European Network Indicators on Social Quality Hungarian National Report, February 2005 European Foundation on Social Quality European Network Indicators of Social Quality - ENIQ - “Social Quality” The Hungarian National Report by Szilvia Altorjai & Dr Erzsébet Bukodi Hungarian Central Statistical Office Social Statistics Department February 2005

Welcome message from author
This document is posted to help you gain knowledge. Please leave a comment to let me know what you think about it! Share it to your friends and learn new things together.
Transcript

European Network Indicators on Social Quality Hungarian National Report, February 2005
European Foundation on Social Quality
European Network Indicators of Social Quality - ENIQ -
“Social Quality” The Hungarian National Report
by Szilvia Altorjai
& Dr Erzsébet Bukodi
Hungarian Central Statistical Office Social Statistics Department
February 2005

European Network Indicators on Social Quality Hungarian National Report, February 2005
European Foundation on Social Quality
European Network Indicators on Social Quality Hungarian National Report, February 2005
European Foundation on Social Quality
This report is published by the European Foundation, copyright 2005. For the rights of translation or
reproduction, application should be made to the director of the European Foundation on Social
Quality.
The European Network Indicators of Social Quality is co-ordinated by the European Foundation on
Social Quality in Amsterdam and was Financed under the European Commisions DG Research fifth
Framework program; 2001-2004.
European Foundation on Social Quality
European Foundation on Social Quality
Felix Meritis Building
Keizersgracht 324
1016 EZ Amsterdam
Ph: +31 20 626 2321
Fax: +31 20 624 9368
Email: [email protected]
Website: www.socialquality.org

European Network Indicators on Social Quality Hungarian National Report, February 2005
European Foundation on Social Quality
European Network Indicators on Social Quality Hungarian National Report, February 2005
European Foundation on Social Quality V
Preface
This national report and the 13 others that accompany it are published as part of the final report of the
European Network on Indicators of Social Quality (ENIQ). The network began in October 2001 and
completed its work in January 2005 and was funded under the Fifth Framework Programme of
Directorate-General Research. Also published simultaneously are reports by the European Anti-
Poverty Network and the International Council of Social Welfare, European Region based on the work
of ENIQ. All of these reports and the deliberations of the Network contributed to the final report which
contains a comprehensive overview of all of ENIQ's activities both theoretical and practical.
ENIQ has been focussed mainly on the operationalisation of the four conditional factors of social
quality: socio-economic security, social cohesion, social inclusion and social empowerment. This huge
collective effort has produced a very original and theoretically grounded instrument for comparative
research aimed at understanding the nature and experience of social quality in different countries and
in assessing the impact of policy changes. These national reports also reveal the highly differentiated
character of the European Union (EU) which cannot be captured by reduction to a small number of
social models. At the same time there is clearly an intrinsic affinity in the emphasis on equity and
solidarity between most of the countries involved. This intrinsic, philosophical affinity is intriguing for
future research.
The work presented in the national reports and the Network's final report will contribute substantially to
the major book that will be published by the end of this year. There will also be articles based on the
national reports in the European Journal of Social Quality.
The preparation of these national reports was an extremely difficult task. Developing a new approach,
a new instrument, and analysing important social and economic trends and their consequences
entailed considerable efforts for both established scientists and their junior assistants. The whole
network had to grapple with the theoretical aspects of social quality as well as the empirical
dimensions. Therefore we want to express our deep gratitude, on behalf of the European Foundation
for Social Quality, for the work done by all participants in ENIQ. We will endeavour to ensure that this
effort is not wasted and that Europe benefits from their expertise. We also want to acknowledge the
excellent contributions of the staff of the Foundation - Margo Keizer, Helma Verkleij, Robert Duiveman
and Sarah Doornbos - to the successful completion of this project. They made substantial inputs to all
stages of the Network. Finally our thanks to the European Commission for funding ENIQ.
Alan Walker, Chair of ENIQ
Laurent van der Maesen, Co-ordinator of ENIQ
European Network Indicators on Social Quality Hungarian National Report, February 2005
European Foundation on Social Quality VI
European Network Indicators on Social Quality Hungarian National Report, February 2005
European Foundation on Social Quality VII
Participants
Belgium: Prof. dr Bea Cantillon, Veerle De Maesschalck; Centre for Social Policy, UFSIA
Finland: Dr Mika Gissler, Mr Mika Vuori; STAKES
France: Prof. dr Denis Bouget, Frederic Salladarre, Mourad Sandi; Maison des Sc. De
l'Homme Ange Guepin, Universite de Nantes
Germany: Prof.dr Ilona Ostner, Michael Ebert; Universität Göttingen, Institut für Sozialpolitik
Greece: Prof. dr Maria Petmezidou, dr Periklis Polizoidis; Democritus University, School of
Law / Department of Social Administration
Hungary: Dr E. Bukodi, Szilvia Altorjai; Hungarian Central Statistical Office, Social Statistics
Department
Ireland: Prof. dr Séamus O'Cinneide, Jean Cushen, Fearghas O’Gabhan; University of
Ireland, Centre for Applied Social Studies
Italy: Prof. dr Chiara Saraceno, dr Susanna Terracina, Ester Cois; University of Turin,
Department of Social Sciences
Netherlands: Prof. dr Chris R.J.D. de Neubourg, Pia Steffens; Universiteit Maastricht, Faculteit
Economische Wetenschappen
Portugal: Prof. dr Alfredo Bruto da Costa, dr Heloïsa Perista, Pedro Perista; CESIS
Slovenia: Dr. S. Mandic, Ruzica Boskic; University of Ljubljana, Faculty of Social Sciences,
Institute for Social Sciences
Spain: Prof. dr Juan Monreal, Salvadora Titos; Universidad de Murcia, Dept. de
Sociología y Política, Social, Facultad de Economía y Empresa
Sweden: Prof. dr Göran Therborn, Sonia Therborn; SCASS
United Kingdom: Prof. dr Alan C. Walker, dr David Phillips, dr Andrea Wigfield, Ms Suzanne
Hacking; University of Sheffield, Department of Sociological Studies
EAPN: Mr Fintan Farrel; European Anti Poverty Network. Ms Barbara Demeijer; HIVA,
Leuven, Belgium
ICSW: Mrs Marjaliisa Kauppinen; STAKES, International Council on Social Welfare
(ICSW). Mr Aki Siltaniemi; The Finnish Federation for Welfare and Health
EFSQ: Prof. dr Alan C. Walker, dr Laurent J.G. van der Maesen, drs Margo Keizer, drs
Helma Verkleij

European Network Indicators on Social Quality Hungarian National Report, February 2005
European Foundation on Social Quality VIII
European Network Indicators on Social Quality Hungarian National Report, February 2005
European Foundation on Social Quality IX
Contents
1 Introduction .....................................................................................................................1 2 Socio-economic Security................................................................................................3
2.1 Introduction........................................................................................................................... 3 2.2 Financial resources .............................................................................................................. 3 2.3 Housing securities and housing conditions .......................................................................... 7 2.4 Health and care .................................................................................................................... 9 2.5 Employment securities and working conditions.................................................................. 13 2.6 Educational securities and quality of education ................................................................. 16
3 Social Inclusion .............................................................................................................19 3.1 Introduction......................................................................................................................... 19 3.2 Citizenship rights ................................................................................................................ 19 3.3 Labour market .................................................................................................................... 25 3.4 Services .............................................................................................................................. 26 3.5 Social networks .................................................................................................................. 32
4 Social Cohesion ............................................................................................................35 4.1 Introduction......................................................................................................................... 35 4.2 Trust.................................................................................................................................... 35 4.3 Other integrative norms and values ................................................................................... 36 4.4 Social networks .................................................................................................................. 39 4.5 Identity ................................................................................................................................ 40
5 Social Empowerment ....................................................................................................43 5.1 Introduction......................................................................................................................... 43 5.2 Knowledge base ................................................................................................................. 43 5.3 Labour market .................................................................................................................... 48 5.4 Opennes and supportiveness of institutions....................................................................... 51 5.5 Public space ....................................................................................................................... 53 5.6 Personal relationships ........................................................................................................ 54
6 Social Quality Initiatives ...............................................................................................57 7 Conclusion.....................................................................................................................65 References ...........................................................................................................................69
Annex Social Quality Indicators ........................................................................................77
Statistical Annex .................................................................................................................83
Socio-economic Security ............................................................................................................... 85 Social Inclusion .............................................................................................................................. 97 Social Cohesion ........................................................................................................................... 104 Social Empowerment ................................................................................................................... 118
Annex Collective data .......................................................................................................127
Annex Social Quality theory.............................................................................................153

European Network Indicators on Social Quality Hungarian National Report, February 2005
European Foundation on Social Quality X
Socio-economic Security
Table 1 Proportion of household income spent on food, housing maintenance, clothing, health, and transport (%) ............................................................................................... 85
Table 2 At-risk-of-poverty rate according to employment status, 2003...................................... 85 Table 3 At-risk-of-poverty rate in households with children, 2003.............................................. 85 Table 4 Workless household living under poverty threshold according to household type,
2002 (%) ........................................................................................................................ 86 Table 5 At-risk-of-poverty rate before and after transfers, 2003 ................................................ 86 Table 6 Dwelling distribution (%) ................................................................................................ 86 Table 7 At-risk-of-poverty rate by tenure status, 2003 ............................................................... 86 Table 8 Proportion of households consisting of two or more families (%).................................. 87 Table 9 Indicators of housing density ......................................................................................... 87 Table 10 Proportion of crowded dwellings (%) ............................................................................. 87 Table 11 Proportion of over-crowded dwellings according to size of settlement (%)................... 88 Table 12 Proportion of sub-standard dwellings according to country-region, 2003 (%)............... 88 Table 13 Number of individuals affected by criminal offences per 100 000 inhabitants .............. 88 Table 14 Perception concerning the safety of the neighbourhood (%) ........................................ 89 Table 15 Proportion of households living in unhealthy surroundings (%) .................................... 89 Table 16 Number of medical doctors per 10 000 inhabitants....................................................... 89 Table 17 Changes in the number of the hospital beds per 10 000 inhabitants (1990=100%) ..... 89 Table 18.1 Proximity to hospital according to income level, 2002................................................... 89 Table 18.2 Proximity to general practitioner’s surgery according to income level, 2002 ................ 90 Table 19 Life expectancy at birth.................................................................................................. 90 Table 20 Proportion of individuals aged 15-64 with serious sickness in 2000 (%) ...................... 90 Table 21 Proportion of individuals with long-term illnesses according to income situation,
2002 (%) ........................................................................................................................ 90 Table 22 Proportion of individuals regards their own health status bad (%) ................................ 91 Table 23 Indicators on infants’ nurseries...................................................................................... 91 Table 24 Proportion of children aged 3-6 enrolling nursery school and kindergarden(%) ........... 91 Table 25 Indicators on family and child care allowances (%)....................................................... 91 Table 26 Proportion of elderly (aged 60 and over) receiving home-care service (%) .................. 92 Table 27 Time spent on unpaid childcare in an average day (minutes), 2000............................. 92 Table 28 Proportion of employees with temporary contract (%) .................................................. 92 Table 29 Socio-economic composition of employees with different job contracts in 2000 (%).... 92 Table 30 Job mobility rate, 2003 (%)............................................................................................ 93 Table 31 Proportion of employees leaving their last job involuntary (%)...................................... 93 Table 32 Options concerning return to the labour market after maternity leave (% of females
in maternity leave) ......................................................................................................... 93 Table 33 Proportion of employees in part-time work (%) ............................................................. 94 Table 34 Number of hours employees typically work a week ...................................................... 94 Table 35 Incidence of work accidents........................................................................................... 95 Table 36 Highest education of population aged 15-64, 2001 (%) ................................................ 95 Table 37 Early school leavers, 2003 (%)...................................................................................... 95 Table 38 Labour market exclusion in young population (%) ........................................................ 96
List of Tables
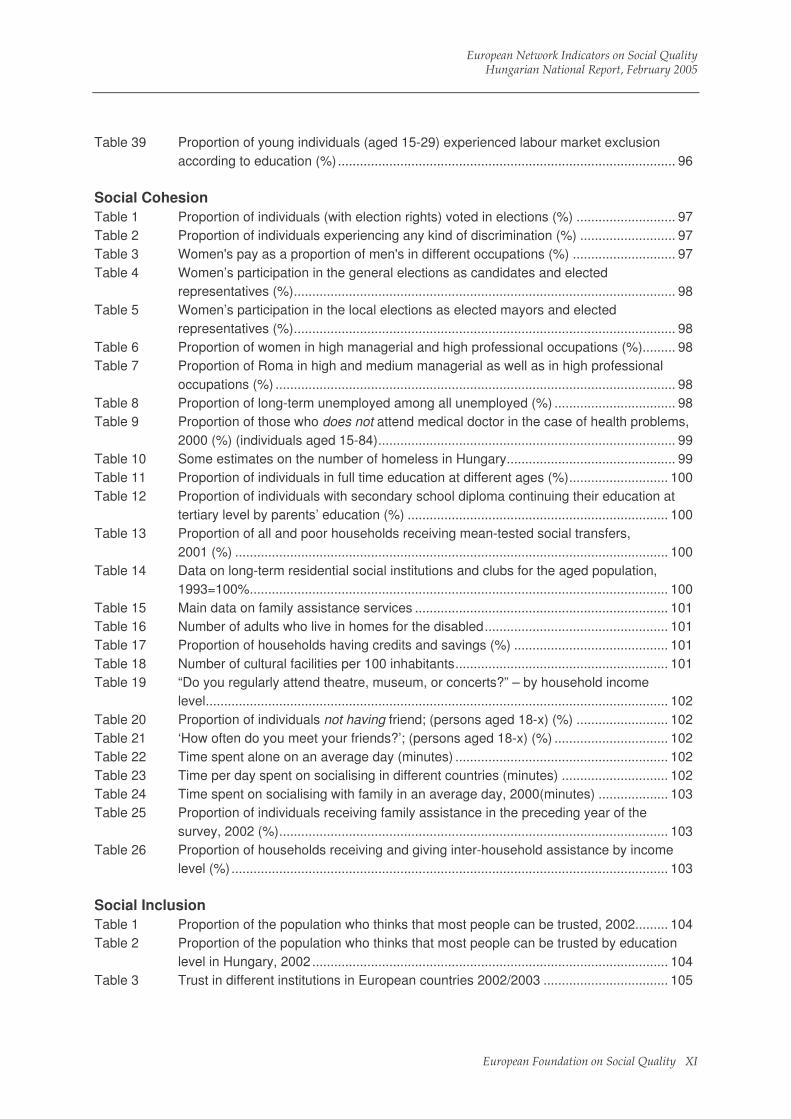
European Network Indicators on Social Quality Hungarian National Report, February 2005
European Foundation on Social Quality XI
Table 39 Proportion of young individuals (aged 15-29) experienced labour market exclusion according to education (%)............................................................................................ 96
Social Cohesion
Table 1 Proportion of individuals (with election rights) voted in elections (%) ........................... 97 Table 2 Proportion of individuals experiencing any kind of discrimination (%) .......................... 97 Table 3 Women's pay as a proportion of men's in different occupations (%) ............................ 97 Table 4 Women’s participation in the general elections as candidates and elected
representatives (%)........................................................................................................ 98 Table 5 Women’s participation in the local elections as elected mayors and elected
representatives (%)........................................................................................................ 98 Table 6 Proportion of women in high managerial and high professional occupations (%)......... 98 Table 7 Proportion of Roma in high and medium managerial as well as in high professional
occupations (%) ............................................................................................................. 98 Table 8 Proportion of long-term unemployed among all unemployed (%) ................................. 98 Table 9 Proportion of those who does not attend medical doctor in the case of health problems,
2000 (%) (individuals aged 15-84)................................................................................. 99 Table 10 Some estimates on the number of homeless in Hungary.............................................. 99 Table 11 Proportion of individuals in full time education at different ages (%)........................... 100 Table 12 Proportion of individuals with secondary school diploma continuing their education at
tertiary level by parents’ education (%) ....................................................................... 100 Table 13 Proportion of all and poor households receiving mean-tested social transfers,
2001 (%) ...................................................................................................................... 100 Table 14 Data on long-term residential social institutions and clubs for the aged population,
1993=100%.................................................................................................................. 100 Table 15 Main data on family assistance services ..................................................................... 101 Table 16 Number of adults who live in homes for the disabled.................................................. 101 Table 17 Proportion of households having credits and savings (%) .......................................... 101 Table 18 Number of cultural facilities per 100 inhabitants.......................................................... 101 Table 19 “Do you regularly attend theatre, museum, or concerts?” – by household income
level.............................................................................................................................. 102 Table 20 Proportion of individuals not having friend; (persons aged 18-x) (%) ......................... 102 Table 21 ‘How often do you meet your friends?’; (persons aged 18-x) (%) ............................... 102 Table 22 Time spent alone on an average day (minutes) .......................................................... 102 Table 23 Time per day spent on socialising in different countries (minutes) ............................. 102 Table 24 Time spent on socialising with family in an average day, 2000(minutes) ................... 103 Table 25 Proportion of individuals receiving family assistance in the preceding year of the
survey, 2002 (%).......................................................................................................... 103 Table 26 Proportion of households receiving and giving inter-household assistance by income
level (%)....................................................................................................................... 103 Social Inclusion
Table 1 Proportion of the population who thinks that most people can be trusted, 2002......... 104 Table 2 Proportion of the population who thinks that most people can be trusted by education
level in Hungary, 2002................................................................................................. 104 Table 3 Trust in different institutions in European countries 2002/2003 .................................. 105

European Network Indicators on Social Quality Hungarian National Report, February 2005
European Foundation on Social Quality XII
Table 4 Trust in different institutions in Hungary, 2002 ............................................................ 105 Table 5 Trust in Hungarian country’s parliament by education level, 2002.............................. 106 Table 6 Trust in legal system by educational level in Hungary 2002 ....................................... 106 Table 7 Trust in the Police by age groups in Hungary, 2002 ................................................... 106 Table 8 Trust in politicians by educational level n Hungary, 2002 ........................................... 106 Table 9 Number of Hungarian cases being referred to European Court of Human Right........ 107 Table 10 Proportion of the population for whom work, family, friends, leisure time, politics is
quite or very important in its live in different countries ............................................... 107 Table 11 Proportion of the population for whom work, family, friends, leisure time, politics is
quite or very important in its live in Hungary ............................................................... 107 Table 12 Volunteer work and informal help among persons aged 20-74 .................................. 108 Table 13 Data about Blood donation in Hungary........................................................................ 108 Table 14 Proportion of different opinions according to the inclusion of immigrants in different
countries, 2000 ............................................................................................................ 109 Table 15 Proportion of different opinions in connection with the cultural identity of immigrants in
different countries ........................................................................................................ 110 Table 16 Tolerance of other people’s self-identity, beliefs, behaviour and lifestyle preferences111 Table 17 Proportion of respondents who would not like to live in a dwelling where neighbours
belong to the following social groups........................................................................... 112 Table 18 Proportion of beliefs of causes of poverty in different countries.................................. 112 Table 19 Proportion of respondents who think that would actually do something practical for
the people in their community/neighbourhood in Hungary .......................................... 113 Table 20 Total time spent on domestic work by persons aged 20 to 74, 2000 .......................... 113 Table 21 Childcare among parents living as couple with children aged up to 6 ........................ 114 Table 22 Proportion of people membered of non-governmental organizations (NGO’s) in
different countries, 2002/2003 ..................................................................................... 115 Table 23 Proportion of households with children by grandparents help..................................... 115 Table 24 Proportion of households with children by the form of grandparents help .................. 115 Table 25 Frequency of contact with friends by gender, 2001..................................................... 116 Table 26 Frequency of contact with friends by age-groups, 2001.............................................. 116 Table 27 Frequency of contact with friends by education level, 2001........................................ 116 Table 28 Proportion of respondents according to the since of national pride ............................ 116 Table 29 Proportion of people by self-identification in different countries, 2003........................ 117 Table 30 Proportion of people by attachement to different geographical areas in different
countries ...................................................................................................................... 117 Table 31 Proportion of people by attachement to different geographical areas in Hungary ...... 117 Social Empowerment
Table 1 Percentage of population illiterate ............................................................................... 118 Table 2 Competence poverty: proportion of educationally „poor” individuals in different
countries based on literacy competences ................................................................... 118 Table 3 Proportion of Internet users in Hungary, 2003 ............................................................ 118 Table 4 Digital gap in Hungary (2001-2003) and in the European Union (2002) ..................... 119 Table 5 ‘How often do you use the Internet?’ – according to purposes of usage, 2003 .......... 119 Table 6 Internet use in different European countries (% of individuals aged 14 and over)...... 119
European Network Indicators on Social Quality Hungarian National Report, February 2005
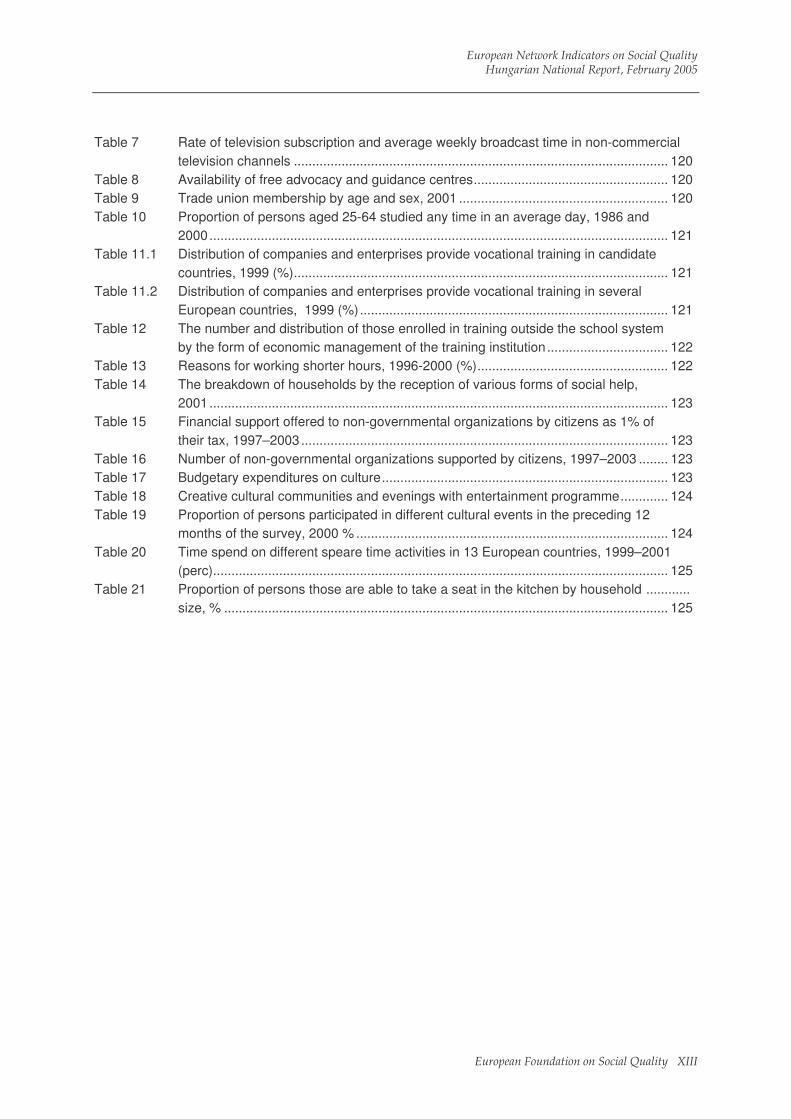
European Foundation on Social Quality XIII
Table 7 Rate of television subscription and average weekly broadcast time in non-commercial television channels ...................................................................................................... 120
Table 8 Availability of free advocacy and guidance centres..................................................... 120 Table 9 Trade union membership by age and sex, 2001 ......................................................... 120 Table 10 Proportion of persons aged 25-64 studied any time in an average day, 1986 and
2000............................................................................................................................. 121 Table 11.1 Distribution of companies and enterprises provide vocational training in candidate
countries, 1999 (%)...................................................................................................... 121 Table 11.2 Distribution of companies and enterprises provide vocational training in several
European countries, 1999 (%).................................................................................... 121 Table 12 The number and distribution of those enrolled in training outside the school system
by the form of economic management of the training institution................................. 122 Table 13 Reasons for working shorter hours, 1996-2000 (%).................................................... 122 Table 14 The breakdown of households by the reception of various forms of social help,
2001............................................................................................................................. 123 Table 15 Financial support offered to non-governmental organizations by citizens as 1% of
their tax, 1997–2003.................................................................................................... 123 Table 16 Number of non-governmental organizations supported by citizens, 1997–2003 ........ 123 Table 17 Budgetary expenditures on culture.............................................................................. 123 Table 18 Creative cultural communities and evenings with entertainment programme............. 124 Table 19 Proportion of persons participated in different cultural events in the preceding 12
months of the survey, 2000 % ..................................................................................... 124 Table 20 Time spend on different speare time activities in 13 European countries, 1999–2001
(perc)............................................................................................................................ 125 Table 21 Proportion of persons those are able to take a seat in the kitchen by household ............
size, % ......................................................................................................................... 125
European Network Indicators on Social Quality Hungarian National Report, February 2005
European Foundation on Social Quality XIV
European Network Indicators on Social Quality Hungarian National Report, February 2005
European Foundation on Social Quality 1
In all modern societies, there is a growing uncertainty concerning the outcome of different individual
choices. In a “runaway world” (Giddens, 1999), structural conditions and social norms provide less and
less support or guidelines for taking decisions. As a result of this, individuals face increasing
uncertainties in their everyday life. One may add here that political and economic changes in a society
always result in an increase in uncertainty, because people have to adapt to new circumstances. In
Hungary, social and economic conditions dramatically changed after the regime-transformation in
1990. This means that the ability of adjustment to new conditions has become one of the most – if not
the most – important factor in the process of diminishing of risk and enhancing life chances. After the
political and economic transition, social strains were growing in Hungary. Families were no longer
stable, divorce rates have increased while marriages and birth rates have declined sharply. The
declining employment rate, shrinking fiscal revenues and transfers have caused increased inequality.
For diminishing risks and enhancing life chances it is required to understand and explain increasing
socio-economic insecurity and general deterioration of social quality. Due to the EU enlargement
Hungary faces an additional “transition”, when the ability of adjustment will be just as important as it
was in the beginning of the 1990s.
As people change their behaviour in order to overcome the new difficulties that they face, old solutions
for old problems lose their relevance. The main feature of Hungarian case is that the planned
economic system dominated by state ownership collapsed, and subsequently a market economy
emerged that was dominated by private ownership. A specialty of this development has been that the
Western market economies, which could in principle provide an example and a sense of direction as
to where the new democracies might wish to go, had to undergo significant changes in the last
decades as well. This meant that if a post-communist country like Hungary after decades of delay
caused by the communist system tried to catch up with the developed democracies, this catching-up
modernization process had in actual fact to follow a moving target. This is a highly “reflexive” (Beck,
1994) form of modernization in which people have to continuously re-evaluate their positions,
possibilities as well as the consequences of their decisions.
In this report we try to outline the most important elements of social quality in the conditional factors of
socio-economic security, social inclusion, social cohesion as well as social empowerment in Hungary.
Following the general framework, we use the common domains, sub-domains and indicators to
investigate the processes in these areas. However – in order to give a more thorough picture of
Hungarian situation – in some cases additional indicators will be applied. As it was referred to above,
Hungary went through a large transformation in the last decade, which makes it inevitable to examine
trends since the beginning of 1990s, instead of 1999 (as it is in general framework). It is also obvious
from previous research that the transformation process “hits” the various population groups differently,
thus, it is straightforward that indicators used in this report should be disaggregated by socio-
1 Introduction
European Network Indicators on Social Quality Hungarian National Report, February 2005
European Foundation on Social Quality 2
economic status, educational attainment, age and gender, as well as – if it is possible – by
geographical regions.
Different studies, research reports and – in some cases – micro data-sets will be used in this work. To
ensure the comparability of our results we used data from European surveys in all cases where it was
possible. Among surveys and statistical background applied here the following should be mentioned:
Household Budget Survey, Labour Force Survey, Time Use Survey, the Research programme of
“Family in Transition”, ISSP survey, European Social Survey, Eurobarometer and Hungarian Census.
We also use reports of international organizations, such as UNICEF, UNDP, and OECD.
The report is divided into six sections. Section 1 highlights findings that are fundamental in the field of
socio-economic security. Section 2 outlines the features in the conditional factors of social inclusion;
Section 3 focuses on domains and indicators of social cohesion; Section 4 points out issues and
trends in the conditional factor of social empowerment in Hungary. In Section 5 we introduce several
national, regional, or local initiatives on the four conditional factors of social quality. Finally, Section 6
summarises and discusses the main findings of our report in the viewpoint in national policy as well as
European agenda.
European Network Indicators on Social Quality Hungarian National Report, February 2005
European Foundation on Social Quality 3
Hungary experienced a sharp increase in socio-economic insecurity in the last decade. Between 1990
and 2001 the rate of relative poverty increased by half from 10 to 15 per cent of the population. By
now it is well-demonstrated in the research that there exists a group of poor people experiencing
multiple deprivation (Spéder, 2002). Given their very low skill level, they are unable to (re)integrate
into the labour market, thus their participation into the mainstream society means great challenges. At
the same time, the failure to reintegrate them poses the threat of dual society in which ones are
trapped in long-term socio-economic insecurity and unable to share the benefits of economic and
social development (Ferge et al., 2003).
According to numerous studies in the field (e.g. Kertesi and Köllő, 2002), the greatest “losers” of the
last decade’s transition in Hungary were the poor-educated households: their relative income position
has declined at most. On the other hand, the greatest “winners” were young people with tertiary
education, whose financial status has improved substantially in the 1990s. Labour market chances are
also salient factors of the risk of becoming poor. The poverty rate is greater in those families where the
head of household is either unemployed or non-retired inactive, as opposed to families with an
employed head. In the latter category – including household with one or more disable members –
proportion of poor is far bellow the average. In sum, skill level and employment possibilities seem to
be the most important determinants of social standing in Hungary, thus in this section particular
emphasizes are put on the role of these factors in shaping socio-economic (in)security.
2.2.1 Income security, income sufficiency
Generally, measuring income security and income sufficiency there are two approaches: applying
absolute and relative poverty indicators. As for the latter ones are concerned, Hungarian household
income surveys reveal that the proportion of those living on a daily income less than 4.3 USD was
about 10 per cent in the early nineties. The poverty rate steadily increased during the economic
recession, reaching its peak in 1996 with 18 per cent of poor. From then on its value decreased
continuously, and by the end of the decade only 6 per cent of the population belonged to the poor. It
should be noted that this decrease in the poverty rate also reflects the substantial decline in the local
currency value of the poverty line in the second half of the nineties.
Proportion of household income spent on food and overheads can be a useful indicator for measuring
income sufficiency. Hungarian Household Budget survey showed that in 2000 the per capita monthly
current consumption expenditure of households belonging to the lowest decile was by 2% higher than
2 Socio-economic Security
2.1 Introduction
2.2 Financial resources

European Network Indicators on Social Quality Hungarian National Report, February 2005
European Foundation on Social Quality 4
in 1997, while that of households in the highest decile by 16%. In 2000 the per capita monthly
expenditure on food of households was about 6-7% higher than in mid-nineties. Money spent on food
kept falling in real terms up to 1997, then, following the rapid increase in volume in 1998-1999, and it
levelled off after the end of the decade. The disparity in the current consumption expenditure of upper
and lower income deciles grew. Everyday costs of households in the low income deciles – food and
overhead costs – were higher than the average (64%). This share is below the average in the high
income group (44%). However, the actual differences manifest themselves in quality rather than in
quantity. In the last years of the nineties, households in the lowest deciles significantly increased their
meat, vegetable and fruit consumption, but still lagged considerably behind the level of the higher
income households. Out of them families without any employed person and with three or more
children lived under the hardest circumstances. Nearly 300 thousand children live in this group, 13%
of the child population.
A notable increase in household income inequalities occurred between the late 1980s and early
1990s. After a short period of stagnation, the Gini coefficient began to rise at the second half of the
decade, reaching a maximum rate of 34 %, and after 1998 it was levelled off at 33%. Despite the
significant increase in market income dispersion, total household incomes (including public social
transfers and social insurance benefits) display a lower level of inequality. This is due to the inequality
reducing effect of social policy (Szivós and Tóth, 1998). As for the trend in relative poverty rate is
concerned, the value of the most popular measure of it – the ratio of those having income lower then
60 per cent of the median income – was 11 per cent at the beginning of the 1990s, and after 1995 the
figure fluctuates around 13 per cent.
Individuals’ education appears to exert the largest impact on the distribution of and the changes in
income inequalities in Hungary. According to a recent study (Tóth, 2003), in 1987 only 8 per cent of
the total household income inequalities was explained by household head’s educational attainment; by
2001 this figure has risen to 27 per cent. It is also apparent that the role of employment increased
remarkably in the first half of the 1990s, with the poverty risk almost doubling for those living in
households without any employed member.
A study (Bukodi and Róbert, 2003) revealed that – similarly to other European countries – non-
employment comes in couple in Hungary, in other words, there is a trend toward polarisation of
households. Due to the high marriage homogamy and huge regional differences in employment
opportunities, an increasing proportion of households have become “work-poor” without any member
in paid employment, and another group of them has become “work-rich” where all adult members
have a secure job. In the former category, the risk of becoming poor is extremely high, and the chance
to get above poverty line is very low.
Following the change of regime, significant and increasing regional inequalities developed on the
labour market. On the one hand, some regions were heavily affected by the decline socialist heavy
industry, and on the other hand, foreign capital investments flowed to the regions that could supply

European Network Indicators on Social Quality Hungarian National Report, February 2005
European Foundation on Social Quality 5
more educated population and were located closer to the main western trade routes. The regions
around Budapest and western Hungarian cities with large proportion of skilled workers were the most
attractive.
In Hungary – similarly to other Central European societies – the problem of “working poor” should also
be discussed. For households where the head is in waged-employment the risk of poverty almost 80
per cent of the average – compared to 69 per cent in EU (Klugman et al., 2002). It means that in
transitional countries for many people work does not help to pull out of poverty because work is poorly
paid, or there are not enough members of the household in paid employment, or both. While in EU-15
one earner in the household is sufficient to reduce the poverty risk to below average, this is not the
case in post-socialist countries. The most important reason of it is that these societies are
characterized by widespread low pay. In addition, in the last decade there was sharp increase in
earning differences among those who do have paid employment in transition countries. Changes in
the Gini-coefficients for earnings are larger than that of household income even in countries where
overall income inequalities has risen modestly (UNICEF, 2001).
In Hungary the distribution of earnings has widened at both extremes of distribution. The incidence of
low pay – measured by monthly earnings below two-thirds of the median of full-time employees – was
22 per cent in 1999, and it exceeds substantially the OECD average 14 per cent. As for temporal
changes are concerned, for men there was an increase in the proportion of low paid workers in 1990s;
for women there was no real variation in this respect. One obvious consequence of the widespread
occurrence of low pay is the relatively high degree of poverty among working families.
It is straightforward that there is a strong relationship between poverty and individuals’ life-cycle. In
western countries children and old-age people have particularly higher risk of living in poor material
circumstances – compared to mid-age individuals. In transitional countries the pattern is somewhat
different: for elderly the poverty risk is lower than the average (Klugman et al., 2002). In Hungary,
although the income situation of elderly also deteriorated in the nineties, it did so to a less degree than
among active people. In the population aged 60 and over, the ratio of individuals living on incomes
lower than half of the median fluctuated around 3 per cent in the 1990s. However, among elderly,
those living alone and/or small villages are particularly exposed to becoming poor.
As for the income situation of families with children is concerned, research shows that they carry a
high poverty risk. In 1991 the ratio of children aged 0-2 living in households with incomes lower than
the poverty threshold was 7 per cent in Hungary, while by the Millennium that figures had climbed to
17 per cent. At the beginning of the new century, the ratio of the poor was exceptionally high among
families with three or more children as well as among single parent families; and the risk of becoming
poor has significantly increased over the past ten years in these groups (UNDP, 2004).
In the situation outlined above the role of social transfers can be very important. When individuals are
not able to enhance their life chances (create opportunities or improve capabilities) and diminish their

European Network Indicators on Social Quality Hungarian National Report, February 2005
European Foundation on Social Quality 6
risks, social help could increase their security. Hungary’s social protection system consists of social
assistance programs and labour-related social insurance benefits such as pensions and
unemployment benefits. The basic elements of the social safety net are pensions, public health care,
unemployment benefits, family support and social assistance. In general, the central government is
responsible for universal benefits, while local governments for means-tested benefits. In addition, local
governments are free to launch social assistance benefits.
The Hungarian social security system as a whole is structured to be broad and flexible, and it provides
benefits for different life situations and different individual needs. About 90 per cent of the households
among the poor (which is the lowest income third of the population) receive social transfer benefits
(Ferge et al., 2003). It should also be underlined that the amount of social benefits paid is low.
Consequently, payment of the various forms of social insurance, allowance, and assistance do not
significantly improve the situation of most poor households. In fact, even with the addition of these
benefits, their income remains below the ‘socially acceptable minimum’ as calculated by the Central
Statistical Office (Ferge et al., 2003).
Family-benefit system is traditionally well-developed in Hungary (see about later); the question is
whether changes in the effectiveness of it in the nineties reduce the child poverty or not. As it was
mentioned above, in the last decade there was a relative worsening of the income position of families
with children in Hungary, and this trend was accompanied by an increase level of targeting by
attempts to exclude higher income households from the benefit system. A study emphasises that
family benefits contributed to reduce significantly child poverty in Hungary; however, the pace of this
reduction decreased between the first and the second half of the 1990s (Förster and Tóth, 2001).
As for the unemployment compensations are concerned, different measures are available in Hungary.
The unemployment insurance (UI) is available for a limited period. The maximum benefit is 65 per cent
of the average income for the past 4 years spent in employment. The maximum of UI duration was
gradually reduced from the initial 2 years to 9 months, as unemployment increased in the early 1990s.
Hungary provides unemployment assistance (UA) to those whose eligibility for UI has expired. This
long-term unemployment benefit is offered to those having a per capita household income below 80
percent of the minimum old-age pension. This assistance was of unlimited duration until 1995, when a
2-year limit to entitlement was introduced.
The share of unemployed individuals receiving unemployment compensation of any kind has always
been above 70 percent since 1991, though it has been slightly declining in the past few years. Since
1994 the number of those receiving UI has fallen, while the number of those obtaining UA has grown.
In 1995 only half of the registered unemployed received UI compared to figures of 75-80 percent in
1991 (Micklewright and Nagy, 1999).
As research quoted by Commander et al. (1995) indicates, the benefit / wage ratio used to be rather
high for low-income workers in the beginning of the 1990s, resulting in low inclination for job search.

European Network Indicators on Social Quality Hungarian National Report, February 2005
European Foundation on Social Quality 7
But the average amount of unemployment benefit has decreased steadily relative to the average
earnings in the second part of the decade. In 1999, the ratio of average unemployment benefit to
average gross earnings was almost 30 percent (Laky, 2000). As a result of this decline combined with
the recent increase of minimum wage, the difference between the minimum wage and unemployment
compensation has been increasing.
In the nineties two main processes directed the transformation of the Hungarian housing system: the
very liberal housing privatisation policy and the re-arrangement of the municipal system. The first ten
years of transition must be characterised primarily by the ‘give-away privatisation’ of the former public
housing stock to sitting tenants. As a consequence, the share of public housing dramatically declined.
At the same time social polarisation, processes of social segregation and social exclusion became
more and more evident. Due to the radical re-arrangement of the roles and duties of central and local
governments (i.e. decentralisation) these two levels appeared as new independent agents and
stakeholders in the housing market. Hungarian housing provision is as follows: 88% owner
occupation; 3% private rental; 4% social rental and 5% others.
The extremely high share of owner-occupation is probably the greatest structural tension within the
Hungarian housing sector exacerbated by the limitless housing privatisation since 1991. About half of
the owner-occupied dwellings are found in the form of single-family houses, the others are in multi-
apartment buildings. Private rentals represents a very small part of the whole stock, but it is
presumably slightly higher as renting out privately owned flats is a part of the hidden (or informal)
economy mainly for taxation reasons. Public rental flats owned by the local governments are actually
the residue of what had been an extensive state housing sector before the transition (today only 4% of
the total stock).
Hungarian housing policy has changed considerably several times, both in goals and practice, in the
post-1945 period. Until 1960 the presence and role of the state in the housing market increased
continuously due to aggressive nationalisation: this process started with the step-by-step
nationalisation of tenement blocks between 1947 and 1953. A new phase of housing policy was
started in 1960, with the so-called ’Fifteen Year Housing Development Plan’ which was intended to
satisfy housing needs in full. The late 1960s and 1970s were the ‘golden age’ of communist housing
policy. During this period the egalitarianism was fostered by the redistribution of the housing stock
among the poor. Between 1960 and the early 1980s the role of the state still remained dominant,
mainly due to large-scale housing construction programmes. However, the whole housing market went
through a gradual liberalisation and private forms of housing were accepted, or even supported by the
regime, which was unique among the communist countries.
1 This subsection heavily rests on the results of the NEHOM (2002) project financed by European Union.
2.3 Housing securities and housing conditions1
European Network Indicators on Social Quality Hungarian National Report, February 2005
European Foundation on Social Quality 8
Compared to other East European countries, the so-called ‘private housing sector’ as well as the
market for privately owned real estates survived even the hardest period of the command economy. It
has always played an important role in the Hungarian housing market, even in urban areas. Therefore,
the Hungarian way of the transformation of the housing system after 1989 has got certain peculiarities.
From the early 1980s, mainly due to economic recession, the state started a slow withdrawal from the
housing market which was accelerated by the political changes of 1989-1990. A fundamental aspect
of the transition was the radical re-arrangement of the roles and duties of central and local
governments. Until 1990 housing in general, and social housing construction and finance in particular,
were the responsibility of the central state (i.e. government), whereas the allocation of dwellings and
maintenance of public housing remained the task of local councils. In 1990, as part of the democratic
reform of the public administration system, local housing property was transferred to the newly formed
municipalities, who also had to elaborate and implement their own housing policies. The first ten years
of transition could be characterised mainly by privatisation of the former state housing stock. In 1990
22 per cent of the dwelling stock in Hungary was state-owned, by January 2002 this ratio had dropped
to 4,3 per cent. The privatisation of state housing in Hungary meant a ‘give-away privatisation’ to
sitting tenants – as it was mentioned above. This practice, in addition to no restrictions on re-sale of
the dwellings, made privatisation of public dwellings very attractive for residents and meant that some
public dwellings especially in an attractive green environment or with an inner-city location could be re-
sold at prices many times what had initially been paid at the privatisation. Tenants living in the residual
public stock are now predominantly households with multiple disadvantages e.g. no regular income,
disabled, families with many children, Roma /gypsy families. Therefore, serious social problems are
attached to the remaining public dwelling stock, which has basically two types: 1) inner-city tenement
blocks, built at the turn of the century; and 2) high-rise housing estates, built during communism.
One of the best indicators of general housing condition is the proportion of over-crowded dwellings. In
this respect there are huge differences according to size of settlement in Hungary. Inhabitants of the
capital (Budapest) are in the most favourable situation: in here only 4 per cent of the flats are too small
compared to the number of their tenants. However, in small villages this share is above 7 per cent. In
1999 13 per cent of dwellings did not possess basic amenities (pipe water, gas, WC). However, during
the last decade there was a substantial improvement in this respect in Hungary, especially in small
towns or in villages. In the early nineties 43 per cent of dwellings in villages did not have pipe water
system, but at the end of 1990s this share was only 20 per cent. Similar trend can be observed in the
case of other amenities. As a result of these processes the proportion of the dwellings under the
national quality standard dropped to 14 per cent by 2003.
As a recent UNDP report (2004) underlines, there was a significant progress during the nineties
towards to ensure the environmentally sustainable development in Hungary. Between 1992 and 2002,
the ratio of households in small villages without running water dropped from 30 to 12 per cent. The
proportion of households connected to the waste collection system also increased substantially,
especially in small settlements. With environmental pollution, economic restructuring during the

European Network Indicators on Social Quality Hungarian National Report, February 2005
European Foundation on Social Quality 9
nineties brought a significant decrease in heavily polluting industries, and as a result, pollution levels
decreased significantly.
In spite of these favourable processes, a quite large part of Hungarian population lives in unhealthy
surrounding; it is particularly true for Budapest. In the capital, 54 per cent of households claim that
they live in a dusty neighbourhood; 43 per cent of them complain about the air pollution, and 17 per
cent of about polluted surrounding. It is obvious that in villages these proportions are lower, but even
in these settlements more than 30 per cent of families live in dusty environment.
2.4.1 Health services and health status
It is straightforward that the poor health status may lead to extreme difficulties in finding a job, which
results in huge deterioration in socio-economic position. From this point of view, health status is one of
the other resources, which essentially defines the chance of diminishing risks and enhancing life
chances. After the communist rule, Hungary transformed its healthcare system from centralised state
control to a more decentralised model. Contracts between local governments and providers have
replaced direct ownership, and privatisation within healthcare has grown since 1989. Influenced by
both the French and German healthcare systems, funding is now predominantly through social
insurance.
Hungary’s healthcare system is financed through the Health Insurance Fund (HIF), which is primarily
responsible for recurrent health care costs. The HIF collects premiums at the national level and
allocates funds to 20 county branches, which in turn enter into contracts with health care providers.
Although the owners of health care provider organisations (usually local governments) are responsible
for capital costs, in practice this usually takes the form of grants from the national budget. The HIF is
also under-financed, and the state government is obliged to cover its deficit. The result is a mix of tax
and social insurance-based funds responsible for financing Hungary’s system (Gaál et al., 1999).
In recent years the focus of the health care system has been shifted to primary care. Patients are
encouraged by the government to seek referral from a GP to limit access to expensive healthcare
measures, although in many cases they can go directly to a specialist if they wish. While GPs are
meant to be involved in preventative medicine and education, their role continues to be a prescription
and referral service (Orosz and Burns, 2000).
In Hungary’s current system, most healthcare provision is operated by the local governments.
Municipalities own primary care and outpatient clinics, and municipal hospitals provide secondary
care. County governments run county hospitals that provide secondary and tertiary care. Some
private, church owned hospitals exist, but most still operate under HIF financing. Most pharmacies are
privatised, but the overall role of the private sector continues to be minimal (Gaál et al., 1999).
2.4 Health and care

European Network Indicators on Social Quality Hungarian National Report, February 2005
European Foundation on Social Quality 10
In common with many post-socialist countries, Hungary’s healthcare system has been plagued by
over-provision, over-supply of resources (including doctors) and duplication of services. Reforms
focused on limiting the number of hospital beds, but failed to cut costs significantly because hospital
infrastructure (including personnel and number of facilities) remained unchanged. In contrast to the
over-supply of doctors, there is an under-supply of nurses. This results in doctors performing the
duties of nurses - an ineffective misuse of resources (Orosz and Burns, 2000).
Within the EU-15, 45 per cent of those in the lowest income quartile and 60 per cent of those in the
highest quartile have easy access to hospitals within 20 minutes (EFILWC, 2004). Thus people with
lower income have worse access to hospitals. In the new EU members, the income gap is much larger
— with a difference of 26 percentage points on average. The difference between top and bottom
income groups is particularly large in Hungary (more than 30 percentage points), indicating that a
significant share of people lack the proper hospital care. Rural – urban differences are another
important dimension of inequality in health care access. In the new member states (and candidate
countries), the rural–urban gap is just as important as the income gap. Whereas only about 5 per cent
of the citizens living in cities need more than one hour to get to a hospital, about one-fifth of the
population in the countryside needs this amount of time. Hungary reports the most severe problems of
hospital supply in rural area. Within the EU-15, proximity to a doctor’s surgery is not related to income.
In the post-socialist countries the income gap is usually higher, reaching 10 percentage points on
average. The situation of Hungary in this respect is even worse: 66 per cent of adult population in the
lowest quartile cannot reach the GP’s surgery within 20 minutes.
It is straightforward in some respect that the poor level of health services results in poor health status;
and poor health status may lead to extreme difficulties in (re)integration into labour market resulting in
huge deterioration in socio-economic position. Although in the last decade the life expectancy at birth
has increased gradually for both sexes in Hungary, it is much lower than in EU-15, and lower then in
most new member states. As for the self-reported morbidity is concerned, 14 per cent of individuals
aged 15-64 suffered in a serious sickness in 2000. There were not significant differences between
males and females in this respect. However, there is a strong relationship between employment status
and the incidence of sickness. Only 8 per cent of employed men reported that he had a serious illness,
but for non-employed males – aged 15-64 – this share was substantially higher, 27 per cent.
The prevalence of long-term illness varies with income level in all European countries (EFILWC,
2004). Social inequalities are somewhat more marked in the new EU-members. In the EU-15 the
difference between the highest and the lowest income groups is 10 percentage points. On aggregate,
the prevalence of long-term illness grows monotonously as income declines in both parts of Europe.
As for Hungary is concerned, almost half of the individuals in the lowest income quartile suffer in long-
term illness, this share is only 17 per cent in the highest income quartile. It means that the differential
role of financial situation is the largest in Hungary in EU. However, a substantive interpretation of
these findings is difficult because the available data tell us little about the mechanisms which link
income to long term illness. The causal order of the two variables remains unclear. Hence we do not
European Network Indicators on Social Quality Hungarian National Report, February 2005
European Foundation on Social Quality 11
know if people with lower incomes are more exposed to have long-standing illnesses or if people with
long-standing illnesses are more likely to have low incomes. A crucial question with respect to socio-
economic security is to what extent long-term illness is concentrated among the poorer strata if we
control for age, gender and employment status.
Taking the subjective judgements into account, there is a significant improvement in individuals’ health
status in Hungary. In 1994 32 per cent of males aged 60-64 regarded their own health status poor or
very poor; by 2002 this proportion has declined to about 20 per cent. Similar trend can be detected for
all other age groups and for females. However, in European context this share should be regarded
even very high.
2.4.2 Care services
Under the state socialism, occupational welfare was the key source of care service entitlement in
Hungary. Work was not only moral obligation but essential welfare passport. Social security was
managed by trade unions, health care as well as child care was available also at work. Welfare
institutions provided by firms still exist, however, it has reduced and has became more uneven.
Employers’ capacities to provide care has become more unequal, and differences in provisions
between different employees within firms is growing (Pascall and Manning, 2000).
With municipal kindergarten enrolment, it has slightly increased in last years. In the early 1990s, 87
per cent of children aged 3-6 enrolled in kindergarten, and this share has climbed up to 92 per cent by
the end of the decade. This fact can make it easier for women to take a job after maternity leave. The
question is whether it is an “enough help” for females aiming at returning paid employment after child-
birth (see about that later).
As it was posed earlier, Hungarian family transfer system can be regarded well-developed. Family and
child benefits in Hungary include child-care benefits, child-raising benefits (family allowance and
schooling allowance), maternity benefits (pregnancy benefit, one-time birth allowance, and sickness
benefit for the term of caring for a sick child), and other benefits (e.g. child protection benefit). (While
the family allowance and child protection benefits are considered the income of the child, the rest are
considered the income of parents caring full time for their children.)
Child-care fee (GYED) is an insurance-based benefit, available for the first two years of a child’s life to
those parents who have paid social security contributions for at least 180 days in the last 2 years prior
to the birth. The benefit is equal to 70 percent of the parent previous wages (but no more than twice
the minimum wage) and can be paid to either parent who takes care of the child full-time. Child-care
aid (GYES) is currently a universal support, first introduced in 1967 as an insurance-related benefit. It
is available for those parents who do not qualify for GYED (who has less than 2 years of insurance
payment) for the first three years of a child’s life and equivalent to the minimum old-age pension.
During the period of entitlement the parent is not allowed to be in employment until the age of 1.5 of

European Network Indicators on Social Quality Hungarian National Report, February 2005
European Foundation on Social Quality 12
the child. After that time, the recipient is permitted to work part-time or even full-time if he/she works at
home. Child-raising support (GYET), introduced in 1993, was designed to serve the interests of
families with three or more children in their own households, as long as the youngest child is aged 3-8.
The monthly amount of benefit, irrespective of the number of children raised, is equal to the minimum
pension. Parents receiving child-raising support can work part-time. Full-time employment is allowed
only if the parent works at home.
Despite the decline in the number of births, the number of women receiving childcare benefits of any
kind kept rising every year. The Labour Account registered nearly 250 thousand (mainly mothers)
recipients (27% of the females’ inactive population of working age) in 1999. The bulk of them received
child-care fee (GYED) or child-care aid (GYES), while the rest obtained child-raising support (GYET).
The family allowance is currently a universal benefit paid for children until the age of 6. Recently it has
accounted for the largest share of family and child benefits. After the age of 6, eligibility to family
allowance expires and is replaced by the schooling allowance. This is also universal (payable until the
age of 16, or 20 for those studying full-time). It is supplemented by the child protection benefit in the
case of low-income families (families with net per capita monthly income below the minimum old-age
pension).
Moving to the field of care for elderly, due to the ageing population, there is a growing need for old age
homes. Currently nursing homes care for approximately 60,000 persons, i.e. less than 1 percent of the
population. Nursing homes are controlled by municipalities and operate partially on central
government funding (capitation payment) and on co-payment by the elderly and/or their families. Basic
services, including medical treatment, are provided for a nominal fee based on the individual's monthly
pension. Special needs, like private rooms, are provided for an additional charge. As the capacity of
the state-run nursing homes does not meet the requirements, privately built and managed nursing
homes are being established. The owners are typically charity organizations, foundations, and private
companies. These institutions provide higher quality services on cost-recovery basis with limited or no
government support. Some municipalities run "day-care" institutions, where the elderly spend as much
time as they wish during the day for a nominal fee. They are provided with basic services, however
they return home for the night. Also many municipalities have social assistants on staff who provide
"visit for social care" for the needy (deliver meals, shopping, etc). The general trend in care policy
leads towards mobile care services to enable elderly people to stay in their familiar surroundings as
long as possible. Thus, the percentage of people aged over 60 receiving home help seems to be a
useful indicator to measure paid care services. In 2002 it was about 7 per cent in Hungary, which
should be considered relatively low.
While the need for formal caring is rising all over Europe the role of the family in care provisions
cannot be questioned. The most useful data sources for investigating unpaid care work are time use
studies. According to a very recent Hungarian survey – it was conducted in 2000 –, women spent
much more time (31 minutes on an average day) on unpaid child care than men (14 minutes). Of
European Network Indicators on Social Quality Hungarian National Report, February 2005
European Foundation on Social Quality 13
course, for females with small children this time investment is much larger, than for their counterparts
without child. In European perspective Hungarian women spend the most time on housing tasks and
child-care duties. It is a particularly crucial problem for employed females for whom this double burden
may lead to serious deteriorations in their life-style and life satisfaction.
‘Risk society’ theorists tend to speak about a generally increasing instability of modern life (Beck,
1992). But it appears that the spread of the different forms of flexible employment result in a relative
increase in social inequalities as risks do not affect workers in the same way (Breen, 1997). In fact,
employers try to shift their market risks increasingly back to those groups of employees who are less
capable and have fewer credentials like young job seekers, migrants, or members of ethnic minorities.
But some groups that profited from the spread of long-term labor contracts during the period of the
economic growth, such as routine non-manual employees, lower grade technicians, and supervisors
of manual workers also experience a decline in job security. Furthermore, certain indicators of
employment relations typical for the working class, like poor promotion prospects and a higher risk of
unemployment, etc., tend to be applied to the specific non-manual, intermediate occupations (Rubery,
1996).
The dual labor market was an existing phenomenon in Hungary even under socialism (Galasi and
Sziráczki, 1985). But a segmented labor market in the sense that employees in the primary segment
enjoy stable careers and those in the secondary segment suffer from employment instabilities (Carroll
and Mayer, 1986) has become more apparent in the 1990s. In the last decade, the Hungarian Labor
Force Surveys have registered albeit small, but slightly increasing numbers of temporary workers.
There is evidence that mainly those who are not in regular employment and performing seasonal work
declared themselves as temporary workers in the surveys (Laky, 2001).
In the nineties the informal economy in transition countries has increasingly become the focus of both
policy and academic research. This is the result of a growing concern with corruption, tax evasion and
crime as well as with an increase in poverty and inequality. Given this wide spectrum of concerns,
studies have used a variety of definitions of the informal sector depending on the question they are
addressing. Moreover, the term ‘informal sector’ has been used interchangeably with ‘hidden’,
‘underground’, ‘second’ or ‘shadow’ economy. Sik (1992) adopt ‘second economy’ definitions to
describe the informal sector in Hungary, and uses the lack of regulation as the main defining criterion.
Similarly, Commander and Tolstopiatenko (1997) argue that the transition economy can be divided
into two sectors: the informal sector, which is comprised of private activities that are largely untaxed,
and the formal sector, comprised of state activities (including privatised state enterprises) that face a
set of payroll taxes. Moreover, they suggest that all part-time work can be considered informal, or
‘undeclared’, and all full-time work is formal and subject to payroll tax. Lackó (2000) suggests another
2.5 Employment securities and working conditions
European Network Indicators on Social Quality Hungarian National Report, February 2005
European Foundation on Social Quality 14
approach to measure the extent of informal sector in transition economies. She argues that household
electricity consumption provides the best measure of the informal economy, as it permits the isolation
of the structural changes during transition that may be responsible for part of the increase in overall
electricity consumption. She adopts a definition of the ‘underground’ economy, which includes
‘activities that are assumed to be measured but escape official registration or measurement’ (Lackó
2000, p.119). According to her estimates the extent of hidden economy was about 20 per cent in
Hungary in the second half of the nineties; and it was substantially lower than in 1992-93, right after
the transformation of the regime.
The public and the private sectors also provide a particular cleavage for insecure employment. The
new private economy works more rationally than the remaining state economy with respect to
employment, so the safety of lifetime jobs persisted only in the public sector. However, only insiders
are protected in the public sphere. While the private sector is more selective on an economic basis,
there are strong administrative budget constraints within public employment. New public job openings
are scarce and, consequently, fixed-term, insecure employment is more frequent for outsiders who try
to gain access to employment there.
A widespread indicator of employment insecurity is the proportion of fixed-term contracts in the labour
market. With regard to it, there are various statistical figures in Hungary. According to Laky (2001), 17
percent of active employees worked under a fixed-term contract in 2000. However, the Labour Force
Survey claims that only 7,5 percent of the employees had fixed-term contract even now. Among the
individuals with fixed-term jobs, about every second has a 3 to12 month long contract, while about one
third of them has shorter contract (Vukovich, 2000). Gender differences are not marked; the proportion
of workers with fixed-term contracts is about 6 to 7 percent of the employees for both sexes. However,
the age differences are greater. Individuals in fixed-term jobs are over-represented among young
people. With the socio-economic composition of fixed-term employees, 20 percent of them belong to
unskilled workers.
According to Sik and Nagy (2002), – all in all – about one third of workers have a “flexible” job contract
in Hungary. This group comprises people working without written contract (11 per cent), self-employed
without subordinates (9 per cent), and individuals with fixed-term contract (7 per cent). The rest is a
mixture of various forms of flexible contracts, such as temporary or causal jobs.
One of the most often posed questions with regard to “flexible” jobs whether these kinds of positions
constitute stepping-stones to secure employment or they mean a way to unemployment and – as a
result of it – to poor socio-economic status. There is no one clear answer to this question, because in
different societal contexts it may be a step to the secure labour market career, but in other
circumstances it may represent a road to unemployment. According to a current OECD-report (2002),
the majority of “flexible” jobs are filled by younger and less educated employees; and these jobs
appear to be less paid than permanent ones, and sometimes give less access to sick leave, paid
vacancies, and so on. About one-fourth of temporary employees become unemployed – of course, it
European Network Indicators on Social Quality Hungarian National Report, February 2005
European Foundation on Social Quality 15
depends on the country investigated –, while the majority of them remains in “flexible” jobs. The
likelihood of mobility into permanent jobs is the lowest for individuals with small amount of human
capital.
Involuntary job mobility can also be regarded as a good indicator of employment security. As for the
job mobility rate is concerned, it is steadily 6-7 per cent in Hungary; in other words, this share of
employees change a job in a year. With regard to the proportion of employees leaving their last job
involuntary, it had been declining in the nineties. In 1992 73 per cent of all the unemployed persons
became non-employed because they were dismissed from their company or their employer
bankrupted; but in 2000 this proportion was only 56 per cent. The relatively large share of this group in
the early nineties was due to the economic transformation process occurred in Hungary. According to
a study on labour market career mobility in Hungary in 1990s, the period after system transformation
can be divided into two parts (Bukodi and Róbert, 2002). The first period up to the 1993 can be
characterised by more turbulence in the labour market compared to the second after this date. In the
first period, any type of job mobility was frequent, but the occurrence of status loss or ‘forced’ mobility
was higher. In the second part of the period the likelihood of employment career movements declined
significantly, and ‘unforced’ mobility got a larger emphasise.
It is straightforward that the number of small children affects women’s employment opportunities. In
Hungary, in spite of different welfare measures survived the socialist times, females with small children
– in particular after maternity leave – have higher risks to become inactive, or if she managed to keep
her job, the probability of (temporal) status loss is quite high (Bukodi and Róbert, 2003). Especially
private firms may reduce their demand for women’s labour, if they have small children. This pattern
can be captured by recent data on labour market opportunities of women with small children: 33 per
cent of them claim that their previous employer is reluctant to employ them again after their maternity
leave (Frey, 2002).
For women balancing between work and family responsibilities one of the most obvious solutions is to
take a part-time job. However, part-time work may mean different things to different people: for
someone it means an advantageous work schedule which gives opportunities to supplement family
income or/and which helps to maintain ties to the labour market. But, for others – who are unable to
get full-time work – it is a “forced” employment status. In addition, part-time employment is an
enormously varied phenomenon in Europe. In post-socialist countries only a small part of women work
in part-time jobs – even in the nineties. There may be several reasons for that: In these countries the
public sector has no policy to give part-time employment for women, and the private sector avoids
creating part-time jobs because it increases their transaction costs. Private employers may feel that
part-time jobs are too expensive for them, because of equal security given to these kinds of jobs as to
full time jobs, but without the same amount of time invested in part-time employees. And, – due to the
relatively low wage level – two “full-time” earnings are needed for most of the families to ensure the
appropriate living conditions.

European Network Indicators on Social Quality Hungarian National Report, February 2005
European Foundation on Social Quality 16
The incidence of part-time work in Hungary is very low compared to the EU countries. In 1999, the EU
average for part-time employment was 16.4 per cent. Surveys carried out by the Labour Research
Institute among enterprises (including legal entities only) present data on part-time employment on a
regular basis. According to the 1997 survey, the proportion of employees working shorter hours was
around 2.1 percent of total employment, with 1.8 per cent part-time workers among them. In 2000, the
share of those working less than the usual hours went up to 2.8 per cent, including 2 per cent part-
time employees (Laky 2001). Labour Force Surveys data − following the ILO recommendations −
indicate somewhat higher shares of part-time employment. Part-time work in 2003 accounted for 4.3
percent of total employment, less than one-quarter of the EU average. According to the last census,
the share of part-time employment is somewhat higher, and – of course – a huge gender difference is
captured. In 2001 almost 9 per cent of employed females worked in part-time jobs, and this proportion
was only 2.8 per cent for employed men. There are marked differences in the incidence of part-time
work by occupational classes: it is over-represented at the two extremes of the hierarchy (among
females in professional and unskilled jobs).
According to a study referred to above (Sik and Nagy, 2002), there are sharp differences between
males and females concerning the incidence of working time flexibility. While part-time work is more
frequent among women, all other types of temporal flexibility are over-represented among males.
Some form of irregular working schedules (part-time work, irregular and evening shifts) are more
widespread in the youngest and in the oldest cohorts, indicating that those in the weakest position in
the labour market are more likely to have temporally flexible jobs.
Educational related costs amounted to about 5 per cent of all annual expenditures of the households
(UNDP, HCSO, 2001). The order of magnitude of education expenses was similar to health and
personal hygiene spending and somewhat less than expenditures on clothing and about one quarter
of what spent on housing by household. Expenditures on the schooling of children are basically
determined by the financial situation of the household. In poorer families a larger share (6 per cent) of
total expenses was made up by costs of schooling than in better-off families (less than 4 per cent).
This signifies that poorer families have to spend much on the education of their children (going on to
further education or being trained in a profession) compared to their financial situation, sometimes
even at the detriment of meeting their needs. Making these sacrifices, nevertheless, they can afford
only a lower level of spending than better-off households.
It is straightforward that changes in the nature of work and technological developments have impact
on the employment structures and the type of labour required. To compete internationally, and to
attain the high level of productivity, firms require highly skilled employees. The increase in the demand
for highly skilled labour can be investigated from various perspectives. Unemployment rates are higher
and have increased at a faster pace for individuals with low education. It means that people without
2.6 Educational securities and quality of education
European Network Indicators on Social Quality Hungarian National Report, February 2005
European Foundation on Social Quality 17
any qualification are forced to face the negative consequences of structural changes in the labour
market: The number of jobs for them has decreased, and the likelihood of getting unemployed or
inactive has increased (OECD, 2000a). But, the relative labour market (dis)advantages connected to
the various levels of qualification indicate significant differences between countries. For instance, in
1996, the thematic review by the OECD’s Education Committee on 14 participating countries has
found that Hungary is one of the four OECD countries, where the gap in the labour market outcomes
between the highly educated and the poorly qualified is the greatest (OECD, 2000b:34).
In consequence of the historical development of the Hungarian educational system, following a
German model, two basic features can be mentioned that seem to survive the regime transformation.
First, tracking continues to be characteristic with a general and a vocational path both at the
secondary and at the tertiary level. Second, vocational training plays a dominating role with combining
abstract knowledge and job-related skills, practical work experiences – though there is an increase in
the proportion of individuals enrolling general education. In principle, this system provided a relatively
smooth transition from school to work under the planed economy of socialism. The highly
standardised acquisition of qualifications through recognised certificates served as a good indication
of skills and knowledge of the potential employees for the employers. This advantage may turn out to
be more a disadvantage in the market system because the close relationship between vocational
certificates and occupational opportunities may result in a high degree of rigidity for labour market
entry and for further career opportunities.
In the last decades, there was an educational expansion both at secondary – particularly at vocational
secondary – and at tertiary – especially college – level in Hungary. First of all, it should be emphasised
that individuals increasingly acquire higher skill levels. The relative proportion of those without any
qualification has been declining over time. On the other hand, proportion of graduates from lower
secondary school with vocational training has been rising. Females’ educational attainment has
increased faster. It is supported by the fact that the proportion of females with university or college
degree has increased more than for males; in 1973 only 3 per cent of women aged 25-64 belonged to
this group, in 2000 already 16 per cent. All in all, according to the last census (in 2001) the share of
employed with tertiary school diploma was higher for women (20 per cent) than men (17 per cent).
As for the share of early school leavers is concerned, it accounts for 11-12 per cent in Hungary, and it
is somewhat lower than in EU-15. However, according to Allmandinger and Leibfried (2003) an
alternative way to assess educational poverty is measuring the lack of basic competences among
students as well as adults. In this respect PISA may be an excellent data-source, which is about
competences are required in modern societies to lead a satisfying life in economic and personal
respect, and to participate actively in social and political life. In their paper Allmandinger and Leibfried
construct the four world of competence distribution based on the patterns how competence poverty
and plenty are combined in each country. In some countries – like in Germany - educational poverty
and plenty go hand in hand. There are few countries (e.g. Spain), which know neither the competence
poverty nor plenty. Other countries are situated between the two extremes: they may know only
European Network Indicators on Social Quality Hungarian National Report, February 2005
European Foundation on Social Quality 18
absolute plenty and not the poverty (e.g. Finland, Denmark, Sweden), and they may experience only
poverty not the plenty. Hungary belongs to the latter category, which indicate that – in spite of the
relatively low share of early school leavers – in terms of skills and competences our country is lagging
behind most of the EU-15 countries.
Of course, one of the most important returns to education is the employment entry and a good job. In
Hungary 8-13 per cent of young people experience employment exclusion; part of them are unable to
enter into the labour market after school completion, another share of them are long-term
unemployed. In employment chances (and risks) there are striking schooling differences: 25 per cent
of young men (and 40 per cent of women) without compulsory education cannot find a job; for higher
educated people the risk of labour market exclusion is much lower.
Concerning the transition from school to work in Hungary, a recent analysis (Róbert and Bukodi, 2002)
underlines that young people tried to remain in the school system as long as possible, an endeavour
that was supported by the educational policy of the different governments in the 1990s. Although
today’s young cohorts have a higher educational level than all previous cohorts, in particular women
still had more chances to find a precarious job in the unskilled service or worker class at the beginning
of their occupational career. Flexibility of the labour market increased in the 1990s, with the result that
more and more young job seekers could enter the labour force only through involuntary self-
employment. In the light of the privatization of the market, this phenomenon is sometimes evaluated
positively. However, it is also the case that young people – and not just the lower educated among
them - have higher odds of finding only fixed-term or other precarious jobs. In order to reduce such a
risky labour market entry, more and more young people start to work already while still attending
school. Data clearly show that if they start to search for a job only after completing school, and if they
fail to find one, then their longer search period decreases the probability of ever entering the labour
force.

European Network Indicators on Social Quality Hungarian National Report, February 2005
European Foundation on Social Quality 19
In Hungary instead of social inclusion the concept of social exclusion is more popular and widely used.
Its dimensions and domains are defined in different ways, and indicators or measures used to
characterise them are even more varied. The possible dimensions may be the following: access to
production (e.g. labour market), access to different forms of consumption, political engagement and
social interaction. However, the Hungarian Central Statistical Office operationalize the concept as
cumulative deprivation, which means that it is defined as income poverty accompanied by housing,
consumption poverty and poverty in consumer durables.
In this report the focus is on the other side of the coin, namely on the process of social inclusion, and
the simple cumulative deprivation approach is challenged. In line with social quality concept, in this
chapter the focal point is on the access to and level of integration in social relations.
3.2.1 Constitutional / political rights
The most important issues to be addressed here are voting rights and participation in elections,
especially in local level. The principles of local government are stipulated by the Hungarian
Constitution. Eligible voters of communities, cities, the capital and its districts and counties have the
right to local self-government —the autonomous and democratic management of and decision making
on local public affairs in the interest of the resident population. Eligible voters exercise their right to
self-government by means of an elected body of representatives and by local referendum.
The significant body of local government are the board of representatives and the mayor, both of
which are elected by voters of the community. Procedures for local elections are regulated by Act No.
LXIV of 1994 on the Election of Local Representatives and Mayors. Suffrage is universal and equal,
and voting is direct by secret ballot. All Hungarian citizens aged 18 and over who are permanent
residents of a particular municipality have the right to vote and to stand in local elections. Those who
are not Hungarian citizens but have permanently settled in Hungary also have the right to vote. Now
the members of the county assembly also are elected directly. There are two constituencies in each
county: one for settlements with less than ten thousand inhabitants and the other for those with more
than ten thousand inhabitants. Voters who are residents of cities with county rights do not have the
right to vote for county assembly representatives. The number of members of each assembly is fixed
by legislation. Mayors of all municipalities and the general mayor of Budapest are elected directly by
voters. Before 1994, in municipalities with more than ten thousand inhabitants, the mayor was elected
3 Social Inclusion
3.1 Introduction
3.2 Citizenship rights

European Network Indicators on Social Quality Hungarian National Report, February 2005
European Foundation on Social Quality 20
by the body of representatives, while in settlements of ten thousand or less inhabitants, the mayor was
elected directly by voters.
General voting existed in Hungary even under the Communist times – despite of the fact that the
country had only one party. Still, MPs were elected in every 4 years – even if there was just one
candidate for a given seat or if there were two candidates (in the 1980s), both representing the official
political line. Before 1990 participation in the elections was obligatory, registered people had no other
option but vote. This resulted in a proportion of about 95 per cent or even higher for taking part in the
elections. Thus, we provide information on participation for the last four ‘free’, multiparty elections.
One can see that the proportions are not high and we interpret this that many people were happier to
live with the right of not voting (participation was not mandatory) than with the possibility of voting for
other parties than the communists. Voting history is short in Hungary and one cannot speak of any
trend in participation so far – at least for general parliamentary elections. Political scientists expected a
decline in the trend and they were surprised to see the increase for 2002 (70 per cent); they explained
this with a wish for a strong ‘protest’ voting. Participation at local elections (for local governmental
bodies, mayor) has always been lower but here we can observe a slight increasing trend. It seems
that local politics is getting closer to ordinary people in Hungary.
3.2.2 Social rights
The predecessor of the current Hungarian public pension system, established in 1929 as a funded
plan, collapsed during World War II. After the war it was re-designed, and by the 1980s it reached a
high level of maturation with near-universal coverage, generous replacement rates (over 60 percent)
and low retirement age (55 for women, 60 for men) (Gál and Tarcali, 2003). It succeeded in protecting
the old from poverty through the transformational crisis in the 1990s. While pensions lost value relative
to wages, and while real pensions decreased substantially, other sources of income for the inactive
declined much faster. Consequently, the relative income status of pensioners improved significantly
during the 1990s. This made the pension system very attractive for older workers: the actual
retirement age dropped due to early retirement and the loss of control over disability retirement. The
rapid growth of coverage in a shrinking economy diminished the range of pensions creating further
disincentives to work. The administration of pensions also proved successful. While most firms
changed ownership in the process of mass privatization, and the number of companies exploded, the
pension agencies managed to collect and redistribute a significant part of GDP even though with
declining efficiency. Indeed the system proved to be too successful in some sense. Being the only
institutional system settled and at the reach of policymakers, it absorbed a disproportionate part of the
labour market crisis of the early transition years. It offered an escape route to hundred thousands of
workers from the labour market who cannot be re-integrated into the labour market any longer. This
undermined the long term stability of the system and induced an extensive reform in 1998 (Gál and
Tarcali, 2003).

European Network Indicators on Social Quality Hungarian National Report, February 2005
European Foundation on Social Quality 21
A comprehensive reform package was passed in 1997 and came into effect on January 1. 1998. The
private pension law established a new pre-funded contribution type of system (the second pillar)
managed by private companies. Fund membership was made optional for those who had earned
pension rights in the old system but mandatory for new entrants to the labour market. The option was
left open for 20 months. Voluntary switchers were allowed to return their full contributions to the social
security. The second pillar covers only longevity risk. Fund members who get disabled can return to
the first pillar by returning their savings to the social security. By this, they can fully re-cover their
eligibility in the first pillar. Alternatively, they can also leave their savings in the fund. In this case,
however, social security pays only 75 per cent of what would have been paid otherwise as disability
pension.
The social security pension law enacted reforms in the first pillar (public pension). It changed several
elements of the old-age entry pension formula. Rules of the survivors’ benefits also changed. In
addition to the own right pension, a widow has also been eligible for the widow benefit since 1998
which is 20 per cent of the pension of the deceased spouse. The law also confirmed the raising of
retirement age legislated but suspended before. According to the new rules, the retirement age for
men was raised from 60 to 61 in 1998 and to 62 in 2000, whereas for women it was raised by one
year every second year and will reach 62 in 2009.
According to a recent survey (Ferge et al., 2003) poor people in general do not have a clear picture of
the pension system or the mechanisms of retirement. The majority of them expect to receive old-age
pension in the future while only about half of them pay contributions or know about this payment. For
instance, 19 percent of working poor people thinks that nobody pays any contribution for them (this
happens if someone works illegally, but this should not be true in all other cases), and only 13 percent
believe that the contribution is paid both by themselves and their employer. Also in this survey
respondents were asked in a separate question whether they had pension insurance. Their answers
are more or less similar to those made on the payment of contributions. Most of the active earners and
child-care grant recipients are insured, while the unemployed and other inactives seem to have a very
precarious future. Among the unemployed poor households, the uninsured segment is very large: over
20 per cent. Occupation (or education) makes a difference among working people; for instance, there
is a significant difference between the skilled and the unskilled workers. Another important finding is
that almost 40 per cent of the self-employed (or own account workers) are inadequately insured.
3.2.3 Civil rights
Experiencing discrimination is an important indicator for this sub-domain what we approach from two
aspects. First, we provide information on the proportion of those who feel that they were discriminated
by some way. Second, we computed a concrete measure for those who were discriminated in a
concrete field, namely in paying differently for the same (similar kind of) work activities.

European Network Indicators on Social Quality Hungarian National Report, February 2005
European Foundation on Social Quality 22
Our first indicator comes from survey data (ESS) and displays the proportion of discriminated persons,
disregarding the concrete field or event of discrimination (about what the survey does not provide
information). The survey was carried out on a sample of randomly selected respondents who were
expected to represent the national population aged over 14 all over the country. In Hungary, about 5
per cent of this population claimed that they have experienced any kind of discrimination in their life. It
is hard to tell whether this proportion is higher or low, (we would say it is rather low). Two facts should
be taken into account when interpreting this result: respondents could decide themselves if they judge
an action against them as a discriminative one or not; this decision is influenced by the general climate
for civil rights in a country, i.e. how sensitive people are for the facts if they are discriminated. We
believe that the communist ideology before 1990 was not very helpful for developing such sensitivity in
Hungary. Consequently, we believe that Western respondents would consider some actions as
discrimination, while this is not the case in Hungary. It means that the general mean (5%) for
experiencing discrimination may be under-estimated. Gender discrimination seems to be an issue,
which is not more frequent than average discrimination. Finally our data indicate that discrimination
increases from the older to the younger age groups; i.e. younger people suffer from more
discrimination than older ones. We have to be cautious with this result just because of the fact
mentioned above: younger people can be more sensitive or more self-confident than older ones just
because they were socialized in the more democratic post-communist era. Consequently we are not
sure that younger people meet really more discrimination in Hungary than older ones.
It seems that persons belonging to a minority group suffered from discrimination to an exceptionally
high degree. We believe that these answers came from respondents belonging to the group of
gypsies. Discrimination against them (e.g. they have difficulties to find employment or they are paid
less for the same work) is quite regular in Hungary and is discussed in the media frequently.
Other studies – conducted by different bodies - have also consistently indicated that Roma continue to
experience widespread discrimination in education, employment, the criminal justice system and
access to public services (OSI, 2001). The well-documented practice of placing Roma children into
separate schools for the mentally handicapped and/or segregating them into classes with inferior
curricula and lower teaching standards ultimately contributes to high levels of unemployment and
dependence upon local authorities for the distribution of welfare and other forms of social protection.
Roma experience discrimination: approximately 48 per cent of complaints submitted to the ethnic
Ombudsman in 2000 were filed by Roma against local governments (OSI, 2001).
In fact, it is a bit surprising that women do not complain more about discrimination, while it is quite
common experience in Hungary that they earn less in the same (similar) occupations in comparison to
men. We made a calculation for this based on data on earnings from the main job as provided by the
Hungarian Labour Office. Information was not available on the level of concrete jobs but only for major
occupational groups. Indeed, it seems that women are discriminated in this sense – though we are not
able to control for the exact gender differences in the distribution of the concrete activities within these
broad categories.
European Network Indicators on Social Quality Hungarian National Report, February 2005
European Foundation on Social Quality 23
In the first years after system transformation, differences between males and females earnings
declined significantly. Data suggest that the earning gap dropped by half between 1989 and 1992; but
there were no substantial changes after that: the raw gap was stabilised around 20 per cent (Köllő,
2002). However, investigating gender pay gap in different sub-groups, important differences can be
captured (Kertesi and Köllő, 1996). First, a drop in gender wage-gap primarily occurred in the
traditional low-paid sectors (farming, food processing, construction, health care), and among middle
aged employees. Second, there was an increase in gender pay-gap for occupations requiring higher
education. Third, due to the drops in wages in regions of high unemployment, which hit females harder
than males, in these regions earning differences has increased in the first few years of transformation.
The pay gap for unqualified women continued to decline after 1995. Following 1992, earnings for
middle-educated females grew slower than they did for females with only primary education. In this
category, however, males’ wages grew even more slowly, and the result was a nearly 10 per cent drop
in the earnings gap. As for the tertiary school graduates are concerned, the gap increased somewhat
in the first half of the 1990s, then it became significantly wider in 1995-98 (Köllő, 2002).
3.2.4 Economic and political network
As for women’s political rights concerned, their participation rate in Parliament and in local
governments can be considered crucial indicators. In 1980 almost one-third of the MPs were women;
however, in the first election following the change of regime women’s rate in Parliament dropped
drastically (to 7 per cent). The results of the second general elections showed an emerging tendency
that did not continue later. Over the elections women were at a disadvantage positions already at the
start, because only a small proportion of the candidates were women, though the continuous increase
of their rate is a favourable tendency. In the elections their disadvantages was growing: their chances
of being elected were worse than that of their male counterparts. The low rate of women in Parlament
is brought about decisively by voters. In the nineties the rate of females elected directly in the
elections was only about 3-9 per cent. In most cases voters’ assumption is rooted in the insight that a
representative’s mandate requiring lots of time and energy can be better experienced by men whose
household tasks and child-rearing burdens are less.
In consistency with the international experience, local governments gave females more chances to
undertake a public role. Both among candidates and elected members of the municipalities women’s
participation increased in the nineties. In smaller settlements women got in local governments more
seats than in larger cities. Here also the so-called pyramid-principle is in play: on the top positions
women have worse chances than in lower posts (CEDEW, 2000).
In the past Hungarian women seemed to be located in a considerably narrow range of occupations,
especially in routine clerical, unskilled and agricultural jobs. However, there is a uniform turn away
from the unskilled jobs in productive branches into the jobs that require higher qualification in service
European Network Indicators on Social Quality Hungarian National Report, February 2005
European Foundation on Social Quality 24
and administrative sectors. Comparison of the data from 1973 and 2000 shows a growth of 6
percentage points in women’s proportion in higher professional and managerial occupations, while the
proportion of females in unskilled jobs have declined from 55 per cent to 30 per cent during this
period.
The Constitution of the Republic of Hungary protects the interests of national and ethnic minorities by
granting them the right to collective participation in public life, including the establishment of their own
self-governments at the local and national levels. Such rights are reinforced by several parliamentary
acts regulating national and ethnic minority rights. Each national and ethnic minority group has the
right to form its own local self-government in the settlement in which it resides. National and ethnic
minority self-government may be organized by three methods on the local level and by one method on
the national level (Temesi, 2002). Each minority group may establish settlement governments in
villages, cities and the districts of Budapest directly or indirectly. In the capital, local minority
government may be established directly. A municipal government may declare itself a minority
government if more then half of its elected representatives are of a certain national or ethnic minority.
If more than thirty per cent of the local representatives are of the same minority, they indirectly may
form a local minority government comprised of at least three members. A minority group may form
only one local minority government established either directly or indirectly. Regardless, the functions
and powers of local minority governments are the same as those of local governments. The office of
the representative body of local government is obligated to assist the activities of local minority
governments under conditions regulated by its statutes. In making decisions concerning issues such
as education, local traditions and culture, and language use, the local government must obtain
agreement with the local minority government of the concerned ethnic group. In addition to the right to
elect national and ethnic self-governments, each minority group may elect a speaker. The speaker is
the candidate of the national or ethnic minority group who received the highest number of votes in
general local elections. If he or she is not elected to the representative body, he or she has the right to
participate in its sessions.
In addition to minority self-governments, Hungary has established an independent institution to
monitor the implementation of minority rights and investigate complaints of violations – the
Parliamentary Commissioner on the Rights of National and Ethnic Minorities (the Ombudsman). An
active non-governmental sector, including minority and human rights organisations frequently
challenges discrimination.
It would be very important for Roma population – in order to being able to influence political decisions
– to have an own, relatively large high professional and managerial stratum. However now it is not the
case. According to the data of last census only 0.2 per cent of Roma belongs to elite class of the
society (for non-Roma this share is about 5 per cent).
European Network Indicators on Social Quality Hungarian National Report, February 2005
European Foundation on Social Quality 25
3.3.1 Access to paid employment
Labour force participation is a highly important indicator with a special relevance in Hungary. One has
to take into account that Hungary under communism was characterised by full employment, complete
access to paid work. Consequently our time series is not very long again as unemployment was not
present before 1990. We provide two indicators for missing access to employment and they are the
long-term (= more than 12 months) and the very long-term (= more than 24 months) unemployment.
Our data indicate quite large proportions for long-term unemployment within the whole unemployed
population. (Obviously, the second indicator is not present for 1992 yet and it cannot be large for the
first indicator either when unemployment histories do not go back longer time than 2 years.) However,
for the later points in time almost half of the unemployed spent a period between 1 and 2 years out of
the labour force, and about every fourth unemployed could not return to work for longer time than 2
years. These proportions drop somewhat for the very recent times in 2003: 40 and 20 per cent.
Leaving the unemployment system can happen in various ways. Previous research revealed that the
probability of getting a job falls with age (though not linearly) and those with higher qualifications are
more likely to return to the labour market (Micklewright and Nagy, 1994; Galasi and Nagy, 1999).
Training was also an option for younger and more educated unemployed. Entry into subsidized work
did not seem to be affected by individual characteristics, while transition to self-employment implied
low hazards. Public work was a typical exit in less developed regions of the country that had a high
unemployment rate. The local unemployment rate in general had a strong negative effect on re-
employment. However, the most likely way to leave the unemployment register is that the entitlement
expires without finding any job or joining any program (Micklewright and Nagy, 1999). It is also typical
that unemployed people (re)-enter the labour market in short-term, unsecured jobs and return to
unemployment soon after. About 60 per cent of males registered as UI recipients in 2000 had been
unemployed at least once before in the nineties (Klugman et al., 2002). According to Bukodi and
Róbert (2002), men with more unemployment experience have significantly more risk to be pushed out
of the work force (again) than males without it. This result calls attention to an important feature of the
Hungarian labour market of the nineties: many people were forced to swing between employment
periods and unemployment episodes that were likely short-term.
The Labour Force Survey usually provides data on the reasons for shorter working hours. In 2002, 5.3
percent of the employed (not including those working flexible hours) worked less than 40 hours per
week. It is important to note, however, that this segment is not identical with part-timers. Almost half of
those working shorter hours hold a job in which the regular working time is less than 40 hours. Only
the other half can be considered as voluntary or involuntary part-time workers. One in five
respondents indicated that they did not intend to work full-time. The share of those working shorter
hours because either they could find no full-time work or could not be employed full-time (for the lack
of work assignment) was 14.5 per cent in 2002 (Laky, 2003).
3.3 Labour market
European Network Indicators on Social Quality Hungarian National Report, February 2005
European Foundation on Social Quality 26
From the viewpoint of the employers’ interests in Hungary they are keener to offer jobs to people on
the basis of such contracts when job seekers will not be officially employed but are required to provide
a bill for their work. This makes possible for the employer to save the social security costs they ought
to pay after a regular employment. Consequently, these employees are forced to be self-employed
because they can have access to paid work only as own-account workers, so this is a kind of
involuntary self-employment. The proportion of self-employed without subordinates in Hungary is quite
large, as much as about 10 per cent of the total labour force according to the last census. Of course, it
is difficult to tell again whether the concrete decisions on being an own-account worker are voluntary
or involuntary.
3.4.1 Access to health services
In Hungary health coverage is universal and provides access to all ambulatory and hospital health
care. All citizens are covered, regardless of employment status, with the government paying
contributions for groups such as the unemployed and pensioners. Health insurance contributions are
collected from employees as well as from employers who pay 15 per cent of the employee’s gross
salary plus a so-called ‘healthcare contribution’. The population also pays local and national income
tax, which helps to finance the investment costs of health care. Patients make co-payments on certain
services, including pharmaceuticals, dental care and rehabilitation. These out-of-pocket payments
have increased substantially since 1990, and currently contribute about 18 per cent to health care
financing (Gaál, 2002).
Actual access to health services can be approached in different ways. Here we do not deal with the
kind of ‘physical’ access based on the regional distance, i.e. how far somebody lives geographically
from health institutions. This is discussed in the part of our paper on socio-economic security (SES),
which represents another quadrant. For social inclusion, however, it is important how much access
somebody has to health services based on their own willingness for using the existing opportunities.
Based on survey data we developed an indicator, which describes whether somebody decides not to
see a medical doctor in the case of health problems even if he or she could go to a health institution.
This indicator refers to social inclusion in the sense that some people exclude themselves from using
health services in need. Exact reasons for this behaviour (e.g. they do not have time or they do not
trust in medical doctors) are not known but the indicator is meaningful anyway and we can have
hypotheses for explanation.
One can see nearly every tenth adult Hungarian belongs to this group who occupy a disadvantaged
position for social inclusion in this respect. Looking behind this mean value we can try to tell more
about the phenomenon. Not visiting a medical doctor in case of health problems is more frequent for
those who are in labour force, so it is possible that they have no time, they do not want to be absent
3.4 Services
European Network Indicators on Social Quality Hungarian National Report, February 2005
European Foundation on Social Quality 27
from work. Unemployed people are similarly over-represented but we think of another background
reason for them, namely being sick can decrease their chances to find a job. Other inactive people
represent a heterogeneous group, but many of them are young mothers with small children. Again
they may have no time or they may miss somebody who can take care of the child while they visit the
doctor. It is obvious that retired or disabled people are under-represented for this indicator. Finally, it
seems that income matters in the sense that people with lower income tend to exclude themselves
from health services with higher probability.
According to Ferge et al. (2003), the problem of poverty does not seem to prevent access to medical
treatment, or at least it seldom does. However, the implementation of the prescribed treatment seems
to be affected. In the referred study it was asked whether an occasional income deficiency (for
instance, at end of the month) affected drug expenditures, and another question was posed whether
the family could buy all the prescribed drugs. Half of the poor households declared that they did not
have difficulty in either cases, one fifth claimed that both problems occur, and the others had one or
the other problem. The households where the impact is greater than average are those with fewer
working members, where there are pensioners, where per capita income falls below the sample
average, and particularly the Roma families.
3.4.2 Access to housing
Homelessness seems a new phenomenon appeared around the change of the regime in 1989. To
understand homelessness in Hungary, it is necessary to discuss briefly the basics of the socialist
housing model (Hegedüs and Tosics, 1996). The new housing system introduced after the take over
of the socialist-communist parties at the end of the 1940s, was part of the system of planned
economy. The income of people was strictly controlled and the cost of housing was not included in
their salaries, as it was considered as a state service, provided free to the citizens. There was also
direct control introduced on the consumption side: one family could only have one flat to avoid the
“over-consumption” of housing and in order to eliminate the private rental sector. Up to the end of the
1980s, there was virtually no problem in Hungary with paying rents, mortgages, utility fees, as these
were fixed at a nominal level and even low-income people could afford them. From the 1970s on, the
output of new state-financed construction of housing was increased. As a result, the housing situation
improved and more and more people have had access to some form of housing. Those who did not,
had to live with their parents, sub-let a room in a flat from someone, or live in the workers hostels of
their employer. Homelessness was considered as a criminal activity: people living on the street were
collected by the police and sent to prison or health care institutions. Only one ‘night shelter’ for 16
people was being operated during the socialist (Erdősi et al., 2003).
In the middle of 1980s Utasi (1987) published the first study focusing on homelessness in Hungary, in
which the researchers made about 100 in depth interviews with different aged homeless people. The
author used the term of homelessness in the broader sense (including not only the rough sleepers, but
all other groups who did not have permanent housing) and estimated their number not to be more than
30-60 thousand on the country level. This study very explicitly demonstrated that some groups of
European Network Indicators on Social Quality Hungarian National Report, February 2005
European Foundation on Social Quality 28
vulnerable people existed. There were thousands of men and women in the situation of homelessness
during the final years of socialism, who could later become one of the basic groups of (rough sleeper)
the homeless population after in 1989.
In 1990 the number of ‘effective homeless’ was estimated around 10-15 thousand people and those
number who were at risk of becoming ‘effective homeless’ could be around 300-400 thousand people
by the experts of the new governmental department for managing homeless problem (Iványi, 1998). At
that time Győri (1990) described the following main groups of homeless people based on the
experiences of social workers: young who escaped from their families, children and young who
escaped from the system of state orphanage or becoming age 18 left the system, young and middle
aged drug users, alcoholics, people who are psychical and somatic ill, disabled people, old age,
demented hobos, former prisoners, criminals, casual labourers, former commuters, former dwellers of
workers’ hostels, unemployed, divorced, evicted. With the collapse of the socialist economy many
people suddenly lost their jobs and the workers hostels were also closed down. At the same time in
the housing sector market mechanisms were introduced - as it was outlined in SES.
As a result, a substantial portion of society suddenly faced payment difficulties and got into arrears. In
the first half of the 1990s these people were still protected directly by the political unacceptedness of
eviction. The political rationale was the idea that at least the security of living somewhere should be
maintained, even if the security of employment, stable income, etc. disappeared.
However, from the second half of the 1990s the housing policy became more and more market-
orientated, without the introduction of comprehensive systems to protect the poor. The responsibility
for housing was transferred to the local governments, without giving them appropriate financial means
from the central budget to enable them to set up a social safety net. In Hungary the protection of
families in arrears has been gradually diminishing as local governments and privatised utility
companies started to collect their rents and fees more efficiently and also started eviction procedures
against families in arrears. All these factors threaten with a huge increase of homeless people, as
there are no or only very weak and limited social and political mechanisms developed to protect
people, who are being evicted, from becoming homeless (Erdősi et al., 2003).
According to the main conclusion of NEHOM (2002) project, there are two possible approaches
available for combating recent trends in social exclusion in housing market: a new social housing
programme initiated by the national government, and involvement and action by local governments
based on their own capacity. Local governmental interventions against social exclusion focus on
maintenance and allocation of the social housing stock, allocation of social allowances for the most
needy and support for needy families to purchase their own flat. In 2000 the housing policy of Hungary
entered a new phase of development through which a stronger co-operation and interaction between
the public and private (both domestic and foreign) sectors became possible. The new social housing
programme was initiated and launched by the Hungarian government. In the framework of the
programme, municipalities can apply for state funding in order to raise the number of disposable rental

European Network Indicators on Social Quality Hungarian National Report, February 2005
European Foundation on Social Quality 29
units in the following ways: 1) they can build new flats; 2.) they can renovate old tenancies; and 3.)
they can also buy dwellings in the free market and then renovate them for rental purposes, or convert
non-residential buildings into tenement blocks.
At present the activity of local municipalities related to the social housing sector concentrates
mainly in three fields: 1) Maintenance and allocation of the social (i.e. public rental) housing stock.
This housing stock basically comprises the old tenancies. In most cases the municipalities can not re-
allocate rentals except when they are empty. In 2000, a new measure was introduced to strengthen
the ownership rights of Hungarian municipalities by making it possible to evict tenants in the case of
missing payments or illegal occupancy. 2) Allocation of social allowances (such as flat maintenance
benefits) for the needy: the main source of the social benefits is the central state budget, but it is
supplemented from the municipalities’ own resources. Municipalities enjoy a high level of
independence in formulating their own regulations referring to the conditions of granting housing
allowances. 3) Support for needy families to purchase their own flat: To a very limited extent,
municipalities also allocate subsidies or loans enabling young families or those with children to buy a
new dwelling in the market.
3.4.3 Access to education
Access to education is one of the most important indicators for social inclusion. We provide two
indicators for this sub-domain: a ‘descriptive’ one, which displays general participation in secondary
and tertiary education as well as a more ‘causal’ one where access to tertiary education is investigated
in the light of the family background.
Our first indicator reveals and increasing access to education in Hungary and this is in line with the
tendencies of educational expansion all over the world. From a historical perspective, three waves of
educational expansion took place in Hungary, first in the 1930s in the period between the two World
Wars; second in the 1950s when the communist took over the country; and third in the 1990s after the
collapse of communism. Two main features of the increase of access to education can be
emphasized: the gender gap in educational attainment declined and, in fact, women were getting
better educated than men (Róbert, 1991); first the educational expansion was more marked for
secondary schooling but later it became stronger for tertiary education.
The indicators we present here refer to the more recent period of late socialism and after 1990. For
participation we provide two pieces of information: being in education at the age of 16 means for most
cases that somebody attends secondary school; being in education at the age of 20 means for most
cases that somebody attends tertiary education. Secondary education was available for the majority of
youngsters already under socialism (80% in 1991) but we can observe a moderate increase up to 92
per cent by 2002. Access to tertiary education indicates a huge contrast in comparison to secondary
education. Tertiary education was highly selective under socialism, only a minority could continue the
studies after secondary school. Students were required to have a final exam from secondary
European Network Indicators on Social Quality Hungarian National Report, February 2005
European Foundation on Social Quality 30
education and they had to pass an entrance exam (in most cases both written and oral one) as well.
Following the logic of a planed economy, Ministry of Education prescribed the number of students who
could enter the different faculties of universities and colleges and could study there without any tuition
fee. In 1991 only 14 per cent of a cohort studied at age 20, but the gates of colleges and universities
opened up in the 1990s. The basic law did not change, the Ministry of Education keep on determining
the available ‘places’ in tertiary education but the system became more flexible. Thus, access to
tertiary education increased by about 2 and half times within one decade, up to 38 per cent. Very
recently the pace of educational expansion declined.
The next indicator displays the chances for access to tertiary education for different groups of
youngsters completed secondary education but come from different families. We have seen before a
significant expansion for tertiary education but obviously this did not help for those young people
whose parents were low educated. For parents’ education, proportions for the ‘uncompleted primary’
category are very stable, less than 20 per cent continued the studies even if more students entered
tertiary education. There is a very moderate increase for the ‘primary’ category between 1995 and
2000, and a bit larger increase for the ‘vocational’ category between 1984 and 1995. The ‘winners’ of
the educational expansion are those students whose parents have at least secondary school diploma.
The access to tertiary education increased a lot for them between 1995 and 2000. This indicator
proves clearly – what we know from other research on educational inequalities (Bukodi, 1999. Róbert,
2003), too – that access to education is highly dependent on social origin in Hungary – even in the
time of rapid expansion.
3.4.4 Access to social care and social transfer
In this sub-domain we will pay special attention for social assistance in kind of elderly people, families
that are in crisis and disabled individuals, on the other hand we will emphasize the importance of
access to social transfer as well.
There are three main institutional forms of social care for elderly people in Hungary. Club for elderly
provides day care for elderly people who are in need of social and mental support, but are partially
capable of looking after themselves. Actually, the social catering, which involves provision of at least
one hot meal daily for persons who are permanently or temporary unable to provide this for
themselves or their dependants, is mostly utilized by elderly people. Domestic care provides for
people who are unable to look after themselves in their own homes from their own resources. In 2003
about 44 thousand persons were supplied by these institutions, which is 47 per cent growth compared
with 1993. The number of these kinds of institutions has increased by 70 per cent for 1993.
Family assistance services are benefit for persons or families that are endangered or in crisis owing to
social or mental health problems, provided for the purpose of sustaining their ability to cope,
eliminating the causes that lead to such situations, and resolving crisis situations. In 1998 the number
of family care institutions was 462, while in 2003 it reached the 777. At the same time the number of
European Network Indicators on Social Quality Hungarian National Report, February 2005
European Foundation on Social Quality 31
individuals asking for help has increased by 60 thousand for 1998. More than 20 per cent of them had
financial problems and about a same share of them asked assistance in official matter.
Disabled people’s homes admit persons who can only be provided, educated, trained and employed
within institutions. For 1993, the number of individuals receiving assistance has increased by 5
thousand. In 2003 more than 13 thousand individuals lived in this kind of institutions.
Apart from access to assistance in kind, the access to social benefit system is an other fundamental
factor of social care. Numerous studies emphasize that it is not easy to measure with a composite
indicator the access to social benefit system. One of the most “natural” indicator is the proportion of
household receiving any mean-tested social transfers among families living under poverty threshold.
This share accounted for about 60 per cent in 2001 according to Hungarian Household Budget
Survey, which is in line with Ferge’s result: in her survey on social exclusion, over 60 per cent of poor
household received one or more types of means-tested benefits in 2002 (Ferge et al., 2003).
According to this survey, the role of such transfers is large in Hungary, but particularly so in the life of
the poor. In a national sample, only 16 per cent, but in the sample on poor population 25 per cent of
the households rely solely on transfer incomes. The ratio of those living exclusively from social
transfers is extremely high (almost three times the average) among single persons in the worst income
situation; it is relatively high among those having no children; and almost double of the average
among Roma.
3.4.5 Access to financial services
We approach access to financial services by two financial options: having savings in some form and
having any type of credit. Information on this we take from a recent survey where respondents were
asked whether they have savings or credit or have not. Based on the simple combinations of the
answers, we have computed an indicator with four categories. This typology reveals that nearly one-
third of the Hungarian households have no access to financial services – at least as defined here. The
majority (about 60%) of the Hungarian households have some savings but having some credit is less
typical, it occurs only for one-fourth of the households.
The income level in the household has obvious relationship with savings and credit. Not surprisingly,
households, which belong to the lowest income quintile, seem to have less access to financial
services, more than one-third of them have neither savings nor credit. At the same time more well to
do households in the highest income quintile are over-represented for having both savings and credits.
One could expect a very simple link between level of income and access to financial services, namely
that rich households have savings and poor households have credit. Though a large proportion (22%)
of the poor households has only credits, the relationship is more complex. In fact, poor households
have no savings but these households are also less eligible for credit. Rich households can benefit
from credit while they have also savings.
European Network Indicators on Social Quality Hungarian National Report, February 2005
European Foundation on Social Quality 32
3.4.6 Access to public transport
According to employment studies there are important differences in labour market chances and risks
within micro-regions. Villages and small towns lag behind larger cities in terms of physical
infrastructure, like in the extent and density of public transport. Many small settlements are isolated
from urban labour market due to the lack of proper public transport, and have very high of
unemployment for this reason (Kertesi and Köllő, 2000). Without developing local public transport
system in small villages and in the most depressed micro-regions it is impossible to increase the odds
of labour market re-integration of inhabitants of these settlements.
3.4.7 Access to cultural services
A set of indicators refers to cultural participation, visiting theatres, museums or cinemas. Cultural
institutions were subsidized in Hungary under communism, tickets were cheap but this situation has
changed after 1990. On the one hand, participation in high culture became more expensive, and, on
the other hand, real wages decreased sharply in Hungary, especially in the first years of the 1990s.
Consequently we see a drop for all of the three indicators between 1990 and 1995. Later, theatre
attendances stabilized, while for museum and cinema attendances reveal even a slight return in the
trend, an increase between 1995 and 2000/2002.
We tested how the level of the household income affects access to cultural services. Statistical data
from a recent survey reveals that, on average, only a minority of Hungarians (13%) attends regularly
theatres, museums or concerts. The difference by level of income is significant but the percentage for
regular access to these services is not very high for those living in more well to do households. At the
same time missing financial means is not the main cause for low access to high culture, though this
reason appears more frequently for those living in households with low level of income. Members of
these households mention quite commonly that they are not interested in participating in high culture.
It is believable if we assume that level of education is also low in these poor households or these
households involve old people who are usually less interested in outdoor cultural activities. In fact, the
most frequent reasoning is not specified but the category for ‘other reasons’ does not seem to be
affected by income differences either.
3.5.1 Friendship and family
Albert and Dávid (1999) indicated that for a large number of people interpersonal relations shrank in
recent years. This is reflected in the following phenomena: the drop of the average number of friends;
the increase in the number of individuals without any friend; the increase the number of individuals
outside inter-households exchanges.
3.5 Social networks
European Network Indicators on Social Quality Hungarian National Report, February 2005
European Foundation on Social Quality 33
Those households that became poor in terms of their supportive relations typically had one or two
members, an older head of household, mid-level income and low-level education. All in all, the
shrinkage of human relations is the most dramatic among individuals in disadvantage social positions.
In social quality perspective duration-type data have a particular importance. In this respect, indicators
from time use studies can be useful. The overall socializing time occupies 20-25 per cent of free time
in most European countries. However, in Hungary this share is smaller, and individuals aged 15-84
spent only 51 minutes on an average day on socializing in 2000 compared to 81 minutes in Denmark
and 70 minutes in Sweden. Another important indicator is the time amount spent alone per day. The
Hungarian time use survey shows that in 2000 individuals spent more time alone than in 1986 (Altorjai
et al., 2004). This trend is particularly emphasised for women. It indicates that more and more people
experience the every-day’s loneliness, which can be traced back to changing demographic and family
composition as well as to the common trend of isolation.
In economic crisis situation reciprocal exchanges among households is of great importance in
Hungary (Sik, 1988a). Moreover, in the decades of communism the role of households and inter-
household networks as the basic units of the informal economy has been reinforced (Sik, 1988b).
According to different surveys on this topic, inter-household exchange appears to be more likely
among better-off households with more economic and social resources in Hungary. The general
conclusion of these studies is that the overall inter-household exchange is more likely to be a
supplement to other sources of marital support than a replacement. In addition, the widespread
incidence of non-monetary exchanges among Hungarian households is motivated by reciprocal norms
which objective is to maintain and strengthen local social networks – mostly in rural areas (Brown,
2001).
European Network Indicators on Social Quality Hungarian National Report, February 2005
European Foundation on Social Quality 34

European Network Indicators on Social Quality Hungarian National Report, February 2005
European Foundation on Social Quality 35
There is a consensus among social scientists upon the general importance of social trust. High levels
of trust in a society contribute to economic growth and efficiency in market economics; provision of
public goods; social integration; co-operation and harmony; personal life satisfaction; democratic
stability; and even good health and longevity. Social trust is a core component of social capital (Delhey
and Newton, 2003). According to survey research, Eastern and Central European countries are
considered low trust societies; however, in these countries personal social networks are particularly
important. In this chapter we outline the special characteristics of social cohesion in Hingary.
4.2.1 Generalised trust
There are two dominant lines of research concerning trust. According to the first approach (individual
theories), trust is an individual property, which is learned in early childhood and tends to persist even
in later life-phases. In accordance with another view, trust is a personal property, the product of adult
life experiences: those who have been treated kindly and generously by life are more trusted than
those who suffer from poverty and other difficulties (see Delhey and Newton, 2003). According to the
second approach, trust is a property of a society, rather than of individuals (societal theories). From
this point of view, responses to the question on trust “Generally speaking, would you say that most
people can be trusted or that you can’t be too careful in dealing with people?” tell us less about
personality of individuals rather than about how they estimate the trustworthiness of the society
around them (Delhey and Newton, 2003). While the trust scores2 in Hungary, Poland, Slovenia and
Greece disperse between 3,6-4,0, in Sweden, Netherlands and Denmark these are around 6,0. This
appears to confirm the societal theory approach about social trust, namely that wealthier nations, and
those with greater income equalities, have higher levels of social trust than poorer and less egalitarian
countries. At the same time, investigating the Hungarian scores it is a fact that distrust is more
common among losers – those with little education, low income, and low status and are unsatisfied
with their life – than those with higher education level and income.
4.2.2 Specific trust
Of the components of the democratic institution system, Hungarians have the lowest level of trust
towards politicians. Thirty per cent of the respondents were mistrustful and within this proportion 11
per cent claim that they do not rely on politicians at all. While 5-5 per cent of all Hungarians credit the
2 The trust scores of different the countries show the means in a 0-10 scale, where 0 means the distrust and 10 means the
trustfulness.
4 Social Cohesion
4.1 Introduction
4.2 Trust

European Network Indicators on Social Quality Hungarian National Report, February 2005
European Foundation on Social Quality 36
country’s parliament and legislative system, 6 per cent of them trust the police, for politicians this
proportion was less than 2 per cent.
The social-demographic factors hardly influence the extent of trust in the country’s parliament. It is
worth emphasizing that women, elderly people and those with lower education level are the most
mistrustful; while men and individuals with higher education have higher trust in the country’s
parliament. We could not find any gender and age variations concerning the judgement of legal
system, but education makes differences: higher schooling level usually mean higher degrees of trust.
Regarding the judgement of the police, younger generation are more dismissive than elderly people.
While only 4 per cent of Hungarians aged 15-39 trust the police entirely, this proportion reaches 10 per
cent among people aged more than 60 years old. We can find some educational variations in the
judgement of politicians as well: people with less education have lower trust in politicians than persons
with higher education level.
According to an international comparative research, Scandinavian countries – Denmark, Finland and
Sweden – are the most trustful in democratic institutions, while post-communist countries such as
Poland, Czech Republic and Slovenia have less trust in these institutions. Hungary seems to be close
to the European average. It is worth mentioning that in each country politicians are the less trusted,
especially in Poland and Portugal. In countries investigated people rely on the police at most extent,
except in Hungary.
To investigate the importance of different sphere of everyday life could predict the confidence,
pessimism and cynism about the possibilities for social and political co-operation, which are the
elements of social trust. According to survey data, the importance of work in everyday life is relatively
low in Hungary. While in Italy, Slovenia, Spain and France 95 per cent of respondents consider work
as an important or very important element of everyday life, in Hungary this share is smaller, 89 per
cent. The Hungarian view on it is close to people’s opinion in Finland, Denmark and Netherlands. In all
countries investigated the family seems to be the most important sphere of the human life. Friends
and free time have relatively low importance in Hungary, and politics was mentioned only by 18 per
cent of respondents as an important thing.
4.3.1 Altruism
One of the most useful indicators of altruism can be obtained from time use studies. According to a
very recent publication (EUROSTAT, 2004), comparing women and men aged 20-74, the total time
spent on volunteer work and informal help is slightly higher for men in most of the countries. In
Finland, Sweden and Norway, the time is the same for women and men, whereas in the United
Kingdom women spend more time on these tasks. In Hungary women spend 8 minutes in an average
day on volunteer work, while men spend a little bit more, 13 minutes. Among the countries
4.3 Other integrative norms and values
European Network Indicators on Social Quality Hungarian National Report, February 2005
European Foundation on Social Quality 37
investigated in this survey, Hungary has the smallest proportion of those spent some time on volunteer
work on an average day.
One of the most important tasks of Red Cross is the persistent maintenance of blood donation. In
every year 90-95 institutional and getting off blood donation was organised in 125-128 companies,
institutions and towns in Hungary. The number of donors of blood decrease every year. The main
cause of this phenomenon are ageing and decreasing number of younger donors of blood.
3.2.2 Tolerance
According to the European Values Survey 1999/2000, the proportion of respondents who would make
anyone enter the country to work purpose is the lowest in Hungary and Czech Republic. Among the
investigated countries, in Finland, Portugal and Sweden more than 10 per cent of respondents think
that for work purpose government should let anyone to come to the country who wants to do it. This
proportion reaches 20 per cent in Spain. At the same time more than 26 per cent of Hungarians
believe that government should prohibit foreign people entering the country, which is much higher than
in the other investigated countries.
According to TARKI Social Research Centre Inc., in 2002 4,7 per cent of respondents agreed with the
statement that “Hungary should let all immigrants in the country”, 32 per cent of them said that
“Hungary should not be allowed to let any immigrants in” and 56 per cent claimed that some
immigrants are allowed to come into the country. According to the survey, people in Hungary tend to
define the question of immigrants as a “zero-sum” game. Hungarians with less schooling and low
income are against the inclusion of immigrants. They are not satisfied with the activity of the
government, which seems to be a strong factor in the prediction of attitudes against immigrants.
People with higher schooling and better income tend to be much more open regarding the inclusion of
immigrants. (Bernát, 2002)
The European Values Survey asked a question concerning pluralism and multiculturalism as well. The
researchers were curious what people thought, whether immigrants should maintain their customs and
traditions or it would have been better for the society if immigrants did not maintain their traditions but
took over the customs of the country. The large share of respondents in the most investigated
countries think that it is better if immigrants to take over the custom of the country and leave behind
their traditions - except in Greece, Ireland, Spain and Italy, where people are more likely to think that
immigrants should maintain their variant customs. Hungary takes part in the first country group: more
than 66 per cent of respondents claim that immigrants should take over the traditions of the country
instead of maintaining their diverse customs.
According to the responses to the question “Please tell me for each of the following statements
whether you think it can always be justified, never be justified, or something in between, using the
cards 1-never and 10-always”, Hungarians absolutely distance themselves from homosexuality and
suicide. While the Polish score was 2,9, the Czech was 5,47, the Dutch value was 7,8 and the
Swedish was 7,65 on the scale of ten, Hungarians gave 1,45 regarding the acceptance of
European Network Indicators on Social Quality Hungarian National Report, February 2005
European Foundation on Social Quality 38
homosexuality. In the matter of suicide, Hungarians marked 1,56, while Netherlands had 4,34,
Denmark 3,07, Czech Republic 2,90 and Slovenia 3,54.
According to the European Values Survey, Hungarians are the most dismissive in connection with
other people’s self identity, beliefs, and behaviour and lifestyle preferences. Taking into account the
answers on the question “Could you please sort out any that you would not like to have as
neighbours?”, Hungarians show the greatest intolerance toward all social groups listed here. More
than 90 per cent of Hungarians would not like to live in a neighbourhood of heavy drinkers and drug
addicts. In case of Czech Republic and Poland these proportions were around 75 per cent. While 88
per cent of Hungarians would not like to live in a dwelling where neighbours are people with criminal
record, this proportion was only 64 per cent in the Czech Republic and 33 per cent in Netherlands. 52
per cent of Hungarians would not like to live in a neighbourhood of people of a different race, while
only 5,5 per cent of Dutch people would feel uncomfortable themselves in this situation.
4.3.2 Social contract
Social justice, as an integrative norm and value, is undoubtedly the substance of social cohesion. In
this respect indicators aiming at capturing individuals’ opinion on the possible causes of poverty or
socio-economic insecurity may have a particular importance. The European Values Survey revealed a
mixed picture on it in Hungary. Almost third (38 per cent) of respondents cited ‘injustice in our society’
and 28% identified ’laziness and lack of will power’ as a reason. ‘Bad luck’ was seen as a possible
cause of poverty by 13 per cent; ‘part of the modern progress’ by 19 per cent of respondents. All in all,
in post-socialist countries the most frequently cited reasons for socio-economic insecurity were
external and structural ones, rather than internal and personal causes. The over-emphasise of these
kinds of causes in Hungary may prognosticate that people expect resolution from government and
social policy actions in reference to winding-up poverty.
The European Values Survey also posed a question concerning the willingness to actually do
something to improve life conditions of different social groups. 11 per cent of Hungarians would be
absolutely prepared to help people in their neighbourhood, and 14 per cent of respondents would give
help to sick and disabled people. In everyday life 90 per cent of individuals would be absolutely
prepared to help their immediate family, which exceeds the value of all countries examined in this
survey.
In Hungary 1,5 per cent, in Poland 3 per cent and in Slovenia 5 per cent of respondents think that they
would help immigrants with no hesitation. In Sweden this rate was more than 10 per cent according to
the data of European Values Survey. Central Eastern European countries are common in the relatively
higher proportion of respondents claiming not being prepared to actually do something to improve
immigrants’ life conditions compared to Western European countries. This result may confirm the
previously mentioned attitudes against the inclusion of immigrants in Hungary.
European Network Indicators on Social Quality Hungarian National Report, February 2005
European Foundation on Social Quality 39
The Community Framework Strategy on Gender Equality (2001-2005) emphasises the importance of
equal participation and representation of all women and men in the economy, in decision-making, and
in social, cultural and civil life. To investigate this problem in everyday life, again the time use survey is
of particular importance (Eurostat, 2004).
Women do 60-66 per cent of all domestic work in the countries included in the comparative time use
research. Women invest the most time in these kinds of duties in Estonia, Hungary and Slovenia;
around five hours per day. Less than four hours is spent on domestic work by women in Sweden,
Norway and Finland. Men's share is the highest in Sweden, however, men in Estonia, Slovenia,
Hungary and Belgium spend more time per day on domestic tasks than their counterparts in the rest of
the countries. Women's and men's shares of domestic work are more equal in Sweden. A gender
difference is also observed in the proportions of persons who do any domestic work on an average
day. Almost all women, but slightly fewer men do some domestic work; in addition, domestic activities
are gender segregated: women do housework and caring; men do maintenance and repair work. With
women, food preparation is the most time-consuming activity, especially in Hungary, Slovenia and
Estonia. Looking at parents with small children, the longest total time spent on childcare activities is
reported in Hungary. Mothers spend two to two-and-a-half hours on these duties on an average day,
and fathers around an hour. It is likely that country variations are partly explained by differences in the
systems for the provision of childcare services (see more about this in chapter on SES and social
inclusion).
Hungary has two sources concerning the number of non-governmental organisations and population
share in these institutions. One of them is the Time-Use Survey database collected by Hungarian
Central Statistical Office in 2000. According to this survey 27 per cent of all respondents claimed that
they were members of any organisations. According to the European Social Survey – which was
conducted in 2002 in an international comparative framework – this share was about 25 per cent.
Based on the former research people aged more than 40 and with at least secondary education are
more likely to be a member of a non-governmental organisation. Differences between countries are
striking: in the Netherlands, Sweden and Denmark 80 per cent of men are members in some kind of
non-governmental organisation, this proportion in Poland is only 18 per cent, in Greece 25 per cent, in
Hungary 25 per cent – as it was reported before.
Personal social networks were extremely important in the Communist systems of East and Central
Europe. People in these countries have built strong private and unofficial contacts among each other –
with those who could help them to resolve daily problems. Informal economy was built on these
relationships, because people in the region know whom they trust, and trust those whom they know
(Delhey and Newton 2003).
4.4 Social networks
European Network Indicators on Social Quality Hungarian National Report, February 2005
European Foundation on Social Quality 40
In job seeking, or when looking for solution for various life management questions people tend to
apply to kinship or friends for advice or any kind of help. After the system-transition – similarly to
communist time – Hungarian household economy needed female labour because two earnings has
been required to survive the everyday life. Due to this situation, to conciliate work and family needs a
special institutional background – for example, opening hours fit more the different work schedules, or
extensive family network. The majority of asked employed women in the “Family in transition” research
(HCSO, 2001) claimed that it was the grandparents’ help that had made it possible for them to
reintegrate to the labour market. Although, living of several generations together is less frequent in
Hungary recently, help from the family, primarily from grandparents, remains important for households
with children. Grandparents help mostly in families where children are young. Support from
grandparents explicitly increases the difference of families with children in terms of their financial
situation. While 60 per cent of households, which are able to make savings, are helped by
grandparents only 45 per cent of households whose income do not cover costs receive grandparents
help. The most frequent form of grandparents help is in-kind support, primarily food. The second and
the third most important ones are daily physical help and financial support. There is a massive
difference by the age of the children as well. Households with younger than school-age children
mentioned food support the first and physical help the second most frequent forms of grandparents’
help. At the same time, households with children in upper primary grades reported the most taking
care of children during school holidays. This remains equally important in households with children in
secondary education, while food and financial support tend to become the most important again.
It is worth to estimate the intensity of social networks by the proportion of frequency contact with
friends. The proportion of every day contacts are higher among women than men, but the once a
week and few times a week frequency are higher among men than women. People aged 18-39 are
the most rife with friends: among them the share of every day contacts is 35 per cent, but it is similarly
high (33 per cent) in old generations. Among individuals aged 40-59 the proportion of weekly and
monthly encounters is higher than in the other age groups. 42 per cent of people with primary
education keep up relationship with their friends every day, while only 20 per cent of respondents with
secondary degree and 15 per cent with tertiary do the same. The weekly encounters with friends is
typical for secondary-educated persons, while individuals with tertiary diploma encounter their friend
rarest.
According to the European Values Survey 1999/2000, – in Central Europe – Polish people are the
most proud of their nationality, 72 per cent of all them gave the answer „very proud” and almost 26 per
cent think that it is a quite proud thing to be Polish. Hungary and Slovenia had a very similar
distribution in this respect: in both countries roughly half of all citizens were very proud of their
nationality and further 35-38 per cent marked the „quite proud” category. In Hungary a little bit more
than 2 per cent of all respondents cited the „not proud at all” answer.
4.5 Identity
European Network Indicators on Social Quality Hungarian National Report, February 2005
European Foundation on Social Quality 41
In 2003 autumn, Eurobarometer asked respondents of the Candidate Countries to choose among the
following possibilities: in the near future they will consider themselves as 1) nationality only, 2)
nationality and European 3) European and nationality, or 4) European only. According to these data,
each candidate country excluding Hungarians identified themselves as European rather than just their
own nationality. This means that the percentage of those respondents who marked that they identify
themselves as „Nationality and European”, „European and Nationality”, „European only” exceeded the
percentage of those who identified themselves only by their nationality. In all investigated countries
there were few respondents only who considered themselves exclusively European (from 1% in
Hungary and Bulgaria to 5 per cent in Slovakia and Romania).
According to the European Values Survey, the attachment to locality or hometown is particularly
typical of Hungarian and Polish people. While 67 per cent of Hungarians and 63 per cent of Polish
identified themselves as a person who first of all belongs to their locality or town where they live, only
50 per cent of Czech and 47 per cent of Bulgarian respondents cited this category. Hungarians at the
second place marked the region and the country as a geographical unit to where they feel belonging.

European Network Indicators on Social Quality Hungarian National Report, February 2005
European Foundation on Social Quality 42
European Network Indicators on Social Quality Hungarian National Report, February 2005
European Foundation on Social Quality 43
Social empowerment deals with conditions for increasing freedom and capabilities of people to act.
Powerlessness is embedded in the nature of institutional relations, which are pre-conditional factors of
actions to participate in, negotiate with, power over, power to and power from in different fields of life.
Social empowerment in Hungary is built upon the idea that – next to the ability of adjustment – could
be the most important factor in the process of enhancing life chances and diminishing risks. However,
in many cases there are no data available for the indicators and we have to use qualitative
descriptions or policy examples for illustrating them.
5.2.1 Application of knowledge
A focal hypothesis in stratification research refers to the crucial role of education in the process of
social mobility. Analysts of social mobility investigate the impact of family background in the status
attainment process and formulate the hypothesis that social origin tends to influence social status to
less extent as societies are getting modernized, while education plays a growing role in achieved
status (cf. Treiman, 1970). This trend is in accordance with an increasing meritocracy, when
achievement replaces ascription in status attainment. International comparative research found this
hypothesis especially valid for the previous socialist countries (Simkus, 1981). In planed economies,
young people’s educational attainment was centrally settled in line with the expected requests of the
economy. Consequently, the statistical link between the level of education and the labour market
position was rather strong in Hungary as well. In a historical perspective from the beginning of the 20th
century until the collapse of communism, education is an increasingly important determinant of
occupation. However, from the 1980s and after the fall of the socialist regime, there is a decline and a
slight return in this tendency as educational expansion increases and the labour market is getting
more open in Hungary (Luijkx et al. 2002). Moreover, higher level of education increases the
opportunities for career mobility during the life course, while missing human capital is one the main
causes for career failures (e.g. unemployment or downward mobility) in the labour market (Luijkx et al.
1998. Bukodi, Róbert, 2002).
5.2.2 Availability of information
Changes in the educational system and the ever increasing number of those involved in various forms
of educational institutions undoubtedly contributed to the perpetual decline of illiteracy rates.
5 Social Empowerment
5.1 Introduction
5.2 Knowledge base

European Network Indicators on Social Quality Hungarian National Report, February 2005
European Foundation on Social Quality 44
As it was mentioned in SES chapter, educational poverty can also be measured through lack of
competences using data from PISA or Adult Literacy Surveys. These surveys pay most attention to
literacy and conceive it to be the strategic parameter which determines all other factors. On the basis
of studies using competence data (e.g. Allmendinger, Leibfried, 2003), educational poverty can be
defined by the lowest competence level (of five using by these surveys), which corresponds to
functional illiteracy. If one does not attain level 1, he/she can be regarded educationally poor.
Individuals belonging to this group are not necessarily illiterate, but their elementary reading
capabilities do not help them to survive in practical context of everyday life. In this respect Hungary’s
situation is relatively bad in European context: 23 per cent of students aged 15 belongs to the
educationally poor (the share of them is less than 15 per cent in Austria, Sweden or Finland). As far as
adult population is concerned, the incidence of competence poverty is even higher: 33 per cent of
Hungarians aged 16-65 have serious problems concerning their reading capabilities.
After the transition the adaptation, skills and competences became an even stronger factor in
enhancing life chances. To be well-informed means to have increased potential of adaptation. From
the late-1980s the Internet has become one of the most important information sources; and in order to
use it appropriately, one has to have certain skills and knowledge. Information and communication
technology literacy (ICT-literacy) skills are essential requirements for everyone who, both as an
individual and as a member of a democratic society, wants to be prepared for the challenges of the
digital age.
Besides the skills and knowledge aspect, which could be considered as a cognitive condition of
information-richness, physical access to the Internet plays a crucial role (DiMaggio and Hargittai,
2001; Hargittai, 2002). According to the World Internet Project 2003 database 25 per cent of
Hungarians can access the Internet. However, the proportion of those who go online at least once a
month is only 22 per cent. Last year 41 per cent of Internet users had access at home. This proportion
represents 10,3 per cent of the population above 14. This means that among the possible places of
access home became the first, pushing school and workplace to the second and third paces,
respectively.
According to an international comparative research the Hungarian information culture is rather
premature. It is worth mentioning that Hungary is one of the countries - after Greece - where the
proportion of Internet non-users is the highest. While 80 per cent of the population above 14 has no
access to the Internet in Hungary, in Denmark 35, Sweden 28, in Austria and Netherlands 22 per cent
go online at least once a day.
Recent information society policies pay much attention to the threat of “digital divide”. The digital
divide marks “the gap between individuals, households, businesses and geographic areas at different
socio-economic levels with regard both to their opportunities to access information and communication
technologies (ICTs) and to their use of the internet for a wide variety of activities.” (OECD, 2001)
Selhofer and Hüsing have produced an index which describes the percentage of internet and

European Network Indicators on Social Quality Hungarian National Report, February 2005
European Foundation on Social Quality 45
computer users (total users “at home”) at the risk groups (women, low education, people aged 50 and
older and low income status) as a ratio of the percentage of users in the total population. The overall
Divide Index is calculated as the mean of the four indices of the risk groups (See Selhofer and Hüsing,
2002). The Hungarian overall Digital Divide Index has been decreasing slightly since 2001, however it
is still higher than the European Union average. Young and highly educated people have greater
chance to take part in the Information Society than the elderly or people with lower education level. As
far as the involvement in the Information Society is concerned, the rule of income status is a stronger
factor in the European Union than in Hungary.
Media
Based on the Hungarian WIP 2003 data, sending and receiving e-mails and searching for information,
playing online games, and browsing for fun are the most popular uses of the Internet; online news
consumption and participating in chat sessions are relatively typical activities, too. All main
newspapers (broadsheets and tabloids) have launched their online versions and significant online
content providers have also appeared. In February 2002, the two most visited websites were Origo.hu
and Index.hu with more than 11 million page impressions per week. (Kiss, 2004).
The Hungarian government has established the Közháló (PublicNet) project that aims to merge
various network segments of public access under the co-ordination of the Ministry of Informatics.
Another objective is to create 2004 eMagyarország (eHungary) points by the end of 2004.
‘eMagyarország points’ are public access points providing services in a franchise-like system and is
planned cover the entire area of the country. The Közháló project will revive the telecottage
programme which was at first a local initiative and later became a national association. So far 500
telecottages are established in Hungary, and further 500 are under construction, mainly in regions with
poorly developed infrastructure and economy. Telecottages are usually produced and operated by civil
society organizations. Working telecottages provide nearly 60 different types of local services
(education, cultural, social, medical and other) and 2 million village dwellers can access modern
telecommunication and information technologies. (see The Hungarian Information Society on the Eve
of the Accession to the European Union: snapshot and strategic objectives.)
Like in other countries, the importance of press media falls behind that of television. The circulation is
decreasing while people spend more and more time with television set switched on. The communist
government did not dare to pass a broadcasting law and imposed a moratorium of frequency
allocation instead. The media market started in 1988 and after a long march the broadcasting law was
registered as Act I of 1996 on Radio and television (after the Broadcasting Act of 1996). From the
beginning of 90s new independent television channels were introduced in Hungary. In this situation a
lot of subscriber has bought different kind of subscribing packages. The two national commercial
channels (TV2 and RTL Klub) combined had almost 60 percent audience market share in 2003 and an
even higher share, 90 percent of the advertising market. This shows that the commercial television
has conquered the media scene. Their programmes favour mainstream commercial values and
European Network Indicators on Social Quality Hungarian National Report, February 2005
European Foundation on Social Quality 46
consumer culture (Gálik, 2004). Beyond m1, the public television has two more channels (m2, Duna
TV), they broadcast via satellite. The latter is supposed to shape its programme taking into account
the Hungarians living outside Hungary. The first channel broadcasts the domestic minorities’ and the
religious programmes, while the second replays several programmes of the first. The law compels the
cable companies to put the public television programmes into their packages. Without that regulation,
two of the three public channels could not be seen by most of the Hungarian audience because just a
few households have satellite receiver (Kiss, 2004).
There are several cable companies in Hungary but their economic strength varies greatly. The satellite
and cable distribution is accessible more than 1,5 million households, the subscription packages are
exceeding in number 950. It is worth to mention the 4 biggest commercial suppliers are the UPC
Hungary, EMKTV Kft, Matávkábel Kft and Fibernet Kft. In the middle of February 2002, more than half
of the 170 cable networks of the country belonged to three companies: UPC (30), Matáv (21) and
Fibernet (48). Since 2000, the customers have raised a huge number of complaints against the cable
companies (the 90 per cent of the complaints is against UPC and Matáv) because of the high prices
and the frequent changes in the assortment. In the beginning of December 2001, one could watch 24
television programmes in Hungarian language. Most of them are the dubbed or subtitled versions of
foreign channels: HBO, National Geographic Channel, Animal Planet, Discovery, Eurosport etc. (Kiss,
2004).
Five radio channels have national broadcasting possibilities in Hungary. Three of them belong to the
public radio (Magyar Rádió). The public radio has three channels, but the audience data are
favourable for neither of them. Only the news magazine programmes of the first (Kossuth Rádió) have
high shares in the audience otherwise the public channels are not listened to widely. It is true
particularly in the case of the third channel (Bartók Rádió), which broadcasts classical music and
literature programmes only and its share is always below one percent. The second channel (Petőfi
Rádió) tries to meet the challenge of the commercial music radios - with not too much success. There
are other two radio channels have national broadcasting possibilities, the Danubius and Sláger, which
are private radios. Two more companies, Juventus and Radio 1, actually reaches more than the half of
the territory of Hungary, but via a network of radios; consequently they are in fierce competition with
the former causing much trouble to them in obtaining enough advertising earnings. In the beginning of
March 2002, 25 regional radio channels worked in Hungary, nine of them being the regional stations of
the public radio. The number of the local radios reached 64, some of them belonging to the network of
national or regional companies (Kiss, 2004).
After years of more or less same financial conditions, the public radio was in deficit in 2001, because
both the advertising revenues and the subscription incomes were far below the expected and the
selling of a whole frequency as well as the staff reduction were not enough to turn the tide (Kiss,
2004).

European Network Indicators on Social Quality Hungarian National Report, February 2005
European Foundation on Social Quality 47
It is worth to mention some smaller commercial channels, such as Klubrádió, which has recently
modified its profile and launched very serious programmes on politics and social questions. Rádió C, a
special channel for the Hungarian Gypsy has been launched recently in the region of Budapest;
several Hungarian non-Roma media celebrities help the channel as anchorpersons. Pannon Rádió is
considered to be extreme rightist. The National Radio and Television Commission has also punished
the channel because of its programmes’ anti minority biases. A great part of the Hungarian musicians
tried to boycott the channel by forbidding the use of their songs in its programmes.The genre of talk
radio is still unfamiliar in Hungary; one can find some shorter programmes on different channels that
remind something like talk radio (Kiss, 2004)..
The press media played an important role during the transitional period since they made it possible for
the new democratic political forces to make themselves known by the public and the journalists wrote
extensively about the Western ideas and democratic institutions. This process, with the media, the
journalists and the intelligentsia preparing both the public generally and the communist elite
particularly to the transition, concluded in the fairly benign political system change between 1988 and
1990.
In Hungary, there are 36 daily newspapers. The country has 12 national daily newspapers and 24
regional and smaller urban ones. As for the regional papers with considerable circulation, there is a
daily newspaper in each of the nineteen counties but the one around Budapest. Of the 12 national
daily titles, 4 are quality political papers, 3 are economic ones, 4 are tabloids, and 1 is about sports.
There are several free of charge daily papers. One of them is Metro, the Hungarian version of the
Scandinavian paper. It has a circulation of 327 thousand which is not much less than the circulation of
all the national quality newspapers. Its publication used to be concentrating on Budapest and the
surrounding of the capital, but since April 2001, it can be found in the county centres as well.
Népszabadság is one of the most important daily in Hungary with a circulation of about 211 thousand.
The second ones is Magyar Nemzet with a bit less than the half of the former. Both papers have its
own political character: the former is close to the socialists while the latter to the conservatives (Kiss,
2004).
5.2.3 User friendliness of information
Language is not only a tool for communication and knowledge but also a fundamental attribute of
cultural identity and empowerment, both for the individual and the group. Respect for the languages of
persons belonging to different linguistic communities therefore is essential to peaceful cohabitation.
This applies both to majority groups, to minorities (whether traditionally resident in a country or more
recent migrants) and to indigenous peoples. (UNESCO — Education in multilingual worlds.)
Hungarian minorities have some television programmes within the programme structure of the public
service channels, particularly in Duna TV.
European Network Indicators on Social Quality Hungarian National Report, February 2005
European Foundation on Social Quality 48
The number of free advocacy institutions and guidance centres have increased continuously in the
second half of 1990s (from 462 to 805), but in 2003 some decreasing is recognisable. In 1998 more
than 246 thousand patients asked advice from these institutions, while in 2003 more than 300
thousand persons used these services. More than 20 per cent of the cases are related to financial
problems of the household. A similar proportion of families ask help to manage their official affairs.
5.3.1 Control over employment contract
In the early 1990s compulsory trade union membership was abolished and new independent trade
unions were introduced in Hungary. The partly reformed former union confederation managed to keep
its dominance in the multi-union structure, while the newly emerged independent unions failed to
recruit a sizeable membership. The overall rate of unionization declined substantially during the last
decade. Different factors have contributed to the marginalization of trade unions in Hungary: For
instance, mass unemployment due to the collapse of large state companies, and then the rise of self-
employment, as well as, the expansion of informal employment (Bukodi, Róbert 2004).
Until 2001, the Labour Force Survey did not include questions concerning unionization. According to
the data of the latest survey, 19.7 per cent of the population aged 15-64 indicated that they were union
members. Unionization among women (22.4%) was somewhat higher than among men (17.3%). This
is due to the fact that female employment tends to concentrate in the traditionally unionized sectors,
such as health and social work. The age composition of union members shows that union membership
is the most widespread among older people. Non-manual employees are more likely to be members of
unions than manual workers.
According to the report of European industrial relations observatory on-line on collective bargaining
from the Hungarian Ministry of Employment and Labour, the proportion of employees covered by
collective agreements fell by 5 percentage points from 2001 to 2002. In terms of the content of
bargaining, many agreements concluded in 2002 included new provisions on flexible working hours,
including the annualisation of working time. The scope of wage agreements further narrowed,
especially in relation to enterprise-level minimum wages and wage rates. On the other hand,
according to the MSZOSZ trade union confederation, enterprise-level wage agreements for 2003,
where they were reached, were generally in line with a national tripartite recommendation on pay
increases.
According to a report by the Ministry of Employment and Labour - which maintains the statistical
database on collective agreements - in 2002 about 1 million employees were covered by sectorial and
company agreements in Hungary. According to the Labour Force Survey, the number of active
employees is about 3.2 million, of whom about 2.5 million work in companies and public institutions
employing more than five people. Based on the latter figure, 39.6% of employees were covered by
collective agreements in 2002, which means a 5 percentage point drop in comparison with the
previous year when 44.9% of employees were covered in the same segment of the economy.
5.3 Labour market
European Network Indicators on Social Quality Hungarian National Report, February 2005
European Foundation on Social Quality 49
However, if one includes those covered by the extension of collective agreements, a further 46,000
employees were included in 2001 and a further 38,000 in 2002, with the result that the overall
coverage rate was 46.7% in 2001 and 41.1% in 2002. In absolute terms, however, while employment
in Hungary grew by 70,000 during 2002, the number of employees covered by collective agreements
decreased by 110,000, including those covered by extended agreements.
As far as private sector is concerned, collective agreements are usually concluded at large
enterprises, while the small and medium-sized enterprise (SME) sector is largely unregulated by them.
Workplace-level agreements are less common in the public sector, where most issues concerning
terms and conditions of employment are regulated by law. The coverage rates of workplace
agreements in the private and public sector in 2002 were 39% and 33%, respectively. In sectorial
terms, the highest overall coverage rates were reported in the energy, water supply and sewage
sector (almost 100%), transportation, telecommunications, postal services (78%) and in health care
and social services (70%). Less regulated by collective agreements were the public administration
(9%), construction (12%) and private services (21%) (EFIWLC).
5.3.2 Prospects of job mobility
In addition to formal training, the other aspect of investments in human capital is the life-long learning,
namely participating in the different forms of training after completing initial education. Compared to
Western European countries, in Hungary much smaller share of people obtain some kind of skill
outside of initial education (OECD, 1999). Partly, it is a consequence of the nature of Hungarian
educational system, where vocational training is embedded in the initial curricula. But on the other
hand, the lack of further investment in training and knowledge may lead to higher unemployment risk
and to lower chance of getting a high-rewarding job.
However, according to time-use data, there was a slight increase in the last decade in the proportion
of individuals aged 25-64 spending time on studying. But, there are significant differences in the
training incentives according to employment status and initial educational attainment. In 2000 3.3 per
cent of working people spent any time on studying on an average day. People who are not employed
are less likely to invest in their training: only 1.2 per cent of them deals with investing in human capital
on an average day. The incidence of studying is somewhat higher for women – irrespective of their
employment status. Those with less initial education appear to lack incentives or opportunities to
acquire more in later life, which may increase their risk of labour market exclusion. This problem is
particularly relevant for individuals with only primary and basic vocational education: for them the
proportion of those spending any time on studying on an average day had decreased between 1986
and 2000 for both sexes.
According to an international research carried out by the Hungarian Central Statistical Office and
Eurostat in 1999, 40 per cent of companies provided vocational training for their workers in Candidate
Countries. In the Czech Republic the proportion of companies that provide trainings for their
employees reached 70 per cent, while in Hungary it was 37 per cent and in Romania it hardly
European Network Indicators on Social Quality Hungarian National Report, February 2005
European Foundation on Social Quality 50
exceeded 10 per cent. While 80 per cent of big companies organize internal or external vocational
trainings, only 32 per cent of companies of smaller size provided courses for their employees in 1999.
There is a significant excursion of internal courses among companies with different sizes providing
vocational trainings. Big companies of stable market position – especially, multinationals – regularly
organize refresher courses for their employees. Medium-sized organizations usually hold refresher
courses when coming out with new products and services. Two-thirds of the enterprises in Hungary,
mainly small-sized companies, have no professional training whatsoever of their own. However, they
pay a compulsory contribution to the state fund of professional training, which is 1,5 per cent of wages
before taxation. (Background paper of Hungary at Employment Week 2004)
Besides the size of companies, the economic branch is another determining factor regarding the
investment to human resources development. In the European Union countries, such as new member
countries, companies working in financial services provide mostly refresher courses for their
employees. 50 per cent of economic service enterprises invest on human resources development
activities, while industrial organizations in at much lower rate provide vocational training for their
workers.
As for the incidence of job mobility is concerned, a recent study indicates that working in producer
services (finance, insurance, communication, etc.) increases the likelihood of job mobility, particularly
that of upward shifts (Bukodi, Róbert, 2002). However, individuals working in personal and domestic
services have the lowest chance of upward occupational mobility. This result indicates that expanding
sectors – like for instance financial services – opened the “window of opportunities” for career
developments, especially for people who are familiar with the new technologies and who possess the
necessary amount of human resources. At the same time, working in these sectors protected from
downward mobility.
5.3.3 Reconciliation of work and family life
One of the most important aims of the survey of „Family in Transition” (HCSO, 2001) was to learn what
forms of help serve the best to coordinate the two kinds of duty, namely family and work. The survey
asked respondents to select the three most important options from the list below:
− opening hours of nurseries, kindergartens and day-care services that better fit the working
schedules of parents
− better transportation to get to school (adjusted time table, school bus)
− ensuring school meals
− opening hours in the area of services that better fit the working time
− regular or occasional organised help in household work
− more opportunities for part time employment
− opportunity to have more flexible working hours.
European Network Indicators on Social Quality Hungarian National Report, February 2005
European Foundation on Social Quality 51
Respondents ranked flexible working hours first, and part time employment second, and hours of
child-care institutions that better fit working schedules third. This is ranking of factors that directly help
parents to combine the two duties namely, work and family.
In families which had risen or currently raising children, the three most important help were the flexible
working hours, the adjusted hours in institutions for children and the part time employment. The option
of adjusted hours in institutions for children was the most important help among the childless
households as well. There was no important difference found in the priority order of the forms of help
neither by the education nor the head of the household or by the type of settlement where the
household lived. There is, however, a certain connection between the preferred forms of help and the
financial situation of the household. This connection manifests itself in that households that have
financial problems tend to mention the school meals more frequently than the average. At the same
time, for families with better financial situation the flexible working hours seem to be more important
than for the other households (HCSO, 2001).
It is observed that multiple disadvantaged households do not list flexible working hours among the first
three priorities. For them school meals are the first, mentioned almost twice as frequently as the
average. It appears right to assume that for these families the mere existence of the possibility of
having meals at school is just as important as its being free of charge, also, opening hours of
institutions for children better adjusted to parents needs is especially important for most of these
parents do so low qualification jobs that usually involve two-shift or irregular schedules (HCSO, 2001).
5.4.1 Openness and supportiveness of political system
In Hungary the Act on Local Governments regulates three main forms of direct democracy: local
referendum, local public initiative and public hearing (Temesi, 2002). Participants in local referendums
and public initiatives are those who have the right to vote in municipal elections. The representative
body of the local government calls local referendums. A local referendum can be initiated by at least
one-quarter of the local representatives, by a committee of the representative body, by the executive
body of a local civil organization or by ten to twenty-five per cent of the electorate. The Act on Local
Governments regulates the conditions under which local referendums can be held. The body of
representatives is obligated to call local referendums on initiatives to unite or separate settlements,
establish new communities, and establish or separate joint representative bodies and other matters
determined by the statutes of the local government. Referendums cannot be called on decisions
concerning the local government budget; local taxes and rates; organizational, personal and
operational matters; or the declaration of dissolution of the representative body. If a referendum is
unsuccessful, the body of representatives is entitled to make a decision on the issue put forward.
Another local referendum on the same issue may not be called within one year. In settlements with
less than five hundred inhabitants, local referendums may be conducted through village meetings of
the local authority with the understanding that the outcome is considered a decision by referendum if
more than half of the voters are present at the meeting.
5.4 Opennes and supportiveness of institutions

European Network Indicators on Social Quality Hungarian National Report, February 2005
European Foundation on Social Quality 52
Public initiatives serve to bring local matters before the body of representatives that fall within its
competence. They must be submitted to the mayor. The number of voters necessary for a public
initiative to be successful is determined by the statutes of the local authority. The representative body
is obligated to hold a debate on the public initiative. The final form of direct democracy is pubic
hearing, which must be held at least once annually by the body of representatives. The time and place
of a public hearing must be announced in advance. Citizens and representatives of local interest
organizations have the right to participate in it, and make proposals during such hearings.
5.4.2 Openness of economic system and organisations
The notion of social partnership has a long and rich history in Europe. It refers to joint meetings of
employers and employee representatives to promote economic stability and growth, as well as
improvement of living and working conditions. Various employee representatives often have different
responsibilities and district rights. For example, in some countries, work councils act as the
representative bodies for employees, while in others, union representatives serve this function. (Hewitt
International Report, 2003)
In Hungary every workplace employing more than 50 workers should elect a Work Council. The
number of Council members depends on the size of the enterprise: From three persons to 13. A
validly elected Works Council has power in protecting all employees, union members and non union-
members alike, working at the same enterprise (Szakáts, 2003). One of the important rights provides
for co-decision with the employer when is obligated to seek the Council’s opinion according to the
following issues:
− any plan affecting a sizeable group of employees regarding restructuring, privatisation and
modernisation of the enterprise;
− personnel record system;
− any plans for trade training, promoting employment and pensions for concession workers;
− rehabilitation of employees with reduced working capacity;
− annual holiday plans;
− introduction of new working methods and output requirements;
− plans of work rules affecting employees’ essential interests; and
− competitions promising material or moral reward.
The employer is bound when the Council demands it to supply information on:
all fundamental issues affecting the employer’s economic situation a minimum of six monthly intervals;
plans of essential modification of business activities and investments; and
wage trends, characteristics of tasks performed, and conditions and use of working time, in every half
year.
In Hungary, it is possible that both unions and councils exist in the same workplace. In this case
unions have more rights than councils regarding control workplace-specific issues, such as hours of
work, overtime, training, promotion and others.

European Network Indicators on Social Quality Hungarian National Report, February 2005
European Foundation on Social Quality 53
5.5.1 Support for collective action
Citizens help non-governmental and non-profit organisations not only with their voluntary work, but
also with their financial support (mostly as 1 per cent of their yearly taxation). Hungarians in 1997 had
a possibility to offer their 1 per cent of tax to various kinds of non-governmental organisations for the
first time. From 2001 every tax-payer could decide to support churches, budget estimates or any kind
of non-governmental organisation. The amount of money offered to these organisations gets higher
each year. In 1997 sixteen organisations got 2 thousand million Forints, while last year 22 thousand
organisations got 6,2 thousand million Forints from citizens.
In Hungary, as in other European countries, before organising a strike consultation with the Police
about the exact time and place is needed. Between 1 January 1989 and 31 December 2001 344 direct
actions occurred, out of which 152 were strikes, 92 demonstrations, and others were signature
collections or petitions. Overall 1,5 million employees took part on stoppages, with only 8,4 hours per
striker. This leaves us only with 39 minutes per strikers per year.
5.5.2 Cultural enrichment
Cultural capital is an important factor in Hungary from the perspective of social differentiation.
Sociological research focusing on the social inequalities in the Hungarian society, in the 1980s found
that the cultural dimension could explain differences among people at most (Kolosi, 1984. 1988). In
fact, under the socialist era, cultural differentiation in Hungary was stronger than other kinds of
inequalities, e.g. financial or regional ones. Obviously a communist society has made efforts to
decrease social differentiation. In respect of cultural enrichment, the slogan sounded that the ‘cultural
monopoly’ of the former ruling classes should be broken and the cultural level of the working class
should be increased. This goal was in accordance with other political attempts, e.g. when communists
tried to confiscate the material basis of capitalism and to reduce the financial inequalities among social
groups. Sociological research revealed that this second goal for the eliminating financial differences
was much more successful. Money or material ownership could have been taken away easier by the
political regime than elements of cultural enrichment which embodied in life style and consumption
behavior. The research mentioned above showed that leisure time activities, housing conditions,
consumption patters were less determined by financial differences, which were low under socialism,
than by cultural differences, which survived any political efforts to reduce them.
After the collapse of socialism, sociologists expected a change for the domination of cultural
enrichment in Hungary. This assumption was based on the fact that material inequalities should get
stronger role in social differentiation, life style and consumption patterns under the conditions of the
emerging new capitalism. This second belief turned out to be true, social inequalities have emerged in
Hungary in the 1990 and it was strongly connected to the rising financial differences. However, the
5.5 Public space
European Network Indicators on Social Quality Hungarian National Report, February 2005
European Foundation on Social Quality 54
decline of importance of cultural enrichment was only relative to the financial inequalities. In absolute
sense, life style or consumption differences continued to be dependent on cultural enrichment. Recent
sociological research revealed that cultural enrichment is a strong predictor of belonging to the elite or
to the upper class in Hungary, while missing cultural capital can easily lead to social isolation and to
becoming excluded in Hungary. Middle class, however, can be characterized by a specific
contradiction, there is cultural middle class involving low-grade professionals and clerical workers and
there is a material middle class including small proprietors and self-employed.
5.6.1 Provision of services supporting physical and social independence
The European Union recognises and respects the right of persons with disabilities to benefit from
measures designed to ensure their independence, social and occupational integration and
participation in the life of the community.(See Charter of fundamental rights of the European Union
2000/c 364/01) The right to equal treatment and prohibition of negative discrimination are two of the
most important priorities of the Hungarian Government. With this design a special government body
was set up in May 2003, the so called Government Office for Equal Opportunities. In this section we
will pay more attention on provision services supporting disabled people’s participation in the
education system, labour market and public transport.
According to the “Family in transition” survey (HCSO, 2001), schooling of physically and/or mentally
disabled children is a big problem for families. Especially if the given settlement they live at does not
have a special school (or class within the school). In relation with the education of disabled pupils, the
greatest current challenge of education policy is to “guide back” and integrate mentally – primarily
slightly – disabled children in the regular education system. However, except for a supportive
legislation, in Hungary the physical, technical and personal preconditions are missing. School
buildings lack technology and education tools that would make schools usable for disabled persons. In
the academic year 2001-2002, less than one fifth of disabled children were educated in an integrated
way in regular schools and classes in primary education and only 5% in secondary education. To
create a more equitable education environment for those groups of pupils who need special education,
a series of education policy tools need reconsideration: the legal regulation of education, the way of
financing, the evaluation system, the system of schools as well as the cooperation with other service
systems.
In 2004 11 million Euros is available for supporting the training of adults and disabled adults with low
education level. This amount of money provides further training possibilities to at least 31 thousand
people. In the framework of the HRDOP measure ‘Improving the employability of Disadvantaged
people, including the Roma’, support services, which – adjusted to the needs and possibilities of
disabled people provide assistance in finding a job, integration at the workplace, and furthermore in
meeting the special infrastructural conditions necessary for training and employing disabled people.
5.6 Personal relationships
European Network Indicators on Social Quality Hungarian National Report, February 2005
European Foundation on Social Quality 55
To facilitate the usage of public transport by disabled people the Budapest Transport Limited makes
serious efforts to ensure equal access to mass transportation for the disabled. In addition to IK 412
buses running on several routes in the capital, from 17 September 2001 the company's door-to-door
service, that is, buses in taxi-like service, also helps travelling from one point of the city to the other.
5.6.2 Support for social interaction
There is considerable evidence that housing conditions do affect health status. Nevertheless, recent
researches define the notion of “healthy housing” as something that covers the provision of functional
and adequate physical, social and mental conditions for health, safety, hygiene, comforts and privacy.
From this point of view an adequate shelter has to support the required milieu of social interactions.
According to the recent Time Use Survey, socialising and spear time activities with other family
members takes part mainly in the living room; however, in villages these activities mostly happen in
the kitchen. It is possible to examine the conditions that facilitate socialising among family members
and guests by the extent of seating-capacity of the dwelling. In kitchen 5, in the rooms 6 persons could
take a seat in average. While in villages kitchens are more proper to have more people, in cities rooms
are the most appropriate areas for this purpose. All in all, during the last 15 years – due to the
increasing dwelling size and changes in the cultural tastes, etc. – Hungarian dwellings have became
more appropriate places for social interactions than they used to be in the communist time.
European Network Indicators on Social Quality Hungarian National Report, February 2005
European Foundation on Social Quality 56

European Network Indicators on Social Quality Hungarian National Report, February 2005
European Foundation on Social Quality 57
Hungary joined the EU open coordination process in 2002 in the area of combating against social
exclusion. The first step of the process was the drafting of the "Joint Inclusion Memorandum" (JIM),
which was signed by the Hungarian Government and the EU Commission in December 2003. The JIM
contains the main risk factors and challenges in the area of poverty and social exclusion in Hungary
such as the main policy measures and tools that are available. After the signature of the JIM Hungary
has begun the preparation of its first National Action Plan on social inclusion (NAP/incl) by the Ministry
of Health, Social and Family Affairs as main co-ordinator. The NAP provides a strategic approach of
the fight against social exclusion and contain those policy measures Hungary is intending to elaborate
between 2004-2006 in this area.
Support to the development of access to work
The most important institution of the implementation of the Hungarian employment policy is the Public
Employment Service (PES). It consists of the Employment Bureau, the Labour Centres in Budapest
and in the 19 counties and 174 local branch offices, as well as the 9 Regional Labour Development
and Training Centres. A Labour Market Fund, made up on contributions by employers and employees,
provides the finances for active labour market measures and PES operations. The modernisation of
PES is going to take place between 2004-2006 financed by the Human Resource Development
Operational Programme (HRD OP) of the European Social Fund (ESF). The measure promotes more
targeted services aiming to facilitating employability and more efficient services for people seeking a
job. (NAP/incl)
The most important objectives of the Hungarian employment policies are to increase the employment
rate and to integrate the unemployed and inactive into labour market by active labour market
programmes. The main targets of these programs
1) to promote the (re)integration of disadvantaged social groups to the labour market, such as
disabled people and roma population or long-term unemployed persons
2) to support markatable trainings, adult education programmes and lifelong learning
3) to support the employment of women and finding ways to reconciliation of work and family.
Promote the integration and reintegration of disadvanteged social groups to the labour market
In recent years the government has made considerable efforts to create new jobs and to support small
and medium size enterprises to increase employment. The Operative Programme for Economic
Competitiveness of the National Development Plan is supporting industry and the service sector as
areas of priority for investment promotion, for they are significant contributors to job creation.
Public employment programmes are designed for the employment of the most marginal groups of
society with the aim to assist unemployed individuals to return to the labour market. Within the
confines of public employment programmes participants are involved in different tasks of the
6 Social Quality Initiatives

European Network Indicators on Social Quality Hungarian National Report, February 2005
European Foundation on Social Quality 58
maintenance of communal institutions, implementation of small district ar regional objectives. When
offering these jobs, priority is given to people who have been unemployed on long term, primarily to
Roma.. Each year the Ministry of Employment and Labour accepts bids for public work projects that
offer temporary work to people in disadvantaged position, and this includes the 2004-2006 period as
well.
The EQUAL programme also supports lifelong learning and sets priorities for evolving inclusive
workplace practice starting in 2004. The programmes will focus particularly on Roma, people with low
educational levels, elderly working people, and people with disabilities, and involves training in order
to improve their employability. To this aim the programmes include developing basic skills and
expanding knowledge through the use of new technologies and procedures, and information and
communication technologies. (NAP/incl)
The labour market participation of people with disability is very low: according to the HCSO, in 2002
among the population with long-term health problems, of the 656 thousand working age people fewer
than 95 thousand were present on the labour market and among them less than 1/5 were employed in
special jobs. The majority of the disabled people subsist on disability pension or allowance. Therefore,
it is an important task to more in order to ensure equal opportunities for people with disabilities on the
labour market. In addition, in the framework of the HRDOP ‘Improving the employability of
disadvantaged people, including the Roma’ has launched a programme supports services, which
adjusted the needs and possibilities of disabled people provide assistance to find a job, integration at
the workplace and furthermore in meeting the special infrastructural conditions necessary for training
and employing disabled people. Approximately 40 million Euros will be available in the period of 2004-
2006, but only one part of this earmarked to supporting disabled people. (NAP/incl)
The Public Employmnet Service gives priority to providing labour market services to disabled people.
Furthermore, there are rehabilitation group teams working in each Labour Centres to help disabled
people find jobs. At present there are Rehabilitation Information Centres (RIC) in operation at 16
Labour Centres offering comprehensive services and in 2004 a further 4 RICs will be established.
(NAP/incl)
The government therefore offers various incentives (tax concessions, supports in job creation) to
employ disabled people. In the case of enterprises employing more than twenty people – including the
budget financed and non-profit organizationas – the law prescribes a quota that at least five per cent
of statistical staff should be persons with disability. If this quota is not realized the organisation has to
pay contribution for Labour Market Fund to be used for rehabilitation purposes. Organizations with
less than twenty employees may receive tax benefit if they employ people with disabilities. If
enterprises employ disabled people in ratio above the quota, they can make use of wages subsidies.
(Equal opportunities - Hungary at Employment Week 2004)

European Network Indicators on Social Quality Hungarian National Report, February 2005
European Foundation on Social Quality 59
According to estimates, the Roma population numbers between 450 000 and 600 000 people. The
Roma population constitutes the most vulnerable group in terms of social exclusion. Their labour
market situation is considerable worst than that of the majority of society. The primary labour market
offers hardly pay-earning occupation for the uneducated and unskilled Roma, and they are also
disadvantaged when they want to take up ad-hoc work. In 2004 the Government Program on
Promoting the Social Inclusion of the Roma Population was launched. The programme sets out the
implementation of comprehensive action to combat the social exclusion of Roma population by the co-
operation of the Roma and non-Roma population. In 2004 the Ministry earmarks 5,8 miilion Euros for
this purpose. It is worth to mention the Public Works Programme which ensure temporary employment
for unemployed and disadvantaged people. In 2004 12-13 thousand people was employed by the
public works programme. Another institution which plays an important role according to the
reintegration of Roma population into the labour market is the mains of labour centres. In their annual
work plan, they draw up special work plan in order to facilitate Roma integration. In 2002 17
programmes were launched for supporting unemployed Roma people. In 2004 the PHARE
programme of ‘Combating Exclusion from the World of Labour’ facilitate the (re)integration of Roma
people to the labour market as well. The total budget of the programme is 28,8 million Euros in 2004.
(Equal opportunities - Hungary at Employment Week 2004)
Support markatable trainings, adult education programmes and lifelong learning
The Government attributes prime importance to the popularization and extension of adult training.
Thanks to these priorities in 2002-2003 tenders were invited for the propagation of Prior Learning
Assessment (PLA), such as the elaboration of e-learning programmes and the development of adult
training career guidance system. For the propagation of lifelong learning a multi-channel source-
system was elaborated: (1) the state budget with (2) employment part of Labour Market Fund and (3)
obligatory financial contribution of economic organizations to professional trainings. The Law on Adult
Training has created the possibility of normative support, a Government decree regulates the
conditions of participation and the annual budget law defines the support fund. The budget allocated
for this purpose EUR 1.8 million in 2003 and EUR 11.2 million in 2004. The former sum assisted the
training of 5 300 people, while the latter will serve 30 000. Participants in accredited trainings can
written off about 30 per cent of the training costs from their personal tax, which is also an indirect
budget contribution to training. (Lifelong learning in Hungary - Hungary at Employment Week 2004)
It is worth to mention the development of e-learning programmes to increase the accessibility of
learning possibilities at home with the help of modern means of informatics. E-learning provides new
possibilities of refreshment and self-trainings in the narrow sense of word of professional training. In
2003 the development facilitated the elaboration of 25 professional training programmes and modules,
which also serve model formation. (E.g., Carpenter, Energy specialist, Electronic mechanic, Tourist
manager, Managing secretary, Financial and public accountant,… etc) (Lifelong learning in Hungary -
Hungary at Employment Week 2004)

European Network Indicators on Social Quality Hungarian National Report, February 2005
European Foundation on Social Quality 60
In 2004 11 million Euros is available for supporting trainings of adults and adults with disabilities with
low education level. This amount of money assists the training for 30 thousand people.
Support the employment of women and finding ways to reconciliation of work and family
The third social group which is threatened by labour market exclusion is women. In Hungary, one-third
of the households have under-age children, and 40 per cent have dependent individuals requiring day
care or having long-terms illness. These familiy obligations are mainly undertaken by women. To
facilitate the reconciliation of work and family life involves family supports, accessible and acceptable
quality childcare, adequate care services for adult dependents, and forms of work organisation and
employment that are better adjusted to family responsibilities, primarily the expansion of part-time
work.
From 2002 a PHARE programme has begun in called “Creating Equal Opportunity on the Labour
Market” is intended to assist women over 40 who are inactive but want to return to the labour market
after caring for children or other family members. The programme support projects including pilot
projects and organisations offering services to job-seekers and business-starters. (NAP/incl)
In addition to supporting employers, women need services and training. Several programmes are
being started up in 2004 to improve the employability of women facing disadvantages in the labour
market for various reasons. Within the framework of the Human Resource Development Operational
Programme (HRD OP) measure called Promoting the participation of women in the labour market,
significant resources will be made available in 2004-2006 to support alternative employment services
and the start-up of business enterprises that will (re)integrate women into the labour market.
(NAP/incl)
The Family Friendly Workplace award is being issued in 2004 for the fifth time. It involves presenting
practice regarding work time, extension training maintaining contacts with parents on temporary leave,
and the operation of their childcare facilities. Winners are entitled to use the emblem “Family-Friendly
Workplace” for the next year. (NAP/incl)
The institutional background plays an especially important role of the process of reintegration to the
labour market. The extent of day-care institutions and the access of institutional care system are the
conditional factors of the labour market reintegration of women. Beside the expansion of child care
system it necessary to develop the care provision on a family and community basis, and to expand
services that care for and nurse the elderly as well.
Improving day-care facilities for children will be a priority for 2004-2006. As of January 1, 2005, every
settlement with over 10,000 population will be mandated to operate a crèche. In smaller settlements a
“family day-care facility” can be an alternative to the crèche. Since 2003, this form of day-care has
received state capitation grant. The goal is to increase day-care facilities for children under the age of
3 by 10% by 2007. In order to guarantee the sustainability of the créche, from 2005 the state
European Network Indicators on Social Quality Hungarian National Report, February 2005
European Foundation on Social Quality 61
capitation grant will be increased by 25%, and in settlements with less than10,000 inhabitants the
state capitation grant for family day-care service will be increased by 50%. (NAP/incl)
Investment in people and acquiring information skills
Just like in many countries Hungary has met as well with the challenges of digital age. The appropriate
knowledge and skills re essential requirements for everyone who, wants to be prepared for the
challenges of the digital age. The younger generations in Hungary are ahead of other age groups in
learning information technology. In 1996 the Hungarian Government has launched the Sulinet
(SchoolNet) programme, which has started to develop the infrastructure background for primary and
secondary school students to acquire the essential knowledge of Internet and computer management.
At the beginning of 2003 85 per cent of the educational institutions had some kind of internet
connection. The Ministry of Education, Ministry of Employment and Labour and the Ministry of
Informatics and Communications has introduces and launched the Sulinet Express programme in
January 2003. One aspect of the programme is to support the computer purchase of teachers and
families with children. Teachers, pupils, students and their parents who take part in accredited adult
training can have a HUF 60 000 tax deduction towards their computer purchase, hire or lease a
computer, a computer assembly or hardware from a company taking part in the programme. Sulinet
products are available at 1 800 places in the country, and by mid December 2003 the turnover of
Sulinet Express has reached HUF 10 billion. Within the frames of the Közháló (PublicNet) programme,
from 2003 the 5000 terminal points of the Sulinet Programme are to be developed further. A new
project was launched in 2003, which is supposed to introduce computers in kindergardens. (The
Hungarian Information Society on the Eve of the Accession to the European Union: snapshot and
strategic objectives)
Assisting disabled people to lead an independent life
The Act on Rights and Equal Opportunities of Disabled People adopted in 1999 identified the rights
and defined the instruments to enforce them. It regulates the rehabilitation of disabled persons
(environment, communication, transport, support service and instrumental aid) and gives equal
opportunities to them. The National Programme for Persons with Disabilities was introduced intended
to implement the new legislation. (JIM) The program is being implemented between 2000 and 2010. It
defines the most important development trends in the areas of physical and informational accessibility,
as well as access to transportation, healthcare, education, employment, sports, culture, recreation and
social care. The goal is to establish the preconditions for equal opportunities, social integration and
independent life.
Within the framework of National Equal Opportunity Programme one of the most important tasks is to
make public buildings accessible to disabled persons. As part of a programme being implemented with
PHARE support, 150 schools and sport centers will be made accessible to disabled persons by 2005.
A model programme was started in Baranya and Jásznagykun-Szolnok counties in 2004. The aim of
these programmes is to enable disabled access to public outdoor spaces through public work
schemes. In coming years this programme will be extended to other counties as well.

European Network Indicators on Social Quality Hungarian National Report, February 2005
European Foundation on Social Quality 62
In 2002 such a sin the previous year, 200 million HUF and budgetary support was made available in
order to provide equal opportunities for disabled people in the field of transport and to support
programmes of public transport companies. The Ministry of Economy and Transport suggested further
developing the programme and providing support for local authorities as well. (JIM)
To assure access to information for people with hearing impairment, regional sign-language
interpreting services have been established. They are in close contact with the welfare, healthcare,
educational and employment institutions and provide translation, interpreting and note-taking
assistance. In coming years it is need to develope this service as well. (NAP/incl)
Support the integrated education
The issue of integrated education system emerges mainly in connection with the roma and the
disabled pupils. According to the National Action Plan in 2004 in Hungary, the proportion of children
with special educational needs (learning disabilities) is 5.3% while in the European Union is only 2.5-
3%. The other significant problem is the overrepresentation of Roma children. Nearly 20% of Roma
students are qualified as having special educational needs, while the rate for non-Roma students is
only 2%. It often happens that children are redirected to special-needs schools simply because their
social circumstances are poor and as a result they are not yet mature enough for school. To reduce
the number of children unnecessary labelled as disabled the Act on Public Education established a
new term ’children with special educational needs’ from January 2003. Between 2004-2006 the
measure called ‘Ensuring equal opportunities for disadvantaged pupils in education’ will finance
programmes to promote educational integration and the provision of other local services for children in
special educational needs with the help of special regional methodological education centres.
Homeless people
Hungary has had to look for answers to the problem of homelessness again since 1989-1990.
Services to homeless people have been regulated by law since 1993. There are only estimates
regarding the nuimber of homeless people in Hungary but it is believed they are between 35 000 and
40 000. Homeless shelters provide approximately 6 200 beds at the end of 2002. These capacities
can cover only a proportion of needs and there are also too few programmes in prevention and re-
integration. In the years to come, it is need to expand the governmental and non-governmental
initiatives to caring for the homeless and reducing the number of people living on the streets.
(NAP/incl)
The street social work has to be advanced which involves the evolving and advancing the operation
conditions for street social work both in the countryside and in Budapest and to maintain regional
dispatcher centres. The supported re-integration programmes for homeless persons will be focused
primarily on job finding and on creating opportunities for independent living. One pillar of independent
living is maintaining a home and to do this, the programme to increase accommodations outside of
institutions will continue. (NAP/incl)

European Network Indicators on Social Quality Hungarian National Report, February 2005
European Foundation on Social Quality 63
A legislative amendment in 2004 has targeted the establishment of six regional and four Budapest
health centres which are to provide emergency care, monitoring, and nursing to back up street social
work.
Promoting to reduce the regional inequalities
The economic, employment, infrastructural, social and health inequalities between the various regions
of Hungary are significant. The eastern and south-western parts of the country there are few job
opportunity and beside the high unemployment rate, there is a high rate of economically inactive
persons such as persons working in the grey economy. These parts of the country contain many tiny
settlements with large numbers of Roma population. As a result, inequalities in living conditions are
significant as well. (NAP/incl)
Between 2004 and 2006 a significant amount of Structural Fund resources will be devoted to regional
development coordinated by the Operational Programme for Regional Development. Some 75% of the
these resources will be used in the four most disadvantageous regions in Hungary (Northern Great
Plain, Northern Hungary, Southern Great Plain, and Southern Transdanubia). A measure called
“Developing the accessibility of the regions and micro-regions lagging behind” calls for developing
roads and public transport to increase the mobility of labour and access to public services. The target
groups of the employment component are people who are disadvantaged in accessing the labour
market and are economically inactive or long-term unemployed. This programme will include 10,000-
14,000 people a year. (NAP/incl)
As of 2004, regional development model programmes coordinated by the Government Office of Equal
Opportunity will get underway. A complex development starts in a region called Cserehát, a region
where there is a serious exclusion. There is a high concentration of people with multiple
disadvantages and urban and rural areas are becoming ghettos. The goals of the programme are
cooperation along the border region, advancing the transportation system, increasing opportunities for
employment and income, advancing the human resources of the region, assuring education
opportunities for the youngest generation, promoting improved access to healthcare services and
participation in information society. (NAP/incl)
Supporting NGOs
The number of NGOs’ has developed since the political system changed in 1989/1999 and at present
there are about 60,000 NGOs in Hungary. The Central Statistics Office reports that 47,000 of them are
actually operative.
While the state contribution is 40%-60% in the European Union countries, they are under 30% in
Hungary. This is why separate funding such as the National Civil Fund Programme is important, since
it provides effective means of assisting civil society in its operations. The basic principle of the National
Civil Programme is to provide matching funds from the central budget. The goal of the Programme is
to support the operation of NGOs that can take over tasks currently conducted by the state and to

European Network Indicators on Social Quality Hungarian National Report, February 2005
European Foundation on Social Quality 64
ensure equal opportunities for NGOs operating in disadvantaged regions. Since 1996 it has been
possible for taxpayers to earmark 1% of their personal income tax to be given to the NGO of their
choice. In 2003, 34% of taxpayers took advantage of this opportunity and directed their 1%-s to nearly
22,000 NGOs. (NAP/incl)
European Network Indicators on Social Quality Hungarian National Report, February 2005
European Foundation on Social Quality 65
In this report we tried to outline the most important elements of social quality in the component of
socio-economic security, social inclusion, social cohesion as well as social empowerment in Hungary.
The collapse of communism in 1989-90 has forced Hungary as well as other CEE countries to
reconstruct completely their political, economic and cultural identity. The overlapping phases of these
changes have resulted in debate about the process which has become known as „the transition” and
Europeanization or globalization. (Manning, 2004)
While we were elaborating this report we realised that the permanently „moving targets” after the
collapse of communism enforce a persistent adaptation on individuals. Moreover, from the social
quality perspective we would like to continue and use the notion of revaluation as well. In the process
of revaluation individuals do more than only adapt themselves to the changing circumstances. The
notion of revaluation includes one of the elements of the subject matters of the social quality
approach, which is the reciprocal relationships between processes of self-realisation of individuals as
social beings. In the process of revaluation individuals try to adjust to changing structural conditions on
the one hand, and on the other hand, the process of self-realisation happens among new structural
conditions where everybody has a “new” place. From this dynamic approach, we would like to point at
some structural differences of transitional countries compared with western countries and describe the
Hungarian social quality from 1990 at the same time.
First of all, it is important to make the relationship clear between poverty and the individuals’ life-cycle.
While in western countries children and elderly have significantly higher risk of living in poor material
circumstances compared to middle aged individuals, in transitional countries the pattern is different,
because the poverty risk for the elderly is lower than that for the average (Klugman et al., 2002). In
Hungary, although the income situation of the elderly also deteriorated in the nineties, it did so to a
less degree than among active people. It means that in transitional countries for many people work
does not help to pull them out of poverty because work is badly paid, or there are not enough
members of the household in paid employment, or both. While in EU-15 one earner in the household
is sufficient to reduce the poverty risk to bellow average, this is not the case in post-socialist countries.
The most important reason for it is that these societies are characterized by widespread low pay. In
addition, there was a sharp increase in earning differences among those who do have paid
employment in the last decade. The Gini-coefficients for earnings are larger than that of household
income even in countries where overall income inequalities have risen modestly (UNICEF, 2001). It is
straightforward that maximizing the active members of the households has become an important
strategy among Hungarian families. That is why Hungarian households have become “two-earner
households” where the labour market participation of mothers is essential to prevent impoverishment.
It is obvious that the number of small children affects women’s employment opportunities. In Hungary,
although different welfare measures have survived the socialist times, females with small children in
7 Conclusion
European Network Indicators on Social Quality Hungarian National Report, February 2005
European Foundation on Social Quality 66
particular after maternity leave have higher risks to become inactive. Even if they have managed to
keep their jobs, the probability of (temporal) status loss is quite high (Bukodi and Róbert, 2004). For
women balancing between work and family responsibilities one of the most obvious solutions is to take
a part-time job. However, part-time work may mean different things to different people. For some
people it means an advantageous work schedule which gives opportunities to reconciliate the work
and family duties besides the supplement of family income and which helps to maintain ties to the
labour market. But, for others – who are unable to get full-time work – it is a “forced” employment
status. What is more, the phenomenon of part-time employment is different in each person’s case but
it has different meaning among European countries as well. In post-socialist countries only a small
part of women worked in part-time jobs in the nineties. There may be several reasons for that.
However, by now it is well demonstrated that mother’s would like to have more opportunities for part
time employment, but the public sector has no policy to satisfy this demand. Moreover, the private
sector avoids creating part-time jobs because it increases it’s transaction costs. Private employers
may feel that part-time jobs are too expensive for them, because of equal security being given to these
kinds of jobs as to full time jobs, but without the same amount of time being invested by part-time
employees. Explaining the low share of part time work in Hungary, it is not a negligible factor that, –
due to the relatively low wage level – two “full-time” earnings are needed for most of the families to
ensure appropriate living conditions.
To help mothers reintegration to the labour market structural conditions play important roles. With
municipal kindergarten enrollment, it has slightly increased in recent years. This institution can make it
easier for women to take a job after maternity leave. The question is whether it is “enough help” for
females aiming at returning to paid employment after child-birth. Besides the hours of child-care
institutions and other services that better fit working schedules, the other factors that help parents to
combine the work and family are school buses and school meals, and the better transportation to get
to school.
Another essential factor to conciliate work and family besides the special institutional background is
the extensive family network. The majority of asked employed women claimed that it was the
grandparents’ help that had made it possible for them to reintegrate to the labour market. Although,
different generations are less likely to live together in Hungary than they used to, help from the family,
primarily from grandparents, remains important for households with children to conciliate work and
family.
For the (re)integration into the labour market it is essential to have the adequate skills and knowledge.
Besides formal training, the other aspect of investment in human capital is the life-long learning. In
Hungary much smaller number of people participate in the different forms of training after completing
initial education compared to Western European countries. (OECD, 1999). Partly, it is a consequence
of the nature of the Hungarian educational system, where vocational training is embedded in the initial
curricula. On the other hand, the lack of further investment in training and knowledge may lead to
European Network Indicators on Social Quality Hungarian National Report, February 2005
European Foundation on Social Quality 67
higher unemployment risk and to lower chance of reintegration to the labour market as well as to lower
chance of getting a high-rewarding job.
Apart from educational level, health status plays an other fundamental role in labour market
(re)integration. It is straightforward that the poor health status may lead to extreme difficulties in
finding a job, which results in huge deterioration in socio-economic position. In 2004 several policy
programmes have been launched to support the training of adults and disabled adults with low
education level. The aims of these projects are to support services, which are adjusted to the needs
and possibilities of disabled people, to provide assistance in finding a job in the integration at the
workplace, and furthermore in meeting the special infrastructural conditions necessary for training and
employing disabled people.
According to the report it is well established to speak about the “losers” and the „winners” of the last
decade’s transition in Hungary. „Losers” were the poor-educated households with low financial status
where the head of the household was either unemployed or non-retired inactive. The greatest
“winners” were young people with tertiary education, whose financial status improved substantially in
the 1990s. On the whole, skill level and employment possibilities seem to be the most important
factors of social standing in Hungary. Numerous studies emphasize the end of the process of „social
paternoster”, which pictures the redefining process of individuals among the new conditions after the
transition. By now it is well-demonstrated that there exists a group of poor people who experience
multiple deprivations. Due to their very low skill level, they are unable to (re)integrate into the labour
market, thus their participation in the mainstream society means great challenges. At the same time,
the failure to reintegrate them raises the threaten of dual society in which some are trapped in long-
term socio-economic insecurity and unable to share the benefits of economic and social development
(Ferge et al., 2003). To prevent and handle the deprivational spiral it is needed to develop an
adequate social policy programme. The dilemma of the development path in social matters merits
more attention, because the unrestrained market may cause not only a dual society within countries
but also intensify the welfare gap between the old and the new member states in the European Union.
The process of self-revaluation of individuals happens under the changed conditions. According to the
Theoretical State of Affairs carried out by EFSQ (21 June 2002) the methodological triangle of the
social quality approach is composed of constitutional factors, objective conditional factors and
subjective conditional factors that is profiles. The form of profiles is made up of the role of life scripts,
the biographical story of the acting individual subject. In Hungary and in the other transitional countries
the persistent self-revaluation is an energy-consuming process, where individuals tend to define the
assignment of resources as a „zero-sum” game. The issues of the social cohesion chapter underpin
this theory by a lot of examples, such as the issue of the inclusion of immigrants. According to various
researches people in Hungary with higher schooling and better income tend to be much more open
regarding the inclusion of immigrants and whereas Hungarians with less schooling and low income are
against the inclusion of them.

European Network Indicators on Social Quality Hungarian National Report, February 2005
European Foundation on Social Quality 68
Another characteristic of transitional countries including Hungary is the dissimilar nature of integrative
norms and values. From this point of view, indicators aiming at capturing individuals’ opinion on the
possible causes of poverty or socio-economic insecurity may have a particular importance. The
European Values Survey revealed a mixed picture in Hungary. To summarize, in post-socialist
countries the most frequently cited reasons for socio-economic insecurity were external and structural
ones, rather than internal and personal causes. The over-emphasise of these kinds of causes in
Hungary may prognosticate that people expect resolution from government and social policy actions in
reference to winding-up poverty. However in the 90’s the number of various mutual benefit societies
and NGO’s are increased, the state remained the most important doer in the reference to winding-up
poverty. In addition, the growing interest in politics towards poverty and social inclusion tends to verify
these expectations.
The nature of personal social networks is very different from the Western European pattern. In the
Communist systems of Central and Eastern Europe, informal economy was built on personal
relationships. People have maintained strong private and unofficial contacts among each other with
those who can help them to resolve daily problems, because people in the region know whom they
trust, and they trust those whom they know (Delhey and Newton 2003). In Hungary after the system
transition – similar to communist time – the personal social networks are less extensive but the bands
are stronger compared with the Western European countries.
In the Initiatives chapter, the „cognitive Europeanization” does not mean direct impacts but rather
indirect changes in the way social issues are handled and discussed (Lendvai, 2004). Through
enlargement the EU exported social-policy ideas and attitudes to Hungary in a number of initiatives.
The Join Inclusion Memorandum or the different action plans are important tasks also in Hungary as
well where the new approaches show where there has been no serious government poverty strategy.
It is important to realise that the European impact on the social matter has increased over in recent
years, and its main results are the growing political interest in poverty and social inclusion, and the
widening practice of civil society and social dialogue (Ferge and Juhász, 2004) Through enlargement
the EU, the non-governmental organizations and the various mutual benefit societies may play an
even more important role in the development of Hungarian social quality.

European Network Indicators on Social Quality Hungarian National Report, February 2005
European Foundation on Social Quality 69
Action Plan on employment policy 2004.
Allmendinger J. – Leibfried S. (2003). Education and the welfare state: the four wolds of competence
production. Journal of European Social Policy, 13: 63-81.
Albert F. – Dávid B. (1999). About friends. In: Kolosi, T. – I.Gy. Tóth – Gy. Vukovich (eds.): Social
Report. TÁRKI, Budapest.
Altorjai Sz. – Giczy J. – Sik E. (2004). Az élet üteme. (The rhythm of time.) HCSO, Budapest.
Az iskolarendszeren kívüli szakképzés statisztikai adatai 1996-2000 (Statistics about vocational
training 1996-2000), Budapest 2002
http://www.fmm.gov.hu/upload/doc/200210/stat_1996_2000_1_65.pdf
A gazdasági szervezetek saját munkavállalói számára biztosított képzések 1999 (, Budapest 2003
http://www.fmm.gov.hu/upload/doc/200312/kiskiadv.pdf
Beck U. (1992). Risk society. Towards a new modernity. London: Sage.
Bernát A. (2002). Elemzések a gazdasági és társadalompolitikai döntések előkészítéséhez 34.
(http://www.tarki.hu/adatbank-h/kutjel/pdf/a082.pdf)
Breen R. (1997). Risk recommodification and stratification. Sociology 31: 473-489.
Brown D. (2001): Household economic behaviour in post-socialist rural Hungary. Rural Sociology, 66:
157-180.
Bukodi E. (1999). Educational choices in Hungary. Hungarian Statistical Review 77: 71-94
Bukodi E. – Róbert P. (2002). Men’s career mobility in Hungary in 1990s. GLOBALIFE Working Paper
No. XX. http://alia.soziologie.uni-bielefeld.de/~globalife/workingp.html
Bukodi E. – Róbert P. (2004). Women’s career mobility in Hungary in 1990s. GLOBALIFE Working
Papers.
Bukodi E. – Róbert P. 2002. Men’s Career Mobility in Hungary during the 1990s. Bamberg:
GLOBALIFE – Life Courses in the Globalization Process. Working Paper (38).
References

European Network Indicators on Social Quality Hungarian National Report, February 2005
European Foundation on Social Quality 70
Bukodi E. – Róbert P. (2003). Social Quality and the Policy Domain of Emplyment in Hungary,
European Journal of Social Quality, Vol 4.
CEDEW [Committee on the Elimination of Discrimination against Women](2000). Consideration of
reports submitted by states parties under article 18 of the convention on the elimination of all forms of
discrimination against women. Hungary. UN.
Commander S. – Köllő J. – C. Ugaz – Vilagi B. (1995). Hungary. In: Commander, S. and Coricelli, F.
(eds.) Unemployment, Restructuring, and the Labour Market in Eastern Europe and Russia.
Washington: Economic Development Institute, The World Bank.
Commander S. – Tolstopiatenko A. (1997). A Model of the Informal Economy in Transition Economies.
The William Davidson Institute: Ann Arbor, Michigan. working paper, 122. 59.
Dávid B. – Snijders T. A. (2002). Estimating the size of the homeless population in Budapest,
Hungary. Quality and Quantity, 36: 291-303.
Delhey J. – Newton K. (2003). Who trusts? The origin of social trust in seven societies. European
Societies 5:93-137.
DiMaggio P. – Hargittai E. (2001). From the "digital divide" to "digital inequality": studying internet use
as penetration increases. Working Paper #15, Summer 2001, Center for Arts and Cultural Policy
Studies, Princeton University.
Erdősi S. – Somogyi E.– Tosics I. (2003). Report on Homelessness in Hungary, 2003 for FEANTSA’s
European Observatory on Homelessness.
Eurobarometer EB60 – CC-EB 2003. 4 – (Candidate Countries) Comparative highlights
European Commission (2000).Charter of fundamental rights of the European Union 2000/c 364/01
http://europa.eu.int/eur-lex/pri/en/oj/dat/2000/c_364/c_36420001218en00010022.pdf
European Commission (2004). The Community Framework Strategy on Gender Equality (2001-2005)
http://europa.eu.int.
Equal opportunities for all – background paper for Employment Week 2004.
European Foundation for the Improvement of Working and Living Conditions [EFIWLC] (2004). Health
and care in an enlarged Europe. Dublin.

European Network Indicators on Social Quality Hungarian National Report, February 2005
European Foundation on Social Quality 71
EUROSTAT. (2003). Time use at different stages of life, results from 13 European countries.
Luxembourg: Office for Official Publications of the European Communities, 2003.
EUROSTAT (2004). How Europeans spend their time everyday life of women and men – Luxembourg.
Equal opportunities - Hungary at Employment Week 2004.
Fábián Z. – Kolosi T. – Róbert P. (2000). Fogyasztás és életstílus. (Consumption and Lifestyle) In:
Tamás Kolosi, István György Tóth and György Vukovich Gy. (eds.): Társadalmi Riport 2000. (Social
Report 2000) Budapest: TÁRKI. pp. 225-259.
Ferge Zs. – Darvas Á. – Tausz K. (2003). Combationg poverty and social exclusion. ILO.
Ferge Zs and Juhász G (2004). Accession and social policy: the case of Hungary. Journal of
European Social Policy Vol 14.
Förster M.F. – Tóth I.Gy. (2001). Child poverty and family transfers in the Czech Republic, Hungary
and Poland. Journal of European Social Policy, 11:324-341.
Galasi P. – Nagy Gy. (1999). Outflows from Insured Unemployment in Hungary, 1992-1996. Budapest
Working Papers on the Labor Market, BWP 3. Budapest: Institute of Economics, HAS and Department
of Human Resources, University of Economics.
Gaál P. – Rekassy B. – Healy J. (1999). Health Care Systems in Transition: Hungary. Copenhagen:
European Observatory on Healthcare Systems.
Gaál P. (2002). Study of the Hungarian Health Care System. Civitas, Budapest.
Gálik M. (2004). Hungary. In: Media Ownership and Its Impact on Media Independence and Pluralism
Gál R. – Tarcali G. (2003). Pension reform and intergenerational redistribution in Hungary.
Paper on the PIE International Workshop on “Pension Reform in Transition Economies”
IER, Hitotsubashi University February 22, 2003.
Győri P. (1990). Gyorsjelentés a hajléktalanságról, Magyarországon, 1990, In: Andorka. – Kolosi T. –
Vukovich Gy. (eds.): Társadalmi Riport, 1990, Budapest, TÁRKI, 430-446.
Hargittai E. (2002) 'Second-level digital divide.' First Monday. 7(4)
[http://www.firstmonday.org/issues/issue7_4/hargittai/] Last accessed: February 2004
HCSO. (2002). Statistical Pocket Book on Women and Men. Budapest.
European Network Indicators on Social Quality Hungarian National Report, February 2005
European Foundation on Social Quality 72
HCSO. (2002): Dwelling culture, time spend in shelter. Budapest.
HCSO. (2001): Cultural conditions in the nineties. Budapest.
HCSO. (2001): Family in transition. Budapest.
Hegedus J. – Tosics I. (1996). Disintegration of East-European Housing Model. in Clapham D. –
Hegedus J. – Kintrea K. – Tosics I. eds, with Helen Kay Housing Privatisation in Eastern Europe
Greenwood Press, 1996.
Hewitt. (2003). Central and Eastern Europe: Employee Representation in the Workplace – Special
edition of International Report.
ILO. 2003-2004 Key Indicators of the Labour Market (Geneva, 2003)
http://www.ilo.org/kilm.
Iványi G. (1998): Hajléktalanok (Homelesses) Sik Kiadó, Budapest.
Join Inclusion Memorandum 2002.
Kertesi G. – Köllő J. (1996). A bér alakulását meghatározó tényezők (Factors determining wage
trends). in: Halpern, L. (ed.): Bérköltség és versenyképesség (Wage costs and competitiveness). MTA
Közgazdaságtudományi Intézet.
Kertesi G. – Köllő J. (2000). Wage inequality in East-Central Europe. Budapest Working Paper on the
Labour Market No. 7. Institute of Economics, Budapest.
Kertesi G. – Köllő J. (2002). Economic transformation and the revaluation of human capital – Hungary,
1986-1999. In: De Grip A. – van Loo J. – Mayhew K. (eds.): The economics of skills obsolescence:
Theoretical innovations and empirical application. Research in Labor Economics, 21: 235-73.
Kiss B. (2004). 'The Media in Hungary.' in M. Kelly G. Matzzoleni D.McQuail (eds.) The Media in
Europe - The Euromedia Handbook. 3rd Edition, Sage.
Klugman J. – Micklewright J. – Redmond G. (2002). Poverty in the transition: Social expenditures and
the working-age poor. Innocenti Working Papers No. 91. United Nations Children’s Fund. Innocenti
Research Centre, Florence.
European Network Indicators on Social Quality Hungarian National Report, February 2005
European Foundation on Social Quality 73
Kolosi T. (1984). Status and Stratification. In: Rudolf Andorka and Tamás Kolosi (eds.) Stratification
and Inequality. Hungarian Sociological Studies I. Budapest: Institute of Social Sciences
Kolosi T. (1988). Stratification and Social Structure in Hungary. Annual Review of Sociology. 14:405-
419.
Köllő J. (2002). Gender earnings differences. in: Fazekas K. – Koltay J. (eds): The Hungarian labour
market. Review and analysis. Institute of Economics, HAS Hungarian Employment Foundation:
Budapest.
Lackó M. (2000). Hidden Economy - An Unknown Quantity? Economics of TRansition, 8:1, pp. 117-
49.
Laky T. (2000). Labour Market in Hungary − 1999. in Fazekas, Károly (ed.) Munkaerőpiaci Tükör,
(Labour Force Mirror), MTA KTK.
Laky T. (2001). Az atipikus foglalkozások.(Atypical jobs). Struktúra Munkaügyi Kiadó, Budapest.
Lendvai N. (2004). The weakest link? EU accession and enlargement: dialoguing EU and post-
communist social policy. Journal of European Social Policy Vol 14.
Lifelong learning in Hungary - Hungary at Employment Week 2004.
Luijkx R. – Róbert P. –M de Graaf P. – Ganzeboom H. (2002). Changes in Status Attainment in
Hungary between 1910-1989. European Societies. Vol.4. No.1. pp. 107-140.
Luijkx R. – Róbert P. – M de Graaf P. – Ganzeboom H. (1998). From Ascription to Achievement: The
status attainment process in Hungary from 1910 to 1991. In: Nieuwbeerta, P., Ganzeboom, H.B.G.
(eds.) Transformation Processes in Eastern Europe. Part 2. Social Stratification. NWO/ESR. The
Hague. pp. 93-119.
Manning N. (2004). Diversity and change in pre-accession Central and Eastern Europe since 1989.
Journal of European Social Policy Vol 14.
Mansell R. E. (2001). 'Digital opportunities and the missing link for developing countries.' Oxford
review of economic policy. 17(2): 282-295.
Micklewright J. – Nagy Gy. (1994). Flows to and from Insured Unemployment in Hungary. EUI
Working Paper ECO No. 94/41. Florence: European University Institute.
European Network Indicators on Social Quality Hungarian National Report, February 2005
European Foundation on Social Quality 74
Micklewright J. – Nagy Gy. (1999). Living standards and incentives in transition: The implications of
exhausting UI entitlement in Hungary. Journal of Public Economics 73: 297-320.
National Action Plan on social inclusion 2004-2006.
NEHOM. (2002). Neighbourhood Housing Models. The project is part of the 5th Framework
Programme of the EU; Key Action 4: City of Tomorrow and Cultural Heritage.
OECD. (2000a). Literacy in the information age. Final report of the international adult literacy survey.
Paris: OECD, Statistics Canada.
OECD. (2000b). From Initial Education to Working Life. Making Transitions Work. Paris: OECD.
OECD. (2002). Taking the measure of temporary employment. in: Employment Outlook 2002. Paris:
OECD.
OECD. (2001). Underatsnding the Digital Divide. OECD Publications, Paris.
Open Society Institute. (2001). Minority Protection in Hungary. Monitoring the EU Accession Process.
Orosz E. – Burns A. (2000). The Healthcare System in Hungary. Paris: Organisation for Economic Co-
operation and Development, 2000.
Pascall P. – Manning N. (2000). Gender and social policy: comparing welfare states in Central and
Eastern Europe and the former Soviet Union. Journal of European Social Policy, 10: 240-266.
Róbert P. (1991). Educational transition in Hungary from the postwar period up to the end of the
1980s. European Sociological Review (Special Edition on Eastern Europe) 7(3): 213-236.
Róbert P. (2003). Self-selection and Selection: Transition from Secondary to Tertiary Education in
Hungary. Czech Sociological Review 39 (3): 325-349.
Róbert P. – Bukodi E. (2002). The effects of the globalization process on the transition to adulthood in
Hungary. Globalife Working Papers No. 27. http://alia.soziologie.uni-
bielefeld.de/~globalife/workingp.html
Róbert P. (2004). The institutional background of life-long-learning and experiencies of European
Union – working paper, 2004
Red Cross: http://www.sopronnet.hu/civil/voroskereszt/beszam.htm.
European Network Indicators on Social Quality Hungarian National Report, February 2005
European Foundation on Social Quality 75
Selhofer H. – Hüsing T. (2002). The Digital Divide Index – a measure of social inequalities in the
adoption of ICT.
http://www.empirica.biz/sibis/files/Huesing_Selhofer_DDIX_2002.pdf
Sik E. (1988a). Reciprocal exchange of labour in Hungary. In: R.E. Pahl (ed): On work: Historical,
comparative and theoretical approaches. Oxford: Basil Blackwell, 527-547.
Sik E. (1988b). “The eternity” of an institution for survival. Innovation. 1: 589-624.
Sik E. (1992). From Second Economy to the Informal Economy. Studies in Public Policy: 207, pp. 1-
35.
Sik E. – Nagy I. (2002). Households, work and flexibility. Hungarian Research Report for “Household,
work and flexibility” project. http://www.hwf.at.
Szakáts A. (2000) Industrial Democracy in Hungary
www.upf.pf/recherche/IRIDIP/RJP/RJP6/45Szakats.doc
Simkus A. (1981). Comparative Stratification and Mobility. International Journal of Comparative
Sociology. Vol. 22. No. 3. pp.213-236.
Szivós P. –Tóth I. Gy. (1998). Poverty trends and social transfers through the transition: Hungary,
1992-1998. Budapest.
Temesi I. (2002). Local government in Hungary. Local governments in Central and Eastern Europe.
The Hungarian Information Society on the Eve of the Accession to the European Union.
Tóth I. Gy. (2003). Jövedelem-egyenlőtlenségek: tényleg növekszenek vagy csak úgy látjuk?
(Inequalities of income: are they or do they just seem to be increasing?) Közgazdasági Szemle
(Review of Economics) L:209-234.
Treiman D. J. (1970). Industrialization and social stratification. In: E. O. Laumann (ed.) Social
Stratification: Research and Theory for the 1970s. Indianapolis: Bobbs-Merrill.
UNICEFF. (2001). A decade of transition. United Nations Children’s Fund. Innocenti Research Centre,
Florence.
Utasi Á. (1987). Hajléktalanok, csavargók. In: Peremhelyzetek, rétegződés-modell vizsgálat, VIII.
Budapest, Társadalomtudományi Intézet, 181-213.

European Network Indicators on Social Quality Hungarian National Report, February 2005
European Foundation on Social Quality 76

European Network Indicators on Social Quality Hungarian National Report, February 2005
European Foundation on Social Quality 77
Annex Social Quality indicators

European Network Indicators on Social Quality Hungarian National Report, February 2005
European Foundation on Social Quality 78

European Network Indicators on Social Quality Hungarian National Report, February 2005
European Foundation on Social Quality 79
Indicators of Socio-economic Security
Domains Sub-domains Indicators
Financial resources
Income sufficiency 1. Part of household income spent on health, clothing, food and housing (in the lower and median household incomes)
Income security 2. How do certain biographical events affect the risk of poverty on household level.
3. Proportion of total population living in households receiving entitlement transfers (means-tested, cash and in-kind transfers) that allow them to live above EU poverty level
Housing and environment
Housing security 4. Proportion of people who have certainty of keeping their home
5. Proportion of hidden families (i.e. several families within the same household)
Housing conditions 6. Number of square meters per household member
7. Proportion of population living in houses with lack of functioning basic amenities (water, sanitation and energy)
Environmental conditions (social and natural)
8. People affected by criminal offences per 10.000 inhabitants
9. Proportion living in households that are situated in neighbourhoods with above average pollution rate (water, air and noise)
Health and care Security of health provisions
10. Proportion of people covered by compulsory/ voluntary health insurance (including qualitative exploration of what is and what is not covered by insurance system)
Health services 11. Number of medical doctors per 10.000 inhabitants
12. Average distance to hospital, measure in minutes, not in meters
13. Average response time of medical ambulance
Care services 14. Average number of hours spent on care differentiated by paid and unpaid
Work Employment security 15. Length of notice before employer can change terms and conditions of labour relation/contract
16. Length of notice before termination of labour contract
17. proportion employed workforce with temporary, non permanent, job contract
18. Proportion of workforce that is illegal
Working conditions 19. Number of employees that reduced work time because of interruption (parental leave, medical assistance of relative, palliative leave) as a proportion of the employees who are entitled to these kinds of work time reductions
20. Number of accidents (fatal / non-fatal) at work per 100.000 employed persons (if possible: per sector)
21. Number of hours a full-time employee typically works a week (actual working week)
Education Security of education 22. Proportion of pupils leaving education without finishing compulsory education (early school leavers)
23. Study fees as proportion of national mean net wage
Quality of education 24. Proportion of students who, within a year of leaving school with or without certificate, are able to find employment
Source: M. Keizer and L.J.G. van der Maesen: Social Quality and the Component of Socio-economic security 3rd Draft, Working Paper, Amsterdam, September 2003

European Network Indicators on Social Quality Hungarian National Report, February 2005
European Foundation on Social Quality 80
Indicators of Social Cohesion
Domains Sub-domains Indicators
Trust Generalised trust 25. Extent to which ‘most people can be trusted’
Specific trust 26. Trust in: government; elected representatives; political parties; armed forces; legal system; the media; trade unions, police; religious institutions; civil service; economic transactions
27. Number of cases being referred to European Court of law
28. Importance of: family; friends; leisure; politics; respecting parents. parents’ duty to children
Other integrative norms and values
Altruism 29. Volunteering: number of hours per week
30. Blood donation
Tolerance 31. Views on immigration, pluralism and multiculturalism
32. Tolerance of other people’s self-identity, beliefs, behaviour and lifestyle preferences
Social contract 33. Beliefs on causes of poverty: individual or structural
34. Willingness to pay more taxes if you were sure that it would improve the situation of the poor
35. Intergenerational: willingness to pay 1% more taxes in order to improve the situation of elderly people in your country
36. Willingness to actually do something practical for the people in your community/ neighbourhood, like: picking up litter, doing some shopping for elderly/ disabled/ sick people in your neighbourhood, assisting neighbours/ community members with filling out (fax/ municipal/ etc) forms, cleaning the street/ porch/ doorway
37. Division of household tasks between men and women: Do you have an understanding with your husband/ spouse about the division of household tasks, raising of the children, and gaining household income?
Social networks Networks 38. Membership (active or inactive) of political, voluntary, charitable organisations or sport clubs
39. Support received from family, neighbours and friends
40. Frequency of contact with friends and colleagues
Identity National/ European identity
41. Sense of national pride
42. Identification with national symbols and European symbols
Regional/ community/ local identity
43. Sense of regional / community / local identity
Interpersonal identity 44. Sense of belonging to family and kinship network
Source: Y. Berman and D. Phillips: Indicators for Social Cohesion, 5th Draft, EFSQ Working Paper, Amsterdam, June 2004

European Network Indicators on Social Quality Hungarian National Report, February 2005
European Foundation on Social Quality 81
Indicators of Social Inclusion
Domains Sub-domains Indicators
Citizenship rights Constitutional/ political rights
45. Proportion of residents with citizenship
46. Proportion having right to vote in local elections and proportion exercising it
Social rights 47. Proportion with right to a public pension (i.e. a pension organised or regulated by the government)
48. Women's pay as a proportion of men's
Civil rights 49. Proportion with right to free legal advice
50. Proportion experiencing discrimination
Economic and political networks
51. Proportion of ethnic minority groups elected or appointed to parliament, boards of private companies and foundations
52. Proportion of women elected or appointed to parliament, boards of private companies and foundations
Labour market Access to paid employment
53. Long-term unemployment (12+ months)
54. Involuntary part-time or temporary employment
Services Health services 55. Proportions with entitlement to and using public primary health care
Housing 56. Proportion homeless, sleeping rough
57. Average waiting time for social housing
Education 58. school participation rates and higher education participation rates
Social care 59. Proportion of people in need receiving care services
60. Average waiting time for care services (including child care)
Financial services 61. Proportion denied credit differentiated by income groups
62. Access to financial assistance / advice in case of need
Transport 63. Proportion of population who has access to public transport system
64. Density of public transport system and road density
Civic / cultural services 65. Number of public sport facilities per 10.000 inhabitants
66. Number of public and private civic & cultural facilities (e.g. cinema, theatre, concerts) per 10.000 inhabitants
Social networks Neighbourhood participation
67. Proportion in regular contact with neighbours
Friendships 68. Proportion in regular contact with friends
Family life 69. Proportion feeling lonely/isolated
70. Duration of contact with relatives (cohabiting and non-cohabiting)
71. Informal (non-monetary) assistance received by different types of family
Source: A. Walker and A. Wigfield: The Social Inclusion Component Of Social Quality, EFSQ Working Paper, Amsterdam, September 2003
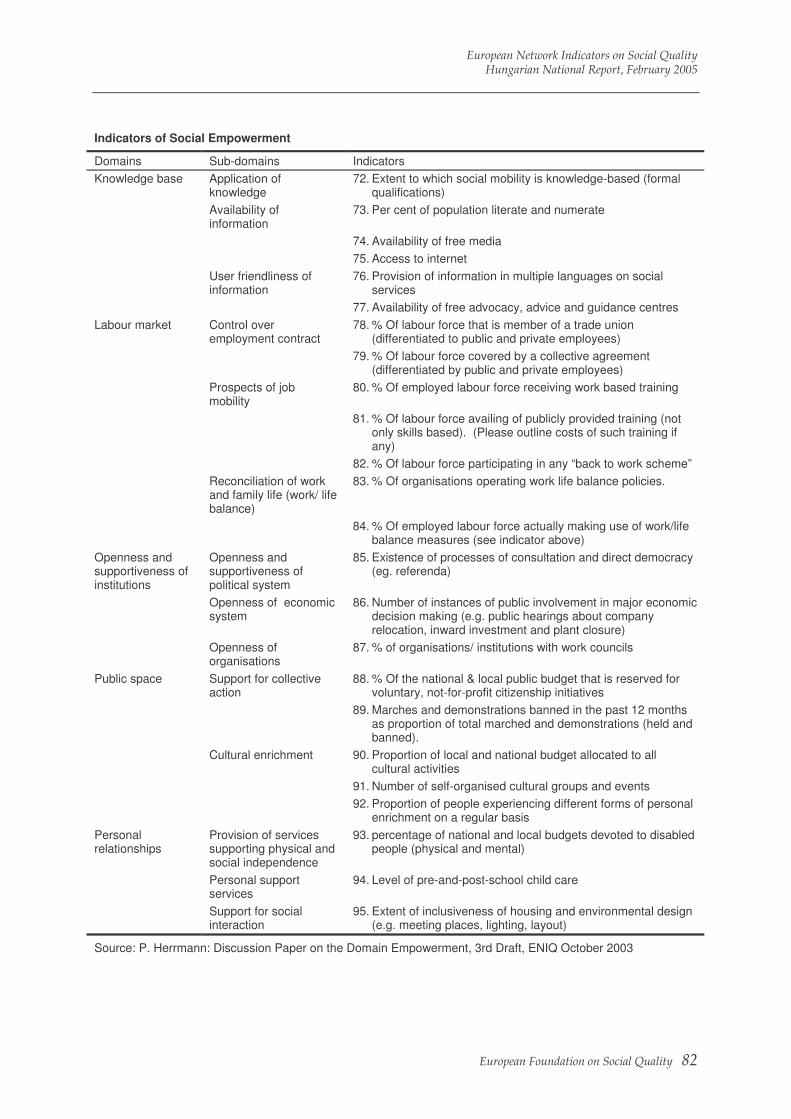
European Network Indicators on Social Quality Hungarian National Report, February 2005
European Foundation on Social Quality 82
Indicators of Social Empowerment
Domains Sub-domains Indicators
Knowledge base Application of knowledge
72. Extent to which social mobility is knowledge-based (formal qualifications)
Availability of information
73. Per cent of population literate and numerate
74. Availability of free media
75. Access to internet
User friendliness of information
76. Provision of information in multiple languages on social services
77. Availability of free advocacy, advice and guidance centres
Labour market Control over employment contract
78. % Of labour force that is member of a trade union (differentiated to public and private employees)
79. % Of labour force covered by a collective agreement (differentiated by public and private employees)
Prospects of job mobility
80. % Of employed labour force receiving work based training
81. % Of labour force availing of publicly provided training (not only skills based). (Please outline costs of such training if any)
82. % Of labour force participating in any “back to work scheme”
Reconciliation of work and family life (work/ life balance)
83. % Of organisations operating work life balance policies.
84. % Of employed labour force actually making use of work/life balance measures (see indicator above)
Openness and supportiveness of institutions
Openness and supportiveness of political system
85. Existence of processes of consultation and direct democracy (eg. referenda)
Openness of economic system
86. Number of instances of public involvement in major economic decision making (e.g. public hearings about company relocation, inward investment and plant closure)
Openness of organisations
87. % of organisations/ institutions with work councils
Public space Support for collective action
88. % Of the national & local public budget that is reserved for voluntary, not-for-profit citizenship initiatives
89. Marches and demonstrations banned in the past 12 months as proportion of total marched and demonstrations (held and banned).
Cultural enrichment 90. Proportion of local and national budget allocated to all cultural activities
91. Number of self-organised cultural groups and events
92. Proportion of people experiencing different forms of personal enrichment on a regular basis
Personal relationships
Provision of services supporting physical and social independence
93. percentage of national and local budgets devoted to disabled people (physical and mental)
Personal support services
94. Level of pre-and-post-school child care
Support for social interaction
95. Extent of inclusiveness of housing and environmental design (e.g. meeting places, lighting, layout)
Source: P. Herrmann: Discussion Paper on the Domain Empowerment, 3rd Draft, ENIQ October 2003
European Network Indicators on Social Quality Hungarian National Report, February 2005
European Foundation on Social Quality 83
Statistical Annex

European Network Indicators on Social Quality Hungarian National Report, February 2005
European Foundation on Social Quality 84

European Network Indicators on Social Quality Hungarian National Report, February 2005
European Foundation on Social Quality 85
Domain: Income
Sub-domain: income sufficiency
Table 1 Proportion of household income spent on food, housing maintenance, clothing, health, and transport (%)
Income level Food Clothing Health Transport, communication
1993 2002 1993 2002 1993 2002 1993 2002
1st deciles 40,4 35,8 7,2 6,0 3,5 5,4 9,1 10,9
10th deciles 26,1 21,3 7,7 5,5 3,9 5,3 19,5 21,4
Mean 33,8 28,8 7,5 5,6 3,8 6,2 13,1 16,5
Source: Hungarian Household Budget Surveys
Sub-domain: income security
Table 2 At-risk-of-poverty rate according to employment status, 2003
Employee Self-employed
Unemployed Retired Other inactive
Mean
Males 7,3 4,0 43,5 9,1 18,0 12,3
Females 4,2 3,5 40,0 12,3 21,3 14,1
Mean 5,9 3,9 41,9 11,0 19,9 13,2
Note: Poverty threshold: 60% of median household income
Source: TARKI Household Monitor Survey, 2003
Table 3 At-risk-of-poverty rate in households with children, 2003
Lone parent
Couple, 1 child
Couple, 2 children
Couple, 3+ children
Rate 37,4 10,8 10,3 30,4
Note: Poverty threshold: 60% of median household income
Source: TARKI Household Monitor Survey, 2003
Socio-economic Security
European Network Indicators on Social Quality Hungarian National Report, February 2005
European Foundation on Social Quality 86
Table 4 Workless household living under poverty threshold according to household type, 2002 (%)
Type of household % of workless household
% of workless household living under poverty threshold
One-person household 79,7 6,0
Household:
without dependent child 59,7 6,0
with 1 child 11,2 40,5
with 2 children 7,0 46,2
with 3 or more children 22,3 65,6
Total 36,8 33,0
Note: Poverty threshold: 60% of median household income
Source: Hungarian Household Budget Survey
Table 5 At-risk-of-poverty rate before and after transfers, 2003
At-risk-of-poverty rate
Before any transfers 38,5
Including pensions 23,0
After all transfers 13,2
Note: Poverty threshold: 60% of median household income
Source: TARKI Household Monitor Survey, 2003
Domain: Housing
Sub-domain: housing security
Table 6 Dwelling distribution (%)
Ownership Private rent Municipal rent
Other Total
1990 73,6 3,4 19,0 4,0 100,0
2003 87,9 2,5 3,9 5,5 100,0
Source: Census, 1990; General Dwelling Survey, 2003 (HCSO)
Table 7 At-risk-of-poverty rate by tenure status, 2003
At-risk-of-poverty rate
Owner 11,9
Tenant (private and municipal) 20,6
Note: Poverty threshold: 60% of median household income
Source: TARKI Household Monitor Survey, 2003
European Network Indicators on Social Quality Hungarian National Report, February 2005
European Foundation on Social Quality 87
Table 8 Proportion of households consisting of two or more families (%)
%
1970 5,5
1980 4,2
1990 2,6
2001 3,2
Source: Census
Sub-domain: housing conditions
Table 9 Indicators of housing density
Number of square meters per a household member
Number of rooms per a household member
1999 28 0,96
2003 30 1,02
Source: General Dwelling Surveys (HCSO)
Table 10 Proportion of crowded dwellings (%)
%
1980 32,3
1984 22,4
1990 16,9
1996 15,2
1999 13,5
2003 7,7
Note: crowded dwelling: number of household members per room exceeds 1 (EUROSTAT definition).
Source: Census, 1980, 1990, 2001;
Micro-census, 1984, 1996;
General Dwelling Survey, 1999, 2003
European Network Indicators on Social Quality Hungarian National Report, February 2005
European Foundation on Social Quality 88
Table 11 Proportion of over-crowded dwellings according to size of settlement (%)
Size of settlement (number of inhabitants)
%
Budapest 4,4
100 000 and more 4,2
50 000 – 99 999 4,1
20 000 – 49 999 5,2
10 000 – 19 999 5,7
5 000 – 9 999 6,4
2 000 – 4 999 6,3
1 000 – 1 999 6,6
500 – 999 7,0
200 – 499 7,5
Less then 200 7,3
Total 5,4
Note: overcrowded dwelling: number of household members per room exceeds 2.
Source: Census, 2001
Table 12 Proportion of sub-standard dwellings according to country-region, 2003 (%)
Country-region %
Central 10,0
Central-Transdanubia 10,4
Western-Transdanubia 9,8
Southern-Transdanubia 13,8
Northern Hungary 18,6
Northern Great Plain 18,1
Southern Great Plain 21,4
Total 14,1
Note: Sub-standard dwelling: dwelling without WC, bathroom or shower, piped-water,
Source: General Dwelling Survey, 2003
Sub-domain: environmental conditions
Table 13 Number of individuals affected by criminal offences per 100 000 inhabitants
Males Females
1990 2817 1199
1995 4640 1938
2000 3566 1689
2002 3226 1605
Source: Hungarian Statistical Yearbook

European Network Indicators on Social Quality Hungarian National Report, February 2005
European Foundation on Social Quality 89
Table 14 Perception concerning the safety of the neighbourhood (%)
%
Very safe 7,5
Rather safe 59,2
Rather not safe 25,9
Not at all 4,8
Other answer 2,7
Total 100,0
Source: European Social Survey, 2002
Table 15 Proportion of households living in unhealthy surroundings (%)
Budapest County seat other town village
dust 53,9 50,1 37,3 31,1
air-pollution 42,8 31,9 20,3 14,4
polluted surrounding 17,4 13,4 5,9 4,8
Source: Dwelling Survey, 1999 (HCSO)
Domain: Health
Sub-domain: health services
Table 16 Number of medical doctors per 10 000 inhabitants
Rate 1990=100%
1990 31,70 100,0
1995 33,53 105,8
2000 35,54 112,1
2002 36,80 116,1
Source: Yearbook on Health Statistics
Table 17 Changes in the number of the hospital beds per 10 000 inhabitants (1990=100%)
%
1990 100,0
1995 89,4
2000 81,9
2002 79,0
Source: Yearbook on Health Statistics
Table 18.1 Proximity to hospital according to income level, 2002
Income level Hungary EU-15
Lowest quartile 16,0 44,9
Highest quartile 46,8 60,4
Mean 31,4 52,8
Note: Proximity: % of individuals having access to a hospital in less than 20 minutes
Source: European Foundation for the improvement of working and living conditions:
Health and care in an enlarged Europe
European Network Indicators on Social Quality Hungarian National Report, February 2005
European Foundation on Social Quality 90
Table 18.2 Proximity to general practitioner’s surgery according to income level, 2002
Income level Hungary EU-15
Lowest quartile 66,5 83,3
Highest quartile 81,9 86,0
Mean 74,3 84,7
Note: Proximity: % of individuals having access to the surgery in less than 20 minutes
Source: European Foundation for the improvement of working and living conditions:
Health and care in an enlarged Europe
Sub-domain: health status
Table 19 Life expectancy at birth
Male Female
1990 65.13 73.71
1991 65.02 73.83
1992 64.55 73.73
1993 64.55 73.73
1994 64.84 74.23
1995 65.25 74.50
1996 66.06 74.70
1997 66.35 75.08
1998 66.14 75.18
1999 66.32 75.13
2000 67.11 75.59
2001 68.15 76.46
2002 68,26 76,56
Source: Demographic Yearbooks
Table 20 Proportion of individuals aged 15-64 with serious sickness in 2000 (%)
% of individuals with serious sickness
% of individuals who are limited in everyday activities by their serious sickness
Males Females Males Females
In labour force 7.7 7.1 1.0 1.4
Not in labour force 26.6 23.4 7.2 6.7
Total 14.4 14.8 3.2 3.9
Source: Way of Life and Time Use Survey, 2000
Table 21 Proportion of individuals with long-term illnesses according to income situation, 2002 (%)
Lowest income quartile
Highest income quartile
Mean
Hungary 48,8 17,5 33,4
EU-15 24,8 15,1 19,3
Source: European Foundation for the Improvement of Living and Working Conditions (2004): Health and care in an enlarged Europe.
Quality of Life in Europe. Dublin.
European Network Indicators on Social Quality Hungarian National Report, February 2005
European Foundation on Social Quality 91
Table 22 Proportion of individuals regards their own health status bad (%)
Health status %
Bad 14,4
Very bad 4,3
Source: European Social Survey, 2002
Domain: care
Sub-domain: paid care services
Table 23 Indicators on infants’ nurseries
Number of infants’ nurseries
Number of space per 100 infant aged 0-3
number 1990=100% number 1990=100%
1990 1003 100,0 13,7 100,0
1998 565 56,3 8,8 64,2
1999 549 54,7 8,8 64,2
2000 532 53,0 8,7 63,5
2001 532 53,0 8,6 62,8
2002 523 52,1 8,4 61,3
2003 515 51,3 8,3 60,6
Source: Statistical Yearbook on Social Care
Table 24 Proportion of children aged 3-6 enrolling nursery school and kindergarden(%)
%
1990 82,1
1998 85,1
1999 85,9
2000 86,2
2001 86,4
2002 87,8
Source: Hungarian Statistical Yearbook
Table 25 Indicators on family and child care allowances (%)
Family allowance as % of persons aged 0-18
Child-care aid as % of females aged 15-49
Child-care fee as % of females aged 15-49
1990 91,0 3,7 6,1
2000 96,1 7,5 2,1
2003 99,4 6,8 3,1
Source: Yearbook on Social Cares and Services
European Network Indicators on Social Quality Hungarian National Report, February 2005
European Foundation on Social Quality 92
Table 26 Proportion of elderly (aged 60 and over) receiving home-care service (%)
General home-care service
Paid catering
1990 4,3 4,6
1995 2,2 5,3
2000 1,9 4,7
2002 2,0 4,9
Source: Yearbook on Social Cares and Services
Sub-domain: unpaid care services
Table 27 Time spent on unpaid childcare in an average day (minutes), 2000
Males Females
Single, no children 2,6 6,8
Couple, no children 6,5 11,3
Couple, children aged 0-6 70,9 175,8
Couple, children aged 7-17 20,7 39,7
Single with children .. 76,5
Total 13,8 30,8
Source: Time Use Survey, 2000
Domain: employment
Sub-domain: employment security
Table 28 Proportion of employees with temporary contract (%)
15-24 25-29 30-39 40-49 50- Total
1997 11,7 7,1 5,4 4,6 7,4 6,6
1998 11,8 7,3 5,6 4,3 6,7 6,6
1999 10,8 7,5 5,7 4,0 5,2 6,1
2000 13,6 8,0 6,7 4,9 5,5 7,1
2001 14,9 8,0 7,3 5,6 5,3 7,5
2002 14,7 8,0 7,2 5,4 5,3 7,3
2003 16,4 9,5 6,9 5,7 5,1 7,5
Source: Hungarian Labour Force Survey
Table 29 Socio-economic composition of employees with different job contracts in 2000 (%)
Permanent job Fixed-term contract
Service class 29.2 21.7
Routine non-manuals 9.1 10.0
Self-employed 10.6 5.0
Skilled workers 21.9 22.9
Unskilled workers 29.2 40.5
Total 100.0 100.0
Source: Way of Life and Time Use Survey, 2000
European Network Indicators on Social Quality Hungarian National Report, February 2005
European Foundation on Social Quality 93
Table 30 Job mobility rate, 2003 (%)
%
Age
15–24 14,3
25–29 10,5
30–39 7,3
40–49 5,5
50– x 3,6
Education
Primary 8,5
Vocational school 8,6
Secondary school 6,2
Tertiary diploma 5,0
Total 7,1
Note: Job mobility rate: % of employees changing job in the preceding year of the survey.
Source: Hungarian Labour Force Survey
Table 31 Proportion of employees leaving their last job involuntary (%)
%
1992 73.46
1993 71.61
1994 68.54
1995 67.44
1996 64.98
1997 60.41
1998 59.44
1999 56.91
2000 55.98
2001 55.70
2002 54.10
Source: Hungarian Labour Force Surveys
Table 32 Options concerning return to the labour market after maternity leave (% of females in maternity leave)
1993 2002
Previous employer does not exist any more 9 12
Previous employer does not want to employ her after maternity leave 34 33
Does not want to return to her previous employer 7 10
Does want to return to her previous employer 50 45
Source: HCSO (2003)

European Network Indicators on Social Quality Hungarian National Report, February 2005
European Foundation on Social Quality 94
Sub-domain: employment and working conditions
Table 33 Proportion of employees in part-time work (%)
1995 2003
Gender
Male 2,0 2,6
Female 4,6 5,9
Age
15–24 2,5 3,1
25–29 2,7 3,1
30–39 2,2 3,4
40–49 2,0 3,2
50– x 8,1 7,6
Education
Primary 4,8 7,2
Vocational school 1,9 3,2
Secondary school 2,7 4,0
Tertiary diploma 4,1 3,7
Total 3,2 4,2
Source: Hungarian Labour Force Surveys
Table 34 Number of hours employees typically work a week
1995 2003
Gender
Male 41,3 40,4
Female 36,6 36,4
Age
15–24 38,9 39,1
25–29 39,8 38,9
30–39 39,7 38,9
40–49 39,7 38,8
50– x 37,1 37,3
Education
Primary 38,2 37,6
Vocational school 40,6 39,6
Secondary school 39,5 38,6
Tertiary diploma 37,6 37,3
Total 39,2 38,5
Source: Hungarian Labour Force Surveys
European Network Indicators on Social Quality Hungarian National Report, February 2005
European Foundation on Social Quality 95
Table 35 Incidence of work accidents
Accidents at work Fatal accidents
Number Per 1000 manual workers
Number Per 1000 manual workers
1990 88684 35,6 428 17,2
1997 28896 20,9 149 10,8
2000 28220 18 153 9,8
Source: Hungarian Statistical Yearbooks
Domain: education
Sub-domain: educational security
Table 36 Highest education of population aged 15-64, 2001 (%)
Age Un-completed primary
Primary
Vocational school
Secondary school
Tertiary school
Total
15–19 6,3 68,8 9,4 15,6 – 100,0
20–24 2,1 18,5 28,5 45,3 5,6 100,0
25–29 2,1 20,3 32,7 30,2 14,8 100,0
30–39 2,3 21,2 31,8 29,1 15,7 100,0
40–49 2,8 27,6 27,3 27,8 14,6 100,0
50–59 4,7 38,7 14,9 27,6 14,1 100,0
60–64 13,3 57,4 0,1 19,7 9,5 100,0
Total 4,0 32,8 22,7 28,5 11,9 100,0
Source: Census, 2001
Table 37 Early school leavers, 2003 (%)
Male Female
EU15 20,3 15,9
Hungary 12,4 11,1
Note: early school leavers: persons aged 18-24 with only primary education and not in formal and non-formal schools.
Source: Hungarian Labour Force Surveys
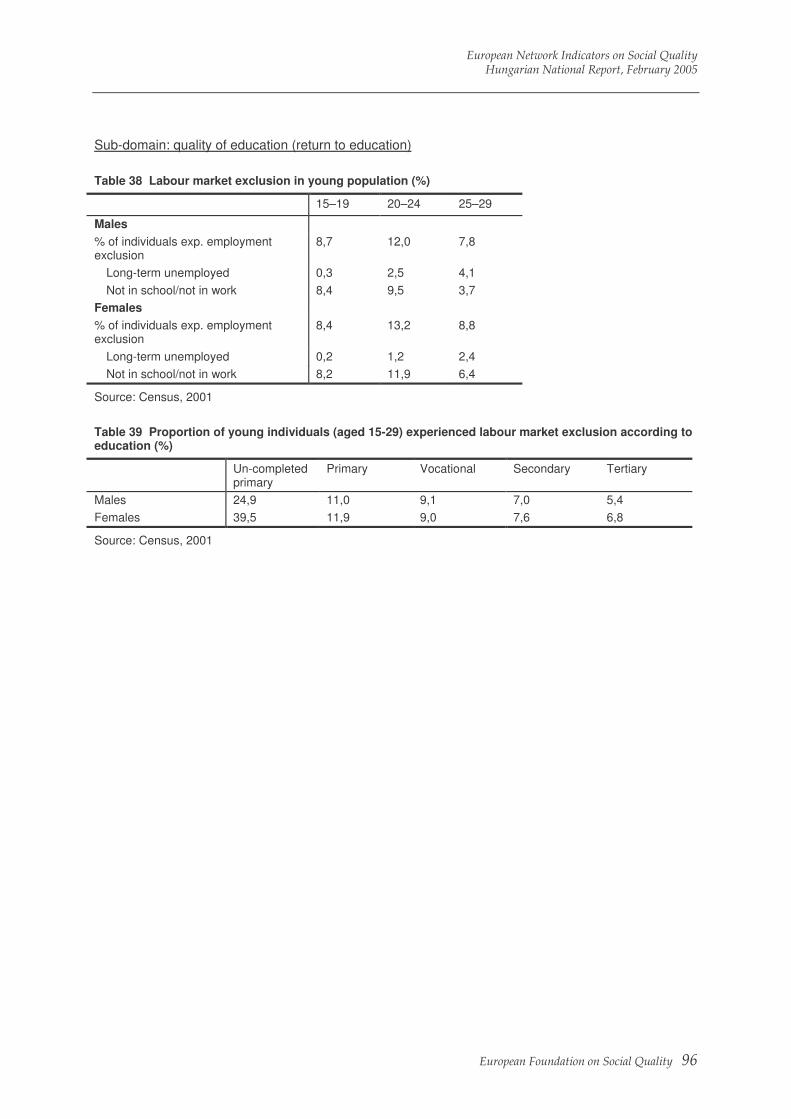
European Network Indicators on Social Quality Hungarian National Report, February 2005
European Foundation on Social Quality 96
Sub-domain: quality of education (return to education)
Table 38 Labour market exclusion in young population (%)
15–19 20–24 25–29
Males
% of individuals exp. employment exclusion
8,7 12,0 7,8
Long-term unemployed 0,3 2,5 4,1
Not in school/not in work 8,4 9,5 3,7
Females
% of individuals exp. employment exclusion
8,4 13,2 8,8
Long-term unemployed 0,2 1,2 2,4
Not in school/not in work 8,2 11,9 6,4
Source: Census, 2001
Table 39 Proportion of young individuals (aged 15-29) experienced labour market exclusion according to education (%)
Un-completed primary
Primary Vocational Secondary Tertiary
Males 24,9 11,0 9,1 7,0 5,4
Females 39,5 11,9 9,0 7,6 6,8
Source: Census, 2001

European Network Indicators on Social Quality Hungarian National Report, February 2005
European Foundation on Social Quality 97
Domain: Rights
Sub-domain: political rights
Table 1 Proportion of individuals (with election rights) voted in elections (%)
Year General election
Local election
1990 65,1 40,2
1994 68,9 43,4
1998 56,3 45,7
2002 70,5 51,1
Source: wwww.valasztas.hu
Sub-domain: civil rights
Table 2 Proportion of individuals experiencing any kind of discrimination (%)
%
% of individuals experiencing discrimination 5,1
% of individuals belonging to a minority group experiencing discrimination
34,1
% of females experiencing discrimination 5,2
% of individuals aged 14-29 experiencing discrimination
5,9
% of individuals aged 30-49 experiencing discrimination
5,4
% of individuals aged 50-69 experiencing discrimination
5,3
% of individuals aged 70-x experiencing discrimination
2,4
Source: European Social Survey, 2002
Table 3 Women's pay as a proportion of men's in different occupations (%)
Occupation 1995 2002
Managers 85 80
Professionals 80 70
Intermediate professionals 81 77
Service and sales occupations 75 82
Unskilled workers 80 90
Total 81 86
Source: Hungarian Labour Force Survey
Social Inclusion

European Network Indicators on Social Quality Hungarian National Report, February 2005
European Foundation on Social Quality 98
Sub-domain: economic and political network
Table 4 Women’s participation in the general elections as candidates and elected representatives (%)
Year Candidates Elected representatives
1990 8,5 7,0
1994 10,0 11,2
1998 14,2 8,5
2002 14,0 9,2
Source: CEDEW (2000)
Table 5 Women’s participation in the local elections as elected mayors and elected representatives (%)
Year Elected mayors Elected representatives
1990 10,8 15,6
1994 10,4 20,2
1998 12,7 24,0
Source: CEDEW (2000)
Table 6 Proportion of women in high managerial and high professional occupations (%)
1973 1983 1992 2000
Women 2,3 6,0 5,6 8,1
Men 5,5 10,6 10,0 11,2
Source: Social Mobility Surveys, 1973-1992; Way of Life Survey, 2000
Table 7 Proportion of Roma in high and medium managerial as well as in high professional occupations (%)
Roma Others
Male 0,3 6,2
Female 0,2 3,9
Source: Census, 2001
Domain: Access to services
Sub-domain: access to paid employment
Table 8 Proportion of long-term unemployed among all unemployed (%)
Year Long-term unemployment Very long term un-employment
1992 20,4 –
1995 49,2 25,3
2000 48,9 23,8
2003 41,0 20,5
Source: Hungarian Labour Force Survey
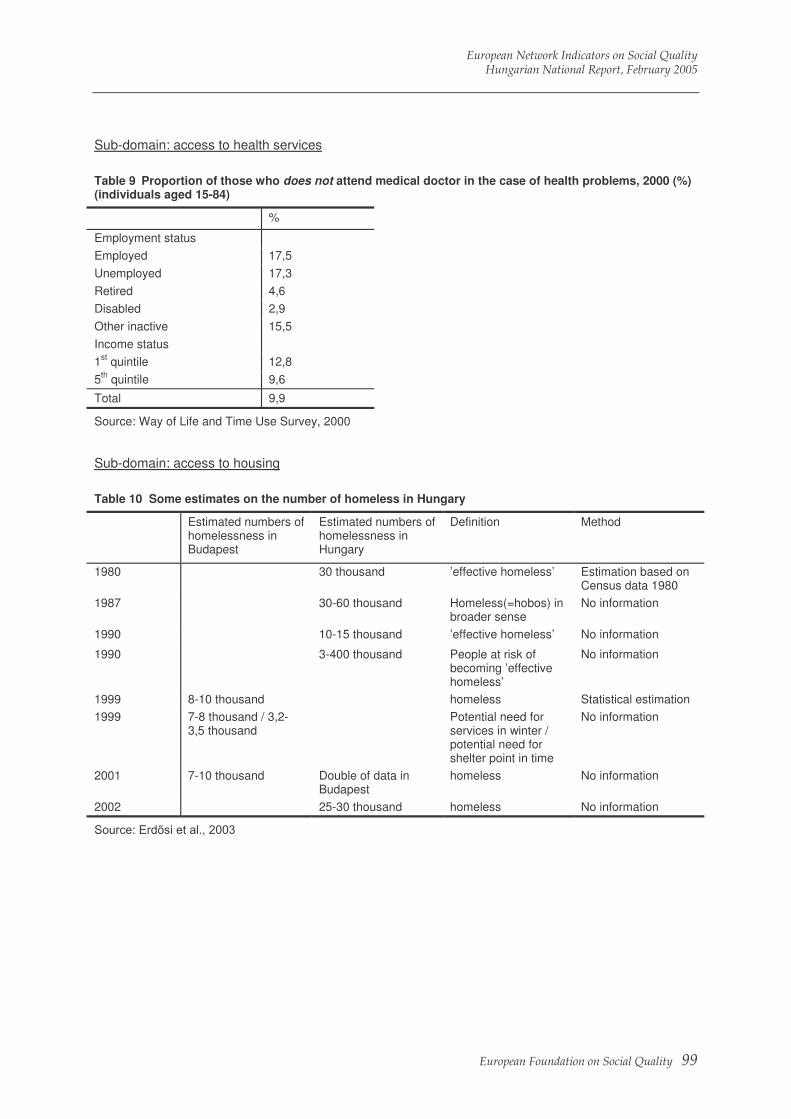
European Network Indicators on Social Quality Hungarian National Report, February 2005
European Foundation on Social Quality 99
Sub-domain: access to health services
Table 9 Proportion of those who does not attend medical doctor in the case of health problems, 2000 (%) (individuals aged 15-84)
%
Employment status
Employed 17,5
Unemployed 17,3
Retired 4,6
Disabled 2,9
Other inactive 15,5
Income status
1st quintile 12,8
5th quintile 9,6
Total 9,9
Source: Way of Life and Time Use Survey, 2000
Sub-domain: access to housing
Table 10 Some estimates on the number of homeless in Hungary
Estimated numbers of homelessness in Budapest
Estimated numbers of homelessness in Hungary
Definition Method
1980 30 thousand ’effective homeless’ Estimation based on Census data 1980
1987 30-60 thousand Homeless(=hobos) in broader sense
No information
1990 10-15 thousand ’effective homeless’ No information
1990 3-400 thousand People at risk of becoming ’effective homeless’
No information
1999 8-10 thousand homeless Statistical estimation
1999 7-8 thousand / 3,2-3,5 thousand
Potential need for services in winter / potential need for shelter point in time
No information
2001 7-10 thousand Double of data in Budapest
homeless No information
2002 25-30 thousand homeless No information
Source: Erdősi et al., 2003
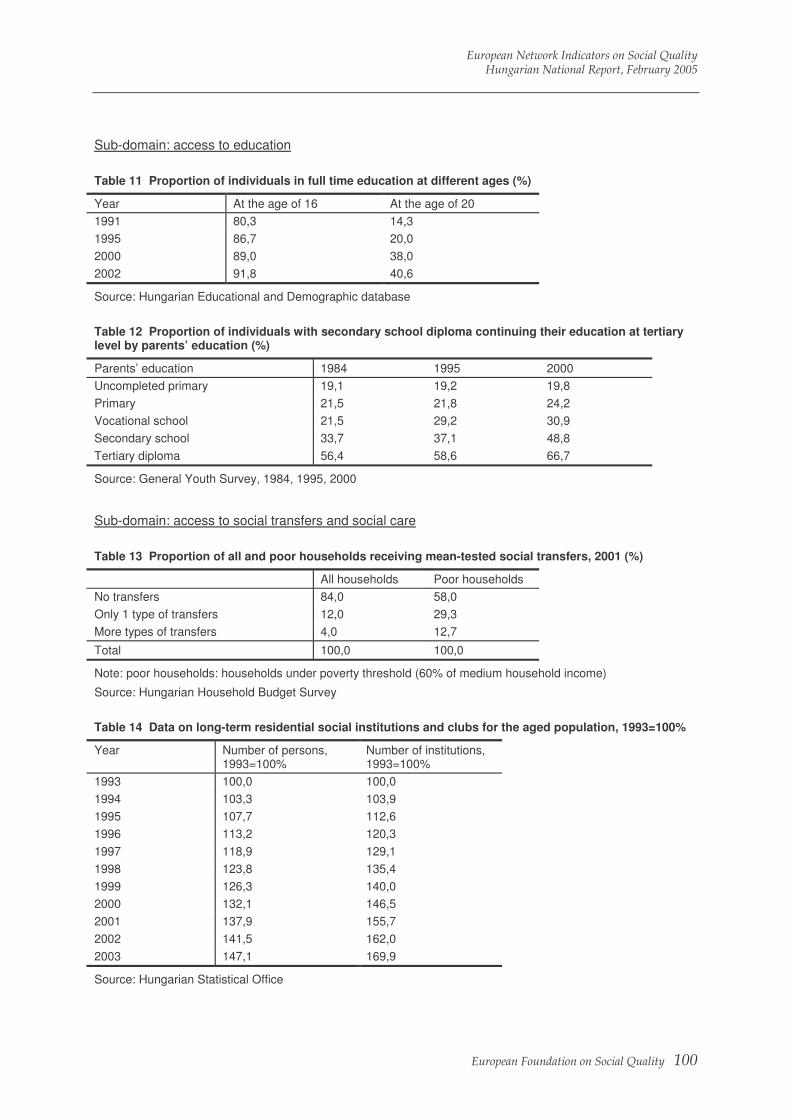
European Network Indicators on Social Quality Hungarian National Report, February 2005
European Foundation on Social Quality 100
Sub-domain: access to education
Table 11 Proportion of individuals in full time education at different ages (%)
Year At the age of 16 At the age of 20
1991 80,3 14,3
1995 86,7 20,0
2000 89,0 38,0
2002 91,8 40,6
Source: Hungarian Educational and Demographic database
Table 12 Proportion of individuals with secondary school diploma continuing their education at tertiary level by parents’ education (%)
Parents’ education 1984 1995 2000
Uncompleted primary 19,1 19,2 19,8
Primary 21,5 21,8 24,2
Vocational school 21,5 29,2 30,9
Secondary school 33,7 37,1 48,8
Tertiary diploma 56,4 58,6 66,7
Source: General Youth Survey, 1984, 1995, 2000
Sub-domain: access to social transfers and social care
Table 13 Proportion of all and poor households receiving mean-tested social transfers, 2001 (%)
All households Poor households
No transfers 84,0 58,0
Only 1 type of transfers 12,0 29,3
More types of transfers 4,0 12,7
Total 100,0 100,0
Note: poor households: households under poverty threshold (60% of medium household income)
Source: Hungarian Household Budget Survey
Table 14 Data on long-term residential social institutions and clubs for the aged population, 1993=100%
Year Number of persons, 1993=100%
Number of institutions, 1993=100%
1993 100,0 100,0
1994 103,3 103,9
1995 107,7 112,6
1996 113,2 120,3
1997 118,9 129,1
1998 123,8 135,4
1999 126,3 140,0
2000 132,1 146,5
2001 137,9 155,7
2002 141,5 162,0
2003 147,1 169,9
Source: Hungarian Statistical Office
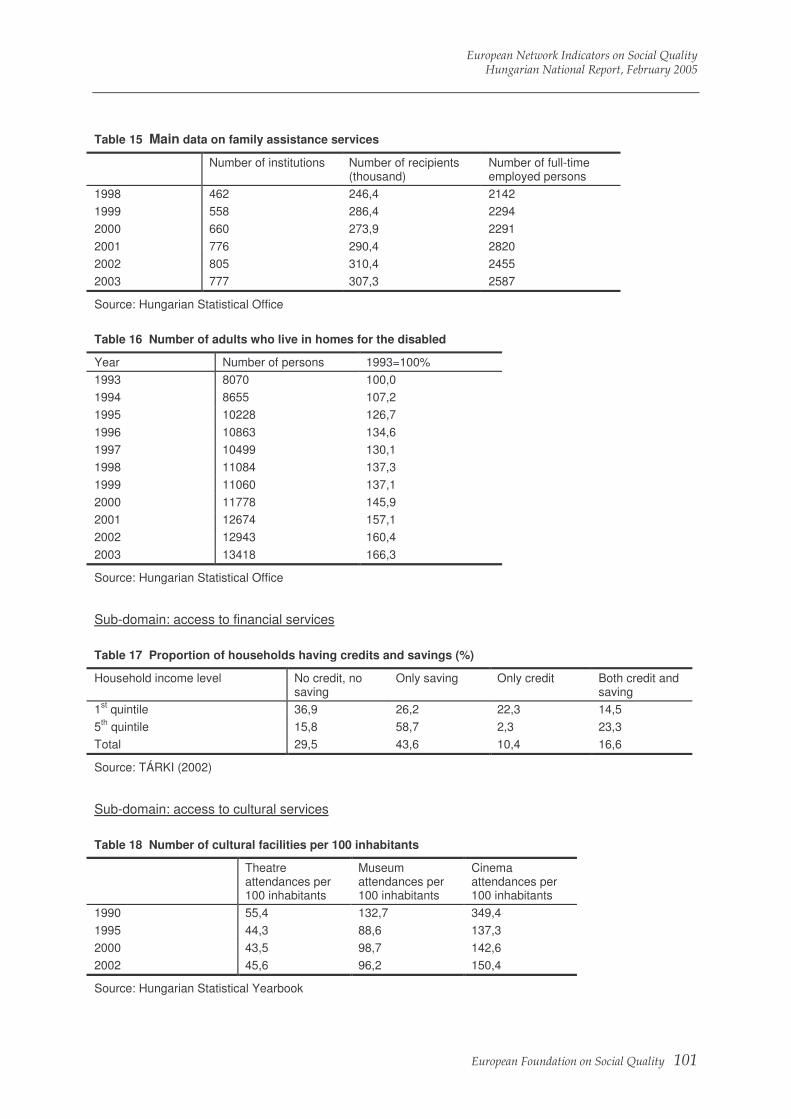
European Network Indicators on Social Quality Hungarian National Report, February 2005
European Foundation on Social Quality 101
Table 15 Main data on family assistance services
Number of institutions Number of recipients (thousand)
Number of full-time employed persons
1998 462 246,4 2142
1999 558 286,4 2294
2000 660 273,9 2291
2001 776 290,4 2820
2002 805 310,4 2455
2003 777 307,3 2587
Source: Hungarian Statistical Office
Table 16 Number of adults who live in homes for the disabled
Year Number of persons 1993=100%
1993 8070 100,0
1994 8655 107,2
1995 10228 126,7
1996 10863 134,6
1997 10499 130,1
1998 11084 137,3
1999 11060 137,1
2000 11778 145,9
2001 12674 157,1
2002 12943 160,4
2003 13418 166,3
Source: Hungarian Statistical Office
Sub-domain: access to financial services
Table 17 Proportion of households having credits and savings (%)
Household income level No credit, no saving
Only saving Only credit Both credit and saving
1st quintile 36,9 26,2 22,3 14,5
5th quintile 15,8 58,7 2,3 23,3
Total 29,5 43,6 10,4 16,6
Source: TÁRKI (2002)
Sub-domain: access to cultural services
Table 18 Number of cultural facilities per 100 inhabitants
Theatre attendances per 100 inhabitants
Museum attendances per 100 inhabitants
Cinema attendances per 100 inhabitants
1990 55,4 132,7 349,4
1995 44,3 88,6 137,3
2000 43,5 98,7 142,6
2002 45,6 96,2 150,4
Source: Hungarian Statistical Yearbook

European Network Indicators on Social Quality Hungarian National Report, February 2005
European Foundation on Social Quality 102
Table 19 “Do you regularly attend theatre, museum, or concerts?” – by household income level
No, because
Yes he/she has no money for that
it is unimportant for him/her
for other reasons
Total
1st quintile 4,2 28,9 22,7 44,3 100,0
5th quintile 28,8 11,7 11,7 47,8 100,0
Total 13,1 22,4 17,1 47,4 100,0
Source: Hungarian Demographic Survey, 2002
Domain: Communities, family
Sub-domain: friendship
Table 20 Proportion of individuals not having friend; (persons aged 18-x) (%)
1993 1997 2001
Males 14 21 34
Females 25 35 43
Source: International Social Survey Program
Table 21 ‘How often do you meet your friends?’; (persons aged 18-x) (%)
Every day Every week Every month Rare
Males 31,1 47,4 15,6 6,9
Females 33,6 38,6 19,4 8,4
Source: International Social Survey Program, 2001
Table 22 Time spent alone on an average day (minutes)
1986 2000
weekday weekend weekday weekend
male 375,64 389,01 515,08 524,08
female 470,68 481,97 614,02 620,67
Source: Time Use Survey, 1986, 2000
Table 23 Time per day spent on socialising in different countries (minutes)
Country %
Belgium 62
Denmark 81
France 55
Finland 64
Sweden 70
UK 67
Estonia 50
Hungary 51
Slovenia 69
Source: EUROSTAT (2003)

European Network Indicators on Social Quality Hungarian National Report, February 2005
European Foundation on Social Quality 103
Sub-domain: family
Table 24 Time spent on socialising with family in an average day, 2000(minutes)
Age Males Females
15-24 18,3 20,4
25-44 19,7 17,8
45-64 17,3 18,7
65-84 22,7 19,0
Total 19,5 18,3
Source: Way of Life and Time Use Survey, 2000
Table 25 Proportion of individuals receiving family assistance in the preceding year of the survey, 2002 (%)
Age Monetary assistance
Non-monetary assistance
18-29 42,0 34,7
30-39 34,0 43,7
40-49 20,2 26,3
50-59 12,7 25,5
60-69 8,5 29,4
70-75 10,5 42,9
Total 24,3 32,8
Source: Hungarian Demographic Survey, 2002
Table 26 Proportion of households receiving and giving inter-household assistance by income level (%)
1999 2002
1st decile (bottom)
10th decile (top) 1st decile (bottom)
10th decile (top)
Household receiving any assistance 55,5 57,7 60,6 72,7
Household giving any assistance 58,3 84,3 46,6 76,2
Source: HCSO (2004)

European Network Indicators on Social Quality Hungarian National Report, February 2005
European Foundation on Social Quality 104
Domain: Trust
Sub-domain: Generalised trust
Table 1 Proportion of the population who thinks that most people can be trusted, 2002
Country
You cannot be too careful .........................................................
Most people can be trusted
Unk
now
n
Tot
al
Mea
n
Hungary 9,3 7,0 10,7 12,5 11,6 25,2 7,7 7,6 4,6 1,4 1,9 0,5 100 4,08
Austria 5,8 3,5 6,0 9,1 10,3 22,0 10,7 15,0 10,2 3,3 3,5 0,6 100 5,07
Belgium 7,1 3,9 6,8 9,9 10,1 21,7 11,9 17,1 8,6 1,1 1,3 0,9 100 4,81
Czech Republic
6,4 6,8 12,2 13,0 11,2 21,1 8,4 9,4 7,0 2,2 1,1 1,0 100 4,25
Germany 7,0 2,8 7,4 13,4 11,8 23,1 10,1 13,5 7,2 1,9 1,6 0,4 100 4,61
Greece 12,5 11,6 10,7 16,5 12,3 15 6,4 5,8 5,7 2,3 1,0 0,1 100 3,64
Ireland 4,2 3,9 6,1 8,2 7,7 18,5 11,9 14,8 15,4 5,3 3,3 1,4 100 5,46
Denmark 0,7 0,7 1,3 3,5 3,7 15,5 7,4 16,2 31,1 11,6 7,8 1,0 100 6,99
Spain 4,0 3,8 8,7 11,8 10,2 19,4 14,1 14,7 9,1 1,9 1,1 2,3 100 4,86
Finland 1,3 0,9 1,9 4,4 6,6 14,2 11,6 25,0 24,9 6,7 2,7 0,1 100 6,46
United Kingdom
4,8 2,3 5,0 11,0 11,4 23,0 13,8 17,0 8,7 1,4 1,4 0,1 100 5,05
Italy 7,5 5,3 7,8 12,4 8,4 26,0 11,7 11,6 6,0 1,7 1,5 0,2 100 4,54
Netherlands 2,9 1,9 3,1 7,4 7,4 19,0 16,2 23,0 14,3 3,1 1,5 0 100 5,71
Poland 11,2 8,6 11,8 16,0 11,3 22,2 6,6 6,1 3,5 0,9 1,2 1,2 100 3,72
Portugal 7,7 5,0 10,8 17,5 12,5 21,4 8,9 7,6 4,3 1,5 2,4 0,3 100 4,00
Sweden 1,7 1,6 3,1 8,1 6,9 17,4 9,3 19,7 23,3 5,7 2,9 0,9 100 6,09
Slovenia 11,8 7,9 9,7 13,9 9,8 22,3 6,5 8,8 5,5 1,3 2,0 1,2 100 3,98
Source: European Social Survey (ESS) 2002.
Remarks: 0-10 scale
Table 2 Proportion of the population who thinks that most people can be trusted by education level in Hungary, 2002
You cannot be too careful
.......................................................... Most people can be trusted
Total Score
primary school 11,8 9,8 13,5 11,5 10,2 24,4 8,2 5,5 2,4 0,5 2,4 100 3,68
secondary school 9,4 6,2 10,8 13,1 11,7 27,0 6,1 7,4 4,8 1,6 1,8 100 4,08
higher education 4,4 4,0 5,5 12,8 14,2 21,3 12,0 12,8 8,8 2,2 1,5 100 4,86
Mean 9,3 7,0 10,7 12,5 11,6 25,2 7,7 7,6 4,6 1,4 1,9 .. 4,08
Source: European Social Survey (ESS) 2002.
Remarks: 0-10 scale
Social Cohesion
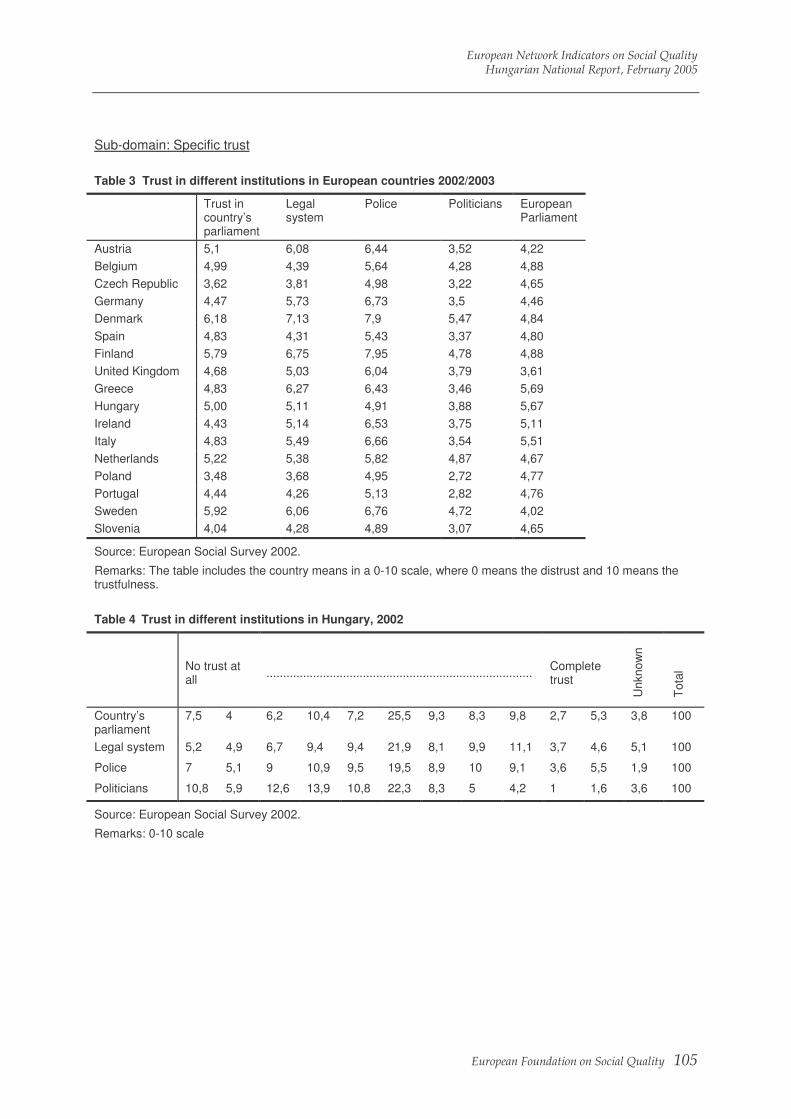
European Network Indicators on Social Quality Hungarian National Report, February 2005
European Foundation on Social Quality 105
Sub-domain: Specific trust
Table 3 Trust in different institutions in European countries 2002/2003
Trust in country’s parliament
Legal system
Police Politicians European Parliament
Austria 5,1 6,08 6,44 3,52 4,22
Belgium 4,99 4,39 5,64 4,28 4,88
Czech Republic 3,62 3,81 4,98 3,22 4,65
Germany 4,47 5,73 6,73 3,5 4,46
Denmark 6,18 7,13 7,9 5,47 4,84
Spain 4,83 4,31 5,43 3,37 4,80
Finland 5,79 6,75 7,95 4,78 4,88
United Kingdom 4,68 5,03 6,04 3,79 3,61
Greece 4,83 6,27 6,43 3,46 5,69
Hungary 5,00 5,11 4,91 3,88 5,67
Ireland 4,43 5,14 6,53 3,75 5,11
Italy 4,83 5,49 6,66 3,54 5,51
Netherlands 5,22 5,38 5,82 4,87 4,67
Poland 3,48 3,68 4,95 2,72 4,77
Portugal 4,44 4,26 5,13 2,82 4,76
Sweden 5,92 6,06 6,76 4,72 4,02
Slovenia 4,04 4,28 4,89 3,07 4,65
Source: European Social Survey 2002.
Remarks: The table includes the country means in a 0-10 scale, where 0 means the distrust and 10 means the trustfulness.
Table 4 Trust in different institutions in Hungary, 2002
No trust at all ................................................................................
Complete trust
Unk
now
n
Tot
al
Country’s parliament
7,5 4 6,2 10,4 7,2 25,5 9,3 8,3 9,8 2,7 5,3 3,8 100
Legal system 5,2 4,9 6,7 9,4 9,4 21,9 8,1 9,9 11,1 3,7 4,6 5,1 100
Police 7 5,1 9 10,9 9,5 19,5 8,9 10 9,1 3,6 5,5 1,9 100
Politicians 10,8 5,9 12,6 13,9 10,8 22,3 8,3 5 4,2 1 1,6 3,6 100
Source: European Social Survey 2002.
Remarks: 0-10 scale
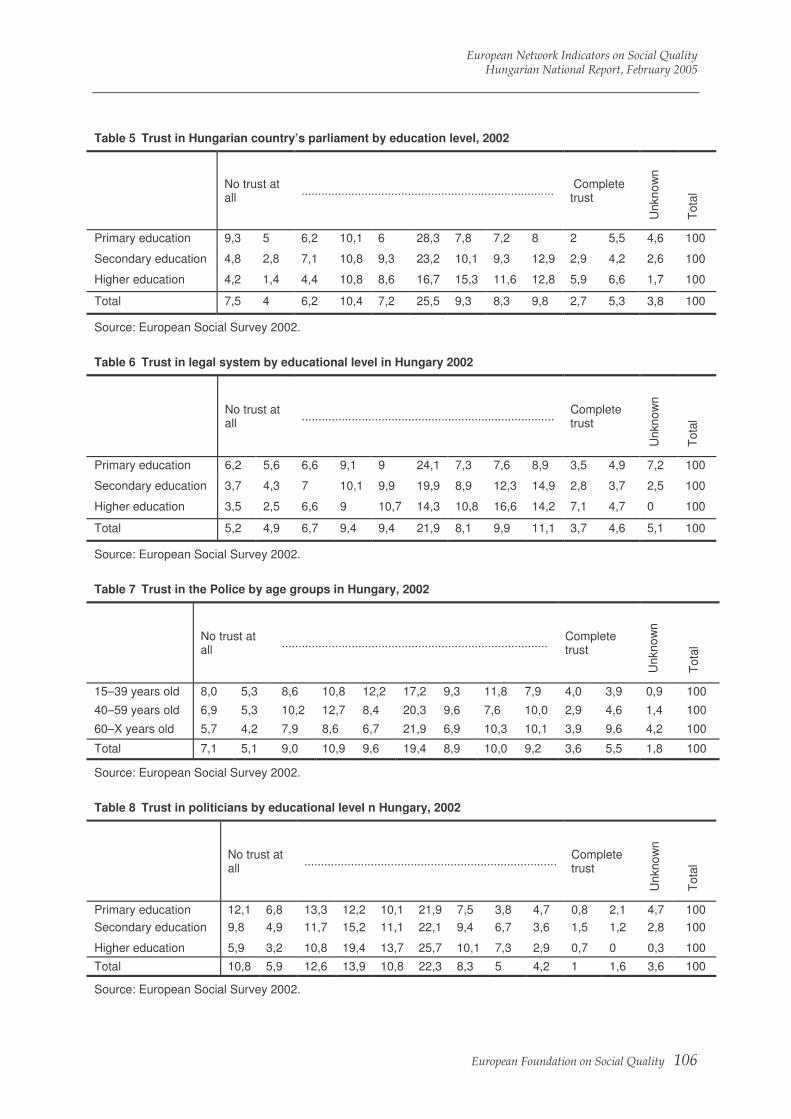
European Network Indicators on Social Quality Hungarian National Report, February 2005
European Foundation on Social Quality 106
Table 5 Trust in Hungarian country’s parliament by education level, 2002
No trust at all
............................................................................ Complete trust
Unk
now
n
Tot
al
Primary education 9,3 5 6,2 10,1 6 28,3 7,8 7,2 8 2 5,5 4,6 100
Secondary education 4,8 2,8 7,1 10,8 9,3 23,2 10,1 9,3 12,9 2,9 4,2 2,6 100
Higher education 4,2 1,4 4,4 10,8 8,6 16,7 15,3 11,6 12,8 5,9 6,6 1,7 100
Total 7,5 4 6,2 10,4 7,2 25,5 9,3 8,3 9,8 2,7 5,3 3,8 100
Source: European Social Survey 2002.
Table 6 Trust in legal system by educational level in Hungary 2002
No trust at all ............................................................................
Complete trust
Unk
now
n
Tot
al
Primary education 6,2 5,6 6,6 9,1 9 24,1 7,3 7,6 8,9 3,5 4,9 7,2 100
Secondary education 3,7 4,3 7 10,1 9,9 19,9 8,9 12,3 14,9 2,8 3,7 2,5 100
Higher education 3,5 2,5 6,6 9 10,7 14,3 10,8 16,6 14,2 7,1 4,7 0 100
Total 5,2 4,9 6,7 9,4 9,4 21,9 8,1 9,9 11,1 3,7 4,6 5,1 100
Source: European Social Survey 2002.
Table 7 Trust in the Police by age groups in Hungary, 2002
No trust at all ................................................................................
Complete trust
Unk
now
n
Tot
al
15–39 years old 8,0 5,3 8,6 10,8 12,2 17,2 9,3 11,8 7,9 4,0 3,9 0,9 100
40–59 years old 6,9 5,3 10,2 12,7 8,4 20,3 9,6 7,6 10,0 2,9 4,6 1,4 100
60–X years old 5,7 4,2 7,9 8,6 6,7 21,9 6,9 10,3 10,1 3,9 9,6 4,2 100
Total 7,1 5,1 9,0 10,9 9,6 19,4 8,9 10,0 9,2 3,6 5,5 1,8 100
Source: European Social Survey 2002.
Table 8 Trust in politicians by educational level n Hungary, 2002
No trust at all
............................................................................ Complete trust
Unk
now
n
Tot
al
Primary education 12,1 6,8 13,3 12,2 10,1 21,9 7,5 3,8 4,7 0,8 2,1 4,7 100
Secondary education 9,8 4,9 11,7 15,2 11,1 22,1 9,4 6,7 3,6 1,5 1,2 2,8 100
Higher education 5,9 3,2 10,8 19,4 13,7 25,7 10,1 7,3 2,9 0,7 0 0,3 100
Total 10,8 5,9 12,6 13,9 10,8 22,3 8,3 5 4,2 1 1,6 3,6 100
Source: European Social Survey 2002.

European Network Indicators on Social Quality Hungarian National Report, February 2005
European Foundation on Social Quality 107
Table 9 Number of Hungarian cases being referred to European Court of Human Right
1999 2000 2001
Provisional files opened 229 358 350
Applications registered 94 162 173
Applications declared inadmissible or struck off 53 67 86
Applications referred to Government for observations 1 12 12
Applications declared admissible 1 1 2
Source: European Court of Human Rights, Survey of Activities 2001. Information document issued by the Registrar of the European Court of Human Rights
Table 10 Proportion of the population for whom work, family, friends, leisure time, politics is quite or very important in its live in different countries (those two answer categories are taken together)
work family friends leisure time politics religion
France 94,8 98,2 94,4 88,1 35,4 36,9
Great Britain 78,6 98,8 96,6 92,5 34,3 37,4
Germany 82,7 96,9 94,5 83,2 39,5 35,0
Austria 92,8 98,4 90,4 86,2 41,4 53,8
Italy 95,0 98,6 89,8 81,2 33,8 72,1
Spain 94,6 98,9 86,6 80,9 19,3 42,0
Portugal 95,1 98,7 87,9 83,7 27,1 75,5
Greece 87,2 99,1 85,5 76,9 34,9 79,7
Belgium 92,8 97,6 89,1 86,2 33,1 47,6
Netherlands 86,5 92,7 96,3 94,0 57,7 39,8
Luxembourg 92,3 98,3 92,3 89,4 41,2 45,1
Denmark 85,0 98,3 94,2 88,9 41,6 27,1
Sweden 91,1 97,9 97,6 93,9 55,0 35,0
Finland 89,2 96,2 95,2 90,0 19,8 45,1
Ireland 84,7 98,5 97,3 86,9 32,1 70,7
Hungary 88,7 97,8 82,3 79,7 18,2 42,3
Slovenia 95,8 97,2 88,3 79,7 14,5 36,6
European Values Study: A third Wave (question 1)
Table 11 Proportion of the population for whom work, family, friends, leisure time, politics is quite or very important in its live in Hungary (those two answer categories are taken together)
Hungary
very rather not not at all
Work 56,8 31,9 7,8 3,5
Family 88,7 9,1 1,4 0,8
Friends 33,8 48,5 15,7 2
Leisure time 31,4 48,3 16,8 3,5
Politics 5,2 13 41,8 39,9
Religion 19,8 22,5 30,7 27,1
Source: European Values Survey 1999/2000, Q1
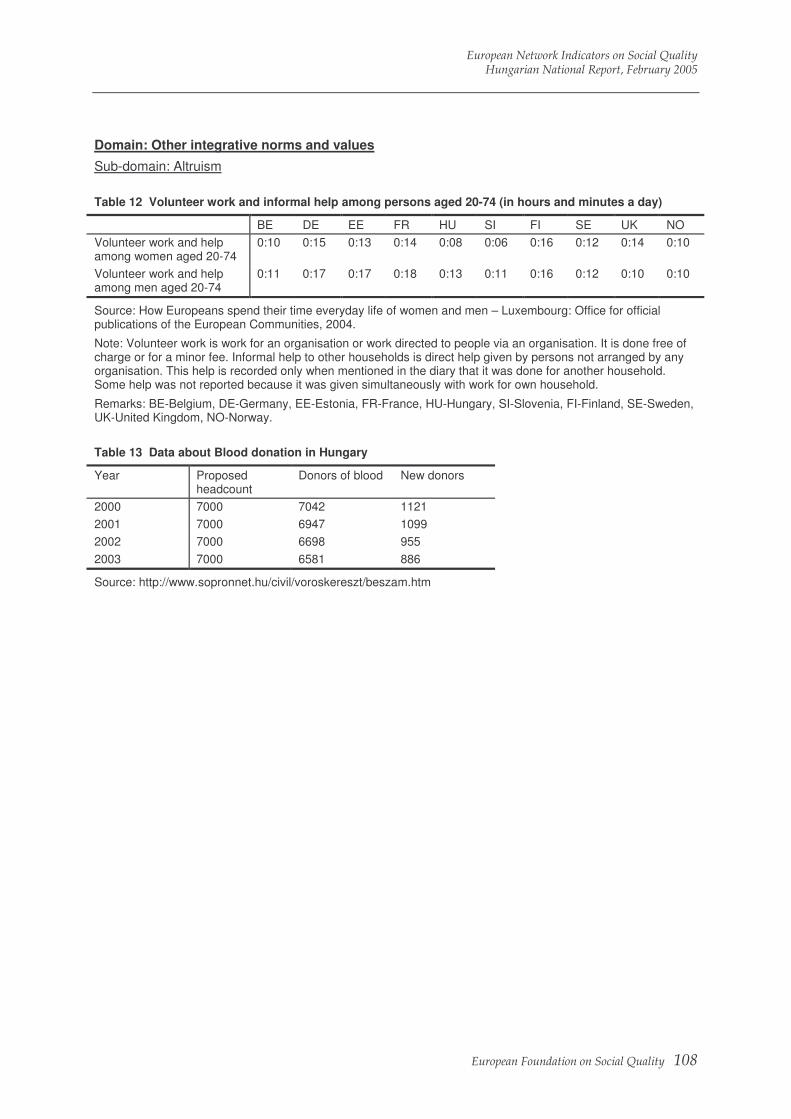
European Network Indicators on Social Quality Hungarian National Report, February 2005
European Foundation on Social Quality 108
Domain: Other integrative norms and values
Sub-domain: Altruism
Table 12 Volunteer work and informal help among persons aged 20-74 (in hours and minutes a day)
BE DE EE FR HU SI FI SE UK NO
Volunteer work and help among women aged 20-74
0:10 0:15 0:13 0:14 0:08 0:06 0:16 0:12 0:14 0:10
Volunteer work and help among men aged 20-74
0:11 0:17 0:17 0:18 0:13 0:11 0:16 0:12 0:10 0:10
Source: How Europeans spend their time everyday life of women and men – Luxembourg: Office for official publications of the European Communities, 2004.
Note: Volunteer work is work for an organisation or work directed to people via an organisation. It is done free of charge or for a minor fee. Informal help to other households is direct help given by persons not arranged by any organisation. This help is recorded only when mentioned in the diary that it was done for another household. Some help was not reported because it was given simultaneously with work for own household.
Remarks: BE-Belgium, DE-Germany, EE-Estonia, FR-France, HU-Hungary, SI-Slovenia, FI-Finland, SE-Sweden, UK-United Kingdom, NO-Norway.
Table 13 Data about Blood donation in Hungary
Year Proposed headcount
Donors of blood New donors
2000 7000 7042 1121
2001 7000 6947 1099
2002 7000 6698 955
2003 7000 6581 886
Source: http://www.sopronnet.hu/civil/voroskereszt/beszam.htm
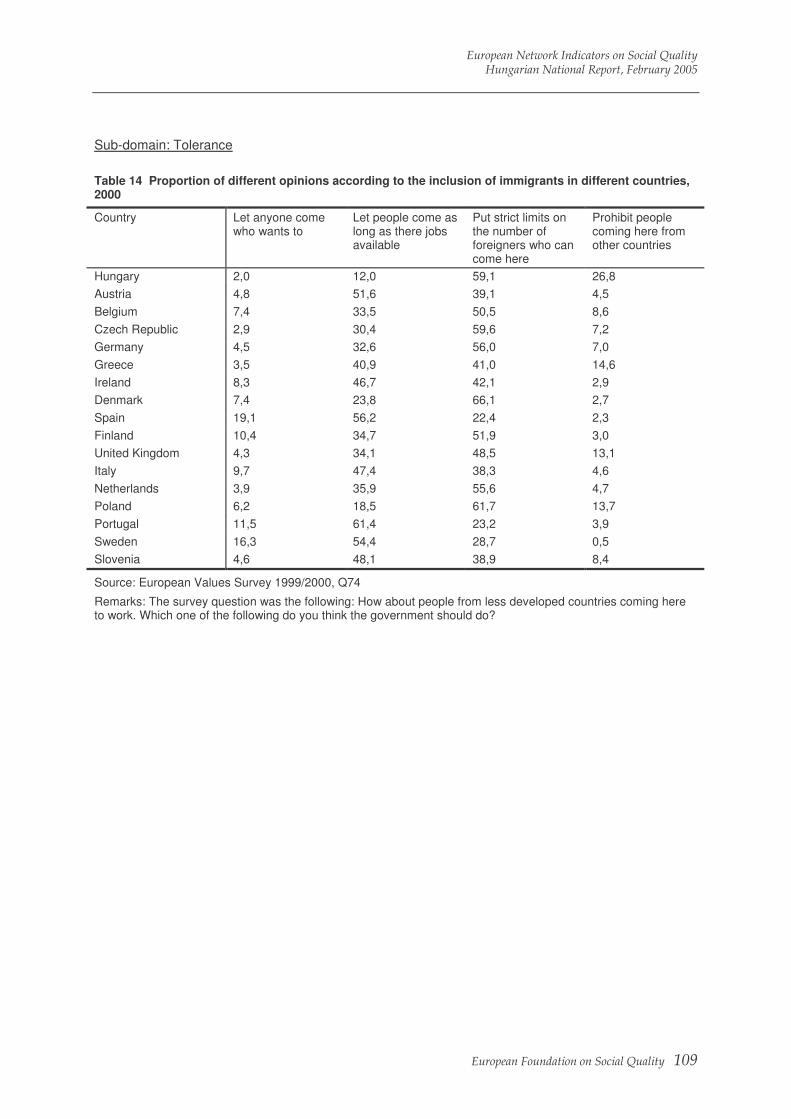
European Network Indicators on Social Quality Hungarian National Report, February 2005
European Foundation on Social Quality 109
Sub-domain: Tolerance
Table 14 Proportion of different opinions according to the inclusion of immigrants in different countries, 2000
Country Let anyone come who wants to
Let people come as long as there jobs available
Put strict limits on the number of foreigners who can come here
Prohibit people coming here from other countries
Hungary 2,0 12,0 59,1 26,8
Austria 4,8 51,6 39,1 4,5
Belgium 7,4 33,5 50,5 8,6
Czech Republic 2,9 30,4 59,6 7,2
Germany 4,5 32,6 56,0 7,0
Greece 3,5 40,9 41,0 14,6
Ireland 8,3 46,7 42,1 2,9
Denmark 7,4 23,8 66,1 2,7
Spain 19,1 56,2 22,4 2,3
Finland 10,4 34,7 51,9 3,0
United Kingdom 4,3 34,1 48,5 13,1
Italy 9,7 47,4 38,3 4,6
Netherlands 3,9 35,9 55,6 4,7
Poland 6,2 18,5 61,7 13,7
Portugal 11,5 61,4 23,2 3,9
Sweden 16,3 54,4 28,7 0,5
Slovenia 4,6 48,1 38,9 8,4
Source: European Values Survey 1999/2000, Q74
Remarks: The survey question was the following: How about people from less developed countries coming here to work. Which one of the following do you think the government should do?
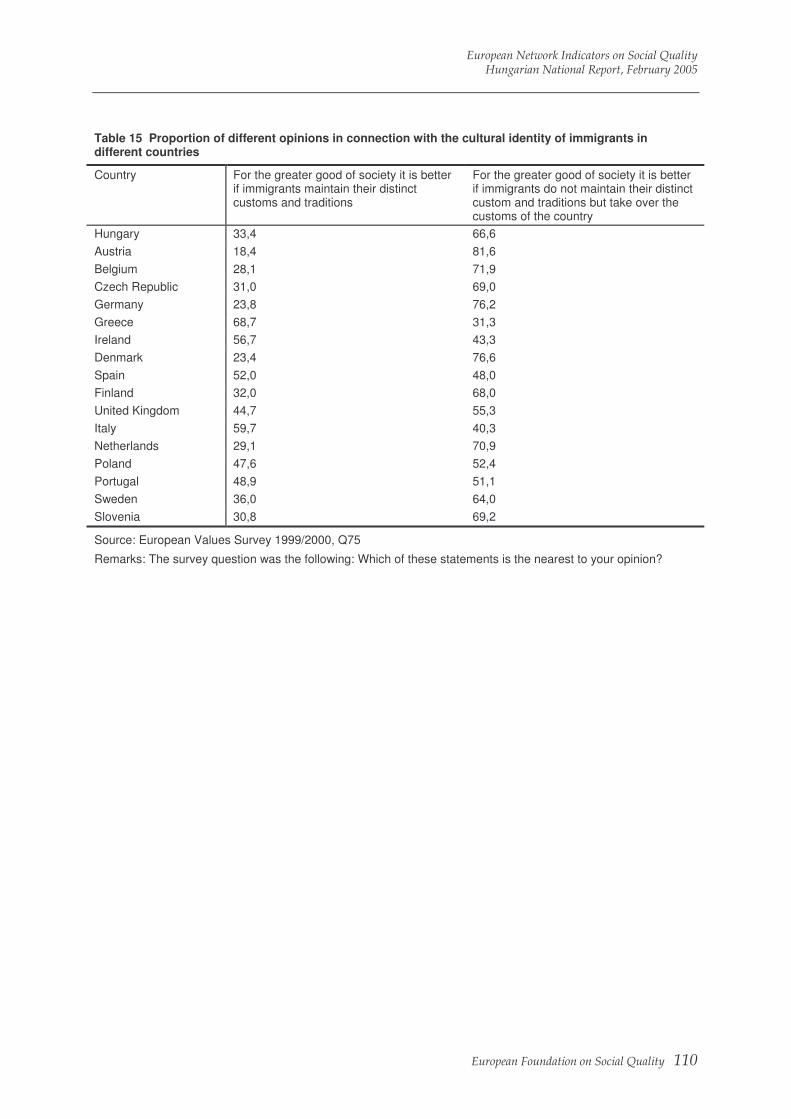
European Network Indicators on Social Quality Hungarian National Report, February 2005
European Foundation on Social Quality 110
Table 15 Proportion of different opinions in connection with the cultural identity of immigrants in different countries
Country For the greater good of society it is better if immigrants maintain their distinct customs and traditions
For the greater good of society it is better if immigrants do not maintain their distinct custom and traditions but take over the customs of the country
Hungary 33,4 66,6
Austria 18,4 81,6
Belgium 28,1 71,9
Czech Republic 31,0 69,0
Germany 23,8 76,2
Greece 68,7 31,3
Ireland 56,7 43,3
Denmark 23,4 76,6
Spain 52,0 48,0
Finland 32,0 68,0
United Kingdom 44,7 55,3
Italy 59,7 40,3
Netherlands 29,1 70,9
Poland 47,6 52,4
Portugal 48,9 51,1
Sweden 36,0 64,0
Slovenia 30,8 69,2
Source: European Values Survey 1999/2000, Q75
Remarks: The survey question was the following: Which of these statements is the nearest to your opinion?
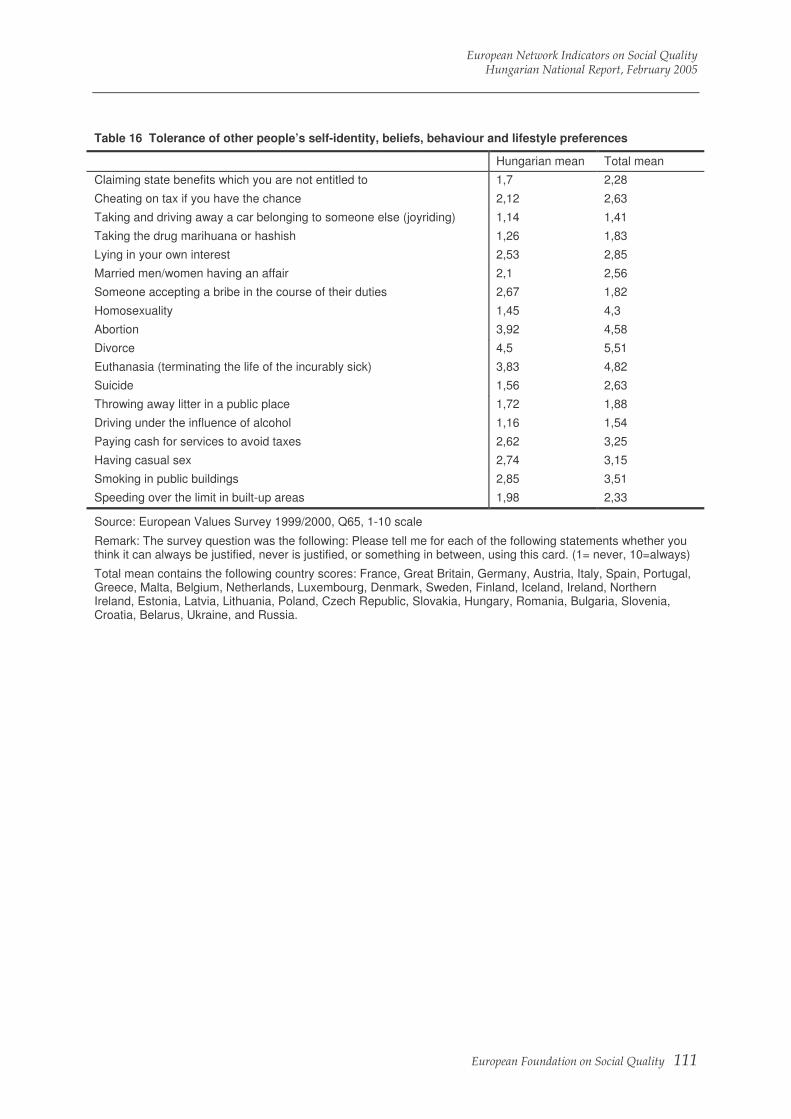
European Network Indicators on Social Quality Hungarian National Report, February 2005
European Foundation on Social Quality 111
Table 16 Tolerance of other people’s self-identity, beliefs, behaviour and lifestyle preferences
Hungarian mean Total mean
Claiming state benefits which you are not entitled to 1,7 2,28
Cheating on tax if you have the chance 2,12 2,63
Taking and driving away a car belonging to someone else (joyriding) 1,14 1,41
Taking the drug marihuana or hashish 1,26 1,83
Lying in your own interest 2,53 2,85
Married men/women having an affair 2,1 2,56
Someone accepting a bribe in the course of their duties 2,67 1,82
Homosexuality 1,45 4,3
Abortion 3,92 4,58
Divorce 4,5 5,51
Euthanasia (terminating the life of the incurably sick) 3,83 4,82
Suicide 1,56 2,63
Throwing away litter in a public place 1,72 1,88
Driving under the influence of alcohol 1,16 1,54
Paying cash for services to avoid taxes 2,62 3,25
Having casual sex 2,74 3,15
Smoking in public buildings 2,85 3,51
Speeding over the limit in built-up areas 1,98 2,33
Source: European Values Survey 1999/2000, Q65, 1-10 scale
Remark: The survey question was the following: Please tell me for each of the following statements whether you think it can always be justified, never is justified, or something in between, using this card. (1= never, 10=always)
Total mean contains the following country scores: France, Great Britain, Germany, Austria, Italy, Spain, Portugal, Greece, Malta, Belgium, Netherlands, Luxembourg, Denmark, Sweden, Finland, Iceland, Ireland, Northern Ireland, Estonia, Latvia, Lithuania, Poland, Czech Republic, Slovakia, Hungary, Romania, Bulgaria, Slovenia, Croatia, Belarus, Ukraine, and Russia.
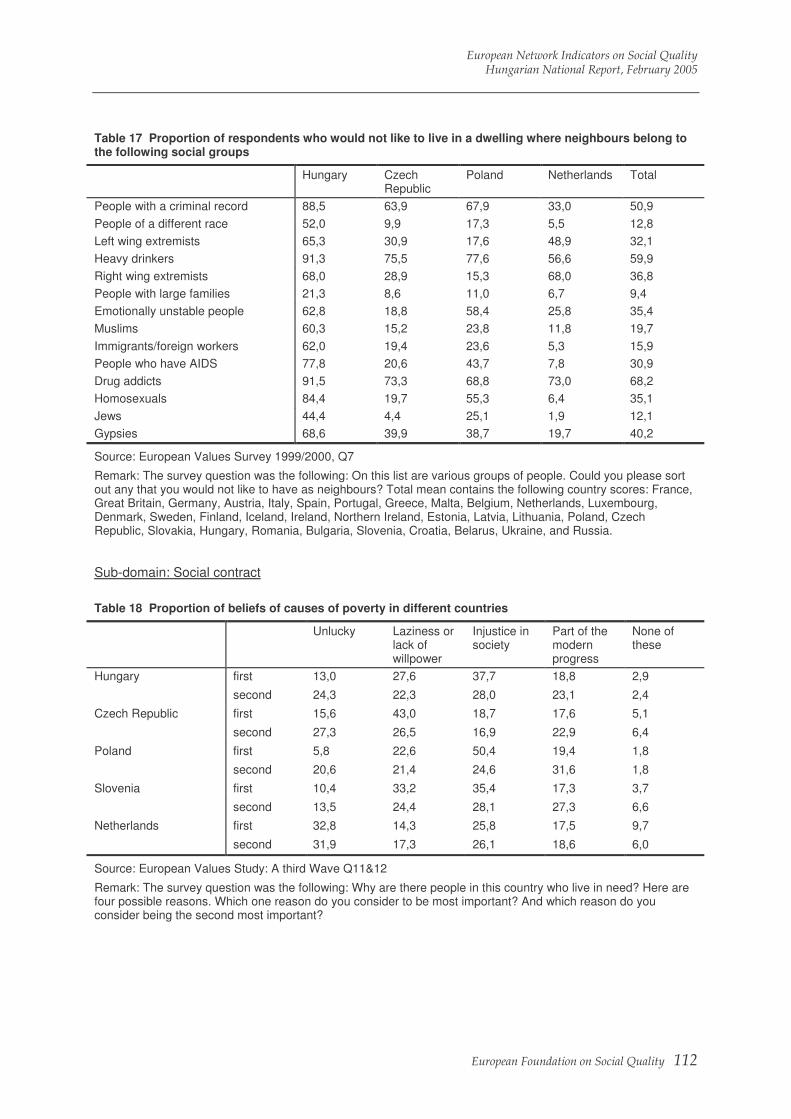
European Network Indicators on Social Quality Hungarian National Report, February 2005
European Foundation on Social Quality 112
Table 17 Proportion of respondents who would not like to live in a dwelling where neighbours belong to the following social groups
Hungary Czech Republic
Poland Netherlands Total
People with a criminal record 88,5 63,9 67,9 33,0 50,9
People of a different race 52,0 9,9 17,3 5,5 12,8
Left wing extremists 65,3 30,9 17,6 48,9 32,1
Heavy drinkers 91,3 75,5 77,6 56,6 59,9
Right wing extremists 68,0 28,9 15,3 68,0 36,8
People with large families 21,3 8,6 11,0 6,7 9,4
Emotionally unstable people 62,8 18,8 58,4 25,8 35,4
Muslims 60,3 15,2 23,8 11,8 19,7
Immigrants/foreign workers 62,0 19,4 23,6 5,3 15,9
People who have AIDS 77,8 20,6 43,7 7,8 30,9
Drug addicts 91,5 73,3 68,8 73,0 68,2
Homosexuals 84,4 19,7 55,3 6,4 35,1
Jews 44,4 4,4 25,1 1,9 12,1
Gypsies 68,6 39,9 38,7 19,7 40,2
Source: European Values Survey 1999/2000, Q7
Remark: The survey question was the following: On this list are various groups of people. Could you please sort out any that you would not like to have as neighbours? Total mean contains the following country scores: France, Great Britain, Germany, Austria, Italy, Spain, Portugal, Greece, Malta, Belgium, Netherlands, Luxembourg, Denmark, Sweden, Finland, Iceland, Ireland, Northern Ireland, Estonia, Latvia, Lithuania, Poland, Czech Republic, Slovakia, Hungary, Romania, Bulgaria, Slovenia, Croatia, Belarus, Ukraine, and Russia.
Sub-domain: Social contract
Table 18 Proportion of beliefs of causes of poverty in different countries
Unlucky Laziness or lack of willpower
Injustice in society
Part of the modern progress
None of these
first 13,0 27,6 37,7 18,8 2,9 Hungary
second 24,3 22,3 28,0 23,1 2,4
first 15,6 43,0 18,7 17,6 5,1 Czech Republic
second 27,3 26,5 16,9 22,9 6,4
first 5,8 22,6 50,4 19,4 1,8 Poland
second 20,6 21,4 24,6 31,6 1,8
first 10,4 33,2 35,4 17,3 3,7 Slovenia
second 13,5 24,4 28,1 27,3 6,6
first 32,8 14,3 25,8 17,5 9,7 Netherlands
second 31,9 17,3 26,1 18,6 6,0
Source: European Values Study: A third Wave Q11&12
Remark: The survey question was the following: Why are there people in this country who live in need? Here are four possible reasons. Which one reason do you consider to be most important? And which reason do you consider being the second most important?
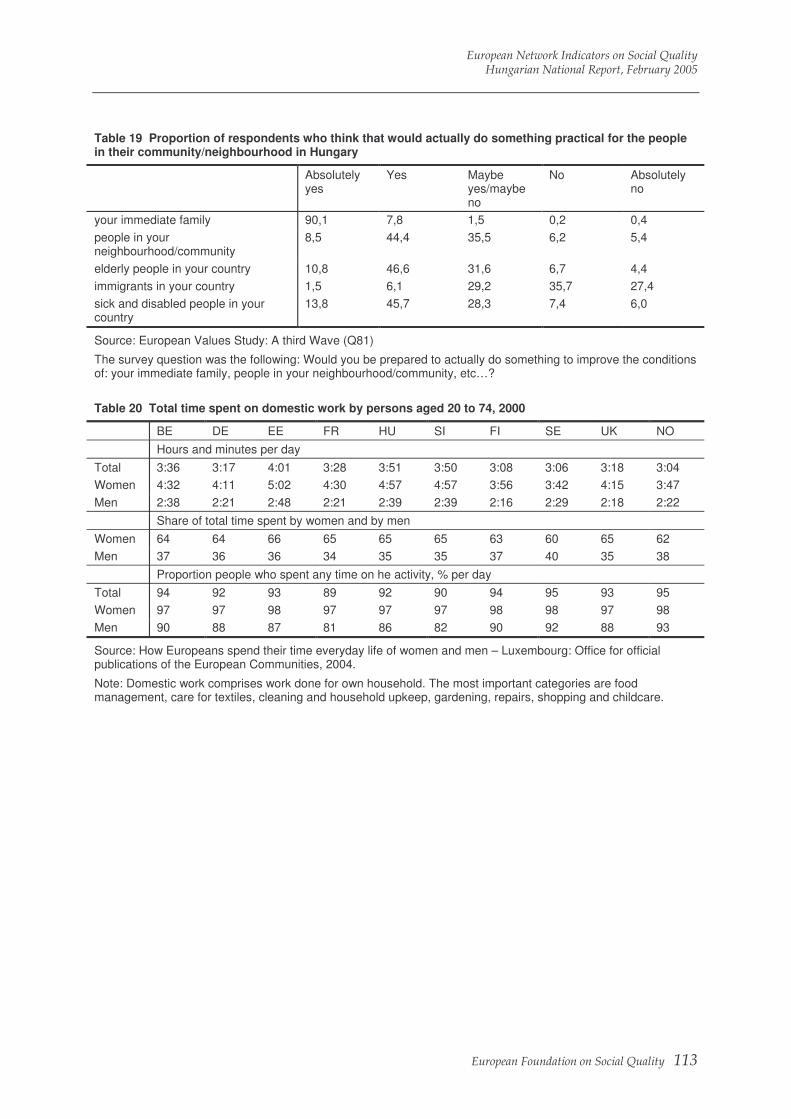
European Network Indicators on Social Quality Hungarian National Report, February 2005
European Foundation on Social Quality 113
Table 19 Proportion of respondents who think that would actually do something practical for the people in their community/neighbourhood in Hungary
Absolutely yes
Yes Maybe yes/maybe no
No Absolutely no
your immediate family 90,1 7,8 1,5 0,2 0,4
people in your neighbourhood/community
8,5 44,4 35,5 6,2 5,4
elderly people in your country 10,8 46,6 31,6 6,7 4,4
immigrants in your country 1,5 6,1 29,2 35,7 27,4
sick and disabled people in your country
13,8 45,7 28,3 7,4 6,0
Source: European Values Study: A third Wave (Q81)
The survey question was the following: Would you be prepared to actually do something to improve the conditions of: your immediate family, people in your neighbourhood/community, etc…?
Table 20 Total time spent on domestic work by persons aged 20 to 74, 2000
BE DE EE FR HU SI FI SE UK NO
Hours and minutes per day
Total 3:36 3:17 4:01 3:28 3:51 3:50 3:08 3:06 3:18 3:04
Women 4:32 4:11 5:02 4:30 4:57 4:57 3:56 3:42 4:15 3:47
Men 2:38 2:21 2:48 2:21 2:39 2:39 2:16 2:29 2:18 2:22
Share of total time spent by women and by men
Women 64 64 66 65 65 65 63 60 65 62
Men 37 36 36 34 35 35 37 40 35 38
Proportion people who spent any time on he activity, % per day
Total 94 92 93 89 92 90 94 95 93 95
Women 97 97 98 97 97 97 98 98 97 98
Men 90 88 87 81 86 82 90 92 88 93
Source: How Europeans spend their time everyday life of women and men – Luxembourg: Office for official publications of the European Communities, 2004.
Note: Domestic work comprises work done for own household. The most important categories are food management, care for textiles, cleaning and household upkeep, gardening, repairs, shopping and childcare.

European Network Indicators on Social Quality Hungarian National Report, February 2005
European Foundation on Social Quality 114
Table 21 Childcare among parents living as couple with children aged up to 6
BE DE EE FR HU SI FI SE UK NO
All parents living as couple
Hours and minutes per day
Total 1:21 1:39 1:46 1:19 2:03 1:39 1:50 1:39 1:41 1:44
Women 1:54 2:18 2:39 1:57 2:56 2:23 2:34 2:10 2:22 2:17
Men 0:51 0:59 0:50 0:40 1:11 0:56 1:03 1:07 1:00 1:13
Share of total time spent by women and by men, %
Women 69 70 76 75 71 72 71 66 70 65
Men 31 30 24 25 29 28 29 34 30 35
Proportion of people who spent any time on he activity, % per day
Total 82 84 77 73 82 77 84 88 82 89
Women 94 95 93 91 94 91 96 96 94 97
Men 70 73 59 55 69 62 72 79 70 80
Employed parents living as couple
Hours and minutes per day
Women 1:40 1:44 1:40 1:41 1:58 2:16 2:02 2:08 2:08 2:11
Men 0:50 0:57 0:50 0:37 1:09 0:55 1:01 1:07 0:58 1:12
Source: How Europeans spend their time everyday life of women and men – Luxembourg: Office for official publications of the European Communities, 2004.
Note: Childcare includes of active care given to a child living in own household. In addition to physical care, teaching, reading, playing and talking with a child, accompanying a child to a doctor, visiting the school, and so on, are also included. Going together to the cinema, watching television with a child, and so on, are excluded. Only parents living as a couple are included. Childcare as a simultaneous activity, for example, while preparing food, is not included.
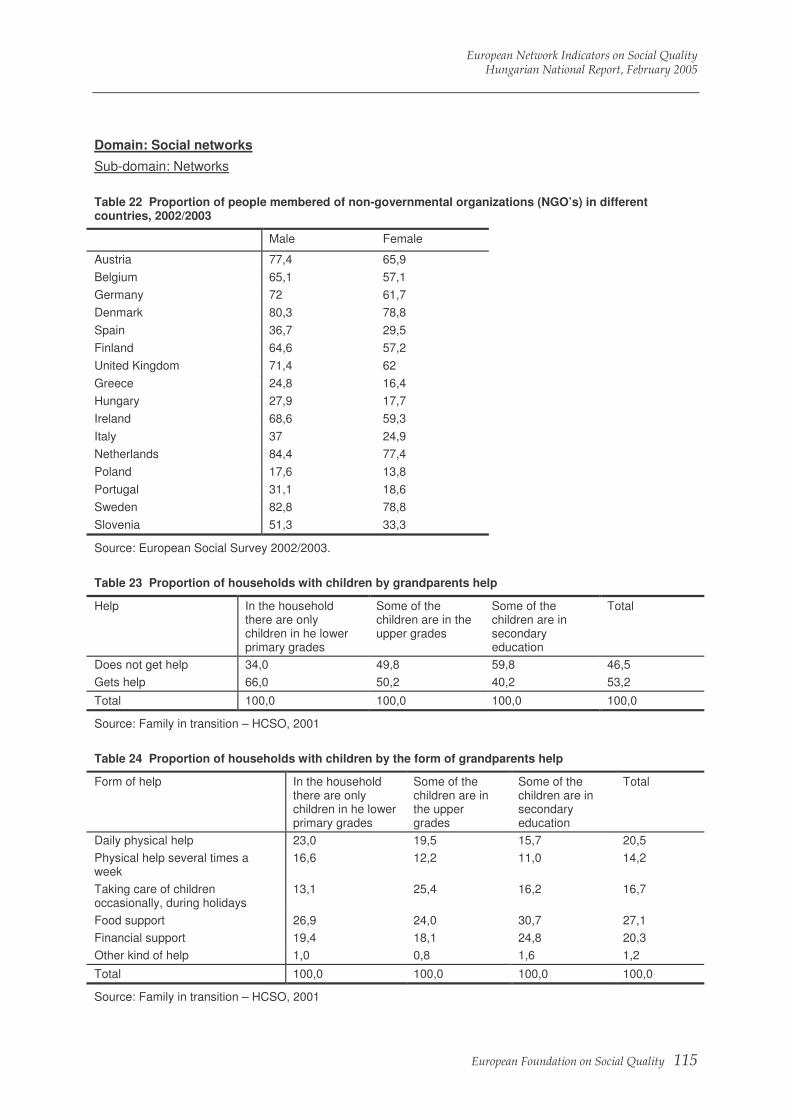
European Network Indicators on Social Quality Hungarian National Report, February 2005
European Foundation on Social Quality 115
Domain: Social networks
Sub-domain: Networks
Table 22 Proportion of people membered of non-governmental organizations (NGO’s) in different countries, 2002/2003
Male Female
Austria 77,4 65,9
Belgium 65,1 57,1
Germany 72 61,7
Denmark 80,3 78,8
Spain 36,7 29,5
Finland 64,6 57,2
United Kingdom 71,4 62
Greece 24,8 16,4
Hungary 27,9 17,7
Ireland 68,6 59,3
Italy 37 24,9
Netherlands 84,4 77,4
Poland 17,6 13,8
Portugal 31,1 18,6
Sweden 82,8 78,8
Slovenia 51,3 33,3
Source: European Social Survey 2002/2003.
Table 23 Proportion of households with children by grandparents help
Help In the household there are only children in he lower primary grades
Some of the children are in the upper grades
Some of the children are in secondary education
Total
Does not get help 34,0 49,8 59,8 46,5
Gets help 66,0 50,2 40,2 53,2
Total 100,0 100,0 100,0 100,0
Source: Family in transition – HCSO, 2001
Table 24 Proportion of households with children by the form of grandparents help
Form of help In the household there are only children in he lower primary grades
Some of the children are in the upper grades
Some of the children are in secondary education
Total
Daily physical help 23,0 19,5 15,7 20,5
Physical help several times a week
16,6 12,2 11,0 14,2
Taking care of children occasionally, during holidays
13,1 25,4 16,2 16,7
Food support 26,9 24,0 30,7 27,1
Financial support 19,4 18,1 24,8 20,3
Other kind of help 1,0 0,8 1,6 1,2
Total 100,0 100,0 100,0 100,0
Source: Family in transition – HCSO, 2001
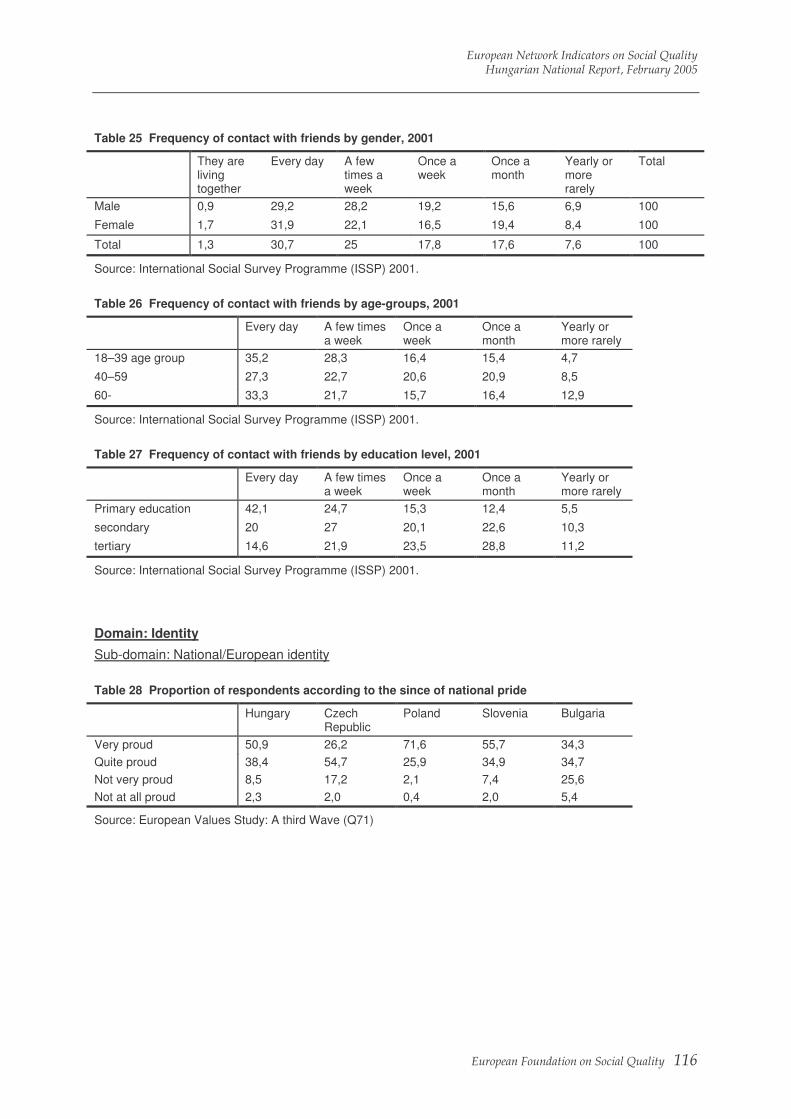
European Network Indicators on Social Quality Hungarian National Report, February 2005
European Foundation on Social Quality 116
Table 25 Frequency of contact with friends by gender, 2001
They are living together
Every day A few times a week
Once a week
Once a month
Yearly or more rarely
Total
Male 0,9 29,2 28,2 19,2 15,6 6,9 100
Female 1,7 31,9 22,1 16,5 19,4 8,4 100
Total 1,3 30,7 25 17,8 17,6 7,6 100
Source: International Social Survey Programme (ISSP) 2001.
Table 26 Frequency of contact with friends by age-groups, 2001
Every day A few times a week
Once a week
Once a month
Yearly or more rarely
18–39 age group 35,2 28,3 16,4 15,4 4,7
40–59 27,3 22,7 20,6 20,9 8,5
60- 33,3 21,7 15,7 16,4 12,9
Source: International Social Survey Programme (ISSP) 2001.
Table 27 Frequency of contact with friends by education level, 2001
Every day A few times a week
Once a week
Once a month
Yearly or more rarely
Primary education 42,1 24,7 15,3 12,4 5,5
secondary 20 27 20,1 22,6 10,3
tertiary 14,6 21,9 23,5 28,8 11,2
Source: International Social Survey Programme (ISSP) 2001.
Domain: Identity
Sub-domain: National/European identity
Table 28 Proportion of respondents according to the since of national pride
Hungary Czech Republic
Poland Slovenia Bulgaria
Very proud 50,9 26,2 71,6 55,7 34,3
Quite proud 38,4 54,7 25,9 34,9 34,7
Not very proud 8,5 17,2 2,1 7,4 25,6
Not at all proud 2,3 2,0 0,4 2,0 5,4
Source: European Values Study: A third Wave (Q71)

European Network Indicators on Social Quality Hungarian National Report, February 2005
European Foundation on Social Quality 117
Table 29 Proportion of people by self-identification in different countries, 2003
Nationality Nationality and European
European and Nationality
European
Hungary 51 44 3 1
Czech Republic 40 41 6 4
Poland 32 51 10 3
Slovenia 31 60 3 2
Bulgaria 42 40 5 1
EU15 40 47 7 3
Source: Eurobarometer EB60 – CC-EB 2003. 4 – (Candidate Countries) Comparative highlights.
Sub-domain: Regional/community/local identity
Table 30 Proportion of people by attachement to different geographical areas in different countries
Hungary Czech Republic
Poland Slovenia Bulgaria
Locality or town where you live 67,3 42,9 62,7 52,8 47,0
Region of country where you live 6,3 13,7 15,0 8,7 4,7
Your country as a whole 20,1 35,5 19,1 32,1 41,0
Europe 2,0 2,7 2,3 2,4 3,8
The world as a whole 4,3 5,3 0,9 3,9 3,5
Source: European Values Study: A third Wave Q67
The survey question was the following: Which of these geographical groups would you say you belong
to first of all?
Table 31 Proportion of people by attachement to different geographical areas in Hungary
First of all Next Least of all
Locality or town where you live 67,3 16,2 6,3
Region of country where you live 6,3 38,8 3,1
Your country as a whole 20,1 36,4 11,1
Europe 2,0 6,1 12,9
The world as a whole 4,3 2,5 66,6
Source: European Values Study: A third Wave Q67
The survey question was the following: Which of these geographical groups would you say you belong to first of all?

European Network Indicators on Social Quality Hungarian National Report, February 2005
European Foundation on Social Quality 118
Domain: Knowledge base
Sub-domain: Availability of information
Table 1 Percentage of population illiterate
1998 2000 2003
Female 0,9 0,8 0,7
Male 0,6 0,5 0,5
Total 0,7 0,7 0,6
Source: ILO: 2003-2004 Key Indicators of the Labour Market (Geneva, 2003) http://www.ilo.org/kilm
Notes: The data from 1995-2001 are UNESCO literacy estimates as assessed in February 2000, based on statistics collected during national population census.
Table 2 Competence poverty: proportion of educationally „poor” individuals in different countries based on literacy competences
Country Students aged 15
Population aged 16-65
Portugal 26,3 49,1
Greece 24,4 -
Poland 23,3 45,4
Hungary 22,7 32,9
Germany 22,6 9,0
Belgium 19,0 15,3
Italy 18,9 -
Denmark 17,9 7,8
Czech Republic 17,5 14,3
France 15,2 -
Austria 14,6 -
UK 12,8 23,3
Sweden 12,6 6,2
Ireland 11,0 25,3
Finland 6,9 12,6
Source: PISA2000; Adult Literacy Survey, 1994-98
Table 3 Proportion of Internet users in Hungary, 2003
Overall internet users Use internet at least once a month
Use internet at least once a week
14 and older 25 22 19
15 and older 25 21 19
18 and older 22 19 17
Source: Hungarian Report of World Internet Project 2003
Social Empowerment
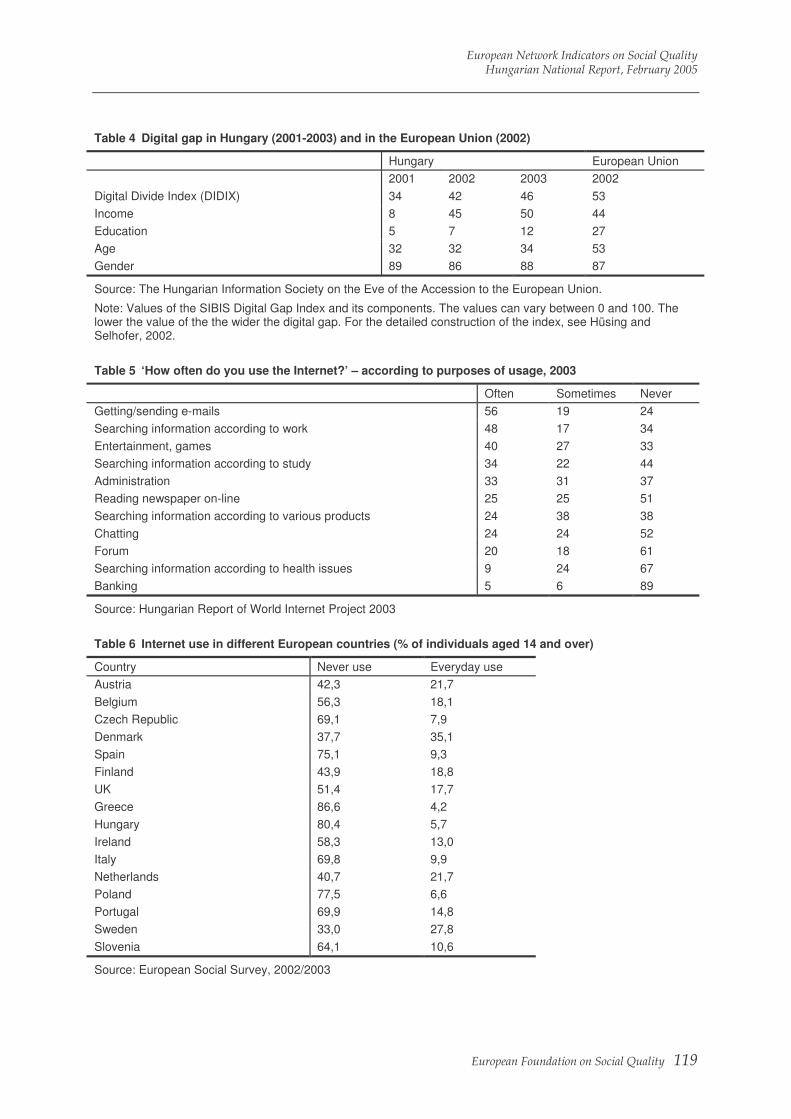
European Network Indicators on Social Quality Hungarian National Report, February 2005
European Foundation on Social Quality 119
Table 4 Digital gap in Hungary (2001-2003) and in the European Union (2002)
Hungary European Union
2001 2002 2003 2002
Digital Divide Index (DIDIX) 34 42 46 53
Income 8 45 50 44
Education 5 7 12 27
Age 32 32 34 53
Gender 89 86 88 87
Source: The Hungarian Information Society on the Eve of the Accession to the European Union.
Note: Values of the SIBIS Digital Gap Index and its components. The values can vary between 0 and 100. The lower the value of the the wider the digital gap. For the detailed construction of the index, see Hüsing and Selhofer, 2002.
Table 5 ‘How often do you use the Internet?’ – according to purposes of usage, 2003
Often Sometimes Never
Getting/sending e-mails 56 19 24
Searching information according to work 48 17 34
Entertainment, games 40 27 33
Searching information according to study 34 22 44
Administration 33 31 37
Reading newspaper on-line 25 25 51
Searching information according to various products 24 38 38
Chatting 24 24 52
Forum 20 18 61
Searching information according to health issues 9 24 67
Banking 5 6 89
Source: Hungarian Report of World Internet Project 2003
Table 6 Internet use in different European countries (% of individuals aged 14 and over)
Country Never use Everyday use
Austria 42,3 21,7
Belgium 56,3 18,1
Czech Republic 69,1 7,9
Denmark 37,7 35,1
Spain 75,1 9,3
Finland 43,9 18,8
UK 51,4 17,7
Greece 86,6 4,2
Hungary 80,4 5,7
Ireland 58,3 13,0
Italy 69,8 9,9
Netherlands 40,7 21,7
Poland 77,5 6,6
Portugal 69,9 14,8
Sweden 33,0 27,8
Slovenia 64,1 10,6
Source: European Social Survey, 2002/2003

European Network Indicators on Social Quality Hungarian National Report, February 2005
European Foundation on Social Quality 120
Table 7 Rate of television subscription and average weekly broadcast time in non-commercial television channels
Year Subscriptions per 1000 inhabitants
Average weekly broadcast time (hours) a)
1990 283 151
1993 274 219
1995 261 217
1997 256 367
1999 267 402
Source: Cultural conditions in the nineties, HCSO, Budapest, 2001
Note: a) state owned television channels (TV1 and 2), from 1996 with broadcast time of a Duna Television.
Sub-domain: User friendliness of information
Table 8 Availability of free advocacy and guidance centres
Advocacy and guidance centres
Number of centres Number of patients (thousand)
Number of employed in the centres*
1998 462 246,4 2142
1999 558 286,4 2294
2000 660 273,9 2291
2001 776 290,4 2820
2002 805 310,4 2455
2003 777 307,3 2587
Source:
* Calculated to number of full time employed.
Domain: Labour market
Sub-domain: Control over employment contract
Table 9 Trade union membership by age and sex, 2001
Employees in trade unions %
Men Women Total
15-19 3,2 2,0 2,7
20-24 6,6 9,7 7,9
25-29 10,4 15,9 12,7
30-39 18,4 22,2 20,1
40-54 22,2 27,3 24,9
55-59 26,2 28,8 27,1
60-74 25,0 19,4 22,8
Total 17,3 22,4 19,7
Of which working age* 17,3 22,3 19,7
Source: LFS in Lakatos 2001.
* Men aged 15-64, Women aged 15-57
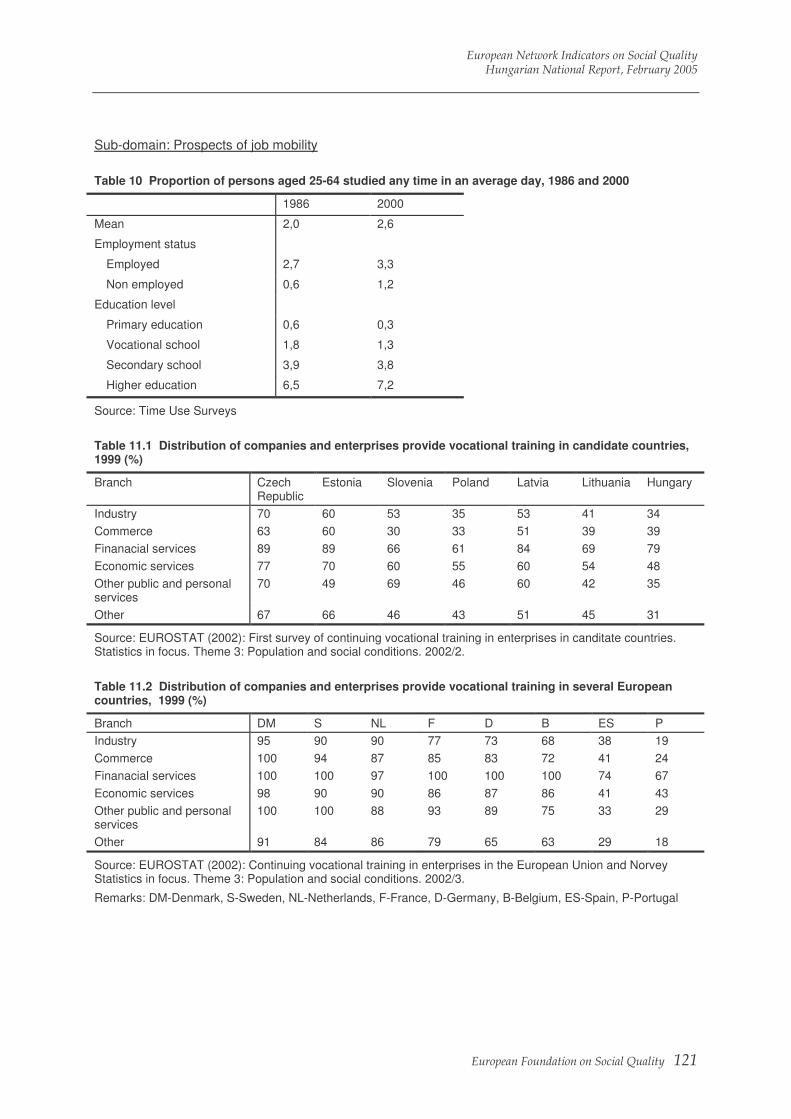
European Network Indicators on Social Quality Hungarian National Report, February 2005
European Foundation on Social Quality 121
Sub-domain: Prospects of job mobility
Table 10 Proportion of persons aged 25-64 studied any time in an average day, 1986 and 2000
1986 2000
Mean 2,0 2,6
Employment status
Employed 2,7 3,3
Non employed 0,6 1,2
Education level
Primary education 0,6 0,3
Vocational school 1,8 1,3
Secondary school 3,9 3,8
Higher education 6,5 7,2
Source: Time Use Surveys
Table 11.1 Distribution of companies and enterprises provide vocational training in candidate countries, 1999 (%)
Branch Czech Republic
Estonia Slovenia Poland Latvia Lithuania Hungary
Industry 70 60 53 35 53 41 34
Commerce 63 60 30 33 51 39 39
Finanacial services 89 89 66 61 84 69 79
Economic services 77 70 60 55 60 54 48
Other public and personal services
70 49 69 46 60 42 35
Other 67 66 46 43 51 45 31
Source: EUROSTAT (2002): First survey of continuing vocational training in enterprises in canditate countries. Statistics in focus. Theme 3: Population and social conditions. 2002/2.
Table 11.2 Distribution of companies and enterprises provide vocational training in several European countries, 1999 (%)
Branch DM S NL F D B ES P
Industry 95 90 90 77 73 68 38 19
Commerce 100 94 87 85 83 72 41 24
Finanacial services 100 100 97 100 100 100 74 67
Economic services 98 90 90 86 87 86 41 43
Other public and personal services
100 100 88 93 89 75 33 29
Other 91 84 86 79 65 63 29 18
Source: EUROSTAT (2002): Continuing vocational training in enterprises in the European Union and Norvey Statistics in focus. Theme 3: Population and social conditions. 2002/3.
Remarks: DM-Denmark, S-Sweden, NL-Netherlands, F-France, D-Germany, B-Belgium, ES-Spain, P-Portugal
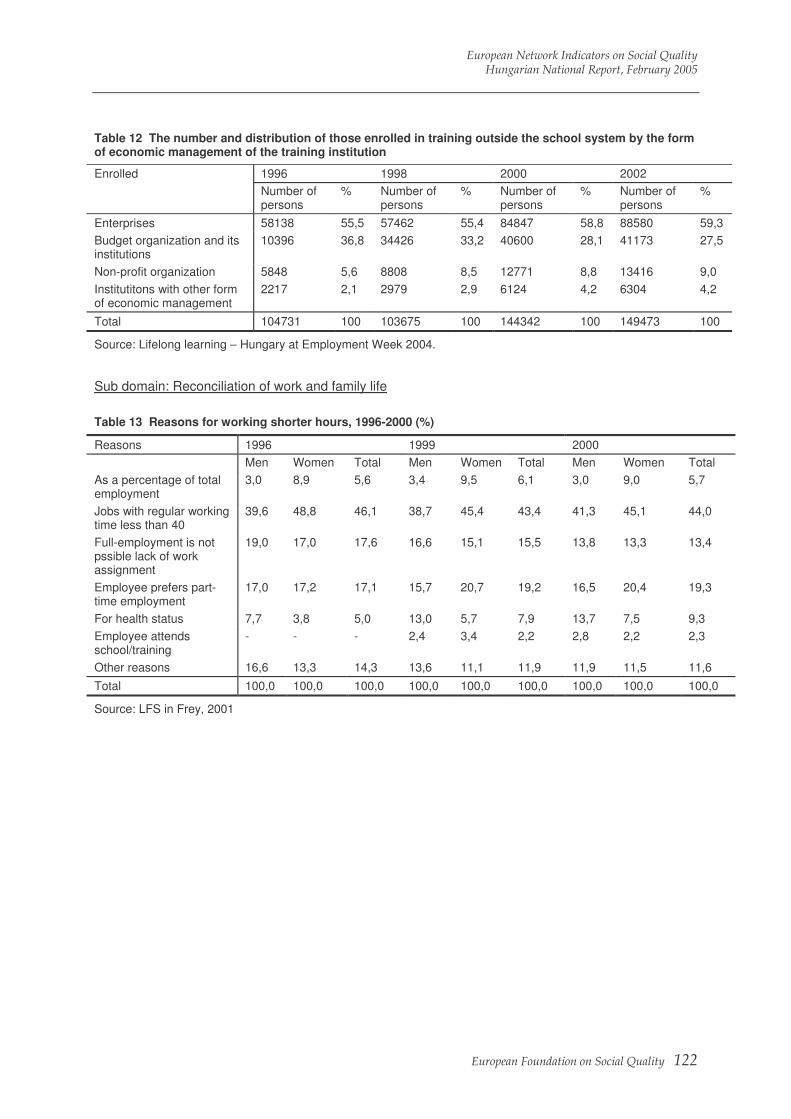
European Network Indicators on Social Quality Hungarian National Report, February 2005
European Foundation on Social Quality 122
Table 12 The number and distribution of those enrolled in training outside the school system by the form of economic management of the training institution
1996 1998 2000 2002 Enrolled
Number of persons
% Number of persons
% Number of persons
% Number of persons
%
Enterprises 58138 55,5 57462 55,4 84847 58,8 88580 59,3
Budget organization and its institutions
10396 36,8 34426 33,2 40600 28,1 41173 27,5
Non-profit organization 5848 5,6 8808 8,5 12771 8,8 13416 9,0
Institutitons with other form of economic management
2217 2,1 2979 2,9 6124 4,2 6304 4,2
Total 104731 100 103675 100 144342 100 149473 100
Source: Lifelong learning – Hungary at Employment Week 2004.
Sub domain: Reconciliation of work and family life
Table 13 Reasons for working shorter hours, 1996-2000 (%)
Reasons 1996 1999 2000
Men Women Total Men Women Total Men Women Total
As a percentage of total employment
3,0 8,9 5,6 3,4 9,5 6,1 3,0 9,0 5,7
Jobs with regular working time less than 40
39,6 48,8 46,1 38,7 45,4 43,4 41,3 45,1 44,0
Full-employment is not pssible lack of work assignment
19,0 17,0 17,6 16,6 15,1 15,5 13,8 13,3 13,4
Employee prefers part-time employment
17,0 17,2 17,1 15,7 20,7 19,2 16,5 20,4 19,3
For health status 7,7 3,8 5,0 13,0 5,7 7,9 13,7 7,5 9,3
Employee attends school/training
- - - 2,4 3,4 2,2 2,8 2,2 2,3
Other reasons 16,6 13,3 14,3 13,6 11,1 11,9 11,9 11,5 11,6
Total 100,0 100,0 100,0 100,0 100,0 100,0 100,0 100,0 100,0
Source: LFS in Frey, 2001
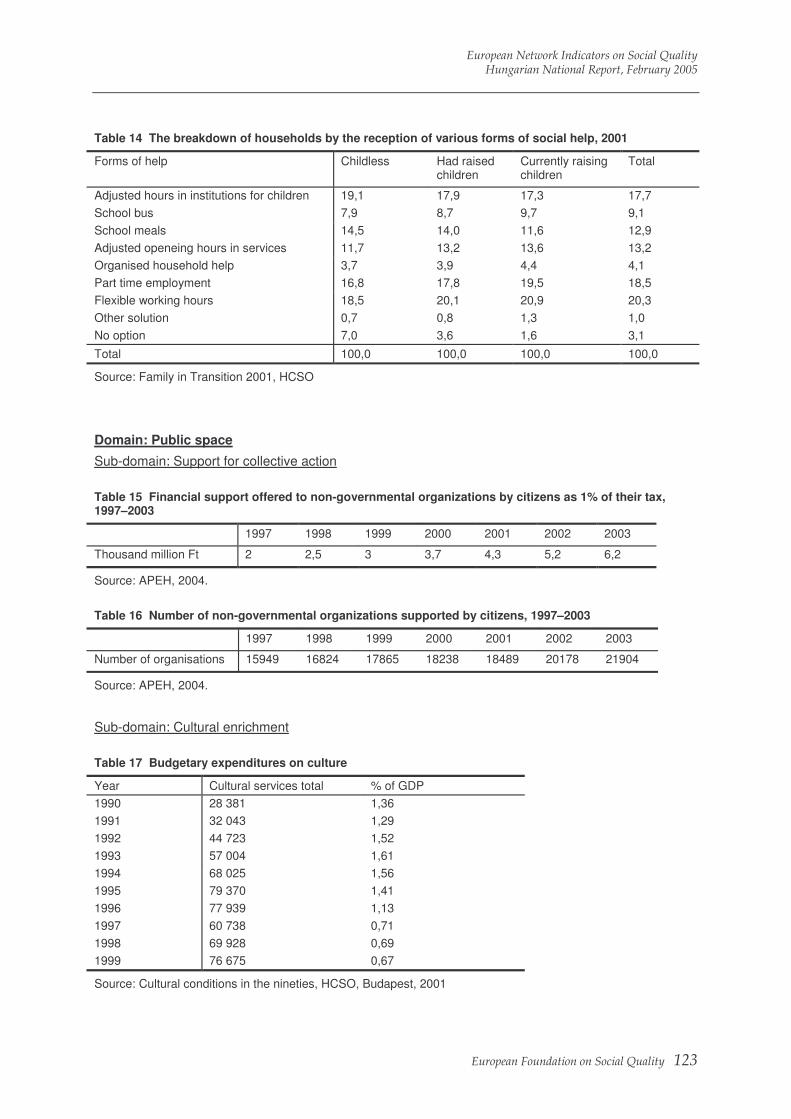
European Network Indicators on Social Quality Hungarian National Report, February 2005
European Foundation on Social Quality 123
Table 14 The breakdown of households by the reception of various forms of social help, 2001
Forms of help Childless Had raised children
Currently raising children
Total
Adjusted hours in institutions for children 19,1 17,9 17,3 17,7
School bus 7,9 8,7 9,7 9,1
School meals 14,5 14,0 11,6 12,9
Adjusted openeing hours in services 11,7 13,2 13,6 13,2
Organised household help 3,7 3,9 4,4 4,1
Part time employment 16,8 17,8 19,5 18,5
Flexible working hours 18,5 20,1 20,9 20,3
Other solution 0,7 0,8 1,3 1,0
No option 7,0 3,6 1,6 3,1
Total 100,0 100,0 100,0 100,0
Source: Family in Transition 2001, HCSO
Domain: Public space
Sub-domain: Support for collective action
Table 15 Financial support offered to non-governmental organizations by citizens as 1% of their tax, 1997–2003
1997 1998 1999 2000 2001 2002 2003
Thousand million Ft 2 2,5 3 3,7 4,3 5,2 6,2
Source: APEH, 2004.
Table 16 Number of non-governmental organizations supported by citizens, 1997–2003
1997 1998 1999 2000 2001 2002 2003
Number of organisations 15949 16824 17865 18238 18489 20178 21904
Source: APEH, 2004.
Sub-domain: Cultural enrichment
Table 17 Budgetary expenditures on culture
Year Cultural services total % of GDP
1990 28 381 1,36
1991 32 043 1,29
1992 44 723 1,52
1993 57 004 1,61
1994 68 025 1,56
1995 79 370 1,41
1996 77 939 1,13
1997 60 738 0,71
1998 69 928 0,69
1999 76 675 0,67
Source: Cultural conditions in the nineties, HCSO, Budapest, 2001

European Network Indicators on Social Quality Hungarian National Report, February 2005
European Foundation on Social Quality 124
Table 18 Creative cultural communities and evenings with entertainment programme
Creative cultural communities Entertainment programme Per 1000 inhabitants Year
Numbers Members Number Participants, thousands
Members Participants
1990 8 203 176 786 23 973 5 012 17 484
1991 5 926 128 129 25 474 5 211 12 504
1992 5 629 127 298 24 797 5 044 13 489
1993 5 423 127 020 27 978 5 131 13 499
1994 5 740 138 135 24 136 5 410 14 528
1995 5 298 116 518 25 012 5 232 12 512
1996 6 612 108 751 25 017 5 790 11 569
1997 5 382 113 586 23 747 6 116 11 603
1998 6 055 132 274 23 747 6 116 13 606
1999 5 737 131 234 26 195 6 349 13 632
Source: Cultural conditions in the nineties, HCSO, Budapest, 2001
Table 19 Proportion of persons participated in different cultural events in the preceding 12 months of the survey, 2000 %
Theatre Museum Concert Cinema Restaurantbar
Sex
Male 11,6 10,7 3,3 9,2 15,3
Female 13,5 12,4 4,0 9,1 11,9
Age groups
15–29 21,1 20,7 5,4 28,0 24,8
30–39 12,5 11,9 3,7 13,6 20,2
40–49 13,1 10,3 3,8 7,7 15,3
50–59 10,2 8,6 3,8 3,9 11,8
60–69 6,1 6,1 1,6 1,7 6,4
70– x 3,7 4,1 1,1 0,7 3,0
Education level
Primary education 6,3 6,9 1,4 5,5 6,7
Vocational school 6,6 6,1 0,9 7,5 16,6
Secondary school 19,8 17,8 5,3 14,3 18,6
Tertiary education 35,5 33,8 14,3 16,2 23,6
Mean 12,6 11,6 3,6 9,1 13,3
Source: Time-Use Survey

European Network Indicators on Social Quality Hungarian National Report, February 2005
European Foundation on Social Quality 125
Table 20 Time spend on different speare time activities in 13 European countries, 1999–2001 (perc)
Country Socialising, entertainment and culture
Televisions and videos
Other media
Resting, sports and hobbies, games and other free time
Free time total
Proportion of total free time in the day (%)
Belgium 62 138 39 73 312 22
Denmark 81 107 30 50 268 19
United Kingdom 67 145 32 66 310 22
Finland 64 136 58 83 341 24
France 55 127 29 53 264 18
Netherlands 147 120 0 84 351 24
Norway 122 117 44 78 361 25
Portugal 57 116 13 39 225 16
Sweden 70 113 43 80 306 21
Éstonia 45 144 51 57 297 21
Slovenia 69 121 31 86 307 21
Hungary 51 164 29 56 300 21
Source: Time use at different stages of life, results from 13 European countries. Luxembourg: Office for Official Publications of the European Communities, 2003.
Table 21 Proportion of persons those are able to take a seat in the kitchen by household size, %
Number of persons who are able to take a seat around a table Household size
1-2 persons 3-4 persons 5-6 persons 7 or more persons
Total
1978
1 persons 65 21 3 11 100
2 66 22 5 8 100
3 64 17 8 10 100
4 67 21 5 7 100
5 and more 39 45 8 8 100
Total 62 23 9 6 100
2000
1 person 16 52 22 9 100
2 9 42 32 18 100
3 3 43 33 21 100
4 1 34 36 28 100
5 and more 2 13 48 37 100
Total 7 40 32 20 100
Source: Dwelling culture, time spend in shelter. HCSO, 2002

European Network Indicators on Social Quality Hungarian National Report, February 2005
European Foundation on Social Quality 126

European Network Indicators on Social Quality Hungarian National Report, February 2005
European Foundation on Social Quality 127
Annex Collective data
European Network Indicators on Social Quality Hungarian National Report, February 2005
European Foundation on Social Quality 128
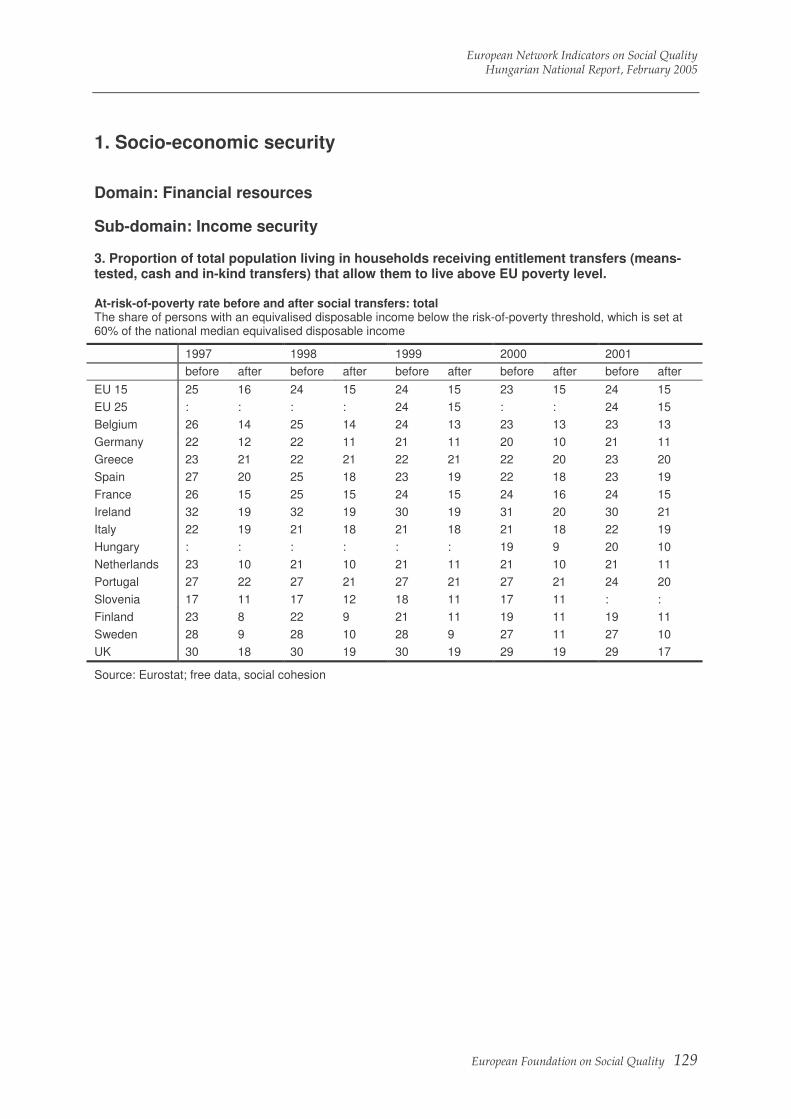
European Network Indicators on Social Quality Hungarian National Report, February 2005
European Foundation on Social Quality 129
1. Socio-economic security
Domain: Financial resources
Sub-domain: Income security 3. Proportion of total population living in households receiving entitlement transfers (means-tested, cash and in-kind transfers) that allow them to live above EU poverty level. At-risk-of-poverty rate before and after social transfers: total The share of persons with an equivalised disposable income below the risk-of-poverty threshold, which is set at 60% of the national median equivalised disposable income
1997 1998 1999 2000 2001
before after before after before after before after before after
EU 15 25 16 24 15 24 15 23 15 24 15
EU 25 : : : : 24 15 : : 24 15
Belgium 26 14 25 14 24 13 23 13 23 13
Germany 22 12 22 11 21 11 20 10 21 11
Greece 23 21 22 21 22 21 22 20 23 20
Spain 27 20 25 18 23 19 22 18 23 19
France 26 15 25 15 24 15 24 16 24 15
Ireland 32 19 32 19 30 19 31 20 30 21
Italy 22 19 21 18 21 18 21 18 22 19
Hungary : : : : : : 19 9 20 10
Netherlands 23 10 21 10 21 11 21 10 21 11
Portugal 27 22 27 21 27 21 27 21 24 20
Slovenia 17 11 17 12 18 11 17 11 : :
Finland 23 8 22 9 21 11 19 11 19 11
Sweden 28 9 28 10 28 9 27 11 27 10
UK 30 18 30 19 30 19 29 19 29 17
Source: Eurostat; free data, social cohesion
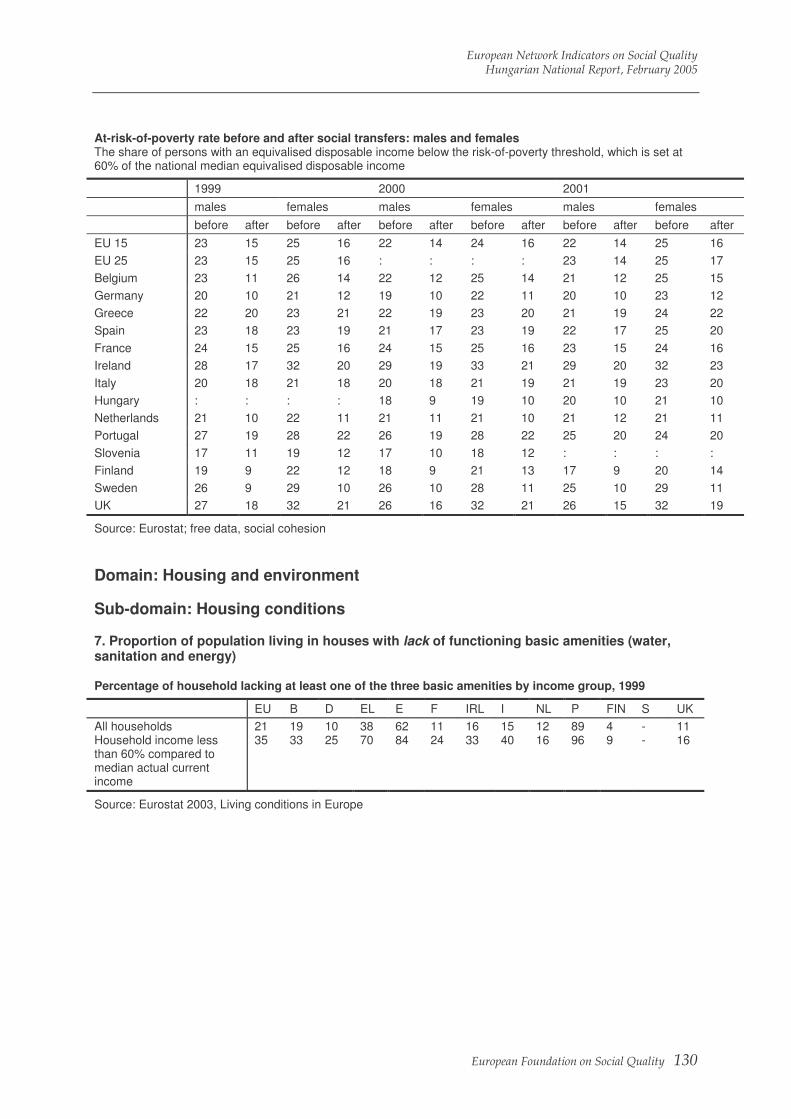
European Network Indicators on Social Quality Hungarian National Report, February 2005
European Foundation on Social Quality 130
At-risk-of-poverty rate before and after social transfers: males and females The share of persons with an equivalised disposable income below the risk-of-poverty threshold, which is set at 60% of the national median equivalised disposable income
1999 2000 2001
males females males females males females
before after before after before after before after before after before after
EU 15 23 15 25 16 22 14 24 16 22 14 25 16
EU 25 23 15 25 16 : : : : 23 14 25 17
Belgium 23 11 26 14 22 12 25 14 21 12 25 15
Germany 20 10 21 12 19 10 22 11 20 10 23 12
Greece 22 20 23 21 22 19 23 20 21 19 24 22
Spain 23 18 23 19 21 17 23 19 22 17 25 20
France 24 15 25 16 24 15 25 16 23 15 24 16
Ireland 28 17 32 20 29 19 33 21 29 20 32 23
Italy 20 18 21 18 20 18 21 19 21 19 23 20
Hungary : : : : 18 9 19 10 20 10 21 10
Netherlands 21 10 22 11 21 11 21 10 21 12 21 11
Portugal 27 19 28 22 26 19 28 22 25 20 24 20
Slovenia 17 11 19 12 17 10 18 12 : : : :
Finland 19 9 22 12 18 9 21 13 17 9 20 14
Sweden 26 9 29 10 26 10 28 11 25 10 29 11
UK 27 18 32 21 26 16 32 21 26 15 32 19
Source: Eurostat; free data, social cohesion Domain: Housing and environment
Sub-domain: Housing conditions 7. Proportion of population living in houses with lack of functioning basic amenities (water, sanitation and energy) Percentage of household lacking at least one of the three basic amenities by income group, 1999
EU B D EL E F IRL I NL P FIN S UK
All households Household income less than 60% compared to median actual current income
21 35
19 33
10 25
38 70
62 84
11 24
16 33
15 40
12 16
89 96
4 9
- -
11 16
Source: Eurostat 2003, Living conditions in Europe

European Network Indicators on Social Quality Hungarian National Report, February 2005
European Foundation on Social Quality 131
Domain: Health and care
Sub-Domain: Health services 11. Number of medical doctors per 100.000 inhabitants Number of practitioners per 100 000 inhabitants
EU15 B D EL E F IRL I NL P FIN S UK
1997 - 386 345 410 428 325 214 578 - 306 296 278 168
1998 368 395 350 426 436 426 219 583 295 312 300 278 172
1999 375 405 355 438 444 328 227 589 311 318 306 283 176
2000 - 411 359 - 454 329 250 599 321 325 308 - 180
2001 - 419 362 - - - - - - - - - -
Source: Eurostat, Yearbook 2003
12. Average distance to hospital, measure in minutes, not in meters Proximity to hospitals by income (% having acces to a hosptial in less than 20 minutes by quartiles of household-equivalence income)
Total Lowest quartile
Highest quartile
Difference in percentage points
EU 15 52,8 44,9 60,4 15,5
Belgium 66 53,6 78,9 25,3
Germany 52,7 48 56,8 8,9
Greece 39,9 35,7 44,3 8,5
Spain 41,4 38,4 44,2 5,8
France 54,4 43,4 65,3 21,9
Ireland 44,6 40,5 48,7 8,2
Italy 60,9 47 75,2 28,2
Hungary 31,4 16 46,8 30,8
Netherlands 72,5 66,8 77,8 11
Portugal 37,8 27,2 49 21,9
Slovenia 37,9 30,5 46,2 15,7
Finland 50,9 48 53,8 5,8
Sweden 58 56 60 4,0
UK 45,5 34,2 57,8 23,6
Source: Eurobarometer 52.1

European Network Indicators on Social Quality Hungarian National Report, February 2005
European Foundation on Social Quality 132
Domain: Work
Sub-domain: Employment security 17. Proportion employed workforce with temporary, non permanent, job contract Proportion employees with a contract of limited duration (temporary job contracts)
1999 2000 2001 2002
total females males total females males total females males total females males
EU 15 13,2 14,2 12,4 13,4 14,5 12,5 13,4 14,5 : 13,1 14,3 12,1
Belgium 10,3 13,7 7,7 9 12,1 6,6 8,8 12,1 : 7,6 10,3 5,5
Germany 13,1 13,4 12,8 12,7 13,1 12,5 12,4 12,7 : 12 12,2 11,8
Greece 13 14,7 12 13,1 15,7 11,5 12,9 15,4 : 11,3 13,4 9,8
Spain 32,7 34,9 31,4 32,1 34,6 12,1 31,6 34,1 : 31,2 34,2 29,2
France 14 14,8 13,3 15 15,7 14,3 14,9 16,3 : 14,1 16 12,5
Ireland 9,4 12,1 7,1 4,6 5,8 3,6 3,7 4,5 : 5,3 6,3 4,5
Italy 9,8 11,8 8,5 10,1 12,2 8,8 9,5 11,5 : 9,9 12,1 8,3
Hungary : : ; : : : 7,5 6,8 : 7,4 6,8 8
Netherlands 12 15,4 9,4 14 17,2 11,1 14,3 17,5 : 14,3 17 12,2
Portugal 18,6 20,4 17,1 20,4 22,7 18,4 20,3 22,1 : 21,8 23,4 20,5
Slovenia : : : : : : 13,1 13,3 : 14,7 16,7 12,9
Finland 18,2 21,2 15,2 17,7 20,9 14,5 17,9 22 ; 17,3 20,5 13,9
Sweden 13,9 16,6 11,2 14,7 16,9 12,1 14,7 16,9 : 15,7 17,9 13,3
UK 6,8 7,5 6,2 6,7 7,7 5,7 6,7 7,5 : 6,1 6,8 5,5
Source: Eurostat; Statistics in Focus
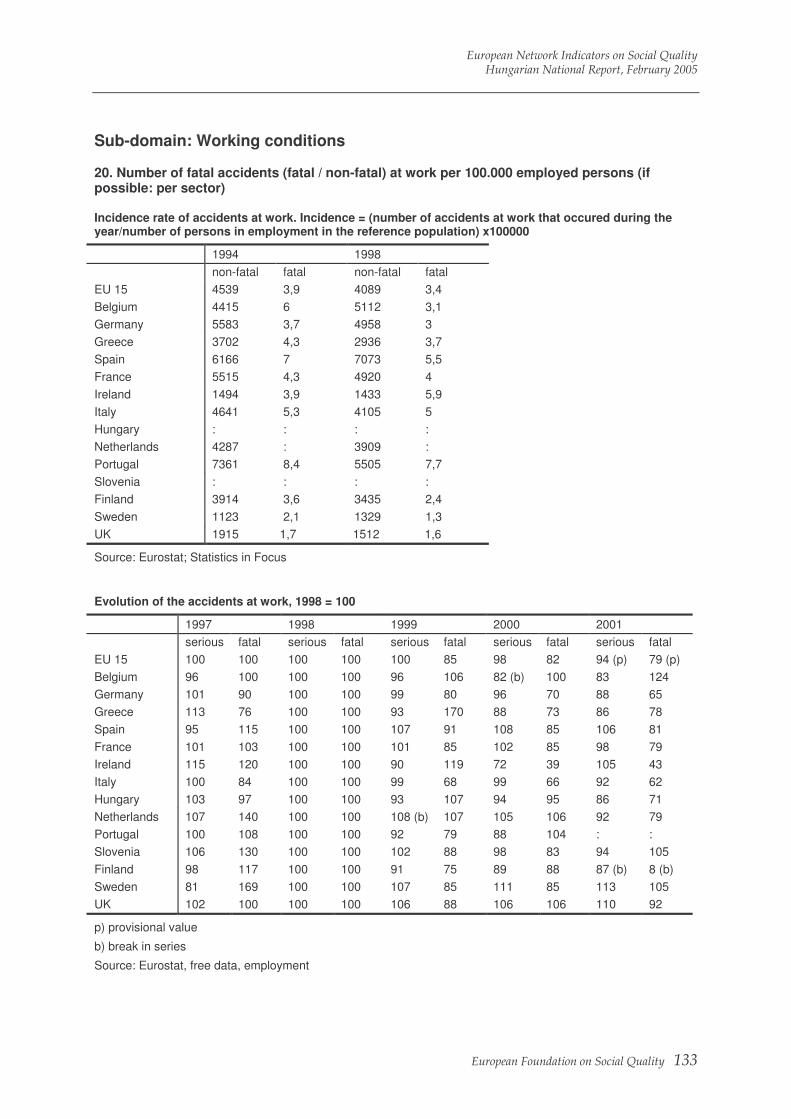
European Network Indicators on Social Quality Hungarian National Report, February 2005
European Foundation on Social Quality 133
Sub-domain: Working conditions 20. Number of fatal accidents (fatal / non-fatal) at work per 100.000 employed persons (if possible: per sector) Incidence rate of accidents at work. Incidence = (number of accidents at work that occured during the year/number of persons in employment in the reference population) x100000
1994 1998
non-fatal fatal non-fatal fatal
EU 15 4539 3,9 4089 3,4
Belgium 4415 6 5112 3,1
Germany 5583 3,7 4958 3
Greece 3702 4,3 2936 3,7
Spain 6166 7 7073 5,5
France 5515 4,3 4920 4
Ireland 1494 3,9 1433 5,9
Italy 4641 5,3 4105 5
Hungary : : : :
Netherlands 4287 : 3909 :
Portugal 7361 8,4 5505 7,7
Slovenia : : : :
Finland 3914 3,6 3435 2,4
Sweden 1123 2,1 1329 1,3
UK 1915 1,7 1512 1,6
Source: Eurostat; Statistics in Focus
Evolution of the accidents at work, 1998 = 100
1997 1998 1999 2000 2001
serious fatal serious fatal serious fatal serious fatal serious fatal
EU 15 100 100 100 100 100 85 98 82 94 (p) 79 (p)
Belgium 96 100 100 100 96 106 82 (b) 100 83 124
Germany 101 90 100 100 99 80 96 70 88 65
Greece 113 76 100 100 93 170 88 73 86 78
Spain 95 115 100 100 107 91 108 85 106 81
France 101 103 100 100 101 85 102 85 98 79
Ireland 115 120 100 100 90 119 72 39 105 43
Italy 100 84 100 100 99 68 99 66 92 62
Hungary 103 97 100 100 93 107 94 95 86 71
Netherlands 107 140 100 100 108 (b) 107 105 106 92 79
Portugal 100 108 100 100 92 79 88 104 : :
Slovenia 106 130 100 100 102 88 98 83 94 105
Finland 98 117 100 100 91 75 89 88 87 (b) 8 (b)
Sweden 81 169 100 100 107 85 111 85 113 105
UK 102 100 100 100 106 88 106 106 110 92
p) provisional value
b) break in series
Source: Eurostat, free data, employment
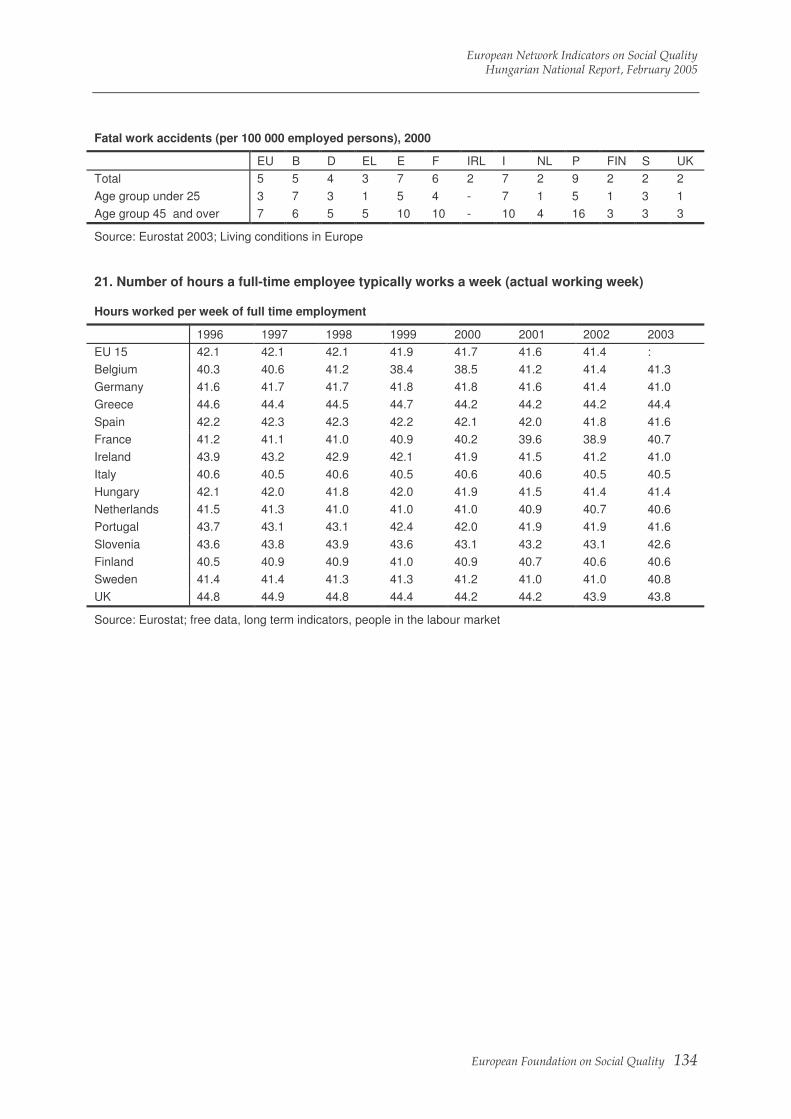
European Network Indicators on Social Quality Hungarian National Report, February 2005
European Foundation on Social Quality 134
Fatal work accidents (per 100 000 employed persons), 2000
EU B D EL E F IRL I NL P FIN S UK
Total 5 5 4 3 7 6 2 7 2 9 2 2 2
Age group under 25 3 7 3 1 5 4 - 7 1 5 1 3 1
Age group 45 and over 7 6 5 5 10 10 - 10 4 16 3 3 3
Source: Eurostat 2003; Living conditions in Europe 21. Number of hours a full-time employee typically works a week (actual working week) Hours worked per week of full time employment
1996 1997 1998 1999 2000 2001 2002 2003
EU 15 42.1 42.1 42.1 41.9 41.7 41.6 41.4 :
Belgium 40.3 40.6 41.2 38.4 38.5 41.2 41.4 41.3
Germany 41.6 41.7 41.7 41.8 41.8 41.6 41.4 41.0
Greece 44.6 44.4 44.5 44.7 44.2 44.2 44.2 44.4
Spain 42.2 42.3 42.3 42.2 42.1 42.0 41.8 41.6
France 41.2 41.1 41.0 40.9 40.2 39.6 38.9 40.7
Ireland 43.9 43.2 42.9 42.1 41.9 41.5 41.2 41.0
Italy 40.6 40.5 40.6 40.5 40.6 40.6 40.5 40.5
Hungary 42.1 42.0 41.8 42.0 41.9 41.5 41.4 41.4
Netherlands 41.5 41.3 41.0 41.0 41.0 40.9 40.7 40.6
Portugal 43.7 43.1 43.1 42.4 42.0 41.9 41.9 41.6
Slovenia 43.6 43.8 43.9 43.6 43.1 43.2 43.1 42.6
Finland 40.5 40.9 40.9 41.0 40.9 40.7 40.6 40.6
Sweden 41.4 41.4 41.3 41.3 41.2 41.0 41.0 40.8
UK 44.8 44.9 44.8 44.4 44.2 44.2 43.9 43.8
Source: Eurostat; free data, long term indicators, people in the labour market

European Network Indicators on Social Quality Hungarian National Report, February 2005
European Foundation on Social Quality 135
Domain: Education
Sub-domain: Security of education 22. Proportion of pupils leaving education without finishing compulsory education (early school leavers) Early school-leavers - total - Percentage of the population aged 18-24 with at most lower secondary education and not in further education or training
1999 2000 2001 2002 2003
EU 25 : : 17.2 (p) 16.5 (p) 15.9 (b)
EU 15 20.5 (p) 19.4 (p) 18.9 (p) 18.5 (p) 18.0 (b)
Belgium 15.2 (b) 12.5 13.6 12.4 12.8
Germany 14.9 14.9 12.5 12.6 12.6 (p)
Greece 17.8 17.1 16.5 16.1 15.3 (b)
Spain 29.5 28.8 28.6 29.0 29.8
France 14.7 13.3 13.5 13.4 13.3 (b)
Ireland : : : 14.7 12.1 (b)
Italy 27.2 25.3 26.4 24.3 23.5
Hungary 13.0 13.8 12.9 12.2 11.8 (b)
Netherlands 16.2 15.5 15.3 15.0 15.0 (p)
Portugal 44.8 42.9 44.3 45.5 41.1
Slovenia : : 7.5 4.8 u 4.3
Finland 9.9 8.9 (b) 10.3 9.9 10.7 (b)
Sweden 6.9 7.7 10.5 (b) 10.4 9.0 (b)
UK 19.7 (p) 18.3 (p) 17.6 (p) 17.7 (p) 16.7 (p)
p) provisional value
b) break in series
Source: Eurostat SC053 IV.5.1
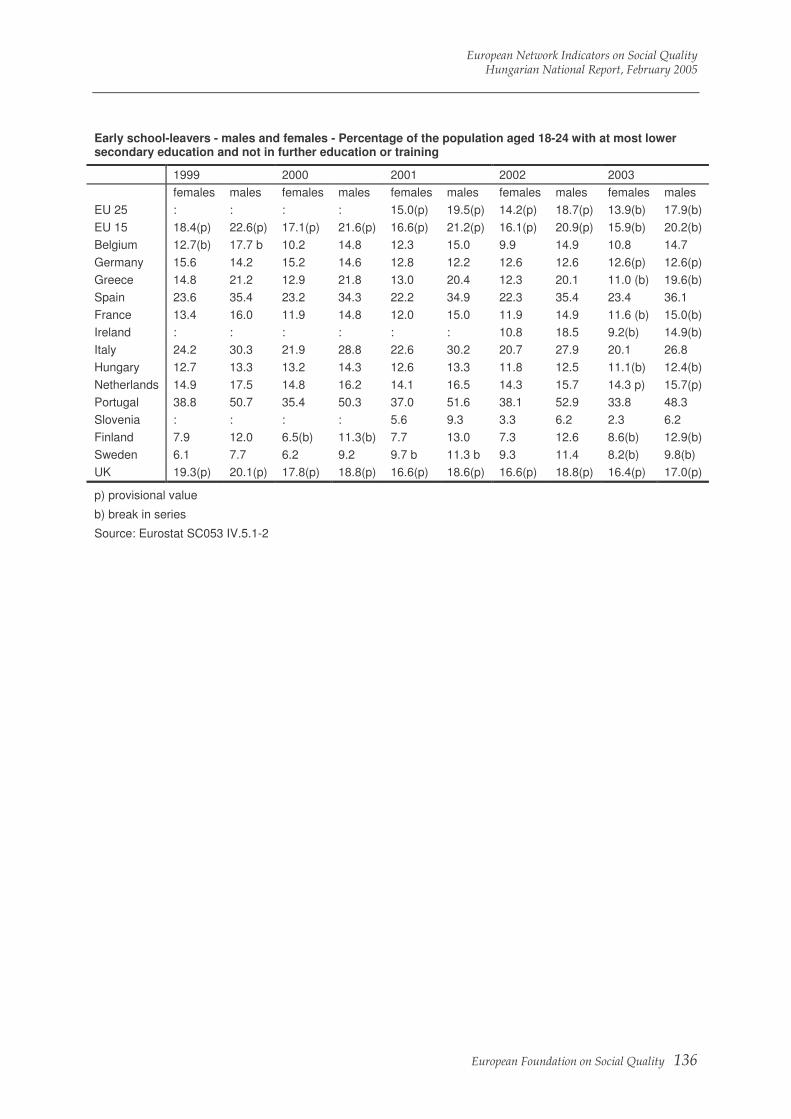
European Network Indicators on Social Quality Hungarian National Report, February 2005
European Foundation on Social Quality 136
Early school-leavers - males and females - Percentage of the population aged 18-24 with at most lower secondary education and not in further education or training
1999 2000 2001 2002 2003
females males females males females males females males females males
EU 25 : : : : 15.0(p) 19.5(p) 14.2(p) 18.7(p) 13.9(b) 17.9(b)
EU 15 18.4(p) 22.6(p) 17.1(p) 21.6(p) 16.6(p) 21.2(p) 16.1(p) 20.9(p) 15.9(b) 20.2(b)
Belgium 12.7(b) 17.7 b 10.2 14.8 12.3 15.0 9.9 14.9 10.8 14.7
Germany 15.6 14.2 15.2 14.6 12.8 12.2 12.6 12.6 12.6(p) 12.6(p)
Greece 14.8 21.2 12.9 21.8 13.0 20.4 12.3 20.1 11.0 (b) 19.6(b)
Spain 23.6 35.4 23.2 34.3 22.2 34.9 22.3 35.4 23.4 36.1
France 13.4 16.0 11.9 14.8 12.0 15.0 11.9 14.9 11.6 (b) 15.0(b)
Ireland : : : : : : 10.8 18.5 9.2(b) 14.9(b)
Italy 24.2 30.3 21.9 28.8 22.6 30.2 20.7 27.9 20.1 26.8
Hungary 12.7 13.3 13.2 14.3 12.6 13.3 11.8 12.5 11.1(b) 12.4(b)
Netherlands 14.9 17.5 14.8 16.2 14.1 16.5 14.3 15.7 14.3 p) 15.7(p)
Portugal 38.8 50.7 35.4 50.3 37.0 51.6 38.1 52.9 33.8 48.3
Slovenia : : : : 5.6 9.3 3.3 6.2 2.3 6.2
Finland 7.9 12.0 6.5(b) 11.3(b) 7.7 13.0 7.3 12.6 8.6(b) 12.9(b)
Sweden 6.1 7.7 6.2 9.2 9.7 b 11.3 b 9.3 11.4 8.2(b) 9.8(b)
UK 19.3(p) 20.1(p) 17.8(p) 18.8(p) 16.6(p) 18.6(p) 16.6(p) 18.8(p) 16.4(p) 17.0(p)
p) provisional value
b) break in series
Source: Eurostat SC053 IV.5.1-2

European Network Indicators on Social Quality Hungarian National Report, February 2005
European Foundation on Social Quality 137
2. Social cohesion Domain: Trust Sub-domain: Generalised trust 25. Extent to which 'most people can be trusted' Proportion of the population who thinks that most people can be trusted
B D EL E F IRL I HU NL SL FIN S UK
most people can be trusted
29,3 34,8 19,1 38,5 22,2 35,2 32,6 21,8 59,7 21,7 58 66,3 29,9
you cannot be too careful
70,7 65,2 80,9 61,5 77,8 64,8 67,4 78,2 40,3 78,3 42 33,7 70,1
Source: European Values Study; A third Wave (question 8) Extent to which the population thinks that most people can be trusted, 2002 The table includes the country means in a 0-10 scale, where 0 means the distrust and 10 means the trustfulness
B D EL E IRL I HU NL P SL FIN S UK
country means 4,81 4,61 3,64 4,86 5,46 4,54 4,08 5,71 4 3,98 6,46 6,09 5,05
Source: European Social Survey (ESS) 2002
Sub-domain: Specific trust 26. Trust in: government; elected representatives; political parties; armed forces; legal system; the media; trade unions, police; eligious institutions; civil service; economic transactions Trust in different institutions in European countries 2002/2003
Trust in country’s parliament
Legal system Police Politicians European Parliament
Belgium 4,99 4,39 5,64 4,28 4,88
Germany 4,47 5,73 6,73 3,5 4,46
Spain 4,83 4,31 5,43 3,37 4,8
Finland 5,79 6,75 7,95 4,78 4,88
UK 4,68 5,03 6,04 3,79 3,61
Greece 4,83 6,27 6,43 3,46 5,69
Hungary 5 5,11 4,91 3,88 5,67
Ireland 4,43 5,14 6,53 3,75 5,11
Italy 4,83 5,49 6,66 3,54 5,51
Netherlands 5,22 5,38 5,82 4,87 4,67
Portugal 4,44 4,26 5,13 2,82 4,76
Sweden 5,92 6,06 6,76 4,72 4,02
Slovenia 4,04 4,28 4,89 3,07 4,65
Source: European Social Survey 2002.
Remarks: The table includes the country means in a 0-10 scale, where 0 means the distrust and 10 means the trustfulness.

European Network Indicators on Social Quality Hungarian National Report, February 2005
European Foundation on Social Quality 138
28. Importance of: family; friends; leisure; politics; respecting parents. parents' duty to children Proportion of the population for whom work, family, friends, leisure time, politics is quite or very important in its live (those two answer categories are taken together)
work family friends leisure time politics religion
Belgium 92,8 97,6 89,1 86,2 33,1 47,6
Germany 82,7 96,9 94,5 83,2 39,5 35
Greece 87,2 99,1 85,5 76,9 34,9 79,7
Spain 94,6 98,9 86,6 80,9 19,3 42
France 94,8 98,2 94,4 88,1 35,4 36,9
Ireland 84,7 98,5 97,3 86,9 32,1 70,7
Italy 95 98,6 89,8 81,2 33,8 72,1
Hungary 88,7 97,8 82,3 79,7 18,2 42,3
Netherlands 86,5 92,7 96,3 94 57,7 39,8
Portugal 95,1 98,7 87,9 83,7 27,1 75,5
Slovenia 95,8 97,2 88,3 79,7 14,5 36,6
Finland 89,2 96,2 95,2 90 19,8 45,1
Sweden 91,1 97,9 97,6 93,9 55 35
UK 78,6 98,8 96,6 92,5 34,3 37,4
Source: European Values Study; A third Wave (question 1) Domain: Other integrative norms and values Sub-domain: Altruism 29. Volunteering: number of hours per week Volunteer work and informal help among persons aged 20-74 (Hours and minutes per day)
B D F HU SI FIN S UK
Volunteer work and help among women aged 20-74 0:10 0:15 0:14 0:08 0:06 0:16 0:12 0:14
Volunteer work and help among men aged 20-74 0:11 0:17 0:18 0:13 0:11 0:16 0:12 0:10
Source: How Europeans spend their time everyday life of women and men – Luxembourg 30. Blood donation Blood donation (%), 2002
EU B D E F IRL I NL P FIN S UK
Yes 31 23 31 25 38 32 24 26 22 39 25 32
Source: « Le don de sang », Eurostat, 2003, p.2, Eurobarometer 58.2
European Network Indicators on Social Quality Hungarian National Report, February 2005
European Foundation on Social Quality 139
Sub-domain: Tolerance 31. Views on immigration, pluralism and multiculturalism
Proportion of different opinions according to the inclusion of immigrants in different countries, 2000
Country Let anyone come who wants to
Let people come as long as there jobs available
Put strict limits on the number of foreigners who can come here
Prohibit people coming here from other countries
Belgium 7,4 33,5 50,5 8,6
Germany 4,5 32,6 56 7
Greece 3,5 40,9 41 14,6
Spain 19,1 56,2 22,4 2,3
Ireland 8,3 46,7 42,1 2,9
Italy 9,7 47,4 38,3 4,6
Hungary 2 12 59,1 26,8
Netherlands 3,9 35,9 55,6 4,7
Portugal 11,5 61,4 23,2 3,9
Slovenia 4,6 48,1 38,9 8,4
Finland 10,4 34,7 51,9 3
Sweden 16,3 54,4 28,7 0,5
UK 4,3 34,1 48,5 13,1
Source: European Values Survey 1999/2000, Q74 Proportion of different opinions in connection with the cultural identity of immigrants in different countries
Country For the greater good of society it is better if immigrants maintain their distinct customs and traditions
For the greater good of society it is better if immigrants do not maintain their distinct custom and traditions but take over the customs of the country
Belgium 28,1 71,9
Germany 23,8 76,2
Greece 68,7 31,3
Spain 52 48
Ireland 56,7 43,3
Italy 59,7 40,3
Hungary 33,4 66,6
Netherlands 29,1 70,9
Portugal 48,9 51,1
Slovenia 30,8 69,2
Finland 32 68
Sweden 36 64
UK 44,7 55,3
Source: European Values Survey 1999/2000, Q75

European Network Indicators on Social Quality Hungarian National Report, February 2005
European Foundation on Social Quality 140
32. Tolerance of other people's self-identity, beliefs, behaviour and lifestyle preferences Typology of people according to their attitudes towards minorities Proportion of the population that is intolerant, ambivalent, passively tolerant and actively tolerant by country
Intolerant Ambivalent Passively tolerant
Actively tolerant
EU15 14 25 39 21
Belgium 25 28 26 22
Germany 18 29 29 24
Greece 27 43 22 7
Spain 4 18 61 16
France 19 26 31 25
Ireland 13 21 50 15
Italy 11 21 54 15
Netherlands 11 25 34 31
Portugal 9 34 44 12
Finland 8 21 39 32
Sweden 9 15 43 33
UK 15 27 36 22
Source: Eurobarometer 2000 survey Tolerance of other people’s self-identity, beliefs, behaviour and lifestyle preferences
B D EL E F IRL I HU
Claiming state benefits which you are not entitled to 2,57 1,91 3,64 2,67 3,39 1,9 1,88 1,7
Cheating on tax if you have the chance 3,64 2,36 2,88 2,35 3,06 2,35 2,39 2,12
Taking and driving away a car belonging to someone else (joyriding)
1,2 1,24 1,39 1,64 1,38 1,11 1,46 1,14
Taking the drug marihuana or hashish 1,72 1,91 2,04 2,16 2,15 1,99 2,03 1,26
Lying in your own interest 3,62 3,32 2,58 2,93 3,71 2,32 2,41 2,53
Married men/women having an affair 2,72 2,85 2,12 2,48 3,52 1,84 2,75 2,1
Someone accepting a bribe in the course of their duties
2 1,8 1,66 1,68 2,08 1,42 1,5 2,67
Homosexuality 5,22 5,69 3,39 5,51 5,27 4,4 4,83 1,45
Abortion 4,45 4,61 4,18 4,34 5,64 2,9 4,04 3,92
Divorce 5,64 5,86 5,42 6,1 6,32 4,8 5,14 4,5
Euthanasia (terminating the life of the incurably sick) 5,83 4,34 3,49 4,73 6,16 3,31 3,86 3,83
Suicide 3,27 2,61 2,26 2,77 4,34 2,07 2,28 1,56
Throwing away litter in a public place 1,48 2,22 1,88 1,86 1,62 1,81 1,58 1,72
Driving under the influence of alcohol 1,64 1,45 1,49 1,52 1,88 1,4 1,43 1,16
Paying cash for services to avoid taxes 4,29 2,89 3,46 3,35 4,18 2,89 2,5 2,62
Having casual sex 2,86 3,15 3,6 3,92 3,91 2,71 3,07 2,74
Smoking in public buildings 2,92 4,05 4 3,74 3,38 3,33 3,46 2,85
Speeding over the limit in built-up areas 2,39 1,99 2,19 1,93 2,84 1,85 2,61 1,98
Avoiding a fare on public transport 2,39 2,13 2,89 : 2,71 : 2,17 :
Sex under the legal age of consent : 2,64 4,57 : : 1,45 : :
Prostitution : 4,19 2,37 3,25 : 2,54 2,4 :
Political assassinations : 1,49 1,93 : : : : :
Scientific experiments on human embryos 2,07 1,52 1,38 1,74 : 1,92 1,95 :
Genetic manipulation of food stuff 2,42 2,21 2,32 2,05 : : 2,31 :

European Network Indicators on Social Quality Hungarian National Report, February 2005
European Foundation on Social Quality 141
Tolerance of other people’s self-identity, beliefs, behaviour and lifestyle preferences (continued)
NL P SL FIN S UK Total
Claiming state benefits which you are not entitled to 1,51 2,03 2,82 2,3 2,08 1,99 2,28
Cheating on tax if you have the chance 2,67 2,45 2,34 2,46 2,41 2,42 2,63
Taking and driving away a car belonging to someone else (joyriding)
1,34 1,62 1,68 1,31 1,29 1,21 1,41
Taking the drug marihuana or hashish 3,06 2,02 2,3 1,65 1,77 3,1 1,83
Lying in your own interest 3,14 2,45 2,54 2,71 2,56 3,01 2,85
Married men/women having an affair 2,69 2,47 3,47 2,36 2,38 2,31 2,56
Someone accepting a bribe in the course of their duties
1,58 1,77 1,78 1,43 1,83 1,77 1,82
Homosexuality 7,8 3,19 4,62 4,94 7,65 4,89 4,3
Abortion 5,4 3,81 6,19 5,42 7,38 4,54 4,58
Divorce 6,54 5,46 6,58 6,64 7,8 5,57 5,51
Euthanasia (terminating the life of the incurably sick) 6,65 3,5 5,37 5,4 6,07 4,99 4,82
Suicide 4,34 2,2 3,54 3,04 4,12 3,16 2,63
Throwing away litter in a public place 1,7 1,83 1,94 2,27 2,72 2,61 1,88
Driving under the influence of alcohol 1,44 1,83 2,04 1,35 1,35 1,51 1,54
Paying cash for services to avoid taxes 4,2 2,25 3,28 3,48 3,78 3,53 3,25
Having casual sex 3,7 2,76 4,08 3,75 4,8 3,44 3,15
Smoking in public buildings 3,81 3,34 3,57 3,1 3,18 4,02 3,51
Speeding over the limit in built-up areas 1,8 2,38 2,93 2,82 2,72 2,3 2,33
Avoiding a fare on public transport 2,72 : : 2,36 : 2,68 2,82
Sex under the legal age of consent : : 5,78 3,31 : 1,96 2,53
Prostitution : : 3,31 3,2 : 3,42 2,84
Political assassinations : : : 1,44 : 1,99 1,63
Scientific experiments on human embryos 2,5 : 1,86 2,47 : 2,35 2,08
Genetic manipulation of food stuff 3,07 : 2,83 2,6 : 2,3 2,42
Source: European Values Survey 1999/2000, Q65, 1-10 scale

European Network Indicators on Social Quality Hungarian National Report, February 2005
European Foundation on Social Quality 142
Sub-domain: Social contract 33. Beliefs on causes of poverty: individual or structural Proportion of the population which considers (respectively) unluckyness, laziness, injustice and the modern progress as the most important reason for living in need
unlucky laziness or lack of wilpower
injustice in society
part of the modern progress
none of these
Belgium 26,8 16 35,3 20 1,9
Germany 11,7 28,4 36,9 19,6 3,5
Greece 14,3 29,8 18,2 34,4 3,3
Spain 19,8 19,6 48,4 10,4 1,9
France 14,4 11,4 44,3 26,9 2,9
Ireland 23,2 20,6 33 19,3 3,9
Italy 19,5 23 37,7 15,6 4,2
Hungary 13 27,6 37,7 18,8 2,9
Netherlands 32,8 14,3 25,8 17,5 9,7
Portugal 23,3 41,9 21,6 11,6 1,6
Slovenia 10,4 33,2 35,4 17,3 3,7
Finland 14,8 23 23,8 35,3 3,1
Sweden 10,2 7,1 49,5 33,1 0
Great Britain 16,4 24,6 30,5 24,4 4,1
Source: European Values Study : A third Wave (question 11) 38. Membership (active or inactive) of political, voluntary, charitable organisations or sport clubs Proportion of people member of non-governmental organizations (NGO’s) in different countries, 2002/2003
B D EL E IRL I HU NL P SL FIN S UK
Male 65,1 72 24,8 36,7 68,6 37 27,9 84,4 31,1 51,3 64,6 82,8 71,4
Female 57,1 61,7 16,4 29,5 59,3 24,9 17,7 77,4 18,6 33,3 57,2 78,8 62
Source: European Social Survey 2002/2003

European Network Indicators on Social Quality Hungarian National Report, February 2005
European Foundation on Social Quality 143
Proportion of population which belongs to….
B D EL E F IRL I
social welfare services for elderly, handicapped or deprived people
11,4 3,9 10,2 3,7 5,6 5,9 6,4
religious or church organisations 12,2 13,5 11,8 5,8 4,3 16,2 10,3
education, arts, music or cultural activities 18,9 7,9 11,2 7,3 7,8 10,1 9,9
trade unions 15,7 7,2 6,5 3,5 4 10 6,2
political parties or groups 7 2,8 4,9 2 2 4,4 4,1
local community action on issues like poverty, employment, housing, racial equality
5 0,7 2,8 2,2 2,3 5,6 2,4
third world development or human rights 9,8 0,6 1,8 2,4 1,4 2,4 2,9
conservation, the environment, ecology, animal rights 10,4 2,7 5,8 2,5 2,2 2,8 3,8
professional associations 8,3 4,4 7,7 2,6 3,1 7,7 7,1
youth work 7,5 1,9 2,5 2,6 2 7,1 4,2
sports or recreation 23,8 28 9,6 8,5 16,4 27,6 11,5
women's groups 8,7 3,6 2,2 2,3 0,4 4,4 0,4
peace mouvements 2,3 0,2 2,9 1,6 0,5 1,7 1,4
voluntary organisations concerned with health 5 2,5 3,6 2,7 2,5 4,1 4,7
other groups 10,6 3,9 6,8 3,7 6,9 5,4 2,6
Proportion of population which belongs to…. (continued)
HU NL P SL FIN S UK
social welfare services for elderly, handicapped or deprived people
1,9 21,6 2 5,4 10,4 20,8 6,7
religious or church organisations 12,1 35,1 5,6 6,7 47 71,5 4,9
education, arts, music or cultural activities 3,4 46,2 3,1 9,2 14,3 26,4 9,7
trade unions 7 23,4 1,7 16,9 32,3 64 8,2
political parties or groups 1,6 9,5 0,9 3 6,6 10,6 2,5
local community action on issues like poverty, employment, housing, racial equality
1 7,4 1 9,2 2,6 9,5 3,8
third world development or human rights 0,3 24,6 0,8 0,8 5,9 15 2,6
conservation, the environment, ecology, animal rights 1,7 44,3 0,5 3,3 4,4 11,3 1,5
professional associations 3,7 18,5 1,1 6,7 5,6 14,5 1,6
youth work 0,8 7,3 1,2 4,5 6,7 6,9 5,7
sports or recreation 3,8 50,3 8,6 16,9 23,7 37 3
women's groups 0,3 4 1,9 4 3,5 1,7
peace mouvements 0,3 3,4 0,6 0,8 1,3 1,5 0,6
voluntary organisations concerned with health 2 9,6 2,2 2,9 9,2 6,7 3
other groups 2,6 9,7 3,2 9,9 11,8 25 5
Source: European Values Study; A third Wave (question 5)

European Network Indicators on Social Quality Hungarian National Report, February 2005
European Foundation on Social Quality 144
40. Frequency of contact with friends and colleagues Frequency of spending time with friends
B D EL E F IRL I HU NL P SL FIN S UK
every week 50,2 49,3 62,1 67,5 58,5 72,1 61,9 37,0 66,7 63,6 57,7 60,3 66,5 74,2
once a week 30,9 36,7 23,6 18,5 28,0 21,1 20,2 29,1 25,5 14,5 25,7 27,7 28,2 18,5
few times a year 14,1 12,3 11,3 10,1 11,0 5,3 13,3 22,0 6,5 16,3 14,0 11,0 5,0 5,2
not at all 4,9 1,7 3,1 3,9 2,5 1,6 4,6 11,9 1,3 5,6 2,6 1,0 0,3 2,1
Source: European Social Survey (Q6A) Frequency of spending time with colleagues
B D EL E F IRL I HU NL P SL FIN S UK
every week 12,9 11,3 24,1 27,0 12,5 25,0 16,8 13,6 14,7 35,4 24,4 23,3 17,8 18,6
once a week 22,5 27,0 23,3 18,7 18,7 27,5 21,9 17,3 29,2 17,8 25,6 23,8 35,9 24,2
few times a year 33,4 39,9 21,6 18,8 24,0 20,4 26,4 20,5 38,3 16,5 28,2 33,8 37,0 26,8
not at all 31,2 21,8 30,9 35,4 44,7 27,0 35,0 48,5 17,7 30,2 21,9 19,1 9,3 30,3
Source: European Social Survey (Q6B) Domain: Identity Sub-domain: National / European pride 41. Sense of national pride Sense of pride : proportion of the population which is proud of being (country) / European
EU15 B D EL E F IRL I NL P FIN S UK
national pride 85 83 66 96 92 86 96 93 84 92 96 90 90
european pride 61 64 49 64 74 58 75 81 62 66 73 70 47
Source: Standard Eurobarometer 6;: full report (categories very and fairly proud taken together) Sense of national pride
B D EL E F IRL I HU NL P SL FIN S UK
very proud 24,3 16,8 65 44,1 39,7 71,8 39,3 50,9 19,5 79,1 55,7 56,1 41,4 50,5
quite proud 50,9 50,8 25,6 45,2 49,6 26,2 49 38,4 60,5 17,7 34,9 37,5 45,6 39,5
not very proud 17,5 24,3 8,6 7,8 7 1,7 9,8 8,5 14,8 2,3 7,4 5,6 11,6 7,9
not at all proud 7,3 8,1 0,9 3 3,7 0,3 1,9 2,3 5,2 0,9 2 0,9 1,4 2,1
Source: European Values Study; A third Wave (Q71)
European Network Indicators on Social Quality Hungarian National Report, February 2005
European Foundation on Social Quality 145
Sub-domain: Regional / community / local identity 43. Sense of regional / community / local identity Which of these geographical groups would you say you belong to first of all?
B D EL E F IRL I HU NL P SL FIN S UK
locality or town 32,1 55,2 44,8 45,6 43,7 56,6 53,4 67,3 39,1 36,3 52,8 48,9 58,7 48,9
region of country 20,3 29,6 12 16,5 12,1 15,8 10,6 6,3 7,7 16 8,7 12,3 9,5 13,7
country as a whole 27,9 10,1 33,2 26,8 28,5 24 23,3 20,1 41,2 41,6 32,1 31,2 22,4 28,4
Europe 9,3 2,9 1,2 1,7 4,3 2,2 4,2 2 4,8 1,6 2,4 3,2 4,2 1,9
world as a whole 10,4 2,2 8,8 9,4 11,4 1,4 8,5 4,3 7,2 4,5 3,9 4,4 5,3 7,2
Source: European Values Study; A third Wave (Q67)
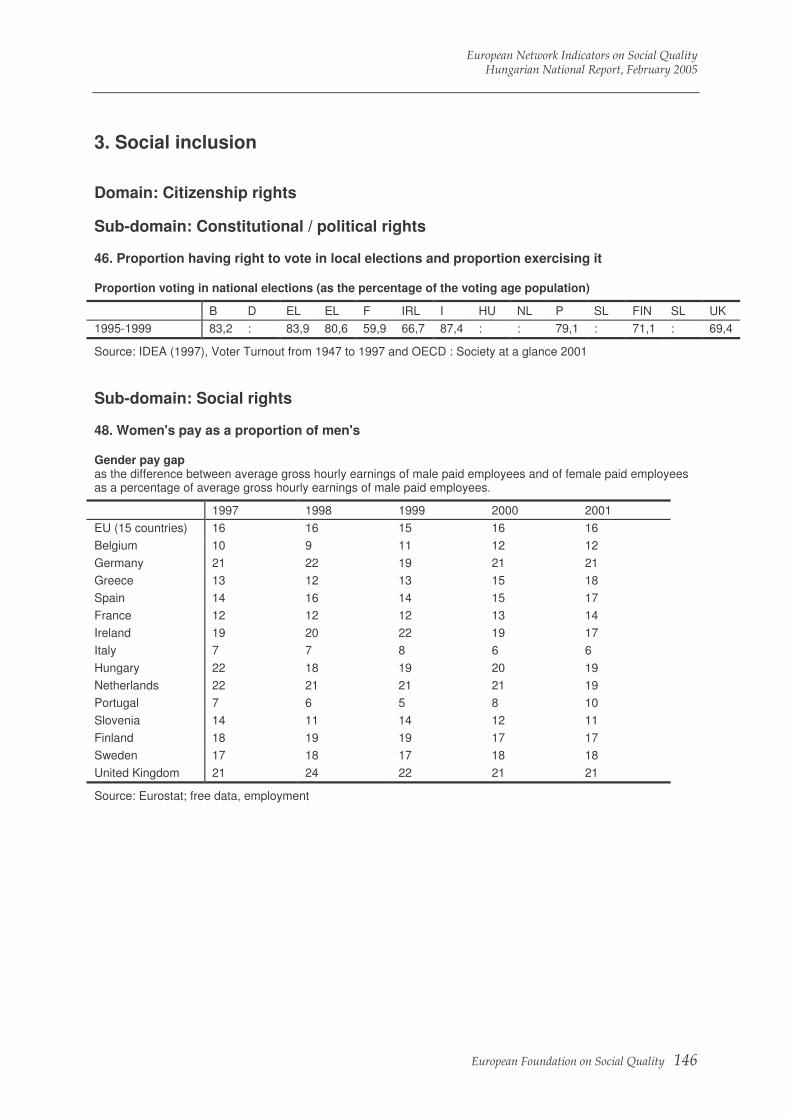
European Network Indicators on Social Quality Hungarian National Report, February 2005
European Foundation on Social Quality 146
3. Social inclusion Domain: Citizenship rights Sub-domain: Constitutional / political rights 46. Proportion having right to vote in local elections and proportion exercising it Proportion voting in national elections (as the percentage of the voting age population)
B D EL EL F IRL I HU NL P SL FIN SL UK
1995-1999 83,2 : 83,9 80,6 59,9 66,7 87,4 : : 79,1 : 71,1 : 69,4
Source: IDEA (1997), Voter Turnout from 1947 to 1997 and OECD : Society at a glance 2001 Sub-domain: Social rights 48. Women's pay as a proportion of men's Gender pay gap as the difference between average gross hourly earnings of male paid employees and of female paid employees as a percentage of average gross hourly earnings of male paid employees.
1997 1998 1999 2000 2001
EU (15 countries) 16 16 15 16 16
Belgium 10 9 11 12 12
Germany 21 22 19 21 21
Greece 13 12 13 15 18
Spain 14 16 14 15 17
France 12 12 12 13 14
Ireland 19 20 22 19 17
Italy 7 7 8 6 6
Hungary 22 18 19 20 19
Netherlands 22 21 21 21 19
Portugal 7 6 5 8 10
Slovenia 14 11 14 12 11
Finland 18 19 19 17 17
Sweden 17 18 17 18 18
United Kingdom 21 24 22 21 21
Source: Eurostat; free data, employment
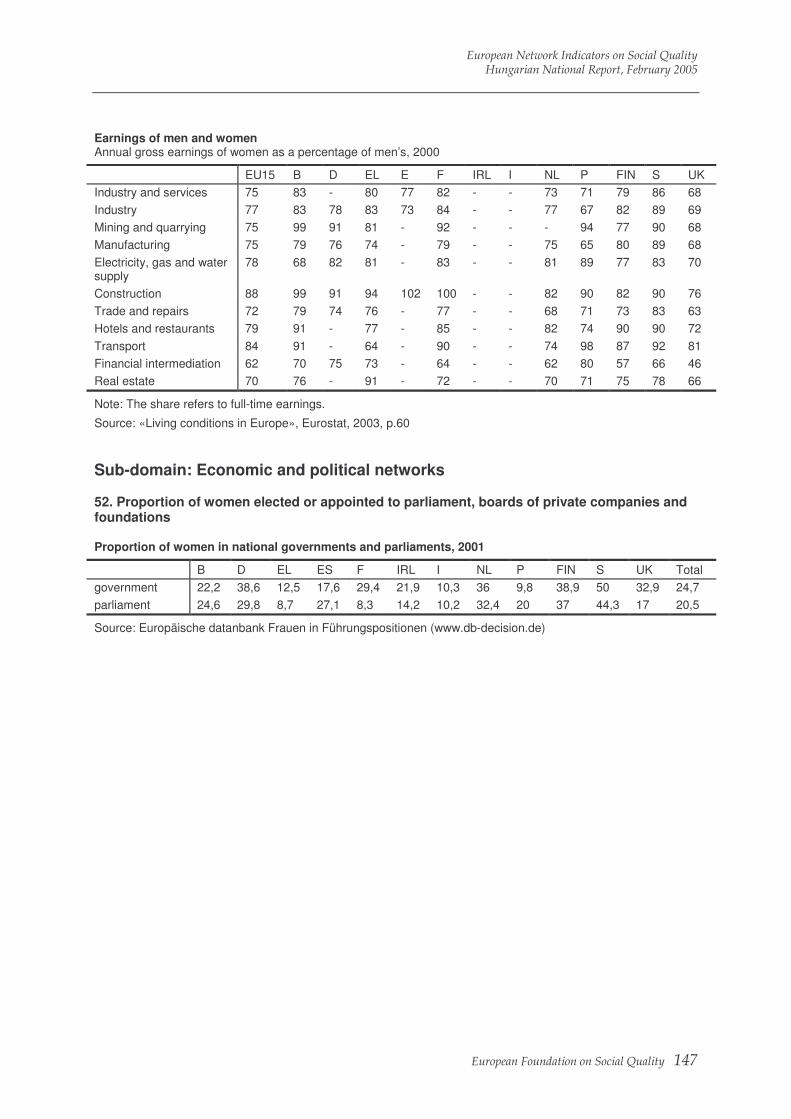
European Network Indicators on Social Quality Hungarian National Report, February 2005
European Foundation on Social Quality 147
Earnings of men and women Annual gross earnings of women as a percentage of men’s, 2000
EU15 B D EL E F IRL I NL P FIN S UK
Industry and services 75 83 - 80 77 82 - - 73 71 79 86 68
Industry 77 83 78 83 73 84 - - 77 67 82 89 69
Mining and quarrying 75 99 91 81 - 92 - - - 94 77 90 68
Manufacturing 75 79 76 74 - 79 - - 75 65 80 89 68
Electricity, gas and water supply
78 68 82 81 - 83 - - 81 89 77 83 70
Construction 88 99 91 94 102 100 - - 82 90 82 90 76
Trade and repairs 72 79 74 76 - 77 - - 68 71 73 83 63
Hotels and restaurants 79 91 - 77 - 85 - - 82 74 90 90 72
Transport 84 91 - 64 - 90 - - 74 98 87 92 81
Financial intermediation 62 70 75 73 - 64 - - 62 80 57 66 46
Real estate 70 76 - 91 - 72 - - 70 71 75 78 66
Note: The share refers to full-time earnings.
Source: «Living conditions in Europe», Eurostat, 2003, p.60 Sub-domain: Economic and political networks 52. Proportion of women elected or appointed to parliament, boards of private companies and foundations Proportion of women in national governments and parliaments, 2001
B D EL ES F IRL I NL P FIN S UK Total
government 22,2 38,6 12,5 17,6 29,4 21,9 10,3 36 9,8 38,9 50 32,9 24,7
parliament 24,6 29,8 8,7 27,1 8,3 14,2 10,2 32,4 20 37 44,3 17 20,5
Source: Europäische datanbank Frauen in Führungspositionen (www.db-decision.de)

European Network Indicators on Social Quality Hungarian National Report, February 2005
European Foundation on Social Quality 148
Domain: Labour market Sub-domain: Access to paid employment 53. Long-term unemployment (12+ months) Total long-term unemployment
1997 1998 1999 2000 2001 2002 2003
EU 15 4.9 4.4 4.0 3.5 3.1 3.1 3.3
Belgium 5.4 5.5 4.9 3.7 3.2 3.5 3.7
Germany 4.9 4.7 4.3 3.9 3.8 4.1 4.6
Greece 5.3 5.8 6.4 6.0 5.4 5.1 5.1
Spain 8.9 7.6 5.9 4.7 3.9 3.9 3.9
France 4.8 4.6 4.2 3.6 3.0 3.0 3.4
Ireland 6.0 3.9 2.6 1.6 1.2 1.3 1.5
Italy 7.5 7.0 6.8 6.4 5.8 5.3 4.9
Hungary 4.5 4.2 3.3 3.0 2.5 2.4 2.4
Netherlands 2.3 1.5 1.2 0.8 0.7 0.7 1.0
Portugal 3.3 2.2 1.8 1.7 1.5 1.8 2.2
Slovenia 3.4 3.3 3.2 4.1 3.5 3.4 3.4
Finland 4.9 4.1 3.0 2.8 2.5 2.3 2.3
Sweden 3.1 2.6 1.9 1.4 1.0 1.0 1.0
UK 2.5 1.9 1.7 1.5 1.3 1.1 1.1
Source: Eurostat;: free data, social cohesion Long-term unemployment: females and males (1997-2000)
1997 1998 1999 2000
females males females males females males females males
EU 15 5.8 4.2 5.4 3.7 4.7 3.3 4.2 2.9
Belgium 7.1 4.2 7.0 4.5 5.9 4.1 4.6 3.0
Germany 5.6 4.3 5.3 4.2 4.7 4.0 4.2 3.7
Greece 9.3 2.8 9.9 3.1 10.5 3.7 9.8 3.5
Spain 14.1 5.7 12.4 4.8 9.4 3.7 7.6 2.8
France 5.7 4.0 5.5 3.9 5.1 3.5 4.4 2.9
Ireland 5.1 6.5 2.8 4.6 1.9 3.2 1.0 2.0
Italy 10.5 5.7 9.5 5.4 9.3 5.2 8.8 4.9
Hungary 4.0 4.9 3.9 4.5 2.9 3.6 2.5 3.4
Netherlands 3.1 1.8 1.8 1.3 1.5 0.9 1.0 0.6
Portugal 3.6 3.0 2.7 1.9 2.1 1.5 2.1 1.4
Slovenia 3.3 3.6 3.3 3.3 3.0 3.4 4.1 4.0
Finland 4.9 4.9 4.0 4.3 2.8 3.2 2.7 2.8
Sweden 2.0 4.0 1.8 3.2 1.4 2.2 1.0 1.7
UK 1.5 3.3 1.2 2.5 1.0 2.2 0.9 1.9

European Network Indicators on Social Quality Hungarian National Report, February 2005
European Foundation on Social Quality 149
Long-term unemployment: females and males (continued) (2001-2003)
2001 2002 2003
females males females males females males
EU 15 3.7 2.7 3.6 2.7 3.7 2.9
Belgium 3.6 3.0 4.1 3.2 4.0 3.4
Germany 4.1 3.7 4.2 4.0 4.6 4.6
Greece 8.6 3.1 8.3 3.0 8.5 2.8
Spain 6.3 2.3 6.3 2.3 6.0 2.4
France 3.7 2.4 3.5 2.6 3.9 3.1
Ireland 0.8 1.6 0.7 1.7 0.9 1.9
Italy 8.0 4.5 7.2 4.1 6.7 3.9
Hungary 2.1 2.9 2.1 2.7 2.3 2.5
Netherlands 0.8 0.5 0.8 0.6 1.1 1.0
Portugal 1.9 1.2 2.2 1.4 2.6 1.8
Slovenia 3.6 3.4 3.4 3.4 3.6 3.3
Finland 2.3 2.7 2.0 2.5 2.0 2.6
Sweden 0.8 1.2 0.8 1.2 0.8 1.2
UK 0.8 1.7 0.7 1.4 0.7 1.4
Source: Eurostat; free data, social cohesion Domain: Social networks Sub-domain: Neighbourhood participation 67. Proportion in regular contact with neighbours Percentage of population aged 16 and over talking to neighbours, 1999
EU B D EL E F IRL I NL P FIN S UK
At least once a week 81 71 - 96 90 - 89 80 70 86 79 - 78
Once or twice a month 10 17 - 2 5 - 7 10 14 8 12 - 13
Less than once a month or never 9 12 - 2 5 - 4 10 16 6 9 - 9 Source: Eurostat 2003, Living conditions in Europe Sub-domain: Friendships 68. Proportion in regular contact with friends Percentage of the population aged 16 and over meeting people (at home or elsewhere), 1999
EU B D EL E F IRL I NL P FIN S UK
At least once a week 81 78 - 90 92 66 97 81 85 74 80 - 87
Once or twice a week 14 18 - 9 6 26 3 13 13 16 17 - 10
Less than once a month or never 5 4 - 2 2 8 1 6 2 9 4 - 3
Source: Eurostat 2003, Living conditions in Europe

European Network Indicators on Social Quality Hungarian National Report, February 2005
European Foundation on Social Quality 150
4. Social Empowerment
Domain: Knowledge base Sub-domain: Availability of information 73. Per cent of population literate and numerate Competence poverty: proportion of educationally „poor” individuals in different countries based on literacy competences
B D EL F IRL I HU P FIN S UK
students aged 15 19 22,6 24,4 15,2 11 18,9 22,7 26,3 6,9 12,6 12,8
Population aged 16-65 15,3 9 - - 25,3 - 32,9 49,1 12,6 6,2 23,3
Source: PISA2000; Adult Literacy Survey, 1994-98 75. Access to internet Internet use in different European countries (% of individuals aged 14 and over)
B EL E IRL I HU NL P SL FIN S UK
Never use 56,3 86,6 75,1 58,3 69,8 80,4 40,7 69,9 64,1 43,9 33 51,4
Everyday use 18,1 4,2 9,3 13 9,9 5,7 21,7 14,8 10,6 18,8 27,8 17,7
Source: European Social Survey, 2002/2003 Domain: Labour market Sub-domain: Prospects of job mobility 80. % of employed labour force receiving work based training Continuing vocational training (CVT) in enterprises (1999)
EU B D EL E F IRL I NL P FIN S UK
Training enterprises as a % of all enterprises
62 70 75 18 36 76 79 24 88 22 82 91 87
Employees in training enterprises as a % of employees in all enterprises
88 88 92 56 64 93 92 56 96 52 95 98 97
Participants in CVT courses as a % of employees in all enterprises
40 41 32 15 25 46 41 26 41 17 50 61 49
Hours in CVT courses per employee (all enterprises)
12 13 9 6 11 17 17 8 15 7 18 18 13
Hours in CVT courses per participant 31 31 27 39 42 36 40 32 37 38 36 31 26
Source: Eurostat 2003, Living conditions in Europe

European Network Indicators on Social Quality Hungarian National Report, February 2005
European Foundation on Social Quality 151
Distribution of companies and enterprises that provide vocational training, 1999 (%)
Branch B D E HU NL P SL FIN S
Industry 68 73 38 34 90 19 53 77 90
Commerce 72 83 41 39 87 24 30 85 94
Finanacial services 100 100 74 79 97 67 66 100 100
Economic services 86 87 41 48 90 43 60 86 90
Other public and personal services 75 89 33 35 88 29 69 93 100
Other 63 65 29 31 86 18 46 79 84
Source: Eurostat 2002, Statistics in Focus

European Network Indicators on Social Quality Hungarian National Report, February 2005
European Foundation on Social Quality 152

European Network Indicators on Social Quality Hungarian National Report, February 2005
European Foundation on Social Quality 153
Annex Social Quality theory

European Network Indicators on Social Quality Hungarian National Report, February 2005
European Foundation on Social Quality 154

European Network Indicators on Social Quality Hungarian National Report, February 2005
European Foundation on Social Quality 155
In the 1990s representatives of universities from different European countries started to elaborate the
theory of social quality. Stimulated by neo-liberal globalisation and the dominance of economic
interests and herewith related economic thinking and policies in the process of European integration,
they were searching for an alternative. Important was to develop international standards with which to
counteract the downward pressure on welfare spending (the race to the bottom). But which standards
were acceptable, which theoretical criteria could be applied and why? The social quality initiative
addressed these questions and could be seen as a possible theoretical foundation upon which
judgements for acceptable standards could be made. The initiative was launched formally under the
Dutch Presidency of the European Union in 1997. The European Foundation on Social Quality,
localised in Amsterdam was founded and presented its first study; The Social Quality of Europe
(Kluwer Law International, 1997; paperback version by Policy Press, 1998). Social quality is a new
standard intended to assess economic, cultural, and welfare progress. One that can be used at all
levels to measure the extent to which the daily lives of citizens have attained an acceptable level. It
aspires to be both a standard by which people can assess the effectiveness of national and European
policies and a scientific yardstick for evidence-based policy making. It’s ambition is to contribute to
public policies that improve the democratic relations on European and national levels and that
enhance social justice and equity in the cities and regions of Europe.
From the beginning the theory’s aims has been to contribute to a comprehensive understanding of
societal processes and to develop an interdisciplinary approach. The social quality approach is a
strategy for analysing the reciprocity between societal structures and actions of citizens. The most
renewing aspect of this approach – and especially in this respect social quality differs from the
traditional (passive) welfare policies – is the addition of the concept of empowerment; a concept that
strengthens the roles of citizens in their communities. The goal is to contribute to the personnel
development of citizens to enable them to elaborate their own conditions for social quality in daily
circumstances.
The first study delivered the points of departure for the Amsterdam Declaration of Social Quality (June
1997) which opens with the words; “Respect for the fundamental human dignity of all citizens requires
us to declare that we do not want to see growing numbers of beggars, tramps and homeless in the
cities of Europe. Nor can we countenance a Europe with large numbers of unemployed, growing
numbers of poor people and those who have only limited access to health care and social services.
These and many other negative indicators demonstrate the current inadequacy of Europe to provide
social quality for all citizens”. This Declaration was finally signed by thousands scientists all over
Europe and presented solemnly to the President of the European Parliament in October 1997.
In this appendix to the national reports about the indicators of social quality we will not present the
whole theory, but only the aspects relevant for the application of this theory and for the analysis
ofsocietal trends and processes in the European Union. The project, for which these national reports
1 Introduction

European Network Indicators on Social Quality Hungarian National Report, February 2005
European Foundation on Social Quality 156
are made, tries to determine and compare the nature of social quality in the different European
countries.
The policy of the European Foundation on Social Quality is based on five pillars: (i) theorising social
quality, (ii) developing its measurement instruments, (iii) applying these instruments to policy
outcomes as well as circumstances in cities and regions, (iv) disseminating the Foundation’s
outcomes, and (v) stimulating public debates. In January 2001 the Foundation published the outcomes
of the ‘permanent symposium’ about social quality and the outcomes of its projects in a second book;
Social Quality, A New Vision for Europe (Kluwer Law International, 2001). In the Foreword of this book
Mr. R. Prodi, the former President of the European Commission, says that “The concept of quality is,
in essence, a democratic concept, based on partnership between the European institutions, the
Member States, regional and local authorities and civil society. Quality conveys the sense of
excellence that characterises the European social model. The great merit of this book is that it places
social issues at the very core of the concept of quality. It promotes an approach that goes beyond
production, economic growth, employment and social protection and gives self-fulfilment for individual
citizens a major role to play in the formation of collective identities. This makes the book an important
and original contribution for the shaping of a new Europe”.
Thanks to this work the Foundation was rewarded for a manifold of grants. The most important were,
first, a grant by DG Employment and Social Affairs for analysing employment policies from a social
quality perspective. The main theme concerned the way the social quality approach may underpin
flexibility and security in employment. The outcomes were published by Berghahn Journals in the
double issue of the European Journal of Social Quality in 2003. The second important grant was
rewarded by DG Research to develop a robust set of indicators with which to measure the conditional
factors of social quality. This resulted in the start of the European Network on Indicators of Social
Quality in October 2001. Representatives of fourteen universities in Europe and of two European
NGOs participated in this network (see page iv of the national report). They were funded to appoint
part-time junior scientists as assistants.
2 The European Network on Indicators of Social Quality (ENIQ)
2.1 The Foundation’s second book as point of departure

European Network Indicators on Social Quality Hungarian National Report, February 2005
European Foundation on Social Quality 157
The network had to deal with a couple of challenges. Within the network people, firstly, used different
interpretations of the social quality theory. Secondly, they used different research methodologies.
Thirdly, they had different cultural backgrounds (including different scientific backgrounds; like
economics, political science, sociology, social policy), and fourthly, they had to deal with the language
problem for proper communication. Therefore one of the major objectives of this network was to
develop a common understanding. This goal was reached by a combination of deductive and inductive
analysis in different stages of the project. In the first stage a preliminary consensus about the theory –
discussed during plenary sessions - was tentatively applied in the fourteen national contexts. It
concerned the first assessment of data availability in national and European databases for one
conditional factor of social quality. The outcomes stimulated to deepen the common understanding
and relationship between the four different conditional factors of social quality. The next stage was
used for a second tentative application, now for all factors. The outcomes of the second exploration of
data availability paved the way for the elaboration of the commonly accepted interpretation of the
conditional factors (see below).
Especially thanks to the input by the network, the co-ordinating team and its advisors could specify
and clarify the theory by defining the essence of the four conditional factors from a new interpretation
of ‘the social’. This was done also by analysing the general scientific and European policy debates
about the concepts. The outcomes of this theoretical work paved the way for the third (and last)
exploration of data availability in the fourteen countries, resulting in the national reports about
indicators of social quality. In other words, the work by the network stimulated an incessant reciprocity
between empirical exploration and theoretical work. The outcomes of this theoretical work and the
interpretation of the outcomes of the national reports will be published in the Foundation’s third study,
forthcoming at the end of 2005.
2.2 The challenge of the Network Indicators

European Network Indicators on Social Quality Hungarian National Report, February 2005
European Foundation on Social Quality 158
In this section a short overview will be given of the theoretical research of the project. This theoretical
background is essential to understand the choice of the indicators for social quality on which the
empirical research of the national reports is based.
A fundamental problem of any comprehensive theoretical approach is to grasp the structural and
dialectical interdependence of what Emile Durkheim called ‘social facts’. The reason for mentioning
Durkheim here is that in his definition of ‘social facts’ he explicitly showed the supposed independence
of ‘the social’. We should however remark that ‘the social’ can only accurately be understood by
reference to the individual as actor. The actual problem can be seen in the fact that we are challenged
to think the seemingly impossible – the simultaneity of independence and dependence. Furthermore,
we have to accentuate the position of individual people as social actors in order to realise the goal of
social quality, namely understanding the reciprocity between social structures and actions of citizens.
The social quality approach tries to resolve the actual tension behind action and structure in a
dialectical way. Social science is by definition a theory of action (this is not the same as the so-called
‘action theory’), as the social cannot be imagined without actions or interventions by individual people.
Instead of leaving this to spontaneous and voluntarist assessments it is proposed to search for criteria
that allow the analysis of the developmental interconnectedness of both, the biographical and societal
momentum of interaction; (i) amongst individual people, (ii) between individual people and society, (iii)
amongst societal subsystems and not least (iv) between the various social actors and the natural
environment. The social quality approach can serve as a comprehensive or meta-theory for
addressing this interconnectedness. Rather than referring to actors and structure, this approach refers
on the one hand to biographical and on the other hand to societal development. At the very same
time, another reference is made to systems on the one hand and communities on the other hand.
Starting point of developing such a perspective is to look at a common denominator, i.e. criteria which
are necessary for their constitution. This is not achieved by looking for minimal standards. Rather, the
idea is that there should be a strong commonality in terms of the recognition of all four angles of the
social fabric. This is meant to be a substantial dimension of the relationship between action and
structure. We recognise four conditional factors of social quality, namely: (i) socio-economic security,
(ii) social cohesion, (iii) social inclusion, and (iv) social empowerment. These four conditional factors
define the concrete qualitative frame, in which society, individuals and their interaction develop.
3 Some aspects of the theory and its indicators
3.1 The reciprocity between structure and action
3.2 The four conditional factors
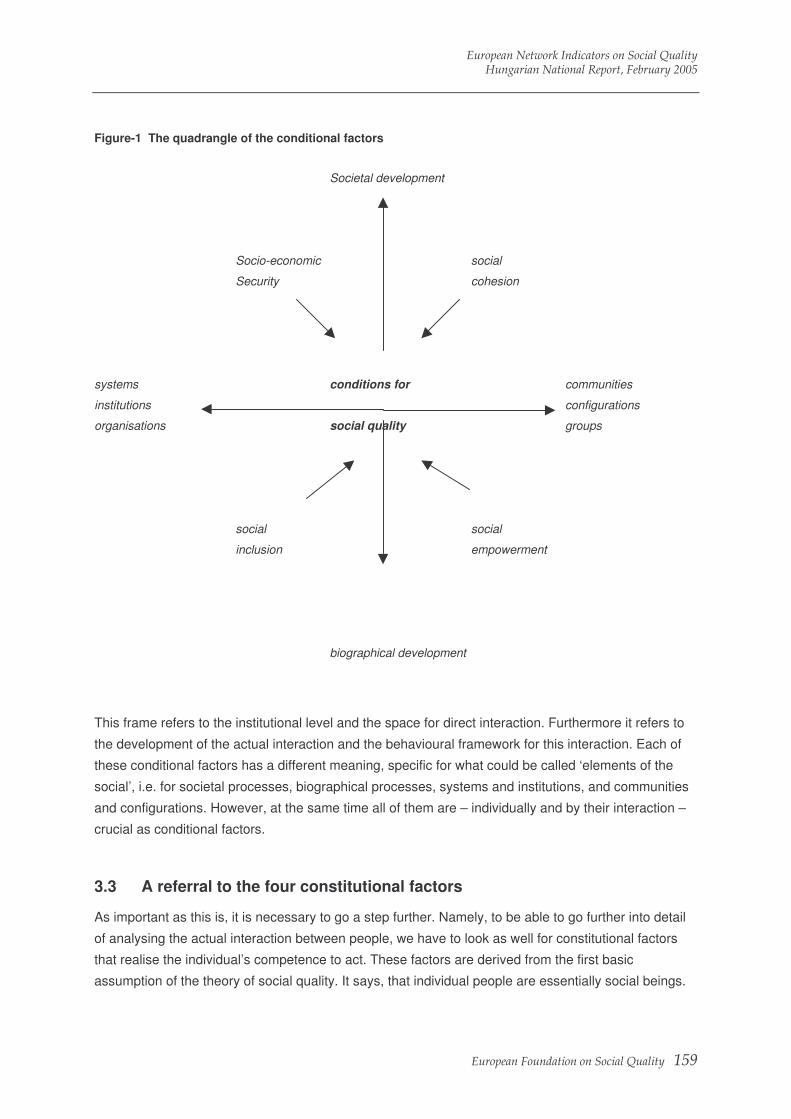
European Network Indicators on Social Quality Hungarian National Report, February 2005
European Foundation on Social Quality 159
Figure-1 The quadrangle of the conditional factors
Societal development
Socio-economic social
Security cohesion
systems conditions for communities
institutions configurations
organisations social quality groups
social social
inclusion empowerment
biographical development
This frame refers to the institutional level and the space for direct interaction. Furthermore it refers to
the development of the actual interaction and the behavioural framework for this interaction. Each of
these conditional factors has a different meaning, specific for what could be called ‘elements of the
social’, i.e. for societal processes, biographical processes, systems and institutions, and communities
and configurations. However, at the same time all of them are – individually and by their interaction –
crucial as conditional factors.
As important as this is, it is necessary to go a step further. Namely, to be able to go further into detail
of analysing the actual interaction between people, we have to look as well for constitutional factors
that realise the individual’s competence to act. These factors are derived from the first basic
assumption of the theory of social quality. It says, that individual people are essentially social beings.
3.3 A referral to the four constitutional factors
European Network Indicators on Social Quality Hungarian National Report, February 2005
European Foundation on Social Quality 160
They interact with each other and these interactions constitute the collective identities as contexts for
their actions, resulting in processes of self-realisation.
This theme is presented for the first time in the Foundation’s second book of January 2001 and will be
elaborated in the Foundation’s third book. The relationship between the constitutional factors and the
conditional factors – theoretically and practically – will be analysed. For the European Network on
Indicators of Social Quality the nature of the conditional factors in the fourteen national countries is the
‘heart of the matter’.
The measurement tools of the conditional factors are indicators. Indicators of social quality are thus –
to be precise – ‘indicators of the conditional factors of social quality’. As said, the network’s challenge
was to develop a robust set of these indicators. A condition was to clarify and to elaborate the social
quality theory. This was done by applying deductive and inductive approaches that increased the
understanding of the nature of the four conditional factors substantially. Thanks to four plenary
sessions of the network’s participants and three plenary sessions of their assistants, all those engaged
could reach an agreement on the final definition of the four conditional factors, and recognise their
domains and sub-domains. This delivered the consensus necessary for the development of indicators
for all sub-domains that are relevant for the understanding of the nature of the conditional factor in
question. The outcomes of this process are presented in the national reports. The following steps are
made to syntonize all relevant concepts and to define the set of indicators: firstly, to determine the
subject matter and definition of the conditional factors; secondly, to relate these definitions to each
other as well as to the subject matter of ‘the social’; thirdly, to determine the conditional factors’ most
essential domains; fourthly, to determine the nature of the sub-domains. As argued already these
steps were based on the reciprocity between empirical explorations in the different countries and
theoretical elaboration of the conditional factors of social quality, thus between inductive and deductive
approaches. It may be illustrated as follows:
4 The national reports about the indicators of social quality
4.1 The steps made by the network
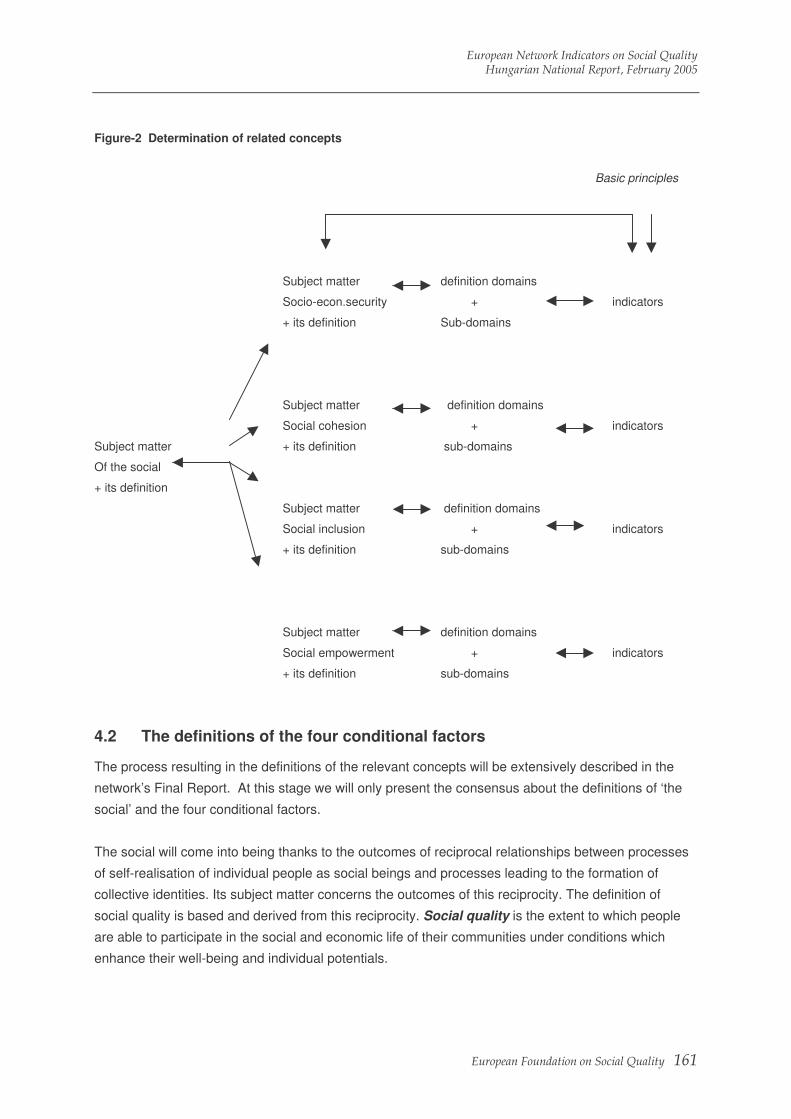
European Network Indicators on Social Quality Hungarian National Report, February 2005
European Foundation on Social Quality 161
Figure-2 Determination of related concepts
Basic principles
Subject matter definition domains
Socio-econ.security + indicators
+ its definition Sub-domains
Subject matter definition domains
Social cohesion + indicators
Subject matter + its definition sub-domains
Of the social
+ its definition
Subject matter definition domains
Social inclusion + indicators
+ its definition sub-domains
Subject matter definition domains
Social empowerment + indicators
+ its definition sub-domains
The process resulting in the definitions of the relevant concepts will be extensively described in the
network’s Final Report. At this stage we will only present the consensus about the definitions of ‘the
social’ and the four conditional factors.
The social will come into being thanks to the outcomes of reciprocal relationships between processes
of self-realisation of individual people as social beings and processes leading to the formation of
collective identities. Its subject matter concerns the outcomes of this reciprocity. The definition of
social quality is based and derived from this reciprocity. Social quality is the extent to which people
are able to participate in the social and economic life of their communities under conditions which
enhance their well-being and individual potentials.
4.2 The definitions of the four conditional factors
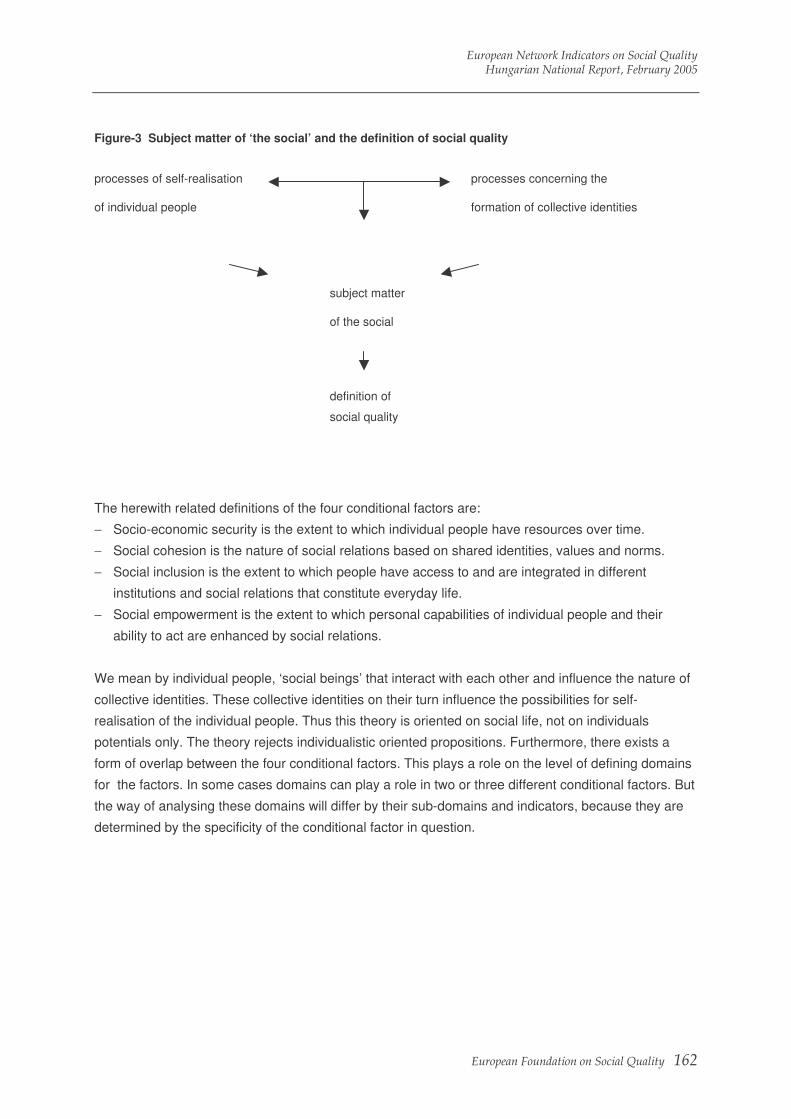
European Network Indicators on Social Quality Hungarian National Report, February 2005
European Foundation on Social Quality 162
Figure-3 Subject matter of ‘the social’ and the definition of social quality
processes of self-realisation processes concerning the
of individual people formation of collective identities
subject matter
of the social
definition of
social quality
The herewith related definitions of the four conditional factors are:
− Socio-economic security is the extent to which individual people have resources over time.
− Social cohesion is the nature of social relations based on shared identities, values and norms.
− Social inclusion is the extent to which people have access to and are integrated in different
institutions and social relations that constitute everyday life.
− Social empowerment is the extent to which personal capabilities of individual people and their
ability to act are enhanced by social relations.
We mean by individual people, ‘social beings’ that interact with each other and influence the nature of
collective identities. These collective identities on their turn influence the possibilities for self-
realisation of the individual people. Thus this theory is oriented on social life, not on individuals
potentials only. The theory rejects individualistic oriented propositions. Furthermore, there exists a
form of overlap between the four conditional factors. This plays a role on the level of defining domains
for the factors. In some cases domains can play a role in two or three different conditional factors. But
the way of analysing these domains will differ by their sub-domains and indicators, because they are
determined by the specificity of the conditional factor in question.
European Network Indicators on Social Quality Hungarian National Report, February 2005
European Foundation on Social Quality 163
In all national reports the domains, sub-domains and indicators are presented in order to assess the
data availability for these indicators. At this stage we will summarise some results of this approach:
− The indicators reflect processes of interacting social beings. In comparison with other approaches,
the social quality approach has paid a lot more attention to the theoretical foundation of the
indicators. It distinguishes ‘the social’ from the economic. Or more precise, the economic is seen as
an aspect of ‘the social’ as is the cultural, the juridical etc. This prevents the trap of explaining
social policy (or welfare policy) as a productive factor for economic policy and economic growth.
The social has its own raison d’etre.
− For the first time in the academic world concepts as socio-economic security, social cohesion,
social inclusion and social empowerment are theoretically related with each other. The social
quality theory demonstrates the intrinsic affinity of these four conditional factors. Herewith it
addresses the existing scientific and policy-making fragmentation.
− Thanks to the applied method we have the possibility to analyse the nature and relationships
between different policy areas. For example the relationship between economic policy, social policy
and employment policy – see the Lisbon strategy – cannot be properly analysed without an
intermediary. Social quality and the knowledge about the nature and changes of the four
conditional factors deliver the points of departure for such an intermediary.
− The network has constructed indicators for measuring the nature and changes of the four
conditional factors. By applying these indicators we dispose of a new tool for international
comparison that is based on theoretically grounded concepts. Thanks to the application of this tools
we are able to analyse the convergence and divergence between the Member States of the
European Union with regard to these conditional factors of social quality. This could have added
value for international comparison.
− Thanks to the assessment of the data availability of the indicators – as is done in each national
report – we recognise the highly differentiated character of the countries of the European Union.
This differentiated character cannot be captured by a reduction to a small number of social models.
At the same time we recognise an intrinsic affinity in the emphasis on equity and solidarity between
most of the countries involved. This outcome of the national reports will deliver good points of
departure for future research on the comparison of the essence of the developmental approach of
the European Union, the USA and the Asian countries.
5 Conclusions
Related Documents