European Higher Education Institutions: Building a Typology of Research Ben Jongbloed, Benedetto Lepori, Carlo Salerno and Stig Slipersæter An interim report for the project Changes in University Incomes: Their Impact on University-Based Research and Innovation (CHINC) Under contract with the European Commission No. 22537-2004-12 F1ED SEV NO 1

Welcome message from author
This document is posted to help you gain knowledge. Please leave a comment to let me know what you think about it! Share it to your friends and learn new things together.
Transcript

European Higher Education Institutions: Building a Typology of Research
Ben Jongbloed, Benedetto Lepori, Carlo Salerno and Stig Slipersæter
An interim report for the project Changes in University Incomes:
Their Impact on University-Based Research and Innovation (CHINC)
Under contract with the European Commission No. 22537-2004-12 F1ED SEV NO
1

The project “Changes in University Incomes: Their Impact on University-Based Research and Innovation (CHINC)” is done under service contract with the European Commission, represented by the Institute for Prospective Technological Studies of the Joint Research Centre under contract number 22537-2004-12 F1ED SEV NO The following institutions take part in the project:
Centre for Higher Education Studies (CHES), Czech Republic
The Danish Centre for Studies in Research and Research Policy, Århus
University, Denmark
Observatoire des Sciences et des Techniques, France
Innovation Research Centre, Corvinus University of Budapest, Hungary
Scuola Superiore, Sant' Anna di studi universitari e di perfezionamento, Italy
Center for Higher Education Policy Studies (CHEPS), Universiteit Twente,
the Netherlands
NIFU STEP, Norway
Institute for Innovation and Knowledge Management INGENIO, Spain
Istituto Comunicazione e Formazione – IceF, Universita della Svizzeria italiana,
Switzerland
SPRU (Science and Technology Policy Research), University of Sussex,
United Kingdom
2

Contents Towards a Typology of European Higher Education Institutions ...................................... 4
Introduction..................................................................................................................... 4 Classification of systems................................................................................................. 5 Classification of institutions ........................................................................................... 6 Conceptualizing and constructing a practical typology ................................................ 10 Operationalization......................................................................................................... 13 Developing a classification ........................................................................................... 14
Preliminary analysis of the sample ................................................................................... 18 Methodological limitations ........................................................................................... 19 Higher education institutions in Europe – a first overview .......................................... 20 A first attempt at a typology ......................................................................................... 24
References......................................................................................................................... 30 Methodological Annex...................................................................................................... 31
3

Towards a Typology of European Higher Education Institutions
Introduction When making a survey of the changes in university income categories – in
particular the revenues for research – it is useful to have at one’s disposal a typology for
classifying the institutions in the survey. A classification, or typology, of higher
education institutions is a useful mechanism for describing institutional diversity. It
provides a framework for characterizing institutions on the basis of a set of dimensions
and in this way can assist the typology’s users when analyzing or drawing comparisons
among varied higher education providers. In no place is the need for such a classification
more necessary today than in Europe, where more than 3,000 higher education
institutions stretching across some 30 countries arguably form the most diverse collection
of both education and research programs seeking to operate under a more general, and
more common, framework.
Such diversity is one of the budding system’s strengths, yet when the degree of
diversity becomes so high, transparency inherently becomes low. To those within and
outside of higher education (e.g., students, businesses, academic researchers, institutional
researchers and policy analysts) that must constantly grapple with higher education’s
complexity, it is often unclear where to begin when comparisons or analyses are
warranted. To get an overview, this complexity needs to be reduced to manageable
proportions. In the course of doing this, the objects (in our case: higher education
institutions, universities) subjected to the classification are grouped together into a
limited set of categories that each have their distinctive characteristics.
A classification can help if one would like to know to which family, class or group
a particular higher education institution belongs. However, the first thing that one needs
to know is in which country the higher education institution is situated. In other words, it
can make a large difference if one knows that university A is located in country B.
Therefore, the objects of classifications are not restricted to providers of education and
4

research but may also be extended to entire higher education systems, or indeed science
(R&D) systems. Although the main aim of the Changes in University Incomes (CHINC)
project is to provide insight into the changes in the research portfolio of individual higher
education institutions, it makes sense to also briefly mention system-wide classifications.
Classification of systems In the field of higher education studies, some attempts were made to classify
national systems of higher education. Scholars who focused on the national level, such as
Clark (1983), Goedegebuure et al (1994), Teichler (1988), and van Vught (1989), have
analyzed characteristics of higher education systems in a comparative way, but their
methods do not lend themselves for a classification of the countries involved on the basis
of measurable indicators. At best higher education systems have been compared on the
basis of subjective dimensions that allowed for a relative positioning of countries without
these dimensions being combined into discriminating categories. Clark’s “triangle of
coordination”, for example, allowed for a positioning of countries on the dimensions
‘state versus market coordination’, ‘market versus academic oligarchy coordination’, and
‘academic oligarchy versus state coordination’, but these dimensions were not
operationalized in the sense that Clark did not present indicators that could be used to
interpret the position of a country on the dimension. Therefore it was impossible to
determine/measure whether, for example, France was on the dimension state versus
academic oligarchy closer to the state extreme of the dimension than Sweden.
More recently, and more close to the topic of the CHINC project, the OECD has
looked into the steering and funding of research institutions and, in analyzing the data,
has made an attempt to group countries according to a functional taxonomy.1 The OECD
taxonomy relates to the countries’ patterns of funding and R&D performance. Taking into
account only the public sector research, it came to the conclusion that government is the
main funder in all OECD countries observed, but in addition it made the following
typology of public research systems (between brackets our ‘CHINC-countries’):
1 OECD (2001), AD HOC WORKING GROUP "STEERING AND FUNDING OF RESEARCH INSTITUTIONS" 13-14 March 2001. See: http://www.oecd.org/dataoecd/43/10/2507864.pdf
5

1. Countries where universities are the most important research performer (Denmark, Italy, Netherlands, Norway, Spain, Switzerland)
2. Countries where there is a balance with regard to performance between universities and public research institutions (France, Germany)
3. Countries (in particular in Central Europe) where public research institutions play the major role for public sector research (Czech Republic, Hungary).
This typology is worth keeping in mind when interpreting the results of our analysis
of funding trends in European universities. Differences in particular research revenue
streams across universities may be explained by referring to the between-country
variance as well as the within country variance.
The above information on the funding structures for public R&D were the subject
of the OECD report Governance of Public Research – Towards Better Practices (OECD,
2003). This report, also mentioned in the EUA study on The Funding of University-based
Research and Innovation in Europe (Conraths & Smidt-Södergard, 2004) makes mention
of three archetypes for science systems:
1. The Centralized Archetype: Top down priority setting from ministry/central
government, funding streams directly to public research institutions and universities, no independent funding agencies. This model partly applies to many systems in the new member states and to a certain extent in France.
2. The Dual System Archetype: Federal and regional structure and ministries, both bottom-up and top-down practice, a mix of direct funding for public research institutions and universities AND competitive grant programmes offered by independent funding agencies (Research Councils or Associations). This model is applicable to Germany, UK, Norway, The Netherlands, Italy, and Switzerland.
3. The Decentralized Archetype: Multiple ministerial research responsibilities, a primarily bottom-up agenda setting, mostly project funding via competitive grants from independent agencies. This model seems to be the least represented system in Europe.
Classification of institutions When it comes to making a typology of individual higher education institutions the
best known example of a successfully employed higher education typology is the
Carnegie Classification System. In place for more than 30 years now, its original purpose
was to support higher education and research by identifying categories of American
6

colleges and universities that are functionally similar. Over the years researchers and
policymakers gradually adopted it for other purposes; so much so that today one is hard
pressed to find academic research or policy documents related to higher education that do
not, at some point, make some reference to the Carnegie Classification. Even the general
public in the United States has more than a passing familiarity with it, as it is also used in
the influential rankings of American colleges and universities produced annually by the
popular periodical US News and World Report.
Carnegie classification What makes the Carnegie Classification so relevant and useful to the current study
is its simplicity and dynamism: two characteristics we see as crucial for the development
and implementation of a European higher education research typology. Though the soon-
to-be-released incarnation will be the most expansive typology to-date, it relishes its
widespread reputation for being “a tool for rendering the diversity of US higher education
into analytically manageable, reasonably homogeneous groupings of roughly comparable
institutions” (McCormick, 2004). Moreover, such simplicity has successfully adapted
itself over time. The functions of American colleges and universities have changed
dramatically since the early-1970s as have the issues and priorities relevant to key
stakeholders. In response, Carnegie has undergone four methodological revisions since its
introduction. The first classification was developed in 1973 by Clark Kerr. New versions
appeared in 1976, 1987, 1994 and 2000. Currently it is being revised again – this time
more drastically – for the 2005 classification due out soon (McCormick, 2004). Like the
previous systems, the new classification will include all 3 941 US universities and
colleges that are degree granting and accredited.
The 1994 Classification (i.e. the fourth edition), for instance, distinguishes: research
universities I, research universities II, doctoral universities I, doctoral universities II,
Master’s (comprehensive) colleges and universities I, Master’s (comprehensive) colleges
and universities II, baccalaureate (liberal arts) colleges I, baccalaureate colleges II,
associate of arts colleges, and specialised institutions. The qualifications “I” and “II”
were merely indicators of size: size of federal financial support, number of PhDs granted,
student enrolment, and level of selectivity. A main difference between the 2000 edition
7

and the 1994 edition is that the four doctoral institution categories have been collapsed
into two categories. Another difference between the 2000 Classification and the previous
one was the elimination of federally sponsored research as the proxy to indicate an
institution’s research emphasis.2 There are other conceptual and technical differences
between classifications over time, but the backbone remains similar: institutions are
classified on the basis of their research and teaching objectives, the degrees offered, their
size and their comprehensiveness. The backbone clearly refers to the institutions’
missions.
The Carnegie classification over the years has provided, as McCormick states, “a
single approach to characterizing the diversity in US higher education”. However, today
there are many questions for which different groupings of ‘similar institutions’ may be
more suitable. A classification should always be matched to a specific analytical purpose.
To help address the variety in questions that require a classification of some sort, the
Carnegie Foundation’s 2005 edition will replace the present single classification scheme
with a set of distinct, parallel schemes that will include different sets of institutional
characteristics. Apart from the traditional classification that looks at the institutions’
research activity (albeit based on a multidimensional set of research measures compared
to the previous classifications), other classification criteria will focus on:
(1) undergraduate programs, (2) graduate programs, (3) overall student profile, (4) size
and setting (urban, suburban, rural), (5) undergraduate education, and (6) service and
community engagement. In other words, different criteria related to institutional
characteristics will be used to assess similarities and differences between institutions in
such a way that institutions will be grouped into mutually exclusive categories.
2 The reasons cited are: “First, federal support is at best a rough proxy for an institution’s research
activity that suffers from several weaknesses. Not all research is federally funded, and institutions differ in the proportion of all research that is funded from federal sources. Similarly, academic fields differ in their reliance on federal research funding and also in the costs associated with research. Thus a focus on federal dollars pays greater attention to fields that are heavily dependent on federal funding and also to fields where research requires substantial investments. The federal obligations data are also blind to the pass-through of funds from one institution to another, as happens in the case of large projects involving research teams at different institutions. All of these factors compromise the accuracy of federal obligations as a gauge of overall research activity (see: http://www.carnegiefoundation.org/Classification/CIHE2000/background.htm).
8

The latest editions therefore are based on different definitions than Kerr’s original
ones – they are more teaching than research based, focusing on the number and type of
degrees an institution awards, rather than on research or selectivity in admissions. The
reason is that the research-based classifications were criticized by teaching institutions
and other actors for providing a positive bias towards the research function in higher
education, and consequently for stimulating academic drift based on research. Given this
development it is obvious that for our project the first three editions are more interesting
and relevant. If one would like to come to a European version of the Carnegie
classification, the 1987 edition of the Carnegie classification would seem to be most
relevant for our purposes.
Speaking of European classification attempts, it is good to mention the recent
initiative by a group of (mostly Dutch) researchers that aims to explore the viability of
designing a typology of higher education institutions in Europe. The project was granted
funding in the framework of the Socrates program and so far has produced a progress
report that outlines the goals of the project and proposes a set of criteria for a typology
(Van Vught et al., 2005). Like the Carnegie Foundation initiative, it mentions the wish to
produce a multi-dimensional classification based on objective data. It will be interesting
to see to how this European initiative develops and, in particular, how it operationalizes
the research (versus teaching) dimension as it is the key focus of our project.
Summarizing the above we would like to state that a different perspective (i.e. the
perspective of college attendance, relevant to prospective students and their parents,
versus the perspective of academic research, relevant for research-based classifications)
will lead to a different typology. Because the world – and indeed the world of academic
research – is dynamic and very much driven by market forces, one has to be aware that
classification dimensions will be able to capture the important developments one intends
to study. Institutions will change places in a typology over the years, but typologies
themselves also change.
9

Conceptualizing and constructing a practical typology Identifying the relevant framework and subsequent criteria on which a typology can
be based is complicated on many fronts; not the least of which is securing relevant and
objective data. When undertaking a classification exercise across a wide range of
countries one also runs into the thorny issue of different (and oftentimes multiple or even
overlapping) contexts and institutional settings. The core concern at this stage of the
CHINC project is developing a typology for characterizing accredited European higher
education institutions with respect to their varied research portfolios, yet it is clear that a
concept like “research” is neither easily defined nor operationalized.
Research-based typologies can be developed from a number of different angles
depending on what needs the typology is meant to serve. What type of research do
institutions do? Is it basic, applied or possibly strategic? What kind of institution is
doing the work? To what extent is research being conducted in traditional universities,
specialized institutions (e.g., technical institutes), or professional education institutions?
Who sponsors the research? Does funding come primarily from government (perhaps
integrated with annual appropriations), research councils, industry, charitable foundations
or international sources? How much research capacity do institutions have? Does an
institution have a relatively large number of research staff? Does it train sizeable cohorts
of PhDs? How much output is produced? Does an institution only conduct a relatively
low amount of research? Is the institution’s research concentrated in a small number of
programs or is it more evenly distributed across the entire institution’s disciplinary base?
Of course none of the groupings above are mutually exclusive. More complicated and
more elaborate frameworks might incorporate some or possibly even all of the
perspectives above.
Hence, like the Carnegie Classification, developing and implementing the simplest
yet most encompassing typology is critical. The number of dimensions on which it is
based cannot be too large and the necessary data for positioning institutions ought to be
available in all countries or at least possible to collect without incurring too great a cost.
Nevertheless, given that one of the CHINC project’s overall objectives is to broadly
characterize European higher education research activities, the best typology would
incorporate as many of these varied considerations as is possible.
10
Taking each of the factors above into account, we chose to build the typology
around the following two dimensions:
1. Research versus teaching orientation. This is intended to reflect institutions’
observed missions.
2. Research intensity. This is intended to reflect the extent to which institutions engage in research relative to other activities.
From an implementation standpoint, the use of such dimensions enjoys support
from the fact that the Carnegie Classification has historically used similar measures.
Perhaps the strongest justification though is that these particular dimensions arguably
capture the broadest characterizations of institutions’ research: relative importance and
intensity in comparison to institutions’ other core tasks. Notions like type of research
done, the type of institution doing it or sources of financial support are clearly important.
However, these measures can be thought of as sub-classifications of research
intensity/distribution. In other words they are: 1) inherently narrow in their focus, and
2) possibly inapplicable to certain types of higher education providers. Dimensions that
account for mission and intensity are appealing specifically because they are inclusive.
They make it possible to position all higher education providers, not just research
institutions, including those that do very little or perhaps no research.
Because the unit-of-analysis is the institution, it is also critical that our typology
account for the relatively large number of providers that are not comprehensive in scope
but instead have narrow disciplinary foci. Since relative research intensity depends
greatly on the disciplines doing the work, the volume of research done in technical or
natural sciences institutions (where higher capital costs translate into larger project
budgets) will systematically vary in different ways than it will at institutions that are
strongly humanities-, social science- or performance arts-based. What is more, since
different disciplines often conduct different types of research (e.g., engineering faculties
generally do a balanced amount of basic and applied research and their income portfolio
is likely to include both public and private funding whereas physicists and geologists are
more prone to doing basic research and securing the bulk of their funding from
11
governments and national research councils), relying solely on the two dimensions will
invariably produce misleading and sometimes even strange results.
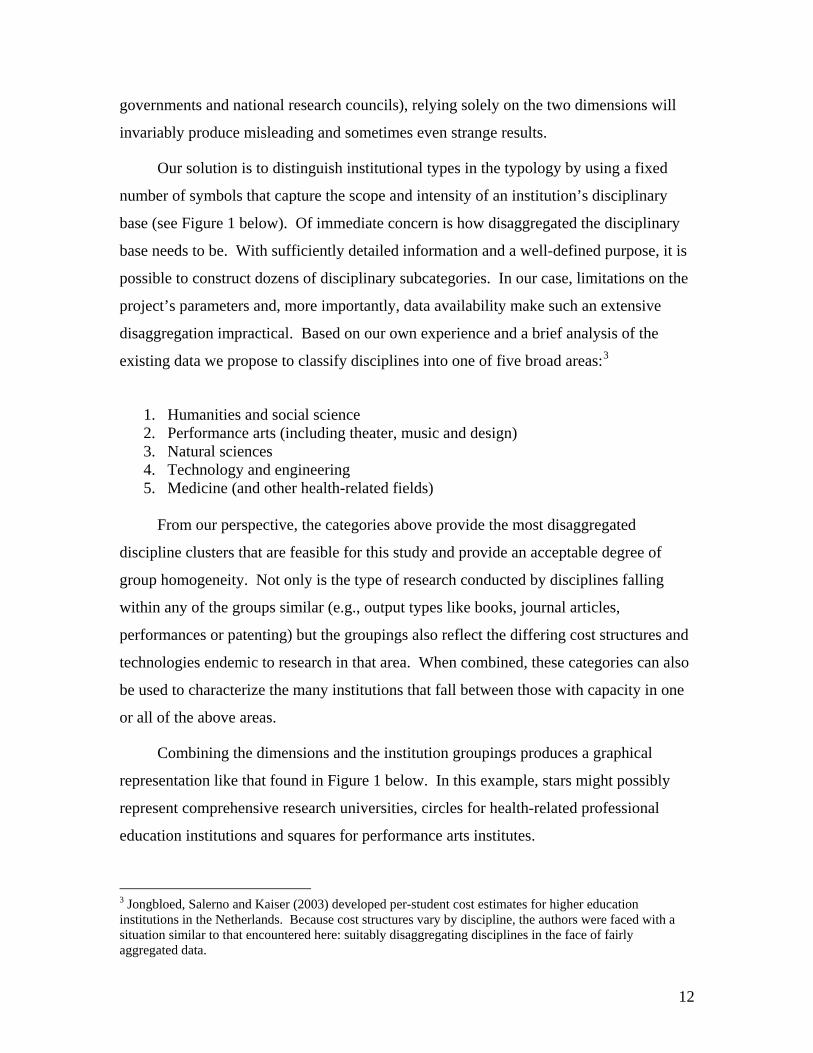
Our solution is to distinguish institutional types in the typology by using a fixed
number of symbols that capture the scope and intensity of an institution’s disciplinary
base (see Figure 1 below). Of immediate concern is how disaggregated the disciplinary
base needs to be. With sufficiently detailed information and a well-defined purpose, it is
possible to construct dozens of disciplinary subcategories. In our case, limitations on the
project’s parameters and, more importantly, data availability make such an extensive
disaggregation impractical. Based on our own experience and a brief analysis of the
existing data we propose to classify disciplines into one of five broad areas:3
1. Humanities and social science 2. Performance arts (including theater, music and design) 3. Natural sciences 4. Technology and engineering 5. Medicine (and other health-related fields)
From our perspective, the categories above provide the most disaggregated
discipline clusters that are feasible for this study and provide an acceptable degree of
group homogeneity. Not only is the type of research conducted by disciplines falling
within any of the groups similar (e.g., output types like books, journal articles,
performances or patenting) but the groupings also reflect the differing cost structures and
technologies endemic to research in that area. When combined, these categories can also
be used to characterize the many institutions that fall between those with capacity in one
or all of the above areas.
Combining the dimensions and the institution groupings produces a graphical
representation like that found in Figure 1 below. In this example, stars might possibly
represent comprehensive research universities, circles for health-related professional
education institutions and squares for performance arts institutes.
3 Jongbloed, Salerno and Kaiser (2003) developed per-student cost estimates for higher education institutions in the Netherlands. Because cost structures vary by discipline, the authors were faced with a situation similar to that encountered here: suitably disaggregating disciplines in the face of fairly aggregated data.
12
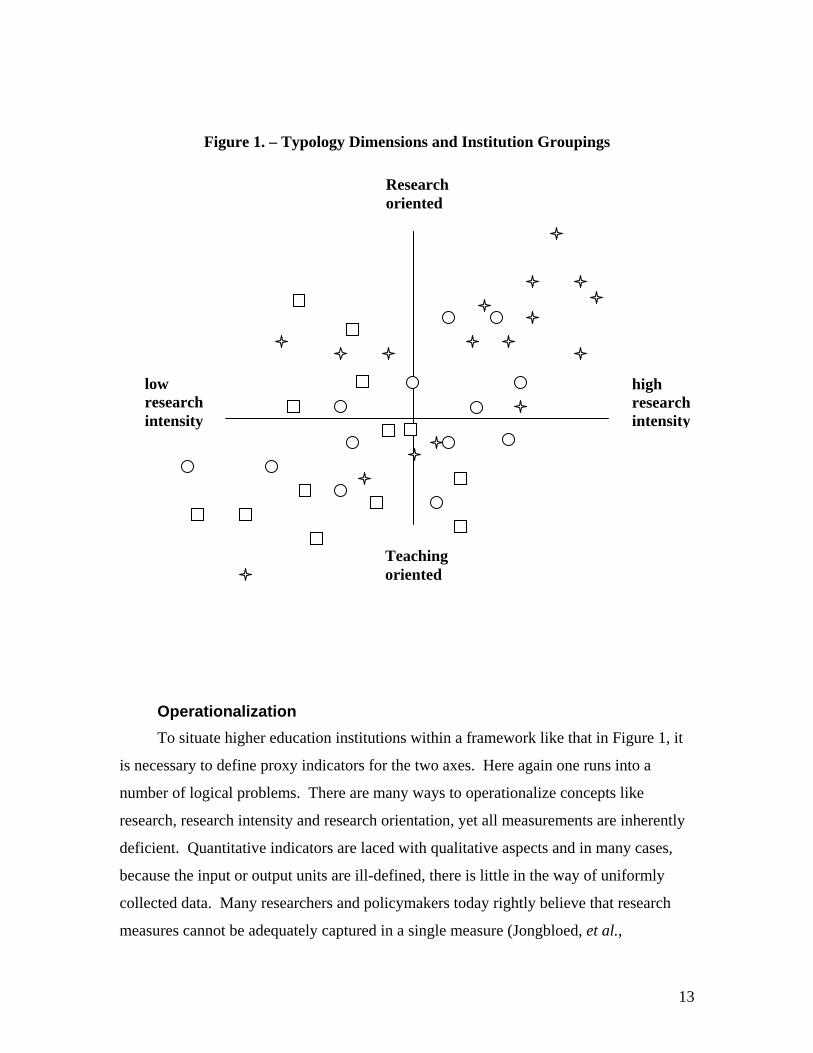
Figure 1. – Typology Dimensions and Institution Groupings Research
oriented
low research intensity
high research intensity
Teaching
oriented
Operationalization To situate higher education institutions within a framework like that in Figure 1, it
is necessary to define proxy indicators for the two axes. Here again one runs into a
number of logical problems. There are many ways to operationalize concepts like
research, research intensity and research orientation, yet all measurements are inherently
deficient. Quantitative indicators are laced with qualitative aspects and in many cases,
because the input or output units are ill-defined, there is little in the way of uniformly
collected data. Many researchers and policymakers today rightly believe that research
measures cannot be adequately captured in a single measure (Jongbloed, et al.,
13

forthcoming) yet the problem they face, and that which we do here as well, is determining
what components most appropriately belong in the relevant basket of indicators. Should
they be input-oriented? Output-oriented? Both? And if both, should input and output
measures be equally weighted? It is a well regarded maxim in higher education research
that definition and choice of research measurement is the quintessential methodological
shortcoming to empirical studies.
With these factors in mind, we believe that two particular quantitative measures
would be most useful: 1) numbers of degrees conferred and 2) research income earned
by institutions. The first is readily observable, though some differences clearly exist
between countries when it comes to the type of degrees conferred below the PhD level.
What is more, the PhD is, for all intents and purposes, universally recognized for what it
bestows in individuals. The other indicator, research income, is the core topic of the
CHINC project and is used in our framework for evaluating research intensity. In our
view, other useful indicators like research or academic staff, publication counts or time
spent on research are of dubious value if only for a lack of reliable and comparable data.
To sum, while it is possible to select a number of different proxy measures for the
two axes, because we seek to be as inclusive and broad as is possible, our choice of
measures was designed to accommodate data availability problems. Though this study
only looks at a fixed number of European countries, the expectation is to apply this
typology in a much larger pan-European framework. With different countries using
different reporting standards and collecting data for their own particular purposes, our
experience leads us to believe that, while not perfect, the measures represent a suitable
“second-best” solution.
Developing a classification The next step is to create a classification scheme from the typology. We do this by
taking the typology above and analyzing it with respect to the following four criteria (an
example of the overlay between the two can be found in Figure 2 below):
1. Highest type of degree offered. When this is a PhD, the institution belongs to
Group A, which naturally includes most, if not all, universities. Group B denotes
14

the Master’s (or similar level) colleges and specialized institutions like business or law schools. Group C consists of those institutions offering baccalaureate degrees or lower-level (but still higher education) diplomas and certificates.
2. Breadth of program offerings. Does an institution only offer degree programs? Does it only carry out research in one of the five categories listed above or does it cover multiple disciplinary fields?
3. Doctorates awarded relative to total education activities. Higher percentages would imply stronger research intensity.
4. Level of research income relative to an institution’s total income. Research income includes core research funding from public agencies, competitive funding from public and private sources and contract income earned from research-related activities. This last component must still be problematized in light of the available data (see brief discussion immediately below).
Figure 2. – Typology Dimensions and Classification Quadrants Research
oriented
The first two criteria relate to the institution’s mission and the latter to its research
intensity. In general the first two points are also straightforward to address. The main
Teachingoriented
high research intensity
low research intensity
A2 A1
B BB2 B1
C2 C1
15

problem is drawing a somewhat arbitrary line between comprehensive and specialized
institutions, but this is partially resolved by our decision to treat institution types as
different plot points in the typology dimensions.
It is not yet clear whether the research intensity measure can be constructed from
composite indicators (depending on data availability). For the moment then, our
preference is to base it solely on the numbers of PhD degrees (criteria 3) and if feasible,
create a composite measure later based on criteria 3 and 4.
Overlapping Figures 1 and 2 gives rise to Figure 3. For illustrative purposes, one
might treat the circles as comprehensive universities and the stars as professional
education institutions. One would expect the research universities scattered in the top
right section of Figure 3 as well as some technical universities and institutions with
medical schools. Institutions that are qualified to confer doctorates but in reality do so
very seldom (like some of the Arts schools or music academies) would be placed towards
the extreme northwest. Institutions like the German Fachhochschulen or Dutch
hogescholen would show up in the right-middle. Those institutions falling into the bottom
two categories would include the diploma granting institutions discussed earlier. Note
that the low volume of research conducted by largely teaching-oriented institutions
implies there should be only a few observations in the lower right classification and
where there are they should lie close to the vertical axis.
16

Figure 3. – Hypothetical Mapping of European Institutions
Teachingoriented
high research intensity
low research intensity
Research oriented
A2 A1
BB2 BB1
C2 C1
Logistically, there is still a problem with defining when an institution falls on either
side of the vertical axis. In other words, what is the borderline between categories A1 and
A2, categories B1 and B2, and C1 and C2? In our view, this will first require an
examination of the available data, particularly that coming from research-intensive
institutions.
17

Preliminary analysis of the sample
Data collection for the CHINC project began in February 2005. The primary
purpose of this initial data gathering exercise was twofold: first to get basic information
about the higher education institutions in the countries covered by the study and second
to test the applicability of the typology expounded upon in the first part of this
intermediary report. Importantly, our sample covers more than just universities. We also
include institutions usually classified in the second tier of many countries higher
education systems, like the Fachhochschulen in Germany, Hogescholen in the
Netherlands and the Høgskoler in Norway. Though such institutions may have strong
education orientations, some possess considerably diverse research portfolios or have
ambitions to increase their research intensity. Because this study focuses specifically on
European higher education institutions’ research portfolios, the inclusion of such
institutions is both logical and, in our view, necessary for fully exploring the underlying
dynamics of academic research in Europe.
Project partners collected data for their representative country. These individuals
are not only capable of collecting such information, indeed they were selected because of
their regional expertise, knowledge of higher education indicators and access to key
networks within their countries. Such expertise is invaluable as no national system is
completely transparent. The knowledge of the national correspondents has already proven
to be remarkably helpful in the process of securing and vetting the data collected to this
point as well as for understanding the limitations the arise in the process.
The sources behind the data collected thus far are publicly available information
coming from within the respective countries. To the extent it was possible, information
was collected for 2002. It should be noted however that in a small number of cases, we
rely on data from other years.4
4 Country experts were asked to annotate all data and explain deviations from all reference points.
18

Methodological limitations While the data collected to now include straightforward and commonly measured
information, definition issues impose a number of limitations on the reliability and
validity of the data. The variety and differentiation of what constitutes an undergraduate
program provides one particularly illustrative example. Many countries have rapidly
adopted the Bologna model of 3 + 2 years while still retaining their former degree
structures. Moreover, in some study fields programs are inherently structured differently
from the “typical” European model, such as the 3- and 4-year undergraduate program
cycles in the United Kingdom. This would likely have the effect of under-estimating the
numbers of undergraduate students at institutions in countries like the UK and France
relative to that which we estimated for institutions in our other sample countries.
Our initial approach was to classify programs into one of four broad categories: 1)
humanities and social sciences, 2) natural sciences, 3) technology, and 4) medicine. After
examining the data collected to this point we revised our program classification by
making performance arts institutions their own category (rather than include them with
the humanities) and to add engineering programs to the technology classification.
An additional problem relates to our coverage of institutions’ scientific fields and
specializations. There are considerable differences between institutions that offer one
economics course and those that offer a range of social science courses, hence it is highly
subjective whether having one social science course is enough to classify a university as
covering the humanities and social sciences. Likewise, how many courses or scientists
working in areas like “technology and human resources management”, “business
administration” or “social aspects of technology” can a technical university have before it
stops being a specialized technical university and a becomes a university within
technology and business administration, or even a university covering technology and
social sciences? From our perspective such problems will be handled on a case-by-case
basis. Here we simply wish to point out that such borderline cases exist and run the risk
of being situated in what others might consider to be the wrong classification.
Defining whether an institution is private or public is tricky because there are
numerous ways in which distinctions between the two sectors are made. We define public
19

institutions as those which receive recurrent public core funding. There can, however, be
institutions which have such funding in most years but not all and consequently there can
be some doubt of the classification. For the more detailed sample which will be collected
later in the project, there will be more detailed data on core funding which will make it
easier to attribute institutions on this variable.
Finding the exact year of foundation is most difficult in cases where an institution is
the result of one or more mergers over the years. As the history of such institutions can be
difficult to track, we have in some cases decided to use the year of foundation for the
institution in its present state as the year of foundation.
Higher education institutions in Europe – a first overview The sample discussed here covers higher education institutions in 11 European
countries, and includes approximately 1000 institutions. Given that the total number of
European5 higher education institutions has been estimated as somewhere in the
neighborhood of 3000, our sample, while not randomly distributed includes
approximately one-third of the population.
5 Here we consider the 25 member countries of the European Union and 8 additional countries.
20

Table 1 Higher education institutions in selected European countries according to the awarding of a PhD or not. Number of institutions and number of undergraduate students. 2002.
Awarding PhD Non PhD Total Country N Students N Students N StudentsCzech Republic 25 217 502 39 10 917 64 228 419Denmark 1 15 40 55 France 86 1 053 121 19 25 104 105 1 078 225Germany 125 1 377 166 209 542 885 334 1 920 051Hungary 21 238 587 45 135 543 66 374 130Italy 70 1 707 527 7 6 839 77 1 714 366Netherlands 18 180 382 54 325 771 72 506 153Norway 16 98 515 28 63 683 44 162 198Spain 58 1 324 753 8 22 121 66 1 346 874Switzerland 12 74 386 7 28 338 19 102 724United Kingdom 87 1 182 420 3 48 670 90 1 234 090Total 533 7 454 359 459 1 209 871 992 8 664 230
1 At the time of writing, the figures for Denmark were not yet ready.
In Table 1 we have split the institutions according to awarding a PhD or not. The
table shows a relative equal distribution of number of institutions in the two groups.
There are 533 institutions (55 percent) which have the right to award a PhD within at
least one scientific field. 459 institutions do not award a PhD.
21

Figure 4 Average size of sample institutions by number of undergraduate student. 2002.
0
5 000
10 000
15 000
20 000
25 000
30 000
Czech
Rep
ublic
Denmark
Franc
e
German
y
Hungary Ita
ly
Netherlan
ds
Norway
Spain
Switzer
land
UK
Avera
ge
Awarding PhDNon PhD
In all countries except for the UK, the average size of the PhD-awarding institutions
in our sample is larger than the non-PhD-awarding institutions (approximately 10 000 for
the former and around 5 000 for the latter). The exception is in Italy and Spain where the
average size of PhD-granting institutions are notably large: enrolments of 24 400 and
22 800 students respectively. Our sample also includes 16 universities with more than 50
000 students. With the exception of the Open University in UK (which is a special case)
all are in Italy (9) and Spain (6). This highlights two important considerations that will
need to be factored into the later analysis. First, the diverse educational offerings of such
“mega-universities” likely include some programs that are offered by second-tier
institutions in other countries. Second, these institutions may contain pockets of strong
research but because of their size be regarded as not very research oriented on the whole.
Note also that the UK is the only country in our sample where the non-PhD-
awarding institutions are larger than the PhD-awarding ones.
22

There are also large differences between the countries in terms of the number of
institutions in both categories. Figure 5 shows the per-country distribution of institutions
by highest degree awarded.
Figure 5 Distribution of higher education institutions per country according to
the awarding of a PhD or not. 2002.
0 %
20 %
40 %
60 %
80 %
100 %
Czech
Repu
blic
Denmark
France
German
y
Hungary Ita
ly
Netherl
ands
Norway
Spain
Switzerl
and UK
Averag
e
Non PhDAwarding PhD
A clear pattern can be seen in Figure 5 between those countries operating dual (CZ,
DK, D, HU, NL and CH) and unitary (F, I, ESP and UK) systems. Systems in the former
tend to have larger numbers of second-tier (e.g. professional education) providers than
the latter. These institutions possess at least three characteristics that are important to the
typology laid out earlier in Figure 2. One, on average, they tend to enroll fewer students.
Two, they are often more specialized in their program offerings. Three, on a volume basis
they conduct much less research than traditional universities. Taken together these factors
suggest that second-tier institutions should, as a rule, be located in the C2 area of our
typology. However, this will not be the case for all such institutions. In some countries
(e.g. Switzerland or Finland) such providers tend to have specific research missions or
foci, and will thus have higher research intensity. Moreover, because we have elected to
23

use per-capita measures in order to control for the wide range of operational scale a
Dutch hogescholen, for example, with a low volume of research output can be plausibly
regarded as “research intensive” if they also have notably low student enrolments and/or
a relatively high faculty to student ratio. To the extent that such differences are in
evidence will become clearer as more data is collected. At this point we simply bring the
issue forward to highlight our awareness of the methodological difficulties that exist and
to provide further evidence for the idea that research intensity cannot be adequately
captured through the use of one or even two indicators.
Given that most institutions in unitary systems award PhDs, the natural inclination
is to expect them, a priori, to be research intensive. However, as can be seen in Figure 4,
many also teach large numbers of students (see “mega universities” issue addressed
earlier). If class sizes are small, student-faculty interaction is extensive or campus
infrastructure is geared more towards education rather than research activities, then it
would not be surprising to find many PhD-granting institutions within unitary systems to
be relatively less research-intensive than their peers in other countries or possibly even
other tiers in other systems. Again, the confirmation of our suspicions by the data
collected to this point suggests that careful attention will need to be given to developing
as large a basket of institutional research indicators as is feasibly possible.
A first attempt at a typology Research orientation, as indicated by the right to award PhD degrees, is one of the
dimensions of our typology. As shown in table 1, slightly over half of the institutions in
our sample have an orientation toward basic research. The second dimension in our
typology is research intensity. This reflects the actual extent to which institutions engage
in research relative to other activities (in particular teaching). This second dimension
differs from the first dimension in the sense that uses a relative measure instead of an
absolute one. As stated in the first part of this report, the relative level of the institutions’
research income and the doctorates awarded relative to total educational activities are
selected as indicators of research intensity. Given the state of our data collection so far,
we only have information the second indicator. In the remainder of this section we will
24

employ this indicator to look at the research intensity of the PhD awarding institutions
(mainly universities) in our sample.
On the basis of the PhD/student ratio one can observe that, on average, large
institutions are not very research intensive. For the subset of PhD-awarding institutions,
Table 2 gives a first impression of how research intensity is distributed among the
countries and institutions.
Table 2 Research intensity expressed by PhD degrees awarded per 100 undergraduate students. 2002.
Country PhD degrees awarded
No. of under-graduate students
PhD degrees per 100 students
Czech Republic 1 228 228 419 0,54 Denmark 961 France 9 568 1 078 225 0,89 Germany 23 675 1 920 051 1,23 Hungary 7 430 374 130 1,99 Italy 4 341 1 714 366 0,25 Netherlands 2 538 506 153 0,50 Norway 739 162 198 0,46 Spain 6 245 1 346 874 0,46 Switzerland 2 743 102 724 2,67 UK 10 934 1 231 090 0,89 Total 70 402 8 664 230 0,80
The table shows considerable variation for this indicator; from 0.25 PhDs awarded
per 100 undergraduate students enrolled in Italy to 2.67 in Switzerland. The average ratio
is 0.80 (Denmark excluded).
The difference between the countries can probably to some extent be explained by
factors like the absorption of PhDs in the industrial and academic workforce, traditions
for high level academic training in the populace and the availability of educational
programs and research opportunities at this level. In other words, there are structural and
institutional differences between the countries higher education and research systems.
The differences as expressed by the PhD/student indicator are quite substantial, showing
a magnitude of almost 1:11 between the highest and lowest ranking nations.
25

When it comes to individual institutions, one can once again observe a large
variation in research intensity across as well as within countries. Again, structural and
institutional differences can be put forward. However, the variation across individual
universities within countries is due partly to the country’s national policy for resourcing
education and research and the individual institution’s teaching and research strategy and
its research portfolio. Some institutions – like some of the big Italian or Spanish
universities – will have a large vocational education component. Others have bigger
research budgets at their disposal, enabling them to engage in research training. The aim
of our (CHINC) project is to look more deeply into the issue of research budgets to
analyze which revenue sources over time have grown or experienced decline and to what
extent national or individual university policy is causing this.
The number of PhDs awarded in relation to the institution’s undergraduate
portfolio, therefore is a reflection of the institution’s mission, which partly is a result of
national policies and priorities and partly of the individual institution’s strategy and
opportunities. Therefore, at this point in the project we have chosen not to present the
outcomes in terms of the values for the PhD/student ratio for individual institutions, as
this would pose too many questions still; questions that can only adequately be addressed
once more data are available. A list – or even a ranking – of institutions based on the
value of this indicator will list only some of the well-known European research
universities in the research-intensive part of the classification (Zürich, Oxbridge, LSE,
München, Paris VI), whereas others (e.g. Heidelberg, Oslo, La Sapienza, Delft, Oslo)
only show up in the less research-intensive (i.e. bottom) part of the list. Yet other
institutions – many of them specialised in fields like arts and engineering, or even
performing arts – turn out to be the research-intensive institutions.
However, an exercise focusing on the PhD/student ratios is instructive for several
reasons. First it triggers many questions about the data for individual institutions, about
definitions and possible anomalies. Second, it immediately shows the need to properly
take into account the national context. Third, it points to the institutional mission and
profile – some institutions are primarily teaching oriented, others are specialized in
particular fields, and yet others are heavily oriented on research in engineering or medical
disciplines with a large potential to generate revenues. Fourth, and most importantly, our
26

first attempt to quantitatively address research intensity shows the need for a basket of
indicators to assess the research portfolio of institutions. A one-dimensional picture on
the basis of a readily available indicator clearly is insufficient.
What has also become clear after closer inspection of the data for the PhD/student
indicator is that the profile of the individual institution has a large impact on the actual
value for this ratio. Some institutions are relatively small, specializing on particular fields
– either in undergraduate education and/or postgraduate education and/or in particular
disciplinary fields. For instance, our exercise shows that the institutions having a
relatively high value of the PhD/student ratio on average have less than 10 000
undergraduates, were established before the year 1900, and quite a few of them are
technical universities.
For the 50% of PhD-awarding institutions in our sample that have the highest
scores in terms of PhD/student ratio, figure 6 shows the number of PhDs awarded per
100 students enrolled on the vertical axis (as a proxy for research intensity) and their
coverage of scientific fields on the horizontal axis. The figure illustrates that institutions
that are research intensive in terms of the PhD/student ratio also have a tendency to be
specialized in terms of scientific fields covered. All institutions with a ratio over 6 are
covering 2 fields or less. For ratios under 6 the coverage is more evenly distributed.
27

Figure 6 Research intensity by scientific fields covered
0 1 2 3
SciFields4
2,0
4,0
6,0
8,0
10,0
PhD
_stu
d
PhD_stud: Number of PhD-degrees awarded per undergraduate students enrolled. SciFields: Number of scientific fields covered by the institutions.
The distribution of scientific fields covered by the institutions has only been
analyzed for the institutions having the highest PhD/student ratio. A further analysis of
particular subsets of institutions in our sample could provide additional insights in across-
country and within-country differences between, for instance, the technological
institutions.
Our sample also allows analysis at the regional level as all institutions are classified
according to the Eurostat NUTS standard (level 2). This opens up the possibility of
analyzing regional distributions along the same axis as at national level.
28
The analysis of the first, relatively simple set of data illustrates in our opinion the
need for building a typology of European higher education institutions based on data for
the institutional level. What our analysis up to now has shown is that research intensity is
a dimension that needs to be captured on the basis of more than just one indicator. Our
one-dimensional PhD/students indicator does not allow us properly assess research
intensity. From this exercise and other experiences we know Europe to show a very large
diversity of national settings. Knowledge of the context is thus of utmost importance
when making comparisons between countries or higher education institutions and
inferring conclusions. Indicators will always have to be interpreted in their national
context.
A multi-dimensional indicator clearly is needed, as research intensity is a
function/reflection of other factors like the composition of an institution’s revenues, its
number of personnel and academic specializations, as well its strategies.
The next stage in our project, therefore, is to collect information that allows us to
adequately capture research orientation, intensity, and research portfolio management on
the national and – in particular – institutional level.
29

References McCormick, A.C. (2004), The 2005 revision of the Carnegie Classification System. Presentation to the Washington Higher Education Secretariat. Washington D.C. June 8, 2004. available online at: http://www.carnegiefoundation.org/Classification/future.htm Clark, B.R. (1983). The Higher Education System: Academic Organization in Cross-National Perspective. Berkeley: University of California Press. Jongbloed, B. W. A., Salerno, C. & Kaiser, F. Kosten per student. Methodologie, schattingen en een internationale vergelijking. Beleidsgerichte studies Hoger onderw. & Wetensch. onderzoek, 100. Den Haag: Ministerie van Onderwijs, Cultuur en Wetenschap, 138 pp. isbn. 905910191X. (Translation: Per student costs: Methodology, estimates and an international comparison) Jongbloed, B.W.A., Salerno, C.S., Huisman, J., & Vossensteyn, J.J. (2005). Researchprestatiemeting in zes landen. CHEPS: University of Twente. (Translation: Research performance measurement in six countries) L. Goedegebuure, F. Kaiser, P. Maassen, L. Meek, F. van Vught, and E. de Weert (eds.), Higher Education Policy: An International Comparative Perspective, Pergamon Press: Oxford. McCormick, A.C. (2004), The 2005 revision of the Carnegie Classification System. Presentation to the Washington Higher Education Secretariat. Washington D.C. June 8, 2004. available online at: http://www.carnegiefoundation.org/Classification/future.htm Teichler, U. (1988), Changing patterns of higher education systems. The experience of three decades. London: Jessica Kingsley. Van Vught et al. (2005), Towards a typology of higher education institutions in Europe. Progress report March 2005.
30

Methodological Annex Definition of variables for data collection on all higher education institutions All variables refer to the year 2002. Basically all higher education institutions should be included, including universities, technical universities, professional universities etc. Institutions delivering only curricula of less than three years and institutions giving only continuing education should be excluded. General description Definitions / instructions Code Pre filled. Do not change the numbers. Name of the institution Full name of the institution (university, college etc) in the national
language. Institution acronym Fill inn if institution has an acronym or abbreviation. If not, leave
empty. English name of the institution
Insert the official English name of the institution. If no such name exists, leave open.
Year of foundation In case the institution is a product of earlier mergers between institutions etc, use the year of foundation for the oldest part of the institution. Use the "Comments" column for further explanations when necessary.
Type of institution Insert type of institution according to the national system of higher education institutions. Use national language. Example France: If institution belongs to the Grande Ecoles category, insert "Grande Ecole". Example Germany: If institution belongs to the Hochschulen category, insert "Hochschule".
Public / Private Insert "1" if the institution belongs to public sector, i.e. institutions receiving annual core funding form the state. Insert "2" if the institution belongs to private sector, i.e. all institutions not included in public sector.
Region Insert code for the region where the institution is situated. See spreadsheet "Regions definitions" for codes to be used. Codes used are Eurostat NUTS, 2003 revision, level 2.
Number of under-graduate students
Total number of undergraduate students enrolled (headcount). Exclude vocational and postgraduate education. Bologna masters should be included.
31

Scientific fields covered The broad scientific fields covered by the institution. Use the following codes: "1": Humanities and social sciences "2": Natural sciences "3": Technology "4": Medicine If several codes, separate by comma.
Awarding PhD Insert "1" if the institution is awarding at least one PhD degree or another degree of equivalent level. Otherwise, insert "2".
Number of PhD degrees awarded
The total number of PhD degrees awarded by the institution.
Specialisation classification
If the institution is in some way specialized, indicate kind of specialisation, examples:
• Technical university • Business school • Arts • Theology • Agriculture.
If necessary add new categories Sample Insert “1” if you suggested this institution should be included in
the projects’ final sample of 100+ institutions. Criteria to be used for the choice: availability of data; interest for the case. Indicate more institutions than required as the total sample has to be representative. A shortlist will be made.
Comments Open for comments on the variables.
32
Related Documents