Electronic copy available at: http://ssrn.com/abstract=1405703 European bank equity risk, 1995-2006 Mamiza Haq University of Queensland and RMIT University [email protected] Richard Heaney* RMIT University [email protected] Abstract We examine changes in bank equity risk following the formation of the Economic Monetary Union (EMU) in 1999. With the exception of Germany, we observe a decline in bank risk across euro-zone countries. Total risk decreased for 70% of the euro-zone banks in our sample with a statistically significant decrease in total risk observed for 51% of the sample. Similar results are found for idiosyncratic risk and systematic risk. These results are robust to financial crisis effects and test specification. Moreover, we find some evidence of a decrease in bank equity risk for a sample of neighbouring non-euro-zone European countries, consistent with the existence of some spill-over effects. JEL: G21, G32 Keywords: Economic Monetary Union (EMU), banks, euro-zone, total risk, systematic risk, idiosyncratic risk * Corresponding Author: Tel.: +61 3 9925 5905; fax: +61 3 9925 5986.

Welcome message from author
This document is posted to help you gain knowledge. Please leave a comment to let me know what you think about it! Share it to your friends and learn new things together.
Transcript
Electronic copy available at: http://ssrn.com/abstract=1405703
European bank equity risk, 1995-2006
Mamiza Haq
University of Queensland and RMIT University [email protected]
Richard Heaney*
RMIT University [email protected]
Abstract
We examine changes in bank equity risk following the formation of the Economic
Monetary Union (EMU) in 1999. With the exception of Germany, we observe a decline
in bank risk across euro-zone countries. Total risk decreased for 70% of the euro-zone
banks in our sample with a statistically significant decrease in total risk observed for 51%
of the sample. Similar results are found for idiosyncratic risk and systematic risk. These
results are robust to financial crisis effects and test specification. Moreover, we find some
evidence of a decrease in bank equity risk for a sample of neighbouring non-euro-zone
European countries, consistent with the existence of some spill-over effects.
JEL: G21, G32
Keywords: Economic Monetary Union (EMU), banks, euro-zone, total risk, systematic
risk, idiosyncratic risk
* Corresponding Author: Tel.: +61 3 9925 5905; fax: +61 3 9925 5986.

Electronic copy available at: http://ssrn.com/abstract=1405703
2
1
1. Introduction
The aim of this paper is to provide an empirical analysis of the impact on bank
equity risk of Economic Monetary Union (EMU), and the deregulation and integration
that accompanied EMU. The literature dealing with European banks provides little
guidance as to the expected impact of EMU on listed banks yet Allen and Song (2005)
suggest that some fundamental economic changes accompany EMU. In particular, they
find that euro-zone banks, compared with banks in Asia or the USA, exhibit greater
levels of financial integration with the formation of EMU.
It is important to analyse the impact of EMU on bank equity risk because the
banks play a key role in the allocation of resources, mobilisation of savings,
diversification of risk (Williams and Gardener, 2003). These institutions have an
important impact on the profitability of investment and productivity of an economy
(Francis and Hunter, 2004). Further, financial intermediaries such as banks are a major
part of an economy in their own right. They influence the securities markets and promote
economic growth by providing liquid financial markets. Banks also encourage
diversification and specialization (Diamond and Dybvig, 1983). Further, change in bank
equity risk with the EMU is important because changes in equity risk can have
repercussions for investors, borrowers and regulators. While decreases in the systematic
risk of equity may be associated with increased market value, an increase in idiosyncratic
equity risk is also of importance to regulators who are very much concerned with the
performance of individual banks.
The bank deregulation literature generally deals with USA banks and while it is
found that deregulation can result in increased bank risk it can also foster better risk
2
management (Houston and Stiroh 2006). Certainly, one objective of the EMU is to
achieve greater levels of competition and it has been argued that a consequence of
increased competition is increased bank risk as banks seek out more risky high yielding
investments in order to maintain profit margins (Bundt, Cosimano and Halloran, 1992,
Park, 1994 and Galloway, Lee and Roden, 1997). Deregulation may also allow banks to
diversify and this could result in reduced risks (Craig and Santos, 1997). Thus, the
formation of EMU provides an opportunity to study the impact of EMU driven
deregulation and economic integration on European bank equity risk. There has also
been considerable bank mergers and acquisition activity since EMU (Pricewaterhouse
Coopers, 2006)
Our analysis is based on bank share price data collected for all available European
banks from Datastream over the period from January 1995 to April 2006. Three
measures of equity risk (systematic risk, unsystematic risk and total risk) are estimated
for each of the banks. We find bank equity risk generally decreases over the period, a
characteristic not evident for the non-financial sector within the euro-zone countries.
Further, there is some evidence of spill over effects with neighbouring non-euro-zone
banks also exhibiting decreases in risk. Perhaps this is not surprising given the size of the
financial markets that fall within the ambit of the EMU. One important exception is the
German banking sector where bank risk increases are observed. In the following section
we review the literature and develop hypotheses. The data and methodology are
described in section 3 with results reported in Section 4. Results from robustness tests are
reported in Section 5 and the key results of the paper are summarised and conclusions
reported in Section 6.
3
2. Literature Review and Hypothesis Development
The establishment of EMU has had a significant impact on the European bank
industry in terms of competition and consolidation (Francis and Hunter, 2004 and
Altunbas and Ibanez, 2004). The development of this new financial system with the
introduction of the European Central bank (ECB) and Euro-bond market, along with the
steps taken to harmonize and assimilate the securities markets, has given the banking
system more opportunity to access funds.
Yet, there has been little change in the euro-zone banking legislation over the
period of the study as much of the critical regulation was in place by 1992. The banking
industry is often considered to be one of the more regulated industries with the impact of
the Basel Accord, adopted in 1988 and designed to monitor bank risk exposures (Francis
and Hunter, 2004) and the more recent European Union (EU) Bank Directives. Yet, even
with this regulatory environment in place, bank failures occur and these include the
Scandinavian (Norway, Sweden and Finland) Banking Crisis (1988-1992) 1 and the
Barings bank debacle (1995). Further, the past decade includes the Russian rouble crisis
(1998), the internet bubble in 2000 and the economic downturn that followed this
collapse. While these events have led banking regulators to be more cognisant of bank
risk taking activity, it has been argued that the liberalization of the European banking
1 During 1983-1985 the Norwegian banks were willing to lend as much as 85% of Norway’s GDP. In turn, this led to a moral hazard problem and ultimately to a banking crisis. The Norwegian banking crisis was systemic (this crisis spread to Sweden and Finland) and economically significant (Ongena, Smith and Michalsen 2003). It has been argued that the deregulatory banking environment may have encouraged the Norwegian banks to increase their risk as competition increased (Benink and Benston 2005).
4
industry via the abolition of interest rate restrictions, credit controls and barriers to entry
(Francis and Hunter, 2004) may have allowed European banks to better deal with greater
levels of competition and the crises that have occurred during the period of our study.
Further, the formation of EMU may also have had a spill-over effect onto neighbouring
non-eurozone European countries. It is evident that the financial institution consolidation
that has occurred with EMU has also played an important role in financial integration
between euro-zone and non-euro-zone countries and contributed to the integration of
European financial markets more generally (Allen and Song, 2005).
The effect of EMU on the health of the European banking sector remains an
important concern. Yet, the European banking literature offers little guidance as to the
impact of EMU on the euro-zone bank equity risk or whether, if there is a change in risk,
there will be spill over effects for the non-euro-zone European country banking sectors.
For example, it is important to note the increase in equity market co-movement observed
between euro-zone countries and neighbouring non-euro-zone countries (Allen and Song,
2005 and Bartram, Taylor, Wang, 2007).
We also note the recent takeover waves that have occurred in Europe with the
formation of the EMU, particularly the dramatic increase in merger and acquisition
activity from 1998 onwards. While it is possible that some common factor is responsible
for both the change attributed to EMU and the observed increase in takeovers that has
occurred with EMU this seems unlikely.2 Euro-zone bank consolidations have been quite
profitable for the acquiring banks, particularly cross-border acquisitions, which have been
simplified with EMU (Altunbas and Ibanez, 2004). Bank consolidation has also had a
2 The need to maintain bank franchise value could provide an alternative explanation for mergers and acquisitions. We would like to thank the referee for indicating this issue to us.
5
dramatic impact on the banking systems of a number of the individual euro-zone
countries. For example, Staikouras and Fillipaki (2006) report a 17% reduction in the
number of credit institutions for the EU-15 group of nations over the period 1998 to
2002.3 Bank consolidation can lead to diversification, particularly with cross border
acquisitions, and it is often argued that more extensive bank branching can result in
reduced bank risk (Craig and Santos, 1997 and Hogan and Sharpe, 1984). In particular,
Marco and Robles-Fernandez, (2007) provide evidence to support the argument that
increased diversification led large Spanish commercial banks to lower their risk level.
Core objectives of the formation of EMU include increased competition and
integration yet the greater competition arising from financial deregulation and integration
may affect bank incentives for prudent risk taking. In this respect, Boyd and De Nicolo
(2005) argue excessive competition leads to socially undesirable events such as bank
runs, panics and, possibly bank crises leading to overall financial instability. Consistent
with this argument Salas and Saurina (2003) show that greater competition among
Spanish banks, with the liberalization in the European banking industry, resulted in a
massive reduction in market power and economic profits. Similar results were reported
for the US bank holding companies with deregulation (for instance Bundt, Cosimano and
Halloran, 1992, Park, 1994 and Galloway, Lee and Roden, 1997 among others). These
studies mainly propose that increased competition increases bank costs and decreases
bank income which encourages banks to undertake high risk, high yield projects in an
effort to recover lost profit margin. However, it has been argued that deregulation of the
3 While an increase in the number of credit institutions of 3.4% is reported for Greece, there was a 27% decrease in the number of credit institutions in Germany over the same period.
6
US bank industry not only generated opportunities to increase risk but it also equipped
the banks to control, share and manage risk (Houston and Stiroh 2006).
Further, diversification arguments generally predict that bank risk decreases.
Baele, De Jonghe and Vennet (2007) on European banks show a non linear relationship
between total risk and diversification. However, most European banks confirm that
diversification can actually decrease the total risk. In contrast, Demsetz and Strahan
(1997) propose that despite large US bank holding companies being better diversified
(than small ones) this does not necessarily lower their risk level. They showed that both
the asset side and the liability side of the balance sheet of many of the large US banks
consist of risky loans and higher leverage respectively. However, Hughes, Lang, Mester
and Moon (1996) also observe that increased diversification (geographic and/or depositor
diversification), while correlated with decreases in the price of risk, may motivate US
bank holding companies to undertake greater levels of risk to increase their returns. This
leads to the total risk hypothesis with the prediction of either increased risk with greater
competition and integration (Boyd and De Nicolo, 2005) or decreased risk with
diversification (Craig and Santos, 1997).
Null hypothesis: No change in total bank equity risk Alternate hypotheses: Total bank equity risk (increases) decreases with EMU
Changes in total bank equity risk may be either due to changes in systematic or
idiosyncratic risks. Therefore, it is also important to look into how systematic and
idiosyncratic changes in the post-EMU period.
With regard to idiosyncratic risk, it is possible that idiosyncratic risk may increase
with the formation of the EMU. This could arise from diversification of bank activities
7
and increased competition. With greater competition banks may choose to increase
leverage to increase profits but this will also increase idiosyncratic risk because the
shareholders bear a greater share of cash flow risk of the firm (Campbell, Lettau, Malkiel
and Xu 2001)4. Moreover, financial innovation linked to EMU may increase idiosyncratic
risk (Stein 1987). It is also likely that derivative instruments could also increase bank
idiosyncratic risk where troubled banks facing greater competition use derivatives to
bolster profits but at the cost of increase bank risk (Dewatripont and Tirole 1995).
Yet, Altunbas and Ibanez (2004) suggest that large efficient European banks have
tended to merge with relatively small and well-capitalized banks resulting in more
diversified sources of income. This may help the European banks to decrease their
idiosyncratic risk. Similarly, Baele, De Jonghe and Vennet (2007) find that most
European banks confirm that diversification can actually decrease the bank idiosyncratic
risk. Similarly for the US banks, it is evident that revenue diversification and ease of
investment opportunities that arise from deregulation reduced the idiosyncratic risk of the
US commercial banks after 1998 (Houston and Stiroh 2006). Thus, the formation of
EMU has given the European banking industry the opportunity to diversify risk through
varying their activities, which may allow banks to reduce their idiosyncratic risk. Again
the literature is not clear on the expected change in risk with EMU and we formulate our
second hypothesis.
Null hypothesis: No change in bank equity idiosyncratic risk Alternate hypotheses: Bank equity idiosyncratic risk (increases) decreases with EMU
4 However, Campbell, Lettau, Malkiel and Xu (2001) find during 1990s the decrease in US corporate
leverage led to an increase in idiosyncratic risk.
8
With regard to systematic risk, we could expect that there will be a decrease in
bank systematic risk as European bank concentration increases with increased domestic
merger activity following the formation of EMU. It is often argued that domestic
mergers lead to increased market concentration through reduced costs, reduction in
branch overlap and increased market power. For example, Europe wide branching would
lessen the risk of bank failure arising from unfavourable local economic conditions.
Moreover, mergers can create an internal money market either through diversification or
internationalization that aids banks in dealing with future macroeconomic shocks
(Carletti, Hartmann and Spagnolo, 2006). In contrast, Baele, De Jonghe and Vennet
(2007) on European banks show that diversification can increase bank systematic risk.
Deregulation (such as the Depository Institutions Deregulatory and Monetary Control Act
1980 introduced in the US) can also benefit bank shareholders resulting in a reduction in
the systematic risk (Aharony, Saunders and Swary, 1988). Akihgbe and Whyte (2004)
examine the long-term shift in risk after the passage of Gramm-Leach-Bililey Act 1999 in
the US. They find that increased financial integration led to a decrease in bank systematic
risk. In essence, financial integration can help the banking system to cope with local
shocks through diversification (Strahan, 2006).
However, Smirlock (1984), in analysis of the impact of deregulation on US banks,
and Amoako-Adu and Smith (1995), focusing on Canadian banks, show that deregulation
did not change average bank systematic risk in their samples of banks. Further, it is
possible to argue that, bank systematic risk need not decrease with bank concentration. If
mergers are cross-border mergers, then banks will spread their activities geographically
and as a result banks may be more exposed to Europe wide shocks as distinct from
9
country specific shocks. Furthermore, the easing of barriers to entry and exit and the
increased competition that accompanies this may lead to banks investing in riskier
projects. Since EMU, a number of investment banks have entered the euro-zone and there
has been rapid development of the Euro-bond markets and securities markets. This could
lead to increased competition and may threaten future bank profitability. Based on the
above discussion we can formulate our third and last of our hypotheses. Again, given the
state of the literature we have no prior on the expected change in risk that will accompany
EMU.
Null hypothesis: No change in systematic bank equity risk Alternate hypotheses: Systematic bank equity risk (increases) decreases with EMU
3. Data and method
We use monthly data obtained from Datastream to construct a sample of share
returns for 96 euro-zone country banks5 and 85 non-eurozone European banks6 spanning
the period from January 1995 to April 2006. This includes both the A and B shares for
one Finnish bank. Thus, the total number of sample bank shares stands at 181. Our
sample includes listed banks of different types such as commercial banks, savings banks
and bank holding companies. The sample captures around about 80% to 100% of the
banking industry aggregate market value for almost all the countries included in the
analysis except for Austria and Norway, where there is some variation in the Datastream
coverage of the banking industry over the study period.7
5 The countries include Austria, Belgium, Finland, France, Germany, Greece, Ireland, Italy, Portugal, the Netherlands and Spain. 6 The countries include Denmark, Norway, Sweden, Switzerland and United Kingdom. 7 Our sample follows the Datastream banking index lists fairly closely. These indices are designed to cover around 90% of the aggregate market value of the sector and so this ensures our sample also attains good coverage of the sector aggregate market value for each country. Moreover, the ratio of total assets of the sample banks to the total assets of the individual country financial institutions was calculated for each of
10
We calculate continuously compounded monthly returns for each of the banks and
include both delisted and merged banks in our full sample. While some survivorship bias
is inevitable with the individual bank based analysis the banking sector portfolios and
FTSE banking indices reduces the impact of this problem as they are based on the bank
population available at the end of each month though this also clouds much of the
interesting individual bank level variation in risk. Euro-zone country bank equity returns
are calculated using the Datastream data which is based on the ECU for the pre EMU
period and euro for the EMU period. Local currency is used for non euro-zone country
bank returns. In addition, we have extracted the MSCI individual country equity market
indices, the MSCI Europe equity market index and the MSCI world equity market index
from Datastream for estimation of systematic risk and idiosyncratic risk.
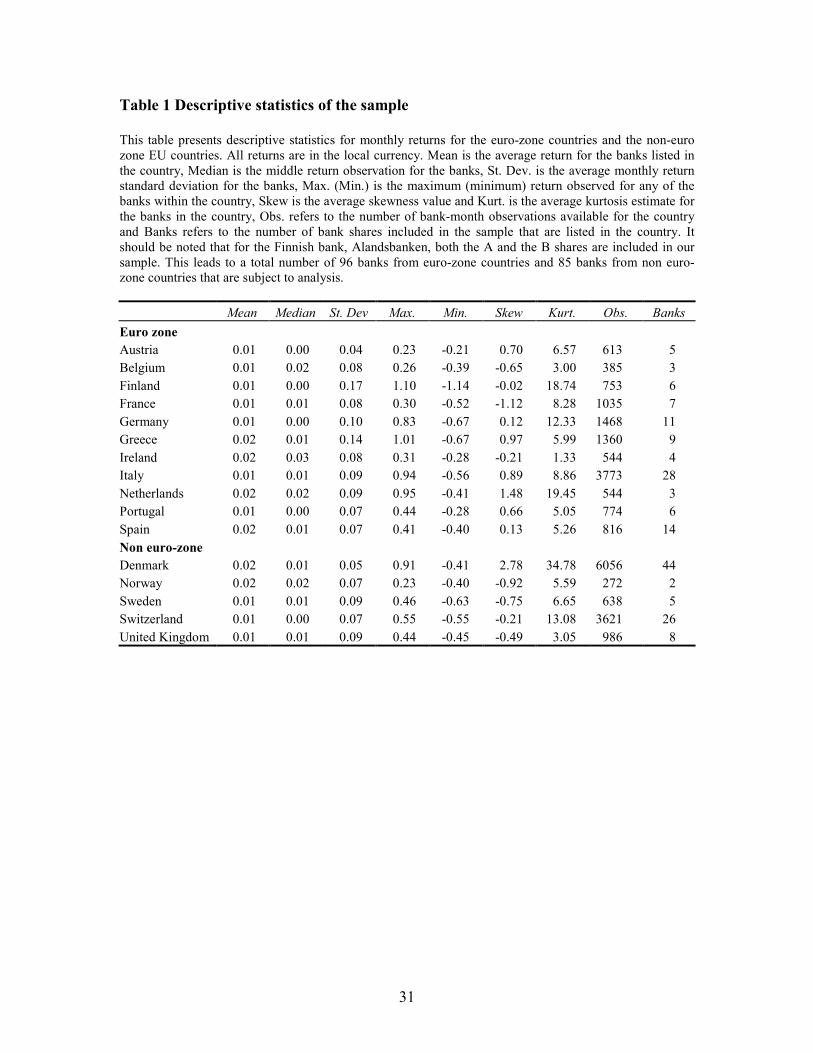
The descriptive statistics for the individual European Union based banks included
in the study are reported in table 1. The mean monthly return ranges from 1% to 2% per
month on average and volatility ranges from 4% to 17% per month. There is some
variation in skewness and kurtosis across the countries with the maximum and minimum
average monthly returns evident for Finnish banks.
[Insert Table 1 about here]
the EMU countries in our sample for the years from 1997 to 2006. The average of these ratios was then calculated for each of the countries and these ratios vary considerably from country to country. The total assets of the individual country financial institutions was obtained from the ESCB statistics following Goddard, Molyneux, Wilson and Tavakoli (2007). While we find that some ratios are as low as 20% on average (Austria and Finland), other ratios are considerably higher including France (54%), Greece (65%), the Netherlands (82%), Portugal (41%) and Spain (58%).
11
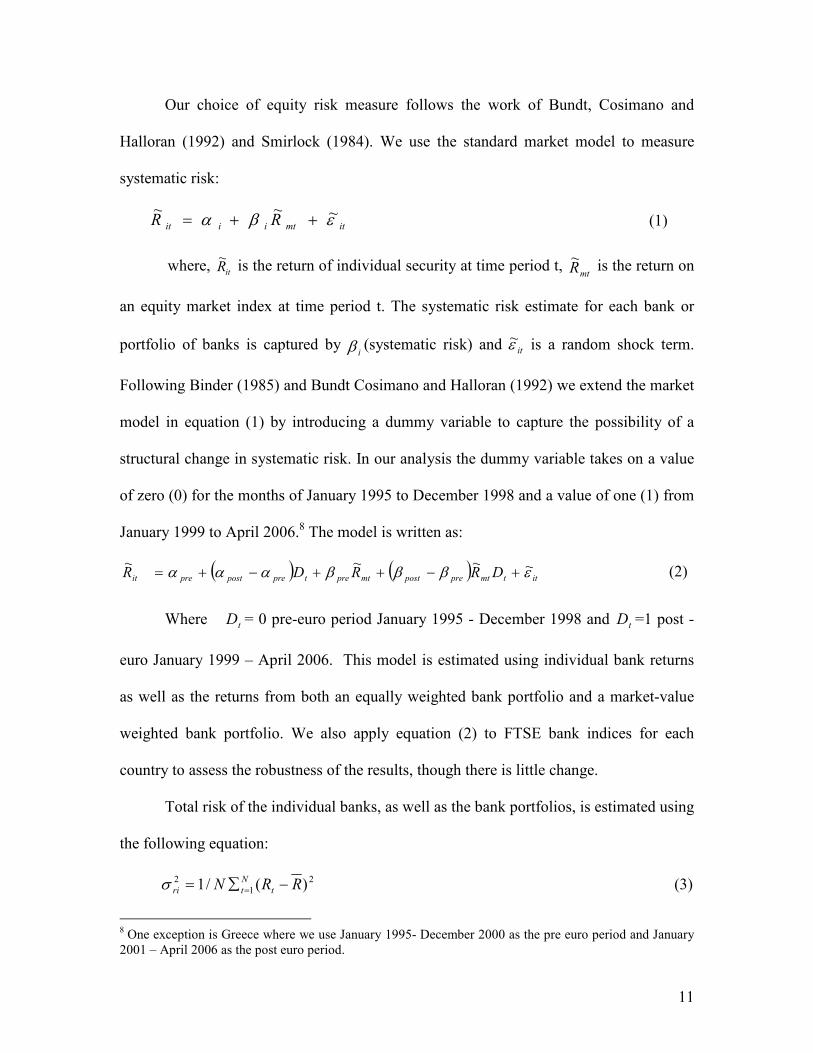
Our choice of equity risk measure follows the work of Bundt, Cosimano and
Halloran (1992) and Smirlock (1984). We use the standard market model to measure
systematic risk:
itmtiiit RR εβα ~~~++= (1)
where, itR~ is the return of individual security at time period t,
mtR~ is the return on
an equity market index at time period t. The systematic risk estimate for each bank or
portfolio of banks is captured by iβ (systematic risk) and itε
~ is a random shock term.
Following Binder (1985) and Bundt Cosimano and Halloran (1992) we extend the market
model in equation (1) by introducing a dummy variable to capture the possibility of a
structural change in systematic risk. In our analysis the dummy variable takes on a value
of zero (0) for the months of January 1995 to December 1998 and a value of one (1) from
January 1999 to April 2006.8 The model is written as:
( ) ( )ittmtprepostmtpretprepostpreit DRRDR εβββααα ~~~~
+−++−+= (2)
Where tD = 0 pre-euro period January 1995 - December 1998 and tD =1 post -
euro January 1999 – April 2006. This model is estimated using individual bank returns
as well as the returns from both an equally weighted bank portfolio and a market-value
weighted bank portfolio. We also apply equation (2) to FTSE bank indices for each
country to assess the robustness of the results, though there is little change.
Total risk of the individual banks, as well as the bank portfolios, is estimated using
the following equation:
21
2 )(/1 RRN t
N
tri −∑= =σ (3)
8 One exception is Greece where we use January 1995- December 2000 as the pre euro period and January 2001 – April 2006 as the post euro period.
12
where, 2riσ is the variance of the return for bank i, Ri return of bank i and R
average return of bank i.
We measure idiosyncratic risk using the following equation:
2222εσσβσ += rmri (4)
where, 2riσ is the total risk or variance of the bank returns for bank i , 2
εσ is the
idiosyncratic risk of the bank returns and 22rmσβ is the systematic risk of individual
banks and bank portfolios. We rearrange equation (4) to estimate the idiosyncratic risk
(Bundt, Cosimano and Halloran, 1992) for individual banks as well as the equally
weighted and the market value weighted bank portfolios and the FTSE indices.
2222rmri σβσσ ε −= (5)
We report total risk and idiosyncratic risk in terms of standard deviation in our
results to simplify interpretation. In addition, following Kane and Unal (1988) this study
uses the non-orthogonalized two-index model. Chane and Lane (1980) among others
have used an orthogonalized two-index model though Kane and Unal (1988) show that
the orthogonalization procedure provides biased t-statistics. In addition, following Kane
and Unal (1988), we use long-term government bonds as a proxy for the interest rate.
This alternative model takes the form:
itttmtmttpreit IDRRDR εββββα ~~~~
4321 +++++= (6)
where, =tI monthly change in the interest rate on a 10 year government bond and
=2β pre-euro beta, =3β changes in systematic risk and =4β interest rate risk. Given
there is little change in the results using this model we do not report results from this
model separately in this paper.
13
4. Results
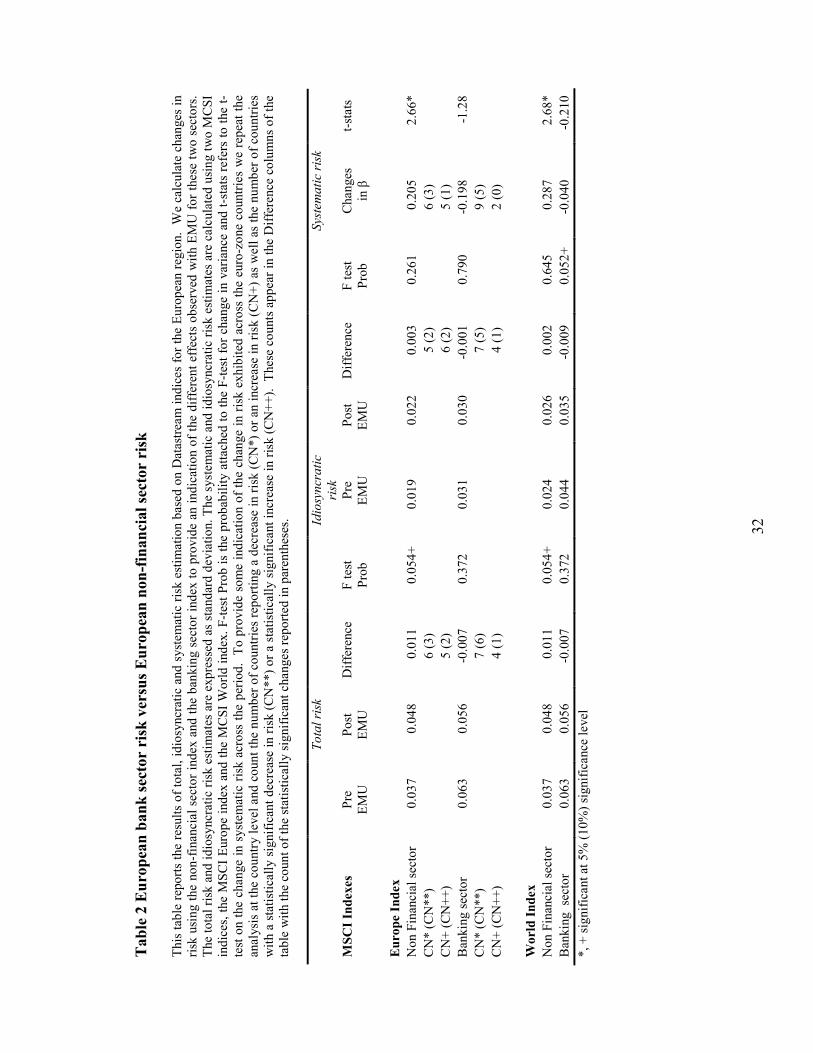
It is important to first identify whether the changes in risk are economy wide
movements or whether these shifts in risk are more localised. We estimate total risk,
idiosyncratic risk and systematic risk for the European non-financial sector and the
European banking sector using equity market indices provided by Datastream. The
MSCI European and world indices are used to capture market effects. While changes in
risk that occur with EMU are not generally statistically significant at this very broad
European economy level we note in Table 2 that banking sector risk generally falls while
non-financial sector risk generally rises.9
[Insert Table 2 about here]
Given our interest in the euro-zone banks we narrow this analysis further,
comparing the euro-zone banking sector with the non-financial sector for each of the
countries, Austria, Belgium, Finland, France, Germany, Greece, Ireland, Italy,
Netherlands, Portugal and Spain. As can be seen from the counts that are reported in
table 2 for the MSCI European index based calculations, a majority of the country bank
sectors exhibit decreased risk with EMU, while increases and decreases are fairly evenly
spread amongst the individual euro-zone country non-financial sectors. For example, if
we focus on total risk we observe decreases (increases) in six (five) of the eleven country
non-financial sectors with only three of these being statistically significant at the 10%
9 We thank the reviewer for suggesting that we undertake this higher level analysis.
14
level or better. Yet, we note that for the bank sectors in these countries there are
decreases (increases) in seven (four) of the eleven countries and in six of these seven
cases the decline is statistically significant at the 10% level or better. The euro-zone
country sector based results suggest that important changes have occurred in the banking
sectors of these countries that are not closely reflected in the respective non-financial
sectors.
To gain a better idea of the impact of the EMU period at the individual bank level
we repeat the analysis using individual bank total risk, idiosyncratic risk and systematic
risk and find that these risk measures have also reduced substantially with EMU for a
majority of the euro-zone banks in our sample (See Table 3 and 4). Thus, we find
support for our three hypotheses and this support is evident at both the individual bank
level and the bank sector level (proxied by equally weighted and value weighted
portfolios of the banks in our sample). The decrease in risk is particularly evident for
Austrian, French, Italian, Greek, Portuguese and Spanish banks (See Tables 3 and 4).
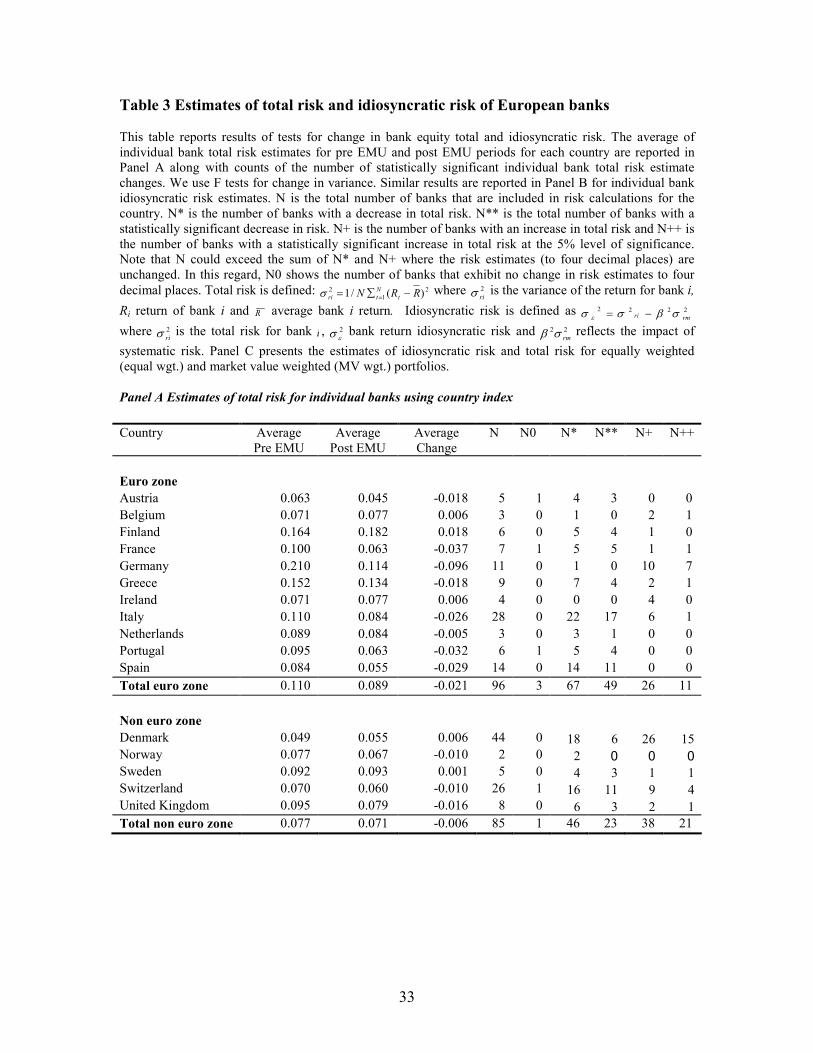
From Table 3, Panel A, we note that 67 of the 96 euro zone banks (70% of the sample)
exhibit a decline in total risk on average of 19%, with more than half of these declines
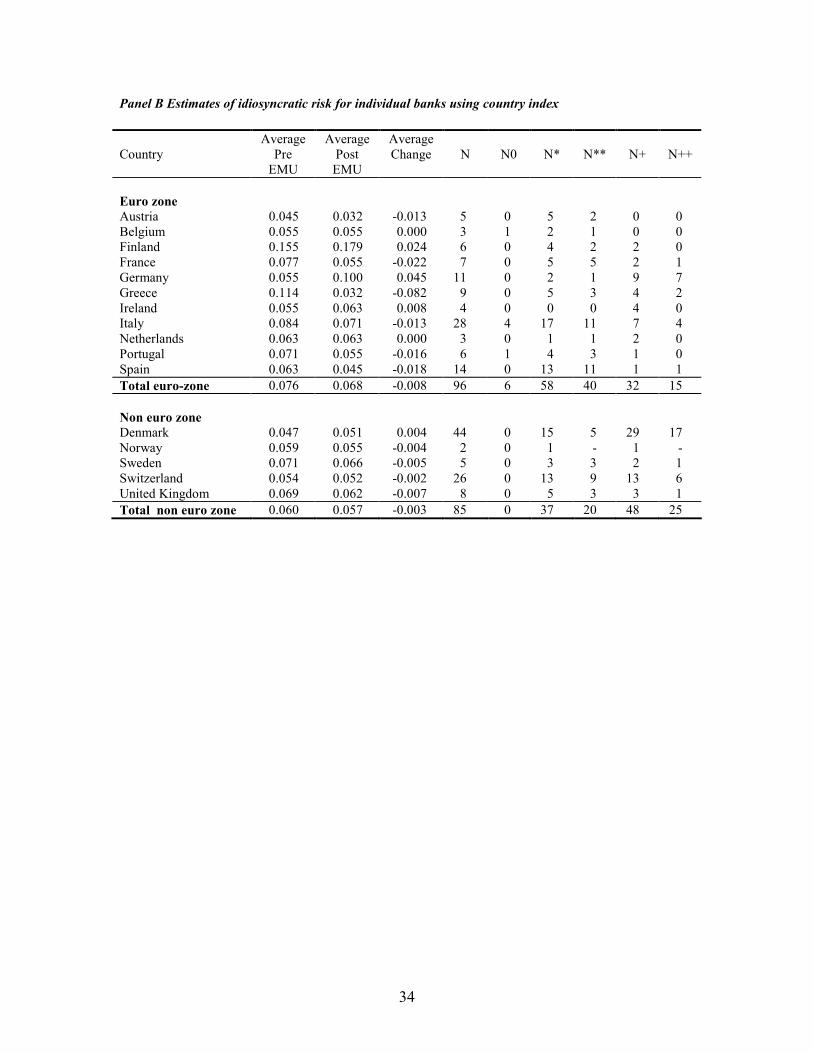
being statistically significant. Further, bank idiosyncratic risk (Panel B, Table 3) declined
10% on average with 58 of the 96 banks (60% of the sample) exhibiting decreased risk.
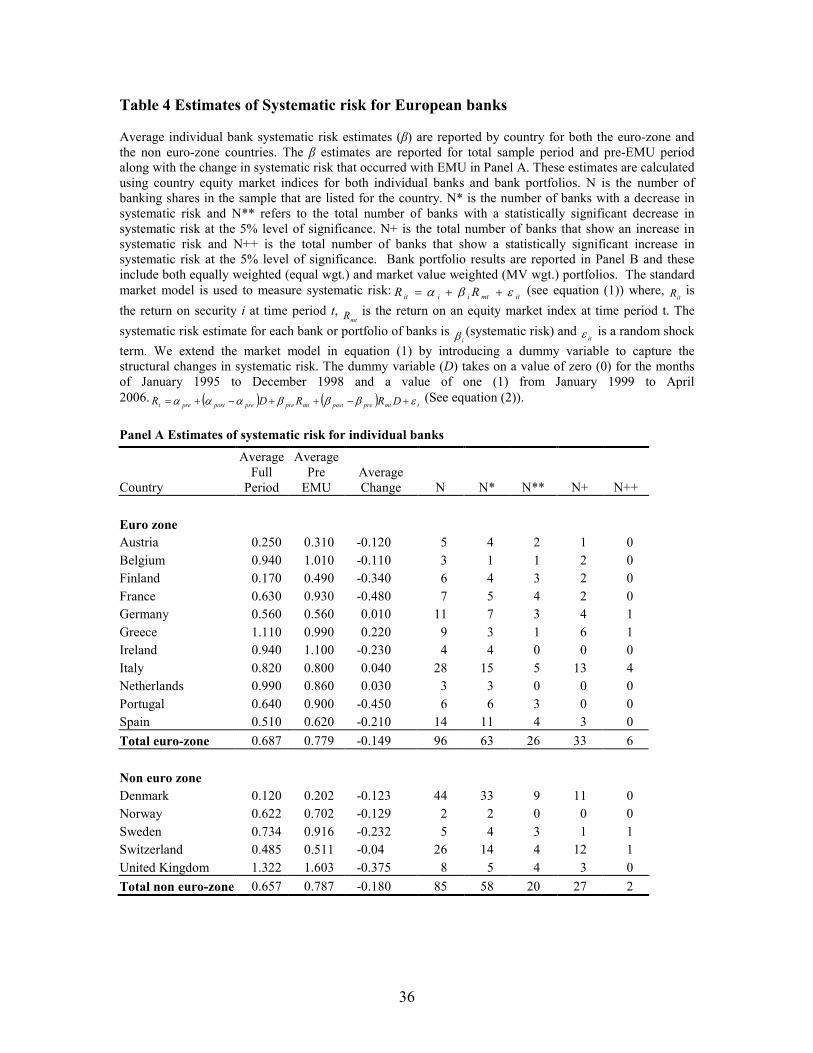
Further, there was a 19% decrease in systematic risk on average with declines observed
in 63 of the banks in the sample (64% of the sample). Regardless of risk measure, almost
half of the declines are statistically significant. The sample includes both commercial
banks and bank holding companies with the declines evident broadly across the sample.
15
Regardless, there are a few banks, particularly the German banks that show an increase in
total risk and idiosyncratic risk in particular.
[Insert Tables 3 and 4 about here]
Given the important links that exist between the euro-zone countries and the
neighbouring euro-zone countries we also conduct analysis of the change in risk for
banks in the countries, Denmark, Norway, Sweden, Switzerland and the United Kingdom.
We find a general decrease in bank equity risk in Sweden and United Kingdom but an
increase in total risk and idiosyncratic risk in Denmark. One possible explanation for this
result may be interpreted in terms of the formation of EMU leading to an increase the
European financial market integration (Allen and Song, 2005). Furthermore, Europe is
fairly unique in terms of the level of bank consolidation that occurred in its banking
system during the period from 1999 to 2003, particularly when compared to other regions
such as the USA and Asia. Regional integration between euro-zone and non euro-zone
European countries may help to explain this effect over the last ten years (Allen and Song,
2005).
We run chi-square tests to test for statistical significance of the proportion of
banks with decreases in risk relative to those with increases in risk. Under ordinary
circumstances it would be expected that individual bank risk is as likely to rise as it is to
fall (null hypothesis) and on the basis of this expectation we construct chi-square tests to
test the proportion of banks that exhibit a change in risk with EMU. These tests show
that a statistically significant proportion of the euro-zone bank sample exhibited a
16
decrease in total risk (Prob. = 0.00), idiosyncratic risk (Prob. = 0.01) and systematic risk
(Prob. = 0.00) with introduction of EMU. This provides further support for our
hypotheses with respect to the euro-zone banks. We also performed this test using the
neighbouring non euro-zone banks with support only for hypothesis three for the non
euro-zone banks. 10 There is a significant proportion of the euro-zone banks with
decreased risk, though the decreases in risk are not so widespread in the neighbouring
non euro-zone country sample, particularly for total risk and idiosyncratic risk.
It is possible that the recent wave of bank mergers and acquisitions
(Pricewaterhouse Coopers, 2006) are unrelated to EMU and that the results we observe in
this study are due entirely driven by bank consolidations. This argument would certainly
find support in the work of Amihud, DeLong and Saunders (2002), who find that cross-
border mergers do not increase the risk of either the domestic bank or the host bank. Yet,
it is difficult to see how the formation of the EMU and the recent merger and acquisition
activity in Europe can be separated. Indeed, Altunbas and Ibanez (2004) state that the
mergers and acquisition growth “ …increased in parallel with the introduction of the
Monetary Union” (p. 7). We do not attempt to disentangle the relationship that might
exist between EMU and the recent merger and acquisition activity though we believe that
this activity is closely related with EMU in Europe.
5. Robustness
There are number of further tests that have been conducted to assess the
robustness of the results reported so far. First, we test for change in risk using sub
samples of the original bank sample, particularly commercial banks divided into foreign
10 Although the chi-square test for systematic risk was statistically significant (Prob. = 0.00), the null could not be rejected for either total risk (Prob. = 0.38) or idiosyncratic risk (Prob. = 0.23).
17
exposure banks, regional exposure banks and local exposure banks. Second, we analyse
the change in systematic risk, idiosyncratic risk and total risk using the MSCI world
index and MSCI Europe index for both individual bank and bank portfolios with both
single market model and two-factor market models. We also fit the Fama-French three
factor model to the data to assess the impact on market risk after adjustment for size and
value characteristics of the bank equity returns. Third, we re-estimate systematic risk
using dummy variables to adjust for some of the critical events that have occurred during
the study period. Fourth, we re-estimate all of the country wide results using individual
country commercial bank indices. Fifth, we compare the change in risk for banking and
non-financial indices. Sixth, we test to see whether this is a purely euro effect or whether
similar changes in bank risk are observed for neighbouring non euro-zone banks.
Seventh, we test for the impact of excluding the Italian savings banks from the sample.
Eighth, we test to see whether changes in the level of economic growth could explain the
decrease in bank risk. Finally, we generate CUSUM square graphs to check the timing of
structural breaks to see whether these are aligned with the date when the EMU was put
into place.
5.1 Selected commercial banks
We construct a sample of 51 commercial banks from our original sample and
divide it into foreign exposure banks, regional exposure banks and local exposure banks.
We use the MSCI world index for the foreign exposure banks, MSCI Europe index for
the regional banks and MSCI country index for the local exposure banks. We re-estimate
the risk measures by using both single market model and two-factor market model. We
find 84% of the banks show a decline in idiosyncratic risk and total risk which are
18
statistically significant at 1% significance level. We also find 71% of the commercial
banks exhibit a decline in systematic risk with 14 banks being statistically significant at
1% significance level. It is important to note that the decline in bank equity risk is mainly
observed in banks with foreign and regional exposures.
5.2 Equity Market Index Choice and Equity Pricing Model
We estimate systematic risk using the MSCI world index and the results are again
consistent with our previous estimates. One exception is that with the world index we
find a statistically significant risk reduction for the Bank of Ireland. The results for total
risk and idiosyncratic risk of the individual banks and portfolios also support our
previous results. Similar results are also obtained when the European market equity index
is used as the market portfolio proxy. The majority of the euro-zone banks report a
decrease in equity risk over the period and a large proportion of these banks show a
statistically significant decrease in equity risk regardless of the index chosen to capture
market risk.
In addition, we fit both a two-factor index model, including interest rates and
equity market index, as well as the Fama-French three factor model to the individual
bank and bank portfolio returns to provide a further check on the robustness of our
results. While there is little change in the results when using the two-factor model
(equation 6) our implementation of the Fama-French model needs a little more
explanation. In order to construct the excess market return (Rmt - Rft) and BE/ME (HML)
we use French’s website11 for all sample countries except Greece and Portugal. The size
premium (SMB) is calculated using the MSCI small capital index and MSCI benchmark
11 http://mba.tuck.dartmouth.edu/pages/faculty/ken.french/data_library.html
19
index. However, for Portugal and Greece we had to calculate SMB and HML premiums
as well as the excess market return.12 Our results suggest even after adjusting for HML
and SMB effects 51 of the banks exhibit a decline in systematic risk, with 22 of these
banks showing a statistically significant decline in risk. Consistent with the previous
analysis, few of the banks showed a statistically significant increase in systematic risk.
5.3 Controlling for different events
We also estimate the effect of episodes such as the Asian crisis 1997, the Russian
ruble crisis 1998 and the internet bubble 2000 on bank systematic risk using the country
wide market indices. It is important to note that we exclude 6 banks from this analysis
due to data limitations.13 We replicate the analysis with a series of dummy variables, one
for each event. The results are little changed from our previous analysis. There is also a
possibility that the true break in the data occurred at some time other than with EMU.14
As a result we review the literature for possible alternative break points and identify June
1998 as the most natural alternative date. This is the date when the introduction of a
single currency was announced. The analysis was repeated with this alternate break point
though here is no evidence of a break in bank risk occurring at this date. We discuss the
issue of structural change further in Section 5.9.
12 For each country we calculate the HML premium using the top and bottom 30% of the firms and the size premium using the top and bottom half of the sample. Otherwise the calculations of these premiums follow the standard approach used in the literature. We then calculate the market excess return using the 10 year bond benchmark as the risk-free rate. 13 The banks that have been excluded are: Erste bank in Austria, Mandatum bank in Finland, CIC ‘A’ in France, Banca Naz Lavoro and Banca Ppo di Verona Novara in Italy and Finibanco in Portugal. 14 We thank the reviewer for alerting us to this possibility.
20
5.4 Commercial bank indices
We also estimate systematic risk of the banking industry for each country using
commercially available bank industry indices extracted from DataStream International.
Our analysis uses both the single market model and two-factor market model that
includes an interest rate factor. The results also support our finding that the bank equity
risk for the banking industry in the euro-zone has declined with EMU.
5.5 Banking and Non-banking industries risk
It is also important to assess whether the change in risk that is observed in this
analysis merely reflects a general decrease in risk across Europe across both the financial
and non-financial firms. We calculate the change in total risk, systematic risk and
idiosyncratic risk for both the banking sector and the non-financial sector Datastream
indices for each of the countries. We find that while there is generally a decrease in risk
for the banking sector indices across the countries in the sample there are as many
increases as there are decreases in risk for the non-financial sector indices. The baning
risk reduction effects noted in this paper are not Europe wide effects. Further, the results
are evident regardless of the equity market index, European equity index or a world
equity index, used in the calculation of systematic risk and idiosyncratic risk.
5.6 Euro-zone and non Euro-zone banking industries
It is also of interest to determine whether the decrease in bank risk is focused
solely on the banks trading within euro-zone countries or whether it is also evident in the
neighbouring non euro-zone banks. On analysis of the neighbouring non euro-zone
21
countries we find that the banks in these countries also show some evidence of a decline
in risk, regardless of the measure chosen. Using the MSCI world index and MSCI Europe
index we find that all three measures of risk have declined in the banking sector industry
for both the euro-zone banks and for many of the neighbouring non euro-zone banks.
This result is consistent with EMU driven regional integration. Further, approximately
83% of the value of bank merger and acquisition deals in Europe involved the acquisition
of stakes in western European banks (Pricewaterhouse Coopers, 2006) and so it is
expected that decreases in euro-zone equity risk will affect both target bank risk and the
acquirer bank risk. Regardless, given the size of the euro-zone banking sector relative to
neighbouring non euro-zone banking sectors it is unlikely that this decrease in risk
observed for the euro-zone banks is driven by non euro-zone banks.
5.7 Excluding savings banks from Italian sample
We re-estimate the Italian bank portfolios by excluding six (6) savings banks from
the total bank sample. Our results for the equally-weighted and market value weighted
portfolio remains the same.15 Further, on an individual bank analysis, our average results
also remain essentially unchanged. We find more than 70% of the banks decrease their
idiosyncratic and systematic risk while approximately 80% of the banks reduce their total
risk over the sample period.
5.8 Bank risk and business cycle
We re-estimate our model in order to capture the risk behaviour of the European
banks during the economic downturn around 2001 and 2002. Theories of imperfect
15 We thank the referee for alerting us to this possible problem.
22
capital markets (Bernanke and Gertler 1989 and Kiyotaki and Moore 1997) argue that
asymmetric information and agency costs are high during business cycle downturns and
relatively low during booms. However, the pro-cyclical behaviour of banking business
may be augmented by the tendency for the banks to lend excessively during economic
upturns and to adopt over cautious lending standards during economic downturns
(Altman, Brady, Resti and Sironi 2005). Further, a positive correlation between risk and
GDP growth may arise from tendency for banks to increase their riskiness by lowering
their lending standards during economic upturns (Vennet, Jonghe and Baele 2004). We
estimate the correlation between the change, from the pre EMU period to the EMU
period, in systematic risk and GDP growth across our sample of countries. We find that
while changes in total risk and idiosyncratic risk are negatively correlated with changes
in GDP across the countries in the sample, changes in systematic risk are positively
correlated with changes in GDP. The inconsistency in estimated correlation sign suggests
that GDP growth does not provide a complete explanation for the decrease in risk that we
observe across all three risk measures used in this study. We leave further analysis of
this question to future research.
5.9 Structural Change
CUSUM square analysis allows us to verify whether the structural breaks indeed
align with the starting date for EMU. Out of a sample of 97 banks we find 90% of the
banks show a clear break around the time that the EMU was introduced. For example the
graph for SAMPO ‘A’ in Finland shows a break just after the introduction of euro. The
Belgium banks show evidence of structural change in period from 1999 to 2001. We also
find support for a structural break around the introduction of the EMU for Ireland and
23
Portugal. In Italy, both Banca Lombardo and Unicredito Italiano present a break point
around the establishment of EMU. Moreover, Spanish banks such as Banco de Castilla,
Banco Espanol de Credito, Banco Popular Espanol and Bankinter ‘R’ also appear to be
directly affected by the EMU.
For large German banks like the Bankgsellschaft Berlin, the Bayer Hypo-Und-
Vbk, the Commerz bank there is no direct link with the EMU though the graphs suggest
that there is a structural break closer to the middle of 1996 and the impact of the Asian
Crisis around 1997. Regardless, it is important to note that some of the relatively smaller
German banks like the Oldenburger LB and the BHW Holdings show a break point with
the introduction of EMU consistent with the majority of the banks in the sample. In short,
the CUSUM square graphs support the assumption that a structural change occurred with
the formation of EMU.
6. Conclusion
The aim of this paper is to assess the impact of EMU on euro-zone bank equity
risk. We find that over 70% of the banks reduced their total risk. More than 60% of the
banks exhibit a reduction in idiosyncratic risk and 64% of the banks exhibit a decrease in
systematic risk. The banks that exhibit a decrease in bank equity risk are clustered in
countries like Austria, France, Greece, Italy, Portugal and Spain.
Our results are robust to a number of different test specifications. For example, the
use of the European index and world index as a proxy for the market index had little
impact on the results and the use of the Fama French three-factor model, which adjusts
for the impact of size and value as well as market effects, also has little effect on our tests
24
for change in market sensitivity of bank equity over the period. We also adjust for
financial crises that occurred during our sample period and find little change in our
results. Analysis of banking industry index returns is also undertaken as a further check
on the results. In addition, visual analysis of CUSUM square graphs provide evidence of
a structural break around the time of the introduction of EMU for most of the banks in
our sample. In summary, the majority of the banks in the sample exhibit a decrease in
systematic risk with EMU.
Apparently, the euro-zone banking sector has been able to deal with the
macroeconomic shocks arising from EMU. There has certainly been an increase in
domestic and cross border merger activity since the formation of EMU and it has been
argued that this has lead to an increase in financial integration among the euro-zone
countries. We also note a reduction in bank equity risk in some of the neighbouring non-
euro-zone European country banks with the formation of EMU.
We argue that our analysis contributes to the literature dealing with the impact of
regulatory change on the bank sector. The results portray an impressive picture of a
banking system which has faced financial deregulation, comprehensive changes
associated with EMU as well as several major financial crises. Yet, a large proportion of
the commercial banks and bank holding companies across Europe exhibit reduced equity
risk over the decade.
Our results are consistent with the contention that financial integration among the
European banks may have resulted in reduced operating risk through decreased foreign
exchange risk exposures, decreased differences in legislation and accounting and in
simplification of European securities regulation. There has also been a rapid increase in
25
bank merger and acquisition activity since 1999 with the beginning of EMU. These
important changes could account for individual bank equity risk reduction that we note in
this study. Furthermore, the reduction in risk in some non euro-zone European country
banks suggests the possibility of spill over effects from the EMU. However, the reduction
in risk in non euro-zone banking industry is not as pronounced as it is for EMU members.
While equity risk reduction is apparent in most countries in our sample, an
important exception is the German banking industry, where we observe an increase in
bank equity risk an average. The German banking industry is dominated by Sparkassen-
Finanzgruppe which includes savings and Landesbanken. This peculiarity of the German
banking system is said to have limited bank consolidation, lowered market concentration,
and facilitated continuing fragmentation in the market and may well explain the risk
increases that we observe in this study.
Policy makers should perhaps focus on gaining a better understanding of what
European bank capabilities helped them to reduce equity market risk while adapting to a
rapidly changing economic climate. From the point of view of EMU, the major policy
implication of this analysis is perhaps one of unintended consequences. While there was
little academic discussion concerning the impact of EMU on the banks, it appears that
EMU has had a marked impact on European bank equity risk. This decrease in risk
occurs at the systematic, idiosyncratic and total risk level. And, while the majority of
banks show a decrease in risk, there is a substantial number where a statistically
significant decline in risk is observed. One question for future research is whether this
decline in bank equity risk is due to bank portfolio diversification, bank mergers and

26
acquisitions, increased equity holdings, changing income or the internationalization of the
euro-zone banks as they take a more active part in the Eastern European markets.
Acknowledgements
We thank the editor, Ike Mathur, and an anonymous referee for their
recommendations. We acknowledge the comments and suggestions of participants at the
19th Australasian Banking and Finance Conference (2006) and at the RMIT School of
Economics, Finance and Marketing seminar series in 2006. We also thank Professor
Barry Williams for his helpful comments and advice. The usual caveats apply.
27
Reference
Aharony, J., Saunders, A., Swary, I. 1988. The effects of DIDMCA on bank
shareholders’ return and risk. Journal of Banking and Finance 12, 317-331.
Akhigbe, A., Whyte, A.M., 2004. The Gramm-Leach -Bliley Act of 1999: risk
implications for the financial services industry. The Journal of Financial Research 27,
435-446.
Allen, F., Song, W. L., 2005. Financial integration and EMU. European Financial
Management 11, 7-24.
Altman, E. I., Brady, B., Resti, A., Sironi, A., 2005. The link between default and
recovery rates: Theory, empirical evidence and implications. Journal of Business 78 (6),
2203-2227.
Altunbas, Y., Ibanez, D.M., 2004. Mergers and acquisitions and bank performance in
Europe: the role of strategic similarities. Working paper series No. 398, 1-35, European
Central bank.
Amihud, Y., DeLong, G.L., Saunders, A., 2002. The effects of cross-border bank mergers
on bank risk and value. Journal of International Money and Finance 21, 857-877.
Amoako-Adu, B., Smith, B., 1995. The wealth effects of deregulation of Canadian
financial institutions. Journal of Banking and Finance 19, 1211-1236.
Baele, L. De Jonghe, O., Vennet, R. V. , 2007. Does the stock market value
diversification? Journal of Banking and Finance 31, 1999-2023.
Bartram, S. M. , Taylor, S. J. , Wang, Y. H. , 2007. The euro and European financial
market dependence. Journal of Banking and Finance 31, 1461-1481.
28
Benink, H., Benston, G., 2005. The future of banking regulation in developed countries:
lessons from and for Europe. Financial Markets, Institutions and Instruments 14, 289-
328.
Bernanke, B. S., Gertler, M., 1989. Agency costs, net worth, and business fluctuations.
American Economic Review 79, 14-31.
Binder, J. J., 1985. Measuring the effects of regulation with stock price data. Journal of
Economics 16, 167-183.
Boyd, J.H., De Nicolo, G., 2005. The theory of bank risk taking and competition
revisited. Journal of Finance 60, 1329-1343.
Bundt, T.P., Cosimano, T.F., Halloran, J.A., 1992. DIDMCA and market risk: theory and
evidence. Journal of Banking and Finance 16, 1179-1193.
Campbell, J.Y., Lettau, M., Malkiel, B.G., Xu, Y., 2001. Have individual stocks become
more volatile? An empirical exploration of idiosyncratic risk. Journal of Finance 56,1-43.
Carletti, E., Hartmann, P., Spagnolo, G., 2006. Bank mergers, competition and liquidity.
Centre for Financial Studies working paper series, No. 2006/08, 1-49.
Chance, D.M., Lane, W.R., 1980. A re-examination of interest rate sensitivity in the
common stocks of financial institutions. Journal of Financial Research 3, 49-55.
Craig, B., Santos, J.C., 1997. The risk effects of bank acquisitions. Federal Reserve Bank
of Cleveland. Economic Review, 25-35.
Diamond, D. W., Dybvig, P.H., 1983. Bank runs, deposit insurance and liquidity. Journal
of Political Economy 91, 401-419.
Demsetz, R.S., Strahan, P.E., 1997. Diversification, size and risk at bank holding
companies. Journal of Money, Credit and Banking 29, 300-313.
29
Dewatripont, M., Tirole, J., 1994. The prudential regulation of banks. The Walras- Pareto
Lectures at the École des Hautes Études Commerciales, Université de Lausanne. MIT
Press, London.
Francis, B.B., Hunter, D.M., 2004. The impact of euro on risk exposure of the world's
major banking industries. Journal of International Money and Finance 23, 1011-1042.
Galloway, T.M., Lee, W.B., Roden, D.M., 1997. Banks' changing incentives and
opportunities for risk taking. Journal of Banking and Finance 21, 509-527.
Goddard, J., Molyneux, P., Wilson, J. O. S., Tavakoli, M, 2007. European banking: An
overview. Journal of Banking and Finance 31, 1911-1935.
Hogan, W.P., Sharpe, I.G., 1984. Regulation, risk and the pricing of Australian bank
shares. Economic Record 60, 34-44.
Houston, J.F., Stiroh, K., 2006. Three decades of financial sector risk. Federal Reserve
Bank of New York. Staff Report No. 248.
Hughes, J.P., Lang, W., Mester, L. J., Moon, C., 1996. Efficient banking under interstate
branching. Journal of Money, Credit and Banking 28, 1045-1071.
Kane, E.J., Unal, H., 1988. Changes in market assessments of deposit-institution
riskiness. Journal of Financial Services Research 1, 207-229.
Kiyotaki, N. , Moore, J., 1997. Credit cycles. Journal of Political Economy 105, 211-248.
Marco, T. G., Robles-Fernandez, M. D., 2007. Risk-taking behaviour and ownership in
the banking industry: the Spanish evidence. Journal of Economics and Business,
forthcoming.
Ongena, S., Smith, D.C., Michalsen, D., 2003. Firms and their distressed banks: lessons
from the Norwegian banking crisis. Journal of Financial Economics 67, 81-112.
30
Park, S., 1994. Explanations for he increased riskiness of banks in 1980s, Federal
Reserve Bank of St. Louis 76, 3-23.
Pricewaterhouse Coopers, 2006, European banking consolidation, Working paper, 1-16.
(http://www.pwc.com/extweb/pwcpublications.nsf/docid/8ec8b5ad78c51cbe8525716400
3d6ff4)
Salas, V., Saurina, J., 2003. Deregulation, market power and risk behavior in Spanish
banks. European Economic Review 47, 1061-1075.
Smirlock, M., 1984. An analysis of bank risk and deposit rate ceilings: evidence form the
capital markets. Journal of Monetary Economics 13, 195-210.
Staikouras, C.K., Koustsomanoli-Fillipaki, A., 2006. Competition and concentration in
the new European banking landscape. European Financial Management 12, 443-482.
Stein, J.C., 1987. Informational externalities and welfare-reducing speculation. The
Journal of Political Economy 95, 1123-1145.
Strahan, P.E., 2006. Bank diversification, economic diversification? Economic Letter.
Federal Reserve Bank of San Francisco. www.highbeam.com/docs/1G1-146354008.
Vennet, R.V., Jonghe, O.D., Baele, L., 2004. Bank risks and the business cycle. Working
paper 264, 1-35.
Williams, J., Gardener, E.P.M., 2002. The efficiency of European regional banking.
Regional Studies 37, 321-330.
31
Table 1 Descriptive statistics of the sample
This table presents descriptive statistics for monthly returns for the euro-zone countries and the non-euro zone EU countries. All returns are in the local currency. Mean is the average return for the banks listed in the country, Median is the middle return observation for the banks, St. Dev. is the average monthly return standard deviation for the banks, Max. (Min.) is the maximum (minimum) return observed for any of the banks within the country, Skew is the average skewness value and Kurt. is the average kurtosis estimate for the banks in the country, Obs. refers to the number of bank-month observations available for the country and Banks refers to the number of bank shares included in the sample that are listed in the country. It should be noted that for the Finnish bank, Alandsbanken, both the A and the B shares are included in our sample. This leads to a total number of 96 banks from euro-zone countries and 85 banks from non euro- zone countries that are subject to analysis.
Mean Median St. Dev Max. Min. Skew Kurt. Obs. Banks
Euro zone
Austria 0.01 0.00 0.04 0.23 -0.21 0.70 6.57 613 5 Belgium 0.01 0.02 0.08 0.26 -0.39 -0.65 3.00 385 3 Finland 0.01 0.00 0.17 1.10 -1.14 -0.02 18.74 753 6 France 0.01 0.01 0.08 0.30 -0.52 -1.12 8.28 1035 7 Germany 0.01 0.00 0.10 0.83 -0.67 0.12 12.33 1468 11 Greece 0.02 0.01 0.14 1.01 -0.67 0.97 5.99 1360 9 Ireland 0.02 0.03 0.08 0.31 -0.28 -0.21 1.33 544 4 Italy 0.01 0.01 0.09 0.94 -0.56 0.89 8.86 3773 28 Netherlands 0.02 0.02 0.09 0.95 -0.41 1.48 19.45 544 3 Portugal 0.01 0.00 0.07 0.44 -0.28 0.66 5.05 774 6 Spain 0.02 0.01 0.07 0.41 -0.40 0.13 5.26 816 14
Non euro-zone
Denmark 0.02 0.01 0.05 0.91 -0.41 2.78 34.78 6056 44 Norway 0.02 0.02 0.07 0.23 -0.40 -0.92 5.59 272 2 Sweden 0.01 0.01 0.09 0.46 -0.63 -0.75 6.65 638 5 Switzerland 0.01 0.00 0.07 0.55 -0.55 -0.21 13.08 3621 26 United Kingdom 0.01 0.01 0.09 0.44 -0.45 -0.49 3.05 986 8
32
Table 2 European bank sector risk versus European non-financial sector risk
This table reports the results of total, idiosyncratic and systematic risk estimation based on
Datastream indices for the Europ
ean region. We calculate changes in
risk using the non
-financial sector index and the banking sector index to provide an indication of the different effects observed with EMU for these two sectors.
The to
tal risk and idiosyncratic risk estim
ates are expressed as standard deviation. T
he systematic and id
iosyncratic risk estim
ates are calculated using two MCSI
indices, the M
SCI Europ
e index and the MCSI World index. F
-test Prob is the probability attached to the F-test for change in variance and t-stats refers to the t-
test on the change in system
atic risk across the period. To provide some indication of the change in risk exhibited across the euro-zon
e countries we repeat the
analysis at the cou
ntry level and count the num
ber of cou
ntries reporting a decrease in risk (CN*) or an in
crease in
risk (C
N+) as well as the nu
mber of cou
ntries
with a statistically significant decrease in
risk (CN**) or a statistically significant increase in risk (CN++). T
hese cou
nts appear in
the Difference columns of the
table with the count o
f the statistically significant changes reported in parentheses.
Total risk
Idiosyncratic
risk
Systematic risk
MSCI Indexes
Pre
EMU
Post
EMU
Difference
F test
Prob
Pre
EMU
Post
EMU
Difference
F test
Prob
Changes
in β
t-stats
Europe Index
Non Financial sector
0.03
7 0.04
8 0.01
1 0.05
4+
0.01
9 0.02
2 0.00
3 0.26
1 0.20
5 2.66
* CN* (C
N**)
6 (3)
5 (2)
6 (3)
CN+ (CN++)
5 (2)
6 (2)
5 (1)
Banking sector
0.06
3 0.05
6 -0.007
0.37
2 0.03
1 0.03
0 -0.001
0.79
0 -0.198
-1.28
CN* (C
N**)
7 (6)
7 (5)
9 (5)
CN+ (CN++)
4 (1)
4 (1)
2 (0)
World Index
Non Financial sector
0.03
7 0.04
8 0.01
1 0.05
4+
0.02
4 0.02
6 0.00
2 0.64
5 0.28
7 2.68
* Banking sector
0.06
3 0.05
6 -0.007
0.37
2 0.04
4 0.03
5 -0.009
0.05
2+
-0.040
-0.210
*, + significant at 5
% (10
%) significance level
33
Table 3 Estimates of total risk and idiosyncratic risk of European banks This table reports results of tests for change in bank equity total and idiosyncratic risk. The average of individual bank total risk estimates for pre EMU and post EMU periods for each country are reported in Panel A along with counts of the number of statistically significant individual bank total risk estimate changes. We use F tests for change in variance. Similar results are reported in Panel B for individual bank idiosyncratic risk estimates. N is the total number of banks that are included in risk calculations for the country. N* is the number of banks with a decrease in total risk. N** is the total number of banks with a statistically significant decrease in risk. N+ is the number of banks with an increase in total risk and N++ is the number of banks with a statistically significant increase in total risk at the 5% level of significance. Note that N could exceed the sum of N* and N+ where the risk estimates (to four decimal places) are unchanged. In this regard, N0 shows the number of banks that exhibit no change in risk estimates to four decimal places. Total risk is defined: 2
12 )(/1 RRN t
N
tri −∑= =σ where 2riσ is the variance of the return for bank i,
Ri return of bank i and R average bank i return. Idiosyncratic risk is defined as 2222rmri σβσσ ε −=
where 2riσ is the total risk for bank i , 2
εσ bank return idiosyncratic risk and 22rmσβ reflects the impact of
systematic risk. Panel C presents the estimates of idiosyncratic risk and total risk for equally weighted (equal wgt.) and market value weighted (MV wgt.) portfolios.
Panel A Estimates of total risk for individual banks using country index
Country Average
Pre EMU Average Post EMU
Average Change
N N0 N* N** N+ N++
Euro zone
Austria 0.063 0.045 -0.018 5 1 4 3 0 0 Belgium 0.071 0.077 0.006 3 0 1 0 2 1 Finland 0.164 0.182 0.018 6 0 5 4 1 0 France 0.100 0.063 -0.037 7 1 5 5 1 1 Germany 0.210 0.114 -0.096 11 0 1 0 10 7 Greece 0.152 0.134 -0.018 9 0 7 4 2 1 Ireland 0.071 0.077 0.006 4 0 0 0 4 0 Italy 0.110 0.084 -0.026 28 0 22 17 6 1 Netherlands 0.089 0.084 -0.005 3 0 3 1 0 0 Portugal 0.095 0.063 -0.032 6 1 5 4 0 0 Spain 0.084 0.055 -0.029 14 0 14 11 0 0
Total euro zone 0.110 0.089 -0.021 96 3 67 49 26 11
Non euro zone
Denmark 0.049 0.055 0.006 44 0 18 6 26 15 Norway 0.077 0.067 -0.010 2 0 2 0 0 0
Sweden 0.092 0.093 0.001 5 0 4 3 1 1 Switzerland 0.070 0.060 -0.010 26 1 16 11 9 4 United Kingdom 0.095 0.079 -0.016 8 0 6 3 2 1 Total non euro zone 0.077 0.071 -0.006 85 1 46 23 38 21
34
Panel B Estimates of idiosyncratic risk for individual banks using country index
Country
Average Pre EMU
Average Post EMU
Average Change
N
N0
N*
N**
N+
N++
Euro zone
Austria 0.045 0.032 -0.013 5 0 5 2 0 0 Belgium 0.055 0.055 0.000 3 1 2 1 0 0 Finland 0.155 0.179 0.024 6 0 4 2 2 0 France 0.077 0.055 -0.022 7 0 5 5 2 1 Germany 0.055 0.100 0.045 11 0 2 1 9 7 Greece 0.114 0.032 -0.082 9 0 5 3 4 2 Ireland 0.055 0.063 0.008 4 0 0 0 4 0 Italy 0.084 0.071 -0.013 28 4 17 11 7 4 Netherlands 0.063 0.063 0.000 3 0 1 1 2 0 Portugal 0.071 0.055 -0.016 6 1 4 3 1 0 Spain 0.063 0.045 -0.018 14 0 13 11 1 1 Total euro-zone 0.076 0.068 -0.008 96 6 58 40 32 15 Non euro zone Denmark 0.047 0.051 0.004 44 0 15 5 29 17 Norway 0.059 0.055 -0.004 2 0 1 - 1 - Sweden 0.071 0.066 -0.005 5 0 3 3 2 1 Switzerland 0.054 0.052 -0.002 26 0 13 9 13 6 United Kingdom 0.069 0.062 -0.007 8 0 5 3 3 1 Total non euro zone 0.060 0.057 -0.003 85 0 37 20 48 25
35
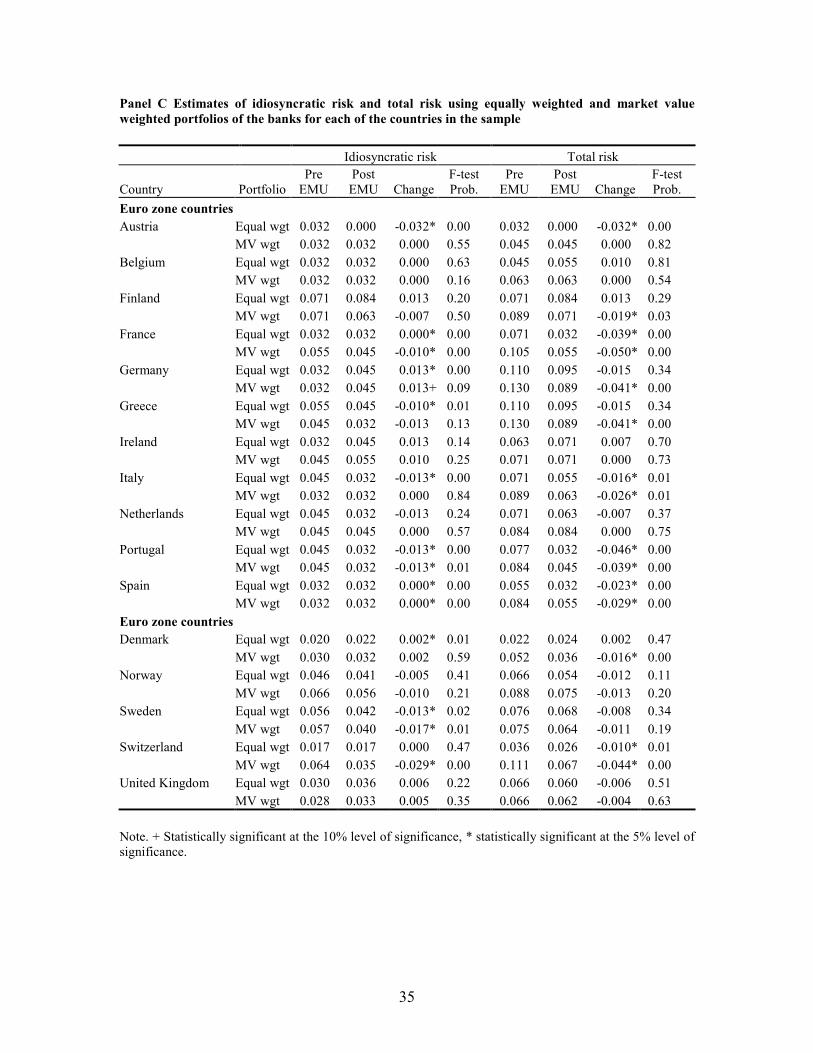
Panel C Estimates of idiosyncratic risk and total risk using equally weighted and market value
weighted portfolios of the banks for each of the countries in the sample
Idiosyncratic risk Total risk
Country Portfolio Pre EMU
Post EMU Change
F-test Prob.
Pre EMU
Post EMU Change
F-test Prob.
Euro zone countries
Austria Equal wgt 0.032 0.000 -0.032* 0.00 0.032 0.000 -0.032* 0.00 MV wgt 0.032 0.032 0.000 0.55 0.045 0.045 0.000 0.82 Belgium Equal wgt 0.032 0.032 0.000 0.63 0.045 0.055 0.010 0.81 MV wgt 0.032 0.032 0.000 0.16 0.063 0.063 0.000 0.54 Finland Equal wgt 0.071 0.084 0.013 0.20 0.071 0.084 0.013 0.29 MV wgt 0.071 0.063 -0.007 0.50 0.089 0.071 -0.019* 0.03 France Equal wgt 0.032 0.032 0.000* 0.00 0.071 0.032 -0.039* 0.00 MV wgt 0.055 0.045 -0.010* 0.00 0.105 0.055 -0.050* 0.00 Germany Equal wgt 0.032 0.045 0.013* 0.00 0.110 0.095 -0.015 0.34 MV wgt 0.032 0.045 0.013+ 0.09 0.130 0.089 -0.041* 0.00 Greece Equal wgt 0.055 0.045 -0.010* 0.01 0.110 0.095 -0.015 0.34 MV wgt 0.045 0.032 -0.013 0.13 0.130 0.089 -0.041* 0.00 Ireland Equal wgt 0.032 0.045 0.013 0.14 0.063 0.071 0.007 0.70 MV wgt 0.045 0.055 0.010 0.25 0.071 0.071 0.000 0.73 Italy Equal wgt 0.045 0.032 -0.013* 0.00 0.071 0.055 -0.016* 0.01 MV wgt 0.032 0.032 0.000 0.84 0.089 0.063 -0.026* 0.01 Netherlands Equal wgt 0.045 0.032 -0.013 0.24 0.071 0.063 -0.007 0.37 MV wgt 0.045 0.045 0.000 0.57 0.084 0.084 0.000 0.75 Portugal Equal wgt 0.045 0.032 -0.013* 0.00 0.077 0.032 -0.046* 0.00 MV wgt 0.045 0.032 -0.013* 0.01 0.084 0.045 -0.039* 0.00 Spain Equal wgt 0.032 0.032 0.000* 0.00 0.055 0.032 -0.023* 0.00 MV wgt 0.032 0.032 0.000* 0.00 0.084 0.055 -0.029* 0.00
Euro zone countries
Denmark Equal wgt 0.020 0.022 0.002* 0.01 0.022 0.024 0.002 0.47 MV wgt 0.030 0.032 0.002 0.59 0.052 0.036 -0.016* 0.00 Norway Equal wgt 0.046 0.041 -0.005 0.41 0.066 0.054 -0.012 0.11 MV wgt 0.066 0.056 -0.010 0.21 0.088 0.075 -0.013 0.20 Sweden Equal wgt 0.056 0.042 -0.013* 0.02 0.076 0.068 -0.008 0.34 MV wgt 0.057 0.040 -0.017* 0.01 0.075 0.064 -0.011 0.19 Switzerland Equal wgt 0.017 0.017 0.000 0.47 0.036 0.026 -0.010* 0.01 MV wgt 0.064 0.035 -0.029* 0.00 0.111 0.067 -0.044* 0.00 United Kingdom Equal wgt 0.030 0.036 0.006 0.22 0.066 0.060 -0.006 0.51 MV wgt 0.028 0.033 0.005 0.35 0.066 0.062 -0.004 0.63
Note. + Statistically significant at the 10% level of significance, * statistically significant at the 5% level of significance.
36
Table 4 Estimates of Systematic risk for European banks Average individual bank systematic risk estimates (β) are reported by country for both the euro-zone and the non euro-zone countries. The β estimates are reported for total sample period and pre-EMU period along with the change in systematic risk that occurred with EMU in Panel A. These estimates are calculated using country equity market indices for both individual banks and bank portfolios. N is the number of banking shares in the sample that are listed for the country. N* is the number of banks with a decrease in systematic risk and N** refers to the total number of banks with a statistically significant decrease in systematic risk at the 5% level of significance. N+ is the total number of banks that show an increase in systematic risk and N++ is the total number of banks that show a statistically significant increase in systematic risk at the 5% level of significance. Bank portfolio results are reported in Panel B and these include both equally weighted (equal wgt.) and market value weighted (MV wgt.) portfolios. The standard market model is used to measure systematic risk:
itmtiiit RR εβα ++= (see equation (1)) where, itR is
the return on security i at time period t, mtR is the return on an equity market index at time period t. The
systematic risk estimate for each bank or portfolio of banks is iβ(systematic risk) and
itε is a random shock
term. We extend the market model in equation (1) by introducing a dummy variable to capture the structural changes in systematic risk. The dummy variable (D) takes on a value of zero (0) for the months of January 1995 to December 1998 and a value of one (1) from January 1999 to April 2006. ( ) ( ) tmtprepostmtpreprepostpret DRRDR εβββααα +−++−+= (See equation (2)).
Panel A Estimates of systematic risk for individual banks
Country
Average Full
Period
Average Pre EMU
Average Change N N* N** N+ N++
Euro zone
Austria 0.250 0.310 -0.120 5 4 2 1 0 Belgium 0.940 1.010 -0.110 3 1 1 2 0 Finland 0.170 0.490 -0.340 6 4 3 2 0 France 0.630 0.930 -0.480 7 5 4 2 0 Germany 0.560 0.560 0.010 11 7 3 4 1 Greece 1.110 0.990 0.220 9 3 1 6 1 Ireland 0.940 1.100 -0.230 4 4 0 0 0 Italy 0.820 0.800 0.040 28 15 5 13 4 Netherlands 0.990 0.860 0.030 3 3 0 0 0 Portugal 0.640 0.900 -0.450 6 6 3 0 0 Spain 0.510 0.620 -0.210 14 11 4 3 0
Total euro-zone 0.687 0.779 -0.149 96 63 26 33 6
Non euro zone Denmark 0.120 0.202 -0.123 44 33 9 11 0 Norway 0.622 0.702 -0.129 2 2 0 0 0 Sweden 0.734 0.916 -0.232 5 4 3 1 1 Switzerland 0.485 0.511 -0.04 26 14 4 12 1 United Kingdom 1.322 1.603 -0.375 8 5 4 3 0
Total non euro-zone 0.657 0.787 -0.180 85 58 20 27 2
37
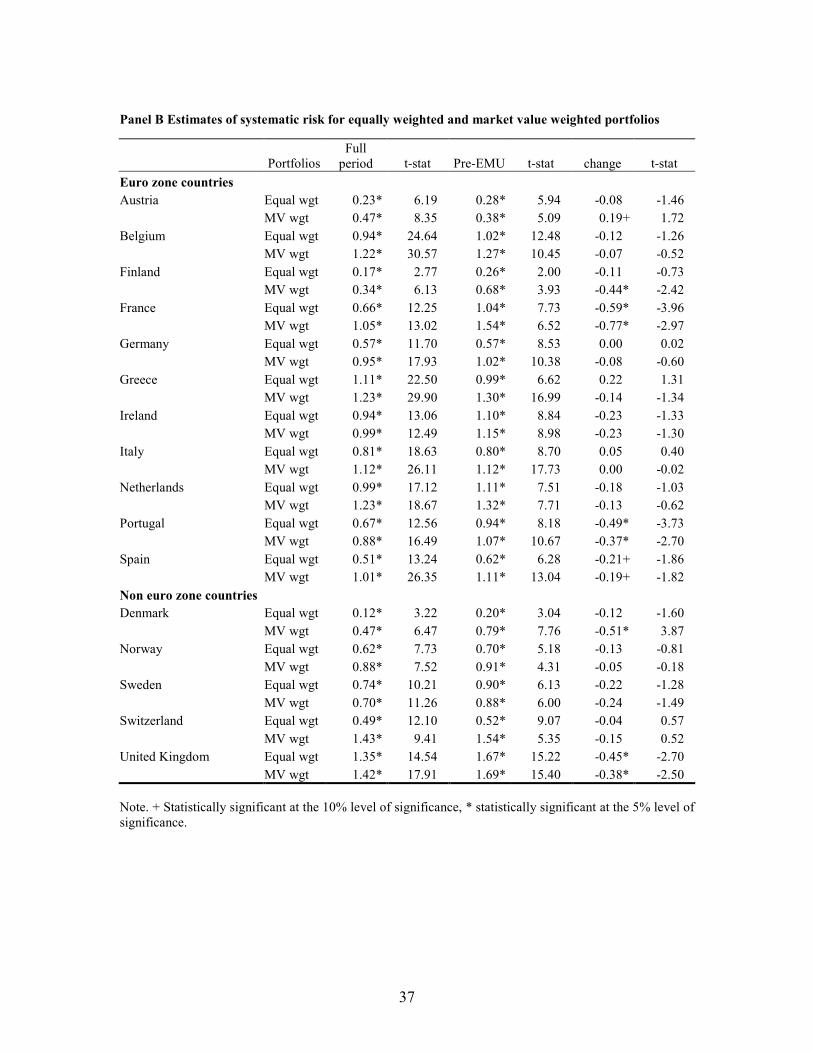
Panel B Estimates of systematic risk for equally weighted and market value weighted portfolios
Portfolios Full period t-stat Pre-EMU t-stat
change t-stat
Euro zone countries
Austria Equal wgt 0.23* 6.19 0.28* 5.94 -0.08 -1.46 MV wgt 0.47* 8.35 0.38* 5.09 0.19+ 1.72 Belgium Equal wgt 0.94* 24.64 1.02* 12.48 -0.12 -1.26 MV wgt 1.22* 30.57 1.27* 10.45 -0.07 -0.52 Finland Equal wgt 0.17* 2.77 0.26* 2.00 -0.11 -0.73 MV wgt 0.34* 6.13 0.68* 3.93 -0.44* -2.42 France Equal wgt 0.66* 12.25 1.04* 7.73 -0.59* -3.96 MV wgt 1.05* 13.02 1.54* 6.52 -0.77* -2.97 Germany Equal wgt 0.57* 11.70 0.57* 8.53 0.00 0.02 MV wgt 0.95* 17.93 1.02* 10.38 -0.08 -0.60 Greece Equal wgt 1.11* 22.50 0.99* 6.62 0.22 1.31 MV wgt 1.23* 29.90 1.30* 16.99 -0.14 -1.34 Ireland Equal wgt 0.94* 13.06 1.10* 8.84 -0.23 -1.33 MV wgt 0.99* 12.49 1.15* 8.98 -0.23 -1.30 Italy Equal wgt 0.81* 18.63 0.80* 8.70 0.05 0.40 MV wgt 1.12* 26.11 1.12* 17.73 0.00 -0.02 Netherlands Equal wgt 0.99* 17.12 1.11* 7.51 -0.18 -1.03 MV wgt 1.23* 18.67 1.32* 7.71 -0.13 -0.62 Portugal Equal wgt 0.67* 12.56 0.94* 8.18 -0.49* -3.73 MV wgt 0.88* 16.49 1.07* 10.67 -0.37* -2.70 Spain Equal wgt 0.51* 13.24 0.62* 6.28 -0.21+ -1.86 MV wgt 1.01* 26.35 1.11* 13.04 -0.19+ -1.82
Non euro zone countries
Denmark Equal wgt 0.12* 3.22 0.20* 3.04 -0.12 -1.60 MV wgt 0.47* 6.47 0.79* 7.76 -0.51* 3.87 Norway Equal wgt 0.62* 7.73 0.70* 5.18 -0.13 -0.81 MV wgt 0.88* 7.52 0.91* 4.31 -0.05 -0.18 Sweden Equal wgt 0.74* 10.21 0.90* 6.13 -0.22 -1.28 MV wgt 0.70* 11.26 0.88* 6.00 -0.24 -1.49 Switzerland Equal wgt 0.49* 12.10 0.52* 9.07 -0.04 0.57 MV wgt 1.43* 9.41 1.54* 5.35 -0.15 0.52 United Kingdom Equal wgt 1.35* 14.54 1.67* 15.22 -0.45* -2.70 MV wgt 1.42* 17.91 1.69* 15.40 -0.38* -2.50 Note. + Statistically significant at the 10% level of significance, * statistically significant at the 5% level of significance.
Related Documents