EUROFEL-Report-2007-DS1-80 EUROPEAN FEL Design Study Deliverable N°: D1.14 Deliverable Title: Beam measurements with tomography module at PITZ Subtask : DS-1 Authors: G. Asova, C. Boulware, D. J. Holder, S. Korepanov, S. Khodyadchyk * , B. D. Muratori, S. Rimjaem, S. Skelton, R. Spesyvtsev, F. Stephan * presently at Siemens AG, Rudolstadt, Germany Project funded by the European Community under the “Structuring the European Research Area” Specific Programme Research Infrastructures action

Welcome message from author
This document is posted to help you gain knowledge. Please leave a comment to let me know what you think about it! Share it to your friends and learn new things together.
Transcript

EUROFEL-Report-2007-DS1-80
EUROPEAN FEL Design Study
Deliverable N°: D1.14
Deliverable Title: Beam measurements with tomography module at PITZ
Subtask : DS-1
Authors: G. Asova, C. Boulware, D. J. Holder, S. Korepanov, S. Khodyadchyk*, B. D. Muratori, S. Rimjaem, S. Skelton, R. Spesyvtsev, F. Stephan
*presently at Siemens AG, Rudolstadt, Germany
Project funded by the European Community under the “Structuring the European Research Area” Specific Programme
Research Infrastructures action

Abstract
A future upgrade of the PITZ facility will include a diagnostic section suitable for transverse phase space tomography and multiscreen emittance measurements [1]. The designed module should be capable of operation over a range of beam momenta between 15 and 40 MeV/c. The tomography module consists of four observation screens with three quadrupole focusing-defocusing (FODO) cells between them. An upstream section including a number of quadrupoles is used to match the electron beam Twiss parameters to the tomography section. The design considerations of the tomography section, results from numerical simulations of beam matching and phase-space reconstruction, preliminary tests of quadrupole emittance measurements, and tests of new quadrupole magnets will be presented in this report.
Introduction
A major goal of the Photo Injector Test Facility at DESY in Zeuthen (PITZ) is to build and to optimize high brightness electron sources for free-electron lasers operating by self-amplified spontaneous emission (SASE FELs). In such a machine, detailed knowledge of the phase-space distribution of the electron beam is critical for the performance of the output beam. Especially at short photon wavelengths, SASE FELs require very high phase space density in the electron beam, meaning high bunch charge with low transverse beam emittance. For the European X-ray laser (XFEL), the design value for the transverse emittance at the injector exit is 0.9 mm mrad, with a required bunch charge of 1 nC [2].
The Photo Injector Test Facility at DESY in Zeuthen (PITZ) will be upgraded to operate with higher beam energies in 2008. Part of the upgrade will be extended electron beam diagnostics, including a tomography section for detailed analysis of the transverse phase-space density distribution of the electron beam. A proposed extension of this tomography module includes an RF deflecting cavity to study the transverse distributions and measure emittance for temporal slices of selected electron bunches [3].
The tomography module will consist of three FODO cells and four diagnostic stations for beam size measurements. It has previously been shown that 45º phase advance between the cells delivers the smallest emittance measurement errors using four screens [4]. Since the beam in general does not have the necessary size and slope on the first screen, a matching section is necessary. Both the tomography and the matching sections have been designed in a collaboration between STFC Daresbury Laboratory and DESY. Preceding iterations of the design can be found in [5].
Installation of the tomography module was planned for 2007 with first beam measurements by the end of the year, but this installation has been delayed for a number of reasons. Because of the lack of manpower at PITZ and at STFC Daresbury Laboratory in the beginning of the project the start of the design work for the tomography module was delayed. Some further delay in the technical realization was caused by the necessity to first finish other technical tasks of higher priority in the PITZ2 project at DESY and on the ERLP and 4 GLS projects at STFC Daresbury Laboratory.
2

Further, the boundary conditions for the tomography design were not fixed at the start of the project; these included the distance of the tomography section from the gun, the space available for the tomography section and the requirement to accommodate space for a transverse deflecting cavity. Changes in these considerations required several iterations of the design.
In addition, the influence of space charge on the performance of the tomography module has, as expected, proved to be a difficult issue to resolve satisfactorily. Significant further work on these effects has been done following the publication of the physical design (deliverable D1.13 EuroFEL-Report-2006-DS1-021). Investigations are still continuing to devise a method to overcome this issue.
Despite these delays, much has been accomplished toward the operation of the tomography module at PITZ under the EuroFEL project. The physics design has been completed, with recent studies done on positioning of the quadrupoles when taking into account possible locations of the future RF deflector at PITZ. The quadrupole magnets which will make up the tomography module have been delivered and some excitation curve and effective length measurements have been made. Three pairs of these quadrupoles are being installed and will be tested with beam in spring 2008. For systematic studies, some quadrupole emittance measurements have already been done with beam in the summer of 2007 and compared to emittance measurements done using the slit method.
Simulations of beam matching and algorithms for phase space reconstruction from quadrupole scan data have been performed, so that the data analysis will be fully prepared when the full module is installed at PITZ in summer/fall 2008. The tomography module will be installed at that time along with the new PITZ booster section, with which the module is designed to operate. Phase space tomography measurements on the beam with the higher energy available from the new booster will follow immediately.
Design and layout
The full tomography module will be installed at PITZ as shown in Figure 1 (from reference [1]). It includes 15 quadrupole magnets, 4 kicker magnets, a traveling-wave RF deflecting cavity, and multiple screen stations.
Figure 1. Schematic diagram of tomography module (crossed boxes represent quadrupoles, slashed boxes represent screen stations, and the blue section represents the RF deflector).
3
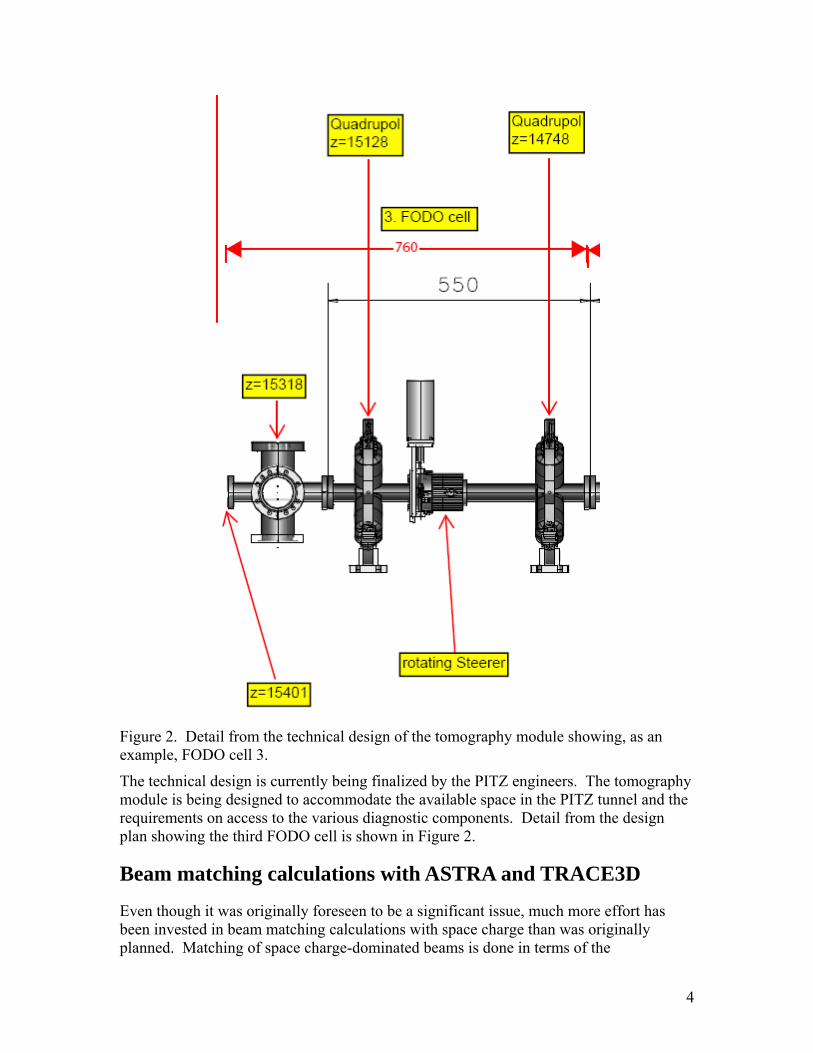
Figure 2. Detail from the technical design of the tomography module showing, as an example, FODO cell 3.
The technical design is currently being finalized by the PITZ engineers. The tomography module is being designed to accommodate the available space in the PITZ tunnel and the requirements on access to the various diagnostic components. Detail from the design plan showing the third FODO cell is shown in Figure 2.
Beam matching calculations with ASTRA and TRACE3D
Even though it was originally foreseen to be a significant issue, much more effort has been invested in beam matching calculations with space charge than was originally planned. Matching of space charge-dominated beams is done in terms of the
4
minimization of a ’cost function’ which takes into account the beam size X(z), Y(z) and slope dX/dz(z), dY/dz(z) and generalized perveance, including the kinetic energy and the beam peak current as a ratio between the bunch charge and length [1].
Initially, five quadrupoles used for matching were assumed, but they were found to be insufficient with the designed effective length. There is a possibility to include up to a further four magnets, located in an upstream straight section. Two independent approaches and setups were evaluated in order to obtain a matched beam on the first screen in the presence of self repulsive forces. Initially ASTRA was used to track the electron beam along the full setup shown in Fig. 1 – nine matching quadrupoles, excluding the self-field repulsion. This would represent the ideal solution. Including the space charge afterwards gives some idea of the beam size mismatch and where the space-charge effects have strongest influence.
The defined cost function is
( ) ( ) ( ) ( )2,,2
,,222
owywyowxwxowwoww YYXX σσσσδδδδ −+−+′−′+′−′=Δ
where w denotes simulation with space charge included, wo denotes space charge forces switched off, and
startend
zUzU
zzX endstart
−
−=′ ,, σσ
δ
where zstart and zend refer to the beginning and the end of the drifts surrounding the quadrupoles. The cost function has to be minimized in a number of iterations, where the strength of each magnet for zero current is corrected with a predefined value
2RLLKkeff
=δ
where L is the overall length the space charge forces are acting on, Leff is the quadrupole effective length, K is the generalized perveance and R is beam radius. δk can be changed in each successive iteration to a value where the value of Δ is smaller. This iterative procedure has to include not less than two quadrupoles at a time. The process is rather time consuming since it requires evaluation of the results, but in this way the mismatch was decreased by five times inside the FODO lattice, while without correction no periodic solution was obtained. An example of the results inside the FODO lattice is shown in Figure 3. The beam was also matched with the help of TRACE-3D [6] for the same layout of quadrupoles. The agreement in the resulting mismatch between the two methods is rather good. In both cases the periodicity in one of the transverse planes is better than in the other.
5

Figure 3. Beta functions in the x and y directions for the first matching setup with no space charge (red), with space charge (blue), and with space charge plus quadrupole strength corrections (green).
6

7
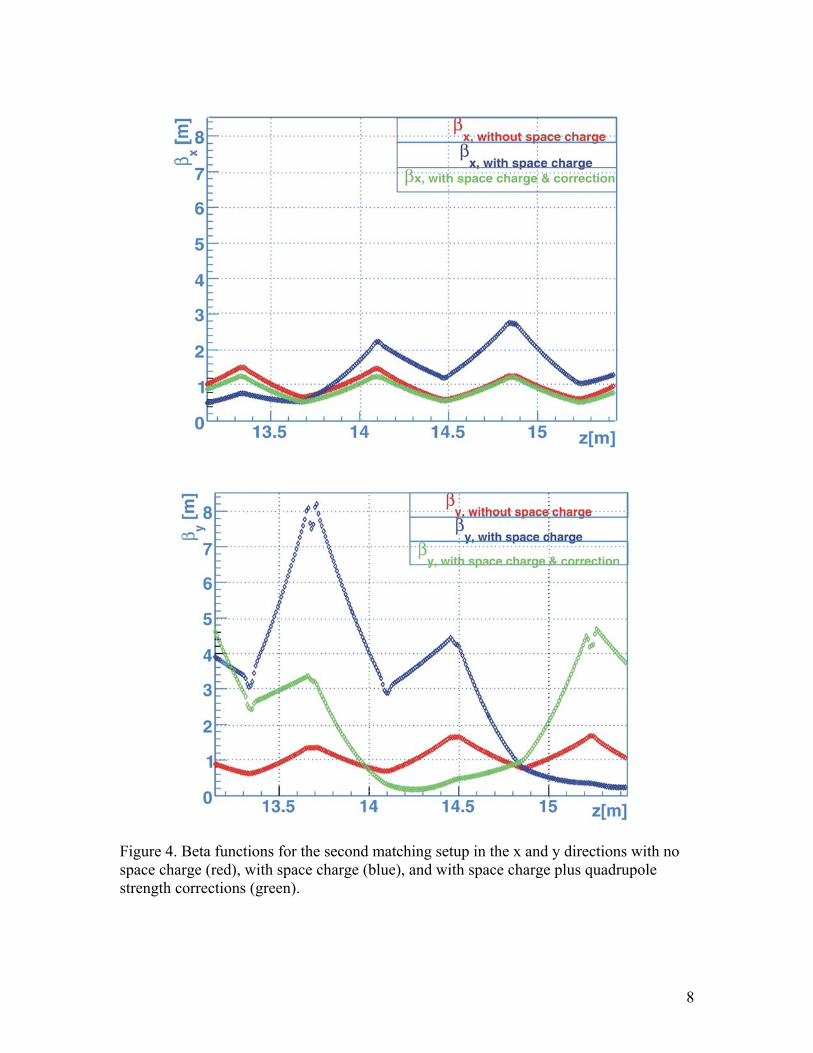
Figure 4. Beta functions for the second matching setup in the x and y directions with no space charge (red), with space charge (blue), and with space charge plus quadrupole strength corrections (green).
8

This can be seen as well using a different matching setup, excluding the first magnet from the previous case and including one more upstream. The result is shown in Fig. 4. Here the periodic solution for one plane was very good, while for the other it was not found. Inverting the polarity swaps the results for the two planes. Since the tomographic reconstruction requires recording projections for both planes, the reconstruction error will depend strongly on the mismatch for either of the transverse planes if they are coupled.
A third setup using quadrupole triplets has also been considered. To provide extra flexibility in the matching, the drift space between two of the upstream quadrupoles in the matching section can be mechanically adjusted (until the RF deflector is installed). Simulations have shown that the required gradient in the matching quadrupoles can be reduced by small adjustments in this drift space. This flexibility is important because the quadrupoles will be operated near the limit of the linear region of the field-current curve. Figure 5 shows the required gradients in the quadrupoles for beam momentum of 32 MeV/c, with the maximum gradient shown by the red bars. Figure 6 shows the results for beam momentum of 29 MeV/c. For both, the minimum beam emittance is 1 mm-mrad.
Figure 5. Required gradient along the matching section for different drift lengths between the first two quadrupoles, beam momentum 32 MeV/c, normalized emittance 1mm mrad. Dark red represents the nominal setup with drift space length d, the light red is the maximum allowed gradient. The green, orange, blue and magenta bars show the gradients for length increased by 0.02, 0.04, 0.06 and 0.08 m.
9

Figure 6. Required gradients for momentum of 29 MeV/c and 1 mm mrad normalized emittance.
Beam matching calculations with MADX and GPT
Another set of beam-matching simulations has been done for the PITZ tomography module using the General Particle Tracer (GPT) code [7]. Three energies were examined in detail for the PITZ2 matching line with space charge. We go through in some detail the three cases considered and give quadrupole strengths both with and without space charge. It can be seen analytically that a mismatch due to space charge may be resolved by modifying the quadrupole strength. However this can only be done if enough quadrupoles are available for a given distance. This means that, for example, when inside the tomography section, there is an insufficient number of quadrupoles to eliminate the mismatch entirely and a betatron oscillation results. However, this is not at all a problem and just needs to be taken into account when doing the tomography reconstruction.
This section is divided as follows: we have chosen three random energies at which to investigate the space charge mismatch and how to cure it. These energies are 15.5, 24.3 and 32 MeV. Previously the matching section started at around 9 m or 7 m from the gun, however, this has now changed and the matching section starts at 6 m from the gun. As a result of this, all matching shown in the previous report are now wrong and we show the original MADX match for the three cases considered again. The results from MADX are then taken and put into GPT (General Particle Tracer) program where a further matching is done with space charge included. To the best of our knowledge, GPT is the only program which has this ability. For each energy considered, two cases are shown corresponding to two different space charge routines in GPT (the first uses a traditional, mesh based algorithm whereas the second calculates relativistic macro-particle – macro-particle interactions). The quadrupole strengths are listed for every case. In some instances there is a significant difference between the two cases whereas in others the second set of results merely confirms the first. If the two cases differ (for example at 32 MeV where the rms beam size goes from approximately 0.95 mm to 1.2 mm), this does not mean that one case is wrong, only that the optimiser found two solutions.
10
Theoretically there is an infinity of solutions, the only distinction being the practicality of some with respect to others.
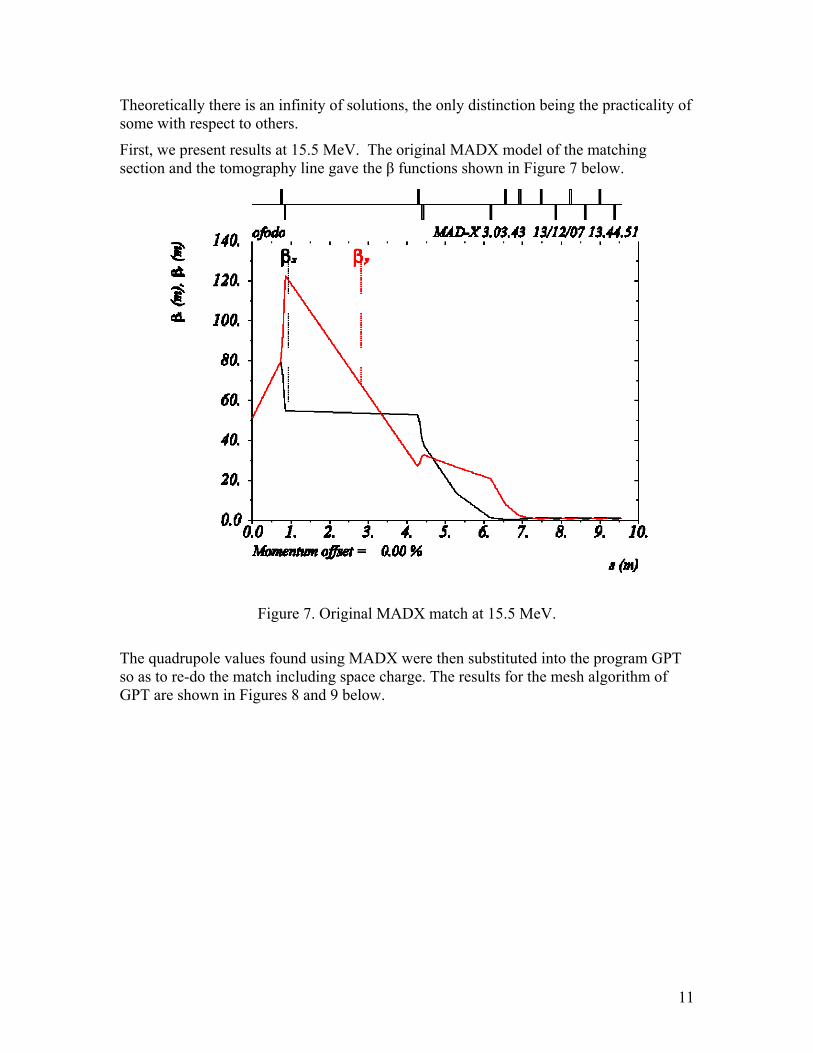
First, we present results at 15.5 MeV. The original MADX model of the matching section and the tomography line gave the β functions shown in Figure 7 below.
Figure 7. Original MADX match at 15.5 MeV.
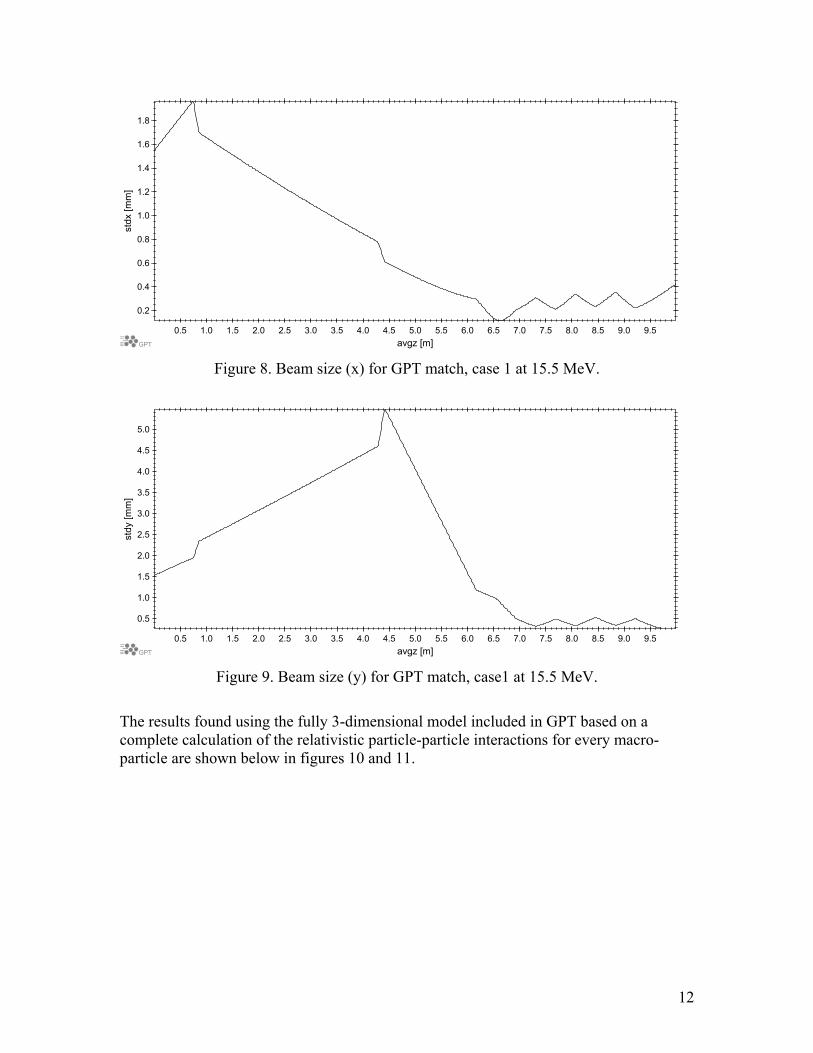
The quadrupole values found using MADX were then substituted into the program GPT so as to re-do the match including space charge. The results for the mesh algorithm of GPT are shown in Figures 8 and 9 below.
11
0.5 1.0 1.5 2.0 2.5 3.0 3.5 4.0 4.5 5.0 5.5 6.0 6.5 7.0 7.5 8.0 8.5 9.0 9.5GPT avgz [m]
0.2
0.4
0.6
0.8
1.0
1.2
1.4
1.6
1.8st
dx [m
m]
Figure 8. Beam size (x) for GPT match, case 1 at 15.5 MeV.
0.5 1.0 1.5 2.0 2.5 3.0 3.5 4.0 4.5 5.0 5.5 6.0 6.5 7.0 7.5 8.0 8.5 9.0 9.5GPT avgz [m]
0.5
1.0
1.5
2.0
2.5
3.0
3.5
4.0
4.5
5.0
stdy
[mm
]
Figure 9. Beam size (y) for GPT match, case1 at 15.5 MeV.
The results found using the fully 3-dimensional model included in GPT based on a complete calculation of the relativistic particle-particle interactions for every macro-particle are shown below in figures 10 and 11.
12

0.5 1.0 1.5 2.0 2.5 3.0 3.5 4.0 4.5 5.0 5.5 6.0 6.5 7.0 7.5 8.0 8.5 9.0 9.5GPT avgz [m]
0.2
0.4
0.6
0.8
1.0
1.2
1.4
1.6
1.8st
dx [m
m]
Figure 10. Beam size (x) for GPT match, case2 at 15.5 MeV.
0.5 1.0 1.5 2.0 2.5 3.0 3.5 4.0 4.5 5.0 5.5 6.0 6.5 7.0 7.5 8.0 8.5 9.0 9.5GPT avgz [m]
0.5
1.0
1.5
2.0
2.5
3.0
3.5
4.0
4.5
5.0
stdy
[mm
]
Figure 11. Beam size (y) for GPT match, case2 at 15.5 MeV.
All results are summarized in the table below: [T/m] Q1 Q2 Q3 Q4 Q5 Q6 Q7 QT
MADX -2.75 2.7 -1.6 1.22 1.14 -0.39 -2.1 -2.8 Case 1 -2.16 1.8 -1.9 2.37 -2.06 1.03 -1.63 -2.8 Case 2 -2.28 1.94 -1.82 2.3 -2.43 1.43 -1.18 -2.8
Table 1. GPT results at 15.5 MeV.
13

Following are the results for a beam energy of 24.3 MeV. The original MADX model of the matching section and the tomography line gave the β functions shown in figure 12 below.
Figure 12. Original MADX match at 24.3 MeV.
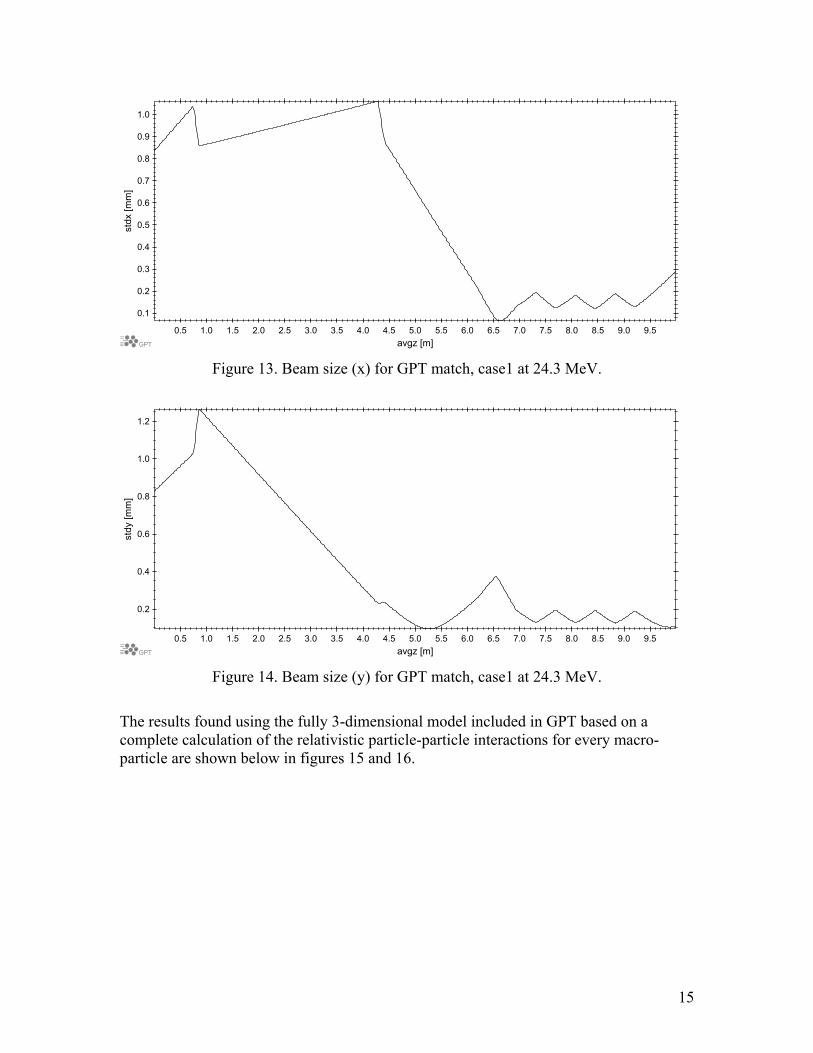
The quadrupole values found using MADX were then substituted into the program GPT so as to re-do the match including space charge. The results for the mesh algorithm of GPT are shown in figures 13 and 14 below
14
0.5 1.0 1.5 2.0 2.5 3.0 3.5 4.0 4.5 5.0 5.5 6.0 6.5 7.0 7.5 8.0 8.5 9.0 9.5GPT avgz [m]
0.1
0.2
0.3
0.4
0.5
0.6
0.7
0.8
0.9
1.0st
dx [m
m]
Figure 13. Beam size (x) for GPT match, case1 at 24.3 MeV.
0.5 1.0 1.5 2.0 2.5 3.0 3.5 4.0 4.5 5.0 5.5 6.0 6.5 7.0 7.5 8.0 8.5 9.0 9.5GPT avgz [m]
0.2
0.4
0.6
0.8
1.0
1.2
stdy
[mm
]
Figure 14. Beam size (y) for GPT match, case1 at 24.3 MeV.
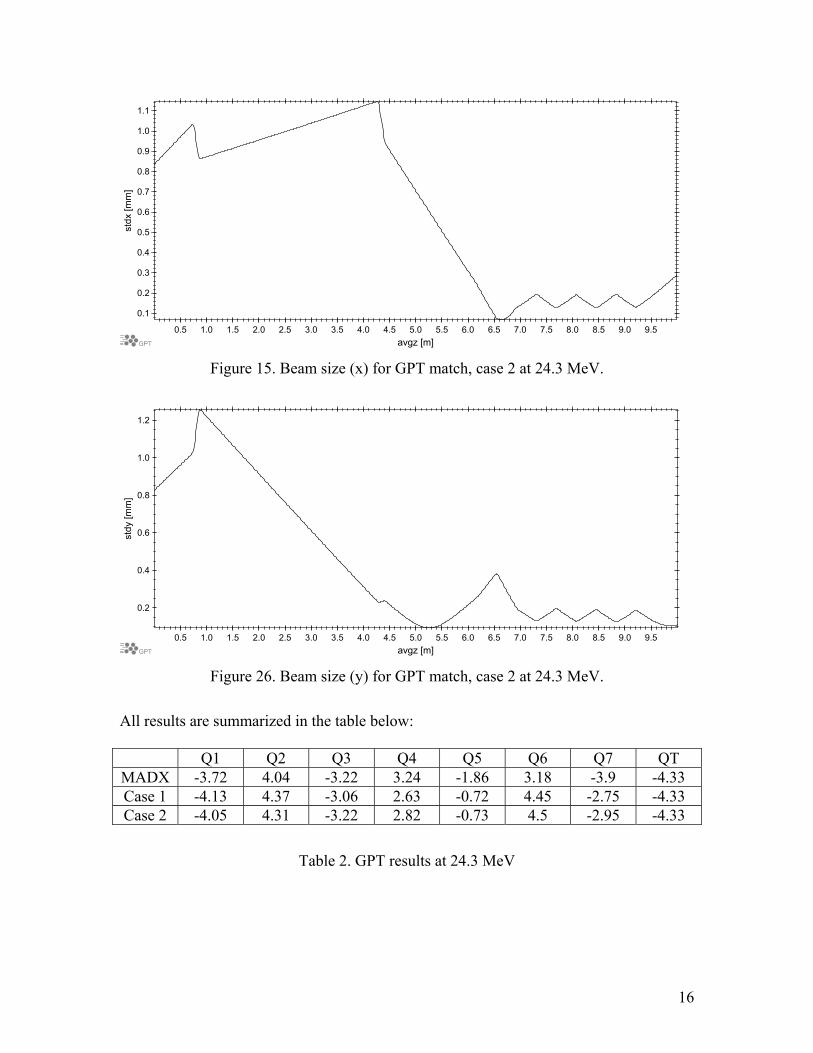
The results found using the fully 3-dimensional model included in GPT based on a complete calculation of the relativistic particle-particle interactions for every macro-particle are shown below in figures 15 and 16.
15
0.5 1.0 1.5 2.0 2.5 3.0 3.5 4.0 4.5 5.0 5.5 6.0 6.5 7.0 7.5 8.0 8.5 9.0 9.5GPT avgz [m]
0.1
0.2
0.3
0.4
0.5
0.6
0.7
0.8
0.9
1.0
1.1
stdx
[mm
]
Figure 15. Beam size (x) for GPT match, case 2 at 24.3 MeV.
0.5 1.0 1.5 2.0 2.5 3.0 3.5 4.0 4.5 5.0 5.5 6.0 6.5 7.0 7.5 8.0 8.5 9.0 9.5GPT avgz [m]
0.2
0.4
0.6
0.8
1.0
1.2
stdy
[mm
]
Figure 26. Beam size (y) for GPT match, case 2 at 24.3 MeV.
All results are summarized in the table below:
Q1 Q2 Q3 Q4 Q5 Q6 Q7 QT MADX -3.72 4.04 -3.22 3.24 -1.86 3.18 -3.9 -4.33 Case 1 -4.13 4.37 -3.06 2.63 -0.72 4.45 -2.75 -4.33 Case 2 -4.05 4.31 -3.22 2.82 -0.73 4.5 -2.95 -4.33
Table 2. GPT results at 24.3 MeV
16

Finally, these calculations were also performed at beam energy of 32.0 MeV. The original MADX model of the matching section and the tomography line gave the β functions shown in Figure 17 below.
Figure 37. Original MADX match at 32 MeV.
The quadrupole values found using MADX were then substituted into the program GPT so as to re-do the match including space charge. The results for the mesh algorithm of GPT are shown in Figures 18 and 19 below
17

0.5 1.0 1.5 2.0 2.5 3.0 3.5 4.0 4.5 5.0 5.5 6.0 6.5 7.0 7.5 8.0 8.5 9.0 9.5GPT avgz [m]
0.1
0.2
0.3
0.4
0.5
0.6
0.7
0.8
0.9st
dx [m
m]
Figure 48. Beam size (x) for GPT match, case1 at 32 MeV.
0.5 1.0 1.5 2.0 2.5 3.0 3.5 4.0 4.5 5.0 5.5 6.0 6.5 7.0 7.5 8.0 8.5 9.0 9.5GPT avgz [m]
0.1
0.2
0.3
0.4
0.5
0.6
0.7
stdy
[mm
]
Figure 59. Beam size (y) for GPT match, case1 at 32 MeV.
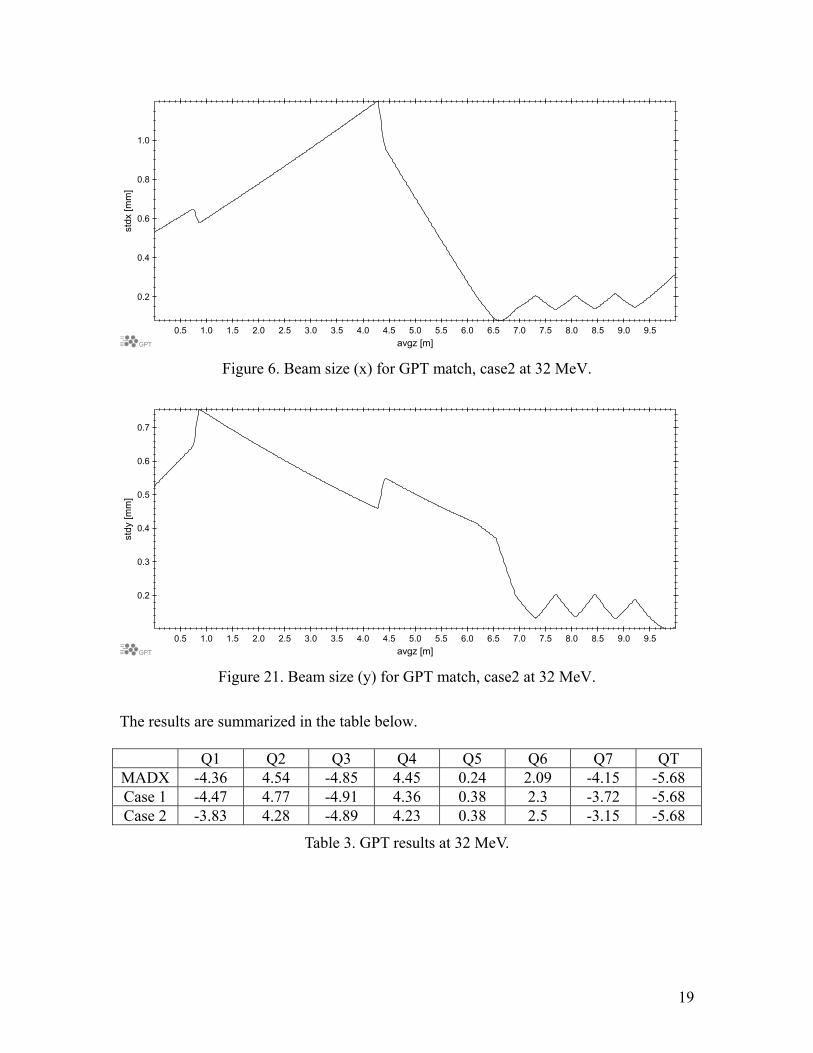
The results found using the fully 3-dimensional model included in GPT based on a complete calculation of the relativistic particle-particle interactions for every macro-particle are shown below in figures 20 and 21.
18
0.5 1.0 1.5 2.0 2.5 3.0 3.5 4.0 4.5 5.0 5.5 6.0 6.5 7.0 7.5 8.0 8.5 9.0 9.5GPT avgz [m]
0.2
0.4
0.6
0.8
1.0st
dx [m
m]
Figure 6. Beam size (x) for GPT match, case2 at 32 MeV.
0.5 1.0 1.5 2.0 2.5 3.0 3.5 4.0 4.5 5.0 5.5 6.0 6.5 7.0 7.5 8.0 8.5 9.0 9.5GPT avgz [m]
0.2
0.3
0.4
0.5
0.6
0.7
stdy
[mm
]
Figure 21. Beam size (y) for GPT match, case2 at 32 MeV.
The results are summarized in the table below.
Q1 Q2 Q3 Q4 Q5 Q6 Q7 QT MADX -4.36 4.54 -4.85 4.45 0.24 2.09 -4.15 -5.68 Case 1 -4.47 4.77 -4.91 4.36 0.38 2.3 -3.72 -5.68 Case 2 -3.83 4.28 -4.89 4.23 0.38 2.5 -3.15 -5.68
Table 3. GPT results at 32 MeV.
19
These calculations demonstrate that it is possible to successfully remove the mismatch induced by space charge as the electron beam passes through the matching section, prior to its entry into the tomography diagnostic. This is achieved by modifying the quadrupole strength in the matching section. This has been demonstrated at three example energies and 1 nC bunch charge. Furthermore, this result can only be achieved by using the simulation code GPT; if an analytical approach is used to calculate the required change in quadrupole strength, the results are not only incorrect in magnitude, but in some cases the direction of change is calculated incorrectly.
As can be readily seen, the mismatch due to space charge can be taken away completely by a change in quadrupole strength. Further, it can be seen that the average of the absolute strength of the quadrupoles does not necessarily need to increase due to space charge. This can be explained by the fact that the defocusing effect of space charge is inversely proportional to beam size so a larger beam gives a reduction in defocusing. This also appears to indicate that a more elegant, analytical way to find the correct increase in quadrupole strength is impossible and a program like GPT should be used every time one is faced with a space charge-induced mismatch.
Emittance measurements with quadrupole scan technique
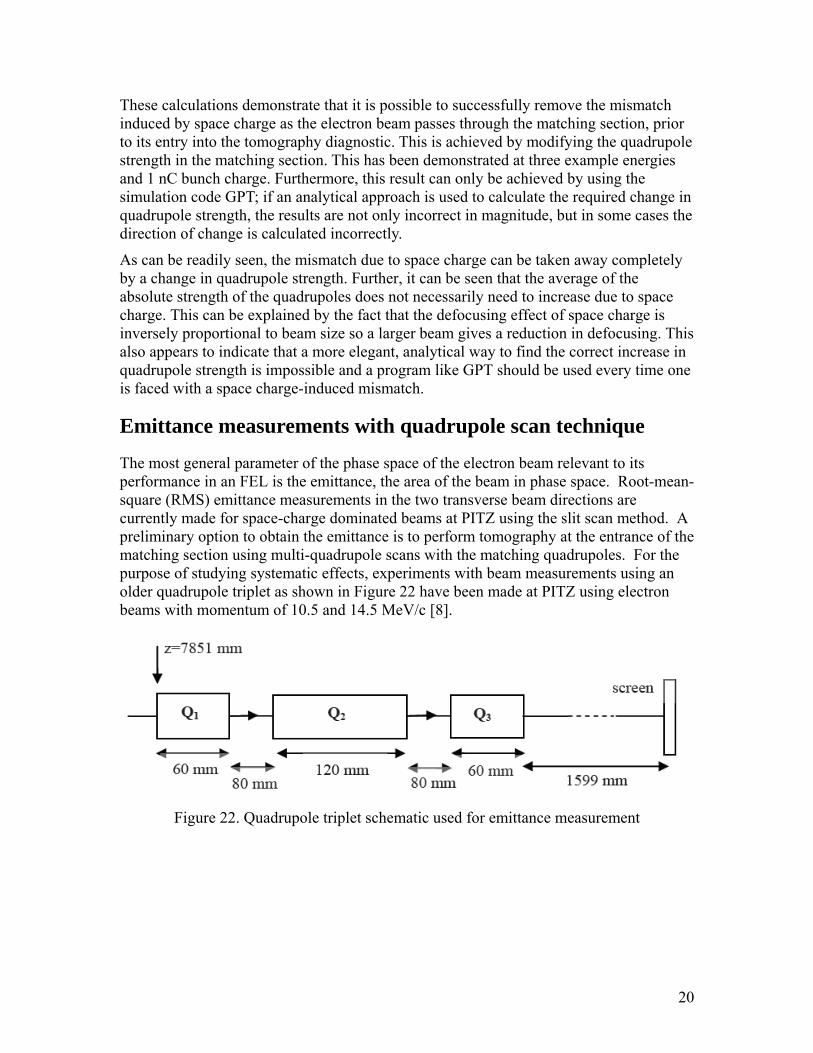
The most general parameter of the phase space of the electron beam relevant to its performance in an FEL is the emittance, the area of the beam in phase space. Root-mean-square (RMS) emittance measurements in the two transverse beam directions are currently made for space-charge dominated beams at PITZ using the slit scan method. A preliminary option to obtain the emittance is to perform tomography at the entrance of the matching section using multi-quadrupole scans with the matching quadrupoles. For the purpose of studying systematic effects, experiments with beam measurements using an older quadrupole triplet as shown in Figure 22 have been made at PITZ using electron beams with momentum of 10.5 and 14.5 MeV/c [8].
Figure 22. Quadrupole triplet schematic used for emittance measurement
20

At quadrupole entrance (z=7.9 m) At EMSY (z=11.6 m) E (MeV)
Charge (nC)
εx εx εy ε (mm mrad)
εy
(mm mrad) ε (mm mrad)
Imain X pos. jitter (mm)
Y pos. jitter (mm)
(A) (mm
mrad) (mm
mrad)
(mm
mrad)
10.46 0.005 190 0.75±0.05 1.7±0.14 1.13±0.13 0.72 0.20 0.50 0.47 0.49 10.49 1.003 352 2.14±0.05 1.29±0.5 1.66±0.34 0.66 0.59 0.83 1.06 0.94 10.47 1.009 352 2.63±0.08 3.86±0.1 3.19±0.23 0.84 1.52 1.25 1.26 1.26 13.03 0.193 340 3.35±0.05 2.60±0.02 2.95±0.03 1.98 0.41 0.92 1.05 0.98 14.47 1.009 352 3.17±0.08 4.92±0.09 3.95±0.09 1.28 1.28 1.25 1.26 1.26 14.47 1.009 352 2.55±0.07 3.41±0.05 2.95±0.06 1.50 0.58 1.25 1.26 1.26 14.47 1.009 370 4.96±0.45 2.18±0.08 3.29±0.21 0.13 0.49 1.25 1.26 1.26 14.47 1.009 352 1.86±1.08 2.23±0.23 2.04±0.69 0.99 0.78 1.25 1.26 1.26
Table 4. Results from triplet quad emittance scans from summer 2007 for 10.5 and 14.5 MeV/c (from [8]). Only best measured emittance points for the Emittance Measuring System (EMSY) station are presented in this table to show emittance growth between EMSY and quadrupoles.
Preliminary emittance measurements using the triplet quadrupole scan were done in the summer 2007. Some points correspond to the setup parameters that were optimized for the slit-scan based emittance measurement at the Emittance Measurement System (EMSY) station that was 3.7 meters closer to the booster than quadrupole triplet. These results (in Table 4) show the emittance growth in the drift space between EMSY station and quadrupole entrance. However, it was not possible in these preliminary scans to measure the beam size at the entrance to the quadrupoles. Therefore, the main solenoid current could not be optimized for emittance compensation at the quadrupole entrance. For this reason, all quadrupole scan measurements are higher than the measurements from the slit-scan emittance stations, and the table should not be taken to mean that there is some disagreement between the measurements. The slit-scan results are provided to show the emittance minimum for the given configuration and demonstrate that these preliminary quadrupole measurements are producing reasonable results.
Phase-space reconstruction with the tomography module
Algorithms for reconstructing the detailed structure of the transverse phase space using the projections measured with the tomography module have been developed and are being improved [4]. These algorithms make no assumptions about the electron phase-space distribution beforehand. The objects of interest in the case of beam dynamics are two-dimensional functions ( )xx ′,ρ or ( )yy ′,ρ representing the beam density at position . The observed data are inizz = ( )yxf , distributions taken on N different screens, obtained by rotating the phase space ellipse with the help of quadrupole magnets in
predefined angular steps of phase angle( 1−N ) Nπθ = .
From each distribution a pair of projections, one for each axis, is taken according to
21

( ) ( )∫ == NidyyxfxGi ,,1 , ,, Kθθθθθ
or
( ) ( )∫ == NidxyxfyGi ,,1 , ,, Kθθθθθ
Each projection at position is mapped to a reference obszz = ( )yx, frame at the position of the reconstruction using transverse phase space transformations between the screens given by
⎟⎟⎠
⎞⎜⎜⎝
⎛=⎟⎟
⎠
⎞⎜⎜⎝
⎛yx
Myx
θθ
θ
where is the transformation matrix between the first and each following observation position. In transverse phase space the spatial maps onto the divergence (and onto ).
θM
θy x′ θxy ′
Minerbo‘s Maximum Entropy (MENT) algorithm [9] comprises minimum artifacts and is well suited in cases of noisy or incomplete data. It states that of all possible distribution functions which satisfy the above equation, the solution is the most probable one in terms of the entropy given by
( yxf , )
( ) ( ) ( )[ ]∫ ∫−= dydxyxfyxfxH ,ln,
By maximizing this entropy, from all possible solutions one selects the one that can be reproduced most often and is consistent with the information available from measurements. A detailed description of maximizing the entropy is given in [10].
In the tomography section designed for PITZ the number of possible transformations of the phase space is three and correspondingly the number of projections is only four. Therefore, reconstruction algorithms which comprise minimum artifacts due to limited number of projections have to be employed. Currently the MENT algorithm is favored for the reconstruction.
Transverse phase space distributions along the designed tomography module in both and ( planes at the position of the first screen, z = 13.038 m, have been
generated with the ASTRA code using 100000 macroparticles. Influence from the space charge was taken into account while tracking the particles through the matching section. The corresponding ( distributions were used as an input for further investigations using the code presented in [11] which implements the MENT algorithm.
( xx ′, ) )
)
yy ′,
yx,
22

Figure 23. ASTRA-simulated phase space for the electron beam emitted by the photoinjector (on left) and reconstructions using the MENT-based algorithm operating on projections of the ASTRA data (on right) for the two transverse phase space planes.
23

Samples of the output from the reconstruction algorithm are shown in Figure 23. Each figure shows on the left side the phase space from an ASTRA simulation of the photoinjector (space-charge included) and on the right side the MENT-based reconstruction of the phase space based on projections of the ASTRA data. The phase space in both the plane and the xx ′− yy ′− plane are shown. The calculated emittances from the reconstructed phase space underestimate the ASTRA emittance by 4.8% in the x plane and 2.6% in the y plane.
Tomography reconstruction with two quadrupoles
The advantage of the four-screen method phase space tomography is the possibility to study both transverse planes simultaneously. As mentioned above, this requires a good matching of the beam envelope to the machine optics and is hard to achieve for low energies. In fact, if the reconstruction is to be done at a position where the beam emittance is measured using slit technique, the action of space charge along the intervening drift length to the entrance to the matching section prevents comparison of the slit scan result to the tomographic reconstruction. An option to overcome that is to use tomography reconstruction based on a setup of two quadrupoles and an observation screen.
A set of ASTRA simulations has proven this to be feasible for one of the planes at a time for beam momenta of 15 MeV/c and normalized emittance of 1.5 mm mrad. The phase advance steps used here are equidistant over the full range π, chosen from the ones on Figure 24 (number of projections vs. phase advance). As this figure shows, linear transport calculations give only a rough idea of the necessary number of rotations. As seen from Figure 25, a good agreement between the simulated and reconstructed distributions is achieved with 9 and 15 rotations of the beam in the phase space.
020406080
100120140160180
0 5 10 15 20 25 30 35 40 45 50 55# measurements, a.u.
φ_x, ASTRA
φ_x, lineartransport
φ_x
, deg
Figure 24. Phase advance at each measurement interval in 2-quadrupole scans using linear transport (orange dots) and from ASTRA (green dots).
24
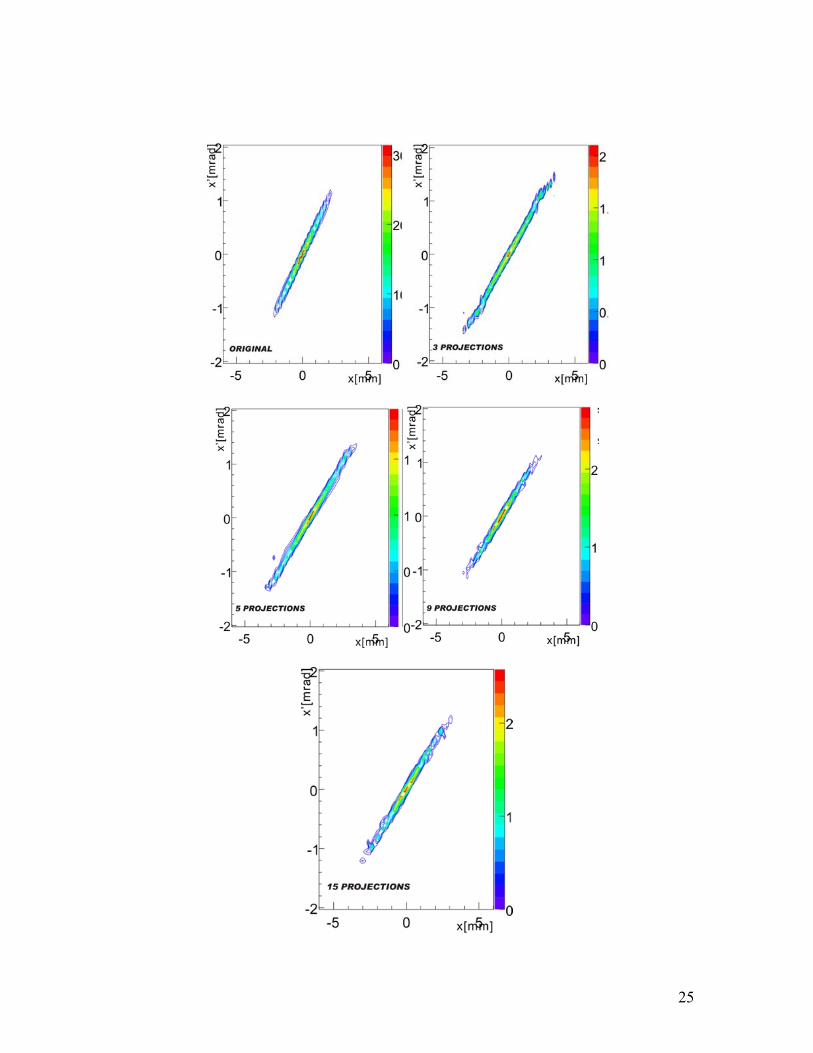
25
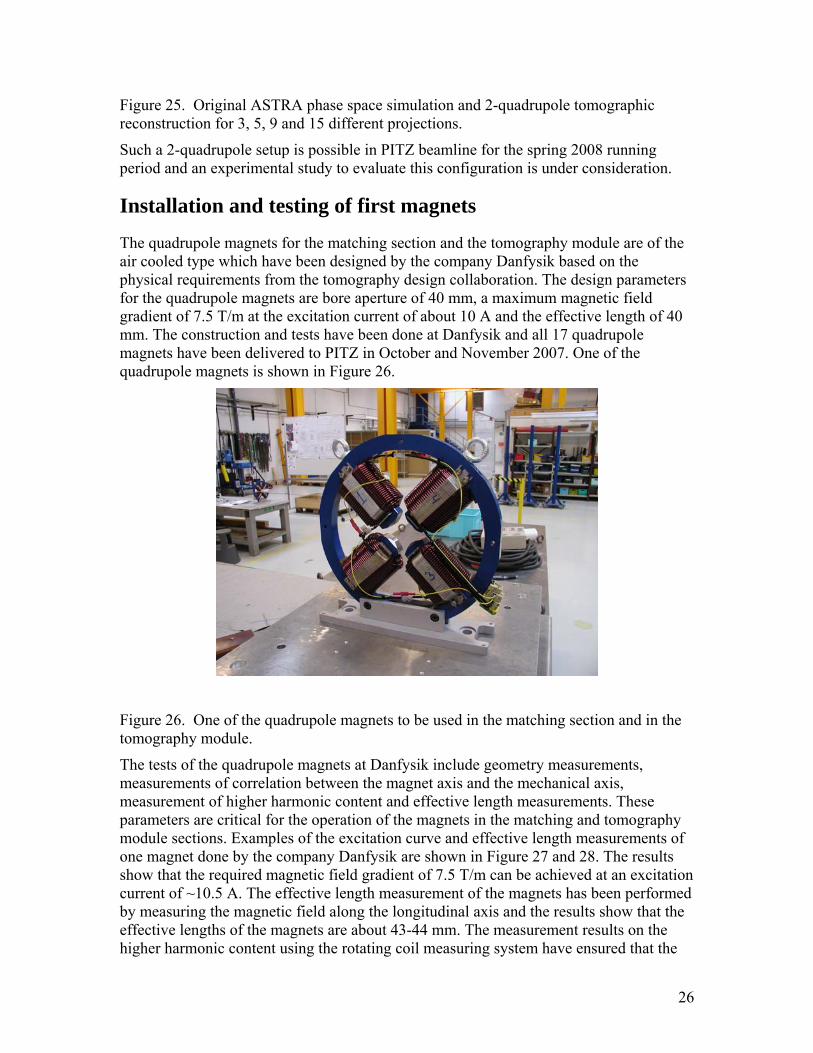
Figure 25. Original ASTRA phase space simulation and 2-quadrupole tomographic reconstruction for 3, 5, 9 and 15 different projections.
Such a 2-quadrupole setup is possible in PITZ beamline for the spring 2008 running period and an experimental study to evaluate this configuration is under consideration.
Installation and testing of first magnets
The quadrupole magnets for the matching section and the tomography module are of the air cooled type which have been designed by the company Danfysik based on the physical requirements from the tomography design collaboration. The design parameters for the quadrupole magnets are bore aperture of 40 mm, a maximum magnetic field gradient of 7.5 T/m at the excitation current of about 10 A and the effective length of 40 mm. The construction and tests have been done at Danfysik and all 17 quadrupole magnets have been delivered to PITZ in October and November 2007. One of the quadrupole magnets is shown in Figure 26.
Figure 26. One of the quadrupole magnets to be used in the matching section and in the tomography module.
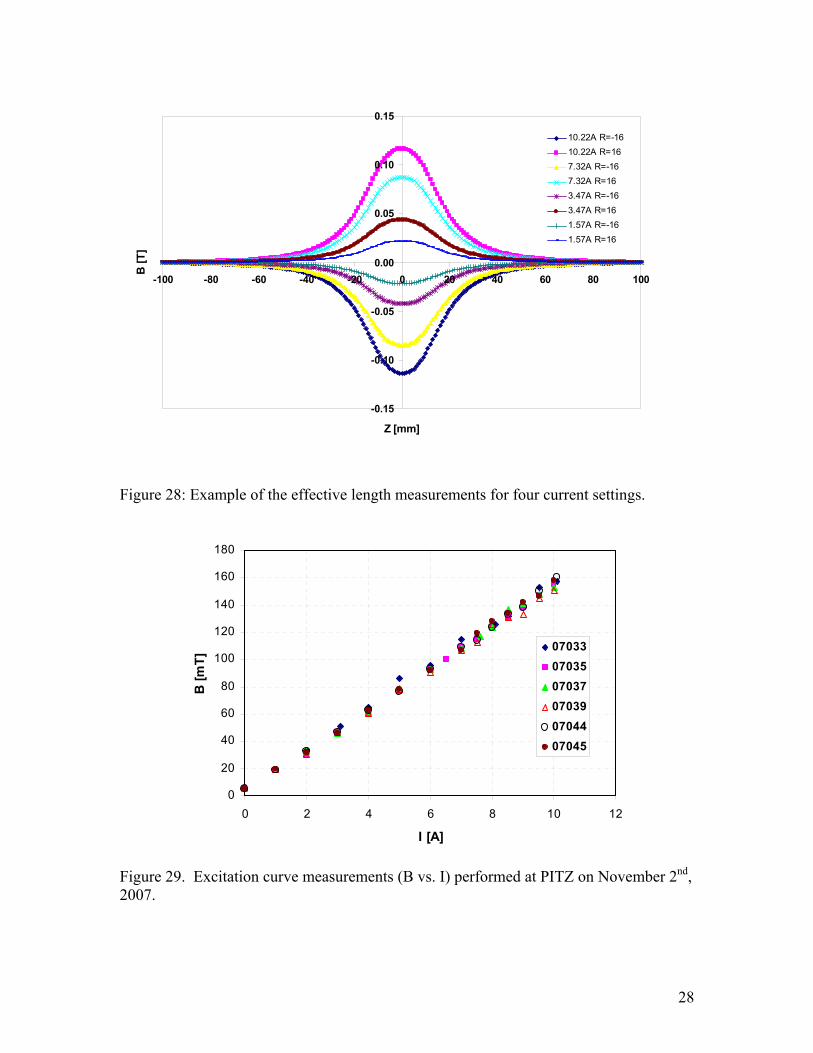
The tests of the quadrupole magnets at Danfysik include geometry measurements, measurements of correlation between the magnet axis and the mechanical axis, measurement of higher harmonic content and effective length measurements. These parameters are critical for the operation of the magnets in the matching and tomography module sections. Examples of the excitation curve and effective length measurements of one magnet done by the company Danfysik are shown in Figure 27 and 28. The results show that the required magnetic field gradient of 7.5 T/m can be achieved at an excitation current of ~10.5 A. The effective length measurement of the magnets has been performed by measuring the magnetic field along the longitudinal axis and the results show that the effective lengths of the magnets are about 43-44 mm. The measurement results on the higher harmonic content using the rotating coil measuring system have ensured that the
26

error in quadrupole field measured on the total integrated harmonic contents of the field (dB/G0x) from n=3 to n=10 was less than 2% at 80% of the aperture radius according to the requirement from the design.
After the first set of six quadrupole magnets was delivered at PITZ on October 2007, acceptance tests were performed. The results (in Figure 29) show the linearity of the magnetic field versus the excitation current up to 10 A, as required. The differences in the measurement results from Danfysik and from PITZ are due to the different location of the measuring point. At Danfysik the measurements have been performed at 80% of the aperture radius (16mm), but at PITZ the measurement points were at the pole tip of the magnet, where the field is higher.
0.00
0.04
0.08
0.12
0.16
0 2 4 6 8 10 12 14Excitation current [A]
B [T
]
measurements
Linear (measurements)
Figure 27: Example of excitation curve measurements (B vs. I) performed at Danfysik.
27
-0.15
-0.10
-0.05
0.00
0.05
0.10
0.15
-100 -80 -60 -40 -20 0 20 40 60 80 100
Z [mm]
B [T
]10.22A R=-1610.22A R=167.32A R=-167.32A R=163.47A R=-163.47A R=161.57A R=-161.57A R=16
Figure 28: Example of the effective length measurements for four current settings.
0
20
40
60
80
100
120
140
160
180
0 2 4 6 8 10
I [A]
B [m
T]
12
070330703507037070390704407045
Figure 29. Excitation curve measurements (B vs. I) performed at PITZ on November 2nd, 2007.
28
Three pairs of these quadrupole magnets are under installation in the PITZ beam line. The last pair is a part of the matching section. The installation of the magnets at PITZ has been done based on the test results from the company Danfysik, particularly for the correction of the magnet axis and mechanical axis. The first tests with beam will be performed in spring 2008.
Conclusions
The installation of the tomography module at PITZ has been delayed significantly due to several issues, including significant extra design work to handle space-charge effects at lower beam energies. However, the quadrupole magnets which make up the tomography module and matching section have been delivered to PITZ, and six have been tested and are now under installation in the PITZ beamline. Preliminary emittance measurements of the electron beam using existing quadrupoles have been performed, and significant simulation efforts have been carried out on beam matching and phase space reconstruction.
Extensive calculations of beam matching for the tomography module have been performed. Several setups have been examined using ASTRA simulations, and the benefits of an adjustable drift length between two of the quadrupoles has been shown. Simulations of the tomography module based on the GPT code have also been done, for beam energies of 15.5, 24.3 and 32 MeV. The results of the ASTRA-based matching and the GPT results are not the same. The collaboration between the users of these different codes will continue in order to resolve the discrepancies in the results and to come to a full understanding of this important issue.
The technical design of the full tomography module will be finalized by the engineers at PITZ in spring 2008. The full tomography module will then be installed at PITZ during a shutdown in the summer/fall together with the new compact disk structure (CDS) booster. The tomography module has been specially designed for the beam energies that will be available from the new booster. With the higher energy beam, tomography measurements will start immediately due to the preparations which have been made both in simulations of beam matching and phase-space reconstruction, as well as in the preliminary tests of quadrupole emittance scans.
References
[1] G. Asova, et al., in Proceedings of the DIPAC 2007, Venice, Mestre, Italy (2007).
[2] M. Altarelli, et al. (eds.), ”The Technical Design Report of the European XFEL”, Chapter 4: XFEL accelerator. DESY 2006-097, p. 80, (2006).
[3] S. Korepanov, et al., in Proceedings of the DIPAC 2007, Venice, Mestre, Italy (2007).
[4] G. Asova et al., in Proceedings of ICAP 2006, Chamonix, France (2006).
[5] D.J. Holder et al., in Proceedings of EPAC 2006, Edinburgh, UK (2006).
[6] PBO Lab 2.0, Gillespie Associates, Inc., 2001.
[7] GPT (General Particle Tracer) Code. www.pulsar.nl/gpt/
29

[8] S. Skelton, “Multi-quadrupole scan for emittance determination at PITZ,” DESY Summer Student report (2007).
[9] G. Minerbo, Comp. Graphics Image Proc. 10 (1970) 48.
[10] C.T. Mottershead, IEEE Trans. Nucl. Sci. Vol. NS-32 (1985) 1970.
[11] J.J. Scheins, “Tomographic Reconstruction of Tranverse and Longitudinal Phase Space Distribution using Maximum Entropy Algorithm”, TESLA Report 2004-08.
30
Related Documents


![EUROFEL-Report-2007-DS2-084 a EUROPEAN FEL Design Study€¦ · in the low-frequency (inductive) regime [5] which is not the case for FERMI. A 3D numerical code would allow one to](https://static.cupdf.com/doc/110x72/5ea2b0282597f130501930c5/eurofel-report-2007-ds2-084-a-european-fel-design-in-the-low-frequency-inductive.jpg)


