1 EURO DISNEY S.C.A. Announcement of Full Year Results for Fiscal Year 2016 Revenues for Fiscal Year 2016 were €1,278 million, a decrease of 7% compared to the prior year. The decrease was due to lower volumes, primarily resulting from the adverse tourism environment in Paris Costs and expenses increased 5% to €1,520 million, driven by the Group's continued improvements to the guest experience, planned labor rate inflation and incremental security costs Net loss at €858 million for the year includes an impairment charge for the Group's assets of €565 million. The impairment charge had no impact on the Group's cash position or cash flows In November 2016, The Walt Disney Company agreed to waive two years of royalty and management fees to provide the Group additional liquidity (Marne-la-Vallée, November 10, 2016) Euro Disney S.C.A. (the "Company"), parent company of Euro Disney Associés S.C.A., operator of Disneyland ® Paris, today reported results of the consolidated group (the "Group") for the fiscal year ended September 30, 2016. 123 Key Financial Highlights 2 Fiscal Year (€ in millions, unaudited) 2016 2015 2014 Revenues 1,278 1,373 1,280 Costs and expenses (1,520 ) (1,454 ) (1,346 ) Other income - 24 - Operating margin (242 ) (57 ) (66 ) Plus: depreciation and amortization 208 198 179 EBITDA (34 ) 141 113 EBITDA as a percentage of revenues (3 )% 10 % 9 % Impairment charge (565 ) - - Net loss (858 ) (102 ) (114 ) Cash (used in) / generated by operating activities (68 ) 69 78 Cash used in investing activities (193 ) (134 ) (145 ) Free cash flow (261 ) (65 ) (67 ) Cash generated by financing activities 125 265 38 Cash and cash equivalents, end of period 113 249 49 Key Operating Statistics Fiscal Year 2016 2015 2014 Theme parks attendance (in millions) 13 .4 14 .8 14 .2 Average spending per guest (in €) 54 54 51 Hotel occupancy rate 77 % 79 % 75 % Average spending per room (in €) 235 238 231 1 The Group's consolidated financial accounts for Fiscal Year 2016 were reviewed by the Gérant on November 9, 2016. 2 Refer to Exhibit 8 for definitions.

Welcome message from author
This document is posted to help you gain knowledge. Please leave a comment to let me know what you think about it! Share it to your friends and learn new things together.
Transcript
1
EURO DISNEY S.C.A.
Announcement of Full Year Results for Fiscal Year 2016
Revenues for Fiscal Year 2016 were €1,278 million, a decrease of 7% compared to the prior year. The
decrease was due to lower volumes, primarily resulting from the adverse tourism environment in Paris
Costs and expenses increased 5% to €1,520 million, driven by the Group's continued improvements to
the guest experience, planned labor rate inflation and incremental security costs
Net loss at €858 million for the year includes an impairment charge for the Group's assets of
€565 million. The impairment charge had no impact on the Group's cash position or cash flows
In November 2016, The Walt Disney Company agreed to waive two years of royalty and management
fees to provide the Group additional liquidity
(Marne-la-Vallée, November 10, 2016) Euro Disney S.C.A. (the "Company"), parent company of Euro Disney
Associés S.C.A., operator of Disneyland® Paris, today reported results of the consolidated group (the "Group") for
the fiscal year ended September 30, 2016.123
Key Financial Highlights 2
Fiscal Year
(€ in millions, unaudited) 2016 2015 2014
Revenues 1,278 1,373 1,280
Costs and expenses (1,520 ) (1,454 ) (1,346 )
Other income - 24 -
Operating margin (242 ) (57 ) (66 )
Plus: depreciation and amortization 208 198 179
EBITDA (34 ) 141 113
EBITDA as a percentage of revenues (3 )% 10 % 9 %
Impairment charge (565 ) - -
Net loss (858 ) (102 ) (114 )
Cash (used in) / generated by operating activities (68 ) 69 78
Cash used in investing activities (193 ) (134 ) (145 )
Free cash flow (261 ) (65 ) (67 )
Cash generated by financing activities 125 265 38
Cash and cash equivalents, end of period 113 249 49
Key Operating Statistics Fiscal Year
2016 2015 2014
Theme parks attendance (in millions) 13 .4 14 .8 14 .2
Average spending per guest (in €) 54 54 51
Hotel occupancy rate 77 % 79 % 75 %
Average spending per room (in €) 235 238 231
1 The Group's consolidated financial accounts for Fiscal Year 2016 were reviewed by the Gérant on November 9, 2016. 2 Refer to Exhibit 8 for definitions.
2
Commenting on the results, Catherine Powell, Présidente of Euro Disney S.A.S., said:
"Disneyland Paris had an exceptionally challenging year. We have been impacted by various external factors that have significantly affected the tourism business in the Paris region.
In this adverse environment, revenue decreased 7%. This, together with the increase in costs driven by our future
growth strategy of continually improving the guest experience plus the costs of additional security measures,
resulted in a significant decrease in our operating performance for the fiscal year.
Despite this challenging environment, we are encouraged by the attendance of over 13 million guests that visited the parks this year and by the improved satisfaction ratings for our newly renovated hotels and attractions. Our
upcoming 25th
Anniversary will be an important milestone for the Group and together with our talented cast members, we are looking forward to sharing unique and magical new experiences with our guests."
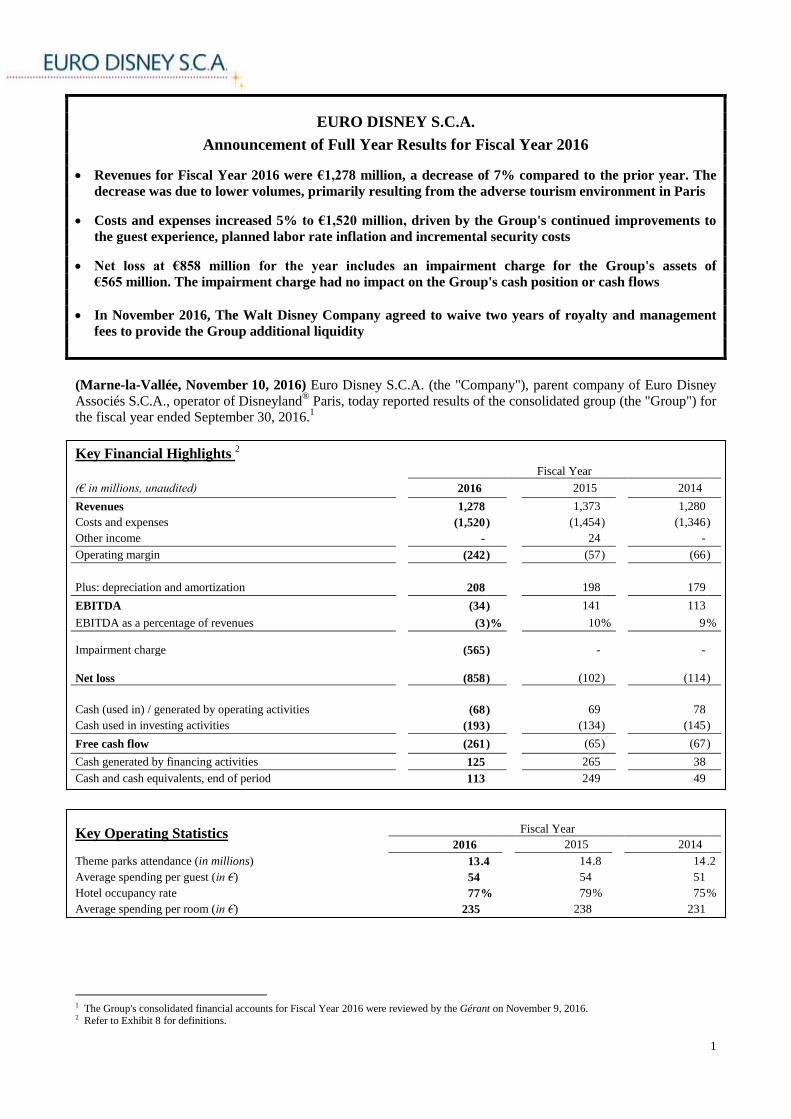
REVENUES BY OPERATING SEGMENT FOR THE FULL YEAR
Fiscal Year Variance
(€ in millions, unaudited) 2016 2015 Amount %
Theme parks 722 802 (80 ) (10 )%
Hotels and Disney Village® 505 526 (21 ) (4 )%
Other 40 38 2 5 %
Resort operating segment 1,267 1,366 (99 ) (7 )%
Real estate development operating segment 11 7 4 n /m
Total revenues 1,278 1,373 (95 ) (7 )%
n/m: not meaningful
Resort operating segment revenues decreased 7% to €1,267 million, compared to €1,366 million in the prior
year.
Theme parks revenues decreased 10% to €722 million due to a 10% decrease in attendance. The decrease in
attendance was due to fewer guests visiting from all the Group's key European markets.
Hotels and Disney Village® revenues decreased 4% to €505 million due to a 2 percentage point decrease in hotel
occupancy, a 1% decrease in average spending per room and a 2% decrease in Disney Village revenues. The
decrease in hotel occupancy resulted from fewer guests visiting from most key European markets, partially offset
by more guests visiting from France and Germany. The decrease in average spending per room was due to lower
daily room rates, partly offset by higher spending on food and beverage. The decrease in Disney Village revenues
was attributed to lower resort volumes.
Real estate development operating segment revenues increased by €4 million to €11 million due to higher land
sale activity. Given the nature of the Group's real estate development activity, the number and size of transactions
vary from one year to the next.
3
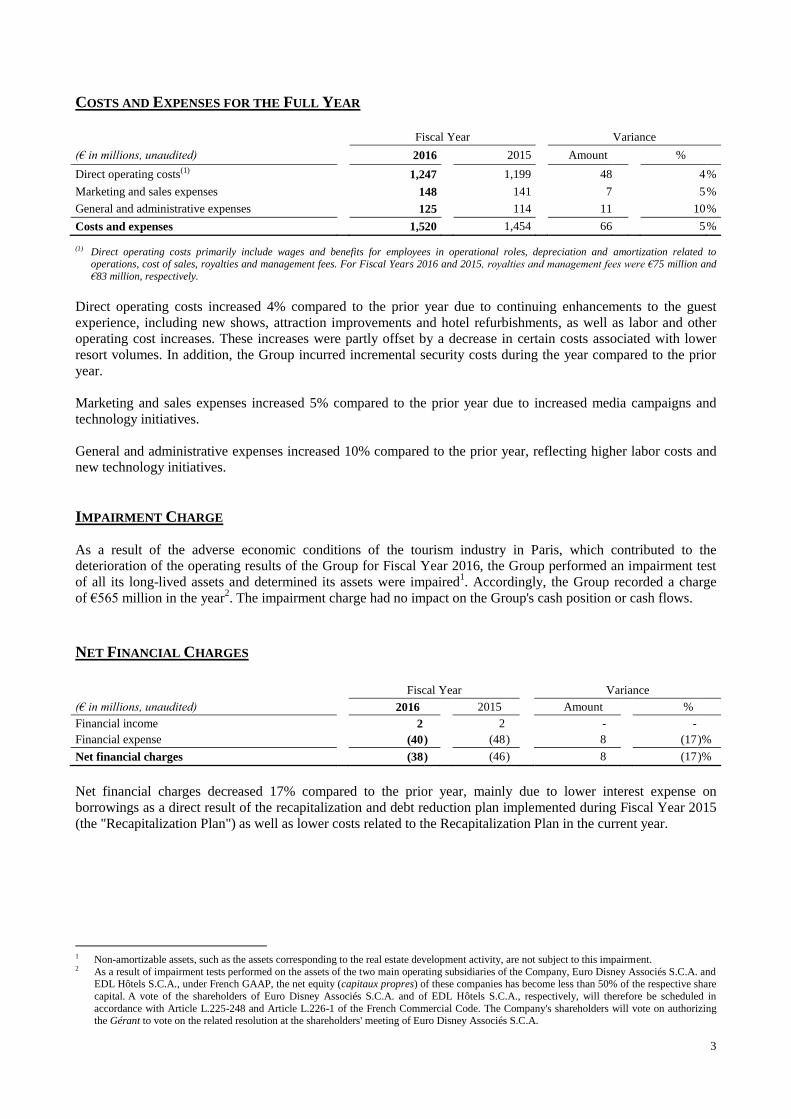
COSTS AND EXPENSES FOR THE FULL YEAR
Fiscal Year Variance
(€ in millions, unaudited) 2016 2015 Amount %
Direct operating costs(1) 1,247 1,199 48 4 %
Marketing and sales expenses 148 141 7 5 %
General and administrative expenses 125 114 11 10 %
Costs and expenses 1,520 1,454 66 5 % (1) Direct operating costs primarily include wages and benefits for employees in operational roles, depreciation and amortization related to
operations, cost of sales, royalties and management fees. For Fiscal Years 2016 and 2015, royalties and management fees were €75 million and
€83 million, respectively.
Direct operating costs increased 4% compared to the prior year due to continuing enhancements to the guest
experience, including new shows, attraction improvements and hotel refurbishments, as well as labor and other
operating cost increases. These increases were partly offset by a decrease in certain costs associated with lower
resort volumes. In addition, the Group incurred incremental security costs during the year compared to the prior
year.
Marketing and sales expenses increased 5% compared to the prior year due to increased media campaigns and
technology initiatives.
General and administrative expenses increased 10% compared to the prior year, reflecting higher labor costs and
new technology initiatives.
IMPAIRMENT CHARGE
As a result of the adverse economic conditions of the tourism industry in Paris, which contributed to the
deterioration of the operating results of the Group for Fiscal Year 2016, the Group performed an impairment test
of all its long-lived assets and determined its assets were impaired1. Accordingly, the Group recorded a charge
of €565 million in the year2. The impairment charge had no impact on the Group's cash position or cash flows.
NET FINANCIAL CHARGES
Fiscal Year
Variance
(€ in millions, unaudited)
2016
2015
Amount
%
Financial income
2
2
-
-
Financial expense
(40 )
(48 )
8
(17 )%
Net financial charges (38 ) (46 ) 8 (17 )%
Net financial charges decreased 17% compared to the prior year, mainly due to lower interest expense on
borrowings as a direct result of the recapitalization and debt reduction plan implemented during Fiscal Year 2015
(the "Recapitalization Plan") as well as lower costs related to the Recapitalization Plan in the current year.
1
Non-amortizable assets, such as the assets corresponding to the real estate development activity, are not subject to this impairment. 2
As a result of impairment tests performed on the assets of the two main operating subsidiaries of the Company, Euro Disney Associés S.C.A. and EDL Hôtels S.C.A., under French GAAP, the net equity (capitaux propres) of these companies has become less than 50% of the respective share
capital. A vote of the shareholders of Euro Disney Associés S.C.A. and of EDL Hôtels S.C.A., respectively, will therefore be scheduled in
accordance with Article L.225-248 and Article L.226-1 of the French Commercial Code. The Company's shareholders will vote on authorizing the Gérant to vote on the related resolution at the shareholders' meeting of Euro Disney Associés S.C.A.

4
NET LOSS
For Fiscal Year 2016, the net loss of the Group increased to €858 million from €102 million in the prior year. Net
loss attributable to owners of the parent and non-controlling interests amounted to €705 million and €153 million,
respectively. Excluding the impairment charge of €565 million in the current year and the €24 million gain for the
early termination of a lease agreement in the prior year, the net loss increased €167 million.
CASH FLOWS
Cash and cash equivalents as of September 30, 2016 were €113 million, down €136 million compared to the prior
year.
Fiscal Year
(€ in millions, unaudited) 2016 2015 Variance
Cash (used in) / generated by operating activities (68 ) 69 (137 )
Cash used in investing activities (193 ) (134 ) (59 )
Cash generated by financing activities 125 265 (140 )
Change in cash and cash equivalents (136 ) 200 (336 )
Cash and cash equivalents, beginning of period 249 49 200
Cash and cash equivalents, end of period 113 249 (136 )
Cash used in operating activities for Fiscal Year 2016 totaled €68 million compared to cash generated of
€69 million in the prior year. This variance resulted from decreased operating performance during the year,
partially offset by a change in the timing of payment of royalties and management fees.
Cash used in investing activities for Fiscal Year 2016 totaled €193 million, compared to €134 million in the prior
year. The increase was due to continued investments in the guest experience including preparation for the
upcoming celebration of Disneyland® Paris' 25
th Anniversary as well as cash provided to the Les Villages Nature
de Val d'Europe S.A.S. joint venture.
Cash generated by financing activities for Fiscal Year 2016 totaled €125 million, compared to €265 million in the
prior year. During Fiscal Year 2016, the Group drew €130 million under the €350 million standby revolving credit
facility granted by The Walt Disney Company ("TWDC"). The prior year included the net cash inflow from the
Recapitalization Plan.
LIQUIDITY
In November 2016, TWDC agreed to waive two years of royalty and management fees, commencing with the
€21 million payment for the fourth quarter of Fiscal Year 2016, to provide the Group liquidity above its remaining
undrawn standby revolving credit facility.
5
UPDATE ON RECENT AND UPCOMING EVENTS New and Enhanced Attractions and Entertainment Offerings
During 2016, the Group continued its focus on the guest experience with the return of the Frozen sing-along show
at Disneyland® Park and the launch of a new production, Mickey and the Magician, at the Walt Disney Studios
®
Park.
From January to March 2017, Disneyland® Paris will celebrate the Season of the Force. As part of this seasonal
event, the Walt Disney Studios Park will present a nighttime spectacular which will transport guests into the heart
of the Star Wars Saga. This show will combine live entertainment, special effects and an epic sound and light
show projected on the park's most iconic building. Guests will also have opportunities to meet the characters from
the Star Wars universe as part of the celebration.
On March 26, 2017, Disneyland Paris will kick-off its 25th Anniversary celebration, which features a new
nighttime spectacular, a new daytime parade, and exclusive shows. Enhanced attractions include the launch of
Star Wars Hyperspace Mountain and Star Tours: The Adventures Continue.
Management of Villages Nature
The Group, in partnership with Pierre & Vacances-Center Parcs Group, is developing Villages Nature, an
innovative eco-tourism destination based on the concept of harmony between man and nature.
On October 14, 2016, the Group and Pierre & Vacances-Center Parcs Group reached agreement for Pierre &
Vacances-Center Parcs Group to manage the operations of Villages Nature. The governance of the partnership
remains unchanged. For more information, see the press release available on the Group's website
(http://corporate.disneylandparis.com).
6
Press Contact Investor Relations
Lorraine Lenoir Yoann Nguyen
Tel: +331 64 74 59 50 Tel: +331 64 74 58 55
Fax: +331 64 74 59 69 Fax: +331 64 74 56 36
e-mail: [email protected] e-mail: [email protected]
Corporate Communication Brunswick
François Banon Hugues Boëton
Tel: +331 64 74 59 50 Tel: +33 1 53 96 83 74
Fax: +331 64 74 59 69 e-mail: [email protected]
e-mail: [email protected]
Fiscal Year 2016 results and additional financial information can be found on the Company's website
(http://corporate.disneylandparis.com)
Code ISIN: FR0010540740
Code Reuters: EDLP.PA
Code Bloomberg: EDL:FP
The Group operates Disneyland® Paris which includes: the Disneyland® Park, the Walt Disney Studios® Park, seven themed hotels
with approximately 5,800 rooms (excluding approximately 2,700 additional third-party rooms located on the site), two convention
centers, the Disney Village®, a dining, shopping and entertainment center, and golf courses. The Group's operating activities also
include the development of the 2,230-hectare site, approximately 50% of which is yet to be developed. Euro Disney S.C.A.'s shares
are listed and traded on Euronext Paris.
Attachments: Exhibit 1 – Consolidated Statement of Income Exhibit 2 – Consolidated Segment Statements of Income
Exhibit 3 – Consolidated Statement of Financial Position
Exhibit 4 – Consolidated Statement of Cash Flows Exhibit 5 – Consolidated Statement of Changes in Equity
Exhibit 6 – Statement of Changes in Borrowings
Exhibit 7 – Consolidated Semestrial Statements of Income Exhibit 8 – Definitions
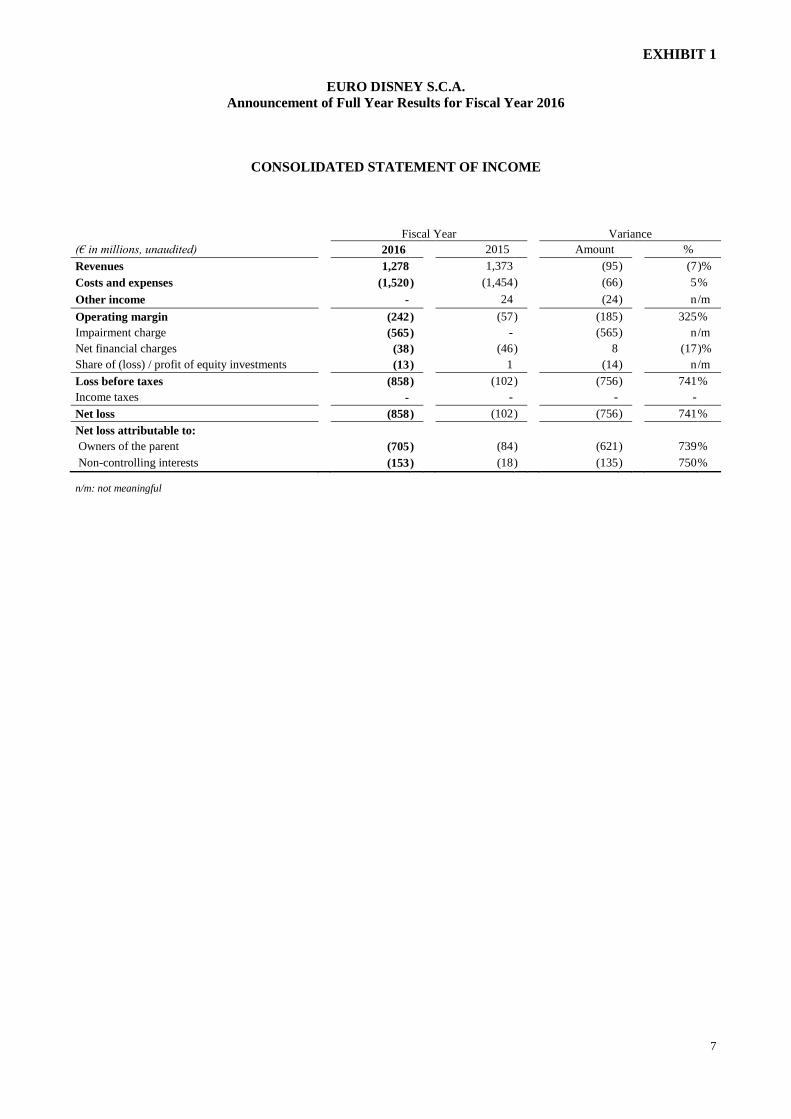
EXHIBIT 1
7
EURO DISNEY S.C.A.
Announcement of Full Year Results for Fiscal Year 2016
CONSOLIDATED STATEMENT OF INCOME
Fiscal Year Variance
(€ in millions, unaudited) 2016 2015 Amount %
Revenues 1,278 1,373 (95 ) (7 )%
Costs and expenses (1,520 ) (1,454 ) (66 ) 5 %
Other income - 24 (24 ) n /m
Operating margin (242 ) (57 ) (185 ) 325 %
Impairment charge (565 ) - (565 ) n /m
Net financial charges (38 ) (46 ) 8 (17 )%
Share of (loss) / profit of equity investments (13 ) 1 (14 ) n /m
Loss before taxes (858 ) (102 ) (756 ) 741 %
Income taxes - - - -
Net loss (858 ) (102 ) (756 ) 741 %
Net loss attributable to:
Owners of the parent (705 ) (84 ) (621 ) 739 %
Non-controlling interests (153 ) (18 ) (135 ) 750 %
n/m: not meaningful

EXHIBIT 2
8
EURO DISNEY S.C.A.
Announcement of Full Year Results for Fiscal Year 2016
CONSOLIDATED SEGMENT STATEMENTS OF INCOME
RESORT OPERATING SEGMENT
Fiscal Year Variance
(€ in millions, unaudited) 2016 2015 Amount %
Revenues 1,267 1,366 (99 ) (7 )%
Costs and expenses (1,510 ) (1,446 ) (64 ) 4 %
Operating margin (243 ) (80 ) (163 ) 204 %
Impairment charge (565 ) - (565 ) n /m
Net financial charges (38 ) (46 ) 8 (17 )%
Share of loss of equity investments (2 ) - (2 ) n /m
Loss before taxes (848 ) (126 ) (722 ) 573 %
Income taxes - - - -
Net loss (848 ) (126 ) (722 ) 573 %
n/m: not meaningful
REAL ESTATE DEVELOPMENT OPERATING SEGMENT
Fiscal Year Variance
(€ in millions, unaudited) 2016 2015 Amount %
Revenues 11 7 4 n /m
Costs and expenses (10 ) (8 ) (2 ) n /m
Other income - 24 (24 ) n /m
Operating margin 1 23 (22 ) n /m
Share of (loss) / profit of equity investments (11 ) 1 (12 ) n /m
(Loss) / profit before taxes (10 ) 24 (34 ) n /m
Income taxes - - - -
Net (loss) / profit (10 ) 24 (34 ) n /m
n/m: not meaningful
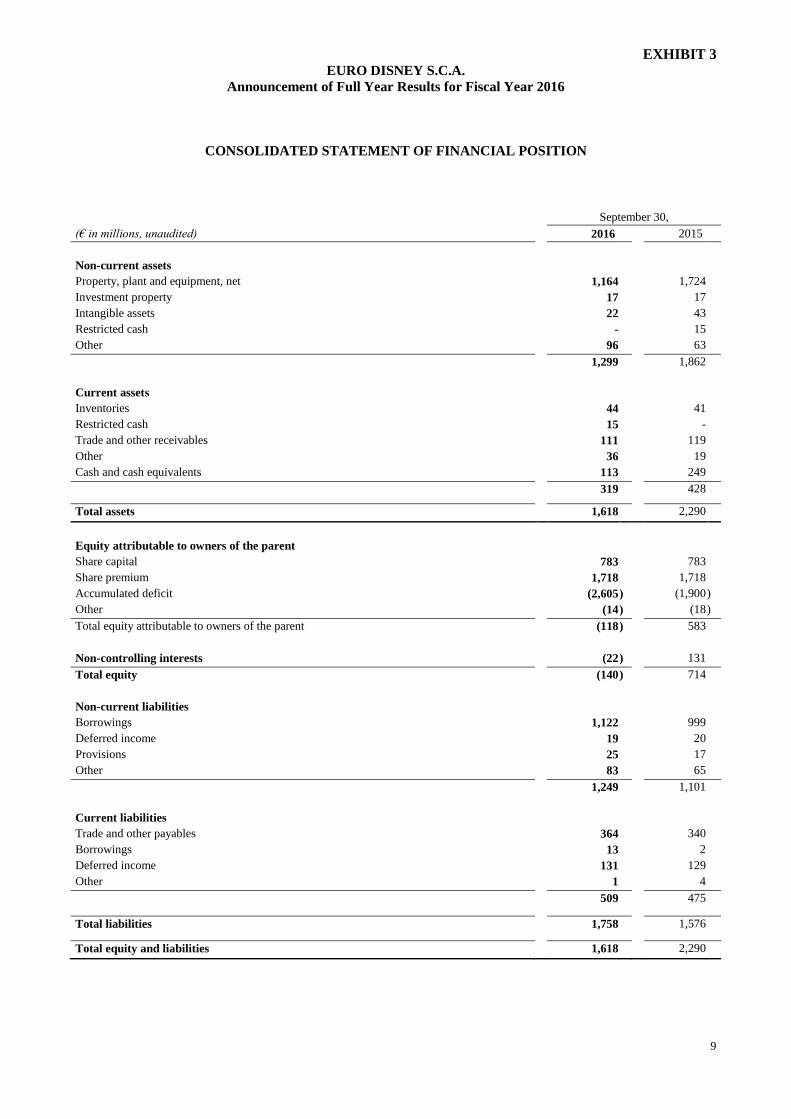
EXHIBIT 3
9
EURO DISNEY S.C.A.
Announcement of Full Year Results for Fiscal Year 2016
CONSOLIDATED STATEMENT OF FINANCIAL POSITION
September 30,
(€ in millions, unaudited) 2016 2015
Non-current assets
Property, plant and equipment, net 1,164 1,724
Investment property 17 17
Intangible assets 22 43
Restricted cash - 15
Other 96 63
1,299 1,862
Current assets
Inventories 44 41
Restricted cash 15 -
Trade and other receivables 111 119
Other 36 19
Cash and cash equivalents 113 249
319 428
Total assets 1,618 2,290
Equity attributable to owners of the parent
Share capital 783 783
Share premium 1,718 1,718
Accumulated deficit (2,605 ) (1,900 )
Other (14 ) (18 )
Total equity attributable to owners of the parent (118 ) 583
Non-controlling interests (22 ) 131
Total equity (140 ) 714
Non-current liabilities
Borrowings 1,122 999
Deferred income 19 20
Provisions 25 17
Other 83 65
1,249 1,101
Current liabilities
Trade and other payables 364 340
Borrowings 13 2
Deferred income 131 129
Other 1 4
509 475
Total liabilities 1,758 1,576
Total equity and liabilities 1,618 2,290
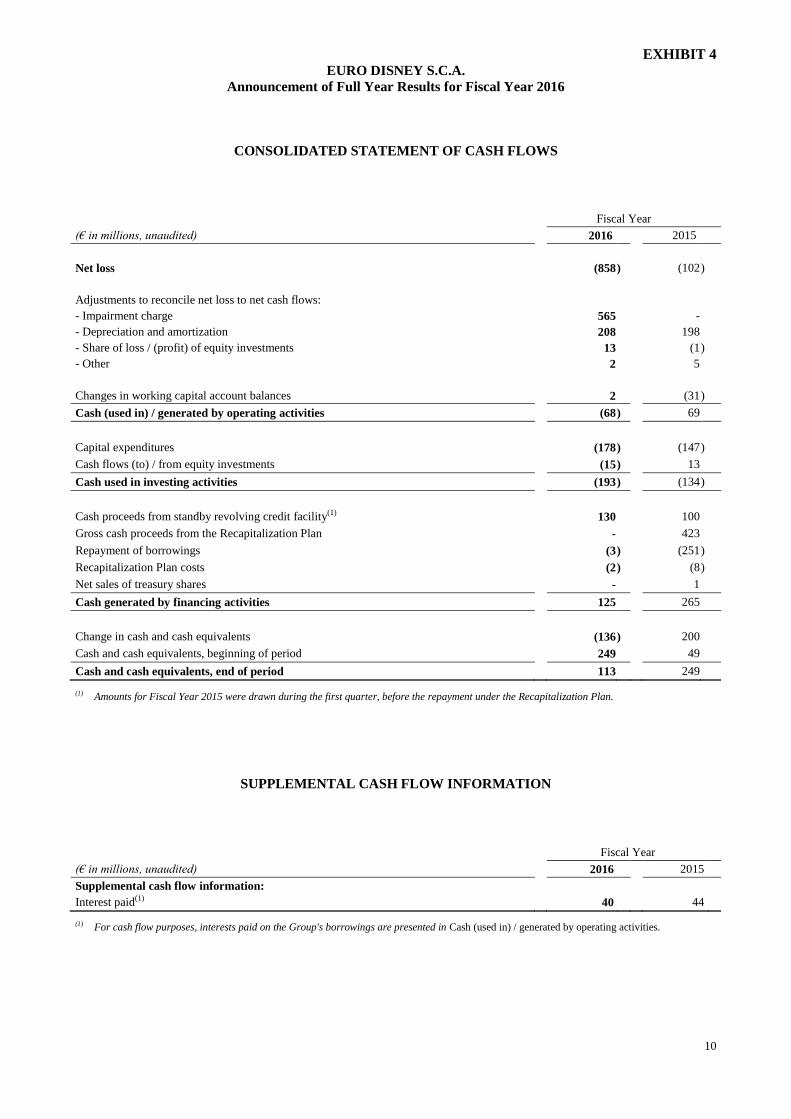
EXHIBIT 4
10
EURO DISNEY S.C.A.
Announcement of Full Year Results for Fiscal Year 2016
CONSOLIDATED STATEMENT OF CASH FLOWS
Fiscal Year
(€ in millions, unaudited) 2016 2015
Net loss (858 ) (102 )
Adjustments to reconcile net loss to net cash flows:
- Impairment charge 565 -
- Depreciation and amortization 208 198
- Share of loss / (profit) of equity investments 13 (1 )
- Other 2 5
Changes in working capital account balances 2 (31 )
Cash (used in) / generated by operating activities (68 ) 69
Capital expenditures (178 ) (147 )
Cash flows (to) / from equity investments (15 ) 13
Cash used in investing activities (193 ) (134 )
Cash proceeds from standby revolving credit facility(1) 130 100
Gross cash proceeds from the Recapitalization Plan - 423
Repayment of borrowings (3 ) (251 )
Recapitalization Plan costs (2 ) (8 )
Net sales of treasury shares - 1
Cash generated by financing activities 125 265
Change in cash and cash equivalents (136 ) 200
Cash and cash equivalents, beginning of period 249 49
Cash and cash equivalents, end of period 113 249 (1) Amounts for Fiscal Year 2015 were drawn during the first quarter, before the repayment under the Recapitalization Plan.
SUPPLEMENTAL CASH FLOW INFORMATION
Fiscal Year
(€ in millions, unaudited) 2016 2015
Supplemental cash flow information:
Interest paid(1) 40 44 (1) For cash flow purposes, interests paid on the Group's borrowings are presented in Cash (used in) / generated by operating activities.

11
EXHIBIT 5
EURO DISNEY S.C.A.
Announcement of Full Year Results for Fiscal Year 2016
CONSOLIDATED STATEMENT OF CHANGES IN EQUITY
(€ in millions unaudited)
September 30,
2015
Net loss
Other
September 30,
2016
Equity attributable to owners of the parent
Share capital
783
-
- 783
Share premium
1,718
-
- 1,718
Accumulated deficit
(1,900 )
(705 )
- (2,605 )
Other
(18 )
-
4 (14 )
Total equity attributable to owners of the
parent
583 (705 ) 4 (118 )
Non-controlling interests 131 (153 ) - (22 )
Total equity 714 (858 ) 4 (140 )
EXHIBIT 6
STATEMENT OF CHANGES IN BORROWINGS
Fiscal Year 2016 (unaudited)
(€ in millions) September
30, 2015 Increase Repayments Transfers September
30, 2016
(unaudited)
Long-term loans 983 - -
-
983
Standby revolving credit facility of €350 million - 130
-
-
130
Loan from TWDC to Centre de Congrès Newport S.N.C. 12 -
-
(12 ) -
Sub-total TWDC debt 995 130
-
(12 ) 1,113
Financial leases 4 6
-
(1 ) 9
Total non-current borrowings 999 136
-
(13 ) 1,122
Loan from TWDC to Centre de Congrès Newport S.N.C. 2 - (2 ) 12
12
Financial leases - 1 (1 ) 1
1
Total current borrowings 2 1 (3 ) 13 13
Total borrowings 1,001 137 (3 ) - 1,135

12
EXHIBIT 7
EURO DISNEY S.C.A.
Announcement of Full Year Results for Fiscal Year 2016
CONSOLIDATED SEMESTRIAL STATEMENTS OF INCOME
FIRST HALF
First Half Variance
(€ in millions, unaudited) 2016 2015 Amount %
Revenues 604 592 12 2 %
Costs and expenses (764 ) (709 ) (55 ) 8 %
Other income - 24 (24 ) n /m
Operating margin (160 ) (93 ) (67 ) 72 %
Net financial charges (19 ) (26 ) 7 (27 )%
Share of loss of equity investments (5 ) - (5 ) n /m
Loss before taxes (184 ) (119 ) (65 ) 55 %
Income taxes - - - -
Net loss (184 ) (119 ) (65 ) 55 %
Operating margin (160 ) (93 ) (67 ) 72 %
Plus: depreciation and amortization 103 97 6 6 %
EBITDA (57 ) 4 (61 ) n /m
n/m: not meaningful
SECOND HALF
Second Half Variance
(€ in millions, unaudited) 2016 2015 Amount %
Revenues 674 781 (107 ) (14 )%
Costs and expenses (756 ) (745 ) (11 ) 1 %
Operating margin (82 ) 36 (118 ) n /m
Impairment charge (565 ) - (565 ) n /m
Net financial charges (19 ) (20 ) 1 (5 )%
Share of (loss) / profit of equity investments (8 ) 1 (9 ) n /m
(Loss) / income before taxes (674 ) 17 (691 ) n /m
Income taxes - - - -
Net (loss) / profit (674 ) 17 (691 ) n /m
Operating margin (82 ) 36 (118 ) n /m
Plus: depreciation and amortization 105 101 4 4 %
EBITDA 23 137 (114 ) (83 )%
n/m: not meaningful

13
EXHIBIT 8
EURO DISNEY S.C.A.
Announcement of Full Year Results for Fiscal Year 2016
DEFINITIONS
Fiscal Year corresponds to the Company's fiscal year beginning on October 1 of a given year and ends on
September 30 of the following year. For the purposes of this press release, the Fiscal Year for any given calendar
year is the Fiscal Year that ends in that calendar year (for example, Fiscal Year 2016 is the fiscal year that ends on
September 30, 2016).
EBITDA corresponds to earnings before interest, taxes, depreciation and amortization. EBITDA is not a measure
of financial performance defined under International Financial Reporting Standards ("IFRS"), and should not be
viewed as a substitute for operating margin, net profit / (loss) or operating cash flows in evaluating the Group's
financial results. However, management believes that EBITDA is a useful tool for evaluating the Group's
performance.
Free cash flow is cash generated by operating activities less cash used in investing activities. Free cash flow is not
a measure of financial performance defined under IFRS, and should not be viewed as a substitute for operating
margin, net profit / (loss) or operating cash flows in evaluating the Group's financial results. However,
management believes that Free cash flow is a useful tool for evaluating the Group's performance.
Theme parks attendance corresponds to the attendance recorded on a "first click" basis, meaning that a person
visiting both parks in a single day is counted as only one visitor.
Average spending per guest is the average daily admission price and spending on food, beverage, merchandise
and other services sold in the theme parks, excluding value added tax.
Hotel occupancy rate is the average daily rooms occupied as a percentage of total room inventory (total room
inventory is approximately 5,800 rooms).
Average spending per room is the average daily room price and spending on food, beverage, merchandise and
other services sold in hotels, excluding value added tax.
Related Documents