OCCASIONAL PAPER SERIES NO 126 / JULY 2011 by Katrin Forster, Melina Vasardani and Michele Ca’ Zorzi EURO AREA CROSS-BORDER FINANCIAL FLOWS AND THE GLOBAL FINANCIAL CRISIS

Welcome message from author
This document is posted to help you gain knowledge. Please leave a comment to let me know what you think about it! Share it to your friends and learn new things together.
Transcript

OCCAS IONAL PAPER SER I E SNO 126 / J ULY 2011
by Katrin Forster,Melina Vasardani and Michele Ca’ Zorzi
EURO AREA
CROSS-BORDER
FINANCIAL FLOWS
AND THE GLOBAL
FINANCIAL CRISIS

OCCAS IONAL PAPER SER IESNO 126 / JULY 2011
by Katrin Forster, Melina Vasardani
and Michele Ca’ Zorzi
EURO AREA CROSS-BORDER
FINANCIAL FLOWS AND
THE GLOBAL FINANCIAL CRISIS1
1 Comments and suggestions from Hans-Joachim Klöckers, Filippo di Mauro, Philipp Rother, Annalisa Ferrando, Roberto De Santis, Philip Hill
and Pavlos Petroulas, as well as an anonymous referee, are gratefully acknowledged. Ricardo Pereira provided excellent research assistance.
This paper can be downloaded without charge from http://www.ecb.europa.eu or from the Social Science
Research Network electronic library at http://ssrn.com/abstract_id=1791529.
NOTE: This Occasional Paper should not be reported as representing
the views of the European Central Bank (ECB).
The views expressed are those of the authors
and do not necessarily reflect those of the ECB.In 2011 all ECB
publicationsfeature a motif
taken fromthe €100 banknote.

© European Central Bank, 2011
AddressKaiserstrasse 29
60311 Frankfurt am Main, Germany
Postal addressPostfach 16 03 19
60066 Frankfurt am Main, Germany
Telephone+49 69 1344 0
Internethttp://www.ecb.europa.eu
Fax+49 69 1344 6000
All rights reserved.
Any reproduction, publication and reprint in the form of a different publication, whether printed or produced electronically, in whole or in part, is permitted only with the explicit written authorisation of the ECB or the authors.
Information on all of the papers published in the ECB Occasional Paper Series can be found on the ECB’s website, http://www.ecb.europa.eu/pub/scientific/ops/date/html/index.en.html. Unless otherwise indicated, hard copies can be obtained or subscribed to free of charge, stock permitting, by contacting [email protected]
ISSN 1607-1484 (print)
ISSN 1725-6534 (online)

3ECB
Occasional Paper No 126
July 2011
CONTENTS
ABSTRACT 4
NON-TECHNICAL SUMMARY 5
1 INTRODUCTION 7
2 THE INCREASING ROLE
OF CROSS-BORDER FINANCIAL FLOWS 8
2.1 Global fi nancial liberalisation
and innovation 8
2.2 Benefi ts and costs
of international fi nancial integration 10
3 THE FINANCIAL CRISIS AND EURO AREA
CROSS-BORDER FINANCIAL FLOWS 13
3.1 Main trends prior to the crisis 13
3.2 The impact of the crisis 18
3.3 The aftermath of the crisis
and recent developments 27
3.4 International investment position 31
3.5 Summary and future prospects 33
4 POLICY IMPLICATIONS
AND CONCLUSIONS 35
ANNEX 38
REFERENCES 39
CONTENTS

4ECB
Occasional Paper No 126
July 2011
ABSTRACT
This paper analyses the impact of the global
fi nancial crisis on euro area cross-border
fi nancial fl ows by comparing recent
developments with the main pre-crisis trends.
Two prominent features of the period of turmoil
were (i) the sizeable deleveraging of external
fi nancial exposures by the private sector and,
in particular, the banking sector from 2008 and
(ii) the signifi cant changes in the composition
of euro area cross-border portfolio fl ows, as
investors shifted from equity to debt instruments,
from long-term to short-term debt instruments
and from private to public sector securities.
Since 2009 such trends have started reversing.
However, as balance sheet restructuring
by fi nancial and non-fi nancial corporations
continues, cross-border fi nancial fl ows have
remained well below pre-crisis levels. The
degree of resumption and volatility of cross-
border fi nancial activity may have a major
bearing on growth prospects for the euro area
and may also matter from a fi nancial stability
perspective. We argue that the recent experience,
fi rst of extraordinary growth and then of scaling
down of international fi nancial activity, calls for
enhanced monitoring of developments in cross-
border fi nancial fl ows so that the underlying
risks to the domestic economy stemming from
the fi nancial sector can be better assessed.
Looking forward, successful implementation
of policy actions to promote macroeconomic
discipline and enhance fi nancial regulation
and supervision could infl uence, inter alia, the
composition and volume of cross-border capital
fl ows, contributing to a more effi cient and
sustainable allocation of resources.
JEL code: E44 E58 F33 F42.
Keywords: global fi nancial crisis, euro area,
capital fl ows.

5ECB
Occasional Paper No 126
July 2011
NON-TECHNICAL
SUMMARYNON-TECHNICAL SUMMARY
The global fi nancial crisis that started in 2007
and intensifi ed after the collapse of Lehman
Brothers in September 2008 abruptly interrupted
the more than two-decade-long process of
increasing world fi nancial integration. With the
complex web of global interlinkages contributing
to the spreading of the turmoil from the
United States to the rest of the world, the crisis
led to unprecedented declines, or even reversals,
in global cross-border capital fl ows. Although
fi nancial markets have bounced back from their
lows, cross-border capital fl ows have generally
remained well below their pre-crisis levels.
The advanced economies, which have
traditionally dominated global capital fl ows and
were considered immune from sudden capital
withdrawals, were particularly affected. Prior to
the crisis, the euro area current account was close
to balance, with cross-border fi nancial fl ows
mostly cancelling out when all components are
summed. In net terms this indicated that the euro
area was neither receiving nor exporting large
capital fl ows, although signifi cant developments
were occurring in gross terms. The fi nancial
crisis, however, affected not only those
countries with large current account defi cits but
all countries with open capital accounts.
The aim of this paper is to highlight the
unprecedented adjustments triggered by the
fi nancial crisis in euro area cross-border fi nancial
fl ows. We fi nd that during the turmoil there was
a very sizeable scaling-down of gross external
asset holdings across all types of investors and
the whole range of instruments, amid soaring
risk aversion, high liquidity needs, and balance
sheet restructuring. Flows reversed and their
volatility markedly increased, with potentially
adverse effects for the real economy and fi nancial
stability. The strong increase in home bias and
fl ight-to-safety behaviour was also manifested
in shifts in the composition of cross-border
fi nancial fl ows, from equity to debt instruments,
from long-term to short-term debt instruments
and from private sector to public sector debt.
At the same time, deleveraging activity in relation
to cross-border loans and deposits reached
high levels. The fi nancial crisis also changed
the sectoral breakdown of the euro area’s net
external borrowing, with the government sector
becoming the main, and for most of 2010 the
only, net borrower from abroad. This was in
line with the rise in government borrowing
worldwide (and especially in the advanced
economies), which was partly driven by higher
fi nancing needs on the part of governments in
response to the crisis, but also by heightened
global risk aversion on the part of investors.
As the global economy started to show signs of
stabilisation in 2009 some of the trends in gross
cross-border fi nancial fl ows observed during the
crisis abated or even reversed, towards the end of
the year, particularly in the case of portfolio and
direct investment. As regards other investment,
deleveraging in relation to cross-border loans
and deposits continued apace in 2009, with
some signs of a normalisation, both on the asset
and on the liability sides, only emerging in the
fi rst half of 2010.
Looking ahead, it is still uncertain which trends
will prevail in the near future. Investors appear
to have become more selective in qualitative
terms, for example by increasingly differentiating
across countries in relation to government debt
securities. While the global economic outlook
and fi scal developments are expected to play a
key role, overall international fi nancial fl ows
could still be affected by the balance sheet
restructuring of fi nancial and non-fi nancial
corporations in advanced economies, including
the euro area. Following the surge in international
fi nancial activity prior to the crisis, the recovery
may not be synchronised across different world
regions, as shown by the stronger rebound of
cross-border fl ows to emerging markets.1
Rottier and Veron (2010, p.3) illustrate how the share of 1
emerging markets in the 100 largest banks has been steadily
increasing and has overtaken that of Europe. These banks have
engaged in a limited degree of cross-border activity, but this
could change. According to these authors, one can expect that
“the combination of deleveraging in the West and continued
fi nancial development in the emerging economies will certainly
reinforce the trend toward multipolarity”.

6ECB
Occasional Paper No 126
July 2011
The signifi cant changes in euro area cross-border
fi nancial fl ows brought about by the global
fi nancial crisis also have important policy
implications. The reversal and heightened
volatility of fi nancial fl ows may have adverse
impacts on short- and long-term growth
prospects and may also matter from a fi nancial
stability perspective. This calls for expanding
the analysis of cross-border fi nancial fl ows –
a challenging task, as is widely recognised.
Apart from providing a better understanding
of the fi nancial transmission channel during
fi nancial crises, the identifi cation of signifi cant
changes in cross-border fi nancial fl ows and
stocks could be an important element in the
early detection of the emergence and build-up
of macroeconomic risks and risks to fi nancial
stability. As this paper argues, along the lines
of a burgeoning literature, the monitoring
should be extended to developments in gross
fl ows and not just net fl ows, as the latter may
mask the accumulation of macroeconomic
imbalances and fi nancial risks.
This paper also underscores the need for
policy actions to promote macroeconomic
discipline and enhance fi nancial regulation
and supervision. The impact of the crisis on
cross-border fi nancial fl ows has shown that
sound and stable macroeconomic policies are
both important elements in keeping capital
fl ows on a sustainable path, while preserving the
gains from fi nancial openness and mitigating
the adverse consequences of turbulent times.
In addition, the patterns of cross-border fi nancial
fl ows seen during the fi nancial crisis call for
broadening the scope of fi nancial supervision
and regulation to also include other fi nancial
intermediaries apart from banks. Prudential
regulation is likely to infl uence the composition
and, to a smaller degree, the volume of
cross-border fi nancial fl ows, leading to the
building of additional buffers in the fi nancial
sector that could help reduce cross-country and
cross-sectoral fi nancial fragilities.

7ECB
Occasional Paper No 126
July 2011
I INTRODUCTION
1 INTRODUCTION
Economies around the world were severely hit
by the global fi nancial crisis, particularly after it
intensifi ed in September 2008. One consequence
of the crisis was that the two-decade continuous
rise in international fi nancial fl ows was not just
interrupted, but sizeable reversals and unwinding
of international exposures by the private sector
and more markedly by banks were observed.
As those fl ows have been traditionally dominated
by advanced economies, it is not surprising
that these were the countries and regions most
affected by the crisis.
There is a burgeoning literature on the
impact of the fi nancial crisis on cross-border
capital fl ows, reviewing the experience of the
United States (e.g. Bertaut and Pounder (2009))
or taking a global perspective (e.g. Forbes and
Warnock (2011), IMF (2010b), IMF (2011),
OECD (2011) and Milesi-Ferretti and
Tille (2011)). Other studies focus instead
on banking fl ows, as the banking sector has
signifi cantly reduced international fi nancial
claims (e.g. Cetorelli and Goldberg (2011) and
the Bank for International Settlements (2009a,
b, c and d)). This paper is however the fi rst to
review the impact of the global fi nancial crisis on
all cross-border fi nancial fl ows from a euro area
perspective. Contrasting the recent developments
with the main trends prior to the crisis and
covering the full set of available indicators,
relating to instruments as well as sectors,
it highlights the unprecedented adjustments
triggered by the fi nancial crisis. Like other recent
studies (Forbes and Warnock (2011), Broner
et al. (2010) and Milesi-Ferretti and Tille (2011)),
it shows that it is not enough to examine
cross-border fi nancial fl ows in net terms, but that
it is necessary to investigate “gross” measures
too, i.e. the asset and liability sides separately,
as this may provide additional insights on the
gradual build up of fi nancial vulnerabilities.
The paper is structured as follows. Chapter 2
presents some stylised facts illustrating the
rising importance of cross-border fi nancial fl ows
prior to the crisis and summarises the main
channels through which those fl ows can affect
individual economies. Chapter 3 reviews the
main pre-crisis trends in euro area cross-border
fi nancial fl ows, examines the signifi cant changes
brought about by the crisis and discusses recent
developments and future prospects. Finally,
Chapter 4 explores how cross-border fi nancial
fl ows can help policymakers in their assessments
and seeks to identify possible lessons.

8ECB
Occasional Paper No 126
July 2011
2 THE INCREASING ROLE OF CROSS-BORDER
FINANCIAL FLOWS
The global fi nancial crisis that started with
the meltdown of the United States sub-prime
mortgage market in 2007 was preceded by
more than two decades of increasing world
fi nancial integration. During that period,
advanced and emerging economies became
more accessible to a growing array of fi nancial
investors through the lifting of capital
restrictions, and more interlinked through
larger cross-border fi nancial holdings.
Offering new opportunities to diversify risk
internationally, those developments, together
with advances in fi nancial innovation, resulted
in higher availability of capital worldwide,
contributing to a better allocation of resources
while enabling a strong global economic
expansion to take place. Rising fi nancial
integration and the creation of innovative
fi nancial instruments were the underlying
factors that allowed private economic agents
to gradually increase their leverage, which, at
the aggregate level, also meant that markets
and countries were becoming more prone to
domestic and external shocks. Providing the
background for the analysis of the impact of
the fi nancial crisis on euro area cross-border
fi nancial fl ows, this chapter briefl y looks at the
main drivers underlying the rise in international
fi nancial fl ows prior to the crisis. In parallel,
it summarises the benefi ts and costs of fi nancial
integration by also providing an overview of
the main channels through which cross-border
fi nancial fl ows affect the domestic economy.
2.1 GLOBAL FINANCIAL LIBERALISATION
AND INNOVATION
The degree of global fi nancial market integration
has increased signifi cantly since the late 1980s.
Total cross-border fi nancial assets and liabilities
almost tripled from 125% of global GDP in 1990
to 360% in 2007, with the advanced economies 2
accounting for the largest part of this increase
(see Chart 1). The rapid expansion in
cross-border fi nancial activity was broad-based
across different types of investment (see Chart 2)
and was mainly fostered by the liberalisation of
national fi nancial markets, a process which was
initiated in the advanced economies but gradually
spread to the emerging world. The progressive
easing or abolishing of capital controls and other
fi nancial account restrictions, together with
an improving economic environment and
international investment prospects, encouraged
capital to fl ow around the global economy.
The liberalisation of global fi nancial markets
was also accompanied by a process of fi nancial
innovation and deepening, which gathered pace
in the years prior to the global fi nancial crisis.
The establishment of increasingly liquid markets
Country groups are according to the IMF World Economic Outlook 2
classifi cation. The group of advanced economies includes the euro
area, the United States, Japan, the United Kingdom, Canada,
Australia, Denmark, Iceland, Israel, New Zealand, Norway,
Sweden and Switzerland, as well as the newly industrialised Asian
countries Korea, Singapore, Taiwan and Hong Kong.
Chart 1 International financial integration
(sum of outstanding amounts of cross-border assets and liabilities as a percentage of GDP; unweighted averages)
500
450
400
350
300
250
200
150
100
50
0
500
450
400
350
300
250
200
150
100
50
01970 1975 1980 1985 1990 1995 2000 2005
advanced economies
emerging/developing economies
world
Sources: ECB staff calculations based on the updated and extended version of the External Wealth of Nations Mark II database developed by Lane and Milesi-Ferretti (2007). Last observation refers to 2007.

9ECB
Occasional Paper No 126
July 2011
2 THE INCREASING
ROLE OF CROSS-BORDER
FINANCIAL FLOWS
for new fi nancial instruments, such as securitised
debt and other derivative contracts – issued in
part by new fi nancial entities, such as special
purpose vehicles (SPVs) – largely accounted for
the massive surge in cross-border purchases of
fi nancial assets in the major advanced economies,
in particular over the period from 2005 to
mid-2007. Originally intended to improve the
distribution of risk across savers, such instruments
were extensively used by a number of fi nancial
institutions, including hedge funds and private
equity funds in search of higher returns. Chart 3
shows the rampant growth, fi rst in the United
States and somewhat later in the euro area, in
the issuance of asset-backed securities (ABSs)
and mortgage-backed securities (MBSs) over the
Chart 2 International financial integration by type of investment
(sum of outstanding amounts of cross-border assets and liabilities as a percentage of GDP)
FDI
equity
reserves
debt
Advanced economies Emerging economies
250
200
150
100
50
0
-50
-100
-150
-200
-250
250
200
150
100
50
0
-50
-100
-150
-200
-2501990 2007
250
200
150
100
50
0
-50
-100
-150
-200
-250
250
200
150
100
50
0
-50
-100
-150
-200
-2501990 2007
Sources: ECB staff calculations based on the updated and extended version of the External Wealth of Nations Mark II database developed by Lane and Milesi-Ferretti (2007). Last observation refers to 2007.
Chart 3 Total issuance of ABSs and MBSs
(USD millions)
United States Euro area
2.5
2.0
1.5
1.0
0.0
2.5
2.0
1.5
1.0
0.5 0.5
0.01999 2000 2001 2002 2004 20052003 2006 2007 2008
0.35
0.30
0.15
0.10
0.05
0.00
0.35
0.30
0.25
0.20
0.25
0.20
0.15
0.10
0.05
0.001999 2000 2001 2002 2004 20052003 2006 2007 2008
Sources: Poloni and Reynaud (2009).

10ECB
Occasional Paper No 126
July 2011
past ten years (Moutot and Vitale (2009)), while
Chart 4 illustrates the sudden, sharp increase
in global credit derivatives over the three years
preceding the crisis.
Overall, international fi nancial integration, as
measured by the sum of cross-border assets and
liabilities, increased from 188% in 1999 to 325%
of GDP in 2007 for the euro area, this being
comparable to the upward trend seen in the
United States, while the rise was even sharper
in the case of the United Kingdom. This is not
surprising, considering that the fi nancial sector
represents a high share of total value added in
the United Kingdom and is highly exposed to
cross-border activities, given its international
intermediation role (see Chart 5).
2.2 BENEFITS AND COSTS OF INTERNATIONAL
FINANCIAL INTEGRATION 3
The increase in global fi nancial integration due
to fi nancial liberalisation and innovation, as
documented by the rapid pre-crisis expansion
of cross-border fi nancial fl ows, highlights
the rising weight of international fi nancial
transactions relative to trade transactions. At
least in the short to medium term, this makes
cross-border fi nancial fl ows potentially as
important as trade fl ows in determining the
dynamics of exchange rates and interest rates
(Moutot and Vitale (2009)).
While the more recent debate has naturally
focused on the destabilising impact of the
global fi nancial integration process, both as
an underlying component and amplifi er of
the international transmission mechanism,
the fi nancial integration process has also clearly
been benefi cial. The case for greater fi nancial
integration and openness generally revolves
around three main considerations:
Benefi ts from international risk sharing(1) .
By allowing a country to borrow in “bad”
times and lend in “good” times, fi nancial
openness enhances consumption and income
risk-sharing, while reducing the volatility of
consumption growth. This “counter-cyclical
role” of world capital markets is particularly
important if shocks are temporary. Besides,
improved risk-sharing enhances in turn
the ability of countries to specialise in
This section mainly draws from Agénor (2003) and González-3
Páramo (2010).
Chart 4 Global credit derivatives market
(USD trillions)
0
10
20
30
40
50
60
70
0
10
20
30
40
50
60
70
2001 2002 2003 2004 2005 2006 2007 2008 2009
Source: ISDA.
Chart 5 Financial integration of selected advanced economies in the years prior to the crisis
(sum of outstanding amounts of cross-border assets and liabilities as a percentage of GDP)
1,600
1,400
1,200
1,000
800
600
400
200
0
1,600
1,400
1,200
1,000
800
600
400
200
01999 2001 2003 2005 2007 2009
euro area
United States
United Kingdom
Sources: ECB and Haver Analytics. Note: Last observation refers to 2010, except for the United States and United Kingdom (2009).

11ECB
Occasional Paper No 126
July 2011
2 THE INCREASING
ROLE OF CROSS-BORDER
FINANCIAL FLOWS their most productive sectors, leading to
increased economic effi ciency.4
(2) Positive impact on domestic investment and growth. The ability to draw on an
international pool of resources should
stimulate domestic investment and growth.
While this channel mostly applies to
emerging countries, whose investment
is no longer constrained by the restricted
pool of domestic savings, the fi nancial
integration process also amplifi es growth
opportunities in developed countries. In
addition to the benefi ts from improved risk-
sharing, cross-border banking enhances
the ability of countries to specialise in
their most productive sectors. This leads
to increased economic effi ciency, reduces
the risk of crisis due to the mis-pricing of
investment risk 5 and ultimately fosters an
optimally diversifi ed economy, which may
be expected to be less prone to recessions.6
Greater depth of the domestic fi nancial (3)
system. A common argument in favour
of fi nancial openness is that it increases
the depth and breadth of domestic
fi nancial markets and makes the fi nancial
intermediation process more effi cient by
lowering costs and “excessive” profi ts
associated with monopolistic or cartelised
markets. For example, it is argued that
foreign bank penetration may improve the
quality and availability of fi nancial services
and serve to foster the development of
the domestic banking supervisory and
legal framework. Furthermore, pre-crisis
research had suggested that the cross-border
diversifi cation of large banks improves the
soundness of the banking system by making
individual bank failures less likely.
However, the recent crisis has also shifted the
focus of attention back to costs and the
potentially destabilising impact of fi nancial
integration. While costs and risks had been
mostly discussed with regard to emerging
economies, they also appear to be relevant for
advanced economies and at the global level.7
(1) Costs from misallocation of resources.
Cross-border fl ows may be channelled
to the less productive sectors and fuel
domestic bubbles. For example, external
credit may be channelled to non-tradable
sectors, contributing to construction booms
or supporting consumption over productive
investment, in which case it is ultimately
detrimental to the economy’s potential
growth.
Costs from pro-cyclicality and volatility of (2)
cross-border fl ows. Pro-cyclical and highly
volatile short-term fi nancial fl ows, including
those owing to herding and contagion
effects, may heighten the risk of economic
and fi nancial disruption, for example via
a sudden halt in fl ows from foreign banks.
Furthermore, large fi nancial infl ows may
also have undesirable macroeconomic
effects through other channels, including
rapid monetary expansion (due to the
diffi culty and costs of pursuing sterilisation
policies), infl ationary pressures (resulting
from the effect of fi nancial infl ows on
domestic spending and asset prices) and price
competitiveness losses (through their impact
on the real exchange rate). While, under
a fl exible exchange rate, growing external
defi cits may eventually lead to a realignment
in relative prices and induce self-correcting
movements in trade fl ows, under a fi xed
exchange rate regime (or a monetary union
for that matter), the continuous gradual
losses in price competitiveness eventually
erode the confi dence of investors in the
long-term prospects of the economy.
The self-adjustment mechanism, which
should operate through the impact of current
account defi cits on monetary aggregates,
may be impaired or considerably delayed in
the presence of fi nancial infl ows.
Kalemli-Ozcan, Sorensen and Yosha (2003).4
Giannetti and Ongena (2009).5
Manganelli and Povov (2010).6
For an early perspective on the challenges for and resilience 7
of the global fi nancial system in the light of the globalisation
process, see Greenspan (1997).

12ECB
Occasional Paper No 126
July 2011
(3) Other potential costs. As discussed in
Moutot and Vitale (2009), large cross-
border fi nancial fl ows may have a sizeable
impact on the price of assets by affecting
both their supply and demand, as well as
the premia that investors require to hold
them (see in particular Bernanke (2007)).
This in turn can contribute to making the
link between money and prices unstable
in the short to medium term, so that the
direct interpretation of monetary aggregates
becomes more diffi cult.
Finally, a more controversial element in the
discussion is the extent to which fi nancial
fl ows may be a destabilising force per se, or
whether they merely represent a counterpart
of other macroeconomic imbalances. For any
given country with a current account defi cit,
for instance, keeping reserves constant would
mean that the country must cover its fi nancing
needs by tapping international capital markets.
Such an infl ow of capital may, however, protract
(or aggravate) the current account imbalance.
Similar questions could be posed at the global
level. To what extent have the rise in global
liquidity and in cross-border fl ows constituted
an opportunity to raise fi nance and contributed
to optimising intertemporal consumption?
Could cross-border fi nancial fl ows have also
destabilised the global economy and led to
excessive current account divergence? What is
the relationship between the increase in fi nancial
globalisation and global imbalances, considering
that the latter are persisting while international
cross-border activity and global liquidity appear
more subdued? 8
While these questions are beyond the scope of
this paper, one has to recognise how closely
these issues are interlinked.9 Similar arguments
can also be made with regard to banking
integration, where lack of transparency, wrong
incentives, sub-optimal regulation and fl awed
banking business models may have been the
main source of fi nancial instability.10
For a discussion on how global imbalances, following a temporary 8
correction that coincided with the fi nancial turmoil, may still pose
signifi cant risks to the global economy, see ECB (2010b).
It has been argued for instance that the pre-crisis boom in the 9
US real estate and securitisation markets refl ected to some extent
the high foreign demand for safe assets resulting from “excess
world savings” in the context of persistent global imbalances.
Strong foreign demand for fi nancial assets not only pushed down
the United States’ risk-free interest rate, but also compressed the
risk premia on risky assets. The low cost of fi nancing fostered in
turn an increase in the level of leverage of the domestic fi nancial
sector, which exacerbated systemic risk.
Altunbas et al. (2011) analyse measures of bank distress during 10
the recent turmoil for a large panel of institutions, showing there
is a correlation with their pre-crisis business models.

13ECB
Occasional Paper No 126
July 2011
3 THE FINANCIAL
CRISIS AND EURO
AREA CROSS-BORDER
FINANCIAL FLOWS
Box 1
CROSS-BORDER FINANCIAL INTEGRATION OF THE EURO AREA
The EMU process and the subsequent introduction of the euro in 1999 had a catalytic effect on cross-
border fi nancial activity in Europe. In this box, we review the strong pre-crisis increase in intra-euro
area fi nancial activity, go on to assess the geographical breakdown of euro area fi nancial assets and
conclude by examining the impact of the crisis on different segments of euro area fi nancial markets.
3 THE FINANCIAL CRISIS AND EURO AREA
CROSS-BORDER FINANCIAL FLOWS
This chapter describes the main trends of euro
area cross-border direct, portfolio and other
investment transactions prior to the crisis and
thereafter. A stock analysis complements the
fl ow analysis, while special issues, such as intra-
euro area fi nancial activity and the international
dimension of bank deleveraging, are discussed
in separate boxes.
3.1 MAIN TRENDS PRIOR TO THE CRISIS
Against the backdrop of increasing global
fi nancial liberalisation and innovation and in line
with similar developments in other advanced
economies, euro area cross-border fi nancial fl ows
strongly accelerated in the years prior to the
fi nancial crisis (see Chart 6). This was refl ected
both in increasing (net) purchases by euro area
residents of foreign assets (captured by the
asset side of the fi nancial account) and in rising
fi nancial investment by non-residents in the euro
area (captured by the liability side).11 However,
the high correlation between the fl ows recorded
on the asset side of the euro area fi nancial
account and those recorded on the liability side 12
had resulted in net fl ows being close to balance
for most of the period since the introduction of
the euro.
The introduction of the euro in 1999 has
certainly been another factor boosting euro area
cross-border fi nancial fl ows.13 Relevant here is
the increased international role of the euro and
the growing international role of euro area
banks. A remarkable feature is however, that in
spite of all the globalisation trends and the rise
of new opportunities in emerging markets, the
introduction of the euro has fostered even
stronger cross-border fi nancial integration in
Europe (Box 1).14
Following the balance of payments convention, outfl ows (e.g. 11
increases in euro area residents’ assets abroad) are depicted with
a negative sign, while infl ows are recorded with a positive sign.
For simplicity, we use the term “gross fl ows” when referring 12
to the fi nancial fl ows on either the asset or the liability sides of
the fi nancial account separately, and the term “net fl ows” when
referring to their balance.
De Santis (2010) argues that the monetary policy framework 13
of the euro area and the establishment of EMU help explain
the changes in portfolio asset allocation in the euro area over
the turbulent period 1999-2001. For a pre-crisis comparison
between the degree of fi nancial integration in Europe and Asia
see Eichengreen and Park (2003).
For more details, see ECB (2008).14
Chart 6 Euro area financial account
(EUR billions; annual fl ows)
2,500
2,000
1,500
1,000
500
0
-500
-1,000
-1,500
-2,000
-2,500
2,500
2,000
1,500
1,000
500
0
-500
-1,000
-1,500
-2,000
-2,5001999 2001 2003 2005 2007 2009
assets
liabilities
net
Source: ECB.Note: Infl ows (+); outfl ows (-).

14ECB
Occasional Paper No 126
July 2011
Intra-euro area fi nancial activity
After the launch of the euro, foreign direct investment within the euro area increased, as the
elimination of exchange rate risk and the reduction in transaction, fi xed and fi nancing costs
facilitated the reallocation of capital among euro area countries, particularly in the manufacturing
sector. The creation of common technological platforms, the potential benefi ts of greater
diversifi cation and an appetite for higher expected returns were further factors that help explain
the expansion of intra-euro area portfolio investment (see Chart A).
In terms of product composition, this phenomenon was broad-based as intra-euro area portfolio
holdings increased, both in terms of equity and debt instruments (corporate and government
bonds) (De Santis (2010), De Santis and Gerard (2009) and Baele et al. (2004)). Following the
introduction of the euro, residents of the euro area diversifi ed their sovereign bond holdings
across different euro area countries, thus contributing to the decline of yield spreads vis-à-vis
German government bonds to very low levels (see Chart B) until the intensifi cation of the
global fi nancial crisis in September 2008. The explanations generally put forward for this were:
(i) the anchoring of infl ationary expectations owing to the credible common monetary
policy; (ii) the elimination of exchange rate risk premia; (iii) positive confi dence effects of
EMU membership on creditworthiness; and (iv) the progress made in some countries in real
convergence (notwithstanding some concerns of rising risks of overheating).
Over this period, intra-euro area bank exposure also increased remarkably, with euro area credit
institutions increasingly allocating available savings to euro area countries, particularly those
that needed to fi nance large, either public or private, debts. Countries such as Greece, Ireland,
Chart A Intra-euro area portfolio holdings of debt and equity
(as a percentage of total holdings; EUR billions)
0
10
20
30
40
50
60
70
0
10
20
30
40
50
60
70
2001 2007 2008 2009
equity
debt
Sources: CPIS and ECB staff calculations.
Chart B Sovereign bond yield spreads of selected euro area countries
(in basis points; end-of-month data for the period 1990 to end-April 2011)
-2
0
2
4
6
8
10
12
14
-2
0
2
4
6
8
10
12
14
1990 1993 1996 1999 2002 2005 2008 2011
Italy
Spain
AAA corp
Greece
Ireland
Portugal
Sources: Datastream and ECB staff calculations.Notes: Bond yield spreads vis-à-vis the German 10-year government bond. “AAA corp” denotes euro area AAArated corporate bond yields (maturity 7-10 years).

15ECB
Occasional Paper No 126
July 2011
3 THE FINANCIAL
CRISIS AND EURO
AREA CROSS-BORDER
FINANCIAL FLOWS
Italy, Portugal, and Spain, indeed attracted sizeable amounts of additional funds in the years
prior to the crisis, mostly from German and French banks (see Chart C). This coincided with the
period when German and French banks took a very active role internationally by expanding their
cross-border operations as well as increasing lending through local subsidiaries and branches.
This expansion was, however, even stronger within the euro area, with the claims of German and
French banks on the aforementioned countries increasing from about 15% to about 20-25% of
their total foreign claims (see Chart D).
Prior to the crisis increased intra-euro area fi nancial activity led to a further disconnect between
domestic savings and investment (Blanchard and Giavazzi (2001)). Intra-euro area fi nancial
fl ows, coupled with fl ows from the rest of the world, made possible the fi nancing of large current
account defi cits in some member countries (European Commission (2009 and 2010)) for a
prolonged period of time. While expectations of convergence and low fi nancing costs contributed
to rising current account divergence in the euro area (Ca’ Zorzi and Rubaszek (2011)), structural
reforms were often inadequate to support growth over long-term horizons. However, following
the fi nancial crisis, the degree of segmentation of euro area bond markets increased, as pressures
on sovereign debt intensifi ed in some countries.
A range of indicators show that, in euro area countries with large current account defi cits, the
banking sector has acted as an intermediary, turning infl ows of capital into household and
corporate debt. In many cases, relatively short-term fi nancing, in the form of cross-border
deposits from the rest of the world (a more volatile source of fi nance than domestic deposits),
has accounted for the largest part of the increase in the net external liability positions of the
respective countries, while portfolio investment and, especially, foreign direct investment have
played a secondary role (European Commission (2009)).
Chart C Foreign claims of selected euro area countries vis-à-vis the group of countries comprising Greece, Ireland, Italy, Portugal and Spain
(USD billions)
0
100
200
300
400
500
600
700
800
900
1,000
0
100
200
300
400
500
600
700
800
900
1,000
2005 2006 2007 2008 2009 2010
Germany
France
Netherlands
Spain
Sources: BIS consolidated banking statistics and ECB staff calculations.
Chart D Foreign claims of selected euro area countries vis-à-vis the group of countries comprising Greece, Ireland, Italy, Portugal and Spain
(as a percentage of total foreign claims)
0
5
10
15
20
25
30
0
5
10
15
20
25
30
2005 2006 2007 2008 2009 2010
Germany
France
Netherlands
Spain
Sources: BIS consolidated banking statistics and ECB staff calculations.

16ECB
Occasional Paper No 126
July 2011
Geographical breakdown of euro area fi nancial assets
The increased fi nancial integration in the euro area was matched by the abundant fl ow of
capital from the euro area countries to Central Europe and South-Eastern Europe (CESEE).
These fl ows were particularly large and fi nanced sizeable current account defi cits that
persisted until the start of the global fi nancial turmoil, before reversing in some cases rather
suddenly and sharply (Ca’ Zorzi et al. (2011)). Development of the fi nancial sector and the
widespread ownership by euro area banks of the CESEE banks appear to have contributed
signifi cantly to boosting credit growth and supporting economic activity in several CESEE
countries before the crisis (Gardo and Martin (2010)). As the crisis unfolded, however, these
factors had stabilising effects, as parent banks had the incentive to preserve the viability of
their subsidiary banks. Moreover the European Bank Coordination Initiative, known as the
“Vienna initiative”, appears to have helped limit the degree of retrenchment of the euro area
banking sector, particularly from the subsidiaries and offi ces situated in the most vulnerable
countries, where IMF/EU programmes were already in place (Cetorelli and Golberg
(2011), Constâncio (2010), Ostry et al. (2010), Milesi-Ferretti and Tille (2011) and De Haas
et al. (2011)).
Although the fl ows to CESEE were important for the recipient economies and for the balance
sheets of individual euro area parent banks, for the euro area as a whole they represented a small
fraction of its international exposure, as illustrated by the geographical breakdown of euro area
fi nancial assets (see Chart E). Euro area fi nancial assets prior to the crisis were indeed mostly
held vis-à-vis other major advanced economies, primarily the United Kingdom and the United
States, as well as offshore fi nancial centres. This geographical distribution did not change with
the fi nancial crisis.
Impact of the crisis on different segments of euro area fi nancial markets
The crisis affected the various sectors of the
fi nancial markets in Europe to very different
degrees (ECB (2010a)). The most integrated
ones, such as the money markets, showed clear
signs of retrenchment within national borders.
The bond and retail banking markets, by
contrast, were less affected, but also witnessed
some strains. As the fi nancial crisis unfolded
and fi scal problems in some European countries
escalated, the process of euro area fi nancial
integration, in particular of sovereign bond
markets, witnessed a partial moderation in
2009 (Balli et al. (2010)). Sovereign bond yield
spreads (vis-à-vis the German bond) widened
across euro area countries, while foreign and
resident investors displayed fl ight-to-quality
behaviour, infl uenced by a reassessment of
borrower’s creditworthiness, partly reshuffl ing
Chart E Geographical breakdown of euro area financial assets by main instrument, as at the end of 2007
(outstanding amounts)
100
0
10
20
30
40
50
60
70
80
90
100
0
10
20
30
40
50
60
70
80
90
Direct
investment
Portfolio
investment
Other
investment
United Kingdom
Switzerland
offshore financial centres
EU-8
United States
other
Sources: ECB staff calculations. The EU-8 aggregate includes the Czech Republic, Hungary, Poland, Slovak Republic, Estonia, Latvia and Lithuania.

17ECB
Occasional Paper No 126
July 2011
3 THE FINANCIAL
CRISIS AND EURO
AREA CROSS-BORDER
FINANCIAL FLOWS
A broad overview of the fi nancial account since
1999 allows one to trace the main trends in the
euro area balance of payments (see Chart 7).
A persistent feature has been that the euro
area has received, repeatedly over the years,
net infl ows of portfolio investment that have
been counterbalanced by net outfl ows of direct
investment.
Direct investment was largely driven by equity
capital and, secondarily, by re-invested earnings
and other capital, the latter consisting mainly of
inter-company loans.15 Portfolio investment
generally refl ected infl ows in both equities and
bonds and notes, while money market
instruments (i.e. debt securities with an initial
maturity of less than one year) accounted for a
relatively minor share of total net portfolio
investment fl ows in most years (see Chart 8).
Financial derivatives 16 and offi cial reserves
typically played a minor role. Finally, other
investment, a residual component in the fi nancial
account mostly comprising loans, currency and
deposits 17, was more volatile, being large and
positive (i.e. net infl ows) in 1999 and 2000 and
sizeable and mostly negative (i.e. net outfl ows)
over the period from 2002 to 2007
(see Chart 9).
The “other capital” category of direct investment covers all 15
fi nancial transactions (borrowing and lending of funds) between
direct investors and their subsidiaries, branches and associates.
In the case of transactions between affi liated banks (monetary
fi nancial institutions (MFIs)), or special-purpose entities (SPEs)
whose sole purpose is to act as a fi nancial intermediary (e.g.
brokers), and other fi nancial intermediaries, direct investment
transactions are confi ned to those that are permanent in nature
(debt or equity).
Financial derivatives include options, futures, swaps, forward 16
foreign exchange contracts and credit derivatives.
Other investment includes all fi nancial transactions not covered 17
by direct investment, portfolio investment, fi nancial derivatives
or reserve assets. It can be sub-divided into (i) trade credits,
(ii) loans, currency and deposits and (iii) other assets/other
liabilities. Repo-type agreements that are treated as collateralised
loans in the balance of payments statistics are also included.
their portfolios to increase the weight of specifi c euro area government bonds (ECB (2010a)).1
Meanwhile, the fi nancial crisis revealed some potentially destabilising effects of strong
intra-euro area, and more broadly intra-European, bank linkages, since the latter acted as
transmission channels, amplifying and propagating the shock and turning it into a systemic
event. Finally, equity markets did not show any appreciable retreat from cross-border integration,
possibly owing to institutional features such as the fact that they are more transparent and more
liquid than debt markets.
All in all, the reversal of some volatile and short-term forms of fi nance made countries that had
heavily relied on these fl ows highly vulnerable to changing global fi nancial conditions and less
able to sustain their external asset positions.
1 For more details on the impact of the crisis on euro area debt market as a whole, see Section 4.
Chart 7 Components of the euro area financial account
(EUR billions; net annual fl ows)
-400
-300
-200
-100
0
100
200
300
400
500
600
-400
-300
-200
-100
0
100
200
300
400
500
600
1999 2001 2003 2005 2007 2009
reserves
derivatives
other investment
portfolio investment
direct investment
financial account
Source: ECB.Note: Infl ows (+); outfl ows (-).

18ECB
Occasional Paper No 126
July 2011
3.2 THE IMPACT OF THE CRISIS
Although the size, direction and composition of
net fl ows is what matters from a macroeconomic
perspective (for aggregate demand, monetary
aggregates and exchange rate developments),
netting out assets and liabilities may lead
to a loss of valuable information that might
otherwise help gauge investors’ motivations.
For example, while an increase in net infl ows in
equities may refl ect an increase of investment in
euro area equities by non-residents, it can also
refl ect the liquidation of equity positions abroad
and the repatriation of funds by residents.
Understanding these differences is important
to accurately interpret international investors’
incentives and capital movements, especially in
periods of turmoil.
It is worth noting that the crisis has affected euro
area asset and liability fl ows on a much larger
scale than net fl ows (see Chart 10), refl ecting
the process of reduction or, in many cases,
reversal of cross-border fi nancial investment by
resident and non-resident investors. A similar
conclusion may be drawn from developments in
the fi nancial accounts of other major advanced
economies, such as the United States and the
United Kingdom (see Chart 11).
Chart 9 Other investment by institution
(EUR billions, net annual fl ows)
300
200
100
0
-100
-200
-300
400
400
300
200
100
0
-100
-200
-300
-400
400
1999 2001 2003 2005 2007 2009
government
monetary authorities
net other investment
MFIs
other sectors
Source: ECB.
Chart 8 Portfolio investment by instrument
(EUR billions; net annual fl ows)
bonds and notes
MMIs
equity
net portfolio investment
400
300
200
100
0
-100
-200
-300
-400
400
300
200
100
0
-100
-200
-300
-4001999 2001 2003 2005 2007 2009
Source: ECB.Notes: MMIs stands for “money market instruments”. Infl ows (+); outfl ows (-).
Chart 10 Financial flows as a percentage of GDP
Euro area
25
20
15
10
5
0
-5
-10
-15
-20
-25
25
20
15
10
5
0
-5
-10
-15
-20
-251999 2001 2003 2005 2007 2009
assets
liabilities
net
Source: ECB.Note: Infl ows (+); outfl ows (-).

19ECB
Occasional Paper No 126
July 2011
3 THE FINANCIAL
CRISIS AND EURO
AREA CROSS-BORDER
FINANCIAL FLOWS
The ratio of euro area external assets to GDP,
as well as that of euro area external liabilities
to GDP after reaching the level of 23% in both
cases (€2 trillion) in 2007, fell to about 5% in
2008 and just 2% in 2009. Net fl ows which, for
comparison, were close to balance (€3 billion)
in 2007, amounted to just 1.3% of GDP in
2008 and fell to 0.3% in 2009, in line with the
developments in the current account balance
(see Chart 10).
These fi gures show that: (i) asset and liability
fl ows can be far larger than net fl ows,
(ii) external fi nancial fl ows can be volatile and
easily reversible under certain conditions 18 and
(iii) low net fl ows may mask the gradual build
up of macroeconomic imbalances and fi nancial
risks. The larger the ratio of assets or liabilities
to GDP, the more vulnerable a country is to
abrupt changes in fi nancial market conditions
and to adverse wealth and balance sheet shocks.
Indeed, the collapse of Lehman Brothers in
September 2008 and the ensuing intensifi cation
and synchronisation of the global fi nancial
crisis marked a break in the surge of gross
cross-border fi nancial fl ows. In the euro area
a sizeable scaling down of external fi nancial
transactions by both residents and non-
residents was recorded in 2008 (see Charts 6
and 10), which was evident across the whole
range of investment instruments. The only
exceptions were investment in euro area debt by
non-residents and inter-company loans abroad
by residents, which both increased (see Tables 1
and 2 in the Annex).
A number of extraordinary circumstances
amplifi ed the reduction in gross cross-border
investment – and in some cases resulted in
disinvestment by euro area residents and
non-residents during the crisis. First, liquidity
shortages owing to the breakdown of the
interbank and asset-backed securities markets
triggered initially signifi cant (fi re) sales of
A study by Broner et al. (2010) fi nds that for high-income 18
countries during the 2000s, the volatility of gross fi nancial
fl ows is signifi cantly higher than that of net fi nancial fl ows. For
example, the median standard deviation of gross infl ows from
abroad increased to 9.16 in the 2000s from 2.66 during the
1970s, while the volatility of net fl ows increased from 2.41 in the
1970s to 3.60 in the 2000s.
Chart 11 Financial flows as a percentage of GDP
assets
liabilities
net
United States United Kingdom
-25
-20
-15
-10
-5
0
5
10
15
20
25
-25
-20
-15
-10
-5
0
5
10
15
20
25
1999 2001 2003 2005 2007 2009-100
-80
-60
-40
-20
0
20
40
60
80
100
-100
-80
-60
-40
-20
0
20
40
60
80
100
1999 2001 2003 2005 2007 2009
Sources: Bureau of Economic Analysis and UK Offi ce of National Statistics.

20ECB
Occasional Paper No 126
July 2011
other assets to raise cash. Second, heightened
uncertainty and asymmetric information
between lenders and borrowers resulted in
a sudden rise in risk aversion, which led to
a certain amount of herd behaviour among
international investors. Third, extensive balance
sheet restructuring in both the fi nancial and
non-fi nancial sectors, triggered partly by
solvency concerns, induced a further decrease in
euro area cross-border fi nancial fl ows.
The prominent role of sudden gyrations in
markets’ risk perceptions, confi dence and
tolerance during this fi nancial crisis episode has
recently attracted attention in the literature as
a determinant of cross-border activity (Forbes
and Warnock (2011)). It has been argued that part
of the rise in market risk that emerged in the last
quarter of 2008 (see Chart 12) can be explained
by shifts in the risk assessment of current as well
as future asset prices, in an environment of large
negative wealth shocks, weak fundamentals and
economic and fi nancial imbalances (Bacchetta
et al. (2010)). This suggests that some degree
of additional immeasurable risk, referred to as
Knightian uncertainty, might have intensifi ed
the typical risk aversion behaviour seen during
times of high risk, leading to a broadly-based
loss of confi dence on the part of investors
(Caballero and Krishnamurthy (2008)).
Taken together, these three factors not only
led to a scaling down of gross cross-border
direct investment, portfolio investment and
other investment, they also resulted in changes
in the composition of euro area cross-border
portfolio fl ows.
3.2.1 SHIFTS IN THE COMPOSITION
OF PORTFOLIO INVESTMENT
As the global fi nancial turmoil that started in
mid-2007 developed into a full-blown crisis in
2008, investors shifted from (i) equity to debt
instruments (fl ight to safety), (ii) long-term to
short-term debt instruments and (iii) private
sector securities to public sector debt.
While euro area residents engaged in large-scale
portfolio disinvestment abroad and repatriation
of funds, foreign investors continued to
purchase portfolio assets in the euro area, albeit
at a decelerating pace (see Chart 13).
This mainly refl ected developments in the debt
market. Foreign investors purchased sizeable
amounts of euro area money market instruments,
Chart 12 Risk dynamics during the crisis
Market risk Volatility of market risk
0
10
20
30
40
50
60
70
80
90
0
10
20
30
40
50
60
70
80
90
2007 2008 2009 20100
2
4
6
8
10
12
14
16
18
0
2
4
6
8
10
12
14
16
18
2007 2008 2009 2010
Sources: Datastream and ECB staff calculations. Notes: The market risk measure on the left-hand side refers to the CBOE SPX volatility VIX index. The volatility of market risk is the 30-day standard deviation of the VIX index. See Bacchetta, Tille and van Wincoop (2010). Last observation refers to May 2011.

21ECB
Occasional Paper No 126
July 2011
3 THE FINANCIAL
CRISIS AND EURO
AREA CROSS-BORDER
FINANCIAL FLOWS
which more than offset their reduced investment
in euro area bonds and notes (see Chart 14).
Euro area investors, by contrast, decreased
signifi cantly their purchases of both long and
short-term debt instruments abroad as a result of
increased home bias (see Chart 15).19
The shift in foreign investors’ preferences away
from assets with longer-term maturity (bonds and
notes) to safer and more liquid short-term assets
(money market instruments), was accompanied
by a move away from debt issued by euro
area MFIs to government debt, both long-term
and short-term (see Chart 16). In particular,
foreigners strongly disinvested in MFI bonds
in the fourth quarter of 2008 and in the fi rst
three quarters of 2009, in spite of government
guarantees for such securities, possibly due to
growing uncertainty about the extent of the euro
area banking sector’s exposure to “toxic” assets
and fears of systemic spillovers.
At the same time, investors withdrew from
equity markets in the midst of the crisis. Foreign
investors’ large disinvestment in euro area
See, also, the box entitled “Financial integration and the fi nancial 19
crisis in 2008: a cross-border portfolio allocation perspective”,
Monthly Bulletin, ECB, May 2010.
Chart 13 Portfolio assets and liabilities of the euro area
(EUR billions; annual fl ows)
-800
-600
-400
-200
0
200
400
600
800
-800
-600
-400
-200
0
200
400
600
800
2006 2007 2008 2009 2010
assets
liabilities
Source: ECB.Note: Infl ows (+); outfl ows (-).
Chart 14 Non-euro area residents’ investment in euro area bonds and notes and money market instruments, by issuing sector
(EUR billions; quarterly fl ows)
government
MFIsother sectors
Bonds and notes Money market instruments
-200
-150
-100
-50
0
50
100
150
200
-200
-150
-100
-50
0
50
100
150
200
2006 2007 2008 2009 2010
-200
-150
-100
-50
0
50
100
150
200
-200
-150
-100
-50
0
50
100
150
200
2006 2007 2008 2009 2010
Source: ECB.Notes: MFIs stands for “monetary fi nancial institutions”. Last observation refers to Q4 2010. Infl ows (+); outfl ows (-).

22ECB
Occasional Paper No 126
July 2011
equities in the second half of 2008 and the fi rst
quarter of 2009 was concentrated on non-MFI
sectors, while euro area investors also liquidated
equity investments abroad (see Chart 17).
As risk aversion surged, increasing home
bias and stronger preferences for safer and
more liquid assets became the main drivers
of the developments in cross-border portfolio
fl ows during the crisis. Other factors – such as
interest rate differentials – that traditionally
had played a major role in explaining bond
fl ows seemed less relevant (see Chart 18).
Meanwhile, the halt of the convergence process
in euro area bond markets, as evidenced by
widening government bond spreads, implied
that country-specifi c risk factors were playing
an increasing role. Equity fl ows, by contrast,
remained broadly in line with relative stock
price developments in the euro area and other
major fi nancial centres, such as the United
States (see Chart 19), but have largely suffered
from a highly synchronised stock market
downturn worldwide and from the adverse
impact of persistent global risk factors.
3.2.2 DELEVERAGING IN OTHER INVESTMENT
In other investment, which mainly comprises
loans and deposits, signifi cant cross-border
Chart 15 Euro area residents’ investment by sector in bonds and notes and money market instruments abroad
(EUR billions; quarterly fl ows)
government
MFIs/monetary authorities
other sectors
Bonds and notes Money market instruments
-200
-150
-100
-50
0
50
100
150
200
-200
-150
-100
-50
0
50
100
150
200
2006 2007 2008 2009 2010
-200
-150
-100
-50
0
50
100
150
200
-200
-150
-100
-50
0
50
100
150
200
2006 2007 2008 2009 2010
Source: ECB.Notes: MFIs stands for “monetary fi nancial institutions”. Last observation refers to Q4 2010. Infl ows (+); outfl ows (-).
Chart 16 Non-euro area residents’ investment in euro area debt (by issuing sector)
(EUR billions; annual fl ows)
2006 2007 2008 2009 2010-200
-100
0
100
200
300
400
500
-200
-100
0
100
200
300
400
500
government
MFIs
other sectors
total
Source: ECB.Notes: MFIs stands for “monetary fi nancial institutions”; the Eurosystem is excluded, as it does not issue debt securities.

23ECB
Occasional Paper No 126
July 2011
3 THE FINANCIAL
CRISIS AND EURO
AREA CROSS-BORDER
FINANCIAL FLOWS
deleveraging activity by euro area residents
and non-residents has been particularly evident
(see Chart 20).
After showing a strong upward trend prior to the
crisis, with annual fl ows rising from about
€150 billion in 2003 to about €600 billion
Chart 17 Cross-border investment in equities
(EUR billions; quarterly fl ows)
Euro area residents’ investment in equities Non-euro area residents’ investment in euro area equities
-200
-150
-100
-50
0
50
100
150
200
-200
-150
-100
-50
0
50
100
150
200
2006 2007 2008 2009 2010
government
MFIs/mon. auth.
other sectors
-200
-150
-100
-50
0
50
100
150
200
-200
-150
-100
-50
0
50
100
150
200
2006 2007 2008 2009 2010
MFIs
non-MFIs
Source: ECB.Notes: MFIs stands for “monetary fi nancial institutions”. Last observation refers to Q4 2010. Infl ows (+); outfl ows (-).
Chart 18 Bond yield differentials
(EUR billions; 12-month cumulated fl ows)
2000 2002 2004 2006 2008 2010-250
-200
-150
-100
-50
0
50
100
150
200
250
-40
-30
-20
-10
0
10
20
30
40
net flows in bonds and notes (left-hand scale)
bond return differentials between the euro area
and the United States (right-hand scale)
Sources: ECB and Datastream.Note: Last observation refers to February 2011.
Chart 19 Equity return differentials
(EUR billions; 12-month cumulated fl ows; percentage change)
-300
-200
-100
0
100
200
300
-40
-30
-20
-10
0
10
20
30
40
2000 2002 2004 2006 2008 2010
net equity flows (left-hand scale)
equity return differentials between the euro area
and the United States (right-hand scale)
Sources: ECB and Datastream.Note: Last observation refers to February 2011.
24ECB
Occasional Paper No 126
July 2011
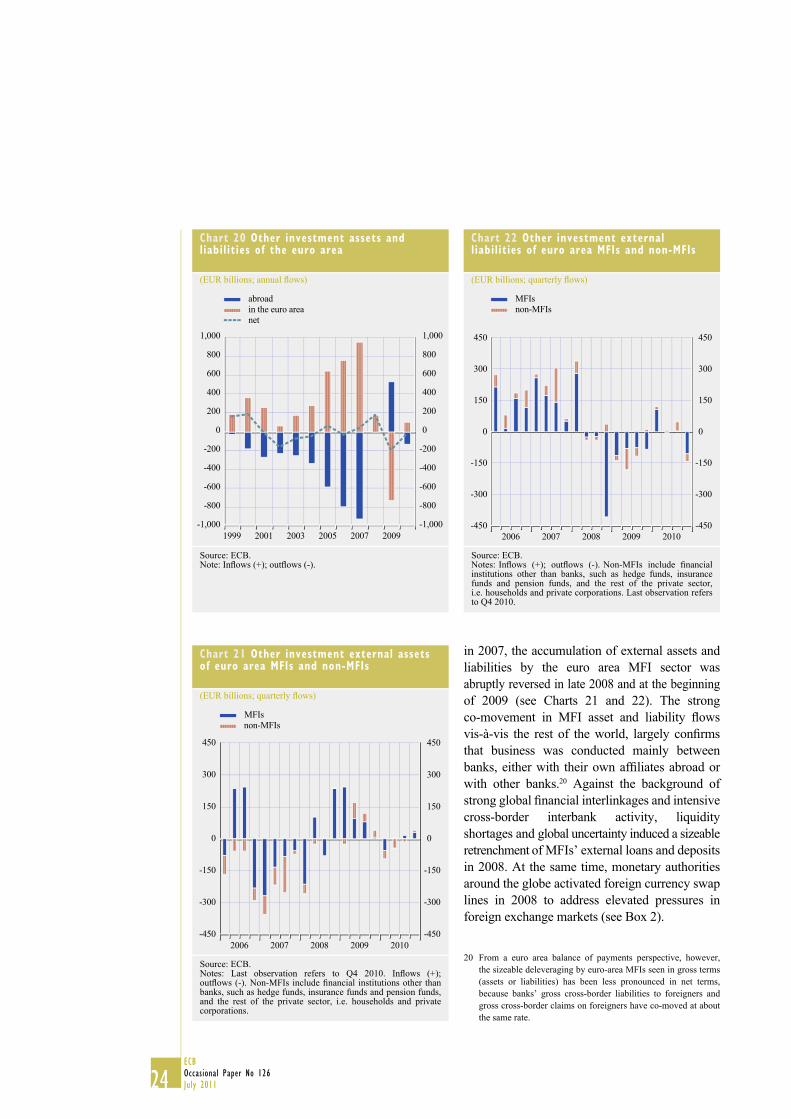
in 2007, the accumulation of external assets and
liabilities by the euro area MFI sector was
abruptly reversed in late 2008 and at the beginning
of 2009 (see Charts 21 and 22). The strong
co-movement in MFI asset and liability fl ows
vis-à-vis the rest of the world, largely confi rms
that business was conducted mainly between
banks, either with their own affi liates abroad or
with other banks.20 Against the background of
strong global fi nancial interlinkages and intensive
cross-border interbank activity, liquidity
shortages and global uncertainty induced a sizeable
retrenchment of MFIs’ external loans and deposits
in 2008. At the same time, monetary authorities
around the globe activated foreign currency swap
lines in 2008 to address elevated pressures in
foreign exchange markets (see Box 2).
From a euro area balance of payments perspective, however, 20
the sizeable deleveraging by euro-area MFIs seen in gross terms
(assets or liabilities) has been less pronounced in net terms,
because banks’ gross cross-border liabilities to foreigners and
gross cross-border claims on foreigners have co-moved at about
the same rate.
Chart 20 Other investment assets and liabilities of the euro area
(EUR billions; annual fl ows)
-1,000
-800
-600
-400
-200
0
200
400
600
800
1,000
-1,000
-800
-600
-400
-200
0
200
400
600
800
1,000
1999 2001 2003 2005 2007 2009
abroad
in the euro area
net
Source: ECB.Note: Infl ows (+); outfl ows (-).
Chart 21 Other investment external assets of euro area MFIs and non-MFIs
(EUR billions; quarterly fl ows)
-450
-300
-150
0
150
300
450
-450
-300
-150
0
150
300
450
2006 2007 2008 2009 2010
MFIs
non-MFIs
Source: ECB.Notes: Last observation refers to Q4 2010. Infl ows (+); outfl ows (-). Non-MFIs include fi nancial institutions other than banks, such as hedge funds, insurance funds and pension funds, and the rest of the private sector, i.e. households and private corporations.
Chart 22 Other investment external liabilities of euro area MFIs and non-MFIs
(EUR billions; quarterly fl ows)
-450
-300
-150
0
150
300
450
-450
-300
-150
0
150
300
450
2006 2007 2008 2009 2010
MFIs
non-MFIs
Source: ECB.Notes: Infl ows (+); outfl ows (-). Non-MFIs include fi nancial institutions other than banks, such as hedge funds, insurance funds and pension funds, and the rest of the private sector, i.e. households and private corporations. Last observation refers to Q4 2010.

25ECB
Occasional Paper No 126
July 2011
3 THE FINANCIAL
CRISIS AND EURO
AREA CROSS-BORDER
FINANCIAL FLOWS
Box 2
THE ECB’S FOREIGN EXCHANGE LIQUIDITY-PROVIDING OPERATIONS
From the onset of the crisis in mid-2007 until mid-2008, the signifi cant foreign exchange liquidity
needs of the euro area banks have been covered by banks located abroad – usually the US or UK
offi ces of euro area-owned banks – lending to their affi liated offi ces in the euro area (often the
parent offi ce). When the crisis intensifi ed in September 2008 and cash shortages emerged, central
banks began to play a key role in providing liquidity in currencies other than the euro. In response
to elevated pressures in the US dollar funding markets, the ECB agreed a temporary reciprocal
currency arrangement (swap line) with the Federal Reserve that enabled the ECB to conduct US
dollar liquidity-providing operations with its counterparties against Eurosystem-eligible collateral.
A similar swap line was activated between the ECB and the Swiss National Bank in October 2008
in order to enable the ECB to provide Swiss franc liquidity to euro area banks, if needed.
Although these operations, and most notably the US dollar liquidity ones, resulted in a rapid
increase in the Eurosystem’s external liabilities in the “other investment” item of the balance of
payments in 2008 (see Chart), they were counterbalanced by an increase in the external assets
held by resident MFIs and eventually by a decrease in their external liabilities, in particular
the ones denominated in foreign currency. As a result, the US offi ces of many euro area banks
were able to decrease their lending position to their parents and, in the fourth quarter of 2008,
they actually received a fl ow of funds back into the United States, possibly due to heightened
diffi culties in the US market.
An unwinding of the US dollar liquidity-
providing operations took place in 2009, which
was refl ected in a decrease in the liabilities of
the Eurosystem of almost the same size as the
interventions of late 2008.
In January 2010, the swap line with the Swiss
National Bank was discontinued. However,
in May 2010 the ECB decided to reactivate,
in coordination with other central banks, the
temporary US dollar liquidity swap facilities,
which had been earlier discontinued, as a
response to the re-emergence of strains in
US dollar short-term funding markets. Finally,
in December 2010, the ECB and the Bank of
England announced, within the framework
of central bank cooperation, a temporary
liquidity swap facility, under which the Bank
of England could provide, if necessary, pound
sterling to the ECB in exchange for euro.
The impact of all the above-mentioned foreign
exchange liquidity-providing operations in
2010 on the Eurosystem’s external liabilities
has been marginal.
Other investment by sector
(EUR billions; net annual fl ows)
-300
-200
-100
0
100
200
300
400
-300
-200
-100
0
100
200
300
400
2005 2006 2007 2008 2009 2010
government
MFIs
monetary authorities
other sectorstotal
Source: ECB.Notes: MFIs stands for “monetary fi nancial institutions”. Infl ows (+); outfl ows (-).

26ECB
Occasional Paper No 126
July 2011
The deleveraging process was apparent also
in the non-bank sector (see Charts 21 and 22).
Prior to the crisis, loans granted to foreigners
and deposits held abroad (asset side) and
loans received from abroad (liability side)
by euro area non-bank entities had risen at a
strong pace. Annual fl ows in foreign assets
increased from less than €100 billion in 2004
to around €400 billion in 2007, while fl ows in
foreign liabilities increased from €35 billion to
more than €200 billion over the same period.
The deceleration in 2008 was more pronounced
for external assets than for external liabilities.
3.2.3 RESILIENCE OF FOREIGN DIRECT
INVESTMENT
An interesting feature of the fi nancial crisis has
been that foreign direct investment (FDI) has
been more resilient than other forms of private
capital. Thus, FDI fl ows in 2008/9 remained
close to their pre-crisis long-term averages
(see Chart 23).
Euro area FDI investment abroad decelerated,
but weathered the crisis relatively well, while
inward FDI in the euro area was affected more
strongly in 2008. The most pronounced drop was
in direct investment from the United Kingdom,
followed by that from the United States
(see Chart 25).
The resilience of outward FDI by euro area
residents could partly refl ect engagement
in projects of a longer-term nature or with
higher fi xed costs, and thus the diffi culty of
withdrawing from longer-term commitments.
Meanwhile, the rather strong euro exchange rate
may have encouraged some euro area fi rms to
buy assets abroad, while making inward FDI
rather expensive.
Data on cross-border mergers and acquisitions
(M&As), the main mode of FDI, confi rm
the deceleration observed in euro area
direct investment in the last couple of years
(see Chart 24). The value of these deals declined
in 2008 and 2009, as compared with the pre-
crisis period. M&As in manufacturing and in the
non-bank fi nancial sector recorded the sharpest
fall, while those in services increased, the
latter possibly refl ecting buy-out opportunities
resulting from the crisis.
Chart 23 Foreign direct investment abroad and in the euro area
(EUR billions; annual fl ows)
-600
-400
-200
0
200
400
600
-600
-400
-200
0
200
400
600
2005 2006 2007 2008 2009 2010
abroad
in the euro area
net
Source: ECB.Note: Infl ows (+); outfl ows (-).
Chart 24 M&As by the rest of the world in the euro area, by target sector
(EUR billions; period sums)
2005 2006 2007 2008 2009 2010
manufacturing
banking
other financial
other
services
0
50
100
150
200
250
0
50
100
150
200
250
Sources: Bureau Van Dijk and ECB staff calculations.

27ECB
Occasional Paper No 126
July 2011
3 THE FINANCIAL
CRISIS AND EURO
AREA CROSS-BORDER
FINANCIAL FLOWS
The main factor behind the moderation in FDI
fl ows was, according to fi rm level data, the
deterioration in the fi nancing capability of fi rms.
The tightening of credit conditions and the
higher cost of capital hampered companies’
access to external fi nancing, while the lower
profi tability and stock market value of their
assets reduced the availability of own funds for
investment at home and abroad. At the same
time, the uncertainty surrounding global
economic prospects had a dampening effect on
fi rms’ propensity to invest, with a preference for
partnerships and licensing as opposed to equity
investments, as means of international
expansion.21 Multinational fi rms also accelerated
their repatriation of profi ts, opting against
reinvestment. In some cases, disinvestment was
observed, as troubled fi rms and fi nancial
institutions raised capital by selling their
overseas assets, usually to local companies.
Finally, a drop in leveraged buy-out transactions
by private-equity funds from many countries
served to further dampen inward cross-border
M&As, which in turn further depressed euro
area FDI infl ows.
3.3 THE AFTERMATH OF THE CRISIS AND
RECENT DEVELOPMENTS
As the global economy started to show signs of
stabilisation in 2009, some of the trends in gross
cross-border fi nancial fl ows observed during
the peak of the crisis abated or even started to
reverse. There was a general resumption of fl ows,
although they remained at signifi cantly lower
levels than in the pre-crisis period from 2005 to
2007. In some cases, such as portfolio investment
abroad by euro area residents, cross-border fl ows
stabilised at well below their historical annual
average levels.
In more detail, portfolio investment in debt
instruments lost some of its appeal in 2009,
particularly for non-resident investors.
The more favourable global economic outlook
and improved fi nancial market conditions
resulted in a partial rebound in investors’
risk appetite, encouraging them to invest
in equities in the euro area and abroad.
However, in the fi rst half of 2010 risk aversion
re-emerged, amid high volatility, due to the
re-intensifi cation of fi nancial market tensions,
especially in Europe, in May. Indeed, during
the second quarter of 2010, developments were
largely driven by increased home bias on the part
of euro area residents, who engaged in a process
of liquidation of positions in foreign bonds and
equities and repatriation of funds. In the second
half of 2010 non-residents signifi cantly decreased
their purchases of euro area debt instruments; in
particular, they sold euro area bonds and notes in
the third quarter of 2010 amid market concerns
related to the sustainability of the sovereign debt
of some euro area countries, only resuming their
purchases in the fourth quarter as tensions eased.
In contrast, euro area residents increased their
purchases of debt instruments abroad somewhat.
Equity investment accelerated in the second
half of 2010, rebounding from the low levels
observed in the fi rst half of the year, mainly
refl ecting higher investment in euro area equities
by foreign investors. Euro area investors also
See United Nations Conference on Trade and Development 21
(2009).
Chart 25 Euro area FDI inflows, by geographical region of origin
(EUR billions)
0
100
200
300
400
500
0
100
200
300
400
500
Mar.
2007
Sep. Mar.
2008
Sep. Mar.
2009
Sep. Mar.
2010
Sep.
other
United States
United KingdomJapanSweden
SwitzerlandCEEC+BRIC
Source: ECB.Notes: Last observation refers to Q4 2010. “other” is calculated as a residual and includes infl ows from other countries, international organisations and offshore fi nancial centres. CEECs stands for “central and eastern European countries” and BRICs stands for “Brazil, Russia, India and China”.

28ECB
Occasional Paper No 126
July 2011
started to invest in foreign equities again in an
environment of rising stock market prices and
declining market volatility.
Meanwhile, the process of deleveraging continued
at a signifi cant rate in 2009 in relation to cross-
border loans and deposits. For the fi rst time since
the introduction of the euro, the euro area’s gross
other investment fl ows recorded declines on both
the asset and liability sides in 2009 (see Chart 20),
before modestly resuming in 2010.
As regards the euro area banking sector, the
need to strengthen capital positions – in an
environment of more prudent lending standards
and pressure from the supervisory authorities
to keep leverage levels under tight control –
and reduce international risk exposure largely
accounted for the continued reduction in the
foreign assets (mostly loans granted abroad)
of MFIs (see Chart 21). At the same time, the
desire to refocus balance sheet risk may have
been the reason for a higher acquisition of other
assets, like government securities, at least until
the third quarter of 2009. On the liability side,
foreign investors continued to withdraw deposits
held with euro area MFIs (see Chart 22). Given
that euro area MFIs form an integral and
core part of the global fi nancial system, their
cross-border activity has been fundamental in
the process of global deleveraging. Against this
background, Box 3 provides further insight into
euro-area bank deleveraging by discussing it
from a global perspective.
Similarly, a fully fl edged deleveraging process
also started in the euro area non-MFI sector, in
2009 (see Charts 21 and 22). For the fi rst time
since the introduction of the euro, the non-MFI
sector recorded net sales of its external assets
and a reduction in its external liabilities. This
development is likely to have been the combined
result of: (i) balance sheet adjustment and debt
repayment, (ii) a shift from (foreign) bank loans
to market-based fund raising,22 due to improved
sentiment in fi nancial markets, as evidenced by
the rebound in equity prices (demand-side
effect) and (iii) a reduction by foreign banks in
their cross-border lending (supply-side effect).
See the box entitled “Integrated euro area accounts for the third 22
quarter of 2009”, Monthly Bulletin, ECB, February 2010.
Box 3
THE INTERNATIONAL DIMENSION OF BANK
DELEVERAGING
An important channel through which
the fi nancial crisis has been propagated
internationally has been the sizeable reduction
in the foreign claims of banks active in
global fi nancial markets. As the turmoil
reached its peak, banks reporting to the
Bank for International Settlements (BIS)
reduced their global exposure by 18%, from
USD 30.4 trillion in the fi rst quarter of 2008
to USD 25.0 trillion in the fourth quarter of
2008 on a consolidated basis (see Chart A).
Around 70% of this reduction was achieved by
cutting cross-border claims, mostly comprising
international loans, while the remaining 30%
resulted from a reduction in the local claims
Chart A Foreign claims of BIS reporting countries (cross-border and local lending)
(total amount outstanding (stock) in USD billions; ultimate risk basis)
0
4
8
12
16
20
24
28
32
0
4
8
12
16
20
24
28
32
2005 2006 2007 2008 2009 2010
cross-border claims
local claims of foreign offices in all currencies
Sources: BIS and ECB staff calculations.Notes: Consolidated data. The last observation refers to the fourth quarter of 2010.

29ECB
Occasional Paper No 126
July 2011
3 THE FINANCIAL
CRISIS AND EURO
AREA CROSS-BORDER
FINANCIAL FLOWS
of foreign subsidiaries. Between March 2009
and the fourth quarter of 2010 the total foreign
claims of BIS reporting countries broadly
stabilised at a level of around USD 25 trillion.
In line with the global nature of the fi nancial
turmoil, the deleveraging process was highly
synchronised across countries in the period
between March 2008 and December 2008,
affecting almost all major developed and
emerging economies. Over this period,
foreign claims were reduced vis-à-vis the
United States by USD 866 billion (-13%) and
the United Kingdom by USD 1 trillion (-27%),
as shown by the reddish brown bars in Chart B.
The reduction was particularly sizeable
vis-à-vis the euro area countries, USD 2.1 trillion
(-20%), partly refl ecting a fall in intra-euro area
fi nancial claims. From a systemic point of view,
the decline in banks’ international exposure
to emerging market economies by almost
half a trillion US dollars was also particularly
relevant, with Asia appearing to be the most
affected region during the early stages of the
crisis. From the fourth quarter of 2008 onward,
developments have been more idiosyncratic.
Although BIS banks increased their exposure
to (non-European) emerging markets to levels
even higher than those prevailing prior to the
turmoil, they continued to cut foreign claims
on the United States and euro area countries
(see the blue bars in Chart B).
Particularly relevant is that banks of the largest
euro area countries have continued to retrench
internationally, returning, for example, to
the levels of exposure of 2005 in the case of
Germany and of 2007 in the case of France
(see Chart C).1
A sectoral decomposition of banking claims
also allows one to get a better insight into the
nature of the international bank deleveraging
process. While between March 2008 and
December 2010 BIS banks increased their
1 Avdjiev et al. (2011) report breaks in the series for both Germany and France, including in the light of the transfer of claims to asset
management companies that do not report to the BIS. These however do not affect the broad picture that German and French banks
continued to reduce their international fi nancial exposure (the breaks are also smaller in consolidated terms).
Chart B Change in foreign claims of BIS reporting countries vis-à-vis selected geographical regions
(total amount outstanding (stock) in USD billions; ultimate risk basis)
-2,500
-2,000
-1,500
-1,000
-500
0
500
1,000
-2,500
-2,000
-1,500
-1,000
-500
0
500
1,000
change from Q4 2008 to Q4 2010
change from Q1 2008 to Q4 2008
1 2 3 4 5 6 7 8 9
9 euro area8 United States
7 United Kingdom
6 Japan
5 Emerging Europe
4 Latin America and Carribean3 Africa and Middle East
2 Asia and Pacific
1 Offshore centres
Sources: BIS and ECB staff calculations.Notes: Consolidated data. For the euro area (EA) the last observation refers to Q4 2010.
Chart C Foreign claims of BIS reporting countries vis-à-vis the rest of the world (selected euro area countries)
(total amount outstanding (stock) in USD billions; ultimate risk basis)
0
500
1,000
1,500
2,000
2,500
3,000
3,500
4,000
4,500
5,000
0
500
1,000
1,500
2,000
2,500
3,000
3,500
4,000
4,500
5,000
2005 2006 2007 2008 2009 2010
Germany
France
Italy
Netherlands
Spain
Sources: BIS and ECB staff calculations.Notes: Consolidated data. The last observation refers to Q4 of 2010.

30ECB
Occasional Paper No 126
July 2011
In 2010, however, deleveraging in relation to
cross-border loans and deposits lost momentum
and there were some signs of normalisation of
fl ows both on the asset and on the liability sides,
as euro area residents resumed investing abroad
and non-residents resumed investing in the euro
area. The size of international fl ows of other
investment, however, remained very subdued.
Finally, direct investment – which, as discussed,
moderated but proved more resilient than other
fl ows of private capital during the crisis –
showed some signs of recovery in 2009.
Inward direct investment picked up again
but remained substantially muted, especially
that part stemming from the United Kingdom
and the United States (see Chart 26). At the
same time direct investment by euro area
residents abroad stabilised. In 2010 as a whole,
direct investment again moderated, particularly
that carried out in the euro area by foreign
investors.
exposure vis-à-vis the public sector by 7.0%
(USD 0.3 trillion), the deleveraging process
vis-à-vis other banks and the private sector
was sizeable (see Chart D). Overall BIS banks
reduced their foreign claims vis-à-vis other
banks by one third (about USD 2.9 trillion) and
their foreign claims vis-à-vis the private sector
by one sixth (USD 2.9 trillion) from the peak
levels of March 2008. Notwithstanding this
sizeable fall in foreign claims on the private
sector, the latter remains by far the largest
sector to which the banking sector is exposed
(USD 14.3 trillion in December 2010).
Moreover, the share of BIS bank exposure to
the private sector increased by 3 percentage
points (to reach 59% of their total exposure)
between March 2008 and December 2010.
Over the same period the exposure to the
public sector increased by 500 basis points, to
reach 19% while that to other banks declined
by a similar amount to 24%.
Part of the process of global bank deleveraging can be viewed as a necessary adjustment of loan-
to-deposit ratios after several years of rapid credit expansion at the global level. The decline
is also consistent with the sharp slowdown observed in global economic activity. However, a
prolonged period of subdued foreign lending to the private sector could also signal a phase of
general weakness in the banking sector, which may be partly refl ected in banks’ willingness to
lend domestically.
In summary, the global economy has witnessed a signifi cant retrenchment of the banking sector
from global markets, which has refl ected the severity of the fi nancial turmoil, but also contributed
to the spread of its impact internationally. Although the deleveraging process is not yet over for
all countries and all sectors, there are signs of stabilisation, which is important if the global
recovery is to be durable.
Chart D Foreign claims of BIS reporting countries vis-à-vis the rest of the world, by sector
(total amount outstanding (stock) in USD billions; June 2010)
0
2,000
4,000
6,000
8,000
10,000
12,000
14,000
16,000
18,000
0
2,000
4,000
6,000
8,000
10,000
12,000
14,000
16,000
18,000
2005 2006 2007 2008 2009 2010
bankspublic sectornon-bank private sector
Sources: BIS and ECB staff calculations.Note: Consolidated data, based on headquarter principle.

31ECB
Occasional Paper No 126
July 2011
3 THE FINANCIAL
CRISIS AND EURO
AREA CROSS-BORDER
FINANCIAL FLOWS
3.4 INTERNATIONAL INVESTMENT POSITION
Apart from the impact on cross-border fi nancial
fl ows, the crisis has also affected fi nancial
stocks, i.e. the international investment position
(i.i.p.). The change in the i.i.p. is primarily
explained by two factors: (i) net fi nancial fl ows
and (ii) revaluations due to changes in exchange
rates and asset prices and other adjustments.
In the years prior to the crisis, the net i.i.p. of
the euro area was gradually deteriorating, its net
liability position reaching a peak of €1.7 trillion
(or 17.9% of GDP) in 2008, before narrowing
to €1.5 trillion (or 16.4% of GDP) in 2009 and
€1.2 trillion (or 13.0% of GDP) in 2010.
The United States and the United Kingdom
also recorded net liability positions during the
same period, which peaked in 2008 and 2006,
respectively (see Chart 26).
While revaluation effects almost exclusively
explained the deterioration in the net i.i.p. of the
euro area in 2006 and 2007, the transaction
effect, i.e. the contribution of fi nancial fl ows,
increased markedly, to one third of the
deterioration in the i.i.p. of the euro area in 2008
(see Chart 27). These net infl ows were mainly
driven, as seen above, by strong net purchases
of debt securities, which were only partly offset
by net sales of equities. In addition, the negative
revaluations due to the appreciation of the euro
and other adjustments 23 were only partly offset
by positive asset price changes, so that the euro
area’s net liability position deteriorated further.
As international economic conditions started to
normalise in 2009 and 2010, the impact of net
fi nancial transactions on the change in the euro
area’s i.i.p. became smaller (but still negative),
as it was offset by large and positive revaluation
effects predominantly arising from asset price
and exchange rate changes. Despite the fact
that the euro area’s net i.i.p. improved in 2009
and 2010, underlying sectoral shifts in the net
The other adjustments mainly refl ected the introduction of a new 23
data collection system for portfolio investment in one euro area
country.
Chart 26 Net i.i.p. of selected advanced economies
(as a percentage of GDP)
-30
-25
-20
-15
-10
-5
0
-30
-25
-20
-15
-10
-5
0
euro area
United States
United Kingdom
-35 -351999 2001 2003 2005 2007 2009
Source: ECB.Note: Last observation refers to 2010, except for the United States (2009).
Chart 27 Breakdown of changes in the euro area net i.i.p.
(as a percentage of GDP)
-5
-4
-3
-2
-1
0
1
2
3
4
5
-5
-4
-3
-2
-1
0
1
2
3
4
5
2000 2002 2004 2006 2008 2010
growth effect
transaction effect
other changes effect
total change in net i.i.p.
Source: ECB.

32ECB
Occasional Paper No 126
July 2011
external lending/borrowing of the euro area
suggest some downside risks.
The integrated euro area accounts, available
up to the fourth quarter of 2010, show that net
external borrowing by general government has
been steadily rising since 2008. At the same
time, net borrowing by private non-fi nancial
corporations has been falling, suggesting
reduced needs for capital and changes in
the cash management of companies. In the
course of 2010, general government became
the only sector in the euro area to be a net
borrower from abroad (see Chart 28), although
non-fi nancial corporations returned to a small
net borrowing position in the fourth quarter
of the year. This means that the external
dependence of the euro area governments and
their vulnerability to interest rate risks has
increased. A similar picture emerges from the
analysis of developments in the euro area’s
gross external debt (see Box 4).
Chart 28 Sector contributions to the euro area’s external net lending/borrowing
(four-quarter moving sum; as a percentage of GDP)
-8
-6
-4
-2
0
2
4
6
8
-8
-6
-4
-2
0
2
4
6
8
2004 2006 2008 20102000 2002
households
non-financial corp.
financial corp.
government
total
Source: ECB, Integrated Euro Area Accounts.Note: Last observation refers to Q4 2010. Net lender (+)/ net borrower (-).
Box 4
RECENT DEVELOPMENTS IN THE EURO AREA’S GROSS EXTERNAL DEBT 1
The global fi nancial crisis was associated with an increase in gross external debt in most of the
major advanced economies, including the euro area. Over the period 2006 to 2009, the gross
external debt of the general government sector in the euro area increased by 8.4 percentage
points of GDP to around 21% of GDP at the end of 2009. In the United States, however, the
increase was more pronounced (9.4 percentage points of GDP) and the gross external debt of
general government at the end of 2009 was higher than in the euro area, amounting to about 26%
of GDP (see Table). This increase in the gross debt positions of general government in major
advanced economies was partly driven by higher fi nancing needs on the part of governments as
a result of the crisis, but also by heightened global risk aversion on the part of investors, which
led them to invest in low-risk fi nancial assets, such as the sovereign debt securities of selected
advanced economies.
The net external debt position of the euro area at the end of 2009 (12.6% of GDP) was signifi cantly
lower than its gross external debt position and well below the net positions of the United States
and the United Kingdom. The net interest payments of the euro area amounted to 0.2% of GDP
in 2009, a signifi cantly lower level than in the United States and the United Kingdom where they
were 1.3% of GDP.
1 For an extensive analysis of the gross external debt statistics of the euro area as a whole and its individual member countries,
see Diz Dias (2010).

33ECB
Occasional Paper No 126
July 2011
3 THE FINANCIAL
CRISIS AND EURO
AREA CROSS-BORDER
FINANCIAL FLOWS
3.5 SUMMARY AND FUTURE PROSPECTS
The intensifi cation of the crisis in the last quarter
of 2008, triggered by the collapse of Lehman
Brothers in September 2008, brought about
signifi cant changes compared with the pre-crisis
period, in terms of the size, direction and nature
of euro area cross-border fi nancial fl ows.
First, there was a sizeable scaling-down of
gross external asset holdings, amid soaring risk
aversion, high liquidity needs and balance sheet
restructuring. Flows reversed and their volatility
markedly increased, with potential adverse effects
for the real economy and fi nancial stability.
Second, the strong increase in home bias and
fl ight-to-safety behaviour – manifested in shifts
in the composition of cross-border fi nancial
fl ows – suggest that investors’ decisions were
strongly affected not only by risk aversion,
but, more broadly, by uncertainty aversion.
The diffi culty of identifying, tracing and
quantifying fi nancial and economic risk in the
global system, partly due to the complex inter-
relationships existing among fi nancial and
macroeconomic agents, amplifi ed the overall
perception of risk by investors. Indeed, the
element of uncertainty has featured prominently
throughout this fi nancial crisis episode, having
a clear impact on cross-border fi nancial
fl ows. Investor sentiment continued to swing
signifi cantly in 2009 and 2010, often infl uenced
by market news that rapidly changed collective
expectations. In this context, a number of
policies to restore confi dence and the smooth
External debt indicators for selected countries
(as a percentage of GDP)
2006 2007 2008 2009Gross external debt
Canada 54.3 56.5 52.1 71.3
Japan 34.7 40.4 45.4 42.1
Switzerland 266.2 334.6 245.9 250.3
United Kingdom 378.2 402.1 339.8 416.4
United States 83.6 95.4 95.2 96.5
Euro area 101.5 110.8 118.2 116.6
Gross external debt of general government
Canada 11.3 10.3 9.4 15.5
Japan 9.5 13.8 14.5 13.3
Switzerland 7.1 6.1 4.5 4.0
United Kingdom 11.5 12.1 12.2 18.2
United States 16.5 17.4 21.5 25.9
Euro area 13.0 13.8 18.3 21.4
Net external debt
Canada 22.2 23.6 19.5 20.9
Japan -50.6 -55.7 -48.1 -51.1
Switzerland -102.3 -117.3 -100.9 -120.9
United Kingdom 48.8 43.9 28.0 38.0
United States 39.9 46.0 49.2 46.6
Euro area 6.4 6.6 14.6 12.6
Net interest payments
Canada 1.4 1.4 1.2 1.2
Japan -1.9 -2.3 -2.2 -1.8
Switzerland -3.0 -3.5 -3.5 -3.3
United Kingdom 1.7 1.9 1.6 1.3
United States 1.3 1.5 1.5 1.3
Euro area 0.0 0.1 0.2 0.2
Sources: ECB, IMF and ECB staff calculations.

34ECB
Occasional Paper No 126
July 2011
functioning of various fi nancial market segments
were deemed necessary and promptly introduced
by the respective authorities.
Third, although it was the global economic and
fi nancial conditions that mainly drove cross-
border fl ows, country-specifi c risk factors seem
to have gradually gained importance. This was,
for example, evident in the second quarter of
2010, when cross-border fi nancial fl ows into
euro area debt instruments decreased, following
the sudden re-intensifi cation of fi nancial market
tensions in May 2010. Rising concerns about
the fi scal situation in some of the euro area
peripheral countries and growing fears of
possible contagion in the rest of the euro area
economy appear to have strongly infl uenced
euro area cross-border fl ows and, to some extent,
investors’ portfolio allocation worldwide.24
Finally, the fi nancial crisis changed the sectoral
breakdown of the euro area’s net external
borrowing, with the government sector becoming
the main, and in most of 2010 the only, net
borrower from abroad. In particular, the euro
area’s external debt increased, mainly due to the
increase in government debt, but this was in line
with the upward trend in government borrowing
throughout the world, which was largely
the result of crisis-resolution interventions.
Against this background, the debate about the
level and dynamics of the government sector’s
external debt re-emerged and the discussion on
building buffers in good times in order to have
room for manoeuvre during downturns became
topical again.
As the global economy started to show signs of
stabilisation in 2009, some of the trends in gross
cross-border fi nancial fl ows observed during
the crisis abated or, towards the end of the year,
even reversed. This was the case of portfolio and
direct investment, but less so of cross-border
loans and deposits, where deleveraging was
taking place. In the fi rst half of 2010, the revival
of cross-border portfolio equity transactions and
the loss of momentum in investment in debt
instruments that occurred in 2009 moderated,
as risk aversion rebounded and confi dence in a
rapid recovery of the euro area and the global
economy weakened in the second quarter of
2010. In the second half of the year, investment
in equities accelerated and investment in debt,
notably in euro area government bonds and
notes, rebounded. As regards other investment,
the process of cross-border deleveraging in
relation to loans and deposits appeared to have
halted and signs of stronger fl ows both on the asset
and on the liability sides emerged. Looking ahead,
it is still uncertain what trends will prevail in the
near future. Investors appear to have become
more selective in qualitative terms, for example
by differentiating across countries in relation to
government debt securities. While the global
economic outlook and fi scal developments are
expected to play a key role, overall international
fi nancial fl ows could still be affected by the
balance sheet restructuring of fi nancial and
non-fi nancial corporations in advanced
economies, including the euro area. Following
the surge in international fi nancial activity
prior to the crisis, the recovery may not be
synchronised across world regions, as shown
by the stronger rebound of cross-border fl ows to
emerging markets.
See the box entitled “Developments in fi nancial markets in early 24
May”, Monthly Bulletin, ECB, June 2010.

35ECB
Occasional Paper No 126
July 2011
4 POLICY
IMPLICAT IONS AND
CONCLUS IONS4 POLICY IMPLICATIONS AND CONCLUSIONS
The signifi cant changes in euro area
cross-border fi nancial fl ows, which took place
during the global fi nancial crisis, may have
important implications from a policy perspective.
This crisis has shown that international fi nancial
fl ows can grow very rapidly and suddenly
unwind, potentially having an impact on
economic growth, real exchange rates, current
account positions (Cardarelli et al. (2010))
and eventually on the stability of the fi nancial
sector. The reasons why strong fi nancial infl ows
may be a matter of concern are well known in
the literature; the adverse impact is generally
expected to be channelled via falling price
competitiveness and rising fi nancial fragility.
As discussed in Ostry el al. (2010), fi nancial
infl ows tend to become more problematic as
evidence emerges of (i) currency overvaluation
(ii) excessive reserve accumulation (iii) rising
infl ationary pressures and (iv) signals of
housing and lending booms. The policy tools to
deal with fi nancial fl ows are also well known,
in principle, and include monetary and fi scal
policies, sterilisation, forms of capital controls,
higher exchange rate fl exibility and enhanced
macro-prudential measures. However, in
practice they are far from trivial to implement
for two reasons: fi rst, gearing macro policies
toward discouraging fi nancial infl ows might
have some serious drawbacks; for example
a low interest rate environment might not be
appropriate from a price stability perspective;
second, several of the standard policies to cope
with fi nancial infl ows are often diffi cult to
implement and sustain in practice (Ostry et al.
(2010), for a detailed review).
An important additional aspect highlighted by
the current crisis has been the distinction
between the perils stemming from large net
fi nancial infl ows and those related to
extraordinary growth of cross-border fl ows in
gross terms. The latter could also signal growing
vulnerabilities, since the expansion of the
fi nancial sector may far exceed that of the real
economy and constitute a cause for concern.
Similarly to banks and fi rms, countries may also
be “excessively leveraged”, facing liquidity
shocks, when liabilities are withdrawn, or
capital shocks, when the market-value of
cross-border assets suddenly drops. The aim of
this article is to illustrate the remarkable
experience of the euro area during the “Great
Recession”, notwithstanding the favourable
context of a close-to-balance current account
position and limited fi nancing requirements.
While the euro area’s experience is particularly
interesting, considering the recentness of the
creation of the monetary union, similar trends to
those recorded in the euro area also affected the
global economy. There is indeed a burgeoning
literature on international capital fl ows which
recognises the importance of the gross
dimension of fi nancial fl ows. The large
volatility of fi nancial fl ows seen during the
global turmoil was also identifi ed in the context
of the G20 as a key issue to be evaluated in the
context of the reform of the international
monetary system. A policy debate was initiated
at the IMF (2010b) and (2011) and OECD
(2011), on the challenges and responses to
fi nancial globalisation. To develop a fully
coherent framework for policy guidance across
different countries substantial analytical work
appears warranted.25
The discussion on international capital fl ows
is also part of a much broader discussion on
fi nancial interlinkages, which cannot abstract
from the domestic dimension (IMF (2010b)).
Therefore, a broad macro-prudential regulatory
and supervisory framework is needed to reduce
the possible risk and the negative feedback
effects between the fi nancial and the real
sector, both domestically and internationally.
We conclude this paper, by emphasising the
importance of expanding the monitoring
framework for fi nancial fl ows and by proposing
a few elements of the policy actions that could
contribute to a more effi cient and sustainable
allocation of cross-border fl ows.
See in particular IMF Public Information Notice No 11/1. 25

36ECB
Occasional Paper No 126
July 2011
Expanding the analysis of developments in fi nancial fl ows
Given the lessons from the global fi nancial
crisis, it appears essential to expand the analysis
of cross-border fi nancial fl ows in order to better
assess the fi nancial transmission channel and
identify potential fi nancial fragilities.
The fi rst issue is far from trivial. For example,
the impact cross-border fl ows have on exchange
rates or other macroeconomic variables may
counteract or reinforce standard adjustment
mechanisms. While current account defi cits are
generally expected to lead to weaker exchange
rates, fi nancial infl ows may more than offset
such defi cits. However, the evidence uncovered
by the literature for periods of fi nancial
turmoil seems more clear-cut. In such periods
fi nancial outfl ows and current account defi cits
generally tend to reinforce each other and lead
to a depreciation of the real exchange rate.
The international transmission mechanism, via
cross-border fl ows, may also operate differently
through the banking and shadow banking
sectors, with hidden risks suddenly becoming
more apparent when global risk aversion and
counterpart risk rise.
On the issue of fi nancial fragility, signifi cant
changes in cross-border fi nancial fl ows and
stocks could also be an important tool for
detecting the emergence and build-up of
potential macroeconomic risks. Large external
defi cits are obviously worrisome as they may
increase the probability of banking, currency
and balance of payments crises, especially if
there is a high proportion of debt fi nancing
(Furceri et al. (2011)); but large surpluses may
be challenging too, if associated with credit and
housing booms. Moreover, even a favourable
international investment position may hide a
high degree of exposure to liquidity and capital
shocks from abroad, when the size of the
fi nancing sector and the leverage of the banking
sector increase. Finally, while improving the
monitoring of cross-border fi nancial fl ows may
also involve the development of new or
enhanced statistics,26 the greatest challenge is
possibly to understand the drivers of fi nancial
fl ows and their subcomponents, and to assess
when they may be signalling rising fi nancial
fragility.
Promoting macroeconomic discipline and enhancing fi nancial regulation and supervision
Given that advanced economies typically refrain
from using “direct” policies – such as capital
controls and exchange rate intervention – the
impact that the large size, pro-cyclicality or
volatility of cross-border fi nancial fl ows have on
macroeconomic variables and fi nancial stability
has to be addressed via other, “indirect”, policy
channels. For countries and governments
that wish to maximise the long-term gains of
fi nancial openness, while minimising short-term
risks, policies that promote macroeconomic
discipline or enhance fi nancial supervision and
regulation should play a key role.
On the importance of macroeconomic discipline, the sheer size of pre-crisis fi nancial
fl ows, suggests that sound macroeconomic
policies are essential to maintain a sustainable
growth path, to preserve the gains from
fi nancial openness and to mitigate the adverse
impact associated with fi nancial crises. For
example, countries running high fi scal defi cits
prior to the crisis appear (i) to have been
affected more by the crisis, experiencing higher
volatility of fi nancial market variables or even
a stronger reversal of fi nancial infl ows, and
(ii) to have had a limited ability to respond to
the crisis, for example by re-establishing
foreign investors’ confi dence and re-attracting
foreign capital (van Riet (2010)). To achieve a
viable medium-term fi scal framework, it seems
particularly important not only to reduce the
debt level, but also to improve the maturity
structure of external debt to minimise the
“bunching effect” (Calvo and Reinhart (1999))
and the country’s overall vulnerability to
external shocks. Structural reforms that
increase the economy’s fl exibility can also help
to improve the overall allocation of fi nancial
Waysand et al. (2010) and OECD (2011).26

37ECB
Occasional Paper No 126
July 2011
4 POLICY
IMPLICAT IONS AND
CONCLUS IONSinfl ows to productive investment, which has a
potentially corrective and non-exacerbating
effect on pre-existing domestic distortions in
the recipient economy.27
With respect to fi nancial supervision and regulation, the strong tendency for banks to
take on greater risk in periods when access to
international capital is relatively favourable,
as was the case in the years before the turmoil,
highlights the importance of bank supervision
(Calvo and Reinhart (1999)). For example,
recent work shows the interaction of prudential
policies with fi nancial vulnerabilities connected
to bank-related fi nancial infl ows (IMF (2010a)).
However, the patterns of cross-border fi nancial
fl ows seen during the fi nancial crisis have
shown that it is not only banks that need to be
adequately supervised and regulated, but also
the broader fi nancial sector, including other
fi nancial intermediaries, as the latter have been
very active in cross-border fi nancial transactions
(currently captured in the balance of payments
under the broad umbrella item “other sectors”).28
Prudential regulation is also likely to infl uence
the composition and – to a smaller degree – the
volume of cross-border fi nancial fl ows, thus
building additional buffers in the fi nancial
sector (IMF (2010)) that could help reduce
cross-country and cross-sectoral fi nancial
fragilities.
Taken together, sound macroeconomic policies
and enhanced supervisory and regulatory
frameworks may also help to reduce uncertainty.
As could also be observed during the recent
crisis, imperfectly informed investors tend to
infer underlying conditions from the actions of
other, not necessarily better informed, investors.
This leads to herding and, when inferences
are negative, a rush for the exits (Eichengreen
(2007)), which accounts for volatility spikes in
international fl ows. Cardarelli et al. (2010) argue, on the basis of previous empirical 27
episodes, that the control of public expenditure is a stabilising
factor in the event of a surge in private capital fl ows, while
sterilisation and the tightening of capital controls appear to be
less effective in this respect.
In order to do that, policy-makers need to be able to evaluate the 28
shadow banking system in greater depth (and in a more holistic
way) as well as the structures and operations of new fi nancial
institutions and the benefi ts and risks of securitisation activities
(for example, Hartmann et al. (2007) and Eichner et al. (2010)).

38ECB
Occasional Paper No 126
July 2011
Table A1 Portfolio investment
(EUR billions)
Net AbroadBonds
and notes
Money market
instruments Equity In euro areaBonds and
notes
Money market
instruments Equity
2003 54.3 -281.3 -178.9 -24.4 -78.0 335.6 193.0 31.9 110.7
2004 44.3 -345.4 -181.1 -57.9 -106.4 389.7 268.8 17.0 103.9
2005 106.2 -416.8 -264.9 -17.3 -134.6 523.0 247.4 37.3 238.3
2006 186.2 -520.2 -300.9 -63.2 -156.1 706.4 480.5 -19.6 245.5
2007 126.8 -439.5 -293.4 -83.4 -62.7 566.3 341.1 60.6 164.6
2008 283.3 7.2 -80.7 -10.1 98.0 276.1 177.8 182.9 -84.6
2009 270.7 -84.3 -30.2 -7.2 -46.8 355.0 123.3 119.9 111.8
2010 143.2 -140.7 -103.7 44.0 -81.0 283.9 134.4 2.1 147.5
Source: ECB.
Note: MFIs include Eurosystem.
Table A2 Other investment
(EUR billions)
Net Abroad Government MFIs Other
sectors In euro area Government MFIsOther
sectors
2003 -72.7 -248.8 -0.4 -150.5 -97.9 176.1 -3.4 145.6 33.9
2004 -47.7 -333.6 -1.7 -256.6 -75.3 285.9 -3.8 255.2 34.6
2005 62.2 -584.4 7.4 -400.8 -191.0 646.6 -3.1 495.7 154.0
2006 -30.8 -788.1 7.2 -531.4 -263.8 757.2 1.8 526.1 229.3
2007 38.6 -915.8 7.8 -559.9 -363.8 954.4 -1.0 713.6 241.8
2008 180.5 1.2 5.7 52.1 -56.6 179.3 9.3 106.3 63.7
2009 -193.1 534.6 -10.7 421.6 123.7 -727.7 12.5 -586.3 -153.8
2010 -28.1 -130.0 -39.6 -5.5 -84.9 101.9 64.4 6.0 31.6
Source: ECB.
Note: MFIs include Eurosystem.
Table A3 Direct investment
(EUR billions)
Net Abroad Equity Reinvested
earningsOther
capital In euro area Equity Reinvested
earningsOther
capital
2003 -9.6 -146.2 -115.8 -14.1 -16.3 136.6 108.7 17.8 10.1
2004 -79.2 -169.1 -137.8 -39.0 7.7 89.9 65.3 25.7 -1.1
2005 -204.1 -358.4 -262.1 -39.8 -56.5 154.3 134.4 -12.8 32.7
2006 -159.7 -418.1 -293.0 -40.3 -84.7 258.4 187.4 38.1 32.9
2007 -90.4 -512.9 -318.4 -71.4 -123.1 422.5 271.7 43.7 107.1
2008 -236.0 -328.8 -200.6 5.2 -133.4 92.8 40.0 17.8 35.0
2009 -109.4 -325.3 -217.9 -16.2 -91.1 215.9 204.4 12.0 -0.5
2010 -78.6 -166.5 -51.3 -0.4 -114.9 87.9 120.1 16.6 -48.9
Source: ECB.
Note: MFIs include Eurosystem.
ANNEX

39ECB
Occasional Paper No 126
July 2011
REFERENCES
REFERENCES
Altunbas, Y., Manganelli, S. and Marques-Ibanez, D. (2011), Business models and bank risk during the Great Recession, unpublished manuscript.
Avdjiev, S., Schrimpf, A., Upper, C. and Vause, N. (2011), “Highlights of international banking
and fi nancial market activity”, BIS Quarterly Review, Bank for International Settlements,
June, pp. 15-28.
Agénor, P.-R. (2003), “Benefi ts and costs of international fi nancial integration: theory and facts”,
The World Economy, Blackwell Publishing, Vol. 26(8), pp. 1089-1118, 08.
Bacchetta, P., Tille, C. and van Wincoop, E. (2010), “Self-fulfi lling risk panics”, CEPR Discussion Paper Series, No 7920.
Baele, L., Ferrando, A., Hördahl, P., Krylova, E. and Monnet, C. (2004), “Measuring fi nancial
integration in the euro area”, Occasional Paper Series, No 14, ECB.
Balli, F., Basher, S.A. and Ozer-Balli, H. (2010), “From home bias to euro bias: disentangling the
effects of monetary union on the European fi nancial markets”, MPRA Paper Series, No 22430,
University of Munich, Germany.
Bank for International Settlements (2009a), Annual Report.
Bank for International Settlements (2009b), Quarterly Review, March.
Bank for International Settlements (2009c), Quarterly Review, June.
Bank for International Settlements (2009d), Quarterly Review, September.
Bernanke, B. S. (2007), Globalisation and monetary policy, speech at the Fourth Economic Summit,
Stanford Institute for Economic Policy Research, Stanford, California, March.
Bertaut, C. and Pounder, L. (2009), “The fi nancial crisis and U.S. cross-border fi nancial fl ows”,
Federal Reserve Bulletin, No 93, pp. A147-A167.
Blanchard, O.J. and Giavazzi, F. (2001), “Macroeconomic effects of regulation and deregulation
in goods and labour markets”, CEPR Discussion Paper Series, No 2713.
Broner, F., Didier, T., Erce, A. and Schmukler, S. (2010), “Financial crises and international
portfolio dynamics”, Economics Working Paper Series, Department of Economics and Business,
Universitat Pompeu Fabra.
Ca’ Zorzi, M. and Rubaszek, M. (2011), “On the empirical evidence of the intertemporal current
account model for the euro area countries”, Review of Development Economics, forthcoming.

40ECB
Occasional Paper No 126
July 2011
Ca’ Zorzi, M., Chudik, A. and Dieppe, A. (2011), “And then current accounts (over)adjusted”,
Empirical Economics, forthcoming.
Caballero, R.J. and Krishnamurthy, A. (2008), “Collective risk management in a fl ight to quality
episode”, Journal of Finance, Vol. 63(5), pp. 2195-2230.
Calvo, G. and Reinhart, C. (1999), “The consequences and management of capital infl ows: lessons
for sub-Saharan Africa”, MPRA Paper Series, No 7901, University of Munich, Germany.
Cardarelli, R., Elekdag, S. and Kose, M.A. (2010), “Capital infl ows: macroeconomic implications
and policy responses”, Economic Systems, Vol. 34, pp. 333-356.
Cetorelli, N. and Goldberg, L.S. (2011), “Global banks and international shock transmission:
Evidence from the crisis”, IMF Economic Review, Vol. 59(1), pp. 41-76.
Constâncio, V. (2010), “Catching up strategies after the crisis”, keynote lecture by the Vice-President
of the ECB, Conference on European Economic Integration, Oesterreichische Nationalbank,
Vienna, 15 November 2010.
De Haas, R., Korniyenko, Y., Loukoianova, E. and Pivovarsky, A. (2011), Foreign banks during the crisis: sinners or saints?, available at SSRN: http://ssrn.com/abstract=1799181.
De Santis, R.A. (2010), “The geography of international portfolio fl ows, international CAPM, and
the role of monetary policy frameworks”, International Journal of Central Banking, Vol. 6(2),
pp. 147-197.
De Santis, R.A. and Gerard, B. (2009), “International portfolio reallocation: diversifi cation benefi ts
and European Monetary Union”, European Economic Review, Vol. 53, pp. 1010-1027.
Diz Dias, J. (2010), “External debt statistics of the euro area”, presented at the IFC Conference on “Initiatives to address data gaps revealed by the fi nancial crisis”, Bank for International
Settlements.
Eichengreen, B. (2007), “The cautious case for capital fl ows”, prepared for Rating Agency Malaysia’s conference on “Free Capital Mobility: What’s in Store for Asia” held in Singapore
on 1 August 2007.
Eichengreen, B. and Park, Y.C. (2003), “Why has there been less fi nancial integration in Asia than
in Europe?”, Working Paper Series, No 4679, Institute of European Studies, UC Berkeley.
Eichner, M.J., Hohn, D.L. and Palumbo, M.G. (2010), “Financial statistics for the United States and
the crisis: what did they get right, what did they miss and how should they change?”, Finance and Economics Discussion Series, Federal Reserve Board.
ECB (2008), Monthly Bulletin, 10th anniversary of the ECB”.
ECB (2010a), Financial integration in Europe, Annual Report on Financial Intergration, April 2010.

41ECB
Occasional Paper No 126
July 2011
REFERENCES
ECB (2010b), “Prospects for real and fi nancial imbalances and a global rebalancing”, Monthly Bulletin, April, pp. 91-100.
European Commission (2009), “Competitiveness developments within the euro area”, special report
in Quarterly Report on the Euro Area, Vol. 8, No 1, March.
European Commission (2010), “Surveillance of intra-euro area competitiveness and imbalances”,
European Economy Series, 1/2010.
Forbes, K.J. and Warnock, F.E. (2011), Capital fl ow waves: surges, stops, fl ight and retrenchment, unpublished manuscript.
Furceri, D., Guichard, S. and Rusticelli, E. (2011), “Episodes of Large Capital Infl ows and the
Likelihood of Banking and Currency Crises and Sudden Stops”, Working Paper Series, No 865,
OECD Economics Department.
Gardo, S. and Martin, R. (2010), “The impact of the global economic and fi nancial crisis on central,
eastern and south-eastern Europe. A stock-taking exercise”, Occasional Paper Series, No 114, ECB.
Giannetti, M. and Ongena, S. (2009), “Financial integration and fi rm performance: Evidence from
foreign bank entry in emerging markets”, Review of Finance, Oxford University Press for
European Finance Association, Vol. 13(2), pp. 181-223.
González-Páramo, J.M. (2010), Globalisation, international fi nancial integration and the fi nancial crisis: The future of European and international fi nancial market regulation and supervision,
speech at the Institute of International and European Affairs, Dublin, 19 February.
Greenspan, A. (1997), Globalization and fi nance, speech at Cato’s 15th Annual Monetary
Conference.
Hartmann, P., Heider, F., Papaioannou, E. and Lo Duca, M. (2007), “The role of fi nancial markets
and innovation in productivity and growth in Europe”, Occasional Paper Series, No 72, ECB.
IMF (2010a), “Europe: Fostering sustainability”, Regional Economic Outlook, World Economic and Financial Surveys.
IMF (2010b), The Fund’s role regarding cross-border capital fl ows, prepared by the Strategy,
Policy and Review Department and the Legal Department, 15 November 2010.
IMF (2011), Recent experiences in managing capital infl ows – Cross cutting themes and possible policy framework, prepared by the Strategy, Policy and Review Department, 14 February 2011.
Kalemli-Ozcan, S., Sørensen, B.E. and Yosha, O. (2003), “Risk sharing and industrials
specialization: Regional and international evidence”, American Economic Review, American
Economic Association, Vol. 93(3), pp. 903-918.
Lane, P.R. and Milesi-Ferretti, G.M. (2007), “The external wealth of nations mark II: Revised
and extended estimates of foreign assets and liabilities, 1970–2004”, Journal of International Economics, 73, November, pp. 223-250.

42ECB
Occasional Paper No 126
July 2011
Manganelli, S. and Popov, A. (2010), “Finance and diversifi cation”, Working Paper Series,
No 1259, ECB.
Milesi-Ferretti, G.-M. and Tille, C. (2011), “The great retrenchment: International capital fl ows
during the global fi nancial crisis”, Economic Policy, Vol. 26, No 66, pp. 285-342.
Moutot, P. and Vitale, G. (2009), “Monetary policy strategy in a global environment”, Occasional Paper Series, No 106, ECB.
OECD (2011), “Getting the most out of international capital fl ows”, OECD Economic Outlook,
No 89, Chapter 6, pp. 287-309.
Ostry, J.D., Ghosh, A.R., Habermeier, K., Chamon, M., Qureshi, M.S. and Reinhard, D.B.S. (2010),
“Capital infl ows: the role of controls”, IMF Staff Position Note, No SPN/10/04.
Poloni, P. and Reynaud, J. (2009), “How to measure credit risk transfer in the EU”, IFC Bulletin
No 31, Measuring fi nancial innovation and its impact, Proceedings of the IFC Conference,
26-27 August 2008, Basel.
Rottier, S. and Veron, N. (2010), “Not all fi nancial regulation is global”, Policy Brief, No PB10-22,
Petersen Institute for International Economics.
van Riet, A. (ed.) (2010), “Euro area fi scal policies and the crisis”, Occasional Paper Series,
No 109, ECB.
Schmitz, B. and von Hagen, J. (2009), “Current account imbalances and fi nancial integration in
the euro area”, CEPR Discussion Paper Series, No 7262.
United Nations Conference on Trade and Development (2009), World investment prospects survey 2009-2011.
Waysand, C., Ross, K. and de Guzman, J. (2010), “European fi nancial linkages: a new look
at imbalances”, Working Paper Series, No WP/10/295, IMF, December.

OCCAS IONAL PAPER SER I E SNO 126 / J ULY 2011
by Katrin Forster,Melina Vasardani and Michele Ca’ Zorzi
EURO AREA
CROSS-BORDER
FINANCIAL FLOWS
AND THE GLOBAL
FINANCIAL CRISIS
Related Documents


