
Welcome message from author
This document is posted to help you gain knowledge. Please leave a comment to let me know what you think about it! Share it to your friends and learn new things together.
Transcript
EURASIAN JOURNAL OF SOIL SCIENCE
(Peer Reviewed Open Access Journal)
Published by Federation of Eurasian Soil Science Societies
EDITORS-IN-CHIEF
Dr.Rıdvan KIZILKAYA Ondokuz Mayıs University, Turkey
Dr.Evgeny SHEIN Moscow State University, Russia
Dr.Coşkun GÜLSER Ondokuz Mayıs University, Turkey
EDITORIAL BOARD SCIENTIFIC EDITORS
Dr.Alexandre F. D’ANDREA, Brazil Dr.Alexander MAKEEV, Russia
Dr.Amrakh I. MAMEDOV, Azerbaijan Dr.Fariz MIKAILSOY, Turkey
Dr.Guilhem BOURRIE, France Dr.Galina STULINA, Uzbekistan
Dr.Guy J. LEVY, Israel Dr.Guguli DUMBADZE, Georgia
Dr.Haruyuki FUJIMAKI, Japan Dr.H. Hüsnü KAYIKÇIOĞLU, Turkey
Dr.İbrahim ORTAŞ, Turkey Dr.İzzet AKÇA, Turkey
Dr.Jae YANG, South Korea Dr.János KÁTAI, Hungary
Dr.Hayriye IBRIKCI, Turkey Dr.Lia MATCHAVARIANI, Georgia
Dr.Léon-Etienne PARENT, Canada Dr.Marketa MIHALIKOVA, Czech Republic
Dr.Metin TURAN, Turkey Dr.Mustafa BOLCA, Turkey
Dr.Mohammad A. HAJABBASI, Iran Dr.Necat AĞCA, Turkey
Dr.Mihail DUMITRU, Romania Dr.Pavel KRASILNIKOV, Russia
Dr.Nicolai S. PANIKOV, USA Dr.Ramazan ÇAKMAKCI, Turkey
Dr.Shikui DONG, China Dr.Saglara MANDZHIEVA, Russia
Dr.Sokrat SINAJ, Switzerland Dr.Saoussen HAMMAMI, Tunusia
Dr.Srdjan ŠEREMEŠIĆ, Serbia Dr.Svetlana SUSHKOVA, Russia
Dr.Svatopluk MATULA, Czech Republic Dr.Velibor SPALEVIC, Montenegro
Dr.Tomasz ZALESKI, Poland Dr.Zhainagul YERTAYEVA, Kazakhstan
Dr.Yakov PACHEPSKY, USA ADVISORY EDITORIAL BOARD
Dr.Yury N. VODYANITSKII, Russia Dr.Ajit VARMA, India
DIVISION EDITORS Dr.David MULLA, USA
Dr.Alexsandr RUSANOV, Soil Erosion & Conservation, Russia Dr.Donald GABRIELS, Belgium
Dr.Aminat UMAROVA, Soil Physics, Russia Dr.İsmail ÇAKMAK, Turkey
Dr.David PINSKY, Soil Chemistry, Russia Dr.Nicola SENESI, Italy
Dr.Elena SKVORTSOVA, Soil Mineralogy & Micromorphology, Russia HONORARY BOARD
Dr.Füsun GÜLSER, Soil Fertility, Turkey Dr.Abdulla SAPAROV, Kazakhstan
Dr.İmanverdi EKBERLİ, Mathematical Modelling in Soil Sci., Turkey Dr.Ayten NAMLI, Turkey
Dr.Kadir SALTALI, Soil Salinity & Alkalinity, Turkey Dr.Ermek BAIBAGYSHOV, Kyrgyzstan
Dr.Nadezhda VERKHOVTSEVA, Soil Biology & Biochemistry, Russia Dr.Garib MAMADOV, Azerbaijan
Dr.Nazlı Dide KUTLUK YILMAZ, Soil-Borne Pathogens, Turkey Dr.Hamid ČUSTOVIĆ, Bosnia & Herzegovina
Dr.Nikolay KHITROV, Soil Genesis, Classification & Mapping, Russia Dr.Milivoj BELİĆ, Serbia
Dr.Orhan DENGİZ, Geography Information System, Turkey Dr.Sergei SHOBA, Russia
Dr.Sait GEZGİN, Plant Nutrition & Fertilization, Turkey Dr.Valentina VOICU, Romania
Dr.Salih AYDEMİR, Soil Management & Reclamation, Turkey LINGUISTIC EDITOR
Dr.Sezai DELİBACAK, Soil Health & Quality, Turkey Gregory T. SULLIVAN, Australia
Dr.Taşkın ÖZTAŞ, Soil Mechanic & Technology, Turkey Oksana FOTINA, Russia
Dr.Tatiana MINKINA, Soil Pollution, Russia Birol KURT, Turkey
Dr.Tayfun AŞKIN, Geostatistics, Turkey Yelena KANDALINA, Kazakhstan
ABOUT THIS JOURNAL : Eurasian Journal of Soil Science is the official English language journal of the Federation of Eurasian Soil Science Societies. Eurasian Journal of Soil Science peer-reviewed open access journal that publishes research articles, critical reviews of basic and applied soil science in all related to soil and plant studies and general environmental soil science.
ABSTRACTING AND INDEXING: SCOPUS, CABI, FAO-Agris, EBSCOhost, ProQuest, DOAJ, OAJI, TR Dizin, TURKISH Journalpark, CrossRef, CiteFactor, CAS, etc.
Year: 2020, Volume: 9, Issue: 2, Page: 85 - 193 e-ISSN 2147-4249
EURASIAN JOURNAL OF SOIL SCIENCE
(Peer Reviewed Open Access Journal)
Published by Federation of Eurasian Soil Science Societies
YEAR: 2020 VOLUME : 9 ISSUE : 2 PAGE : 85 – 193
CONTENTS
Isolation, characterization and screening of PGPR capable of providing relief in salinity stress
Hina Javed, Aneela Riaz, Amjad Qureshi, Komal Javed, Fakhir Mujeeb, Fraza Ijaz, Muhammad Saleem Akhtar, M. Asif Ali, Rehman Gul, Muhammad Aftab
85
Spatial variation of soil weathering processes in the tropical high reliefs of Cameroon (Central Africa)
Désiré Tsozué, Simon Djakba Basga, Aubin Nzeugang Nzeukou
92
Effect of potassium levels on teff (Eragrostis tef (Zucc.) Trotter) growth and yield in Central Highland Vertisols of Ethiopia
Mulugeta Demiss, Tekalign Mamo, Sheleme Beyene, Selamyihun Kidanu
105
Impact of No-Till on physicochemical properties of Vertisols in Chaouia region of Morocco
Rachid Aboutayeb, Brahim El Yousfi, Oussama El Gharras
119
Use of sewage sludge in agricultural soils: Useful or harmful
Sezai Delibacak , Lyudmila Voronina, Ekaterina Morachevskaya, Ali Rıza Ongun
126
Quantifying the role of chemical weathering rates on soil developed along an altitudinal transect in the mountainous environments, Turkey
Omar Alsalam, Cevdet Şeker, Mert Dedeoğlu
140
The evaluation of basal respiration and some chemical properties of soils under cover crop treatments in a cherry orchard
Zeynep Demir
151
Accumulating capacity of herbaceous plants of the Asteraceae and Poaceae families under technogenic soil pollution with zinc and cadmium
Victor Chaplygin, Saglara Mandzhieva, Tatiana Minkina, Svetlana Sushkova, Anatolii Barahov, Dina Nevidomskaya, Rıdvan Kızılkaya, Coşkun Gülser, Natalia Chernikova, Mahmoud Mazarji, Luydmila Iljina, Vishnu Rajput
165
Changes in selected soil properties across a chronosequence of exclosures in the central dry lowlands of Ethiopia
Fikrey Tesfay, Kibebew Kibret, Aster Gebrekirstos, Kiros Meles Hadigu
173
Efficiency of using the rangeland hydrology and erosion model for assessing the degradation of pastures and forage lands in Aydarly, Kazakhstan
Maira Kussainova, Kenneth E. Spaeth, Ermekkul Zhaparkulova
186
H. Javed et al. / Eurasian J Soil Sci 2020, 9(2) 85 - 91
85
Isolation, characterization and screening of PGPR capable of providing relief in salinity stress
Hina Javed a,*, Aneela Riaz a, Amjad Qureshi a, Komal Javed b, Fakhir Mujeeb a Fraza Ijaz a, Muhammad Saleem Akhtar a, M. Asif Ali a, Rehman Gul c, Muhammad Aftab a
a Ayub Agriculture Research Institute, Faisalabad, Pakistan b University of Agriculture, Faisalabad, Pakistan
c Soil and Water Testing Lab for Research, Lahore, Pakistan
Abstract Article Info Received : 15.05.2019 Accepted : 05.11.2019
Environmental stresses such as drought, temperature, salinity, air pollution, heavy metals, pesticides, and soil pH are major limiting factors in crop production because they affect almost all plant functions. Soil salinization is a serious stress condition causing major problem for crop productivity. To combat this salinity stress, Plant growth promoting rhizobacteria (PGPR) is considered as innovative, effective and ecofriendly approach. Plant growth promoting rhizobacteria (PGPR) have various direct and indirect mechanisms which can be correlated with their ability to form biofilms, chemotaxis, and the production of exopolysaccharide, indole-3-acetic acids (IAA) and aminocyclopropane-1- carboxylate (ACC) deaminase Investigations on the interaction of PGPR with other microbes and their effect on the physiological response of crop plants under different soil salinity regimes are still at an incipient stage. An experiment was conducted to investigate the effect of PGPR on lowering down the salt stress. Treatments were control (T1), Salt tolerant isolate KH-1 (T2), Salt tolerant isolate KH-2 (T3), Salt tolerant isolate KH-3 (T4), PGPR-I (Pseudimonas) (T5), PGPR-II (Azotobacter) (T6). Rice was sown under saline conditions at Soil Salinity Research Institute, Pindi Bhattian. With the inoculation of salt tolerant PGPR, plant growth and yield was improved. Result showed significant increase in plant height, biomass and yield over control. Inoculation of salt tolerant isolate KH-2 produced maximum grain yield in rice (4267 kg/ha) followed by PGPR-II and it was statistically significant from all other treatments along with control. It is concluded that with the application of salt tolerant isolate (KH-2), there is significant increase in rice production.
Keywords: PGPR, abiotic stresses, Azotobacter, Pseudomonas, auxin production.
© 2020 Federation of Eurasian Soil Science Societies. All rights reserved
Introduction Due to salt stress agricultural productivity has been decreased all over the world (Jouyban, 2012). According to an estimate about 20 % of all irrigated and cultivated lands (equivalent to 62 million ha) are negatively affected by salt stress at present time (Khan et al., 2015). In arid and semiarid regions salinity is considered as major hurdle to plant growth and productivity. About 831 mha of land is affected by salt all over the world (FAO, 2008). Agriculture has very special place in Pakistan’s economy. Irrigated agriculture in Pakistan is facing the problem of water-logging and salinity therefore productive lands are continuously going out of cultivation (Chaudhary, 2001). The limited rainfall, high evapotranspiration rate and high temperature are the major causes of salinity in arid and semiarid regions (Neto et al., 2006). The occurrence of physiological and molecular disorders due to salinity is under consideration since many years but the actual process is still unknown (Hasegawa et al., 2000). Due to salinity, synthesis of lipids and protein along with photosynthesis are badly affected in plants (Parida and Das, 2005). Soil salinity is considered as great threat all over the world that affects nearly one billion hectare land and has an adverse effect on crop production of productive lands (Rengasamy, 2006) and considered as a major
* Corresponding author. Ayub Agriculture Research Institute, P/239 Street No. 5 Ahmadabad, Faisalabad, Pakistan Tel.: +92 333 6580868 E-mail address: [email protected] e-ISSN: 2147-4249 DOI: 10.18393/ejss.650546
H. Javed et al. / Eurasian J Soil Sci 2020, 9(2) 85 - 91
86
challenge to farmers (Flowers and Flowers, 2005). In irrigated areas this problem is more dominant (Flowers, 1999; Zhu, 2001) that is major cause in loss of food production (Munns and Tester, 2008). There is also problem of salinity in dry land regions (Wang et al., 1993; Rengasamy, 2006). In saline condition more salts are present in soils. NaCl is the most dominant in salt effected soils (Zhang et al., 2010). Due to salinity uptake and translocation of Na+ and K+ is affected which results in poor plant growth and metabolism through reduced uptake, nutritional imbalance and toxic effect of some ions. (Nawaz et al., 2002; Tavakkoli et al., 2010). The increased uptake of K results in decreased uptake of K and Ca (Marschner, 1995; Yildirim et al., 2006). The nitrate reductase activity is inhibited by accumulation and uptake of Cl- which in return greatly disturb the photosynthetic activity of plant (Tavakkoli et al., 2000). Salts get accumulated in the intercellular spaces when the capacity of cell to store a specific concentration of salt is exceeded and results in cell dehydration which eventually lead to cell death (Sheldon et al., 2004). Salinity causes a number of biochemical and physiological changes in plant cells that lead to stress symptoms on plants and ultimately reduce growth and development of whole plant (Huang et al., 2012). Plants have different mechanisms to tolerate salinity which includes compartmentation of inorganic ions, adjustment in osmotic balance and reduction in leaf osmotic potential by synthesis of organic solutes etc (Hasegawa et al., 2000).
The use of PGPR is one approach to solve the issue of salinity. Different plant growth promoting rhizobacteria (PGPR) residing near the roots of plants have been reported to provide beneficial effects by different direct and indirect processes. These bacteria have ability to combat salinity stress by different mechanisms which include production of indole-3-acetic acid (IAA), production of ACC-deaminase, solubilization of phosphorus, exopolysaccharide production, production of volatile compounds etc. Auxin (IAA) production by PGPR which stimulates the production of flavonoids by plants, improves nitrogen fixation, nodulation and nutrient uptake which in turn reduced the harmful effects caused by salinity (Dodd and Pérez-Alfocea, 2012). Ethylene act as inhibitor when released during stress by plants and causes reduction in legume’s nodulation. In plants the pathway of production of ethylene is Yang cycle in which ACC oxidase enzyme is responsible for the conversion of ACC into ethylene (Tilak et al., 2005). Plant growth promoting rhizobacteria (PGPR) have ability to produce enzyme 1-aminocyclopropane-1-carboxylic acid deaminase (ACC-D), which is actually a precursor of ethylene and reduces the level of ethylene during salt stress (Glick, 2014; Choudhary et al., 2015). The AAC deaminase producing PGPR attached to the root of plants and uptake ACC which is released from plant roots and then hydrolyze it (Glick et al., 1998.) Many scientist have reported in reduction of salinity stress through ACC-D containing PGPR and thus improve plant growth (Glick, 2010; Ahmed and Farag 2011).
Microbial secreted exopolysaccharides (EPS) are responsible for chelation of surplus ions and decreases the availability of these ions (Na+) to plants. (Choudhary et al., 2015). PGPR are responsible to solubilize the insoluble nutrients like iron, zinc, potassium and phosphorus by secreting organic acids in the rhizosphere which in turn increases the uptake of nutrients by plants. One novel approach of PGPR is the production of VOCs (Volatile Organic Compounds) which are responsible for signalling between plant and microbe. Specific strains of bacteria releases volatile compounds increased the growth of plants by variable processes like osmoprotectant biosynthesis, nutrient uptake, hormone distribution and sodium homeostasis (Singh et al., 2008; Liu and Zhang, 2015). Mitigation of salinity by PGPR inoculants has been shown in rice, wheat, maize, cotton, lettuce, tomato and pepper (da Costa et al., 1998, Bacilio et al., 2004; Parida and Das 2005).
Pakistan is the world's 11th largest producer of rice. Pakistan's exports make up 8% of world's total rice trade. It is an important crop in the agriculture economy of Pakistan. Rice is an important Kharif crop. In the year 2016/17, Pakistan produced 6.7 million tonnes, of which around 4 million were exported, mainly to neighbouring countries, the Middle East and Africa. Rice is grown in fertile lands of Sindh and Punjab region where millions of farmers rely on rice cultivation as their major source of employment. Among the most famous varieties grown in Pakistan include the Basmati, known for its flavour and quality. Pakistan is a major producer of this variety.
The objective of this research is the isolation and characterization of salt tolerant PGPR from salt affected areas. Based on IAA production and their growth promotion abilities, selected bacterial isolates were tested for growth and production of rice under salinity conditions in field experiment.
Material and Methods Isolation of salt tolerant bacteria Soil samples were collected from Kheura salt mines situated in Pind Dadan Khan and its nearby areas from rhizosphere of different plants. Samples were shifted to lab and store under cold condition (4 ºC) for further proceedings. Salt tolerant bacteria (STB) were isolated from dilution plate technique on LB medium
H. Javed et al. / Eurasian J Soil Sci 2020, 9(2) 85 - 91
87
(Tryptophane; 10, NaCl; 10, Yeast; 5, Agar; 20g/L). From the preserved soil samples, one gram of soil was weighed and different dilutions were made. Dilutions were spread on petri plates containing LB agar medium and incubated at 28±2 ºC. After growth of bacterial colonies, the isolates having glycery and proliferating growth were frequently streak on LB medium to get purified colonies. Isolated colonies were preserved at -40℃ in glycerol solution. Characterization of selected isolates Selected bacterial isolates were characterized for IAA production activity (Sarwar et al., 1992). To diagnose the bacterial auxin production the method of Sarwar et al. (1992) was followed. For this 25 mL of General Purpose Media (GPM) media was autoclaved and cooled and inject with bacterial isolates @ 1 mL/flask. The solution was incubated (28 ± 1 ◦ C for 48 hours) and filtered through Whatman No. 2. The filtrate (3ml) was taken and 2 ml Salkowski’s reagent (98 mL of 35% HClO4 +2.0 mL of 0.5 M FeCl3) was added. The samples were run on spectrophotometer at 535nm wavelength. An un-inoculated control with GPM broth was also prepared for comparison. Screening of bacteria for plant growth promotion activities under controlled conditions An experiment was planned in growth room to check the efficiency of bacteria for growth promotion under normal and controlled condition (Temp 30-35℃). A pot experiment was conducted in the growth room of Soil Bacteriology Section, AARI, Faisalabad, Pakistan. Ten pre isolated salt tolerant isolates were used to check microbial effect on rice growth. Growth parameters were studied after 10 days of seed germination. On the basis of growth parameters (Root and shoot length, and dry biomass), 3 best growth promoting bacterial isolates were selected for further study. Two pre isolated isolates PGPR-I (Pseudomonas) and PGPR-II (Azotobacter) were also used in this experiment. Completely randomized design (CRD) was used for this experiment. Field Experiment Field experiment on rice was conducted at the Soil Salinity Research Institute, Pindi Bhattian having EC=06. The main objective of this study was to analyze the effectiveness of salt tolerant bacteria on growth and yield parameters by adaptations against the salt stress conditions on field level. Rice variety Super Basmati was used for the experiment. The statistical design was randomized complete block design (RCBD) having three replicates. Treatments were T1=control, T2=KH-1, T3=KH-2, T4=KH-3, T5=PGPR I (Pseudomonas) and T6=PGPR II (Azotobacter). Statistical Analysis The analysis of data was done by using analysis of variance technique (ANOVA) with RCBD (Steel et al., 1997). For this purpose, software Statistix 8.1 was used and arithmetic means were compared by using least significant difference (LSD) test.
Results The present study was conducted to discover the efficiency of salt tolerant bacteria as suppressor of the salt stresses. Isolation, screening and characterization of salt tolerant bacteria (STB) The salt tolerant bacteria were isolated from different plant rhizosphere by using dilution plate technique on LB media. Total 20 isolates were isolated from rhizosphere and characterized on the basis of auxin production. Ten isolates were carefully chosen and screened on growth promotion basis through bioassay in lab and three promising isolates wee then selected on the basis of maximum root/shoot elongation. These three isolates along with two pre-isolated PGPR were tested in field conditions having highly saline soils. Auxin production (μg mL-1) Data expressed the potential of various isolates to produce auxin (as IAA equivalents). The data related to auxin production is presented in Table 1. All isolates produced auxin in broth culture. The maximum auxin production as IAA equivalents was recorded in KH-1 bacterial isolate (13 μg mL-1) followed by KH-2 and KH-3 (11.8 μg mL-1) and it was statistically different from control. The IAA produced by bacterial isolates could be useful with plants especially when interacted with plant exudates that may help the IAA production potential of the bacteria (Harrison et al., 2002; Rani et al., 2012).
Table 1. Auxin level of different isolate Isolates Auxin (μg mL-1) Isolates Auxin (μg mL-1) Isolates Auxin (μg mL-1) Control 2.8 j KH-7 5.8 fghi KH-14 10.0 bc KH-1 13.0 a KH-8 8.6 cde KH-15 4.1 hij KH-2 11.8 ab KH-9 7.8 cdef KH-16 8.8 cde KH-3 11.8 ab KH-10 6.3 fgh KH-17 9.5 cd KH-4 5.0 ghij KH-11 7.5 def KH-18 9.5 bcd KH-5 6.7 efg KH-12 4.9 ghij KH-19 6.3 fgh KH-6 3.8 ij KH-13 6.9 efg KH-20 7.5 def
H. Javed et al. / Eurasian J Soil Sci 2020, 9(2) 85 - 91
88
Screening of bacteria for plant growth promotion activity through bioassay
Data regarding shoot/root length and biomass are shown in Table 2. The inoculation of bacterial isolates in abiotic stress conditions showed positive response on growth. Maximum shoot length (40.7 cm) was observed in isolate KH-1 and showed significant difference statistically from control. The root length, shoot fresh biomass and root fresh biomass was also showed higher response upon inoculation as compared to control. Among the bacterial isolates KH-10 showed minimum response towards inoculation. The improvement in plant physical parameters may be the result of production of different plant growth regulators and siderophores (Kloepper et al., 1989; Arshad and Frankenberger Jr., 1998).
Table 2. Effect of STB on growth parameters
Isolates Shoot Length (cm) Root length (cm) Shoot fresh biomass (g) Root fresh biomass (g) Control 28.6 d 25.6 e 2.31 de 2.45 de KH-1 40.7 a 45.9 a 3.98 a 4.49 a KH-2 38.4 ab 32.4 cd 3.24 bcd 3.98 bc KH-3 32.4 cd 39.8 bc 3.12 cd 4.24 ab KH-14 39.6 ab 29.6 de 2.56 cde 3.14 cde KH-18 35.4 bc 28.4 de 2.35 cde 3.56 bcd KH-17 36.4 abc 41.5 ab 3.39 ab 3.32 cd KH-16 34.2 cde 32.5 cd 3.56 bc 3.28 cd KH-8 39.6 ab 36.7 bcd 3.48 bc 3.92 bc KH-9 37.6 abc 35.9 bc 2.98 cd 3.52 bcd KH-11 32.3 cd 33.9 cd 3.48 bc 3.21 cd
Yield parameters
Data of field trial showed that with the inoculation of salt tolerant PGPR plant growth and yield was significantly improved. Result showed that bacterial inoculation significantly enhanced the plant height, biomass, yield and no. of tillers over control.
Plant Height
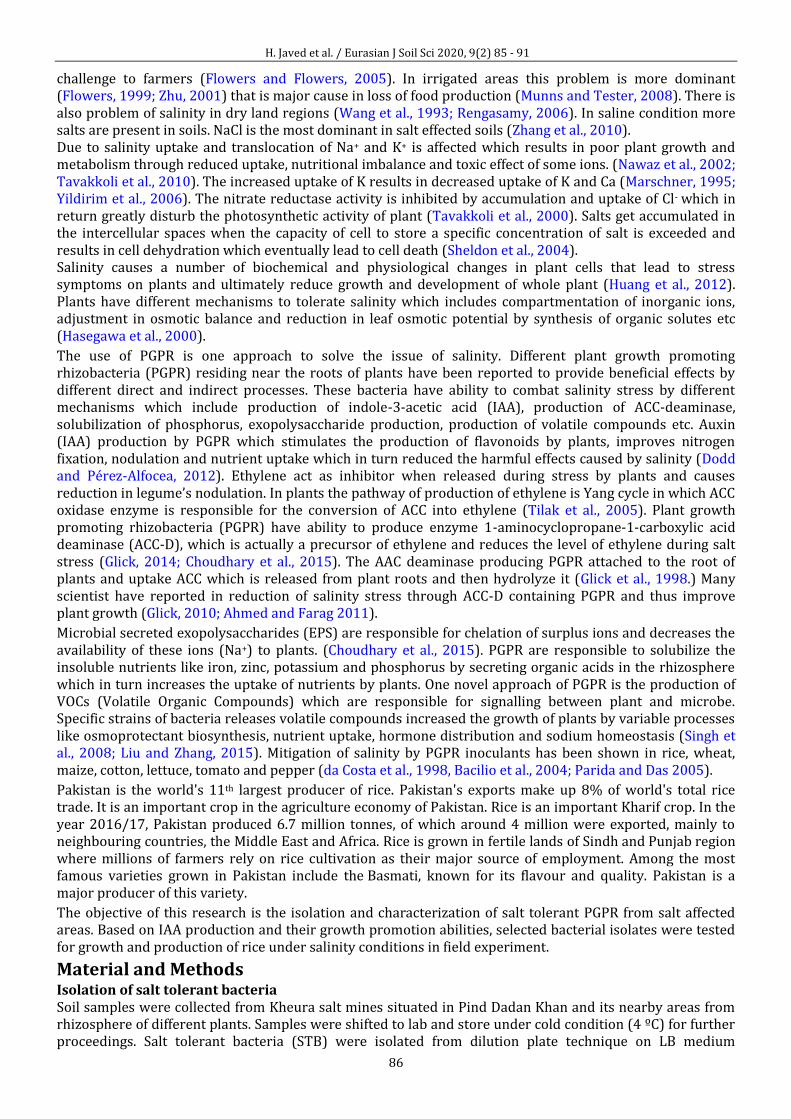
According to the results (Figure 1) plant height was increased upon inoculation over control and maximum (132.7 cm) was observed in case of KH-2 inoculation. As compare to control (110.0cm) plant height was increased in all other treatments. In case of PGPR II (Azotobacter) inoculation plant height was more (127.7 cm) as compared to PGPR I (Pseudomonas) inoculation (121.0 cm). Similarly in case of KH-1 plant height was more (124.3 cm) as compared to KH-3 (121.7 cm). But in case of KH-2 plant height was maximum (132.7 cm). So, KH-2 showed the more pronounced response as compare to all other treatments. In case of salt tolerant bacteria KH-2 showed better response and in case of PGPR II (Azotobacter) showed better results.
Figure 1. Effect of salt tolerant isolates and rhizobacteria on
plant height of rice at SSRI, Pindi Bhattian
No. of Tillers
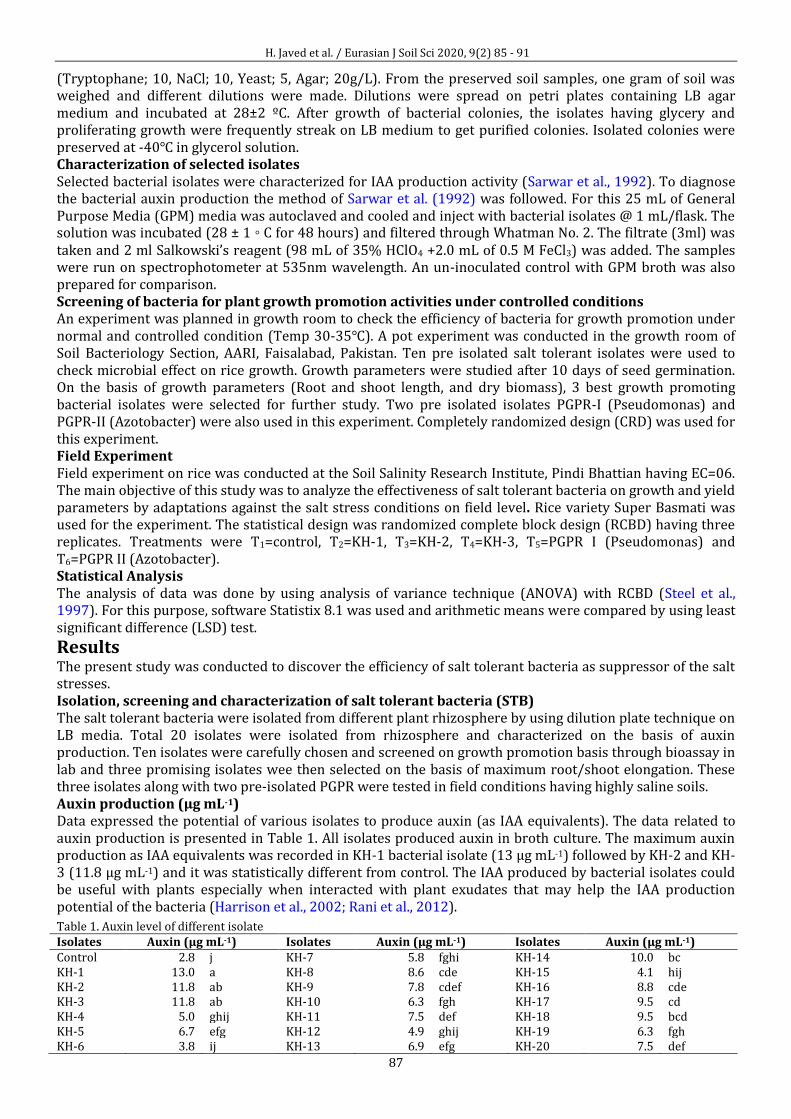
In case of number of tillers (Figure 2) same trend was found as in plant height. KH-2 showed more pronounced effect as compared to other isolates. As compared to control numbers of tillers (27) were more in all other treatments. In case of PGPR more number of tillers was found in PGPR II (Azotobacter) (41) as compare to PGPR I (Pseudomonas) (36). In case of salt tolerant bacteria maximum number of tillers (46) were found in KH-2 as compare to KH-1 (35) and KH-3 (30). So under salt stress conditions KH-2 shows better response as compare to other isolates.
Figure 2. Effect of salt tolerant isolates and rhizobacteria on
tillers/m2 in rice at SSRI, Pindi Bhattian
H. Javed et al. / Eurasian J Soil Sci 2020, 9(2) 85 - 91
89
Straw Yield
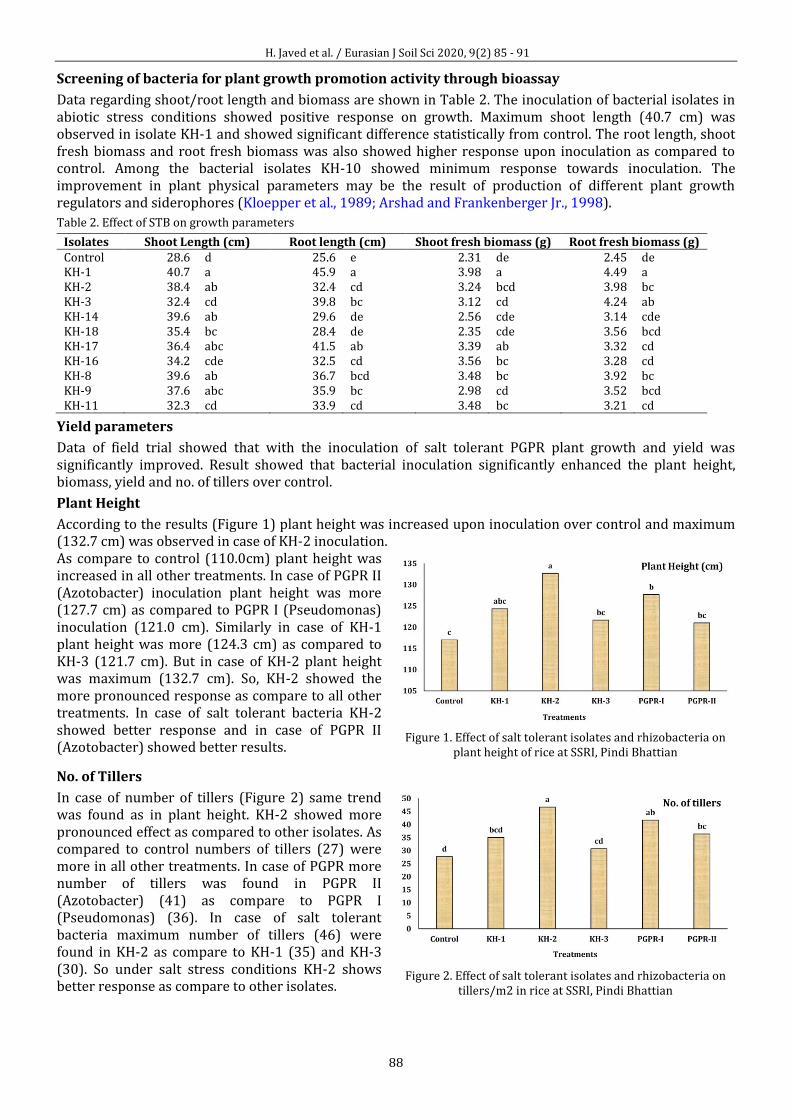
Straw yield of rice was increased by the inoculation of salt tolerant bacteria and PGPR (Figure 3). In case of salt tolerant bacteria maximum straw yield was found by KH-2 (13.83 t/ha) as compare to KH-1 (12.61 t/ha) and KH-3 (12.25 t/ha). In case of PGPR II (Azotobacter) and PGPR I (Pseudomonas) inoculation trend in straw yield 12.81 and 12.20 t/ha respectively.
Figure 3. Effect of salt tolerant isolates and rhizobacteria on rice paddy yield at SSRI, Pindi Bhattian
Paddy Yield
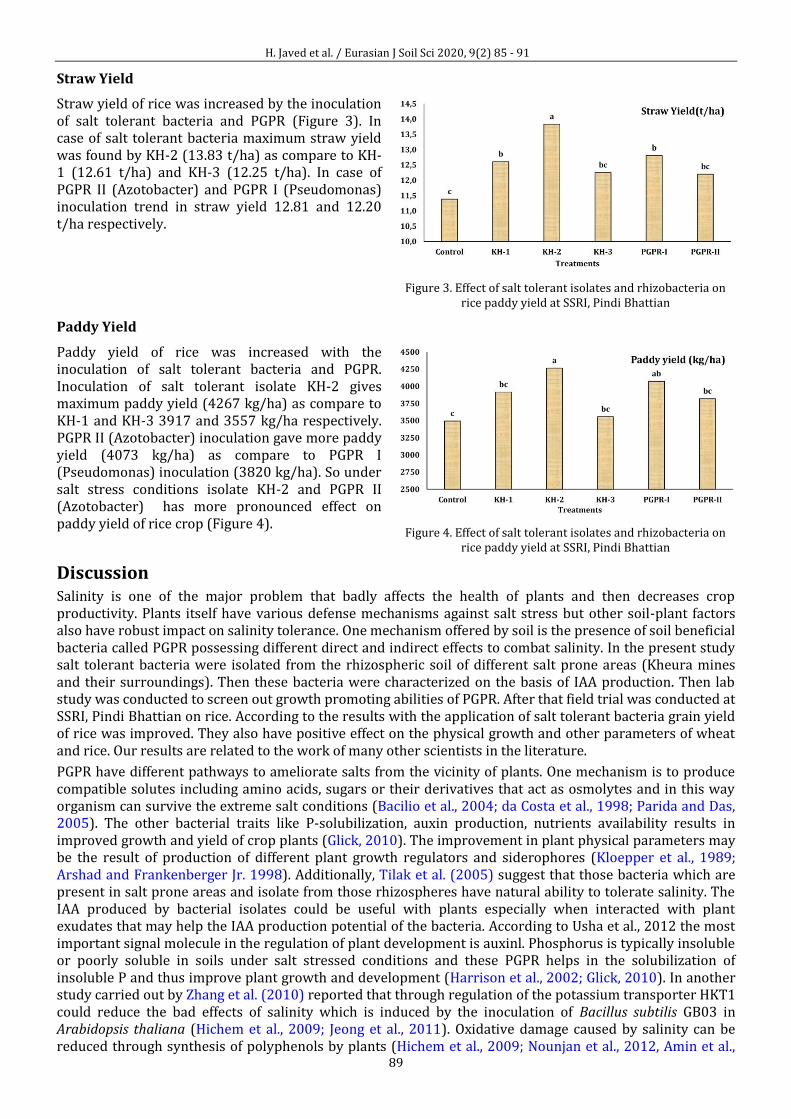
Paddy yield of rice was increased with the inoculation of salt tolerant bacteria and PGPR. Inoculation of salt tolerant isolate KH-2 gives maximum paddy yield (4267 kg/ha) as compare to KH-1 and KH-3 3917 and 3557 kg/ha respectively. PGPR II (Azotobacter) inoculation gave more paddy yield (4073 kg/ha) as compare to PGPR I (Pseudomonas) inoculation (3820 kg/ha). So under salt stress conditions isolate KH-2 and PGPR II (Azotobacter) has more pronounced effect on paddy yield of rice crop (Figure 4).
Figure 4. Effect of salt tolerant isolates and rhizobacteria on rice paddy yield at SSRI, Pindi Bhattian
Discussion Salinity is one of the major problem that badly affects the health of plants and then decreases crop productivity. Plants itself have various defense mechanisms against salt stress but other soil-plant factors also have robust impact on salinity tolerance. One mechanism offered by soil is the presence of soil beneficial bacteria called PGPR possessing different direct and indirect effects to combat salinity. In the present study salt tolerant bacteria were isolated from the rhizospheric soil of different salt prone areas (Kheura mines and their surroundings). Then these bacteria were characterized on the basis of IAA production. Then lab study was conducted to screen out growth promoting abilities of PGPR. After that field trial was conducted at SSRI, Pindi Bhattian on rice. According to the results with the application of salt tolerant bacteria grain yield of rice was improved. They also have positive effect on the physical growth and other parameters of wheat and rice. Our results are related to the work of many other scientists in the literature.
PGPR have different pathways to ameliorate salts from the vicinity of plants. One mechanism is to produce compatible solutes including amino acids, sugars or their derivatives that act as osmolytes and in this way organism can survive the extreme salt conditions (Bacilio et al., 2004; da Costa et al., 1998; Parida and Das, 2005). The other bacterial traits like P-solubilization, auxin production, nutrients availability results in improved growth and yield of crop plants (Glick, 2010). The improvement in plant physical parameters may be the result of production of different plant growth regulators and siderophores (Kloepper et al., 1989; Arshad and Frankenberger Jr. 1998). Additionally, Tilak et al. (2005) suggest that those bacteria which are present in salt prone areas and isolate from those rhizospheres have natural ability to tolerate salinity. The IAA produced by bacterial isolates could be useful with plants especially when interacted with plant exudates that may help the IAA production potential of the bacteria. According to Usha et al., 2012 the most important signal molecule in the regulation of plant development is auxinl. Phosphorus is typically insoluble or poorly soluble in soils under salt stressed conditions and these PGPR helps in the solubilization of insoluble P and thus improve plant growth and development (Harrison et al., 2002; Glick, 2010). In another study carried out by Zhang et al. (2010) reported that through regulation of the potassium transporter HKT1 could reduce the bad effects of salinity which is induced by the inoculation of Bacillus subtilis GB03 in Arabidopsis thaliana (Hichem et al., 2009; Jeong et al., 2011). Oxidative damage caused by salinity can be reduced through synthesis of polyphenols by plants (Hichem et al., 2009; Nounjan et al., 2012, Amin et al.,
H. Javed et al. / Eurasian J Soil Sci 2020, 9(2) 85 - 91
90
2016). Co-inoculation of PGPR with Rhizobium improved plant dry matter significantly upon control (Rahman et al., 2016). Similar findings were reported by Qureshi et al. (2011) who observed a significant increase in concentration of nutrients in grains and other parts of plants by co-inoculation of Bacillus and Rhizobium in a pot experiment.
Conclusion All the bacterial isolates showed high resistance to salinity stress. All the bacterial isolates showed significant improvement in plant growth parameters as compared to control. Among the salt tolerant isolates (KH-1, KH-2, KH-3), KH-2 performed better followed by PGPR II (Azotobacter). The grain yield of rice was also significantly increased by these two treatments over other treatments as well as control.
References
Ahmed, H.M.I., Farag, M.M.A., 2011. Alleviation of salinity stress in lettuce during germination by seed priming. Journal of Plant Production - Mansoura University 2(5): 725–737
Amin, U.S.M., Biswas, S., Elias, S.M., Razzaque, S., Haque, T., Malo, R., Seraj, Z.I., 2016. Enhanced salt tolerance conferred by the complete 2.3 kb cDNA of the rice vacuolar Na+/H+ antiporter gene compared to 1.9 kb coding region with 5′ UTR in transgenic lines of rice. Frontiers in Plant Science 7: 14.
Arshad, M., Frankenberger Jr., W.T., 1998. Plant growth-regulating substances in the rhizosphere: Microbial production and functions. Advances in Agronomy 62: 45-151.
Bacilio, M., Rodriguez, H., Moreno, M., Hernandez, J.P., Bashan, Y., 2004. Mitigation of salt stress in wheat seedlings by a gfp-tagged Azospirillum lipoferum. Biology and Fertility of Soils 40(3) 188–193.
Chaudhary, M.R. 2001. Gypsum efficiency in the amelioration of saline sodic/sodic soils. International Journal of Agriculture and Biology 3(3):276-280.
Choudhary, D.K., Kasotia, A., Jain, S., Vaishnav, A., Kumari, S., Sharma, K.P., Varma, A., 2015. Bacterial-mediated tolerance and resistance to plants under abiotic and biotic stresses. Journal of Plant Growth Regulation 35(1): 276–300.
da Costa, M., H. Santos and E. Galinski. 1998. An overview of the role and diversity of compatible solutes in Bacteria and Archaea. In: Biotechnology of Extremophiles. Antranikian, G. (Ed.). Springer, Volume 61, pp. 117–153.
Dodd, I.C., Pérez-Alfocea, F., 2012. Microbial amelioration of crop salinity stress Journal of Experimental Botany 63(9): 3415–3428.
FAO, 2008. Global network on integrated soil management for sustainable use of salt-affected soils. Food and Agriculture Organization of the United Nations, Land and Plant Nutrition Management Service, Rome, Italy.
Flowers, T.J., 1999. Salinisation and horticultural production. Scientia Horticulturae (Amsterdam) 78: 1–4. Flowers, T.J., Flowers, S.A., 2005. Why does salinity pose such a difficult problem for plant breeders? Agricultural Water
Management 78(1-2): 15–24. Glick, B.R, Penrose, D.M., Li, J., 1998. A model for the lowering of plant ethylene concentrations by plant growth-
promoting bacteria. Journal of Theoretical Biology 190(1): 63–68. Glick, B.R., 2010. Using soil bacteria to facilitate phytoremediation. Biotechnology Advances 28(3): 367–374. Glick, B.R., 2014. Bacteria with ACC deaminase can promote plant growth and help to feed the world. Microbiological
Research 169(1):30–39. Harrison, M.J., Dewbre, G.R., Liu, J., 2002. A phosphate transporter from medicago truncatula ınvolved in the acquisition
of phosphate released by arbuscular mycorrhizal fungi. The Plant Cell 14: 2413-2429. Hasegawa, P.M., Bressan, R.A., Zhu, J.K., Bohnert, H.J., 2000. Plant cellular and molecular responses to high salinity.
Annual Review of Plant Physiology and Plant Molecular Biology 51: 463-499. Hichem, H., El Naceur, A., Mounir, D., 2009. Effects of salt stress on photosynthesis, PSII photochemistry and thermal
energy dissipation in leaves of two corn (Zea mays L.) varieties. Photosynthetica 47(4): 517-526. Huang, G.T., Ma, S.L., Bai, L.P., Zhang, L., Ma, H., Jia, P., Liu, J., Zhong, M., Guo, Z.F., 2012. Signal transduction during cold,
salt, and drought stresses in plants. Molecular Biology Reports 39(2): 969–987. Jeong, J.S., Kim, Y.S., Baek, K.H., Jung, H., Ha, S.H., Do Choi, Y., Kim, M., Reuzeau, C., Kim, J.K., 2010. Root-specific
expression of OsNAC10 improves drought tolerance and grain yield in rice under field drought conditions. Plant Physiology 153(1): 185–197.
Jouyban, Z., 2012. The effects of salt stress on plant growth. Technical Journal of Engineering and Applied Sciences 2(1): 7-10.
Khan, K., Agarwal, P., Shanware, A., Sane, V.A., 2015. Heterologous expression of two Jatropha Aquaporins imparts drought and salt tolerance and ımproves seed viability in transgenic Arabidopsis thaliana. PLoS One 10(6): e0128866.
Kloepper, J.W., Lifshitz, R., Zablotowicz, R.M., 1989. Free-living bacterial inocula for enhancing crop productivity. Trends in Biotechnology 7(2): 39-43.
Liu, X.M., Zhang, H., 2015. The effects of bacterial volatile emissions on plant abiotic stress tolerance. Frontiers in Plant Science 6: 774.
Marschner, H., 1995. Mineral nutrition of higher plants. London: Academic Press. 889p. Munns, R., Tester, M., 2008. Mechanisms of salinity tolerance. Annual Review of Plant Biology 59: 651–681.
H. Javed et al. / Eurasian J Soil Sci 2020, 9(2) 85 - 91
91
Nawaz, S. Akhtar, N. Aslam, M. Qureshi, R.H., Akhtar, J., 2002. Anatomical, morphological and physiological changes in sunflower varieties because of NaCl salinity. Pakistan Journal of Soil Science 21:87-93.
Neto, A.A.D., Prisco, J.T., Enéas-Filho, J., Abreu, C.E.B., Gomes-Filho, E., 2006. Effect of salt stress on antioxidative enzymes and lipid peroxidation in leaves and roots of salt-tolerant and salt-sensitive maize genotypes. Environmental and Experimental Botany 56(1): 87-94.
Nounjan, N., Nghia, P.T., Theerakulpisut, P., 2012. Exogenous proline and trehalose promote recovery of rice seedlings from salt-stress and differentially modulate antioxidant enzymes and expression of related genes. Journal of Plant Physiology 169(6): 596–604.
Parida, A.K., Das, A.B., 2005. Salt tolerance and salinity effects on plants: a review. Ecotoxicology and Environmental Safety 60(3): 324–349.
Qureshi, M.A., Shakir, M.A., Iqbal, A., Akhtar, N., Khan, A., 2011. Co-inoculation of phosphate solubilizing bacteria and rhizobia for improving growth and yield of mungbean (Vigna radiata L.). Journal of Animal and Plant Sciences 21(3): 491-497.
Rahman, M.A., Thomson, M.J., Shah-E-Alam, M., de Ocampo, M., Egdane, J., Ismail, A.M., 2016. Exploring novel genetic sources of salinity tolerance in rice through molecular and physiological characterization. Annals of Botany 117(6): 1083–1097.
Rani, M.U., Arundhathi, A., Reddy, G., 2012. Screening of rhizobacteria containing plant growth promoting (PGPR) traits in rhizosphere soils and their role in enhancing growth of pigeon pea. African Journal of Biotechnology 11(32): 8085-8091.
Rengasamy, P., 2006. World salinization with emphasis on Australia. Journal of Experimental Botany 57(5): 1017–1023. Sarwar, M., Arshad, M., Martins, D.A., Frankenberger Jr, W.T., 1992. Tryptophan-dependent biosynthesis of auxins in
soil. Plant and Soil 147(2): 207-215. Sheldon, A., Menzies, N.W., Bing, S.H., Dalal, R.C., 2004. The effect of salinity on plant available water. Supersoil 2004:
3rd Australian/New Zealand Soils Conference. 5 – 9 December 2004. Sydney, Australia. Available at [access date: 19.02.2019]: http://www.regional.org.au/au/asssi/supersoil2004/s6/poster/1523_sheldona.htm
Singh, A.L., Hariprassanal, K., Solanki, R.M., 2008. Screening and selection of groundnut genotypes for tolerance of soil salinity. Australian Journal of Crop Science 1(3):69-77.
Steel, R.G.D., Torrie, J.H., Dickey, D.A., 1997. Principles and procedures of statistics: a biometrical approach. 3rd ed. McGraw-Hill, New York, USA. 666p.
Tavakkoli, E., Rengasamy, P., McDonald, G.K., 2010. High concentrations of Na+ and Cl− ions in soil solution have simultaneous detrimental effects on growth of fava bean under salinity stress. Journal of Experimental Botany 61(15): 4449–4459.
Tilak, K.V.B.R., Ranganayaki, N., Pal, K.K., De, R., Saxena, A.K., Nautiyal, C.S., Mittal, S., Tripathi, A.K., Johri, B.N., 2005. Diversity of plant growth and soil health-supporting bacteria. Current Science 89(1): 136-150.
Wang, M.Y., Siddiqi, M.Y., Ruth, T.J., Glass, A.D.M., 1993. Ammonium uptake by rice roots (I. Fluxes and subcellular distribution of 13NH4
+). Plant Physiology 103: 1249–1258. Yildirim, E., Taylor, A.G., Spittler, T.D., 2006. Ameliorative effects of biological treatments on growth of squash plants
under salt stress. Scientia Horticulturae 111(1): 1-6. Zhang, J.L., Flowers, T.J., Wang, S.M., 2010. Mechanisms of sodium uptake by roots of higher plants. Plant and Soil 326:
45–60. Zhu, J.K., 2001. Plant salt tolerance. Trends in Plant Science 6(2): 66-71.
D. Tsozué et al. / Eurasian J Soil Sci 2020, 9 (2) 92 - 104
92
Spatial variation of soil weathering processes in the tropical high reliefs of Cameroon (Central Africa)
Désiré Tsozué a,*, Simon Djakba Basga b, Aubin Nzeugang Nzeukou c
a Department of Earth Sciences, Faculty of Science, University of Maroua, P.O. Box 814, Maroua, Cameroon b Institute of Agricultural Research for Development (IRAD), P.O. Box 415 Garoua, Cameroon
c Local Materials Promotion Authority (MIPROMALO), P.O. Box 2396, Yaoundé, Cameroon
Abstract Article Info Received : 06.12.2018 Accepted : 11.12.2019
The objective of the present work was to characterize the morphological, geochemical and mineralogical features of soil with regard to weathering processes as a function of topography and spatial variation of climate in tropical high reliefs of Cameroon. Field investigations permit to select three study sites Mbalam, Meleta and Secande respectively in the humid tropical zone, pseudotropical mountainous zone and in the tropical dry climate. Macroscopically, the studied soils are thick in Mbalam, medium thick in Meleta and relatively less thick in Secande. Globally, saprolite, a loose loamy clayey horizon and humiferous horizon were observed from the bottom to the top of the profiles. These profiles differ by their thickness, the differentiation of the saprolite horizons and the presence of humiferous horizons. They are characterized microscopically by in situ replacement of primary minerals by kaolinite/halloysite, gibbsite and iron oxides. Theses minerals are associated to anatase in Mbalam and to montmorilonite and calcite in Secande. Geochemical processes involving in the spatial differentiation of soils are monosiallitisation and allitisation in the humid tropical zone, monosiallitisation and high allitisation in the pseudotropical mountainous zone with Al2O3 content reaching 41% in the saprolite, and monosiallitisation associated to bisiallitisation in the tropical dry climate of Cameroon. The development of these geochemical processes is conditioned by topography, elevation, rainfall and temperature, which appear as the main factors responsible of the spatial variation of soil weathering processes in the tropical high reliefs of Cameroon.
Keywords: Spatial variation, weathering processes, soil, tropical high reliefs, Cameroon.
© 2020 Federation of Eurasian Soil Science Societies. All rights reserved
Introduction The humid inter-tropical zone constitutes an original and extreme morphogenetic milieu. It is where the bioclimatic weathering mechanisms are most developed in the earth surface (Tricart, 1961). In almost all environments, physical and chemical weathering processes operate together, but usually one of these categories dominates. Although water plays a role in both weathering processes, it is essential for all types of chemical weathering. The meteoric water is the most important factor. It dissolves CO2 from the atmosphere, which is needed to alter minerals and rocks, interacts with them and the vegetation it directly influences, and transports dissolved elements and particles to rivers and oceans (Nahon, 2003). The amount of rainwater that falls on the surface of the continents is decisive on the rates of deterioration and thus on the balance sheets. Therefore, where liquid water is absent, biogeochemical weathering is also virtually absent or negligible and largely dominated by physical weathering (Nahon, 2003; Gabler et al., 2008). Chemical weathering, then, is a dominant process in humid tropical regions, favouring formation of deeply weathered profiles (Voicu and Bardoux, 2002; Nahon, 2003; Gabler et al., 2008). Temperature is another principal climatic variable which influences dominant types and rates of weathering. Most chemical reactions proceed
* Corresponding author. Department of Earth Sciences, Faculty of Science, University of Maroua, P.O Box 814, Maroua, Cameroon Tel.: +237675121489 E-mail address: [email protected] e-ISSN: 2147-4249 DOI: 10.18393/ejss.659830
D. Tsozué et al. / Eurasian J Soil Sci 2020, 9 (2) 92 - 104
93
faster at higher temperatures. Low-latitude regions with humid climates consequently experience the most intense chemical weathering (Tardy, 1993; Gabler et al., 2008).
In the tropical environments, the study of rock weathering and its products concerns various geo-disciplines including soil science, geology, geochemistry, geomorphology and civil engineering. Each of these disciplines has historically been involved with the description and/or interpretation of weathered materials (Ehlen, 2005; Gracheva, 2011; Bétard, 2012). However, most studies focusing on weathering deal with the description and/or dating of vertical variations of weathered materials at the profile scale (Herrmann et al., 2007; Nguetnkam et al., 2008; Beauvais, 2009). Soils are globally deep and well differentiated, and landforms appear rounded in humid tropical environment (Gabler et al., 2008; Beauvais, 2009). Although chemical weathering is somewhat less extreme in the mid-latitude humid climates, his influence is apparent in the moderate soil depth and rounded forms of most landscapes in those regions (Gabler et al., 2008). Only a few studies bear on spatial variations of soil weathering processes and their controlling factors at the landscape scale (Bourgeon, 2001; Scarciglia et al., 2005; Bétard, 2012), though in Cameroon, climate varies from humid tropical rainforest in the Southern part to tropical dry savannah in the Far North (Suchel, 1987). In addition, spatial studies of rock weathering and its products devoted exclusively to high reliefs in this humid tropical zone are very rare. The present research focuses on soil developed in the high reliefs of Cameroon. The objectives are (i) to characterize the morphological, geochemical and mineralogical variations in soil properties as a function of topography and spatial variation of climate and (ii) to identify the factors that control soil weathering processes in these high reliefs of tropical zone characterized by steep environmental gradients and their variation along the latitude.
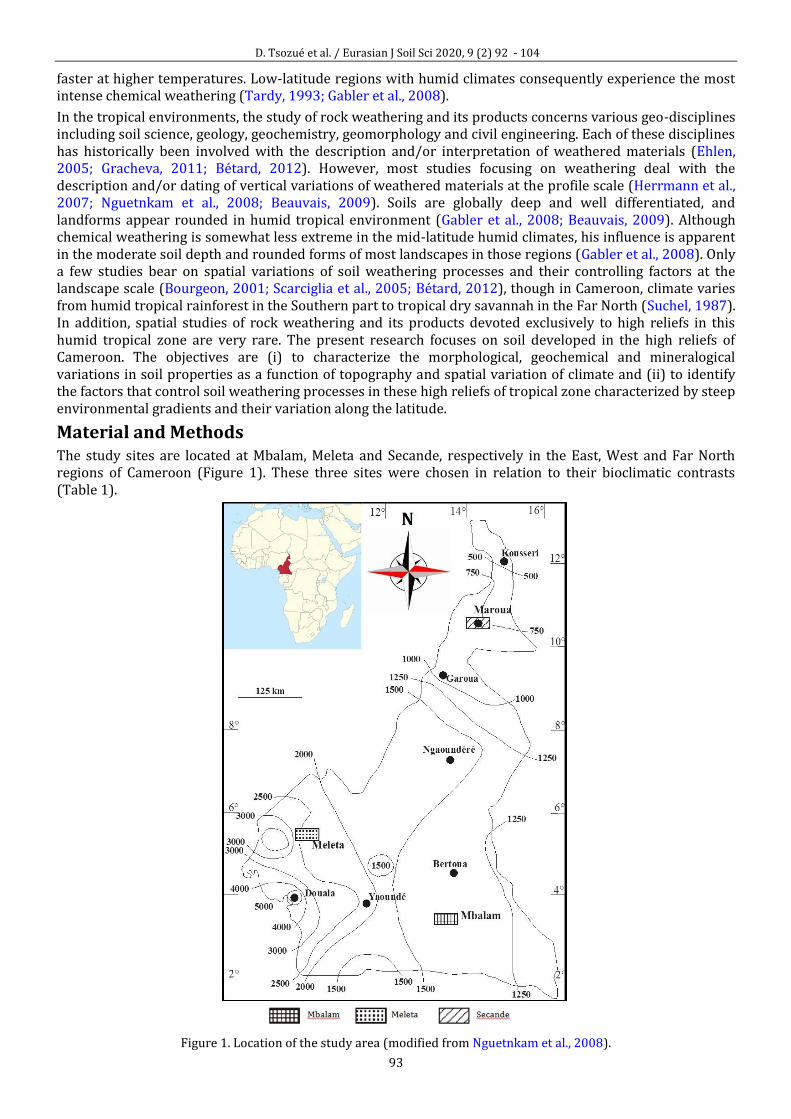
Material and Methods The study sites are located at Mbalam, Meleta and Secande, respectively in the East, West and Far North regions of Cameroon (Figure 1). These three sites were chosen in relation to their bioclimatic contrasts (Table 1).
Figure 1. Location of the study area (modified from Nguetnkam et al., 2008).
D. Tsozué et al. / Eurasian J Soil Sci 2020, 9 (2) 92 - 104
94
Table 1. Characteristics of the three bioclimatic zones of Cameroon.
Characteristics Bioclimatic zones
Mbalam Meleta Secande Location South Cameroon West Cameroon North Cameroon Latitude 3°43'33''N-3°44'45''N 5°36'43''-5°38'31''N 10°35'00''-10°40'30'' N Longitude 13°23'30''E-13°24'30''E 10°04'16''-10°05'49''E 14°16'04''-14°21'34'' E Altitude 840m 2740m 640m
Climate Humid tropical (Suchel, 1987)
Pseudotropical with temperate characteristics due to altitude (Morin, 1988)
Dry tropical (Suchel, 1987)
Mean annual rainfall 1640 mm 2507mm 757.2 mm Mean annual air temperature
23°C 10-12°C 28.53°C
Vegetation Evergreen forest (Letouzey, 1985)
lawn ( Sporobolus prairies) strongly degraded by human activities (Morin, 1988)
Ephemeral grasses, strongly degraded by human activities (Letouzey, 1985)
Relief Half-orange hills, narrow and outstretched valleys (Olivry, 1986)
Mountainous (Morin, 1988) Mountainous
Slope gradient Gentle (6-10%) Steep Gentle to steep
Bedrock Garnet-rich micaschist (Vicat, 1998)
Trachyte (Marzoli et al., 1999; Nono et al., 2004; Gountié et al., 2012).
Microgabbro (Dumort and Peronne, 1966; Lasserre,1975).
Field work consisted firstly of morphological analysis of different topographic profiles in the three study sites. One soil pit was thereafter opened in the high topographic position in each site, described in detail and sampled for laboratory analyses. In the laboratory, soil pH was measured potentiometrically in a 1:2.5 soil: solution ratio (Guitián and Carballas, 1976). Bulk density was determined by clod method (Blake and Hartge, 1986). Optical microscope observations were done on rock and soil thin sections. For soil descriptions, the concepts and terms of Stoops (2003) were used. Soil mineralogy was determined by X-ray diffraction (XRD) on total soil powder. Clay fraction was not separated. X-ray diffraction patterns were recorded at room temperature using a classical powder diffractometer (X'pert Pro/Philips PW3710) instrument equipped with Ni-filtered and Cu anode (quartz monochromator, K-α1 wavelength =1.5405600) operating at 45 kV and 40 mA. This Philips PW3710 instrument operates in continuous scan mode and in step scan mode range from 2° to 70°, with 2θ step of 0.02° and counting time of 0.50s per step. Minerals were identified using XRD coupled with standard saturation (K), solvation (ethylene glycol), and heat (550 °C) treatments (USDA, 2004). X-ray fluorescence for major element analysis was executed with a Philips spectrometer (PW 1404 WD) on total samples powder. Loss on ignition (LOI) was determined by ignition of samples at 1050°C for two hours. The chemical index of alteration (CIA) corresponds to [Al2O3/(Al2O3+CaO*+Na2O+K2O)]×100, where CaO* is the amount of CaO incorporated in the silicate fraction of fresh rock while Na2O, K2O and Al2O3 are their concentrations in the analysed soil samples (Nesbitt and Young, 1982).
Results Morphological, mineralogical and geochemical features of high reliefs’ soils in the humid tropical rainforest of Mbalam
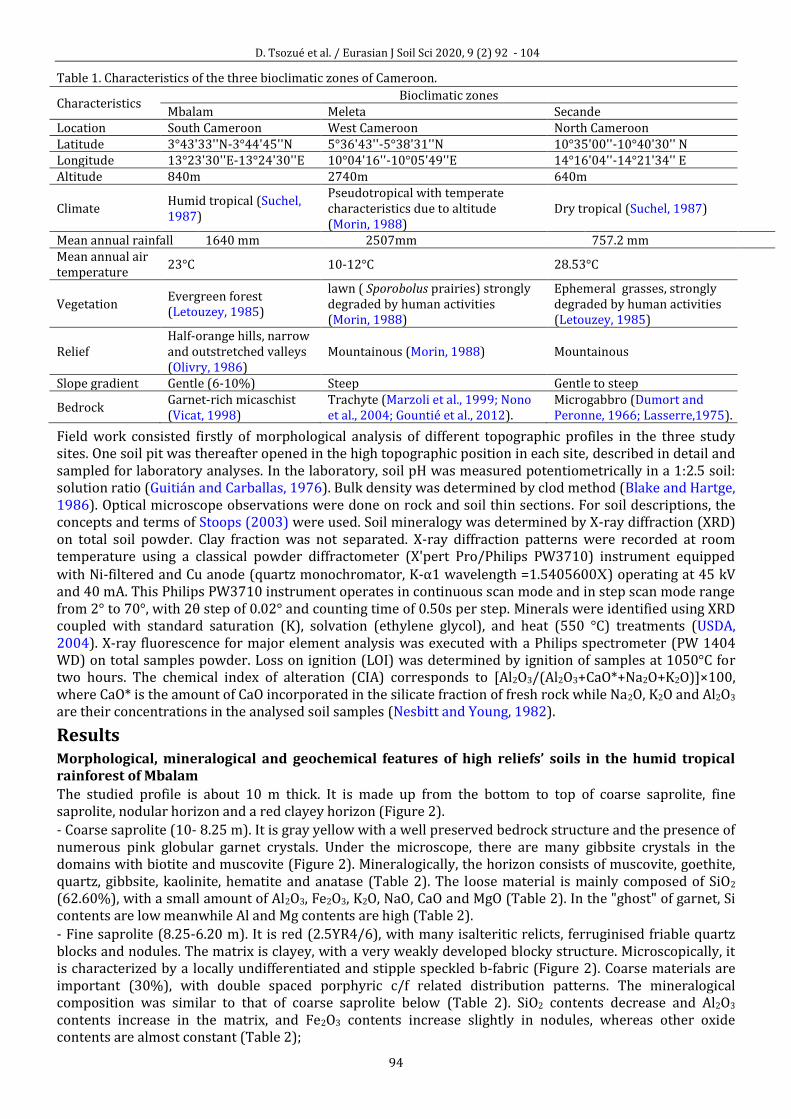
The studied profile is about 10 m thick. It is made up from the bottom to top of coarse saprolite, fine saprolite, nodular horizon and a red clayey horizon (Figure 2).
- Coarse saprolite (10- 8.25 m). It is gray yellow with a well preserved bedrock structure and the presence of numerous pink globular garnet crystals. Under the microscope, there are many gibbsite crystals in the domains with biotite and muscovite (Figure 2). Mineralogically, the horizon consists of muscovite, goethite, quartz, gibbsite, kaolinite, hematite and anatase (Table 2). The loose material is mainly composed of SiO2 (62.60%), with a small amount of Al2O3, Fe2O3, K2O, NaO, CaO and MgO (Table 2). In the "ghost" of garnet, Si contents are low meanwhile Al and Mg contents are high (Table 2).
- Fine saprolite (8.25-6.20 m). It is red (2.5YR4/6), with many isalteritic relicts, ferruginised friable quartz blocks and nodules. The matrix is clayey, with a very weakly developed blocky structure. Microscopically, it is characterized by a locally undifferentiated and stipple speckled b-fabric (Figure 2). Coarse materials are important (30%), with double spaced porphyric c/f related distribution patterns. The mineralogical composition was similar to that of coarse saprolite below (Table 2). SiO2 contents decrease and Al2O3 contents increase in the matrix, and Fe2O3 contents increase slightly in nodules, whereas other oxide contents are almost constant (Table 2);
D. Tsozué et al. / Eurasian J Soil Sci 2020, 9 (2) 92 - 104
95
Figure 2. Macroscopic and microscopic organization of soil profile in Mbalam
- Nodular horizon (6.20-4.60 m). It is red (2.5YR4/6), clayey, with fine blocky structure and about 40% of nodules. Under the microscope, nodules are orange-brown (birefringent) or darker, and undifferentiated. The mineralogical composition was similar to that of other horizons below (Table 2). Si, Al and Fe are the most abundant elements both in the matrix (57.38% SiO2, 15.03 Al2O3, 5.62% Fe2O3) and in the nodules (47.23% SiO2, 15.83% Al2O3, 8.12% Fe2O3). K2O, MgO, Na2O and CaO contents remain almost constant but well represented here as in the other horizons (Table 2);
Table 2. Geochemical characteristics of soils developed in the high reliefs in the humid tropical rainforest of Mbalam.
Horizons
Micaschist (Total rock)
Micaschist (Garnet grains)
Coarse saprolite
(Fine earth)
Coarse saprolite
("ghost" of garnet)
Fine saprolite
(Fine earth)
Fine saprolite
(Nodules)
Nodular horizon
(Fine earth)
Nodular horizon
(Nodules)
Set of clayey
and loose horizons
Depth (m) / / 9 m 9 m 8 m 8 m 5.5 m 5.5 m 1.25 m SiO2 64.01 34.79 62.60 44.23 50.68 42.98 57.38 47.23 52.04 Al2O3 14.40 19.34 14.03 19.82 20.34 18.34 15.03 15.83 20.12 Fe2O3 6.91 31.16 6.12 5.65 6.02 7.31 5.62 8.12 6.23 CaO 3.01 8.07 2.43 2.20 2.01 2.96 3.13 2.40 1.92 MgO 4.20 0.56 1.98 4.34 3.12 3.01 2.13 2.11 2.70 Na2O 2.50 0.00 3.11 2.23 2.10 3.36 2.20 3.24 1.32 K2O 2.08 0.00 3.23 1.38 4.01 2.42 3.12 3.08 4.02 TiO2 0.71 0.06 0.56 1.21 0.99 1.08 0.79 1.11 0.66 P2O5 0.15 0.16 0.31 0.12 0.26 0.31 0.27 0.24 0.09 LOI 2.37 / 6.75 18.53 9.97 17.53 10.36 16.55 10.70 Total 100.34 94.14 101.12 99.70 99.50 99.30 100.03 99.91 99.80
Al
Si / / 4.00 2.00 2.23 2.10 3.42 2.67 2.32
CIA 65.48 70.56 60.00 62.92 69.04 56.97 64.34 52.38 70.67 pH / / 5.2 / 4.4 4.4 4.6 5.2 4.7
Mu: muscovite : 9.96 Å, 9.93 Å, 4.47 Å ; K: kaolinite :7.17 Å, 7.19 Å, 7.21 Å ; Gi: gibbsite : 4.85 Å ; Goe: goethite :4.97 Å, 4.17 Å ; Q: quartz : 4.26 Å, 3.34 Å; He: hematite :2.69 Å, 1.45 Å ; A: anatase : 3.51 Å; F: Feldspar; B: biotite; Ga : garnet.
D. Tsozué et al. / Eurasian J Soil Sci 2020, 9 (2) 92 - 104
96
- Set of red clayey and loose horizons (4.60-0 m). It is constituted of matrix identical to that described in the nodular horizon and a very thin surficial humiferous horizon (0.08 to 0 m). The groundmass has a moderately to highly separated microstructure (Figure 2). Nodules are rare. Coarse materials are important (10 to 20%). It is characterized by double spaced porphyric to open porphyric c/f related distribution patterns. The mineralogical composition was similar to that of other horizons below (Table 2). Si, Al and Fe are the most abundant elements (52.04% SiO2, 20.12% Al2O3, 6.23% Fe2O3). They are followed by K (4.02% K2O), Mg (2.70% MgO), Ca (1.92% CaO) and Na (1.32% Na2O) which remain present here as in the other horizons (Table 2).
Morphological, mineralogical and geochemical features of high reliefs’ soils in the humid tropical mountainous of Meleta
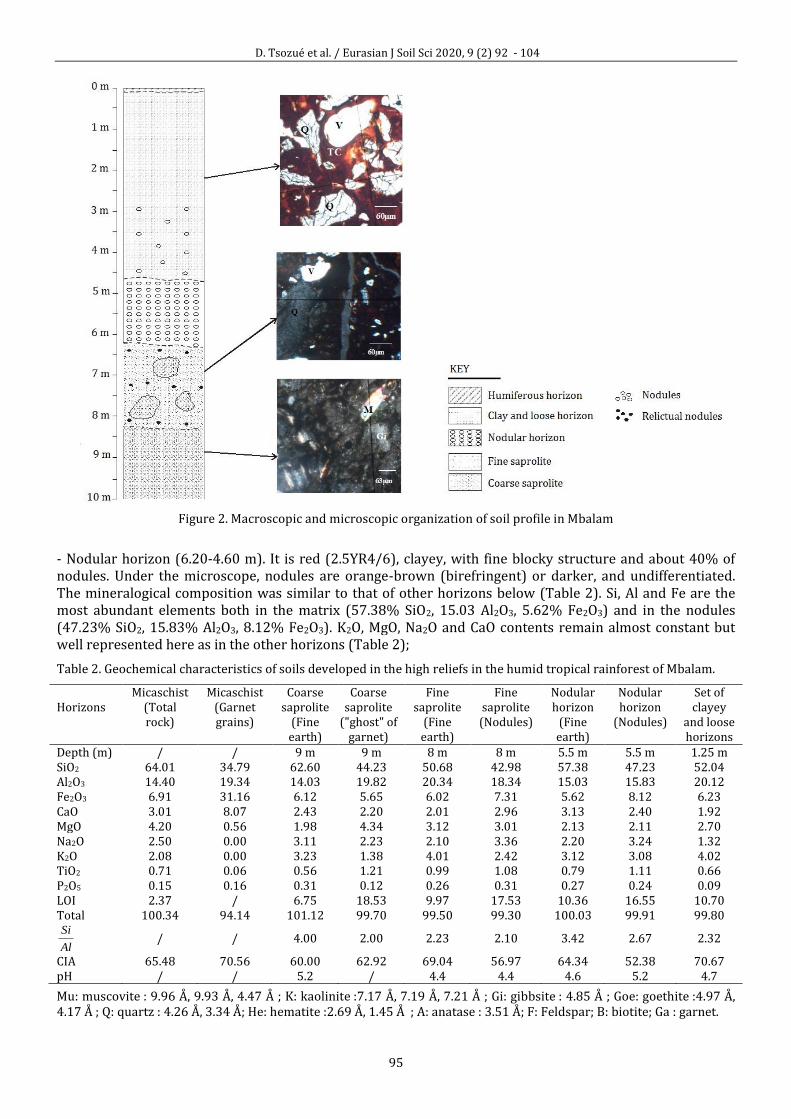
The studied profile in the humid mountainous zone of Meleta is about 2 m thick. It constituted of three horizons, which are from bottom to top: a saprolite, a yellowish red horizon and a black humiferous horizon (Figure 3).
Figure 3. Macroscopic and microscopic organization of soil profile in Meleta.
- Saprolite (2-0.75m). It is composed of yellow brown (10YR6/8) and whitish gray (7.5YR7/0) domains. It is porous, characterized by loamy texture and massive structure, with a well preservation of the structure of the parent rock. Under the microscope, sanidine phenocrysts are partially or totally pseudomorphosed by gibbsite microcrystals (Figure 3). It is constituted of gibbsite, halloysite, quartz, magnetite, goethite and sanidine. On the geochemical point of view, the most important oxides are Al (41.10-39.10% Al2O3), Si (23.50-22.70% SiO2) and Fe (8.94-6.63% Fe2O3). Little quantities of Ti (0.44-0.73 % TiO2) and P (0.25-0.29% P2O5) are detected. The alkali and alkaline earth elements quantities are very weak (Table 3).
Table 3. Geochemical characteristics of soils developed in the high reliefs in the humid tropical mountainous of Meleta.
Horizons Alkaline trachyte Saprolite Yellowish red clayey and loose horizon
Black humiferous horizon
Depth (m) / 1.25-2 m 0.75-1.25 m 0.45-0.75 m 0-0.45 m SiO2 58.00 22.70 23.50 23.80 21.50 Al2O3 18.40 42.10 39.10 34.00 20.30 Fe2O3 5.63 6.63 8.94 8.75 7.05 CaO 2.10 0.01 0.00 0.08 0.23 MgO 0.41 0.09 0.13 0.29 0.30 Na2O 6.56 0.00 0.00 0.20 0.15 K2O 5.23 0.08 0.12 0.60 0.48 TiO2 0.44 0.44 0.73 1.08 0.97 P2O5 0.14 0.25 0.29 0.32 0.35 LOI 2.01 26.20 28.00 30.20 48.10 Total 98.92 98.50 100.66 99.30 99.13
Al
Si / 0.49 0.54 0.63 0.95
CIA 56.98 95.08 94.62 92.14 88.15 pH / 5.4 5.3 5.0 3.9 Mineralogy Sa Px Op Sa Ma Ha Gi Q Ma Ha Gi Goe Q Ma Ha Gi Goe He Q Ma Ha Gi Goe He Q Ma : magnétite : 2.53 Å; Gi : gibbsite : 4.85 Å; Goe : goethite : 4.18 Å ; Q : quartz : 4.29Å, 3.37Å; He : hématite : 2.69 Å ; Ha : halloysite : 10 Å, 7.20 Å ; Sa : sanidine ; Px : pyroxene ; Op : opaque minerals.
D. Tsozué et al. / Eurasian J Soil Sci 2020, 9 (2) 92 - 104
97
- Yellowish red horizon (0.75-0.45m). Beyond the yellowish red colour (5YR4/4), the horizon is clayey, with a fine blocky structure. Under the microscope, the groundmass has moderate separated subangular blocky microstructure, with compound packing voids and undifferentiated b-fabric (Figure 3). Gibbsite crystals are observed in some voids. In addition to the mineralogical composition noted in the saprolite, hematite is present (Table 3). On the geochemical view point, Al (34.00% Al2O3), Si (23.80% SiO2) and Fe (8.75% Fe2O3) remain the most important oxides. Ti (1.08% TiO2), K (0.60% K2O), P (0.32% P2O5), Mg (0.29% MgO) and Na (0.20% Na2O) are weakly represented and Ca is almost absent (0.08% CaO) (Table 3).
- Humiferous horizon (0.45-0m). It is black (2.5YR2.5/0), characterized by high matrix porosity a loamy texture and a blocky structure. Mineralogically, gibbsite, halloysite, goethite, hematite and quartz still the main minerals (Table 3). On the geochemical view point, Si (21.50% SiO2), Al (20.30% Al2O3) and Fe (7.05% Fe2O3) are also the most important elements. The other elements Ti (0.97% TiO2), K (0.48% K2O), P (0.35% P2O5), Mg (0.30% MgO), Ca (0.23% CaO) and Na (0.15% Na2O) remain weakly represented (Table 3).
Morphological, mineralogical and geochemical features of high reliefs’ soils in the dry tropical zone of Secande
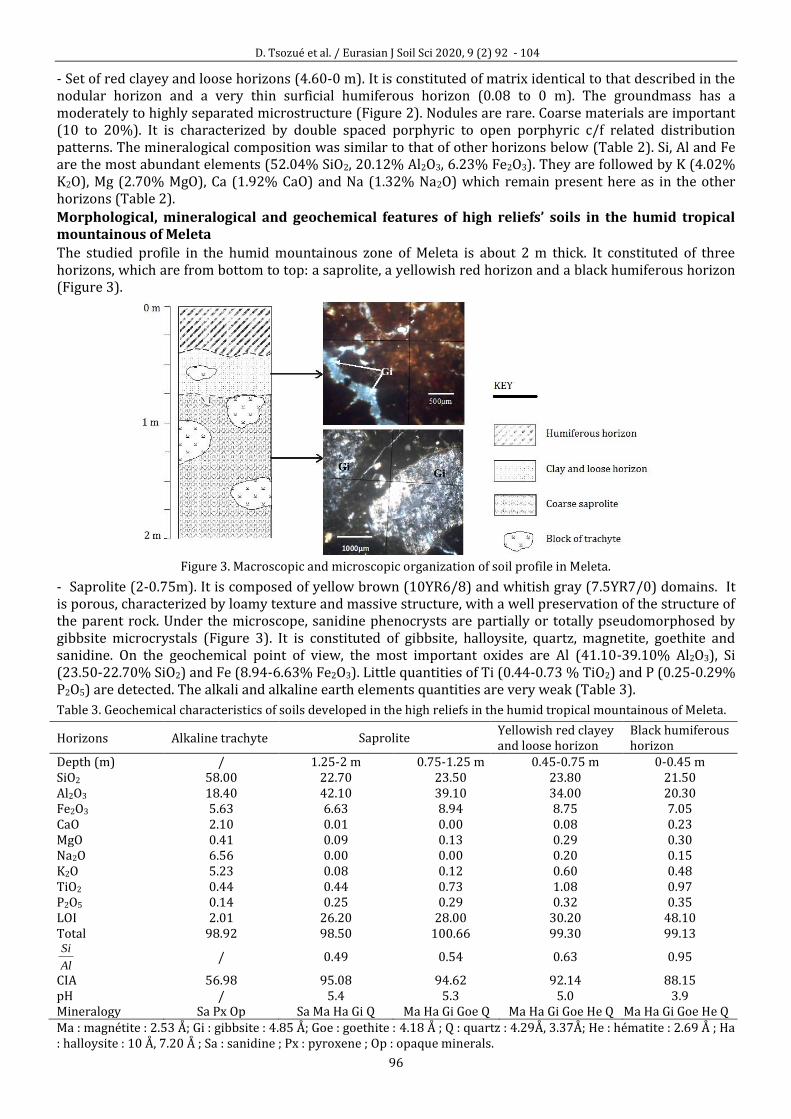
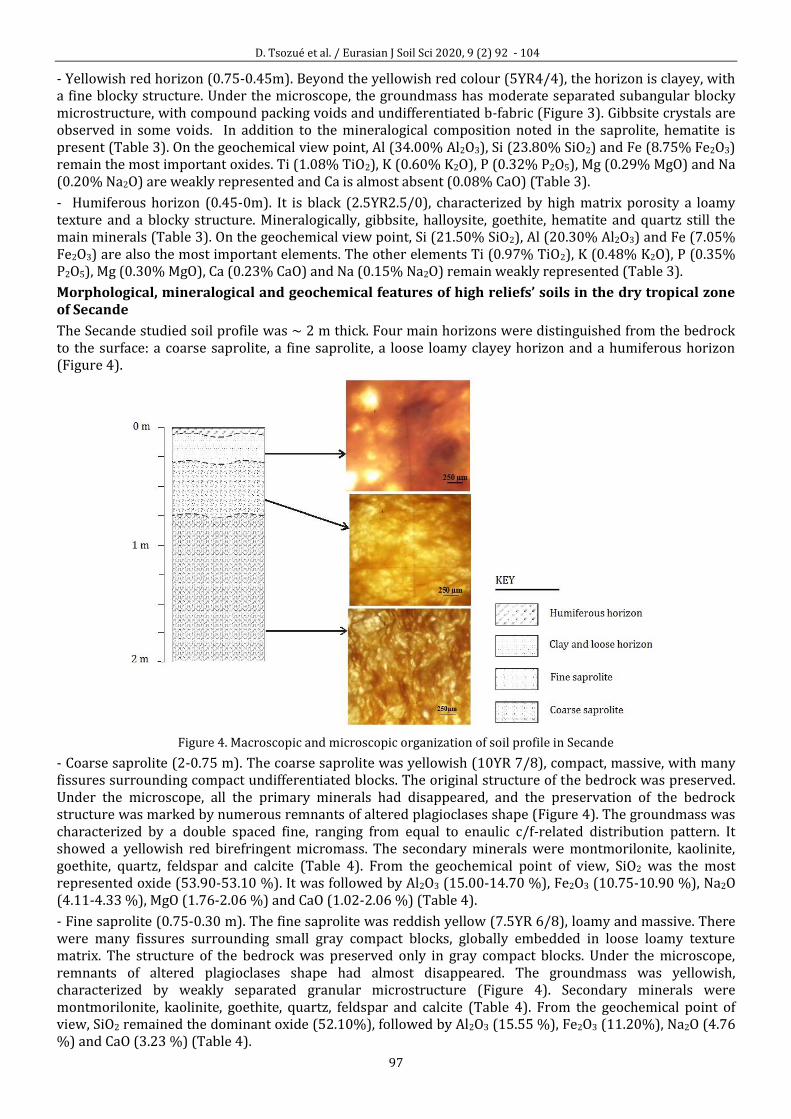
The Secande studied soil profile was ~ 2 m thick. Four main horizons were distinguished from the bedrock to the surface: a coarse saprolite, a fine saprolite, a loose loamy clayey horizon and a humiferous horizon (Figure 4).
Figure 4. Macroscopic and microscopic organization of soil profile in Secande
- Coarse saprolite (2-0.75 m). The coarse saprolite was yellowish (10YR 7/8), compact, massive, with many fissures surrounding compact undifferentiated blocks. The original structure of the bedrock was preserved. Under the microscope, all the primary minerals had disappeared, and the preservation of the bedrock structure was marked by numerous remnants of altered plagioclases shape (Figure 4). The groundmass was characterized by a double spaced fine, ranging from equal to enaulic c/f-related distribution pattern. It showed a yellowish red birefringent micromass. The secondary minerals were montmorilonite, kaolinite, goethite, quartz, feldspar and calcite (Table 4). From the geochemical point of view, SiO2 was the most represented oxide (53.90-53.10 %). It was followed by Al2O3 (15.00-14.70 %), Fe2O3 (10.75-10.90 %), Na2O (4.11-4.33 %), MgO (1.76-2.06 %) and CaO (1.02-2.06 %) (Table 4).
- Fine saprolite (0.75-0.30 m). The fine saprolite was reddish yellow (7.5YR 6/8), loamy and massive. There were many fissures surrounding small gray compact blocks, globally embedded in loose loamy texture matrix. The structure of the bedrock was preserved only in gray compact blocks. Under the microscope, remnants of altered plagioclases shape had almost disappeared. The groundmass was yellowish, characterized by weakly separated granular microstructure (Figure 4). Secondary minerals were montmorilonite, kaolinite, goethite, quartz, feldspar and calcite (Table 4). From the geochemical point of view, SiO2 remained the dominant oxide (52.10%), followed by Al2O3 (15.55 %), Fe2O3 (11.20%), Na2O (4.76 %) and CaO (3.23 %) (Table 4).
D. Tsozué et al. / Eurasian J Soil Sci 2020, 9 (2) 92 - 104
98
Table 4. Geochemical characteristics of soils developed in the high reliefs in the dry tropical zone of Secande
Horizons Microgabbro Coarse saprolite
(Bottom) Coarse
saprolite (Top) Fine saprolite
Loamy clayey horizon
Humiferous horizon
Depth (m) / 2-0.75 0.75-0.30 0.30-0.07 0.07-0 SiO2 48.90 53.90 53.10 52.10 51.60 50.80 Al2O3 16.95 15.00 14.70 15.55 16.25 15.90 Fe2O3 10.55 10.75 10.90 11.20 11.80 11.85 CaO 9.55 1.02 4.22 3.23 3.02 5.12 MgO 6.87 2.06 1.76 1.78 1.68 1.76 Na2O 2.50 4.11 4.33 4.76 3.55 3.02 K2O 1.17 0.46 0.27 0.31 0.24 0.30 TiO2 1.15 1.06 1.14 1.20 1.23 1.20 P2O5 0.20 0.22 0.28 0.21 0.08 0.10 LOI 3.38 9.05 8.88 10.10 11.50 10.30 Total 101.39 100.85 99.81 100.68 101.26 100.62
Al
Si 2.59 3.22 3.24 3.00 2.85 2.86
CIA 56.18 51.51 50.95 51.54 54.92 55.27 pH / 7.50 7.60 7.80 6.70 6.50 Mineralogy A F B Ca Mo K Goe Q F Ca Mo K Goe Q F Ca Mo K Goe Q F Ca Mo K Goe Q F Ca Mo K Goe Q F Ca
Mo= montmorillonite: 10Å, 15.48Å, 17.64Å; K= kaolinite: 7.1Å, 3.57Å; Goe= goethite: 4.17Å, 2.45Å; Q= quartz: 4.29Å, 3.37Å, 2.12Å, 1.82Å; F= feldspath: 3.24; Ca= calcite: 3.89Å; B: biotite; A: amphibole.
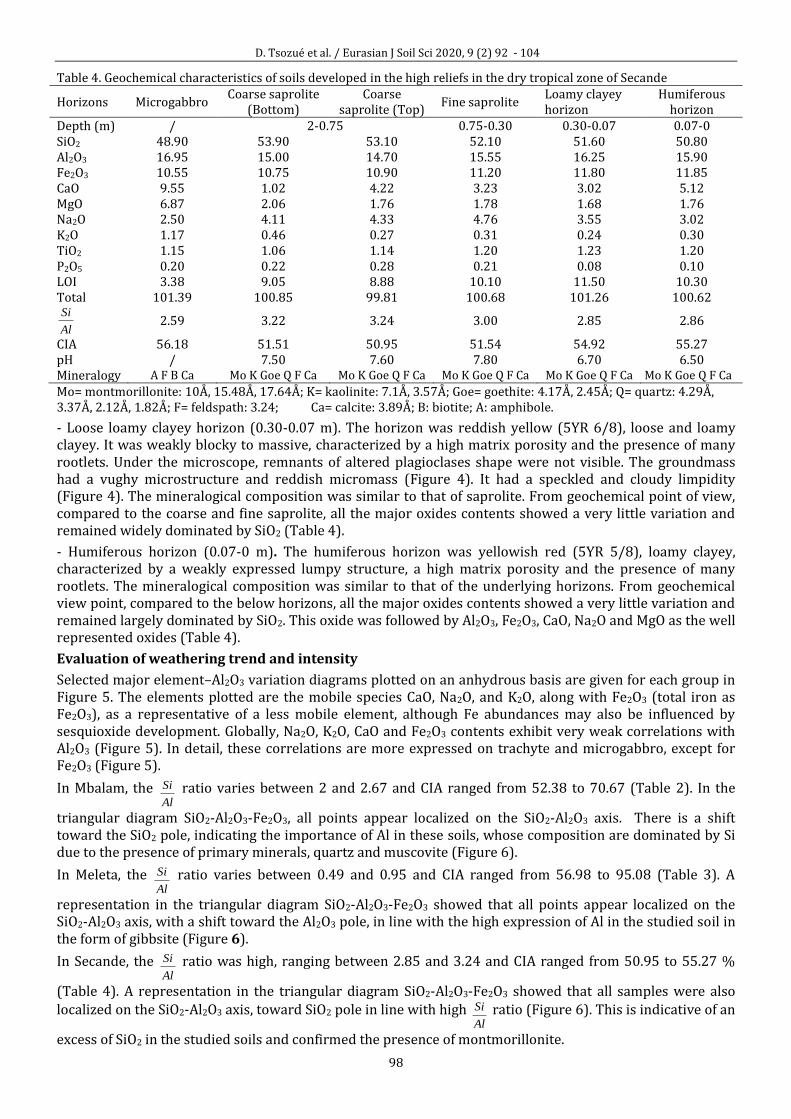
- Loose loamy clayey horizon (0.30-0.07 m). The horizon was reddish yellow (5YR 6/8), loose and loamy clayey. It was weakly blocky to massive, characterized by a high matrix porosity and the presence of many rootlets. Under the microscope, remnants of altered plagioclases shape were not visible. The groundmass had a vughy microstructure and reddish micromass (Figure 4). It had a speckled and cloudy limpidity (Figure 4). The mineralogical composition was similar to that of saprolite. From geochemical point of view, compared to the coarse and fine saprolite, all the major oxides contents showed a very little variation and remained widely dominated by SiO2 (Table 4).
- Humiferous horizon (0.07-0 m). The humiferous horizon was yellowish red (5YR 5/8), loamy clayey, characterized by a weakly expressed lumpy structure, a high matrix porosity and the presence of many rootlets. The mineralogical composition was similar to that of the underlying horizons. From geochemical view point, compared to the below horizons, all the major oxides contents showed a very little variation and remained largely dominated by SiO2. This oxide was followed by Al2O3, Fe2O3, CaO, Na2O and MgO as the well represented oxides (Table 4).
Evaluation of weathering trend and intensity
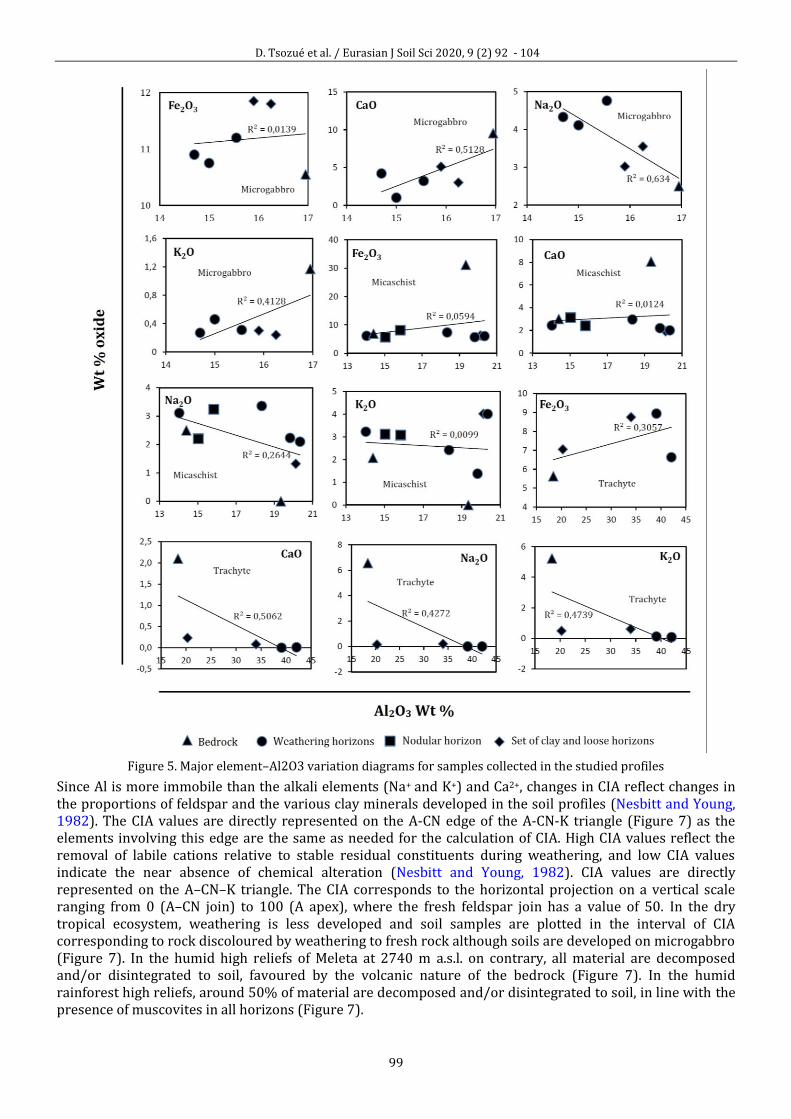
Selected major element–Al2O3 variation diagrams plotted on an anhydrous basis are given for each group in Figure 5. The elements plotted are the mobile species CaO, Na2O, and K2O, along with Fe2O3 (total iron as Fe2O3), as a representative of a less mobile element, although Fe abundances may also be influenced by sesquioxide development. Globally, Na2O, K2O, CaO and Fe2O3 contents exhibit very weak correlations with Al2O3 (Figure 5). In detail, these correlations are more expressed on trachyte and microgabbro, except for Fe2O3 (Figure 5).
In Mbalam, the Al
Si ratio varies between 2 and 2.67 and CIA ranged from 52.38 to 70.67 (Table 2). In the
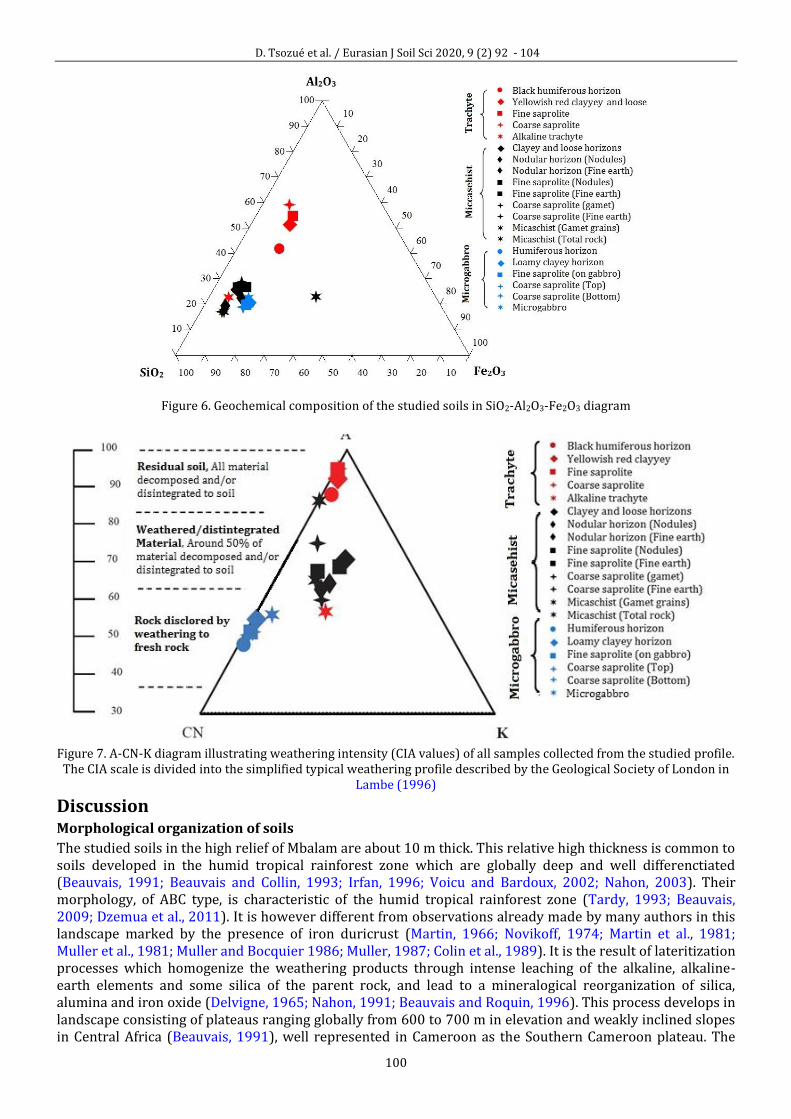
triangular diagram SiO2-Al2O3-Fe2O3, all points appear localized on the SiO2-Al2O3 axis. There is a shift toward the SiO2 pole, indicating the importance of Al in these soils, whose composition are dominated by Si due to the presence of primary minerals, quartz and muscovite (Figure 6).
In Meleta, the Al
Si ratio varies between 0.49 and 0.95 and CIA ranged from 56.98 to 95.08 (Table 3). A
representation in the triangular diagram SiO2-Al2O3-Fe2O3 showed that all points appear localized on the SiO2-Al2O3 axis, with a shift toward the Al2O3 pole, in line with the high expression of Al in the studied soil in the form of gibbsite (Figure 6).
In Secande, the Al
Si ratio was high, ranging between 2.85 and 3.24 and CIA ranged from 50.95 to 55.27 %
(Table 4). A representation in the triangular diagram SiO2-Al2O3-Fe2O3 showed that all samples were also localized on the SiO2-Al2O3 axis, toward SiO2 pole in line with high
Al
Si ratio (Figure 6). This is indicative of an
excess of SiO2 in the studied soils and confirmed the presence of montmorillonite.
D. Tsozué et al. / Eurasian J Soil Sci 2020, 9 (2) 92 - 104
99
Figure 5. Major element–Al2O3 variation diagrams for samples collected in the studied profiles
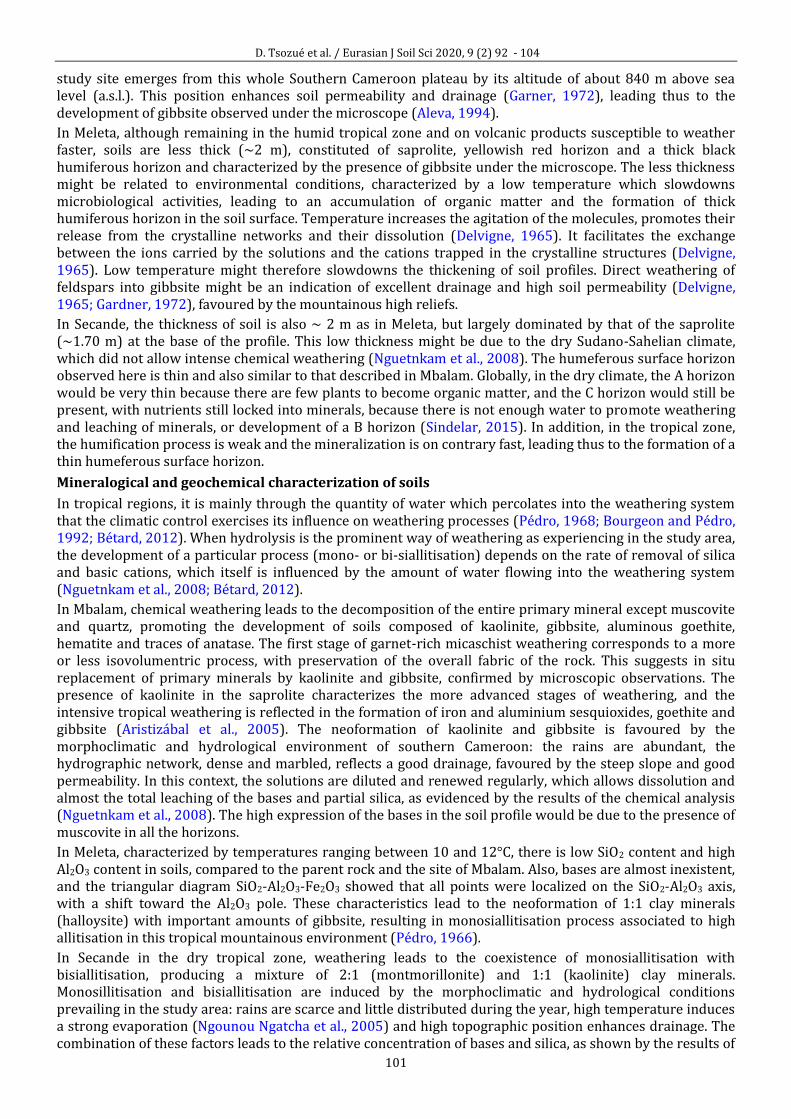
Since Al is more immobile than the alkali elements (Na+
and K+) and Ca2+, changes in CIA reflect changes in the proportions of feldspar and the various clay minerals developed in the soil profiles (Nesbitt and Young, 1982). The CIA values are directly represented on the A-CN edge of the A-CN-K triangle (Figure 7) as the elements involving this edge are the same as needed for the calculation of CIA. High CIA values reflect the removal of labile cations relative to stable residual constituents during weathering, and low CIA values indicate the near absence of chemical alteration (Nesbitt and Young, 1982). CIA values are directly represented on the A–CN–K triangle. The CIA corresponds to the horizontal projection on a vertical scale ranging from 0 (A–CN join) to 100 (A apex), where the fresh feldspar join has a value of 50. In the dry tropical ecosystem, weathering is less developed and soil samples are plotted in the interval of CIA corresponding to rock discoloured by weathering to fresh rock although soils are developed on microgabbro (Figure 7). In the humid high reliefs of Meleta at 2740 m a.s.l. on contrary, all material are decomposed and/or disintegrated to soil, favoured by the volcanic nature of the bedrock (Figure 7). In the humid rainforest high reliefs, around 50% of material are decomposed and/or disintegrated to soil, in line with the presence of muscovites in all horizons (Figure 7).
D. Tsozué et al. / Eurasian J Soil Sci 2020, 9 (2) 92 - 104
100
Figure 6. Geochemical composition of the studied soils in SiO2-Al2O3-Fe2O3 diagram
Figure 7. A-CN-K diagram illustrating weathering intensity (CIA values) of all samples collected from the studied profile. The CIA scale is divided into the simplified typical weathering profile described by the Geological Society of London in
Lambe (1996)
Discussion Morphological organization of soils
The studied soils in the high relief of Mbalam are about 10 m thick. This relative high thickness is common to soils developed in the humid tropical rainforest zone which are globally deep and well differenctiated (Beauvais, 1991; Beauvais and Collin, 1993; Irfan, 1996; Voicu and Bardoux, 2002; Nahon, 2003). Their morphology, of ABC type, is characteristic of the humid tropical rainforest zone (Tardy, 1993; Beauvais, 2009; Dzemua et al., 2011). It is however different from observations already made by many authors in this landscape marked by the presence of iron duricrust (Martin, 1966; Novikoff, 1974; Martin et al., 1981; Muller et al., 1981; Muller and Bocquier 1986; Muller, 1987; Colin et al., 1989). It is the result of lateritization processes which homogenize the weathering products through intense leaching of the alkaline, alkaline-earth elements and some silica of the parent rock, and lead to a mineralogical reorganization of silica, alumina and iron oxide (Delvigne, 1965; Nahon, 1991; Beauvais and Roquin, 1996). This process develops in landscape consisting of plateaus ranging globally from 600 to 700 m in elevation and weakly inclined slopes in Central Africa (Beauvais, 1991), well represented in Cameroon as the Southern Cameroon plateau. The
D. Tsozué et al. / Eurasian J Soil Sci 2020, 9 (2) 92 - 104
101
study site emerges from this whole Southern Cameroon plateau by its altitude of about 840 m above sea level (a.s.l.). This position enhances soil permeability and drainage (Garner, 1972), leading thus to the development of gibbsite observed under the microscope (Aleva, 1994).
In Meleta, although remaining in the humid tropical zone and on volcanic products susceptible to weather faster, soils are less thick (~2 m), constituted of saprolite, yellowish red horizon and a thick black humiferous horizon and characterized by the presence of gibbsite under the microscope. The less thickness might be related to environmental conditions, characterized by a low temperature which slowdowns microbiological activities, leading to an accumulation of organic matter and the formation of thick humiferous horizon in the soil surface. Temperature increases the agitation of the molecules, promotes their release from the crystalline networks and their dissolution (Delvigne, 1965). It facilitates the exchange between the ions carried by the solutions and the cations trapped in the crystalline structures (Delvigne, 1965). Low temperature might therefore slowdowns the thickening of soil profiles. Direct weathering of feldspars into gibbsite might be an indication of excellent drainage and high soil permeability (Delvigne, 1965; Gardner, 1972), favoured by the mountainous high reliefs.
In Secande, the thickness of soil is also ~ 2 m as in Meleta, but largely dominated by that of the saprolite (~1.70 m) at the base of the profile. This low thickness might be due to the dry Sudano-Sahelian climate, which did not allow intense chemical weathering (Nguetnkam et al., 2008). The humeferous surface horizon observed here is thin and also similar to that described in Mbalam. Globally, in the dry climate, the A horizon would be very thin because there are few plants to become organic matter, and the C horizon would still be present, with nutrients still locked into minerals, because there is not enough water to promote weathering and leaching of minerals, or development of a B horizon (Sindelar, 2015). In addition, in the tropical zone, the humification process is weak and the mineralization is on contrary fast, leading thus to the formation of a thin humeferous surface horizon.
Mineralogical and geochemical characterization of soils
In tropical regions, it is mainly through the quantity of water which percolates into the weathering system that the climatic control exercises its influence on weathering processes (Pédro, 1968; Bourgeon and Pédro, 1992; Bétard, 2012). When hydrolysis is the prominent way of weathering as experiencing in the study area, the development of a particular process (mono- or bi-siallitisation) depends on the rate of removal of silica and basic cations, which itself is influenced by the amount of water flowing into the weathering system (Nguetnkam et al., 2008; Bétard, 2012).
In Mbalam, chemical weathering leads to the decomposition of the entire primary mineral except muscovite and quartz, promoting the development of soils composed of kaolinite, gibbsite, aluminous goethite, hematite and traces of anatase. The first stage of garnet-rich micaschist weathering corresponds to a more or less isovolumentric process, with preservation of the overall fabric of the rock. This suggests in situ replacement of primary minerals by kaolinite and gibbsite, confirmed by microscopic observations. The presence of kaolinite in the saprolite characterizes the more advanced stages of weathering, and the intensive tropical weathering is reflected in the formation of iron and aluminium sesquioxides, goethite and gibbsite (Aristizábal et al., 2005). The neoformation of kaolinite and gibbsite is favoured by the morphoclimatic and hydrological environment of southern Cameroon: the rains are abundant, the hydrographic network, dense and marbled, reflects a good drainage, favoured by the steep slope and good permeability. In this context, the solutions are diluted and renewed regularly, which allows dissolution and almost the total leaching of the bases and partial silica, as evidenced by the results of the chemical analysis (Nguetnkam et al., 2008). The high expression of the bases in the soil profile would be due to the presence of muscovite in all the horizons.
In Meleta, characterized by temperatures ranging between 10 and 12°C, there is low SiO2 content and high Al2O3 content in soils, compared to the parent rock and the site of Mbalam. Also, bases are almost inexistent, and the triangular diagram SiO2-Al2O3-Fe2O3 showed that all points were localized on the SiO2-Al2O3 axis, with a shift toward the Al2O3 pole. These characteristics lead to the neoformation of 1:1 clay minerals (halloysite) with important amounts of gibbsite, resulting in monosiallitisation process associated to high allitisation in this tropical mountainous environment (Pédro, 1966).
In Secande in the dry tropical zone, weathering leads to the coexistence of monosiallitisation with bisiallitisation, producing a mixture of 2:1 (montmorillonite) and 1:1 (kaolinite) clay minerals. Monosillitisation and bisiallitisation are induced by the morphoclimatic and hydrological conditions prevailing in the study area: rains are scarce and little distributed during the year, high temperature induces a strong evaporation (Ngounou Ngatcha et al., 2005) and high topographic position enhances drainage. The combination of these factors leads to the relative concentration of bases and silica, as shown by the results of
D. Tsozué et al. / Eurasian J Soil Sci 2020, 9 (2) 92 - 104
102
the chemical analysis, and creates the favourable conditions for the genesis of montmorillonite and kaolinite (Pédro, 1966; Nahon, 1991; Velde, 1995; Paquet and Clauer, 1997). Similar coexistences of kaolinite and montmorillonite have been reported in the literature by many authors (Amouric and Olives, 1998; Meunier, 2003; Nguetkam et al., 2008). They are carried out via the interstratified clay minerals, beidellite-montmorillonite and beidellite-montmorillonite-kaolinite (Nguetkam et al., 2008).
Spatial variation of soil properties in the tropical high reliefs of Cameroon
The surface geochemical signature in soil is always unique in some respects, due to differences in geological, geomorphological and environmental settings. The mobilization and redistribution of elements during weathering follow thus various pathways, as different elements are affected differently by the various pedogenic processes, including dissolution of primary minerals, formation of secondary minerals, redox processes, transport of material, and ion exchange (Middleburg et al. 1988; Ozaytekin and Uzun, 2012). Soils’ genesis and mantles’ weathering are not an instantaneous phenomenon and requires long time periods to develop. According to Lageat and Gunnell (2001), tropical soils and weathering mantles may be considered as palimpsests reflecting “average” bioclimatic conditions that prevail at timescales of 1 to 10 Myr. Thus the duration of the Quaternary period appears to be an order of magnitude likely to control soil and saprolite development, given the propagation rates of weathering fronts estimated for tropical regions (1 to 10 m·Ma−1: Boeglin and Probst, 1998; Braun et al., 2005; Théveniaut and Freyssinet, 1999; Thomas, 1994). This leads to the soil differentiation in each study site according to the bioclimatic conditions which vary from the equator to the tropical dry climate in Cameroon. In the Meleta site, the rate of percolation is dependent on the ratio rainfall/evapotranspiration. This ratio increases with elevation, since rainfall increases and temperature decreases. Consequently higher shares of gibbsite can be expected (Hermann et al., 2007). The high expression of gibbsite here contrary to Mbalam could be attributed to high elevation and rainfall which induced high drainage. As a general rule, Tardy et al. (1973) state that in very humid climates and under excellent drainage conditions, gibbsite can appear. The absence of gibbsite in Secande might thus be attributed to low rainfall, low topography and high evaporation rate which did not facilitate the total evacuation of bases, leading to the maximum development of 2:1 clay minerals in this area, toward 1:1 clay minerals which remain present. In the tropical high reliefs, topography, elevation, rainfall and temperature appear as the main factors responsible of the soil properties.
Conclusion The study of spatial variation of soil weathering processes in the tropical high reliefs of Cameroon lead to the following conclusions:
-soils are very thick in humid rainforest tropical high reliefs and this thickness decrease with increasing elevation and latitude;
-geochemical processes involved in the spatial differentiation of soils are monosiallitisation and allitisation in the humid tropical zone, monosiallitisation and high allitisation in the pseudotropical mountainous zone and monosiallitisation associated to bisiallitisation in the tropical dry climate of Cameroon;
-topography, elevation, rainfall and temperature appear as the main factors responsible of the spatial variation of soil weathering processes in the tropical high reliefs.
Acknowledgements The authors would like to acknowledge Dr Gountié Dedzo Merlin of the Higher Teachers’ Training College of the University of Maroua for his help during field surveys and microscopic observations.
References Aleva, G.J.J., 1994. Laterites. Concepts, geology, morphology and chemistry. International Soil Reference and
Information Center, Wageningen, The Netherlands. 169p. Amouric, M., Olives. J., 1998. Transformation mechanisms and interstratifications in conversion of smectite to kaolinite:
an HRTEM study. Clays and Clay Minerals 46(5): 521-527. Aristizábal, E., Roser, B., Yokota, S., 2005. Tropical chemical weathering of hillslope deposits and bedrock source in the
Aburra Valley, northern Colombian Andes. Engineering Geology 81(4): 389-406. Beauvais, A., 1991. Paléoclimats et dynamique d’un paysage cuirassé de Centrafrique. Morphologie, pétrologie et
géochimie. Thèse Doctorat, Université Poitiers, 297p. [in French] Beauvais, A., 2009. Ferricrete biochemical degradation on the rainforest–savannas boundary of Central African
Republic. Geoderma 150(3-4): 379-388. Beauvais, A., Colin., F., 1993. Formation and transformation processes of iron duricrust systems in tropical humid
environment. Chemical Geology 106(1-2): 77-151. Beauvais, A., Roquin., C., 1996. Petrological differentiation and geomorphic distribution of ferricretes in Central Africa.
Geoderma 73(1-2): 63-82.
D. Tsozué et al. / Eurasian J Soil Sci 2020, 9 (2) 92 - 104
103
Bétard, F., 2012. Spatial variations of soil weathering processes in a tropical mountain environment: The Baturité massif and its piedmont (Ceará, NE Brazil). Catena 93: 18-28.
Blake, G.R., Hartge, K.H., 1986. Bulk density. In: Methods of Soil Analysis Part 1 Physical and Mineralogical Methods. 2nd Edition, Klute, A., (Ed). American Society of Agronomy,-Soil Science Society of America. Madison, Wisconsin, USA. pp. 363-375.
Boeglin, J.L., Probst., J.L., 1998. Physical and chemical weathering rates and CO2 consumption in a tropical lateritic environment: the upper Niger basin. Chemical Geology 148(3-4): 137-156.
Bourgeon, G., 2001. A survey of soil and weathering patterns through land system mapping in the Western Ghats region. In: Sahyadri, the great escarpment of the Indian subcontinent. Patterns of landscape development in the Western Ghats. Gunnell, Y., Radhakrishna, B.P., (Eds.). Geological Society of India, Gavipuram, India. pp 855-904.
Bourgeon, G., Pédro, G., 1992. Rôle majeur du drainage climatique dans la différenciation altéritique et pédologique des sols des régions chaudes. Exemple du passage sols fersiallitiques-sols ferrallitiques au Sud du Karnataka (Inde). Comptes Rendus de l'Académie des Sciences. Série 2, Mécanique, Physique, Chimie, Sciences de l'Univers, Sciences de la Terre 314: 717-725. [in French]
Braun, J.J., Ngeoupayou, J.R.N., Viers, J., Dupré, B., Bedimo, J.P., Boeglin, J.L., Robain, H., Nyeck, B., Freydier, R., Nkamdjou, L.S., Rouiller, J., Muller., J.P., 2005. Present weathering rates in a humid tropical watershed: Nsimi, South Cameroon. Geochimica et Cosmochimica Acta 69(2): 357-387.
Colin, F., Minko, E., Nahon, D., 1989. L'or particulaire résiduel dans les profils latéritiques : altération géochimique et dispersion superficielle en conditions équatoriales. Comptes Rendus de l'Académie des Sciences 309: 553-560. [in French]
Colin, F., Veillard, P., Ambrosi, J.P., 1993. Quantitative approach to physical and chemical gold mobility in equatorial rainforest lateritic environment. Earth and Planetary Science Letters 114(2-3): 269-285.
Delvigne, J., 1965. Pédogenèse en zone tropicale. La formation des minéraux secondaires en milieu ferrallitique. Mém. ORSTOM, Paris, 13. 177p. [in French]
Dumort, J.C., Peronne, Y., 1966. Notice Explicative sur la Feuille Maroua. 1 Carte géologique de Reconnaissance au1/500000. Direction des Mines et de la Géologie, Yaoundé, Cameroun. [in French]
Dzemua, G.L., Mees, F., Stoops, G., Van Ranst E., 2011. Micromorphology, mineralogy and geochemistry of lateritic weathering over serpentinite in south-east Cameroon. Journal of African Earth Sciences 60(1-2): 38-48.
Ehlen, J., 2005. Above the weathering front: contrasting approaches to the study and classification of weathering mantle. Geomorphology 67(1-2): 7-21.
Gabler, R.E., Petersen, J.F., Trapasso, L.M., Sack, D., 2008. Physical Geography. Ninth Edition, Brooks/Cole, Cengage learning, Belmonth, USA. 672p.
Gardner, L.R., 1972. Conditions for direct formation of gibbsite from K-Feldspar—further discussion. American Mineralogist 57(1-2): 294-300.
Gountié Dedzo, M., Njonfang, E., Nono, A., Kamgang, P., Zangmo Tefogoum, G., Kagou Dongmo, A., Nkouathio, D.G., 2012. Dynamic and evolution of the Mounts Bamboutos and Bamenda calderas by study of ignimbritic deposits (West-Cameroon, Cameroon Line). Syllabus Review 3: 11-23.
Gracheva, R., 2011. Formation of soil diversity in themountainous tropics and subtropics: rocks, time and erosion. Geomorphology 135: 224-231.
Guitián, O.F., Carballas, T., 1976. Técnicas de análisis de Suelos (Techniques of Soil Analysis). Pico Sacro: Santiago de Compostela, Spain. 288p. [in French]
Herrmann, L., Anongrak, N., Zarei, M., Schuler, U., Spohrer, K., 2007. Factors and processes of gibbsite formation in Northern Thailand. Catena 71(2): 279-291.
Irfan, T.Y., 1996. Mineralogy, fabric properties and classification of weathered granites in Hong Kong. Quaterly Journal of Engineering Geology and Hydrogeology 29(1): 5-35.
Lageat, Y., Gunnell, Y., 2001. Landscape development in tropical shield environments. In: Basement regions. Godard, A., Lagasquie, J.J., Lageat, Y. (Eds.). Springer, Berlin, pp. 173-197.
Lambe, P., 1996. Residual soils. Landslides: investigation and mitigation. In: Investigation and Mitigation. Turner, K., Schuster, R., (Eds.). Landslides Special Report, Transportation Research Board, National Research Council, pp 507-524.
Lasserre, M., 1975. Etude de Géologique et prospection générale orientée du complexe volcano-sédimentaire Tcholliré-Bibemi-Maroua. In Mesures géochronologiques sur les formations du Nord Cameroun par les méthodes au rubidium/strontium et au potassium/argon sur minéraux et roches totales. Direction des Mines et de la Géologie Yaoundé, Cameroun. 37p. [in French]
Letouzey, R., 1985. Notice explicative de la carte phytogéographique du Cameroun à l’échelle de 1/500 000. Institut de la Carte Internationale de la Végétation, Toulouse, France. 240p. [in French]
Martin, D., 1966. Etudes pédologiques dans le centre Cameroun, Nanga-Eboko à Bertoua. Mém. ORSTOM, Paris, 19, 92 p. Martin, D., Chatelin, Y., Colllnet, J., Guichard, E., Sala, G., 1981. Les sols du Gabon. Pédogenèse, répartition et aptitudes.
Notice explicative de la carte pédologique à 1:200 000. ORSTOM (éd), Paris, 92, 65p. [in French] Marzoli, A., Renne, P.R., Piccirillo, E.M., Francesca, C., Bellieni, G., Melfi, A.J., Nyobe, J.B., N’ni., J., 1999. Silicic magmas
from the continental Cameroon Volcanic Line (Oku, Bambouto and Ngaoundere): 40Ar-39Ar dates, petrology, Sr-Nd-O isotopes and their petrogenetic significance. Contributions to Mineralogy and Petrology 135(2-3): 133-150.
Meunier, A., 2003. Les argiles. Collection Géosciences, GB Science Publisher, 433p. [in French]
D. Tsozué et al. / Eurasian J Soil Sci 2020, 9 (2) 92 - 104
104
Middelburg, J.J., Van Der Weijden, C.H., Woittiez, J.R.W., 1988. Chemical proccesses affecting the mobility of major, minor and trace elements during weathering of granitic rocks. Chemical Geology 68(3-4): 253-273.
Morin, S., 1988. Les dissymétries fondamentales des Hautes Terres de l’Ouest-Cameroun et leurs conséquences sur l’occupation humaine. Exemple des Monts Bambouto. In: L’homme et la montagne tropicale. Bordeaux, pp 49-51.
Muller, D., Bocquier, G., Nahon, D., Paque, H., 1981. Analyses des différenciations minéralogiques et structurales d’un sol ferrallitique à horizons nodulaires du Congo. Cah ORSTOM. Sér. Pédol. 17 : 87-109. [in French]
Muller, J.P., 1987. Analyse pétrologique d’une formation latéritique meuble du Cameroun. Essai de traçage d’une différenciation supergène par les paragenèses secondaires. Thèse Doctorat ès Science, Université de Paris VII. 188p. [in French]
Muller, J.P., Bocquier, G., 1986. Dissolution of kaolinites and accumulation of iron oxides in lateritic-ferruginous nodules: Mineralogical and microstructural transformations. Geoderma 37(2): 113-136.
Nahon, D., 1991. Introduction to the Petrology of Soils and Chemical Weathering. John Wiley, New York. USA. 313p. Nahon, D., 2003. Weathering in tropical zone. Significance through ancient and still active mechanisms. Comptes Rendus
Géoscience 335(16): 1109-1119. Nesbitt, H.W., Young, G.M., 1982. Early Proterozoic climates and plate motions inferred from major element chemistry
of lutites. Nature 279: 715-717. Ngounou Ngatcha, B., Mudry, J., Sigha Nkamdjou, L., Njitchoua, R., Naah, E., 2005. Climate variability and impacts on an
alluvial aquifer in a semi-arid climate, the Logone-Chari plain (South of Lake Chad). International Association of Hydrological Sciences 295: 94-100.
Nguetnkam, J.P., Kamga, R., Villiéras, F., Ekodeck, G.E., Yvon, J., 2008. Variable weathering response of granite in tropical zones. Example of two sequences studied in Cameroon (Central Africa). Comptes Rendus Geoscience 340(7): 451-461.
Nono, A., Njonfang, E., Kagou Dongmo, A., Nkouathio, D.G., Tchoua, F.M., 2004. Pyroclastic deposits of the Bambouto Volcano (Cameroon Line, Central Africa): Evidence of a strombolian initial phase. Journal of African Earth Sciences 39(3-5) : 409-414.
Novikoff, A., 1974. L'altération des roches dans le massif du Chaillu (République populaire du Congo). Formation et évolution des argiles en zone ferrallitique. Thèse Doctorat ès Science, Université Strasbourg. 298p. [in French]
Olivry, J.C., 1986. Fleuves et rivières du Cameroun. Monographies Hydrologiques ORSTOM n°9. Ed. MESRES-ORSTOM. 733p. [in French]
Ozaytekin, H.H., Uzum., C., 2012. Comparison of weathering rates of the soils classified in Alfisol and Entisol order developed on limestone in the Taurus Mountains at East Mediterranean region. Carpathian journal of Earth and Environmental Sciences 7(1): 109-120.
Paquet, H., Clauer, N., 1997. Soils and sediments, Mineralogy and geochemistry. Springer-Verlag, Berlin, Heidelberg. 369p.
Pédro, G., 1966. Essai sur la caractérisation géochimique des différents processus zonaux résultant de l’altération des roches superficielles (cycle alumino-silicique). Comptes Rendus de l'Académie des Sciences 262: 1828-1831. [in French]
Pédro, G., 1968. Distribution des principaux types d'altération chimique à la surface du globe. Revue de Géographie Physique et de Géologie Dynamique 10: 457-470. [in French]
Scarciglia, F., Le Pera, E., Critelli, S., 2005. Weathering and pedogenesis in the Sila Grande Massif (Calabria, South Italy): from field scale to micromorphology. Catena 61(1): 1-29.
Sindelar, M., 2015. Soils and climate. Soil Science Society of America, international year of soils. Available at [Access date : 06.12.2018]: https://www.soils.org/files/sssa/iys/november-soils-overview.pdf
Stoops, G., 2003. Guidelines for analysis and description of soil and regolith thin sections. Soil Science Society of America, Madison, USA., 184p.
Suchel, J.-B., 1987. Les climats du Cameroun. Thesis, Université de Bordeaux III, France. 1186 p. [in French] Tardy, Y., Bocquier, G., Paquet, H., Millot G., 1973. Formation of clay from granite and its distribution in relation to
climate and topography. Geoderma 10(4): 271-284. Tardy, Y., 1993. Pétrologie des latérites et des sols tropicaux. Masson, Paris, 459p. [in French] Théveniaut, H., Freyssinet, Ph., 1999. Paleomagnetism applied to lateritic profiles to assess saprolite and duricrust
formation processes: the example of Mont Baduel profile (French Guiana). Palaeogeography, Palaeoclimatology, Palaeoecology 148(4): 209-231.
Thomas, M.F., 1994. Geomorphology in the tropics. A study of weathering and denudation in low latitudes. J. Wiley & Sons, Chichester, 460p.
Tricart, J., 1961. Les caractéristiques fondamentales du système morpho-génétique des pays tropicaux humides. L’information géographique 25: 155-169. [in French]
USDA. 2004. Soil survey laboratory methods manual. Soil survey investigation report no. 42, Version 4.0. USDA-NCRS, Lincoln, NE, 700p.
Velde, B., 1995. Origin and mineralogy of clays. Clays and the environment. Springer-Verlag, New York, 334p. Vicat, J.-P., 1998. Esquisse géologique du Cameroun. In : Géosciences au Cameroun. Vicat, J.P.,Bilong, P. (Eds.). Collect.
Géocam. Press. Univ. de Yaoundé, pp 1-11. [in French] Voicu, G., Bardoux, M., 2002. Geochemical behavior under tropical weathering of the Barama–Mazaruni greenstone belt
at Omai gold mine, Guiana Shield. Applied Geochemistry 17(3): 321-336.
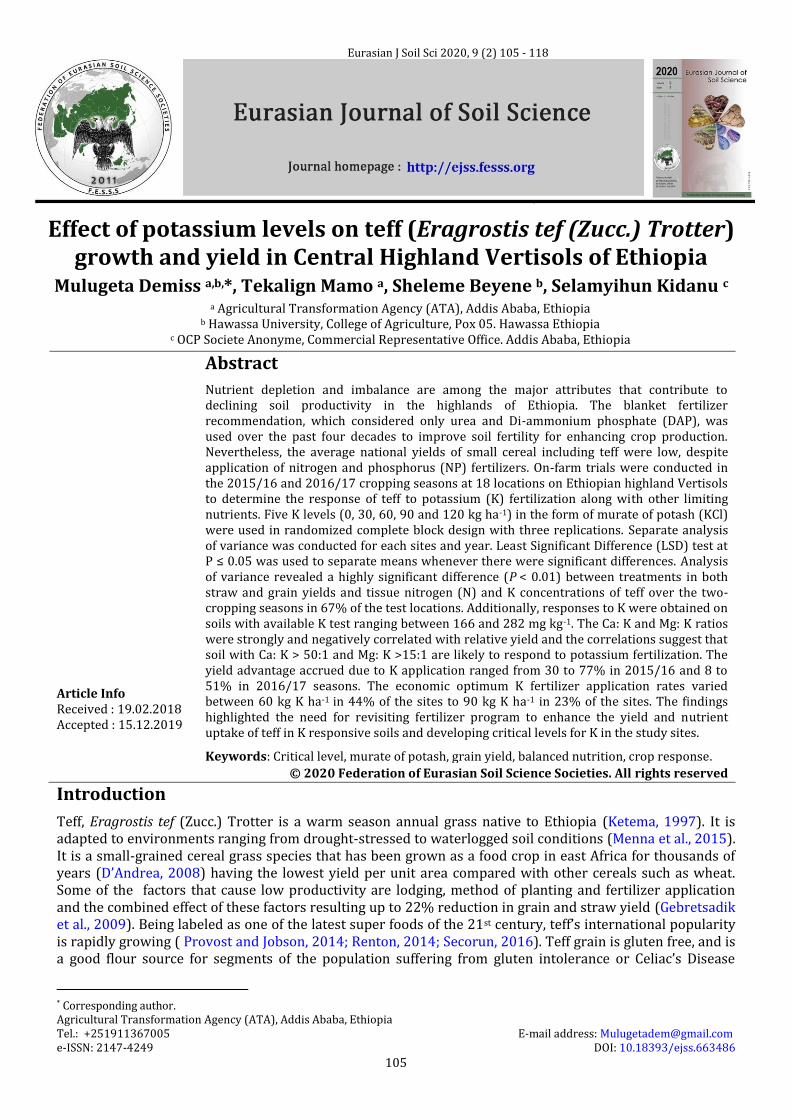
Mulugeta. D. et al. / Eurasian J Soil Sci 2020, 9 (2) 105 - 118
105
Effect of potassium levels on teff (Eragrostis tef (Zucc.) Trotter) growth and yield in Central Highland Vertisols of Ethiopia
Mulugeta Demiss a,b,*, Tekalign Mamo a, Sheleme Beyene b, Selamyihun Kidanu c a Agricultural Transformation Agency (ATA), Addis Ababa, Ethiopia
b Hawassa University, College of Agriculture, Pox 05. Hawassa Ethiopia c OCP Societe Anonyme, Commercial Representative Office. Addis Ababa, Ethiopia
Abstract Article Info Received : 19.02.2018 Accepted : 15.12.2019
Nutrient depletion and imbalance are among the major attributes that contribute to declining soil productivity in the highlands of Ethiopia. The blanket fertilizer recommendation, which considered only urea and Di-ammonium phosphate (DAP), was used over the past four decades to improve soil fertility for enhancing crop production. Nevertheless, the average national yields of small cereal including teff were low, despite application of nitrogen and phosphorus (NP) fertilizers. On-farm trials were conducted in the 2015/16 and 2016/17 cropping seasons at 18 locations on Ethiopian highland Vertisols to determine the response of teff to potassium (K) fertilization along with other limiting nutrients. Five K levels (0, 30, 60, 90 and 120 kg ha-1) in the form of murate of potash (KCl) were used in randomized complete block design with three replications. Separate analysis of variance was conducted for each sites and year. Least Significant Difference (LSD) test at P ≤ 0.05 was used to separate means whenever there were significant differences. Analysis of variance revealed a highly significant difference (P < 0.01) between treatments in both straw and grain yields and tissue nitrogen (N) and K concentrations of teff over the two-cropping seasons in 67% of the test locations. Additionally, responses to K were obtained on soils with available K test ranging between 166 and 282 mg kg-1. The Ca: K and Mg: K ratios were strongly and negatively correlated with relative yield and the correlations suggest that soil with Ca: K > 50:1 and Mg: K >15:1 are likely to respond to potassium fertilization. The yield advantage accrued due to K application ranged from 30 to 77% in 2015/16 and 8 to 51% in 2016/17 seasons. The economic optimum K fertilizer application rates varied between 60 kg K ha-1 in 44% of the sites to 90 kg K ha-1 in 23% of the sites. The findings highlighted the need for revisiting fertilizer program to enhance the yield and nutrient uptake of teff in K responsive soils and developing critical levels for K in the study sites.
Keywords: Critical level, murate of potash, grain yield, balanced nutrition, crop response.
© 2020 Federation of Eurasian Soil Science Societies. All rights reserved
Introduction
Teff, Eragrostis tef (Zucc.) Trotter is a warm season annual grass native to Ethiopia (Ketema, 1997). It is adapted to environments ranging from drought-stressed to waterlogged soil conditions (Menna et al., 2015). It is a small-grained cereal grass species that has been grown as a food crop in east Africa for thousands of years (D’Andrea, 2008) having the lowest yield per unit area compared with other cereals such as wheat. Some of the factors that cause low productivity are lodging, method of planting and fertilizer application and the combined effect of these factors resulting up to 22% reduction in grain and straw yield (Gebretsadik et al., 2009). Being labeled as one of the latest super foods of the 21st century, teff’s international popularity is rapidly growing ( Provost and Jobson, 2014; Renton, 2014; Secorun, 2016). Teff grain is gluten free, and is a good flour source for segments of the population suffering from gluten intolerance or Celiac’s Disease
* Corresponding author. Agricultural Transformation Agency (ATA), Addis Ababa, Ethiopia Tel.: +251911367005 E-mail address: [email protected] e-ISSN: 2147-4249 DOI: 10.18393/ejss.663486
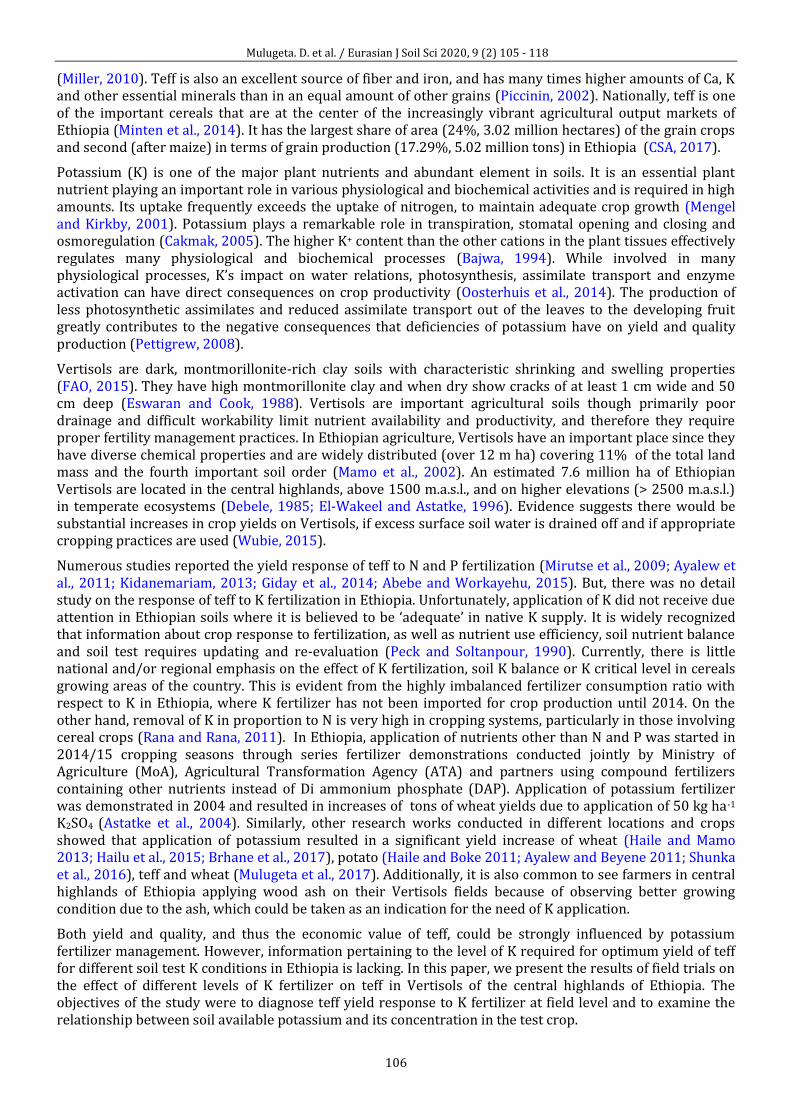
Mulugeta. D. et al. / Eurasian J Soil Sci 2020, 9 (2) 105 - 118
106
(Miller, 2010). Teff is also an excellent source of fiber and iron, and has many times higher amounts of Ca, K and other essential minerals than in an equal amount of other grains (Piccinin, 2002). Nationally, teff is one of the important cereals that are at the center of the increasingly vibrant agricultural output markets of Ethiopia (Minten et al., 2014). It has the largest share of area (24%, 3.02 million hectares) of the grain crops and second (after maize) in terms of grain production (17.29%, 5.02 million tons) in Ethiopia (CSA, 2017).
Potassium (K) is one of the major plant nutrients and abundant element in soils. It is an essential plant nutrient playing an important role in various physiological and biochemical activities and is required in high amounts. Its uptake frequently exceeds the uptake of nitrogen, to maintain adequate crop growth (Mengel and Kirkby, 2001). Potassium plays a remarkable role in transpiration, stomatal opening and closing and osmoregulation (Cakmak, 2005). The higher K+ content than the other cations in the plant tissues effectively regulates many physiological and biochemical processes (Bajwa, 1994). While involved in many physiological processes, K’s impact on water relations, photosynthesis, assimilate transport and enzyme activation can have direct consequences on crop productivity (Oosterhuis et al., 2014). The production of less photosynthetic assimilates and reduced assimilate transport out of the leaves to the developing fruit greatly contributes to the negative consequences that deficiencies of potassium have on yield and quality production (Pettigrew, 2008).
Vertisols are dark, montmorillonite-rich clay soils with characteristic shrinking and swelling properties (FAO, 2015). They have high montmorillonite clay and when dry show cracks of at least 1 cm wide and 50 cm deep (Eswaran and Cook, 1988). Vertisols are important agricultural soils though primarily poor drainage and difficult workability limit nutrient availability and productivity, and therefore they require proper fertility management practices. In Ethiopian agriculture, Vertisols have an important place since they have diverse chemical properties and are widely distributed (over 12 m ha) covering 11% of the total land mass and the fourth important soil order (Mamo et al., 2002). An estimated 7.6 million ha of Ethiopian Vertisols are located in the central highlands, above 1500 m.a.s.l., and on higher elevations (> 2500 m.a.s.l.) in temperate ecosystems (Debele, 1985; El-Wakeel and Astatke, 1996). Evidence suggests there would be substantial increases in crop yields on Vertisols, if excess surface soil water is drained off and if appropriate cropping practices are used (Wubie, 2015).
Numerous studies reported the yield response of teff to N and P fertilization (Mirutse et al., 2009; Ayalew et al., 2011; Kidanemariam, 2013; Giday et al., 2014; Abebe and Workayehu, 2015). But, there was no detail study on the response of teff to K fertilization in Ethiopia. Unfortunately, application of K did not receive due attention in Ethiopian soils where it is believed to be ‘adequate’ in native K supply. It is widely recognized that information about crop response to fertilization, as well as nutrient use efficiency, soil nutrient balance and soil test requires updating and re-evaluation (Peck and Soltanpour, 1990). Currently, there is little national and/or regional emphasis on the effect of K fertilization, soil K balance or K critical level in cereals growing areas of the country. This is evident from the highly imbalanced fertilizer consumption ratio with respect to K in Ethiopia, where K fertilizer has not been imported for crop production until 2014. On the other hand, removal of K in proportion to N is very high in cropping systems, particularly in those involving cereal crops (Rana and Rana, 2011). In Ethiopia, application of nutrients other than N and P was started in 2014/15 cropping seasons through series fertilizer demonstrations conducted jointly by Ministry of Agriculture (MoA), Agricultural Transformation Agency (ATA) and partners using compound fertilizers containing other nutrients instead of Di ammonium phosphate (DAP). Application of potassium fertilizer was demonstrated in 2004 and resulted in increases of tons of wheat yields due to application of 50 kg ha-1 K2SO4 (Astatke et al., 2004). Similarly, other research works conducted in different locations and crops showed that application of potassium resulted in a significant yield increase of wheat (Haile and Mamo 2013; Hailu et al., 2015; Brhane et al., 2017), potato (Haile and Boke 2011; Ayalew and Beyene 2011; Shunka et al., 2016), teff and wheat (Mulugeta et al., 2017). Additionally, it is also common to see farmers in central highlands of Ethiopia applying wood ash on their Vertisols fields because of observing better growing condition due to the ash, which could be taken as an indication for the need of K application.
Both yield and quality, and thus the economic value of teff, could be strongly influenced by potassium fertilizer management. However, information pertaining to the level of K required for optimum yield of teff for different soil test K conditions in Ethiopia is lacking. In this paper, we present the results of field trials on the effect of different levels of K fertilizer on teff in Vertisols of the central highlands of Ethiopia. The objectives of the study were to diagnose teff yield response to K fertilizer at field level and to examine the relationship between soil available potassium and its concentration in the test crop.
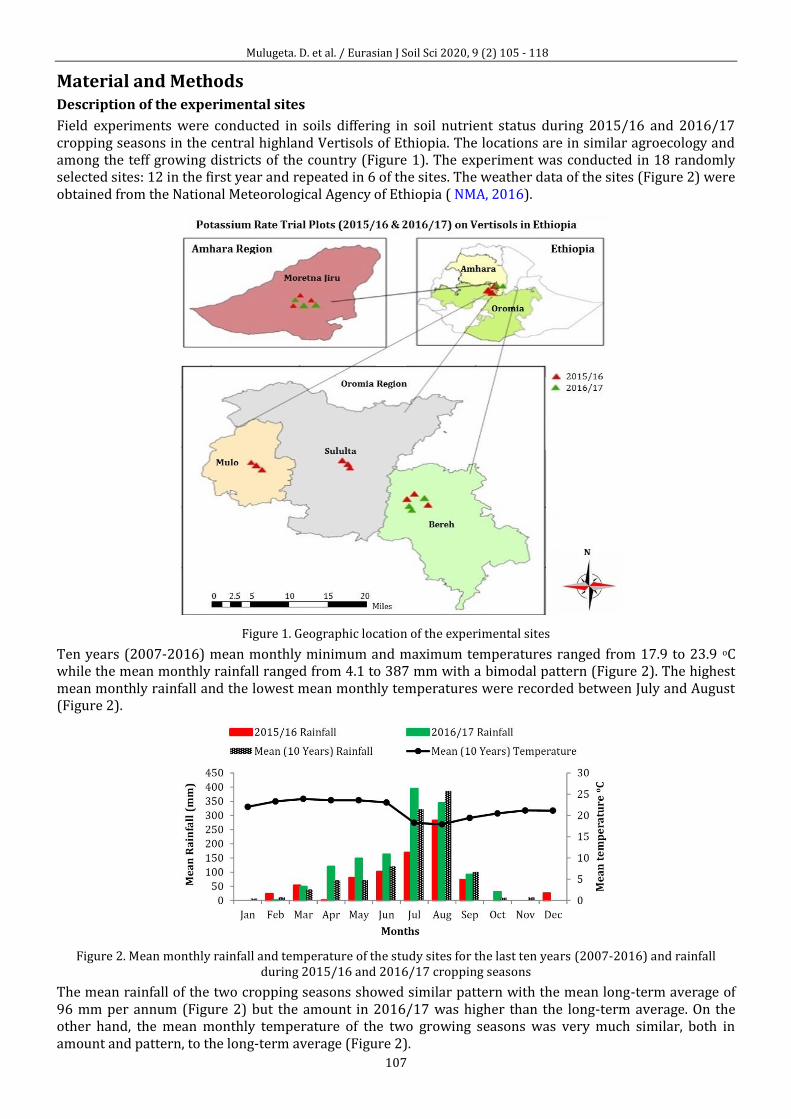
Mulugeta. D. et al. / Eurasian J Soil Sci 2020, 9 (2) 105 - 118
107
Material and Methods Description of the experimental sites
Field experiments were conducted in soils differing in soil nutrient status during 2015/16 and 2016/17 cropping seasons in the central highland Vertisols of Ethiopia. The locations are in similar agroecology and among the teff growing districts of the country (Figure 1). The experiment was conducted in 18 randomly selected sites: 12 in the first year and repeated in 6 of the sites. The weather data of the sites (Figure 2) were obtained from the National Meteorological Agency of Ethiopia ( NMA, 2016).
Figure 1. Geographic location of the experimental sites
Ten years (2007-2016) mean monthly minimum and maximum temperatures ranged from 17.9 to 23.9 oC while the mean monthly rainfall ranged from 4.1 to 387 mm with a bimodal pattern (Figure 2). The highest mean monthly rainfall and the lowest mean monthly temperatures were recorded between July and August (Figure 2).
Figure 2. Mean monthly rainfall and temperature of the study sites for the last ten years (2007-2016) and rainfall
during 2015/16 and 2016/17 cropping seasons
The mean rainfall of the two cropping seasons showed similar pattern with the mean long-term average of 96 mm per annum (Figure 2) but the amount in 2016/17 was higher than the long-term average. On the other hand, the mean monthly temperature of the two growing seasons was very much similar, both in amount and pattern, to the long-term average (Figure 2).
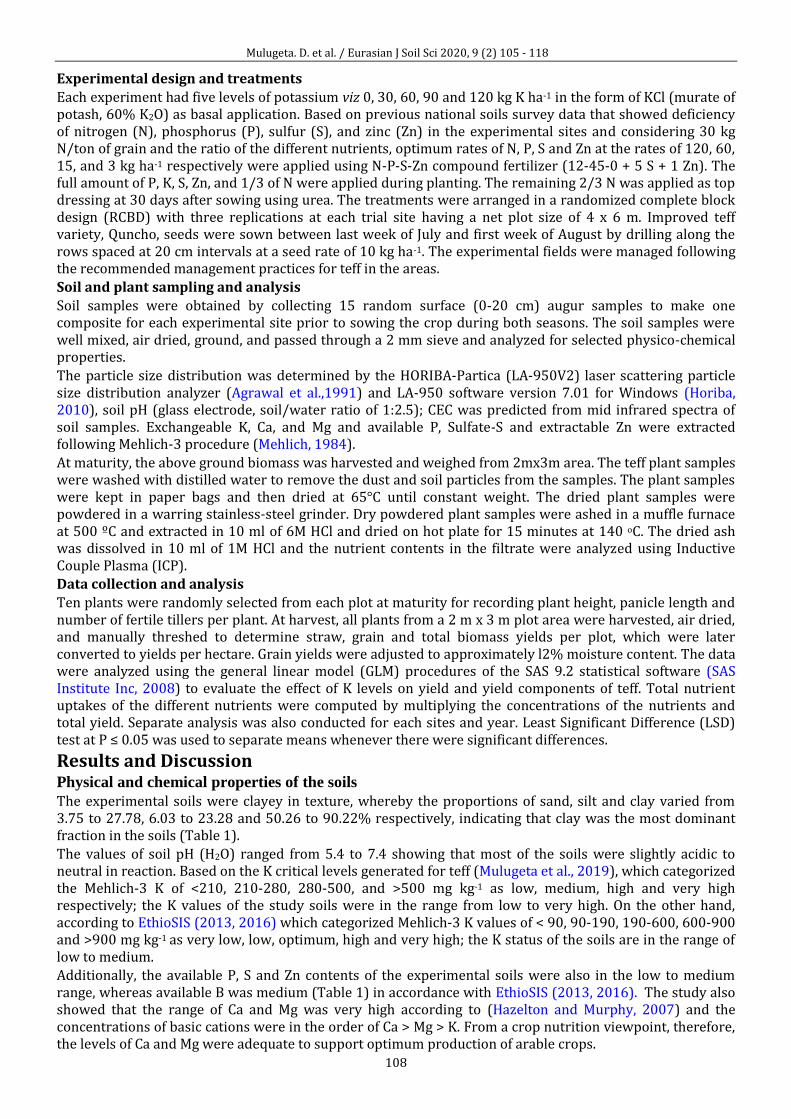
Mulugeta. D. et al. / Eurasian J Soil Sci 2020, 9 (2) 105 - 118
108
Experimental design and treatments
Each experiment had five levels of potassium viz 0, 30, 60, 90 and 120 kg K ha-1 in the form of KCl (murate of potash, 60% K2O) as basal application. Based on previous national soils survey data that showed deficiency of nitrogen (N), phosphorus (P), sulfur (S), and zinc (Zn) in the experimental sites and considering 30 kg N/ton of grain and the ratio of the different nutrients, optimum rates of N, P, S and Zn at the rates of 120, 60, 15, and 3 kg ha-1 respectively were applied using N-P-S-Zn compound fertilizer (12-45-0 + 5 S + 1 Zn). The full amount of P, K, S, Zn, and 1/3 of N were applied during planting. The remaining 2/3 N was applied as top dressing at 30 days after sowing using urea. The treatments were arranged in a randomized complete block design (RCBD) with three replications at each trial site having a net plot size of 4 x 6 m. Improved teff variety, Quncho, seeds were sown between last week of July and first week of August by drilling along the rows spaced at 20 cm intervals at a seed rate of 10 kg ha-1. The experimental fields were managed following the recommended management practices for teff in the areas.
Soil and plant sampling and analysis
Soil samples were obtained by collecting 15 random surface (0-20 cm) augur samples to make one composite for each experimental site prior to sowing the crop during both seasons. The soil samples were well mixed, air dried, ground, and passed through a 2 mm sieve and analyzed for selected physico-chemical properties.
The particle size distribution was determined by the HORIBA-Partica (LA-950V2) laser scattering particle size distribution analyzer (Agrawal et al.,1991) and LA-950 software version 7.01 for Windows (Horiba, 2010), soil pH (glass electrode, soil/water ratio of 1:2.5); CEC was predicted from mid infrared spectra of soil samples. Exchangeable K, Ca, and Mg and available P, Sulfate-S and extractable Zn were extracted following Mehlich-3 procedure (Mehlich, 1984).
At maturity, the above ground biomass was harvested and weighed from 2mx3m area. The teff plant samples were washed with distilled water to remove the dust and soil particles from the samples. The plant samples were kept in paper bags and then dried at 65°C until constant weight. The dried plant samples were powdered in a warring stainless-steel grinder. Dry powdered plant samples were ashed in a muffle furnace at 500 ºC and extracted in 10 ml of 6M HCl and dried on hot plate for 15 minutes at 140 oC. The dried ash was dissolved in 10 ml of 1M HCl and the nutrient contents in the filtrate were analyzed using Inductive Couple Plasma (ICP).
Data collection and analysis
Ten plants were randomly selected from each plot at maturity for recording plant height, panicle length and number of fertile tillers per plant. At harvest, all plants from a 2 m x 3 m plot area were harvested, air dried, and manually threshed to determine straw, grain and total biomass yields per plot, which were later converted to yields per hectare. Grain yields were adjusted to approximately l2% moisture content. The data were analyzed using the general linear model (GLM) procedures of the SAS 9.2 statistical software (SAS Institute Inc, 2008) to evaluate the effect of K levels on yield and yield components of teff. Total nutrient uptakes of the different nutrients were computed by multiplying the concentrations of the nutrients and total yield. Separate analysis was also conducted for each sites and year. Least Significant Difference (LSD) test at P ≤ 0.05 was used to separate means whenever there were significant differences.
Results and Discussion Physical and chemical properties of the soils
The experimental soils were clayey in texture, whereby the proportions of sand, silt and clay varied from 3.75 to 27.78, 6.03 to 23.28 and 50.26 to 90.22% respectively, indicating that clay was the most dominant fraction in the soils (Table 1).
The values of soil pH (H2O) ranged from 5.4 to 7.4 showing that most of the soils were slightly acidic to neutral in reaction. Based on the K critical levels generated for teff (Mulugeta et al., 2019), which categorized the Mehlich-3 K of <210, 210-280, 280-500, and >500 mg kg-1 as low, medium, high and very high respectively; the K values of the study soils were in the range from low to very high. On the other hand, according to EthioSIS (2013, 2016) which categorized Mehlich-3 K values of < 90, 90-190, 190-600, 600-900 and >900 mg kg-1 as very low, low, optimum, high and very high; the K status of the soils are in the range of low to medium. Additionally, the available P, S and Zn contents of the experimental soils were also in the low to medium range, whereas available B was medium (Table 1) in accordance with EthioSIS (2013, 2016). The study also showed that the range of Ca and Mg was very high according to (Hazelton and Murphy, 2007) and the concentrations of basic cations were in the order of Ca > Mg > K. From a crop nutrition viewpoint, therefore, the levels of Ca and Mg were adequate to support optimum production of arable crops.
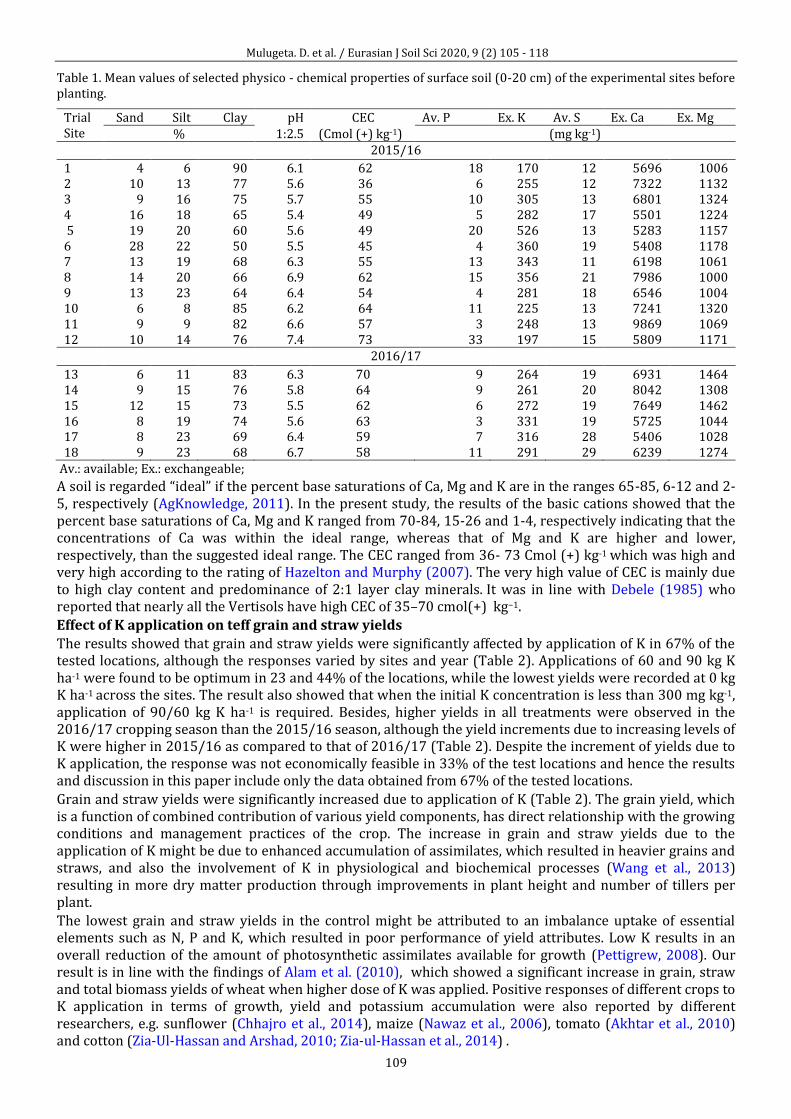
Mulugeta. D. et al. / Eurasian J Soil Sci 2020, 9 (2) 105 - 118
109
Table 1. Mean values of selected physico - chemical properties of surface soil (0-20 cm) of the experimental sites before planting.
Trial Site
Sand Silt Clay pH CEC Av. P Ex. K Av. S Ex. Ca Ex. Mg % 1:2.5 (Cmol (+) kg-1) (mg kg-1)
2015/16
1 4 6 90 6.1 62 18 170 12 5696 1006 2 10 13 77 5.6 36 6 255 12 7322 1132 3 9 16 75 5.7 55 10 305 13 6801 1324 4 16 18 65 5.4 49 5 282 17 5501 1224 5 19 20 60 5.6 49 20 526 13 5283 1157 6 28 22 50 5.5 45 4 360 19 5408 1178 7 13 19 68 6.3 55 13 343 11 6198 1061 8 14 20 66 6.9 62 15 356 21 7986 1000 9 13 23 64 6.4 54 4 281 18 6546 1004 10 6 8 85 6.2 64 11 225 13 7241 1320 11 9 9 82 6.6 57 3 248 13 9869 1069 12 10 14 76 7.4 73 33 197 15 5809 1171
2016/17
13 6 11 83 6.3 70 9 264 19 6931 1464 14 9 15 76 5.8 64 9 261 20 8042 1308 15 12 15 73 5.5 62 6 272 19 7649 1462 16 8 19 74 5.6 63 3 331 19 5725 1044 17 8 23 69 6.4 59 7 316 28 5406 1028 18 9 23 68 6.7 58 11 291 29 6239 1274
Av.: available; Ex.: exchangeable;
A soil is regarded “ideal” if the percent base saturations of Ca, Mg and K are in the ranges 65-85, 6-12 and 2-5, respectively (AgKnowledge, 2011). In the present study, the results of the basic cations showed that the percent base saturations of Ca, Mg and K ranged from 70-84, 15-26 and 1-4, respectively indicating that the concentrations of Ca was within the ideal range, whereas that of Mg and K are higher and lower, respectively, than the suggested ideal range. The CEC ranged from 36- 73 Cmol (+) kg-1 which was high and very high according to the rating of Hazelton and Murphy (2007). The very high value of CEC is mainly due to high clay content and predominance of 2:1 layer clay minerals. It was in line with Debele (1985) who reported that nearly all the Vertisols have high CEC of 35–70 cmol(+) kg−1.
Effect of K application on teff grain and straw yields
The results showed that grain and straw yields were significantly affected by application of K in 67% of the tested locations, although the responses varied by sites and year (Table 2). Applications of 60 and 90 kg K ha-1 were found to be optimum in 23 and 44% of the locations, while the lowest yields were recorded at 0 kg K ha-1 across the sites. The result also showed that when the initial K concentration is less than 300 mg kg-1, application of 90/60 kg K ha-1 is required. Besides, higher yields in all treatments were observed in the 2016/17 cropping season than the 2015/16 season, although the yield increments due to increasing levels of K were higher in 2015/16 as compared to that of 2016/17 (Table 2). Despite the increment of yields due to K application, the response was not economically feasible in 33% of the test locations and hence the results and discussion in this paper include only the data obtained from 67% of the tested locations.
Grain and straw yields were significantly increased due to application of K (Table 2). The grain yield, which is a function of combined contribution of various yield components, has direct relationship with the growing conditions and management practices of the crop. The increase in grain and straw yields due to the application of K might be due to enhanced accumulation of assimilates, which resulted in heavier grains and straws, and also the involvement of K in physiological and biochemical processes (Wang et al., 2013) resulting in more dry matter production through improvements in plant height and number of tillers per plant.
The lowest grain and straw yields in the control might be attributed to an imbalance uptake of essential elements such as N, P and K, which resulted in poor performance of yield attributes. Low K results in an overall reduction of the amount of photosynthetic assimilates available for growth (Pettigrew, 2008). Our result is in line with the findings of Alam et al. (2010), which showed a significant increase in grain, straw and total biomass yields of wheat when higher dose of K was applied. Positive responses of different crops to K application in terms of growth, yield and potassium accumulation were also reported by different researchers, e.g. sunflower (Chhajro et al., 2014), maize (Nawaz et al., 2006), tomato (Akhtar et al., 2010) and cotton (Zia-Ul-Hassan and Arshad, 2010; Zia-ul-Hassan et al., 2014) .
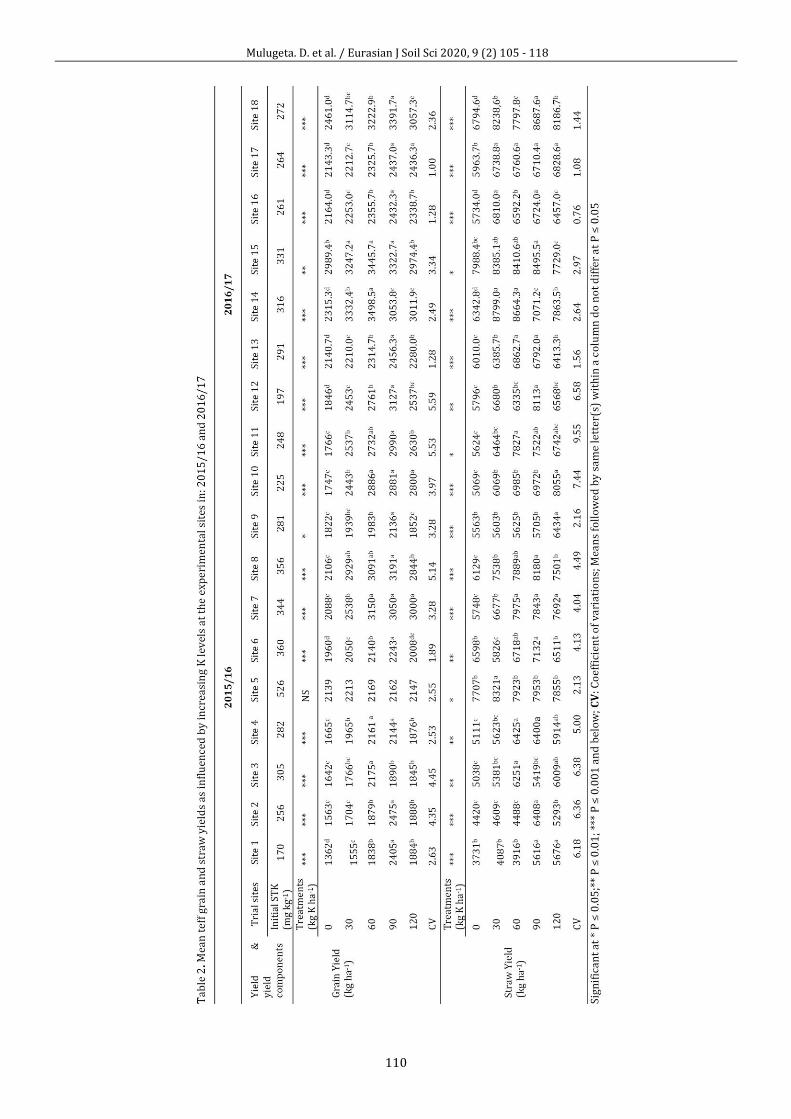
Mulugeta. D. et al. / Eurasian J Soil Sci 2020, 9 (2) 105 - 118
110
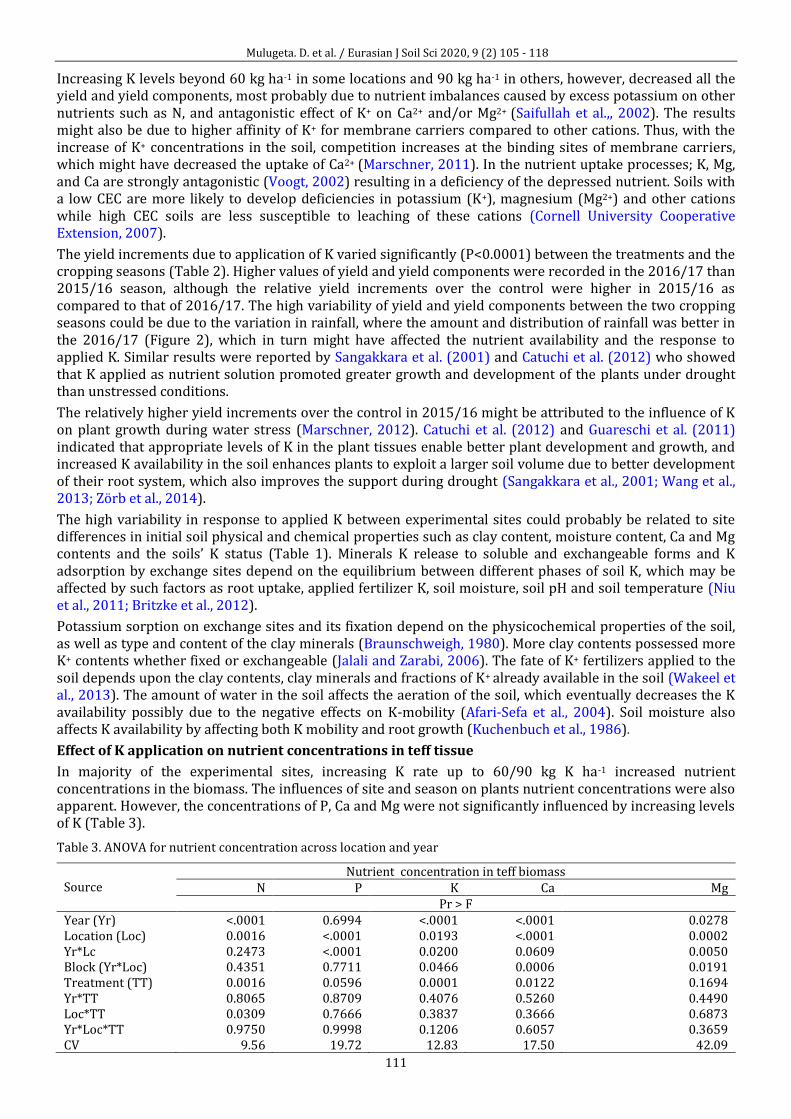
Mulugeta. D. et al. / Eurasian J Soil Sci 2020, 9 (2) 105 - 118
111
Increasing K levels beyond 60 kg ha-1 in some locations and 90 kg ha-1 in others, however, decreased all the yield and yield components, most probably due to nutrient imbalances caused by excess potassium on other nutrients such as N, and antagonistic effect of K+ on Ca2+ and/or Mg2+ (Saifullah et al.,, 2002). The results might also be due to higher affinity of K+ for membrane carriers compared to other cations. Thus, with the increase of K+ concentrations in the soil, competition increases at the binding sites of membrane carriers, which might have decreased the uptake of Ca2+ (Marschner, 2011). In the nutrient uptake processes; K, Mg, and Ca are strongly antagonistic (Voogt, 2002) resulting in a deficiency of the depressed nutrient. Soils with a low CEC are more likely to develop deficiencies in potassium (K+), magnesium (Mg2+) and other cations while high CEC soils are less susceptible to leaching of these cations (Cornell University Cooperative Extension, 2007).
The yield increments due to application of K varied significantly (P<0.0001) between the treatments and the cropping seasons (Table 2). Higher values of yield and yield components were recorded in the 2016/17 than 2015/16 season, although the relative yield increments over the control were higher in 2015/16 as compared to that of 2016/17. The high variability of yield and yield components between the two cropping seasons could be due to the variation in rainfall, where the amount and distribution of rainfall was better in the 2016/17 (Figure 2), which in turn might have affected the nutrient availability and the response to applied K. Similar results were reported by Sangakkara et al. (2001) and Catuchi et al. (2012) who showed that K applied as nutrient solution promoted greater growth and development of the plants under drought than unstressed conditions.
The relatively higher yield increments over the control in 2015/16 might be attributed to the influence of K on plant growth during water stress (Marschner, 2012). Catuchi et al. (2012) and Guareschi et al. (2011) indicated that appropriate levels of K in the plant tissues enable better plant development and growth, and increased K availability in the soil enhances plants to exploit a larger soil volume due to better development of their root system, which also improves the support during drought (Sangakkara et al., 2001; Wang et al., 2013; Zörb et al., 2014).
The high variability in response to applied K between experimental sites could probably be related to site differences in initial soil physical and chemical properties such as clay content, moisture content, Ca and Mg contents and the soils’ K status (Table 1). Minerals K release to soluble and exchangeable forms and K adsorption by exchange sites depend on the equilibrium between different phases of soil K, which may be affected by such factors as root uptake, applied fertilizer K, soil moisture, soil pH and soil temperature (Niu et al., 2011; Britzke et al., 2012).
Potassium sorption on exchange sites and its fixation depend on the physicochemical properties of the soil, as well as type and content of the clay minerals (Braunschweigh, 1980). More clay contents possessed more K+ contents whether fixed or exchangeable (Jalali and Zarabi, 2006). The fate of K+ fertilizers applied to the soil depends upon the clay contents, clay minerals and fractions of K+ already available in the soil (Wakeel et al., 2013). The amount of water in the soil affects the aeration of the soil, which eventually decreases the K availability possibly due to the negative effects on K-mobility (Afari-Sefa et al., 2004). Soil moisture also affects K availability by affecting both K mobility and root growth (Kuchenbuch et al., 1986).
Effect of K application on nutrient concentrations in teff tissue
In majority of the experimental sites, increasing K rate up to 60/90 kg K ha-1 increased nutrient concentrations in the biomass. The influences of site and season on plants nutrient concentrations were also apparent. However, the concentrations of P, Ca and Mg were not significantly influenced by increasing levels of K (Table 3).
Table 3. ANOVA for nutrient concentration across location and year
Source
Nutrient concentration in teff biomass N P K Ca Mg
Pr > F Year (Yr) <.0001 0.6994 <.0001 <.0001 0.0278 Location (Loc) 0.0016 <.0001 0.0193 <.0001 0.0002 Yr*Lc 0.2473 <.0001 0.0200 0.0609 0.0050 Block (Yr*Loc) 0.4351 0.7711 0.0466 0.0006 0.0191 Treatment (TT) 0.0016 0.0596 0.0001 0.0122 0.1694 Yr*TT 0.8065 0.8709 0.4076 0.5260 0.4490 Loc*TT 0.0309 0.7666 0.3837 0.3666 0.6873 Yr*Loc*TT 0.9750 0.9998 0.1206 0.6057 0.3659 CV 9.56 19.72 12.83 17.50 42.09
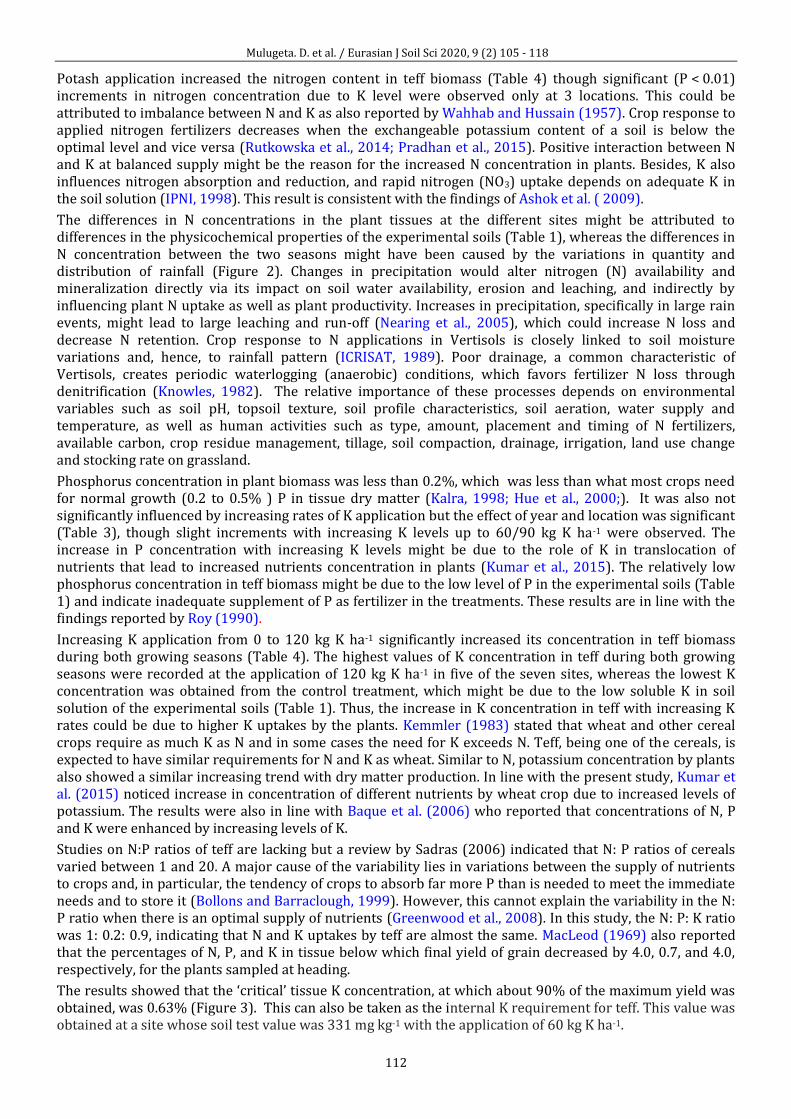
Mulugeta. D. et al. / Eurasian J Soil Sci 2020, 9 (2) 105 - 118
112
Potash application increased the nitrogen content in teff biomass (Table 4) though significant (P < 0.01) increments in nitrogen concentration due to K level were observed only at 3 locations. This could be attributed to imbalance between N and K as also reported by Wahhab and Hussain (1957). Crop response to applied nitrogen fertilizers decreases when the exchangeable potassium content of a soil is below the optimal level and vice versa (Rutkowska et al., 2014; Pradhan et al., 2015). Positive interaction between N and K at balanced supply might be the reason for the increased N concentration in plants. Besides, K also influences nitrogen absorption and reduction, and rapid nitrogen (NO3) uptake depends on adequate K in the soil solution (IPNI, 1998). This result is consistent with the findings of Ashok et al. ( 2009).
The differences in N concentrations in the plant tissues at the different sites might be attributed to differences in the physicochemical properties of the experimental soils (Table 1), whereas the differences in N concentration between the two seasons might have been caused by the variations in quantity and distribution of rainfall (Figure 2). Changes in precipitation would alter nitrogen (N) availability and mineralization directly via its impact on soil water availability, erosion and leaching, and indirectly by influencing plant N uptake as well as plant productivity. Increases in precipitation, specifically in large rain events, might lead to large leaching and run-off (Nearing et al., 2005), which could increase N loss and decrease N retention. Crop response to N applications in Vertisols is closely linked to soil moisture variations and, hence, to rainfall pattern (ICRISAT, 1989). Poor drainage, a common characteristic of Vertisols, creates periodic waterlogging (anaerobic) conditions, which favors fertilizer N loss through denitrification (Knowles, 1982). The relative importance of these processes depends on environmental variables such as soil pH, topsoil texture, soil profile characteristics, soil aeration, water supply and temperature, as well as human activities such as type, amount, placement and timing of N fertilizers, available carbon, crop residue management, tillage, soil compaction, drainage, irrigation, land use change and stocking rate on grassland.
Phosphorus concentration in plant biomass was less than 0.2%, which was less than what most crops need for normal growth (0.2 to 0.5% ) P in tissue dry matter (Kalra, 1998; Hue et al., 2000;). It was also not significantly influenced by increasing rates of K application but the effect of year and location was significant (Table 3), though slight increments with increasing K levels up to 60/90 kg K ha-1 were observed. The increase in P concentration with increasing K levels might be due to the role of K in translocation of nutrients that lead to increased nutrients concentration in plants (Kumar et al., 2015). The relatively low phosphorus concentration in teff biomass might be due to the low level of P in the experimental soils (Table 1) and indicate inadequate supplement of P as fertilizer in the treatments. These results are in line with the findings reported by Roy (1990).
Increasing K application from 0 to 120 kg K ha-1 significantly increased its concentration in teff biomass during both growing seasons (Table 4). The highest values of K concentration in teff during both growing seasons were recorded at the application of 120 kg K ha-1 in five of the seven sites, whereas the lowest K concentration was obtained from the control treatment, which might be due to the low soluble K in soil solution of the experimental soils (Table 1). Thus, the increase in K concentration in teff with increasing K rates could be due to higher K uptakes by the plants. Kemmler (1983) stated that wheat and other cereal crops require as much K as N and in some cases the need for K exceeds N. Teff, being one of the cereals, is expected to have similar requirements for N and K as wheat. Similar to N, potassium concentration by plants also showed a similar increasing trend with dry matter production. In line with the present study, Kumar et al. (2015) noticed increase in concentration of different nutrients by wheat crop due to increased levels of potassium. The results were also in line with Baque et al. (2006) who reported that concentrations of N, P and K were enhanced by increasing levels of K.
Studies on N:P ratios of teff are lacking but a review by Sadras (2006) indicated that N: P ratios of cereals varied between 1 and 20. A major cause of the variability lies in variations between the supply of nutrients to crops and, in particular, the tendency of crops to absorb far more P than is needed to meet the immediate needs and to store it (Bollons and Barraclough, 1999). However, this cannot explain the variability in the N: P ratio when there is an optimal supply of nutrients (Greenwood et al., 2008). In this study, the N: P: K ratio was 1: 0.2: 0.9, indicating that N and K uptakes by teff are almost the same. MacLeod (1969) also reported that the percentages of N, P, and K in tissue below which final yield of grain decreased by 4.0, 0.7, and 4.0, respectively, for the plants sampled at heading.
The results showed that the ‘critical’ tissue K concentration, at which about 90% of the maximum yield was obtained, was 0.63% (Figure 3). This can also be taken as the internal K requirement for teff. This value was obtained at a site whose soil test value was 331 mg kg-1 with the application of 60 kg K ha-1.
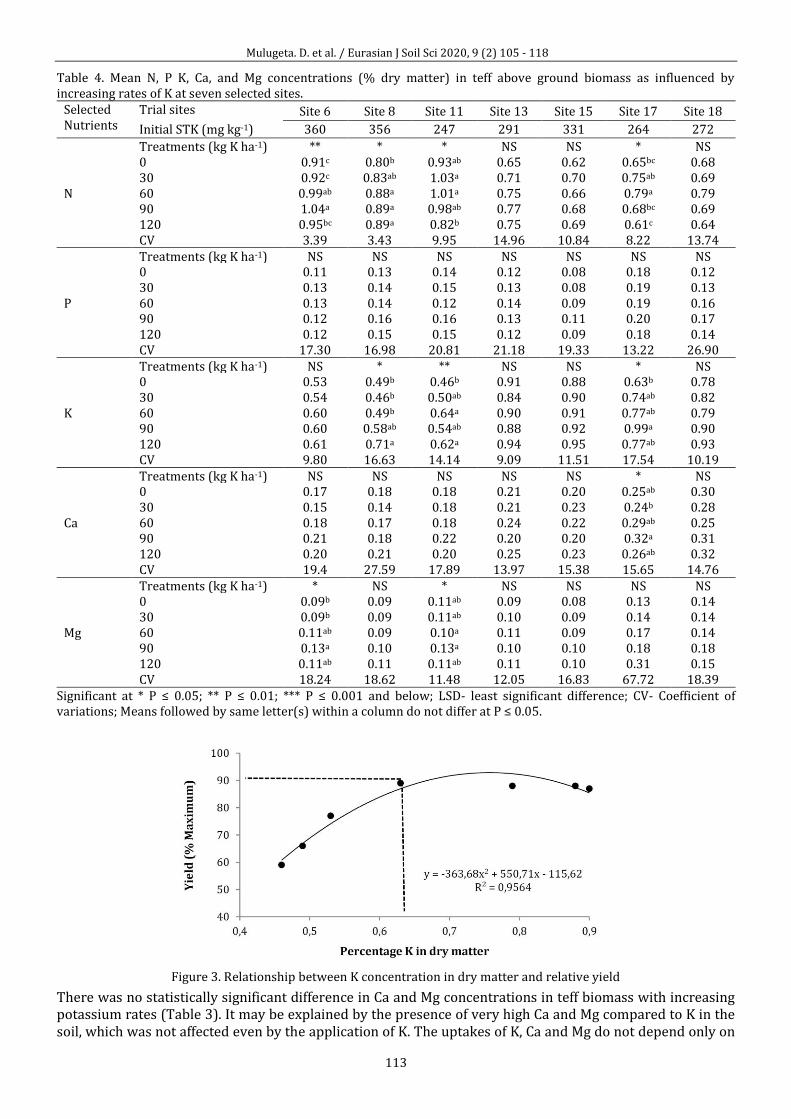
Mulugeta. D. et al. / Eurasian J Soil Sci 2020, 9 (2) 105 - 118
113
Table 4. Mean N, P K, Ca, and Mg concentrations (% dry matter) in teff above ground biomass as influenced by increasing rates of K at seven selected sites.
Selected Nutrients
Trial sites Site 6 Site 8 Site 11 Site 13 Site 15 Site 17 Site 18
Initial STK (mg kg-1) 360 356 247 291 331 264 272
N
Treatments (kg K ha-1) ** * * NS NS * NS 0 0.91c 0.80b 0.93ab 0.65 0.62 0.65bc 0.68 30 0.92c 0.83ab 1.03a 0.71 0.70 0.75ab 0.69 60 0.99ab 0.88a 1.01a 0.75 0.66 0.79a 0.79 90 1.04a 0.89a 0.98ab 0.77 0.68 0.68bc 0.69 120 0.95bc 0.89a 0.82b 0.75 0.69 0.61c 0.64 CV 3.39 3.43 9.95 14.96 10.84 8.22 13.74
P
Treatments (kg K ha-1) NS NS NS NS NS NS NS 0 0.11 0.13 0.14 0.12 0.08 0.18 0.12 30 0.13 0.14 0.15 0.13 0.08 0.19 0.13 60 0.13 0.14 0.12 0.14 0.09 0.19 0.16 90 0.12 0.16 0.16 0.13 0.11 0.20 0.17 120 0.12 0.15 0.15 0.12 0.09 0.18 0.14 CV 17.30 16.98 20.81 21.18 19.33 13.22 26.90
K
Treatments (kg K ha-1) NS * ** NS NS * NS 0 0.53 0.49b 0.46b 0.91 0.88 0.63b 0.78 30 0.54 0.46b 0.50ab 0.84 0.90 0.74ab 0.82 60 0.60 0.49b 0.64a 0.90 0.91 0.77ab 0.79 90 0.60 0.58ab 0.54ab 0.88 0.92 0.99a 0.90 120 0.61 0.71a 0.62a 0.94 0.95 0.77ab 0.93 CV 9.80 16.63 14.14 9.09 11.51 17.54 10.19
Ca
Treatments (kg K ha-1) NS NS NS NS NS * NS 0 0.17 0.18 0.18 0.21 0.20 0.25ab 0.30 30 0.15 0.14 0.18 0.21 0.23 0.24b 0.28 60 0.18 0.17 0.18 0.24 0.22 0.29ab 0.25 90 0.21 0.18 0.22 0.20 0.20 0.32a 0.31 120 0.20 0.21 0.20 0.25 0.23 0.26ab 0.32 CV 19.4 27.59 17.89 13.97 15.38 15.65 14.76
Mg
Treatments (kg K ha-1) * NS * NS NS NS NS 0 0.09b 0.09 0.11ab 0.09 0.08 0.13 0.14 30 0.09b 0.09 0.11ab 0.10 0.09 0.14 0.14 60 0.11ab 0.09 0.10a 0.11 0.09 0.17 0.14 90 0.13a 0.10 0.13a 0.10 0.10 0.18 0.18 120 0.11ab 0.11 0.11ab 0.11 0.10 0.31 0.15 CV 18.24 18.62 11.48 12.05 16.83 67.72 18.39
Significant at * P ≤ 0.05; ** P ≤ 0.01; *** P ≤ 0.001 and below; LSD- least significant difference; CV- Coefficient of variations; Means followed by same letter(s) within a column do not differ at P ≤ 0.05.
Figure 3. Relationship between K concentration in dry matter and relative yield
There was no statistically significant difference in Ca and Mg concentrations in teff biomass with increasing potassium rates (Table 3). It may be explained by the presence of very high Ca and Mg compared to K in the soil, which was not affected even by the application of K. The uptakes of K, Ca and Mg do not depend only on
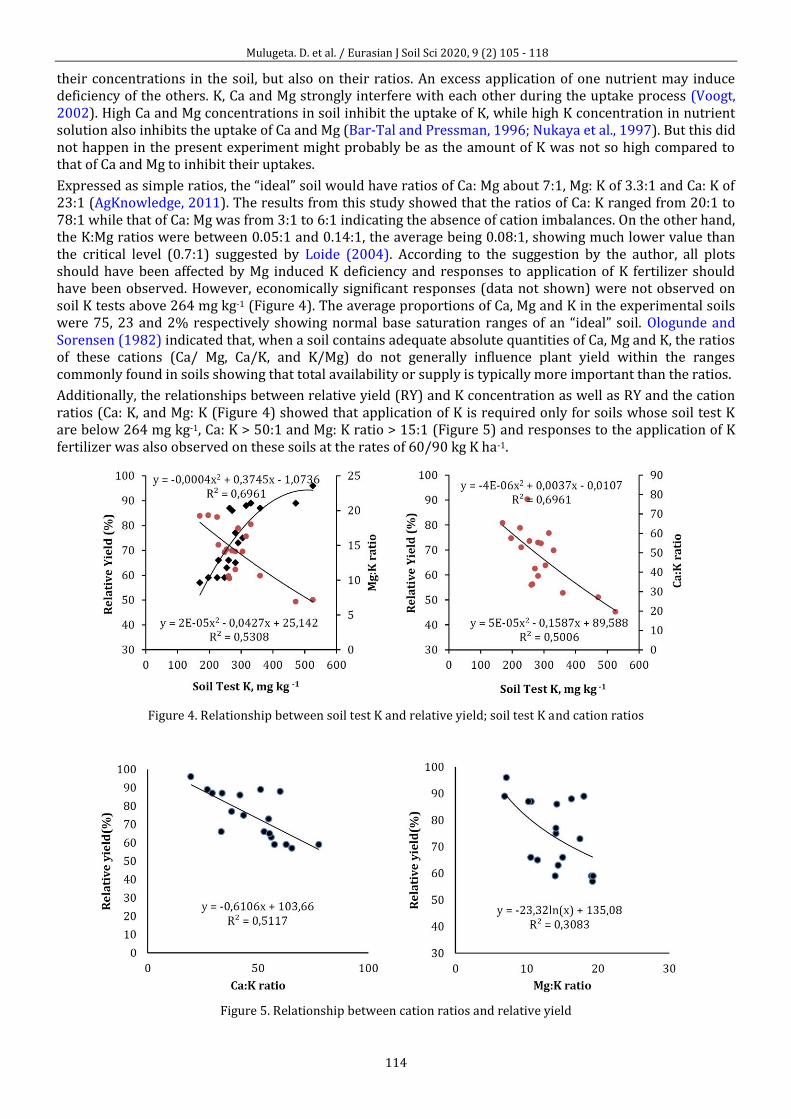
Mulugeta. D. et al. / Eurasian J Soil Sci 2020, 9 (2) 105 - 118
114
their concentrations in the soil, but also on their ratios. An excess application of one nutrient may induce deficiency of the others. K, Ca and Mg strongly interfere with each other during the uptake process (Voogt, 2002). High Ca and Mg concentrations in soil inhibit the uptake of K, while high K concentration in nutrient solution also inhibits the uptake of Ca and Mg (Bar-Tal and Pressman, 1996; Nukaya et al., 1997). But this did not happen in the present experiment might probably be as the amount of K was not so high compared to that of Ca and Mg to inhibit their uptakes.
Expressed as simple ratios, the “ideal” soil would have ratios of Ca: Mg about 7:1, Mg: K of 3.3:1 and Ca: K of 23:1 (AgKnowledge, 2011). The results from this study showed that the ratios of Ca: K ranged from 20:1 to 78:1 while that of Ca: Mg was from 3:1 to 6:1 indicating the absence of cation imbalances. On the other hand, the K:Mg ratios were between 0.05:1 and 0.14:1, the average being 0.08:1, showing much lower value than the critical level (0.7:1) suggested by Loide (2004). According to the suggestion by the author, all plots should have been affected by Mg induced K deficiency and responses to application of K fertilizer should have been observed. However, economically significant responses (data not shown) were not observed on soil K tests above 264 mg kg-1 (Figure 4). The average proportions of Ca, Mg and K in the experimental soils were 75, 23 and 2% respectively showing normal base saturation ranges of an “ideal” soil. Ologunde and Sorensen (1982) indicated that, when a soil contains adequate absolute quantities of Ca, Mg and K, the ratios of these cations (Ca/ Mg, Ca/K, and K/Mg) do not generally influence plant yield within the ranges commonly found in soils showing that total availability or supply is typically more important than the ratios.
Additionally, the relationships between relative yield (RY) and K concentration as well as RY and the cation ratios (Ca: K, and Mg: K (Figure 4) showed that application of K is required only for soils whose soil test K are below 264 mg kg-1, Ca: K > 50:1 and Mg: K ratio > 15:1 (Figure 5) and responses to the application of K fertilizer was also observed on these soils at the rates of 60/90 kg K ha-1.
Figure 4. Relationship between soil test K and relative yield; soil test K and cation ratios
Figure 5. Relationship between cation ratios and relative yield
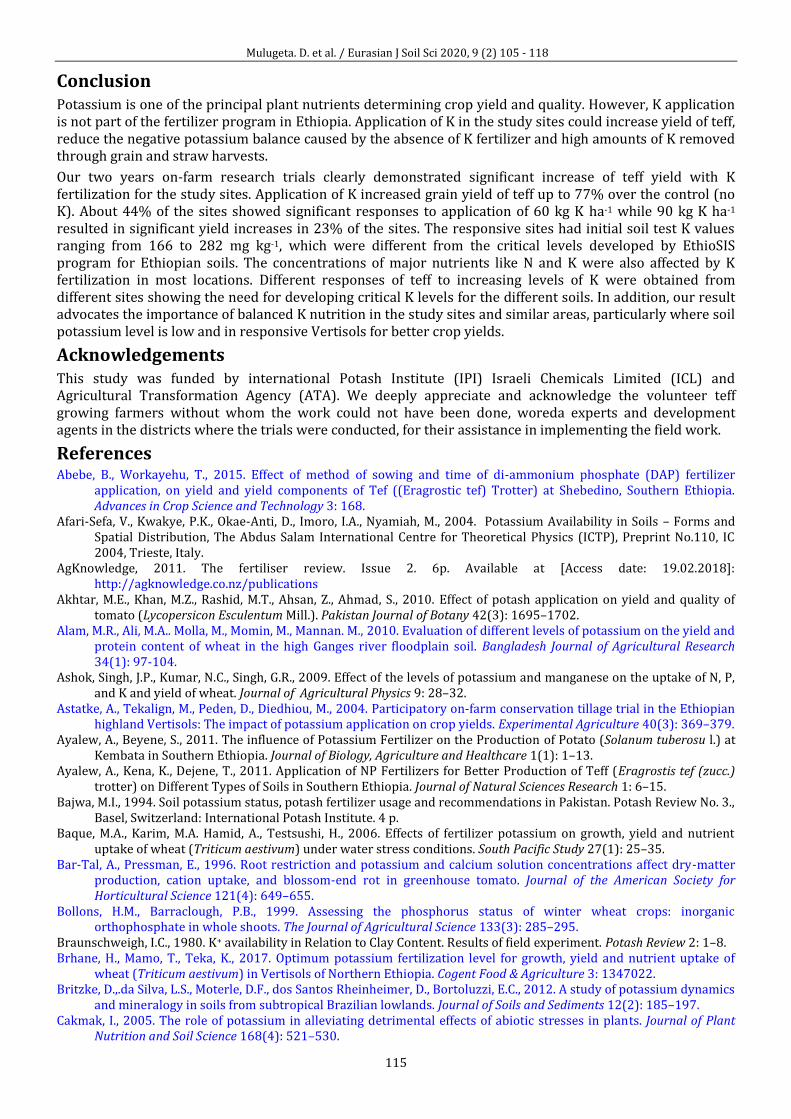
Mulugeta. D. et al. / Eurasian J Soil Sci 2020, 9 (2) 105 - 118
115
Conclusion Potassium is one of the principal plant nutrients determining crop yield and quality. However, K application is not part of the fertilizer program in Ethiopia. Application of K in the study sites could increase yield of teff, reduce the negative potassium balance caused by the absence of K fertilizer and high amounts of K removed through grain and straw harvests.
Our two years on-farm research trials clearly demonstrated significant increase of teff yield with K fertilization for the study sites. Application of K increased grain yield of teff up to 77% over the control (no K). About 44% of the sites showed significant responses to application of 60 kg K ha-1 while 90 kg K ha-1 resulted in significant yield increases in 23% of the sites. The responsive sites had initial soil test K values ranging from 166 to 282 mg kg-1, which were different from the critical levels developed by EthioSIS program for Ethiopian soils. The concentrations of major nutrients like N and K were also affected by K fertilization in most locations. Different responses of teff to increasing levels of K were obtained from different sites showing the need for developing critical K levels for the different soils. In addition, our result advocates the importance of balanced K nutrition in the study sites and similar areas, particularly where soil potassium level is low and in responsive Vertisols for better crop yields.
Acknowledgements This study was funded by international Potash Institute (IPI) Israeli Chemicals Limited (ICL) and Agricultural Transformation Agency (ATA). We deeply appreciate and acknowledge the volunteer teff growing farmers without whom the work could not have been done, woreda experts and development agents in the districts where the trials were conducted, for their assistance in implementing the field work.
References Abebe, B., Workayehu, T., 2015. Effect of method of sowing and time of di-ammonium phosphate (DAP) fertilizer
application, on yield and yield components of Tef ((Eragrostic tef) Trotter) at Shebedino, Southern Ethiopia. Advances in Crop Science and Technology 3: 168.
Afari-Sefa, V., Kwakye, P.K., Okae-Anti, D., Imoro, I.A., Nyamiah, M., 2004. Potassium Availability in Soils – Forms and Spatial Distribution, The Abdus Salam International Centre for Theoretical Physics (ICTP), Preprint No.110, IC 2004, Trieste, Italy.
AgKnowledge, 2011. The fertiliser review. Issue 2. 6p. Available at [Access date: 19.02.2018]: http://agknowledge.co.nz/publications
Akhtar, M.E., Khan, M.Z., Rashid, M.T., Ahsan, Z., Ahmad, S., 2010. Effect of potash application on yield and quality of tomato (Lycopersicon Esculentum Mill.). Pakistan Journal of Botany 42(3): 1695–1702.
Alam, M.R., Ali, M.A.. Molla, M., Momin, M., Mannan. M., 2010. Evaluation of different levels of potassium on the yield and protein content of wheat in the high Ganges river floodplain soil. Bangladesh Journal of Agricultural Research 34(1): 97-104.
Ashok, Singh, J.P., Kumar, N.C., Singh, G.R., 2009. Effect of the levels of potassium and manganese on the uptake of N, P, and K and yield of wheat. Journal of Agricultural Physics 9: 28–32.
Astatke, A., Tekalign, M., Peden, D., Diedhiou, M., 2004. Participatory on-farm conservation tillage trial in the Ethiopian highland Vertisols: The impact of potassium application on crop yields. Experimental Agriculture 40(3): 369–379.
Ayalew, A., Beyene, S., 2011. The influence of Potassium Fertilizer on the Production of Potato (Solanum tuberosu l.) at Kembata in Southern Ethiopia. Journal of Biology, Agriculture and Healthcare 1(1): 1–13.
Ayalew, A., Kena, K., Dejene, T., 2011. Application of NP Fertilizers for Better Production of Teff (Eragrostis tef (zucc.) trotter) on Different Types of Soils in Southern Ethiopia. Journal of Natural Sciences Research 1: 6–15.
Bajwa, M.I., 1994. Soil potassium status, potash fertilizer usage and recommendations in Pakistan. Potash Review No. 3., Basel, Switzerland: International Potash Institute. 4 p.
Baque, M.A., Karim, M.A. Hamid, A., Testsushi, H., 2006. Effects of fertilizer potassium on growth, yield and nutrient uptake of wheat (Triticum aestivum) under water stress conditions. South Pacific Study 27(1): 25–35.
Bar-Tal, A., Pressman, E., 1996. Root restriction and potassium and calcium solution concentrations affect dry-matter production, cation uptake, and blossom-end rot in greenhouse tomato. Journal of the American Society for Horticultural Science 121(4): 649–655.
Bollons, H.M., Barraclough, P.B., 1999. Assessing the phosphorus status of winter wheat crops: inorganic orthophosphate in whole shoots. The Journal of Agricultural Science 133(3): 285–295.
Braunschweigh, I.C., 1980. K+ availability in Relation to Clay Content. Results of field experiment. Potash Review 2: 1–8. Brhane, H., Mamo, T., Teka, K., 2017. Optimum potassium fertilization level for growth, yield and nutrient uptake of
wheat (Triticum aestivum) in Vertisols of Northern Ethiopia. Cogent Food & Agriculture 3: 1347022. Britzke, D.,.da Silva, L.S., Moterle, D.F., dos Santos Rheinheimer, D., Bortoluzzi, E.C., 2012. A study of potassium dynamics
and mineralogy in soils from subtropical Brazilian lowlands. Journal of Soils and Sediments 12(2): 185–197. Cakmak, I., 2005. The role of potassium in alleviating detrimental effects of abiotic stresses in plants. Journal of Plant
Nutrition and Soil Science 168(4): 521–530.
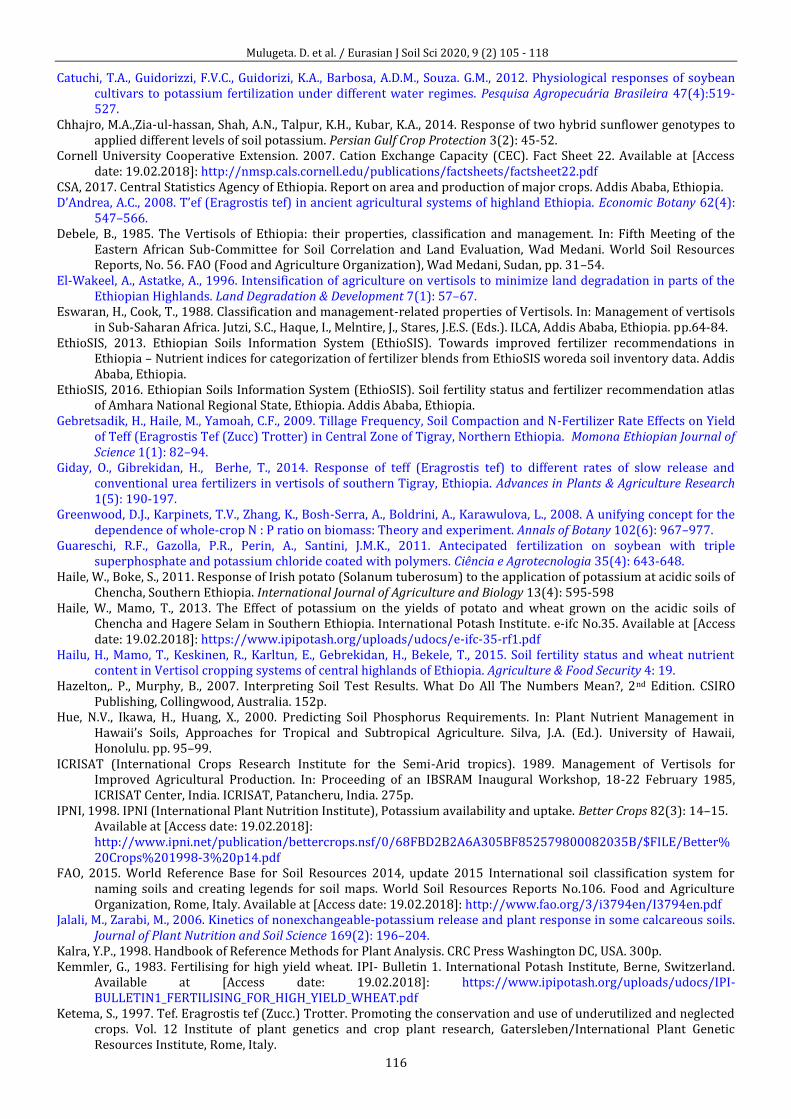
Mulugeta. D. et al. / Eurasian J Soil Sci 2020, 9 (2) 105 - 118
116
Catuchi, T.A., Guidorizzi, F.V.C., Guidorizi, K.A., Barbosa, A.D.M., Souza. G.M., 2012. Physiological responses of soybean cultivars to potassium fertilization under different water regimes. Pesquisa Agropecuária Brasileira 47(4):519-527.
Chhajro, M.A.,Zia-ul-hassan, Shah, A.N., Talpur, K.H., Kubar, K.A., 2014. Response of two hybrid sunflower genotypes to applied different levels of soil potassium. Persian Gulf Crop Protection 3(2): 45-52.
Cornell University Cooperative Extension. 2007. Cation Exchange Capacity (CEC). Fact Sheet 22. Available at [Access date: 19.02.2018]: http://nmsp.cals.cornell.edu/publications/factsheets/factsheet22.pdf
CSA, 2017. Central Statistics Agency of Ethiopia. Report on area and production of major crops. Addis Ababa, Ethiopia. D’Andrea, A.C., 2008. T’ef (Eragrostis tef) in ancient agricultural systems of highland Ethiopia. Economic Botany 62(4):
547–566. Debele, B., 1985. The Vertisols of Ethiopia: their properties, classification and management. In: Fifth Meeting of the
Eastern African Sub-Committee for Soil Correlation and Land Evaluation, Wad Medani. World Soil Resources Reports, No. 56. FAO (Food and Agriculture Organization), Wad Medani, Sudan, pp. 31–54.
El-Wakeel, A., Astatke, A., 1996. Intensification of agriculture on vertisols to minimize land degradation in parts of the Ethiopian Highlands. Land Degradation & Development 7(1): 57–67.
Eswaran, H., Cook, T., 1988. Classification and management-related properties of Vertisols. In: Management of vertisols in Sub-Saharan Africa. Jutzi, S.C., Haque, I., Melntire, J., Stares, J.E.S. (Eds.). ILCA, Addis Ababa, Ethiopia. pp.64-84.
EthioSIS, 2013. Ethiopian Soils Information System (EthioSIS). Towards improved fertilizer recommendations in Ethiopia – Nutrient indices for categorization of fertilizer blends from EthioSIS woreda soil inventory data. Addis Ababa, Ethiopia.
EthioSIS, 2016. Ethiopian Soils Information System (EthioSIS). Soil fertility status and fertilizer recommendation atlas of Amhara National Regional State, Ethiopia. Addis Ababa, Ethiopia.
Gebretsadik, H., Haile, M., Yamoah, C.F., 2009. Tillage Frequency, Soil Compaction and N-Fertilizer Rate Effects on Yield of Teff (Eragrostis Tef (Zucc) Trotter) in Central Zone of Tigray, Northern Ethiopia. Momona Ethiopian Journal of Science 1(1): 82–94.
Giday, O., Gibrekidan, H., Berhe, T., 2014. Response of teff (Eragrostis tef) to different rates of slow release and conventional urea fertilizers in vertisols of southern Tigray, Ethiopia. Advances in Plants & Agriculture Research 1(5): 190-197.
Greenwood, D.J., Karpinets, T.V., Zhang, K., Bosh-Serra, A., Boldrini, A., Karawulova, L., 2008. A unifying concept for the dependence of whole-crop N : P ratio on biomass: Theory and experiment. Annals of Botany 102(6): 967–977.
Guareschi, R.F., Gazolla, P.R., Perin, A., Santini, J.M.K., 2011. Antecipated fertilization on soybean with triple superphosphate and potassium chloride coated with polymers. Ciência e Agrotecnologia 35(4): 643-648.
Haile, W., Boke, S., 2011. Response of Irish potato (Solanum tuberosum) to the application of potassium at acidic soils of Chencha, Southern Ethiopia. International Journal of Agriculture and Biology 13(4): 595-598
Haile, W., Mamo, T., 2013. The Effect of potassium on the yields of potato and wheat grown on the acidic soils of Chencha and Hagere Selam in Southern Ethiopia. International Potash Institute. e-ifc No.35. Available at [Access date: 19.02.2018]: https://www.ipipotash.org/uploads/udocs/e-ifc-35-rf1.pdf
Hailu, H., Mamo, T., Keskinen, R., Karltun, E., Gebrekidan, H., Bekele, T., 2015. Soil fertility status and wheat nutrient content in Vertisol cropping systems of central highlands of Ethiopia. Agriculture & Food Security 4: 19.
Hazelton,. P., Murphy, B., 2007. Interpreting Soil Test Results. What Do All The Numbers Mean?, 2nd Edition. CSIRO Publishing, Collingwood, Australia. 152p.
Hue, N.V., Ikawa, H., Huang, X., 2000. Predicting Soil Phosphorus Requirements. In: Plant Nutrient Management in Hawaii’s Soils, Approaches for Tropical and Subtropical Agriculture. Silva, J.A. (Ed.). University of Hawaii, Honolulu. pp. 95–99.
ICRISAT (International Crops Research Institute for the Semi-Arid tropics). 1989. Management of Vertisols for Improved Agricultural Production. In: Proceeding of an IBSRAM Inaugural Workshop, 18-22 February 1985, ICRISAT Center, India. ICRISAT, Patancheru, India. 275p.
IPNI, 1998. IPNI (International Plant Nutrition Institute), Potassium availability and uptake. Better Crops 82(3): 14–15. Available at [Access date: 19.02.2018]: http://www.ipni.net/publication/bettercrops.nsf/0/68FBD2B2A6A305BF852579800082035B/$FILE/Better%20Crops%201998-3%20p14.pdf
FAO, 2015. World Reference Base for Soil Resources 2014, update 2015 International soil classification system for naming soils and creating legends for soil maps. World Soil Resources Reports No.106. Food and Agriculture Organization, Rome, Italy. Available at [Access date: 19.02.2018]: http://www.fao.org/3/i3794en/I3794en.pdf
Jalali, M., Zarabi, M., 2006. Kinetics of nonexchangeable‐potassium release and plant response in some calcareous soils. Journal of Plant Nutrition and Soil Science 169(2): 196–204.
Kalra, Y.P., 1998. Handbook of Reference Methods for Plant Analysis. CRC Press Washington DC, USA. 300p. Kemmler, G., 1983. Fertilising for high yield wheat. IPI- Bulletin 1. International Potash Institute, Berne, Switzerland.
Available at [Access date: 19.02.2018]: https://www.ipipotash.org/uploads/udocs/IPI-BULLETIN1_FERTILISING_FOR_HIGH_YIELD_WHEAT.pdf
Ketema, S., 1997. Tef. Eragrostis tef (Zucc.) Trotter. Promoting the conservation and use of underutilized and neglected crops. Vol. 12 Institute of plant genetics and crop plant research, Gatersleben/International Plant Genetic Resources Institute, Rome, Italy.
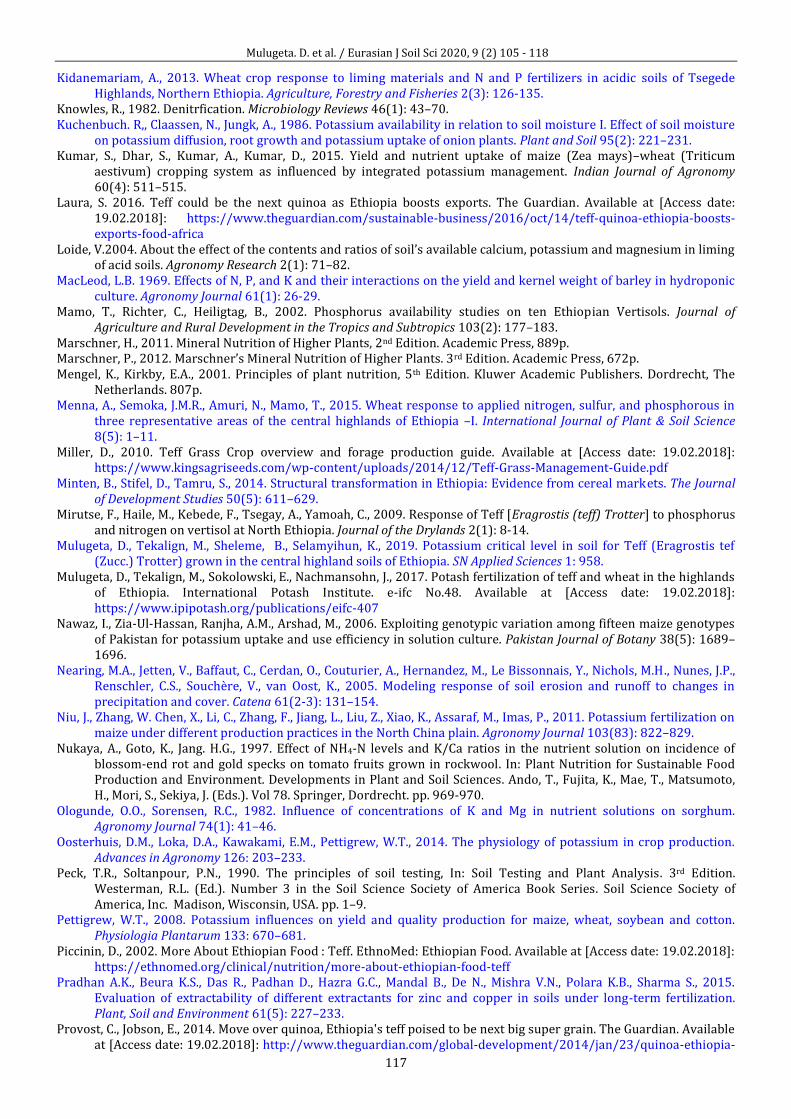
Mulugeta. D. et al. / Eurasian J Soil Sci 2020, 9 (2) 105 - 118
117
Kidanemariam, A., 2013. Wheat crop response to liming materials and N and P fertilizers in acidic soils of Tsegede Highlands, Northern Ethiopia. Agriculture, Forestry and Fisheries 2(3): 126-135.
Knowles, R., 1982. Denitrfication. Microbiology Reviews 46(1): 43–70. Kuchenbuch. R,, Claassen, N., Jungk, A., 1986. Potassium availability in relation to soil moisture I. Effect of soil moisture
on potassium diffusion, root growth and potassium uptake of onion plants. Plant and Soil 95(2): 221–231. Kumar, S., Dhar, S., Kumar, A., Kumar, D., 2015. Yield and nutrient uptake of maize (Zea mays)–wheat (Triticum
aestivum) cropping system as influenced by integrated potassium management. Indian Journal of Agronomy 60(4): 511–515.
Laura, S. 2016. Teff could be the next quinoa as Ethiopia boosts exports. The Guardian. Available at [Access date: 19.02.2018]: https://www.theguardian.com/sustainable-business/2016/oct/14/teff-quinoa-ethiopia-boosts-exports-food-africa
Loide, V.2004. About the effect of the contents and ratios of soil’s available calcium, potassium and magnesium in liming of acid soils. Agronomy Research 2(1): 71–82.
MacLeod, L.B. 1969. Effects of N, P, and K and their interactions on the yield and kernel weight of barley in hydroponic culture. Agronomy Journal 61(1): 26-29.
Mamo, T., Richter, C., Heiligtag, B., 2002. Phosphorus availability studies on ten Ethiopian Vertisols. Journal of Agriculture and Rural Development in the Tropics and Subtropics 103(2): 177–183.
Marschner, H., 2011. Mineral Nutrition of Higher Plants, 2nd Edition. Academic Press, 889p. Marschner, P., 2012. Marschner’s Mineral Nutrition of Higher Plants. 3rd Edition. Academic Press, 672p. Mengel, K., Kirkby, E.A., 2001. Principles of plant nutrition, 5th Edition. Kluwer Academic Publishers. Dordrecht, The
Netherlands. 807p. Menna, A., Semoka, J.M.R., Amuri, N., Mamo, T., 2015. Wheat response to applied nitrogen, sulfur, and phosphorous in
three representative areas of the central highlands of Ethiopia –I. International Journal of Plant & Soil Science 8(5): 1–11.
Miller, D., 2010. Teff Grass Crop overview and forage production guide. Available at [Access date: 19.02.2018]: https://www.kingsagriseeds.com/wp-content/uploads/2014/12/Teff-Grass-Management-Guide.pdf
Minten, B., Stifel, D., Tamru, S., 2014. Structural transformation in Ethiopia: Evidence from cereal markets. The Journal of Development Studies 50(5): 611–629.
Mirutse, F., Haile, M., Kebede, F., Tsegay, A., Yamoah, C., 2009. Response of Teff [Eragrostis (teff) Trotter] to phosphorus and nitrogen on vertisol at North Ethiopia. Journal of the Drylands 2(1): 8-14.
Mulugeta, D., Tekalign, M., Sheleme, B., Selamyihun, K., 2019. Potassium critical level in soil for Teff (Eragrostis tef (Zucc.) Trotter) grown in the central highland soils of Ethiopia. SN Applied Sciences 1: 958.
Mulugeta, D., Tekalign, M., Sokolowski, E., Nachmansohn, J., 2017. Potash fertilization of teff and wheat in the highlands of Ethiopia. International Potash Institute. e-ifc No.48. Available at [Access date: 19.02.2018]: https://www.ipipotash.org/publications/eifc-407
Nawaz, I., Zia-Ul-Hassan, Ranjha, A.M., Arshad, M., 2006. Exploiting genotypic variation among fifteen maize genotypes of Pakistan for potassium uptake and use efficiency in solution culture. Pakistan Journal of Botany 38(5): 1689–1696.
Nearing, M.A., Jetten, V., Baffaut, C., Cerdan, O., Couturier, A., Hernandez, M., Le Bissonnais, Y., Nichols, M.H., Nunes, J.P., Renschler, C.S., Souchère, V., van Oost, K., 2005. Modeling response of soil erosion and runoff to changes in precipitation and cover. Catena 61(2-3): 131–154.
Niu, J., Zhang, W. Chen, X., Li, C., Zhang, F., Jiang, L., Liu, Z., Xiao, K., Assaraf, M., Imas, P., 2011. Potassium fertilization on maize under different production practices in the North China plain. Agronomy Journal 103(83): 822–829.
Nukaya, A., Goto, K., Jang. H.G., 1997. Effect of NH4-N levels and K/Ca ratios in the nutrient solution on incidence of blossom-end rot and gold specks on tomato fruits grown in rockwool. In: Plant Nutrition for Sustainable Food Production and Environment. Developments in Plant and Soil Sciences. Ando, T., Fujita, K., Mae, T., Matsumoto, H., Mori, S., Sekiya, J. (Eds.). Vol 78. Springer, Dordrecht. pp. 969-970.
Ologunde, O.O., Sorensen, R.C., 1982. Influence of concentrations of K and Mg in nutrient solutions on sorghum. Agronomy Journal 74(1): 41–46.
Oosterhuis, D.M., Loka, D.A., Kawakami, E.M., Pettigrew, W.T., 2014. The physiology of potassium in crop production. Advances in Agronomy 126: 203–233.
Peck, T.R., Soltanpour, P.N., 1990. The principles of soil testing, In: Soil Testing and Plant Analysis. 3rd Edition. Westerman, R.L. (Ed.). Number 3 in the Soil Science Society of America Book Series. Soil Science Society of America, Inc. Madison, Wisconsin, USA. pp. 1–9.
Pettigrew, W.T., 2008. Potassium influences on yield and quality production for maize, wheat, soybean and cotton. Physiologia Plantarum 133: 670–681.
Piccinin, D., 2002. More About Ethiopian Food : Teff. EthnoMed: Ethiopian Food. Available at [Access date: 19.02.2018]: https://ethnomed.org/clinical/nutrition/more-about-ethiopian-food-teff
Pradhan A.K., Beura K.S., Das R., Padhan D., Hazra G.C., Mandal B., De N., Mishra V.N., Polara K.B., Sharma S., 2015. Evaluation of extractability of different extractants for zinc and copper in soils under long-term fertilization. Plant, Soil and Environment 61(5): 227–233.
Provost, C., Jobson, E., 2014. Move over quinoa, Ethiopia's teff poised to be next big super grain. The Guardian. Available at [Access date: 19.02.2018]: http://www.theguardian.com/global-development/2014/jan/23/quinoa-ethiopia-
Mulugeta. D. et al. / Eurasian J Soil Sci 2020, 9 (2) 105 - 118
118
teff-super-grain Rana, S.S., Rana, M.C., 2011. Cropping System. Palampur 176062, India. Available at [Access date: 19.02.2018]:
https://pdfs.semanticscholar.org/1a52/6685055e2c8502a88bc24fee5aa36aff4fc0.pdf Renton, A., 2014. Get a taste for teff, the Ethiopian superfood. The Guardian. Available at [Access date: 19.02.2018]:
http://www.theguardian.com/global-development/poverty-matters/2014/jan/23/get-taste-for-teff-ethiopia-superfood
Roy, H.K., Kumar, A., Sinha, K., 1990. Response of wheat to potassium in red loam (Alfisols) soils of Ranchi. Journal of Potassium Research 6(1): 23-28
Rutkowska, A., Pikuła, D., Stępień, W., 2014. Nitrogen use efficiency of maize and spring barley under potassium fertilization in long-term field experiment. Plant, Soil and Environment 60(12): 550–554.
Sadras, V.O., 2006. The N:P stoichiometry of cereal, grain legume and oilseed crops. Field Crops Research 95(1): 13–29. Saifullah, Ranjha, A.M., Yaseenand, M., Akhtar, M.E., 2002. Response of wheat to potassium fertilization under field
conditions. Pakistan Journal of Agricultural Sciences 39:269–272. Sangakkara, U.R., Frehner, M., Nösberger, J., 2001. Influence of soil moisture and fertilizer potassium on the vegetative
growth of Mungbean (Vigna radiata L. Wilczek) and Cowpea (Vigna unguiculata L. Walp). Journal of Agronomy and Crop Science 81(2): 73–81.
SAS Institute Inc. 2008. SAS/STAT 9.2 User’s Guide, in: SAS/STAT 9.2 User’s Guide. Shunka, E., Chindi, A., W/giorgis, G., Seid, E., Tessma, L., 2016. Response of potato (Solanum tuberosum L.) varieties to
nitrogen and potassium fertilizer rates in central highlands of Ethiopia. Advances in Crop Science and Technology 4:.50.
Voogt, W., 2002. Potassium management of vegetables under ıntensive growth conditions. In: Potassium for sustainable crop production. Pasricha, N.S., Bansal, S.K. (Eds.). International Potash Institute, Bern, Switzerland. pp. 347-362
Wahhab, A., Hussain, I., 1957. Effect of nitrogen on growth, quality, and yield of ırrigated wheat in west Pakistan. Agronomy Journal 49(3): 116–119.
Wakeel, A., Gul, M., Sanaullah, M., 2013. Potassium dynamics in three alluvial soils differing in clay contents. Emirates Journal of Food and Agriculture 25(1): 39–44.
Wang, M., Zheng, Q., Shen, Q., Guo. S., 2013. The critical role of potassium in plant stress response. International Journal of Molecular Sciences 14(4): 7370–7390.
Wubie, A.A., 2015. Review on Vertisol Management for the Improvement of Crop Productivity in Ethiopia. Journal of Biology, Agriculture and Healthcare 5(12): 92–103.
Zia-Ul-Hassan, Arshad, M., 2010. Cotton growth under potassium deficiency stress is influenced by photosynthetic apparatus and root system. Pakistan Journal of Botany 42(2): 917–925.
Zia-Ul-Hassan, Kubar, K.A., Rajpar, I., Shah, A.N., Tunio, S.D., Shah J.A., Maitlo, A.A., 2014. Evaluating potassium-use-efficiency of five cotton genotypes of Pakistan. Pakistan Journal of Botany 46(4): 1237–1242.
Zörb, C., Senbayram, M., Peiter, E., 2014. Potassium in agriculture – Status and perspectives. Journal of Plant Physiology 171(9): 656-669.
O. Alsalam et al. / Eurasian J Soil Sci 2020, 9 (2) 140 - 150
140
Quantifying the role of chemical weathering rates on soil developed along an altitudinal transect in the mountainous
environments, Turkey Omar Alsalam a,*, Cevdet Şeker b, Mert Dedeoğlu b
a Baghdad University, Faculty of Agriculture, Department of Soil Science and Water Resources, Baghdad, Iraq b Selçuk University, Faculty of Agriculture, Department of Soil Science and Plant Nutrition, Konya, Turkey
Abstract Article Info Received : 21.06.2019 Accepted : 07.02.2020
Climate and elevations play an important role in controlling rate of weathering and soil formation. The role of chemical weathering rate on soil developed along an altitudinal transect in the mountainous environments in Turkey was investigated to determine the effects of climate on the geochemical characteristics of the soil. The main purposes of this study were: i) To characterize the geochemical characteristics of soils as a function of climate ii) To evaluate the soil formation and decomposition rates in Climosequence depending on the elevation by using geochemical data. For this purpose, four representative profiles were dug at different elevations. The transect of four soils formed in limestone elevations from 1139 to 1809 m. Our results showed that the rate of chemical weathering of CIA, CIW, PIA and MIA indicators decreased with the increase in elevation. In contrast, WIP value increased at higher altitudes and exhibited different weathering directions by deviating from the main trend in the A–CN–K diagram that composition of weathered soils was easily influenced by the quantity of precipitation, degree of gradient and height differences. Therefore, it was concluded that the main factors determining soil development was climate and elevations, and both determine the leaching regime and weathering rates.
Keywords: Climosequence, elevations, geochemical, soil development, weathering index.
© 2020 Federation of Eurasian Soil Science Societies. All rights reserved
Introduction Soil development is closely associated with specific weathering intensities under special mountainous environmental conditions Baumann et al. (2014). Soil development occurs through numerous physical, biological and chemical weathering processes acting to alter the parent rock on the soil surface. The formation of soils (pedogenesis) is a process by which weathering alters constituents within the parent material through the loss of more mobile (i.e., soluble) elements, concurrent enrichment of less mobile elements Le Blond et al. (2015). It is well established that soil-pedogenesis processes result in losses, gains or redistribution of elements, and that not all elements are affected in the same way. Elements are also recycled by the forest vegetation and such recycling can play a major role in soil development and the redistribution of elements. This is mainly the case with forest ecosystems, which are very efficient at recycling major nutrients. (Barbosa et al., 2015; Rate and Sheikh-Abdullah, 2017). Geochemical-based weathering indices are commonly used to measure and compare the relative extent and intensity of soil pedogenesis based on the chemistry of the surface soils (Osat et al., 2016) and weathering indices are used for evaluating soil fertility and development, demonstrating the impact of climate on soil surface weathering (Price and Velbel, 2003; Baumann et al., 2014). Chemical weathering indices incorporate major element oxides chemistry into a single value for each sample Egli et al. (2006). Studies in the regions of altitudinal gradient characterized by decreasing temperatures and increasing rainfalls, have shown the influence of the climatic contrast on soil formation, studies on sequences
* Corresponding author. Baghdad University, Faculty of Agriculture, Department of Soil Science and Water Resources, Baghdad, Iraq Tel.: +90 539 4332321 E-mail address: [email protected] e-ISSN: 2147-4249 DOI: 10.18393/ejss.xxxxxxx
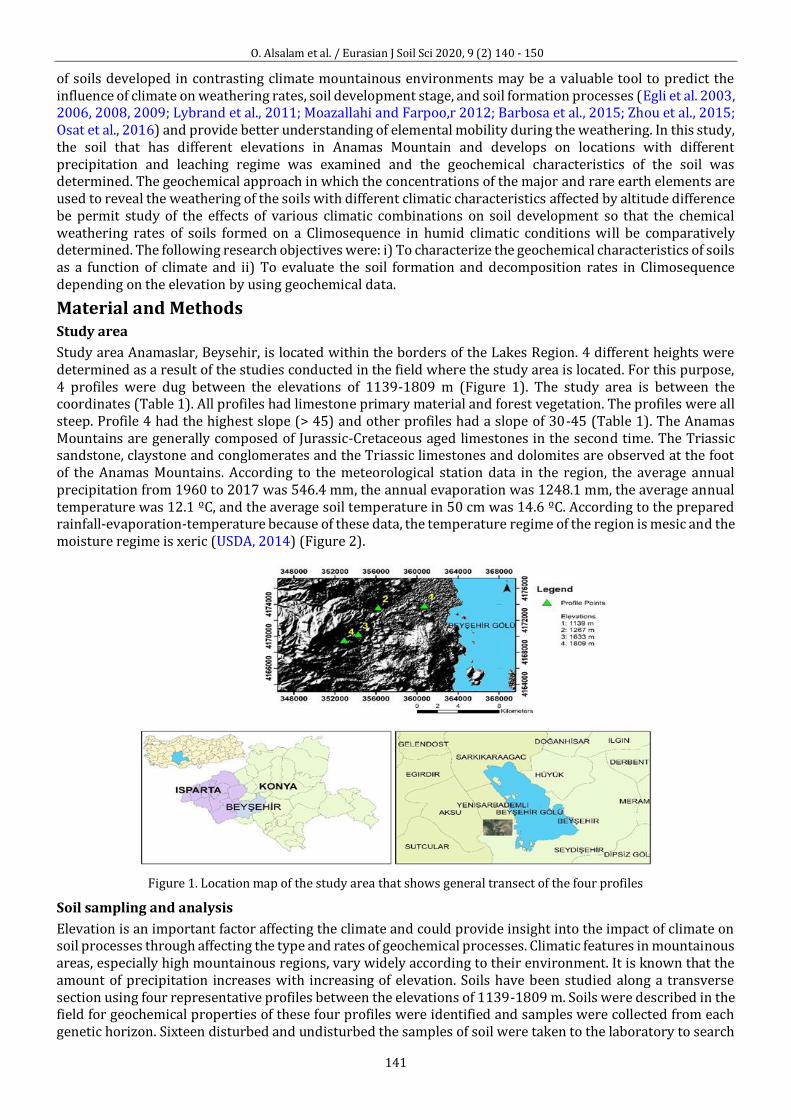
O. Alsalam et al. / Eurasian J Soil Sci 2020, 9 (2) 140 - 150
141
of soils developed in contrasting climate mountainous environments may be a valuable tool to predict the influence of climate on weathering rates, soil development stage, and soil formation processes (Egli et al. 2003, 2006, 2008, 2009; Lybrand et al., 2011; Moazallahi and Farpoo,r 2012; Barbosa et al., 2015; Zhou et al., 2015; Osat et al., 2016) and provide better understanding of elemental mobility during the weathering. In this study, the soil that has different elevations in Anamas Mountain and develops on locations with different precipitation and leaching regime was examined and the geochemical characteristics of the soil was determined. The geochemical approach in which the concentrations of the major and rare earth elements are used to reveal the weathering of the soils with different climatic characteristics affected by altitude difference be permit study of the effects of various climatic combinations on soil development so that the chemical weathering rates of soils formed on a Climosequence in humid climatic conditions will be comparatively determined. The following research objectives were: i) To characterize the geochemical characteristics of soils as a function of climate and ii) To evaluate the soil formation and decomposition rates in Climosequence depending on the elevation by using geochemical data.
Material and Methods Study area
Study area Anamaslar, Beysehir, is located within the borders of the Lakes Region. 4 different heights were determined as a result of the studies conducted in the field where the study area is located. For this purpose, 4 profiles were dug between the elevations of 1139-1809 m (Figure 1). The study area is between the coordinates (Table 1). All profiles had limestone primary material and forest vegetation. The profiles were all steep. Profile 4 had the highest slope (> 45) and other profiles had a slope of 30-45 (Table 1). The Anamas Mountains are generally composed of Jurassic-Cretaceous aged limestones in the second time. The Triassic sandstone, claystone and conglomerates and the Triassic limestones and dolomites are observed at the foot of the Anamas Mountains. According to the meteorological station data in the region, the average annual precipitation from 1960 to 2017 was 546.4 mm, the annual evaporation was 1248.1 mm, the average annual temperature was 12.1 ºC, and the average soil temperature in 50 cm was 14.6 ºC. According to the prepared rainfall-evaporation-temperature because of these data, the temperature regime of the region is mesic and the moisture regime is xeric (USDA, 2014) (Figure 2).
Figure 1. Location map of the study area that shows general transect of the four profiles
Soil sampling and analysis
Elevation is an important factor affecting the climate and could provide insight into the impact of climate on soil processes through affecting the type and rates of geochemical processes. Climatic features in mountainous areas, especially high mountainous regions, vary widely according to their environment. It is known that the amount of precipitation increases with increasing of elevation. Soils have been studied along a transverse section using four representative profiles between the elevations of 1139-1809 m. Soils were described in the field for geochemical properties of these four profiles were identified and samples were collected from each genetic horizon. Sixteen disturbed and undisturbed the samples of soil were taken to the laboratory to search
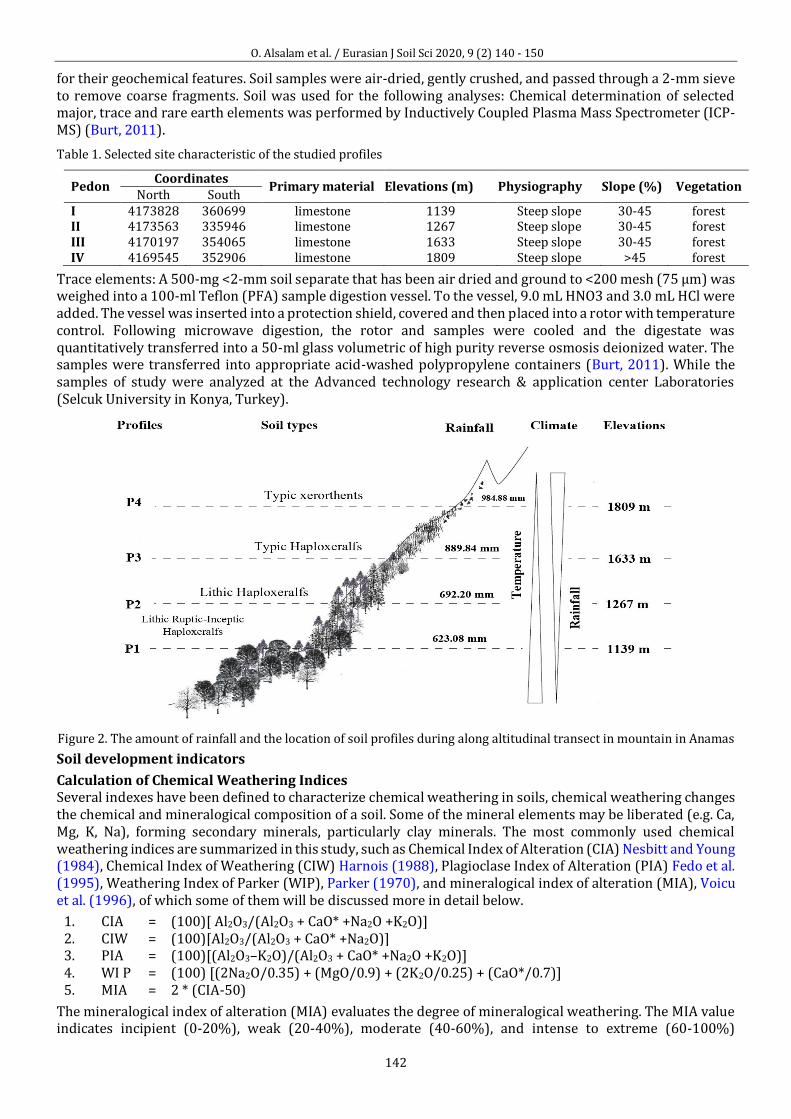
O. Alsalam et al. / Eurasian J Soil Sci 2020, 9 (2) 140 - 150
142
for their geochemical features. Soil samples were air-dried, gently crushed, and passed through a 2-mm sieve to remove coarse fragments. Soil was used for the following analyses: Chemical determination of selected major, trace and rare earth elements was performed by Inductively Coupled Plasma Mass Spectrometer (ICP-MS) (Burt, 2011).
Table 1. Selected site characteristic of the studied profiles
Pedon Coordinates
Primary material Elevations (m) Physiography Slope (%) Vegetation North South
I 4173828 360699 limestone 1139 Steep slope 30-45 forest II 4173563 335946 limestone 1267 Steep slope 30-45 forest III 4170197 354065 limestone 1633 Steep slope 30-45 forest IV 4169545 352906 limestone 1809 Steep slope >45 forest
Trace elements: A 500-mg <2-mm soil separate that has been air dried and ground to <200 mesh (75 µm) was weighed into a 100-ml Teflon (PFA) sample digestion vessel. To the vessel, 9.0 mL HNO3 and 3.0 mL HCl were added. The vessel was inserted into a protection shield, covered and then placed into a rotor with temperature control. Following microwave digestion, the rotor and samples were cooled and the digestate was quantitatively transferred into a 50-ml glass volumetric of high purity reverse osmosis deionized water. The samples were transferred into appropriate acid-washed polypropylene containers (Burt, 2011). While the samples of study were analyzed at the Advanced technology research & application center Laboratories (Selcuk University in Konya, Turkey).
Figure 2. The amount of rainfall and the location of soil profiles during along altitudinal transect in mountain in Anamas
Soil development indicators
Calculation of Chemical Weathering Indices Several indexes have been defined to characterize chemical weathering in soils, chemical weathering changes the chemical and mineralogical composition of a soil. Some of the mineral elements may be liberated (e.g. Ca, Mg, K, Na), forming secondary minerals, particularly clay minerals. The most commonly used chemical weathering indices are summarized in this study, such as Chemical Index of Alteration (CIA) Nesbitt and Young (1984), Chemical Index of Weathering (CIW) Harnois (1988), Plagioclase Index of Alteration (PIA) Fedo et al. (1995), Weathering Index of Parker (WIP), Parker (1970), and mineralogical index of alteration (MIA), Voicu et al. (1996), of which some of them will be discussed more in detail below.
1. CIA = (100)[ Al2O3/(Al2O3 + CaO* +Na2O +K2O)] 2. CIW = (100)[Al2O3/(Al2O3 + CaO* +Na2O)] 3. PIA = (100)[(Al2O3–K2O)/(Al2O3 + CaO* +Na2O +K2O)] 4. WI P = (100) [(2Na2O/0.35) + (MgO/0.9) + (2K2O/0.25) + (CaO*/0.7)] 5. MIA = 2 * (CIA-50)
The mineralogical index of alteration (MIA) evaluates the degree of mineralogical weathering. The MIA value indicates incipient (0-20%), weak (20-40%), moderate (40-60%), and intense to extreme (60-100%)
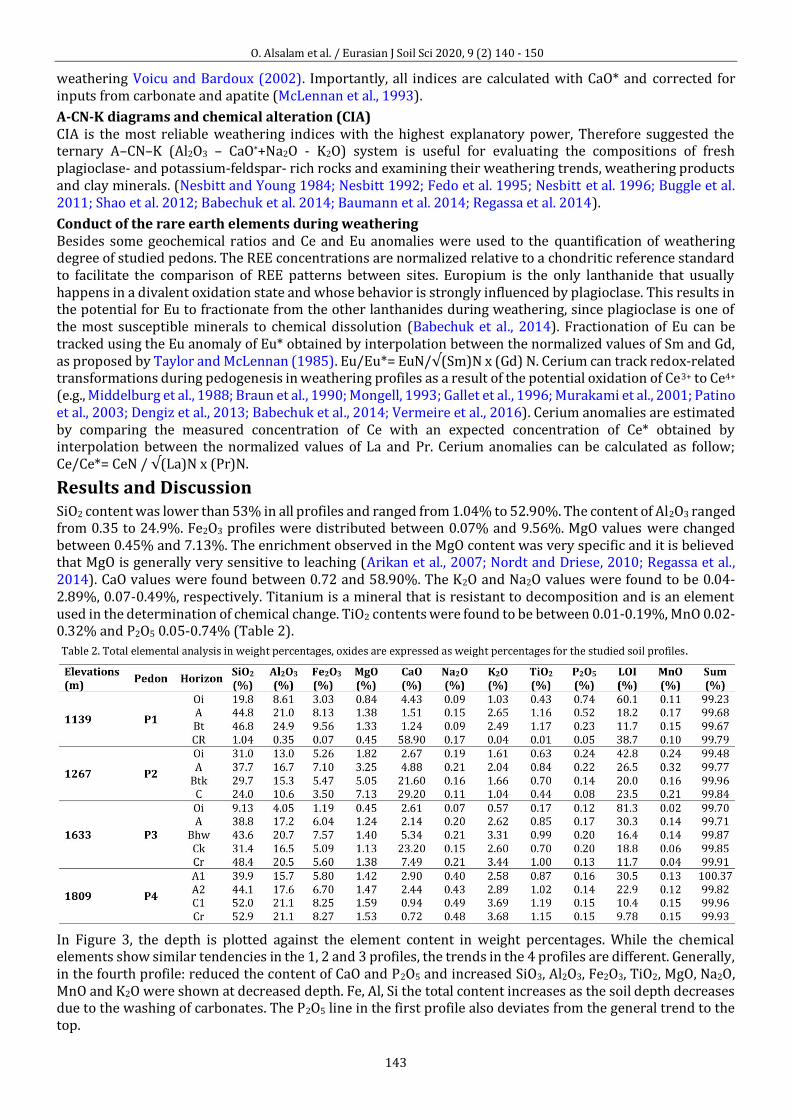
O. Alsalam et al. / Eurasian J Soil Sci 2020, 9 (2) 140 - 150
143
weathering Voicu and Bardoux (2002). Importantly, all indices are calculated with CaO* and corrected for inputs from carbonate and apatite (McLennan et al., 1993).
A-CN-K diagrams and chemical alteration (CIA) CIA is the most reliable weathering indices with the highest explanatory power, Therefore suggested the ternary A–CN–K (Al2O3 – CaO*+Na2O - K2O) system is useful for evaluating the compositions of fresh plagioclase- and potassium-feldspar- rich rocks and examining their weathering trends, weathering products and clay minerals. (Nesbitt and Young 1984; Nesbitt 1992; Fedo et al. 1995; Nesbitt et al. 1996; Buggle et al. 2011; Shao et al. 2012; Babechuk et al. 2014; Baumann et al. 2014; Regassa et al. 2014).
Conduct of the rare earth elements during weathering Besides some geochemical ratios and Ce and Eu anomalies were used to the quantification of weathering degree of studied pedons. The REE concentrations are normalized relative to a chondritic reference standard to facilitate the comparison of REE patterns between sites. Europium is the only lanthanide that usually happens in a divalent oxidation state and whose behavior is strongly influenced by plagioclase. This results in the potential for Eu to fractionate from the other lanthanides during weathering, since plagioclase is one of the most susceptible minerals to chemical dissolution (Babechuk et al., 2014). Fractionation of Eu can be tracked using the Eu anomaly of Eu* obtained by interpolation between the normalized values of Sm and Gd, as proposed by Taylor and McLennan (1985). Eu/Eu*= EuN/√(Sm)N x (Gd) N. Cerium can track redox-related transformations during pedogenesis in weathering profiles as a result of the potential oxidation of Ce3+ to Ce4+ (e.g., Middelburg et al., 1988; Braun et al., 1990; Mongell, 1993; Gallet et al., 1996; Murakami et al., 2001; Patino et al., 2003; Dengiz et al., 2013; Babechuk et al., 2014; Vermeire et al., 2016). Cerium anomalies are estimated by comparing the measured concentration of Ce with an expected concentration of Ce* obtained by interpolation between the normalized values of La and Pr. Cerium anomalies can be calculated as follow; Ce/Ce*= CeN / √(La)N x (Pr)N.
Results and Discussion SiO2 content was lower than 53% in all profiles and ranged from 1.04% to 52.90%. The content of Al2O3 ranged from 0.35 to 24.9%. Fe2O3 profiles were distributed between 0.07% and 9.56%. MgO values were changed between 0.45% and 7.13%. The enrichment observed in the MgO content was very specific and it is believed that MgO is generally very sensitive to leaching (Arikan et al., 2007; Nordt and Driese, 2010; Regassa et al., 2014). CaO values were found between 0.72 and 58.90%. The K2O and Na2O values were found to be 0.04-2.89%, 0.07-0.49%, respectively. Titanium is a mineral that is resistant to decomposition and is an element used in the determination of chemical change. TiO2 contents were found to be between 0.01-0.19%, MnO 0.02-0.32% and P2O5 0.05-0.74% (Table 2).
In Figure 3, the depth is plotted against the element content in weight percentages. While the chemical elements show similar tendencies in the 1, 2 and 3 profiles, the trends in the 4 profiles are different. Generally, in the fourth profile: reduced the content of CaO and P2O5 and increased SiO3, Al2O3, Fe2O3, TiO2, MgO, Na2O, MnO and K2O were shown at decreased depth. Fe, Al, Si the total content increases as the soil depth decreases due to the washing of carbonates. The P2O5 line in the first profile also deviates from the general trend to the top.
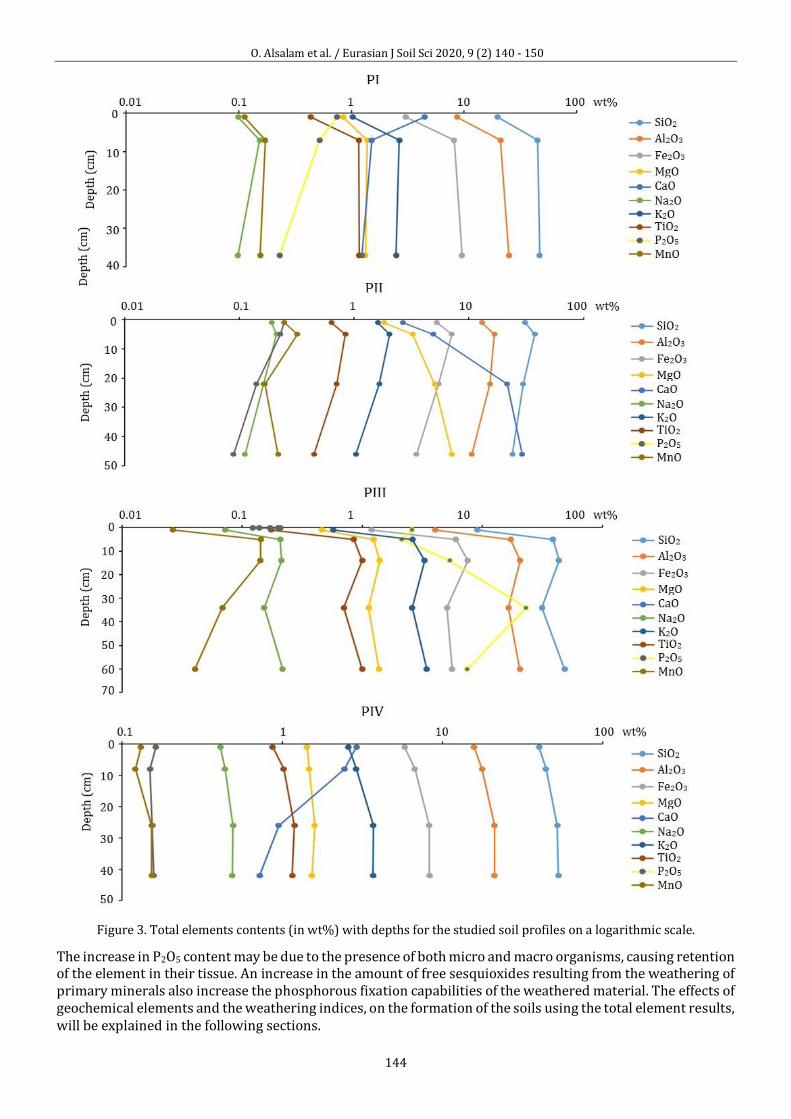
O. Alsalam et al. / Eurasian J Soil Sci 2020, 9 (2) 140 - 150
144
Figure 3. Total elements contents (in wt%) with depths for the studied soil profiles on a logarithmic scale.
The increase in P2O5 content may be due to the presence of both micro and macro organisms, causing retention of the element in their tissue. An increase in the amount of free sesquioxides resulting from the weathering of primary minerals also increase the phosphorous fixation capabilities of the weathered material. The effects of geochemical elements and the weathering indices, on the formation of the soils using the total element results, will be explained in the following sections.
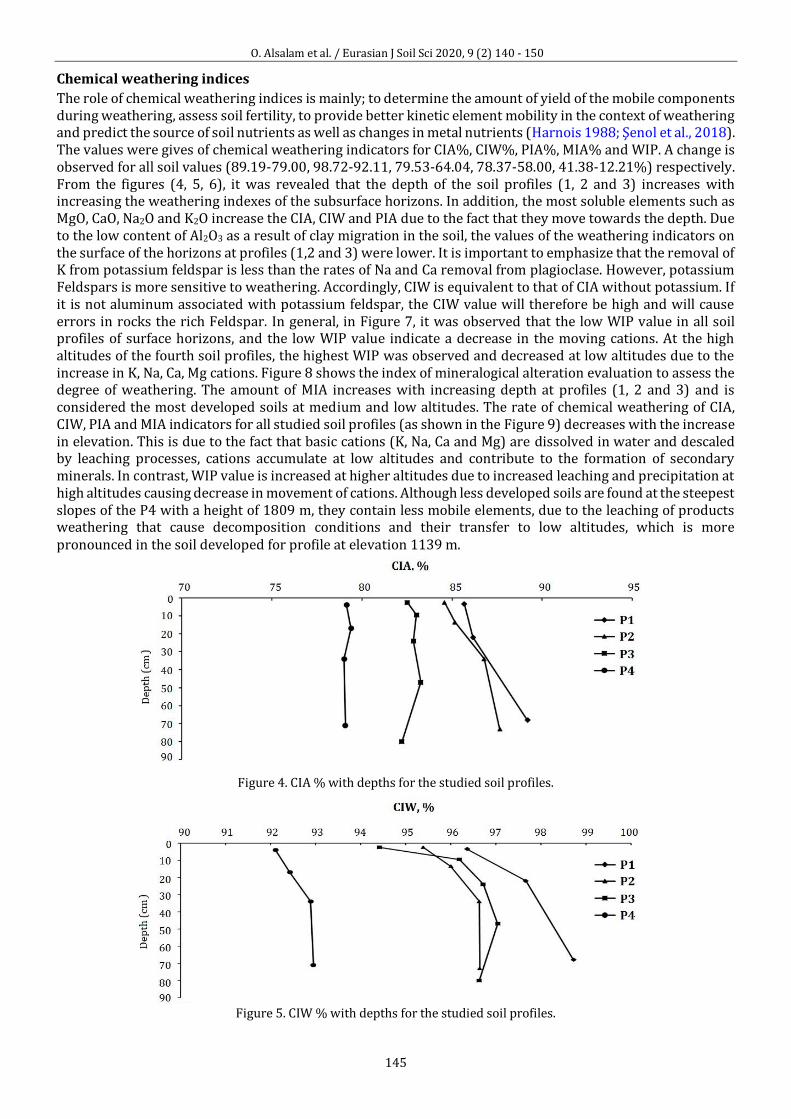
O. Alsalam et al. / Eurasian J Soil Sci 2020, 9 (2) 140 - 150
145
Chemical weathering indices
The role of chemical weathering indices is mainly; to determine the amount of yield of the mobile components during weathering, assess soil fertility, to provide better kinetic element mobility in the context of weathering and predict the source of soil nutrients as well as changes in metal nutrients (Harnois 1988; Şenol et al., 2018). The values were gives of chemical weathering indicators for CIA%, CIW%, PIA%, MIA% and WIP. A change is observed for all soil values (89.19-79.00, 98.72-92.11, 79.53-64.04, 78.37-58.00, 41.38-12.21%) respectively. From the figures (4, 5, 6), it was revealed that the depth of the soil profiles (1, 2 and 3) increases with increasing the weathering indexes of the subsurface horizons. In addition, the most soluble elements such as MgO, CaO, Na2O and K2O increase the CIA, CIW and PIA due to the fact that they move towards the depth. Due to the low content of Al2O3 as a result of clay migration in the soil, the values of the weathering indicators on the surface of the horizons at profiles (1,2 and 3) were lower. It is important to emphasize that the removal of K from potassium feldspar is less than the rates of Na and Ca removal from plagioclase. However, potassium Feldspars is more sensitive to weathering. Accordingly, CIW is equivalent to that of CIA without potassium. If it is not aluminum associated with potassium feldspar, the CIW value will therefore be high and will cause errors in rocks the rich Feldspar. In general, in Figure 7, it was observed that the low WIP value in all soil profiles of surface horizons, and the low WIP value indicate a decrease in the moving cations. At the high altitudes of the fourth soil profiles, the highest WIP was observed and decreased at low altitudes due to the increase in K, Na, Ca, Mg cations. Figure 8 shows the index of mineralogical alteration evaluation to assess the degree of weathering. The amount of MIA increases with increasing depth at profiles (1, 2 and 3) and is considered the most developed soils at medium and low altitudes. The rate of chemical weathering of CIA, CIW, PIA and MIA indicators for all studied soil profiles (as shown in the Figure 9) decreases with the increase in elevation. This is due to the fact that basic cations (K, Na, Ca and Mg) are dissolved in water and descaled by leaching processes, cations accumulate at low altitudes and contribute to the formation of secondary minerals. In contrast, WIP value is increased at higher altitudes due to increased leaching and precipitation at high altitudes causing decrease in movement of cations. Although less developed soils are found at the steepest slopes of the P4 with a height of 1809 m, they contain less mobile elements, due to the leaching of products weathering that cause decomposition conditions and their transfer to low altitudes, which is more pronounced in the soil developed for profile at elevation 1139 m.
Figure 4. CIA % with depths for the studied soil profiles.
Figure 5. CIW % with depths for the studied soil profiles.
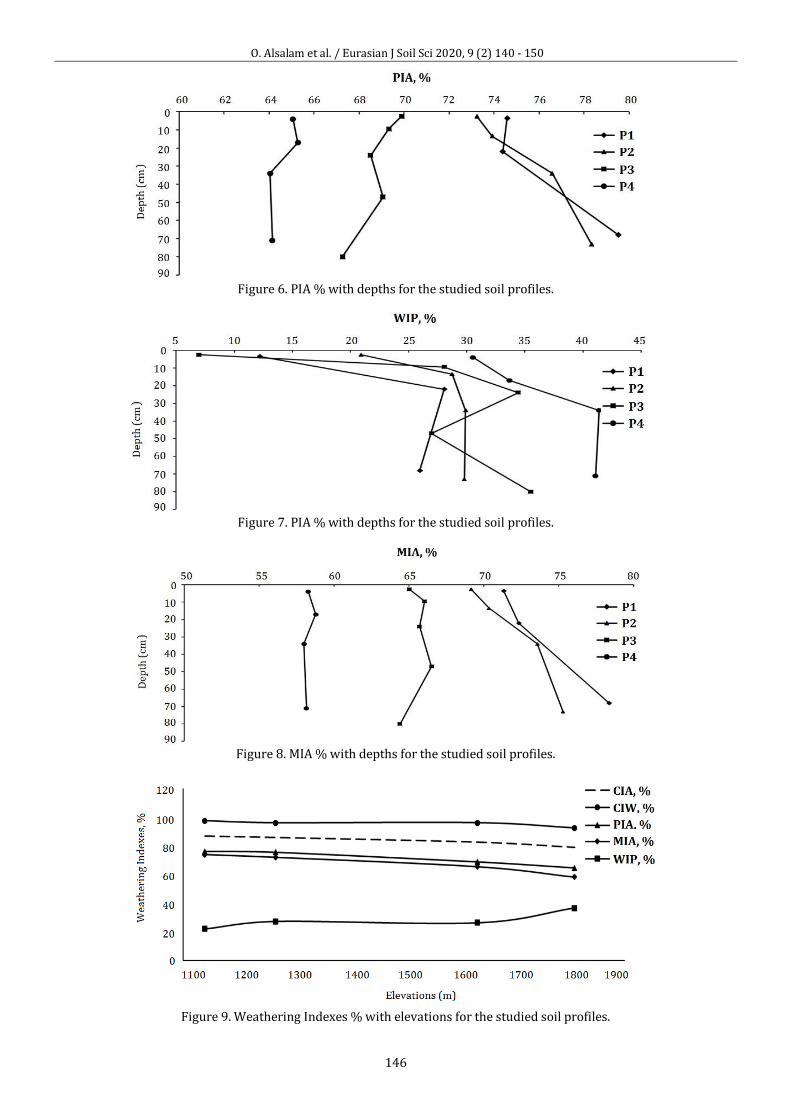
O. Alsalam et al. / Eurasian J Soil Sci 2020, 9 (2) 140 - 150
146
Figure 6. PIA % with depths for the studied soil profiles.
Figure 7. PIA % with depths for the studied soil profiles.
Figure 8. MIA % with depths for the studied soil profiles.
Figure 9. Weathering Indexes % with elevations for the studied soil profiles.
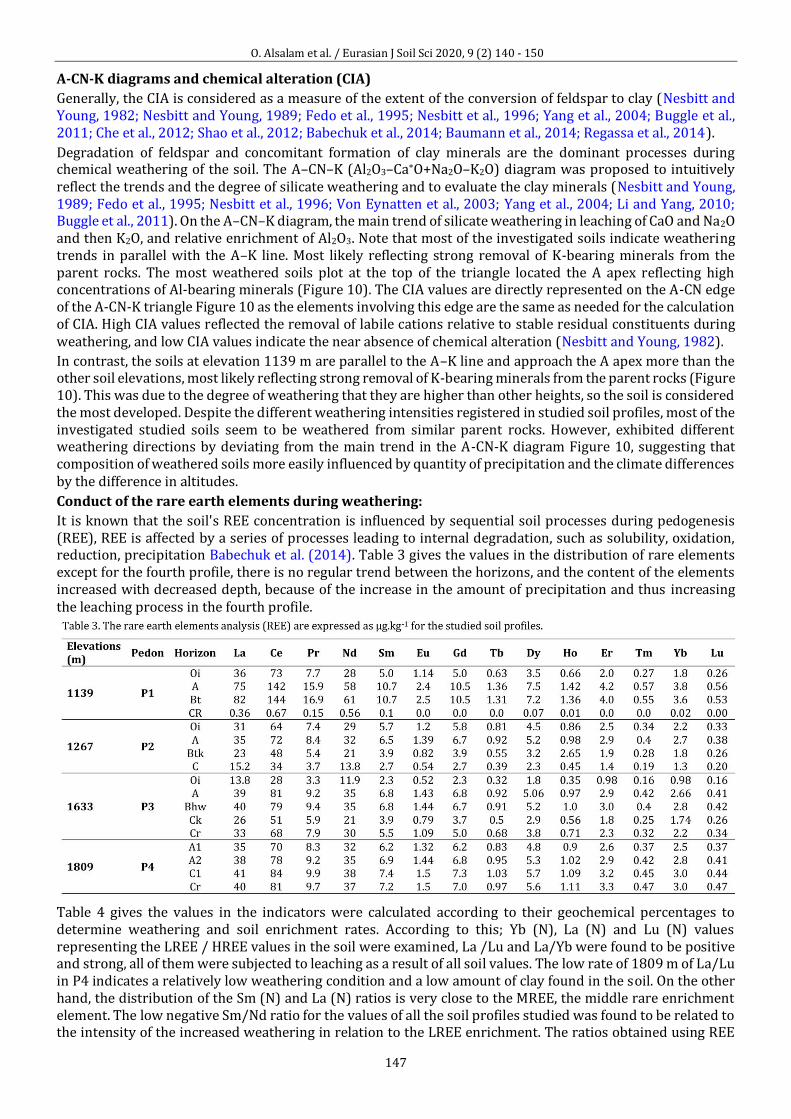
O. Alsalam et al. / Eurasian J Soil Sci 2020, 9 (2) 140 - 150
147
A-CN-K diagrams and chemical alteration (CIA)
Generally, the CIA is considered as a measure of the extent of the conversion of feldspar to clay (Nesbitt and Young, 1982; Nesbitt and Young, 1989; Fedo et al., 1995; Nesbitt et al., 1996; Yang et al., 2004; Buggle et al., 2011; Che et al., 2012; Shao et al., 2012; Babechuk et al., 2014; Baumann et al., 2014; Regassa et al., 2014).
Degradation of feldspar and concomitant formation of clay minerals are the dominant processes during chemical weathering of the soil. The A–CN–K (Al2O3–Ca⁎O+Na2O–K2O) diagram was proposed to intuitively reflect the trends and the degree of silicate weathering and to evaluate the clay minerals (Nesbitt and Young, 1989; Fedo et al., 1995; Nesbitt et al., 1996; Von Eynatten et al., 2003; Yang et al., 2004; Li and Yang, 2010; Buggle et al., 2011). On the A–CN–K diagram, the main trend of silicate weathering in leaching of CaO and Na2O and then K2O, and relative enrichment of Al2O3. Note that most of the investigated soils indicate weathering trends in parallel with the A–K line. Most likely reflecting strong removal of K-bearing minerals from the parent rocks. The most weathered soils plot at the top of the triangle located the A apex reflecting high concentrations of Al-bearing minerals (Figure 10). The CIA values are directly represented on the A-CN edge of the A-CN-K triangle Figure 10 as the elements involving this edge are the same as needed for the calculation of CIA. High CIA values reflected the removal of labile cations relative to stable residual constituents during weathering, and low CIA values indicate the near absence of chemical alteration (Nesbitt and Young, 1982).
In contrast, the soils at elevation 1139 m are parallel to the A–K line and approach the A apex more than the other soil elevations, most likely reflecting strong removal of K-bearing minerals from the parent rocks (Figure 10). This was due to the degree of weathering that they are higher than other heights, so the soil is considered the most developed. Despite the different weathering intensities registered in studied soil profiles, most of the investigated studied soils seem to be weathered from similar parent rocks. However, exhibited different weathering directions by deviating from the main trend in the A-CN-K diagram Figure 10, suggesting that composition of weathered soils more easily influenced by quantity of precipitation and the climate differences by the difference in altitudes.
Conduct of the rare earth elements during weathering:
It is known that the soil's REE concentration is influenced by sequential soil processes during pedogenesis (REE), REE is affected by a series of processes leading to internal degradation, such as solubility, oxidation, reduction, precipitation Babechuk et al. (2014). Table 3 gives the values in the distribution of rare elements except for the fourth profile, there is no regular trend between the horizons, and the content of the elements increased with decreased depth, because of the increase in the amount of precipitation and thus increasing the leaching process in the fourth profile.
Table 4 gives the values in the indicators were calculated according to their geochemical percentages to determine weathering and soil enrichment rates. According to this; Yb (N), La (N) and Lu (N) values representing the LREE / HREE values in the soil were examined, La /Lu and La/Yb were found to be positive and strong, all of them were subjected to leaching as a result of all soil values. The low rate of 1809 m of La/Lu in P4 indicates a relatively low weathering condition and a low amount of clay found in the soil. On the other hand, the distribution of the Sm (N) and La (N) ratios is very close to the MREE, the middle rare enrichment element. The low negative Sm/Nd ratio for the values of all the soil profiles studied was found to be related to the intensity of the increased weathering in relation to the LREE enrichment. The ratios obtained using REE
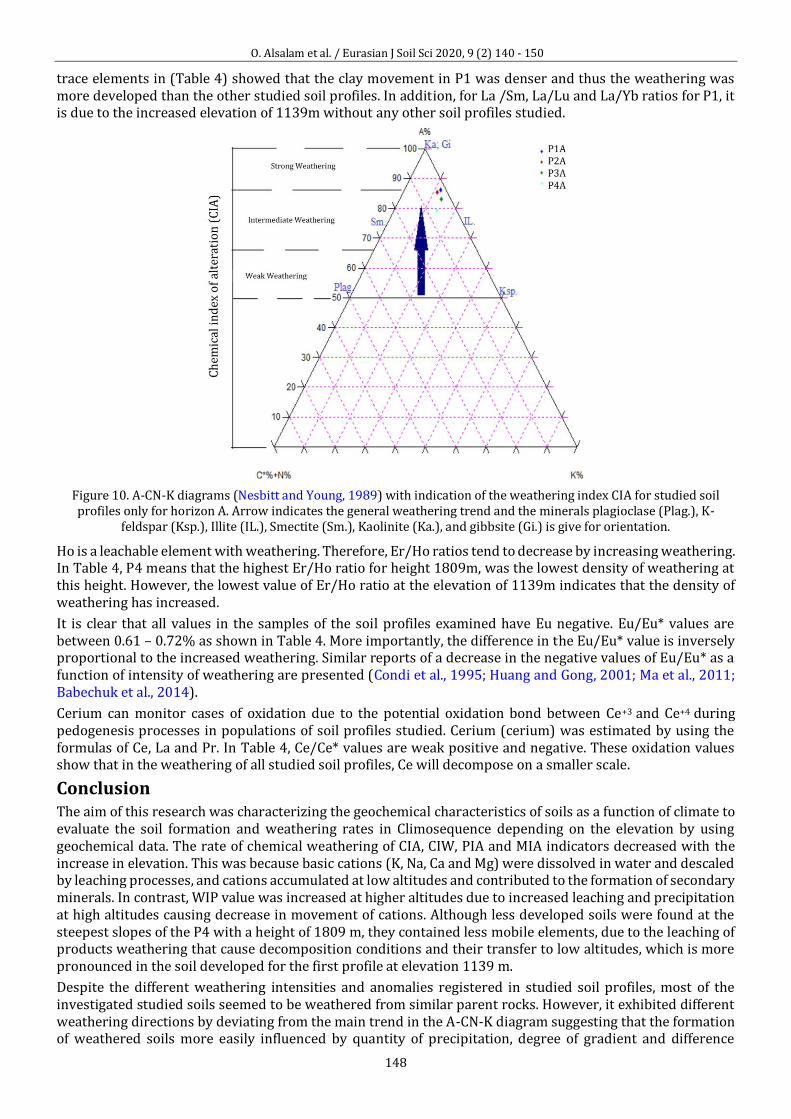
O. Alsalam et al. / Eurasian J Soil Sci 2020, 9 (2) 140 - 150
148
trace elements in (Table 4) showed that the clay movement in P1 was denser and thus the weathering was more developed than the other studied soil profiles. In addition, for La /Sm, La/Lu and La/Yb ratios for P1, it is due to the increased elevation of 1139m without any other soil profiles studied.
Figure 10. A-CN-K diagrams (Nesbitt and Young, 1989) with indication of the weathering index CIA for studied soil profiles only for horizon A. Arrow indicates the general weathering trend and the minerals plagioclase (Plag.), K-
feldspar (Ksp.), Illite (IL.), Smectite (Sm.), Kaolinite (Ka.), and gibbsite (Gi.) is give for orientation.
Ho is a leachable element with weathering. Therefore, Er/Ho ratios tend to decrease by increasing weathering. In Table 4, P4 means that the highest Er/Ho ratio for height 1809m, was the lowest density of weathering at this height. However, the lowest value of Er/Ho ratio at the elevation of 1139m indicates that the density of weathering has increased.
It is clear that all values in the samples of the soil profiles examined have Eu negative. Eu/Eu* values are between 0.61 – 0.72% as shown in Table 4. More importantly, the difference in the Eu/Eu* value is inversely proportional to the increased weathering. Similar reports of a decrease in the negative values of Eu/Eu* as a function of intensity of weathering are presented (Condi et al., 1995; Huang and Gong, 2001; Ma et al., 2011; Babechuk et al., 2014).
Cerium can monitor cases of oxidation due to the potential oxidation bond between Ce+3 and Ce+4 during pedogenesis processes in populations of soil profiles studied. Cerium (cerium) was estimated by using the formulas of Ce, La and Pr. In Table 4, Ce/Ce* values are weak positive and negative. These oxidation values show that in the weathering of all studied soil profiles, Ce will decompose on a smaller scale.
Conclusion The aim of this research was characterizing the geochemical characteristics of soils as a function of climate to evaluate the soil formation and weathering rates in Climosequence depending on the elevation by using geochemical data. The rate of chemical weathering of CIA, CIW, PIA and MIA indicators decreased with the increase in elevation. This was because basic cations (K, Na, Ca and Mg) were dissolved in water and descaled by leaching processes, and cations accumulated at low altitudes and contributed to the formation of secondary minerals. In contrast, WIP value was increased at higher altitudes due to increased leaching and precipitation at high altitudes causing decrease in movement of cations. Although less developed soils were found at the steepest slopes of the P4 with a height of 1809 m, they contained less mobile elements, due to the leaching of products weathering that cause decomposition conditions and their transfer to low altitudes, which is more pronounced in the soil developed for the first profile at elevation 1139 m.
Despite the different weathering intensities and anomalies registered in studied soil profiles, most of the investigated studied soils seemed to be weathered from similar parent rocks. However, it exhibited different weathering directions by deviating from the main trend in the A-CN-K diagram suggesting that the formation of weathered soils more easily influenced by quantity of precipitation, degree of gradient and difference
O. Alsalam et al. / Eurasian J Soil Sci 2020, 9 (2) 140 - 150
149
elevations. Therefore, it was concluded that the main factors determining soil formation are climate and elevations, both of which determine the leaching regime and weathering rates.
Acknowledgments
This study is a part of Ph.D Thesis titled “Pedogenic evaluation and chemical weathering rates of soils developed along an altitudinal transect” conducted by Omar ALSALAM and it was taken from a research project supported by Selçuk University (S.U.) BAP Office (Coordinating Office of Scientific Research Projects, Project No: 18201141). The authors would like to thank ‘‘the S.U.-BAP staffs’’.
References Arikan, F., Ulusay, R., Aydin, N., 2007. Characterization of weathered acidic volcanic rocks and a weathering classification
based on a rating system. Bulletin of Engineering Geology and the Environment 66: 415-430. Babechuk , M.G. , Widdowson, M. , Kamber, B.S., 2014. Quantifying chemical weathering intensity and trace element
release from two contrasting basalt profiles, Deccan Traps, India. Chemical Geology 363: 56–75. Barboso, W.R., Romero, R.E., de Souza Júnior, M.S., Cooper, M., Sartor, L.R., de Moya Partiti, C.S., de Oliveira Jorge, O., Cohen,
R., de Jesus, S.L., Ferreira, T.O., 2015. Effects of slope orientation on pedogenesis of altimontane soils from the Brazilian semi-arid region (Baturité massif, Ceará). Environmental Earth Sciences 73(7): 3731–3743.
Baumann, F., Schmidt, K., Dörfer, C., He, S.J., Scholten, T., Kühn, P., 2014. Pedogenesis, permafrost, substrate and topography: Plot and landscape scale interrelations of weathering processes on the central-eastern Tibetan Plateau. Geoderma 226-227: 300–316.
Braun, J.J., Viers, J., Dupré, B., Polve, M., Ndam, J., Muller, J.P., 1998. Solid/Liquid REE fractionation in the lateritic system of Goyoum, East Cameroon: The implication for the present dynamics of the soil covers of the humid tropical regions. Acta 62(2): 273–299.
Buggle, B., Glaser, B., Hambach, U., Gerasimenko, N., Marković, S., 2011. An evaluation of geochemical weathering indices in loess–paleosol studies. Quaternary International 240(1-2): 12-21.
Burt, R., 2011. Soil Survey laboratory information Manual. 2nd Edition. United States Department of Agriculture, Natural Resources Conservation Service. 305p.
Che, V.B., Fontijn, K., Ernst, G.G.J., Kervyn, M., Elburg, M., Van Ranst, E., Suh, C.E., 2012. Evaluating the degree of weathering in landslide-prone soils in the humid tropics: The case of Limbe, SW Cameroon. Geoderma 170: 378-389.
Condie, K.C. Dengate, J., Cullers, R.L., 1995. Behavior of rare earth elements in a paleoweathering profile on granodiorite in the Front Range, Colorado, USA. Geochimica et Cosmochimica Acta 59(2): 279-294.
Dengiz, O., Saglam, M., Ozaytekin, H.H., Baskan, O., 2013. Weathering rates and some physico-chemical characteristics of soils developed on a calcic toposequences. Carpathian Journal of Earth and Environmental Sciences 8(2): 13-24.
Egli, M., Mirabella, A., Sartori, G., Fitze, P., 2003. Weathering rates as a function of climate: results from a climosequence of the Val Genova (Trentino, Italian Alps). Geoderma 111(1-2): 99–121.
Egli, M., Mirabella, A. , Sartori, G. , Zanelli, R. , Bischof , S., 2006. Effect of north and south exposure on weathering rates and clay mineral formation in Alpine soils. Catena 67(3): 155 –174.
Egli, M, Mirabella, A., Sartori, G., 2008. The role of climate and vegetation in weathering and clay mineral formation in late Quaternary soils of the Swiss and Italian Alps. Geomorphology 102(3-4): 307–324.
Egli, M., Sartori, G., Mirabella, A., Favilli, F., Giaccai, D., Delbos, E., 2009. Effect of north and south exposure on organic matter in high Alpine soils. Geoderma 149(1-2):124–136.
Fedo, C.M., Nesbitt, H.W., Young, G.M., 1995. Unraveling the effects of potassium metasomatism in sedimentary rocks and paleosols, with implications for paleoweathering conditions and provenance. Geology 23(10): 921-924.
Gallet, S., Jahn, B.M., Torii, M., 1996. Geochemical characterization of the Luochuan loess-paleosol sequence, China, and paleoclimatic implications. Chemical Geology 133(1-4): 67-88.
Harnois, L., 1988. The CIW index: A new chemical index of weathering. Sedimentary Geology 55(3-4): 319-322. Huang, C.M., Gong, Z.T., 2001. Geochemical implication of rare earth elements in process of soil development. Journal Rare
Earths 19(1): 57-62. Le Blond , J.S. , Cuadros, J., Molla, Y.B. , Berhanu, T., Umer, M., Baxter, P.J., Davey, G., 2015. Weathering of the Ethiopian
volcanic province: A new weathering index to characterize and compare soils. American Mineralogist 100(11-12): 2518–2232.
Li, C., Yang, S.Y., 2010. Is chemical index of alteration a reliable proxy for chemical weathering in global drainage basins? American Journal of Science 310 (2): 111–127.
Lybrand, R., Rasmussen, C., Jardine, A., Troch, P., Chorover, J., 2011. The effects of climate and landscape position on chemical denudation and mineral transformation in the Santa Catalina mountain critical zone observatory. Applied Geochemistry 26:S80–S84.
Ma, L., Jin, L., Brantley, S. L., .2011. How mineralogy and slope aspect affect REE release and fractionation during shale weathering in the Susquehanna/Shale Hills Critical Zone Observatory. Chemical Geology 290(1-2): 31-49.
McLennan, S.M., 1993. Weathering and global denudation. The Journal of Geology 101(2): 295–303. Middelburg, J.J., van der Weijden, C.H., Woittiez, J.R.W., 1988. Chemical processes affecting the mobility of major, minor
and trace elements during weathering of granitic rocks. Chemical Geology 68(3-4): 253–273. Moazallahi, M., Farpoor, M.H., 2012. Soil genesis and clay mineralogy along the xeric aridic climotoposequence in South
O. Alsalam et al. / Eurasian J Soil Sci 2020, 9 (2) 140 - 150
150
Central Iran. Journal of Agricultural Science and Technology 14(3): 683–696. Mongelli, G., 1993. REE and other trace elements in a granitic weathering profile from “Serre”, southern Italy. Chemical
Geology 103(1-4): 17–25. Murakami, T., Utsunomiya, S., Imazu, Y., Prasad, N., 2001. Direct evidence of late Archean to early Proterozoic anoxic
atmosphere from a product of 2.5 Ga old weathering. Earth and Planetary Science Letters 184(2): 523–528. Nesbitt, H.W., Young, G.M., 1982. Early Proterozoic climates and plate motions inferred from major element chemistry of
lutites. Nature 279: 715-717. Nesbitt, H.W., Young, G.M., 1984. Prediction of some weathering trends of plutonic and volcanic rocks based on
thermodynamic and kinetic considerations. Geochimica et Cosmochimica Acta 48(7): 1523-1534. Nesbitt, H.W., Young, G.M., 1989. Formation and diagenesis of weathering profiles. Journal of Geology 97(2): 129-147. Nesbitt, H.W., 1992. Diagenesis and metasomatism of weathering profiles, with emphasis on Precambrian paleosols.
Developments in Earth Surface Processes 2:127–152. Nesbitt, H.W., Young, G.M., McLennan, S., Keays, R., 1996. Effects of chemical weathering and sorting on the petrogenesis
of siliciclastic sediments, with ımplications for provenance studies. Journal Geology 104(5): 525–542. Nordt, L.C., Driese, S.D., 2010. New weathering index improves paleorainfall estimates from Vertisols. Geology 38(5): 407-
410. Osat, M., Heidari, A., Eghbal, M.K., Mahmoodi, S., 2016. Impacts of topographic attributes on Soil Taxonomic Classes and
weathering indices in a hilly landscape in Northern Iran. Geoderma 281: 90–101. Parker, A., 1970. An index of weathering for silicate rocks. Geological Magazine 107(6): 501-504. Patino, L.C., Velbel, M.A., Price, J.R., Wade, J.A., 2003. Trace element mobility during spheroidal weathering of basalts and
andesites in Hawaii and Guatemala. Chemical Geology 202(3-4): 343–364. Pettapiece, W.W., Pawluc, S., 1972. Clay mineralogy of soils developed partially from volcanic ash. Soil Science Society of
America journal 36(3): 515-519. Price, J.R., Velbel, M.A., 2003. Chemical weathering indices applied to weathering profiles developed on heterogeneous
felsic metamorphic parent rocks. Chemical Geology 202(3-4): 397– 416. Rate, A.W., Sheikh-Abdullah, S.M., 2017. The geochemistry of calcareous forest soils in Sulaimani Governorate, Kurdistan
Region, Iraq. Geoderma 289: 54–65. Regassa, A., van Daele, K.V., De Paepe, P., Dumon, M., Deckers, J., Asrat, A., van Ranst, E., 2014. Characterizing weathering
intensity and trends of geological materials in the Gilgel Gibe catchment, southwestern Ethiopia. Journal of African Earth Sciences 99(2): 568-580.
Shao, J., Yang, S., Li, C., 2012. Chemical indices (CIA and WIP) as proxies for integrated chemical weathering in China: Inferences from analysis of fluvial sediments. Sedimentary Geology 265-266: 110–120.
Şenol, H., Tunçay, T., Dengiz, O., 2018. Geochemical Mass balance applied to the study of weathering and evolution of soil. Indian Journal of Geo-Marine Sciences 47(9):1851-1865.
Taylor, S.R., McLennan, S.M., 1985. The Continental Crust: its Composition and Evolution. 3rd Edition. Blackwell Scientific Publications, Oxford, 312p..
Vermeire, M.L., Cornu, S., Fekiacova , Z., Detienne , M., Delvaux , B., Cornélis, J.T., 2016. Rare earth elements dynamics along pedogenesis in a chronosequence of podzolic soils. Chemical Geology 446: 163–174.
Voicu, G., Bardoux, M., 2002. Geochemical behavior under tropical weathering of the Barama–Mazaruni greenstone belt at Omai gold mine, Guiana Shield. Applied Geochemistry 17(3): 321-336.
Voicu, G., Bardoux, M., Jébrak, M., Voicu, D., 1996. Normative mineralogical calculations for tropical weathering profiles. Geological Association of Canade and Mineral Association of Canadian 21: 58-69.
von Eynatten, H., Barceló-Vidal, C., Pawlowsky-Glahn, V., 2003. Modelling compositional change: The example of chemical weathering of granitoid rocks. Mathematical Geology 35(3): 231–351.
Yang, S.Y., Jung, H.S., Li, C.X., 2004. Two unique weathering regimes in the Changjiang and Huanghe drainage basins: geochemical evidence from river sediments. Sedimentary Geology 164(1-2): 19–34.
Zhou, X., Li, A., Jiang, F., Lu, J., 2015. Effects of grain size distribution on mineralogical and chemical compositions: a case study from size‐fractional sediments of the Huanghe (Yellow River) and Changjiang (Yangtze River). Geological Journal 50(4): 414–433.
S.Delibacak et al. / Eurasian J Soil Sci 2020, 9 (2) 126 - 139
126
Use of sewage sludge in agricultural soils: Useful or harmful Sezai Delibacak a,*, Lyudmila Voronina b,c, Ekaterina Morachevskaya b
Ali Rıza Onguna a Ege University, Faculty of Agriculture, Department of Soil Science and Plant Nutrition, İzmir, Turkey
b Moscow State University, Faculty of Soil Science, Department of Agrochemistry and Plant Biochemistry, Moscow, Russian Federation
c Center for Strategic Planning and Management of Biomedical Health Risks, Moscow, 119121, Russian Federation
Abstract Article Info Received : 12.06.2019 Accepted : 06.02.2020
Sewage sludge is an important type of organic wastes among the various categories of solid waste. Organic matter resources in soils are relatively low and frequently require replenishment. Therefore, the use of sewage sludge in agricultural soils is a desirable method of their utilisation. The addition of sewage sludge to soils may be an inexpensive and effective alternative to the methods applied currently (mineral fertilisation, manure etc.). In spite of the undisputable advantages resulting from the application of sewage sludge in agriculture, it also involves some serious threats. Among those we should mention the presence of pathogens, heavy metals, and organic pollutants. In the current scenario of increasing global population, the generation of solid wastes like biosolids is bound to increase remarkably. Improper and unscientific disposal of biosolids results in several environmental issues such as surface and groundwater contamination, degradation of land, and food chain contamination. According to the principles of waste management hierarchy, agricultural recycling of biosolids will be a more environmentally preferred option over the traditional disposal methods. Utilizing the potential of biosolids to recycle valuable plant nutrients and as an effective soil amendment will not only help in sustainable management of this waste but also in minimizing the negatives associated with its traditional disposal. Every country must obey their regulations and legislations for managing their sewage sludge as a basic solution for use of sewage sludge in agricultural soil.
Keywords: Sewage sludge, biosolids, organic matter, waste management.
© 2020 Federation of Eurasian Soil Science Societies. All rights reserved
Introduction Sewage sludge is an important type of organic wastes among the various categories of solid waste (Singh et al., 2014). In the present day, because of population growth, world of diminishing natural resources and energy crisis, the importance and need of developing a sustainable approach towards environmentally sound solid waste management cannot be ignored (Pappu et al., 2007). The improper disposal of solid wastes like biosolids and other biowastes pose a serious threat to the environmental quality leading to problems like groundwater contamination, degradation of soil quality, etc. Over the time, different approaches of safe biosolids disposal such as incineration, soil application, land filling (Kominko et al., 2017) and sea dumping have been explored (Sanchez Monedero et al., 2004). Disposal methods like land filling and ocean dumping have their own demerits due to scarcity of land, pollution problem and also don’t lead to reuse of the beneficial constituents of biosolids (Wong, 1995; Singh and Agrawal, 2008). As a result, the United States and several European countries have banned the ocean dumping of biosolids since 1991 and 1998 (USEPA, 1999a,b; Zhidong and Wenjing, 2009).
* Corresponding author. Ege University, Faculty of Agriculture, Department of Soil Science and Plant Nutrition, 35100 Bornova, İzmir Tel.: +90 232 3112653 E-mail address: [email protected] e-ISSN: 2147-4249 DOI: 10.18393/ejss.687052
S.Delibacak et al. / Eurasian J Soil Sci 2020, 9 (2) 126 - 139
127
Efficient municipal waste water treatment produces vast amounts of sludge. For example, in the countries located wholly or partly on the Baltic Sea watershed the amount of sewage sludge generated is about 3.5 million tonnes of dry solids annually. This is expected to increase to almost four million tonnes by 2020. Sludge management is an integral part of any modern municipal waste water treatment plant: it is important not to lose nutrients in the sludge, to make use of its material and energy, and to dispose of it efficiently and sustainably. During recent years, much effort has been put to efficient nutrient removal from the municipal waste waters in the Baltic Sea region. The aim is to reduce the eutrophication burden to the fragile Baltic Sea by fulfilling the relevant requirements: the newer EU member states on the eastern and southern shores of the Baltic Sea have started to implement the Urban Waste Water Directive (see chapter 12 for legislation) and also to strive for the stricter HELCOM recommendations for nutrient removal (www.purebalticsea.eu). Also, in the non-EU countries of the region, actions have been taken and are still on-going to improve the level of waste water treatment. The two main sludge fractions are primary and excess secondary sludge. If phosphorus is removed from the sewage by chemical precipitation, the amount of the sludge increases by the amount of chemicals used for the precipitation. The nutrients removed from waste water are contained in the sludge, which must be handled so that the nutrients are not released back to the watercourses, while the material and energy content of the sludge can be utilised. The large amounts of sewage sludge generated in waste water treatment plants provide numerous opportunities for beneficial use; for example, in power generation, soil improvement and even nutrient recycling. The possibilities of use are dependent on the quality and amount of the sludge in question, the processes used in a particular treatment plant, and the national legislation and policies. The sludge handling strategy of an individual waste water treatment plant is shaped, for example, according to: its location, transportation costs; the quality of incoming waters; nutrient removal technology used; legal restrictions concerning sludge disposal; the availability and price of conditioning agents; and the possibilities to outsource the treated sludge products. An accurate and unbiased assessment of the risks connected to the use of sewage sludge is needed. The question is how to deal with various chemical substances present in municipal sewage sludge originating from households and how to recycle the nutrients. The issue of hazardous chemicals of the sludge is currently under debate and regulatory issues are also open with the EU Sewage Sludge Directive currently being revised (www.purebalticsea.eu). There are international political dimensions to the sludge handling issue, not only in differing legislation, energy strategies and sludge handling costs, but also because the world’s mineral resources of phosphorus are depleting. The question on nutrient recycling is emerging: according to some estimates, phosphorus resources may only be sufficient for the next 50 years. These resources are located mostly in northern Africa, China and the USA. Even though there have been some optimistic estimations on the global reserves, the dependency on a single country, Morocco, is expected to grow over the century. Thus, EU food security has to rely on imported phosphorus (Schröder et al., 2011). Municipal sewage sludge contains large amounts of precious phosphorus; however, the possibilities for recycling should be taken into account already when planning sludge management alternatives. Moreover, some sewage treatment methods do not allow the phosphorus to exist in an easily usable form in the sludge (www.purebalticsea.eu). Land application of sewage sludge has a great incentive in view of its fertilizer and soil conditioning properties, unless it contains toxic substances. The heterogeneous nature of sewage sludge produced at different treatment plants and the variations between seasons necessitates knowledge of the chemical composition of sewage sludge prior to the land application. Characteristics of sewage sludge depend on the waste water treatment processes and sludge treatment. Generally sewage sludge is composed of organic compounds, macronutrients, a wide range of micronutrients, non-essential trace metals, organic micro pollutants and microorganisms (Kulling et al., 2001).
The practical and technical challenges of sludge handling are the following:
a) stabilising sludge is not inert and can have an unpleasant odour; b) reducing the water content and sludge volume to the minimum; c) utilising the energy potential when economically possible; d) reducing the amount of harmful micro-organisms if people, animals or plants are in contact with the sludge; e) recovering phosphorus for agriculture (www.purebalticsea.eu).
The macronutrients in sewage sludge serve as a good source of plant nutrients and the organic constituents provide beneficial soil conditioning properties (Logan and Harrison, 1995). Chemical characterization of sewage sludge collected for over 2 years from eight cities of Indiana, USA, showed that sewage sludge contained approximately 50% organic matter and 1–4% inorganic carbon. Organic N and inorganic P constituted the majority of total N and P, respectively, of sludge. Organic and inorganic C, organic N and inorganic P, Ca and Mg were present in relatively constant concentrations in a given sludge throughout the sampling period. Inorganic N, organic P, K and all other metals were quite
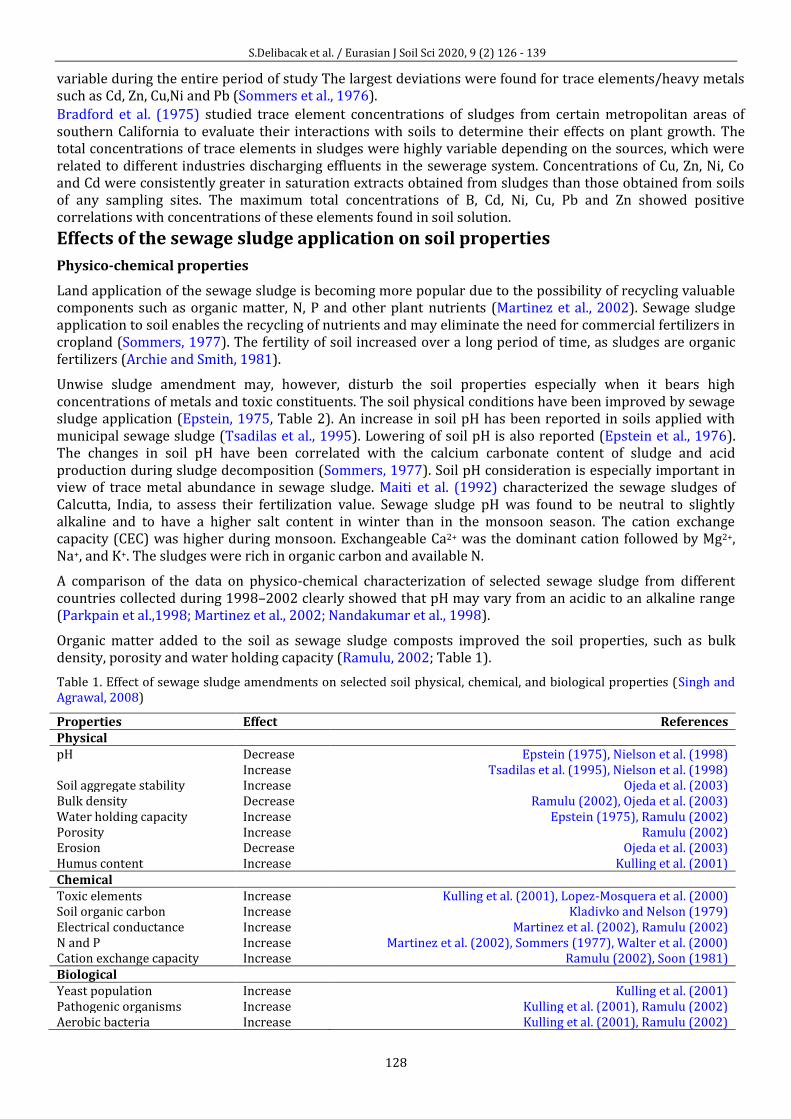
S.Delibacak et al. / Eurasian J Soil Sci 2020, 9 (2) 126 - 139
128
variable during the entire period of study The largest deviations were found for trace elements/heavy metals such as Cd, Zn, Cu,Ni and Pb (Sommers et al., 1976).
Bradford et al. (1975) studied trace element concentrations of sludges from certain metropolitan areas of southern California to evaluate their interactions with soils to determine their effects on plant growth. The total concentrations of trace elements in sludges were highly variable depending on the sources, which were related to different industries discharging effluents in the sewerage system. Concentrations of Cu, Zn, Ni, Co and Cd were consistently greater in saturation extracts obtained from sludges than those obtained from soils of any sampling sites. The maximum total concentrations of B, Cd, Ni, Cu, Pb and Zn showed positive correlations with concentrations of these elements found in soil solution.
Effects of the sewage sludge application on soil properties
Physico-chemical properties
Land application of the sewage sludge is becoming more popular due to the possibility of recycling valuable components such as organic matter, N, P and other plant nutrients (Martinez et al., 2002). Sewage sludge application to soil enables the recycling of nutrients and may eliminate the need for commercial fertilizers in cropland (Sommers, 1977). The fertility of soil increased over a long period of time, as sludges are organic fertilizers (Archie and Smith, 1981).
Unwise sludge amendment may, however, disturb the soil properties especially when it bears high concentrations of metals and toxic constituents. The soil physical conditions have been improved by sewage sludge application (Epstein, 1975, Table 2). An increase in soil pH has been reported in soils applied with municipal sewage sludge (Tsadilas et al., 1995). Lowering of soil pH is also reported (Epstein et al., 1976). The changes in soil pH have been correlated with the calcium carbonate content of sludge and acid production during sludge decomposition (Sommers, 1977). Soil pH consideration is especially important in view of trace metal abundance in sewage sludge. Maiti et al. (1992) characterized the sewage sludges of Calcutta, India, to assess their fertilization value. Sewage sludge pH was found to be neutral to slightly alkaline and to have a higher salt content in winter than in the monsoon season. The cation exchange capacity (CEC) was higher during monsoon. Exchangeable Ca2+ was the dominant cation followed by Mg2+, Na+, and K+. The sludges were rich in organic carbon and available N.
A comparison of the data on physico-chemical characterization of selected sewage sludge from different countries collected during 1998–2002 clearly showed that pH may vary from an acidic to an alkaline range (Parkpain et al.,1998; Martinez et al., 2002; Nandakumar et al., 1998).
Organic matter added to the soil as sewage sludge composts improved the soil properties, such as bulk density, porosity and water holding capacity (Ramulu, 2002; Table 1).
Table 1. Effect of sewage sludge amendments on selected soil physical, chemical, and biological properties (Singh and Agrawal, 2008)
Properties Effect References Physical pH Decrease
Increase Epstein (1975), Nielson et al. (1998)
Tsadilas et al. (1995), Nielson et al. (1998) Soil aggregate stability Increase Ojeda et al. (2003) Bulk density Decrease Ramulu (2002), Ojeda et al. (2003) Water holding capacity Increase Epstein (1975), Ramulu (2002) Porosity Increase Ramulu (2002) Erosion Decrease Ojeda et al. (2003) Humus content Increase Kulling et al. (2001) Chemical Toxic elements Increase Kulling et al. (2001), Lopez-Mosquera et al. (2000) Soil organic carbon Increase Kladivko and Nelson (1979) Electrical conductance Increase Martinez et al. (2002), Ramulu (2002) N and P Increase Martinez et al. (2002), Sommers (1977), Walter et al. (2000) Cation exchange capacity Increase Ramulu (2002), Soon (1981) Biological Yeast population Increase Kulling et al. (2001) Pathogenic organisms Increase Kulling et al. (2001), Ramulu (2002) Aerobic bacteria Increase Kulling et al. (2001), Ramulu (2002)
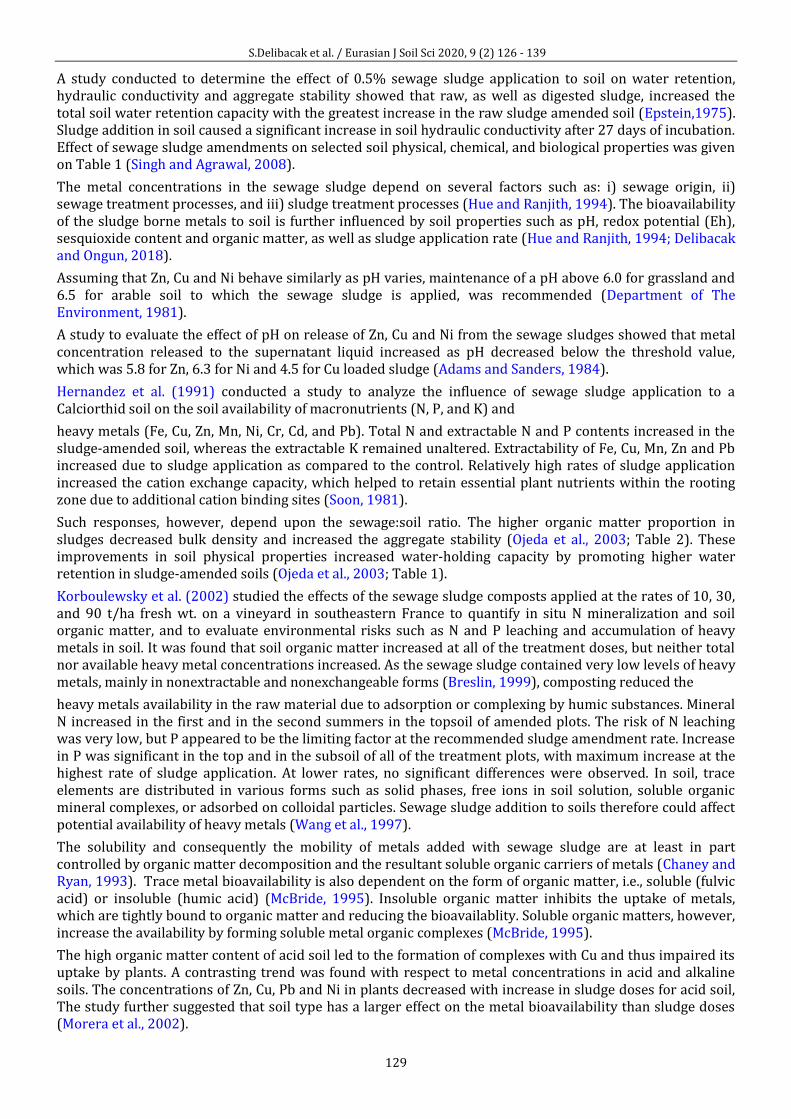
S.Delibacak et al. / Eurasian J Soil Sci 2020, 9 (2) 126 - 139
129
A study conducted to determine the effect of 0.5% sewage sludge application to soil on water retention, hydraulic conductivity and aggregate stability showed that raw, as well as digested sludge, increased the total soil water retention capacity with the greatest increase in the raw sludge amended soil (Epstein,1975). Sludge addition in soil caused a significant increase in soil hydraulic conductivity after 27 days of incubation. Effect of sewage sludge amendments on selected soil physical, chemical, and biological properties was given on Table 1 (Singh and Agrawal, 2008).
The metal concentrations in the sewage sludge depend on several factors such as: i) sewage origin, ii) sewage treatment processes, and iii) sludge treatment processes (Hue and Ranjith, 1994). The bioavailability of the sludge borne metals to soil is further influenced by soil properties such as pH, redox potential (Eh), sesquioxide content and organic matter, as well as sludge application rate (Hue and Ranjith, 1994; Delibacak and Ongun, 2018).
Assuming that Zn, Cu and Ni behave similarly as pH varies, maintenance of a pH above 6.0 for grassland and 6.5 for arable soil to which the sewage sludge is applied, was recommended (Department of The Environment, 1981).
A study to evaluate the effect of pH on release of Zn, Cu and Ni from the sewage sludges showed that metal concentration released to the supernatant liquid increased as pH decreased below the threshold value, which was 5.8 for Zn, 6.3 for Ni and 4.5 for Cu loaded sludge (Adams and Sanders, 1984).
Hernandez et al. (1991) conducted a study to analyze the influence of sewage sludge application to a Calciorthid soil on the soil availability of macronutrients (N, P, and K) and
heavy metals (Fe, Cu, Zn, Mn, Ni, Cr, Cd, and Pb). Total N and extractable N and P contents increased in the sludge-amended soil, whereas the extractable K remained unaltered. Extractability of Fe, Cu, Mn, Zn and Pb increased due to sludge application as compared to the control. Relatively high rates of sludge application increased the cation exchange capacity, which helped to retain essential plant nutrients within the rooting zone due to additional cation binding sites (Soon, 1981).
Such responses, however, depend upon the sewage:soil ratio. The higher organic matter proportion in sludges decreased bulk density and increased the aggregate stability (Ojeda et al., 2003; Table 2). These improvements in soil physical properties increased water-holding capacity by promoting higher water retention in sludge-amended soils (Ojeda et al., 2003; Table 1).
Korboulewsky et al. (2002) studied the effects of the sewage sludge composts applied at the rates of 10, 30, and 90 t/ha fresh wt. on a vineyard in southeastern France to quantify in situ N mineralization and soil organic matter, and to evaluate environmental risks such as N and P leaching and accumulation of heavy metals in soil. It was found that soil organic matter increased at all of the treatment doses, but neither total nor available heavy metal concentrations increased. As the sewage sludge contained very low levels of heavy metals, mainly in nonextractable and nonexchangeable forms (Breslin, 1999), composting reduced the
heavy metals availability in the raw material due to adsorption or complexing by humic substances. Mineral N increased in the first and in the second summers in the topsoil of amended plots. The risk of N leaching was very low, but P appeared to be the limiting factor at the recommended sludge amendment rate. Increase in P was significant in the top and in the subsoil of all of the treatment plots, with maximum increase at the highest rate of sludge application. At lower rates, no significant differences were observed. In soil, trace elements are distributed in various forms such as solid phases, free ions in soil solution, soluble organic mineral complexes, or adsorbed on colloidal particles. Sewage sludge addition to soils therefore could affect potential availability of heavy metals (Wang et al., 1997).
The solubility and consequently the mobility of metals added with sewage sludge are at least in part controlled by organic matter decomposition and the resultant soluble organic carriers of metals (Chaney and Ryan, 1993). Trace metal bioavailability is also dependent on the form of organic matter, i.e., soluble (fulvic acid) or insoluble (humic acid) (McBride, 1995). Insoluble organic matter inhibits the uptake of metals, which are tightly bound to organic matter and reducing the bioavailablity. Soluble organic matters, however, increase the availability by forming soluble metal organic complexes (McBride, 1995).
The high organic matter content of acid soil led to the formation of complexes with Cu and thus impaired its uptake by plants. A contrasting trend was found with respect to metal concentrations in acid and alkaline soils. The concentrations of Zn, Cu, Pb and Ni in plants decreased with increase in sludge doses for acid soil, The study further suggested that soil type has a larger effect on the metal bioavailability than sludge doses (Morera et al., 2002).
S.Delibacak et al. / Eurasian J Soil Sci 2020, 9 (2) 126 - 139
130
Microbial properties and soil enzymes
Land application of biosolids often results in significant changes in the structure, diversity, or richness of plant and animal communities at a given site, due directly, and indirectly, to resulting soil improvements and changing environmental conditions (USEPA, 1994). Few studies, however, have examined the soil microbial community in ecologically based studies, particularly in semi-arid grasslands (Dennis and Fresquez 1989; Pascual et al. 1999; Barbarick et al. 2004; García-Gil et al. 2004). Such research is crucial, considering that among other functions, microbial populations control decomposition and nutrient cycling in soils (Coleman and Crossley 1996), which in turn, control aboveground dynamics (Reynolds, 2018). Furthermore, a greater understanding of biosolids long-term effects on above- and belowground dynamics will lead to a greater understanding of ecosystem-level effects. Dennis and Fresquez (1989) found that cultivable fractions of the soil microbial community from a semi-arid grassland increased linearly with the biosolids application rate (22.5, 45, and 90 Mg ha−1), and they noted that improvements in soil fertility and site restoration were reflected in diversity and composition of the soil microbial community. García-Gil et al. (2004) reported increased microbial biomass, basal respiration, metabolic quotient, and enzymatic activities in another semi-arid soil, amended 9 or 36 months previously, with biosolids at approximately 36 Mg ha−1. Barbarick et al. (2004) examined microbial responses to biosolids in both semi-arid grassland (0 and 30 Mg ha-1) and shrubland (0 and 40 Mg ha−1) sites 6 years after biosolids surface application. At both sites, CO2 evolution and actively metabolizing microbial biomass were greater in plots 6 years following biosolids application than in control (nonamended) plots. Pascual et al. (1999) examined microbiological and biochemical parameters of semi-arid soils 8 years after biosolids amendment (65 and 260 Mg ha−1). Compared to control plots, the amended plots exhibited greater total organic C, microbial biomass, basal respiration rate, and enzymatic activity even 8 years after biosolids incorporation. Enzymatic activities have often been estimated to establish the indices of soil fertility. Microorganisms as well as plants synthesize enzymes, which act as a biocatalyst of important reactions to produce essential compounds for both soil microorganisms and the plants. Soil enzymatic activities can be indirectly affected by heavy metals present in the sewage sludge (Kandeler et al., 2000). The effect of sewage sludge on biological activity may be used as indicator of soil pollution (Fließbach et al., 1994). According to some researches sewage sludge amendment increased the soil microbial activity, soil respiration and soil enzymes activities (Banerjee et al., 1997; Kayikcioglu and Delibacak, 2018). However, reduction in soil enzyme activities has also been reported at longer incubation period with high heavy metal availability (Fließbach et al., 1994). Effects of adding different doses (0, 100, 200 and 300 t/ha dry wt.) and C/N ratios (3:1, 6:1 and 9:1) of the sewage sludge on activities of b-glucosidase, alkaline phosphatase, arylsulphatase and urease in a clay loam soil at 25ºC and 60% water holding capacity were studied by Kizilkaya and Bayrakli (2005). Nitrogen was added in the form of (NH4)2SO4 solution to the sludge to obtain different C/N ratios. Rapid and significant increase in the soil enzymatic activity has been noted at different doses and C/N ratios of the sewage sludge amendments as compared to unamended ones. Enzyme activities varied with differences in incubation period. Soils with the highest C/N ratio and sludge dose had the highest b-glucosidase activity. Alkaline phosphatase and aryl sulphatase showed an increment in their activity during the first 30 days of incubation followed by a pronounced decrease compared to unamended soil. Urease activity, however, showed an increase within 15 days, and thereafter activity declined. The highest activities of urease, alkaline phosphatase and arylsulphatase were observed in soil amended with a low C/N ratio and the highest dose of sludge (Kizilkaya and Bayrakli, 2005).
Harmfull effects
Application of sewage sludge in agriculture or for soil reclamation is an interesting solution. It is more and more frequently used in practice due to the advantageous effect of sewage sludge on the properties of soils fertilised/reclaimed with its application. Apart from soil enrichment in nutrients (Fytili and Zabaniotou, 2008), an addition of sewage sludge causes an increase in organic matter content in soil (Epstein, 2003). Organic matter resources in soils are relatively low and frequently require replenishment. Therefore, the use of sewage sludge in agriculture is a desirable method of their utilisation. The addition of sewage sludge to soils may thus be an inexpensive and effective alternative to the methods applied currently (mineral fertilisation, manure etc.). In spite of the undisputable advantages resulting from the application of sewage sludge in agriculture, it also involves some serious threats. Among those we should mention the presence of pathogens, heavy metals, and organic pollutants (Harrison et al., 2006; Oleszczuk, 2006a; Smith, 2009). Standards for maximum concentrations of pathogens in sewage sludge were given on Table 2.
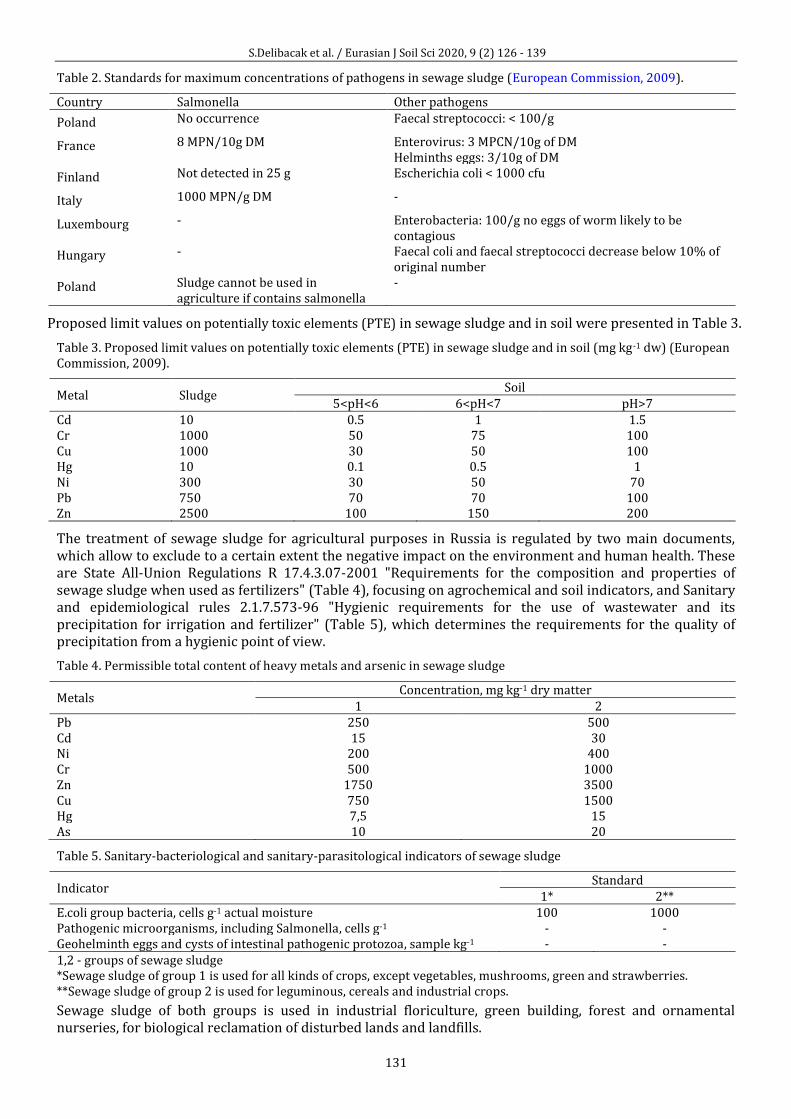
S.Delibacak et al. / Eurasian J Soil Sci 2020, 9 (2) 126 - 139
131
Table 2. Standards for maximum concentrations of pathogens in sewage sludge (European Commission, 2009).
Country Salmonella Other pathogens
Poland No occurrence Faecal streptococci: < 100/g
France 8 MPN/10g DM Enterovirus: 3 MPCN/10g of DM Helminths eggs: 3/10g of DM
Finland Not detected in 25 g Escherichia coli < 1000 cfu
Italy 1000 MPN/g DM -
Luxembourg - Enterobacteria: 100/g no eggs of worm likely to be contagious
Hungary - Faecal coli and faecal streptococci decrease below 10% of original number
Poland Sludge cannot be used in agriculture if contains salmonella
-
Proposed limit values on potentially toxic elements (PTE) in sewage sludge and in soil were presented in Table 3.
Table 3. Proposed limit values on potentially toxic elements (PTE) in sewage sludge and in soil (mg kg-1 dw) (European Commission, 2009).
Metal Sludge Soil
5<pH<6 6<pH<7 pH>7 Cd 10 0.5 1 1.5 Cr 1000 50 75 100 Cu 1000 30 50 100 Hg 10 0.1 0.5 1 Ni 300 30 50 70 Pb 750 70 70 100 Zn 2500 100 150 200
The treatment of sewage sludge for agricultural purposes in Russia is regulated by two main documents, which allow to exclude to a certain extent the negative impact on the environment and human health. These are State All-Union Regulations R 17.4.3.07-2001 "Requirements for the composition and properties of sewage sludge when used as fertilizers" (Table 4), focusing on agrochemical and soil indicators, and Sanitary and epidemiological rules 2.1.7.573-96 "Hygienic requirements for the use of wastewater and its precipitation for irrigation and fertilizer" (Table 5), which determines the requirements for the quality of precipitation from a hygienic point of view.
Table 4. Permissible total content of heavy metals and arsenic in sewage sludge
Metals Concentration, mg kg-1 dry matter
1 2 Pb 250 500 Cd 15 30 Ni 200 400 Cr 500 1000 Zn 1750 3500 Сu 750 1500 Hg 7,5 15 As 10 20
Table 5. Sanitary-bacteriological and sanitary-parasitological indicators of sewage sludge
Indicator Standard
1* 2** E.coli group bacteria, cells g-1 actual moisture 100 1000 Pathogenic microorganisms, including Salmonella, cells g-1 - - Geohelminth eggs and cysts of intestinal pathogenic protozoa, sample kg-1 - - 1,2 - groups of sewage sludge *Sewage sludge of group 1 is used for all kinds of crops, except vegetables, mushrooms, green and strawberries. **Sewage sludge of group 2 is used for leguminous, cereals and industrial crops.
Sewage sludge of both groups is used in industrial floriculture, green building, forest and ornamental nurseries, for biological reclamation of disturbed lands and landfills.
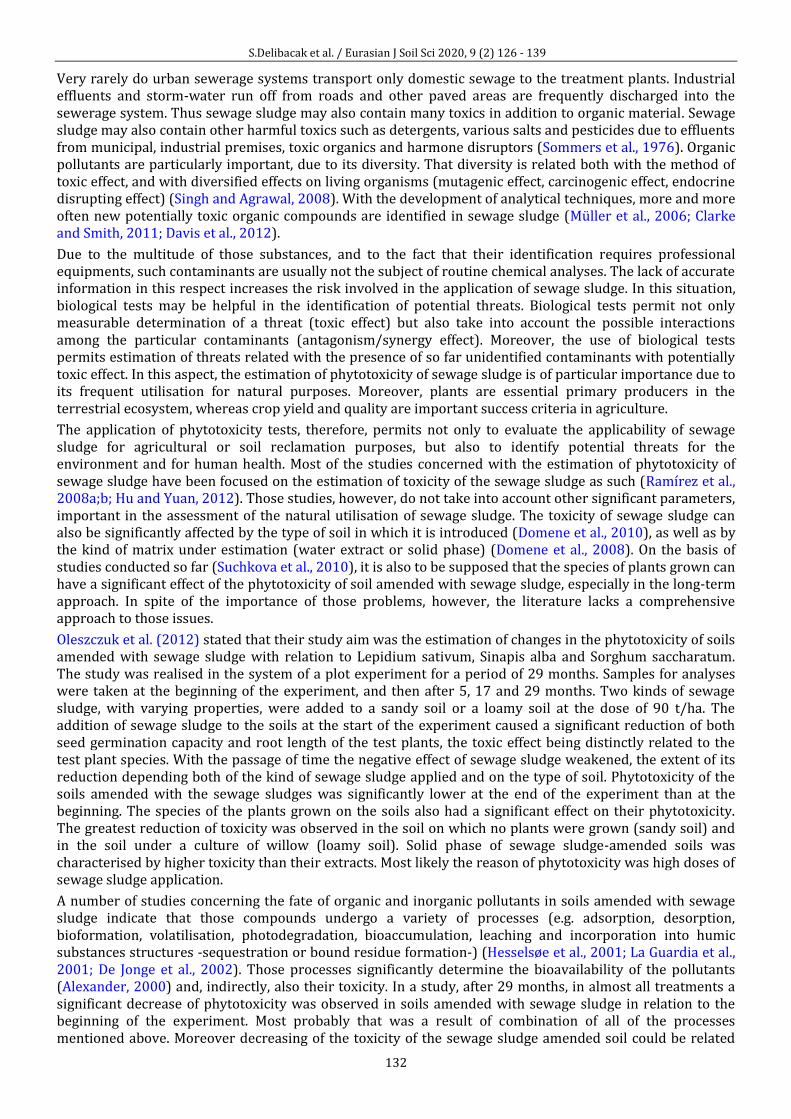
S.Delibacak et al. / Eurasian J Soil Sci 2020, 9 (2) 126 - 139
132
Very rarely do urban sewerage systems transport only domestic sewage to the treatment plants. Industrial effluents and storm-water run off from roads and other paved areas are frequently discharged into the sewerage system. Thus sewage sludge may also contain many toxics in addition to organic material. Sewage sludge may also contain other harmful toxics such as detergents, various salts and pesticides due to effluents from municipal, industrial premises, toxic organics and harmone disruptors (Sommers et al., 1976). Organic pollutants are particularly important, due to its diversity. That diversity is related both with the method of toxic effect, and with diversified effects on living organisms (mutagenic effect, carcinogenic effect, endocrine disrupting effect) (Singh and Agrawal, 2008). With the development of analytical techniques, more and more often new potentially toxic organic compounds are identified in sewage sludge (Müller et al., 2006; Clarke and Smith, 2011; Davis et al., 2012).
Due to the multitude of those substances, and to the fact that their identification requires professional equipments, such contaminants are usually not the subject of routine chemical analyses. The lack of accurate information in this respect increases the risk involved in the application of sewage sludge. In this situation, biological tests may be helpful in the identification of potential threats. Biological tests permit not only measurable determination of a threat (toxic effect) but also take into account the possible interactions among the particular contaminants (antagonism/synergy effect). Moreover, the use of biological tests permits estimation of threats related with the presence of so far unidentified contaminants with potentially toxic effect. In this aspect, the estimation of phytotoxicity of sewage sludge is of particular importance due to its frequent utilisation for natural purposes. Moreover, plants are essential primary producers in the terrestrial ecosystem, whereas crop yield and quality are important success criteria in agriculture.
The application of phytotoxicity tests, therefore, permits not only to evaluate the applicability of sewage sludge for agricultural or soil reclamation purposes, but also to identify potential threats for the environment and for human health. Most of the studies concerned with the estimation of phytotoxicity of sewage sludge have been focused on the estimation of toxicity of the sewage sludge as such (Ramírez et al., 2008a;b; Hu and Yuan, 2012). Those studies, however, do not take into account other significant parameters, important in the assessment of the natural utilisation of sewage sludge. The toxicity of sewage sludge can also be significantly affected by the type of soil in which it is introduced (Domene et al., 2010), as well as by the kind of matrix under estimation (water extract or solid phase) (Domene et al., 2008). On the basis of studies conducted so far (Suchkova et al., 2010), it is also to be supposed that the species of plants grown can have a significant effect of the phytotoxicity of soil amended with sewage sludge, especially in the long-term approach. In spite of the importance of those problems, however, the literature lacks a comprehensive approach to those issues.
Oleszczuk et al. (2012) stated that their study aim was the estimation of changes in the phytotoxicity of soils amended with sewage sludge with relation to Lepidium sativum, Sinapis alba and Sorghum saccharatum. The study was realised in the system of a plot experiment for a period of 29 months. Samples for analyses were taken at the beginning of the experiment, and then after 5, 17 and 29 months. Two kinds of sewage sludge, with varying properties, were added to a sandy soil or a loamy soil at the dose of 90 t/ha. The addition of sewage sludge to the soils at the start of the experiment caused a significant reduction of both seed germination capacity and root length of the test plants, the toxic effect being distinctly related to the test plant species. With the passage of time the negative effect of sewage sludge weakened, the extent of its reduction depending both of the kind of sewage sludge applied and on the type of soil. Phytotoxicity of the soils amended with the sewage sludges was significantly lower at the end of the experiment than at the beginning. The species of the plants grown on the soils also had a significant effect on their phytotoxicity. The greatest reduction of toxicity was observed in the soil on which no plants were grown (sandy soil) and in the soil under a culture of willow (loamy soil). Solid phase of sewage sludge-amended soils was characterised by higher toxicity than their extracts. Most likely the reason of phytotoxicity was high doses of sewage sludge application.
A number of studies concerning the fate of organic and inorganic pollutants in soils amended with sewage sludge indicate that those compounds undergo a variety of processes (e.g. adsorption, desorption, bioformation, volatilisation, photodegradation, bioaccumulation, leaching and incorporation into humic substances structures -sequestration or bound residue formation-) (Hesselsøe et al., 2001; La Guardia et al., 2001; De Jonge et al., 2002). Those processes significantly determine the bioavailability of the pollutants (Alexander, 2000) and, indirectly, also their toxicity. In a study, after 29 months, in almost all treatments a significant decrease of phytotoxicity was observed in soils amended with sewage sludge in relation to the beginning of the experiment. Most probably that was a result of combination of all of the processes mentioned above. Moreover decreasing of the toxicity of the sewage sludge amended soil could be related
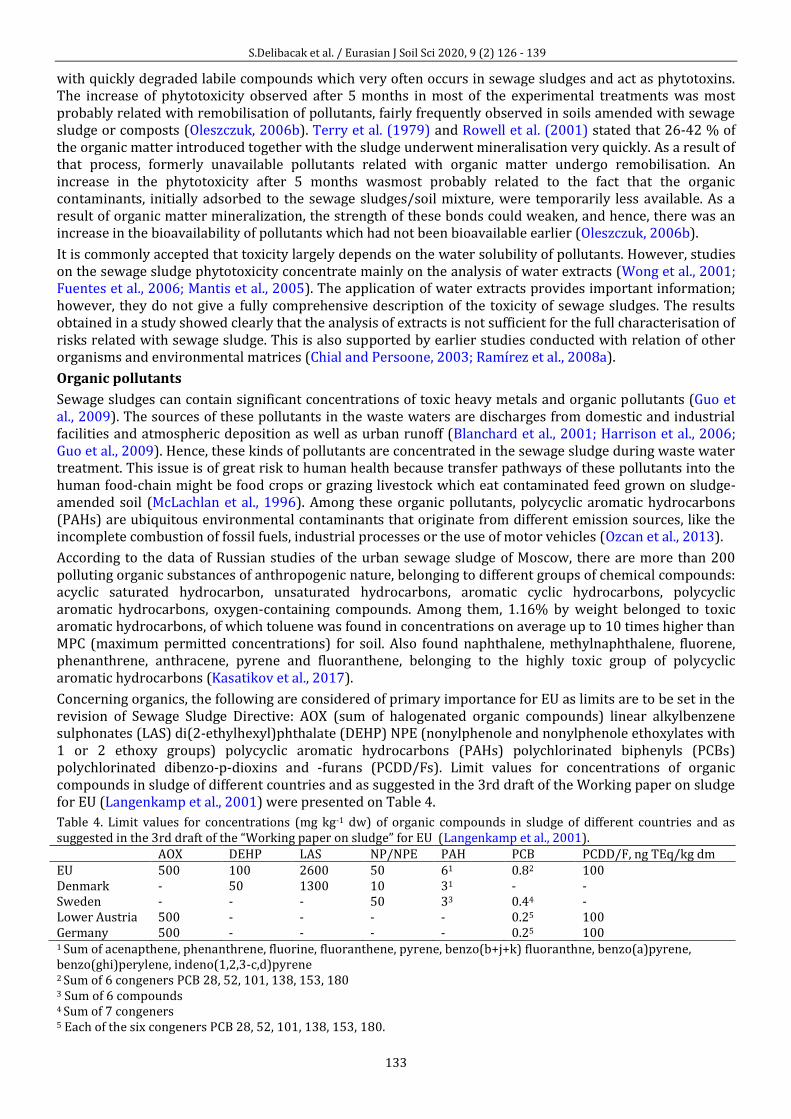
S.Delibacak et al. / Eurasian J Soil Sci 2020, 9 (2) 126 - 139
133
with quickly degraded labile compounds which very often occurs in sewage sludges and act as phytotoxins. The increase of phytotoxicity observed after 5 months in most of the experimental treatments was most probably related with remobilisation of pollutants, fairly frequently observed in soils amended with sewage sludge or composts (Oleszczuk, 2006b). Terry et al. (1979) and Rowell et al. (2001) stated that 26-42 % of the organic matter introduced together with the sludge underwent mineralisation very quickly. As a result of that process, formerly unavailable pollutants related with organic matter undergo remobilisation. An increase in the phytotoxicity after 5 months wasmost probably related to the fact that the organic contaminants, initially adsorbed to the sewage sludges/soil mixture, were temporarily less available. As a result of organic matter mineralization, the strength of these bonds could weaken, and hence, there was an increase in the bioavailability of pollutants which had not been bioavailable earlier (Oleszczuk, 2006b).
It is commonly accepted that toxicity largely depends on the water solubility of pollutants. However, studies on the sewage sludge phytotoxicity concentrate mainly on the analysis of water extracts (Wong et al., 2001; Fuentes et al., 2006; Mantis et al., 2005). The application of water extracts provides important information; however, they do not give a fully comprehensive description of the toxicity of sewage sludges. The results obtained in a study showed clearly that the analysis of extracts is not sufficient for the full characterisation of risks related with sewage sludge. This is also supported by earlier studies conducted with relation of other organisms and environmental matrices (Chial and Persoone, 2003; Ramírez et al., 2008a).
Organic pollutants
Sewage sludges can contain significant concentrations of toxic heavy metals and organic pollutants (Guo et al., 2009). The sources of these pollutants in the waste waters are discharges from domestic and industrial facilities and atmospheric deposition as well as urban runoff (Blanchard et al., 2001; Harrison et al., 2006; Guo et al., 2009). Hence, these kinds of pollutants are concentrated in the sewage sludge during waste water treatment. This issue is of great risk to human health because transfer pathways of these pollutants into the human food-chain might be food crops or grazing livestock which eat contaminated feed grown on sludge-amended soil (McLachlan et al., 1996). Among these organic pollutants, polycyclic aromatic hydrocarbons (PAHs) are ubiquitous environmental contaminants that originate from different emission sources, like the incomplete combustion of fossil fuels, industrial processes or the use of motor vehicles (Ozcan et al., 2013).
According to the data of Russian studies of the urban sewage sludge of Moscow, there are more than 200 polluting organic substances of anthropogenic nature, belonging to different groups of chemical compounds: acyclic saturated hydrocarbon, unsaturated hydrocarbons, aromatic cyclic hydrocarbons, polycyclic aromatic hydrocarbons, oxygen-containing compounds. Among them, 1.16% by weight belonged to toxic aromatic hydrocarbons, of which toluene was found in concentrations on average up to 10 times higher than MPC (maximum permitted concentrations) for soil. Also found naphthalene, methylnaphthalene, fluorene, phenanthrene, anthracene, pyrene and fluoranthene, belonging to the highly toxic group of polycyclic aromatic hydrocarbons (Kasatikov et al., 2017).
Concerning organics, the following are considered of primary importance for EU as limits are to be set in the revision of Sewage Sludge Directive: AOX (sum of halogenated organic compounds) linear alkylbenzene sulphonates (LAS) di(2-ethylhexyl)phthalate (DEHP) NPE (nonylphenole and nonylphenole ethoxylates with 1 or 2 ethoxy groups) polycyclic aromatic hydrocarbons (PAHs) polychlorinated biphenyls (PCBs) polychlorinated dibenzo-p-dioxins and -furans (PCDD/Fs). Limit values for concentrations of organic compounds in sludge of different countries and as suggested in the 3rd draft of the Working paper on sludge for EU (Langenkamp et al., 2001) were presented on Table 4.
Table 4. Limit values for concentrations (mg kg-1 dw) of organic compounds in sludge of different countries and as suggested in the 3rd draft of the “Working paper on sludge” for EU (Langenkamp et al., 2001). AOX DEHP LAS NP/NPE PAH PCB PCDD/F, ng TEq/kg dm EU 500 100 2600 50 61 0.82 100 Denmark - 50 1300 10 31 - - Sweden - - - 50 33 0.44 - Lower Austria 500 - - - - 0.25 100 Germany 500 - - - - 0.25 100 1 Sum of acenapthene, phenanthrene, fluorine, fluoranthene, pyrene, benzo(b+j+k) fluoranthne, benzo(a)pyrene, benzo(ghi)perylene, indeno(1,2,3-c,d)pyrene 2 Sum of 6 congeners PCB 28, 52, 101, 138, 153, 180 3 Sum of 6 compounds 4 Sum of 7 congeners 5 Each of the six congeners PCB 28, 52, 101, 138, 153, 180.
S.Delibacak et al. / Eurasian J Soil Sci 2020, 9 (2) 126 - 139
134
Polycyclic aromatic hydrocarbons (PAHs) contents and sources
Polycyclic aromatic hydrocarbons are one of the most important groups of ecotoxicants due to their high toxicity, considerable stability in the environment, a cumulative effect. They are chemically inert and are hardly affected by the action of acids and oxidizing agents. Certain members of the PAH class have been listed as priority pollutants by Environmental Protection Agencies of the United States, Europe and China. The PAHs often detected in sewage sludge are mainly naphthalene, phenanthrene, anthracene, fluorene, acenaphthene, acenaphthylene, 1,2benzanthracene, benzo(a)pyrene, benzo(b) fluoranthene, benzo(g,h,i)perylene, benzo(k) fluoranthene, fluoranthene, indeno(1,2,3-cd)pyrene and pyrene (Zhai et al., 2011).
The origin of PAHs in sewage can be from combustion of petroleum, kerosene, grass, coal, and wood. Concentration ratios of some PAHs are often used to estimate the sources of PAHs, i.e., combustion and petroleum sources (Soclo et al., 2000). Using molecular mass of 178 as an indicator, anthracene to(anthraceneşphenanthrene) ratio with <0.10 usually represents the petroleum sources PAHs, while the ratio with >0.10 is often considered as an indication of combustion sources (Budzinski, 1997). Yunker et al. (2002) reported that the ratio of (benz[a]anthracene)/(benz[a]anthraceneschrysene) lower than 0.20 implies a petroleum source; the ratio from 0.20 to 0.35 means either petroleum or combustion sources; and the ratio higher than 0.35 indicates combustion sources.
The study of samples collected at a waste-water treatment plant in Shanghai (China) indicates that PAHs release regularly according to temperature changes in the process of sewage sludge incineration treatment (Zhang et al., 2016). Over 90% of total PAHs in sewage sludge are released at the temperature of 300–750°C. The transformation of naphthalene to indeno (1, 2, 3cd) pyrene may be related to the temperature of the treatment system. It has been shown that the output rate of transformation reactions for indeno (1, 2, 3-cd) pyrene is 94% at 300°C.
The source of wastewater, wastewater treatment methods and different treatment process affect the PAH concentrations in sludge. The PAHs concentrations varied strongly between the sludges from primary and secondary treatment processes: the sum of PAHs in the primary sludge were 1.5973 and 0.3402 mg/kg, in the secondary sludge they were 8.7884 and 2.0185mg/kg respectively (Zhai et al., 2011). An enrichment of PAHs over time can be explained by the longer retention time of secondary sludge in comparison with primary sludge.
Previous studies reported a large range in the total concentration of PAHs in sewage sludge from Asian, African, and European countries, varying from below detection to 33,000 ng/g dry weight (Cai et al. 2007; Man et al. 2016; Poluszyńska et al. 2017).
According to Turkish regulation, concentration of total PAHs (naphthalene, acenaphthylene, acenapthene, fluorene, phenanthrene, anthracene, fluoranthene, pyrene, benzo[a]anthracene, chrysene, benzo[b]fluoranthene, benzo[k]fluoranthene, benzo[a]pyrene Indeno[1,2,3-c,d]pyrene, dibenzo[a,h]anthracene, benzo[g,h,i]perylene, benzo[j]fluoranthene) should be <6 mg kg-1 dry matter. According to EU regulation, concentration of total PAHs (acenapthene, phenanthrene, fluorene, plouranthene, pyrene, benzo[b;j;k]fluoranthene, benzo[a]pyrene, benzo[g,h,i]perylene, indeno[1,2,3-c,d]pyrene) should be <6 mg kg-1 dry matter. If the ratio is >0.50, the combustion of kerosene, grass, coal, and wood results in the PAH contamination. If fluoranthene/(fluoranthenespyrene) ratio for sludge was <0.50, which means the origin of PAHs was petroleum combustion. While this ratio for sludge was >0.50, indicating possible source of PAHs was combustion of kerosene, grass, coal, and wood (Ozcan et al., 2013).
Russian legislation in the field of health and environmental protection provides the standards only for the content of benzo (a) pyrene -0,02 mg kg-1 (SanPiN GN 2.1.7.2041-06).
Polychlorinated biphenyls (PCBs) contents
Although sewage sludge improves soil properties, numerous studies have demonstrated that they also contain toxic organic compounds, such as polychlorinated biphenyls (PCBs) (McLachlan et al. 1996; Urbaniak et al. 2014; Wyrwicka et al. 2014), PCBs are found in the natural environment because of human activities (Borja et al., 2011). Approximately 30% (i.e., 10 million tonnes) of the total worldwide production of PCBs has entered the environment (Benabdallah El-Hadj et al., 2007). The presence of these compounds in sewage sludge significantly decreases the potential for the sludge to be used in agriculture. According to proposed changes to EU Directive 1986/278/EEC, the polychlorinated biphenyl (PCB) concentration (expressed as the sum of the concentrations of the indicator congeners, PCBs 28, 52, 101, 118, 138, 153, and 180) should not exceed 0.8 mg/kg dry matter (DM) in sewage sludge used as a crop fertilizer. Many researches confirm the presence of PCBs in sewage sludge and organic waste, which should be utilized (Blanchard et al., 2004). Two biological methods are generally used: composting and the anaerobic
S.Delibacak et al. / Eurasian J Soil Sci 2020, 9 (2) 126 - 139
135
digestion. Rosinska and Dabrowska obtained decrease of PCB content over 50% during anaerobic digestion of sludge (Rosińska and Dabrowska, 2014). Despite the fact that PCBs show a strong affinity to organic matter which predispose them to be stored in the sediments (Gdaniec-Pietryka et al., 2013) and surface layer of the soil, it has been also shown that they can be transferred deeper into the soil profile (Bi et al., 2002; Kobasić et al., 2008; Zhang et al., 2011). Hence, the continued use of such contaminated sludge for agricultural purposes can present problems associated with the risk of soil, subsurface and groundwater contamination (Bi et al., 2002). This also concerns nutrients, which despite being valuable from the perspective of agriculture, their combined application with sewage sludge may lead to health and environmental risks associated with subsurface and groundwater pollution (Kang et al., 2011).
The Turkish and EU regulations describes that levels of PCBs (sum of PCB 28, 52, 101, 118, 138, 153, and 180) in sewage sludges should be <0.8 mg kg-1 (dry weight) in order to be used in agriculture (Ozcan et al., 2013). Ozcan et al. (2013) indicated that the PCB concentrations of all investigated sewage sludges in their study were less than the limit value, it was found that use of them for agricultural purposes was suitable.
Conclusions
Sewage sludge to be utilised in agriculture must be subjected to comprehensive evaluation comprising not only the determination of the basic physicochemical properties, content of pollutants or pathogenic bacteria, but also of the ecotoxicological properties. i) phytotoxicity of sewage sludge and its changes overtime are significantly determined by the soil type. In this case, the soil type is one of the most important factors regulating the phytotoxicity of sewage sludge, especially in the long-term aspect; ii) with the passage of time the phytotoxicity of soils amended with sewage sludge undergoes a change, not always in a direction causing a lowering of their toxicity. The extent of particular changes depends both on the properties of the soils and on the kind of sewage sludge, and for various kinds of sludge, it can have different direction in a single soil; iii) the extent of changes in the toxic effect on the test plants is related to the species of the plant under cultivation; iv) in spite of similar initial toxicity displayed by various kinds of sewage sludge in relation to particular plants, further changes of phytotoxicity may vary with relation to the sewage sludge and the type of soil; v) the intensity of toxicity towards various plants depends not only on the kind of sewage sludge but also on the soil type; vi) proper selection of the conditions of management sludge-amended soil can be conducive to a reduction of phytotoxicity; and vii) estimation of extracts is not sufficient for the full characterisation of the risk involved in the utilisation of sewage sludge in agriculture.
On the other hand, biosolids is a good source organic matter as well as plant macro and micro-nutrients and in future can be substituted for expensive inorganic fertilization. Addition of treated biosolids to soil has been found to be beneficial to soil health, enriching soil with essential nutrient elements as also increasing the pH of the soil. Further, soil amendments with biosolids has been reportedly effective in increasing a number of agro morphological attributes as well as yield in different crop species. However, use of biosolids for commercial agriculture has to be done cautiously. It is common knowledge that biosolids often contains toxic metal residues (heavy metals), as well as toxic organic residues, indiscriminate use of it can be detrimental to the productivity of the soil as well as cause harm to the food chain. Moreover the character of the biosolids changes over time and hence stringent and periodic monitoring of biosolids for agricultural use should be done. In general, a potential waste management depends on several tiers like disposal, recovery, recycle, reuse and prevention. This hierarchy is also suitable for managing biosolids. It is evident that implication of biosolids induce agricultural productivity to a certain level; but the application of this waste in major food generation and supply chain is still needs more study.
International as well as national guidelines on the carrying capacity of toxicants in biosolids composts should be set and stringent monitoring of such guidelines should be enforced in agricultural use of biosolids. Attempts for commercial production of biosolids based fertilizer and soil health amendments can be setup and can be used to boost agricultural production, and minimizing the dependency on inorganic fertilization. This will further reduce the carbon footprint, as most inorganic fertilizers are manufactured at high energy costs. Biosolids can be used for regaining soil fertility in agricultural lands deemed infertile by prolonged and indiscriminate use of synthetic inorganic fertilizers. In such conditions, depletion of soil nutrients as well as decreased soil pH can be rejuvenated with the rational use of biosolids. Owing to high nutrient efficiency and its importance in agriculture and soil fertility, stringent and persistent monitoring of biosolids and its products should be done before introduction in agricultural systems.
In the current scenario of increasing global population, the generation of solid wastes like biosolids is bound to increase remarkably. Improper and unscientific disposal of biosolids results in several environmental issues such as surface and groundwater contamination, degradation of land, and food chain contamination.
S.Delibacak et al. / Eurasian J Soil Sci 2020, 9 (2) 126 - 139
136
Hence, according to the principles of waste management hierarchy, agricultural recycling of biosolids will be a more environmentally preferred option over the traditional disposal methods. Utilizing the potential of biosolids to recycle valuable plant nutrients and as an effective soil amendment will not only help in sustainable management of this waste but also in minimizing the negatives associated with its traditional disposal. Every country must obey their regulations and legislations for managing their sewage sludge.
Researchers around the world are looking for the most optimal set of substances for priority analysis. The knowledge of which will be used to find the best path to deal with the problem of rational and, necessarily, environmentally-safe way of disposal of sewage sludge. Perhaps more fundamental research using new modern chemical methods for the analysis of hazardous organic compounds can tighten the control on the qualitative composition of sewage sludge used in agriculture.
References Adams, T.McM., Sanders, J.R., 1984. The effect of pH on the release to solution of zinc, copper and nickel from metal
loaded sewage sludges. Environmental Pollution Series B, Chemical and Physical 8(2): 85–99. Alexander, M., 2000. Aging, bioavailability, and overestimation of risk from environmental pollutants. Environmental
Science and Technology 34: 4259–4265. Archie, S.G., Smith, M., 1981. Survival and growth of plantations in sewage sludge treated soil and older forest growth
study. In: Municipal Sludge Application to Pacific North-West forest lands. Bledose, C.B. (Ed.), University of Washington, College of Forest Resources, Washington, DC, USA. pp. 105–113.
Banerjee, M.R., Burtonand, D.L., Depoe, S., 1997. Impact of sewage sludge application on soil application characteristics. Agriculture, Ecosystems & Environment 66(3:, 241–249.
Barbarick. K., Doxtader, K.G., Redente, E.F., Brobst, R.B., 2004. Biosolids effects on microbial activity in scrubland and grassland soil. Soil Science 169(3):176-187.
Benabdallah El-Hadj, T., Dosta, J., Torres, R., Mata-Alvarez, J., 2007. PCB and AOX removal in mesophilic and termophilic sewage sludge digestion. Biochemical Engineering Journal 36(3): 281-287.
Bi, X., Chu, S., Meng, Q., Xu, X., 2002. Movemnt and retention of polychlorinated biphenyls in a paddy field of WenTai are in China. Agriculture, Ecosystems & Environment 89(3): 241–252.
Blanchard, M., Teil, M.J., Ollivon, D., Garban, B., Chestérikoff, C., Chevreuil, M., 2001. Origin and distribution of polyaromatic hydrocarbons and polychlorobiphenyls in the urban effluents to waste water treatment plants of the Paris Area (FRANCE), Water Research 35(15): 3679-3687.
Blanchard, M., Teil, M.J., Ollivon, D., Legenti, L. Chevreueil, M., 2004. Polycyclic Aromatic hydrocarbons and polychlorobiphenyls in waste waters and sewage sludges from the Paris Area (France). Environmental Research 95(2): 184-197.
Borja, Á., Belzunce, M. J., Garmendia, J. M., Rodríguez, J. G., Solaun, O., Zorita, I., 2011. Impact of pollutants on coastal and benthic marine communities. In: Ecological Impacts of Toxic Chemicals. Sánchez-Bayo, F., van den Brink, P. J., Mann, R.M. (Eds.). Bentham Science Publishers Ltd. pp. 165–186
Bradford, G.R., Page, A.L., Lund, L.J., Olmstead, W., 1975. Trace element concentrations of sewage treatment plant effluents and sludges; their interactions with soils and uptake by plants. Journal of Environmental Quality 4(1): 123–127.
Breslin, V.T., 1999. Retention of metals in agricultural soils after amending with MSW and MSW-biosolids compost. Water, Air, and Soil Pollution 109(1-4): 163–178.
Budzinski, H., Jones, I., Bellocq, J., Pierard, C., Garrigues, P., 1997. Evaluation of Sediment Contamination by Polycyclic Aromatic Hydrocarbons in the Gironde Estuary. Marine Chemistry 58(1-2): 85–97.
Chaney, R.L., Ryan, J.A., 1993. Heavy Metals and Toxic Organic Pollutants in MSW-Compost: Research Results on Phytoavailability, Bioavailability, Fate, etc. In: Science and Engineering of Composting Design, Environmental, Microbiological and Utilization Aspects. Hoitink, H.A.J., Keener, H.M. (Eds.). Renaissance Publications, Worthington, pp.451-506.
Chial, B., Persoone, G., 2003. Cyst-based toxicity tests XV application of ostracod solid-phase microbiotest for toxicity monitoring of contaminated soils. Environmental Toxicology 18(5): 347–352.
Clarke, B.O., Smith, S.R., 2011. Review of ‘emerging’ organic contaminants in biosolids and assessment of international research priorities for the agricultural use of biosolids. Environmental International 37(1): 226–247.
Coleman, D.C., Crossley, D.A.Jr., 1996. Fundamentals of Soil Ecology. Academic Press, San Diago USA. 375p. Davis, E.F., Klosterhaus, S.L., Stapleton, H.M., 2012. Measurement of flame retardants and triclosan in municipal sewage
sludge and biosolids. Environmental International 40: 1–7 De Jonge, H., De Jonge, L.W., Blicher, B.W., Moldrup, P., 2002. Transport of Di(2-ethylhexyl)phthalate (DEHP) applied
with sewage sludge to undisturbed and repacked soil columns. Journal of Environmental Quality 31(6): 1963–1971.
Delibacak, S., Ongun, A.R., 2018. Influence of treated sewage sludge applications on total and available heavy metal concentration of sandy clay soil. Desalination and Water Treatment 112: 112–118.
Dennis, G.L., Fresquez, P.R., 1989. The soil microbial community in a sewage sludge amended grassland. Biology and Fertility of Soils 7(4): 310–317.
S.Delibacak et al. / Eurasian J Soil Sci 2020, 9 (2) 126 - 139
137
Department of the Environment, 1981. Report of the sub-committee on the disposal of sewage sludge to land. Department of Environment and National Water Council, London.
Domene, X., Alcañiz, J.M., Andres, P., 2008. Comparison of solid-phase and eluate assays to gauge the ecotoxicological risk of organic wastes on soil organisms. Environmental Pollution 151(3): 549–558.
Domene, X., Colón, J., Uras, M.V., Izquierdo, R., Àvila, A., Alcañiz, J.M., 2010. Role of soil properties in sewage sludge toxicity to soil collembolans. Soil Biology and Biochemistry 42(11): 1982–1990.
Epstein, E., 1975. Effect of sewage sludge on some soil physical properties. Journal of Environmental Quality 4(1): 139–142.
Epstein, E., 2003. Land application of sewage sludge and biosolids. CRC Press, Boca Raton, USA. 216p. Epstein, E., Taylor, J.M., Chaney, R.L., 1976. Effects of sewage sludge and sludge compost applied to soil on some soil
physical and chemical properties. Journal of Environmental Quality 5(4): 422–426. European Commission, 2009. Environmental, economic and social impacts of the use of sewage sludge on land.
Consultation Report on Options and Impacts, Report by RPA, Milieu Ltd and WRc for the European Commission, DG Environment under Study Contract DG ENV.G.4/ETU/2008/0076r.
Fließbach, A., Martens, R., Reber, H.H., 1994. Soil microbial biomass and microbial activity in soils treated with heavy metal contaminated sewage sludge. Soil Biology and Biochemistry 26(9): 1201–1205.
Fuentes, A., Llorens, M., Sacz, J., Aguilar, M.I., Perez-Marin, A.B., Ortuno, J.F., Meseguer, V.F., 2006. Ecotoxicity, phytotoxicity and extractability of heavy metals from different stabilized sewage sludges. Environmental Pollution 143(2): 355–360.
Fytili, D., Zabaniotou, A., 2008. Utilization of sewage sludge in EU application of old and new methods—a review. Renewable and Sustainable Energy Reviews 12(1): 116–140.
García -Gil, J. C., Plaza, C., Senesi, N., Brunetti, G., Polo, A., 2004. Effects of sewage sludge amendment on humic acids and microbiological properties of a semiarid Mediterranean soil. Biology and Fertility of Soils 39(5): 320–328.
Gdaniec-Pietryka, M., Mechlińska, A., Wolska, L. Gałuszka, A., Namieśnik, J., 2013. Remobilization of
polychlorinated biphenyls from sediment and its consequences for their transport in river waters.
Environmental Monitoring and Assessment 185: 4449-4459.
Guo, L., Zhang, B., Xiao, K., Zhang, Q., Zheng, M., 2009. Levels and distributions of polychlorinated biphenyls in sewage sludge of urban waste water treatment plants. Journal of Environmental Sciences 21(4): 468-473.
Harrison, E.Z., Oakes, S.R., Hysell, M., Hay, A., 2006. Organic chemicals in sewage sludges. The Science of the Total Environment 367(2-3): 481–497.
Hernandez, T., Moreno, J.I., Costa, F., 1991. Influence of sewage sludge application on crop yields and heavy metal availability. Journal of Soil Science and Plant Nutrition 37(2): 201–210.
Hesselsøe, M., Jensen, D., Skals, K., Olesen, T., Møldrup, P., Roslev, P., Mortensen, G. K., Henriksen, K., 2001. Degradation of 4-nonylphenol in homogeneous and nonhomogeneous mixtures of soil and sewage sludge. Environmental Science & Technology 35(18): 3695-3700.
Hu, M., Yuan, J., 2012. Heavy metal speciation of sewage sludge and its phytotoxic effects on the germination of three plant species. Advances Mathematical Research 347–353: 1022–1030.
Hue, N.V., Ranjith, S.A., 1994. Sewage sludges in Hawaii: chemical composition and reactions with soils and plants. Water, Air, and Soil Pollution 72(1-4): 265–283.
Kandeler, E., Tscherko, D., Bruce, K.D., Stemmer, M., Hobbs, P.J., Bardgett, R.D., Amelung, W., 2000. Structure and function of the soil microbial community in microhabitats of a heavy metal polluted soil. Biology and Fertility of Soils 32(5): 390–400.
Kang, J., Amoozegar, A., Hesterberg, D., Osmond, D.L., 2011. Phosphorus leaching in a sandy soil as affected by organic and inorganic fertlizer sources. Geoderma 161(3-4):194–201.
Kasatikov, V.A., Shabardina, N.P., Raskatov, V.A., 2017. After effect of the systematic application of urban sewage sludge on the agrobiological and ecological properties of soddy-podzolic soil. Plodorodie 1 (94): 43-46 [in Russian].
Kayikcioglu, H.H., Delibacak, S, 2018. Response of soil and plants health to sludge applied under Mediterranean biodegradation conditions. Applied Ecology and Environmental Research 16(4): 4893-4917.
Kizilkaya, R., Bayrakli, B., 2005. Effects of N-enriched sewage sludge on soil enzyme activities. Applied Soil Ecology 30(3): 192–202.
Kladivko, E.J., Nelson, D.W., 1979. Changes in soil properties from application of anaerobic sludge. Journal (Water Pollution Control Federation) 51(2): 325–332.
Kobasić,V.H., Picer, M., Picer, N., Calic, V., 2008. Transport of PCBs with Leachate Water from the Contaminated Soil. Bulletin of Environmental Contamination and Toxicology. 81(2):113-5
Kominko, H., Gorazda, K., Wzorek, Z., 2017. The possibility of organo-mineral fertilizer production from sewage sludge. Waste Biomass Valoriz., 1–11.
Korboulewsky, N., Dupouyet, S., Bonin, G., 2002. Environmental risks of applying sewage sludge compost to vineyards: carbon, heavy metals, nitrogen, and phosphorous accumulation. J. Environ. Qual. 31, 1522–1527.
Kulling, D., Stadelmann, F., Herter, U., 2001. Sewage Sludge – Fertilizer or Waste? UKWIR Conference, Brussels. La Guardia, M.J., Hale, R.C., Harvey, E., Matteson Mainor, T., 2001. Alkylphenol ethoxylate degradation products in land-
applied sewage sludge (biosolids). Environmental Science and Technology 35(24): 4798–4804.
S.Delibacak et al. / Eurasian J Soil Sci 2020, 9 (2) 126 - 139
138
Langenkamp H., Part, H., Erhardt, W., Prüeß, A., 2001. Organic contaminants in sewage sludge for agricultural use. Joint Research Centre, Institute for Environment and Sustainability, Soil and Waste Unit, European Commission.
Logan, T.J., Harrison, B.J., 1995. Physical characteristics of alkaline stabilized sewage sludge (N-vitro soil) and their effects on soil properties. Journal of Environmental Quality 24(1): 153–164.
Lopez-Mosquera, M.E., Moiron, C., Carral, E., 2000. Use of dairy industry sludge as fertilizer for grassland in northwest Spain: heavy metal levels in the soil and plants. Resources, Conservation and Recycling 30(2): 95–109.
Maiti, P.S., Sah, K.D., Gupta, S.K., Banerjee, S.K., 1992. Evaluation of sewage sludge as a source of irrigation and manure. Journal of the Indian Society of Soil Science 40(1): 168–172.
Man, Y.B., Chow, K.L.,Cheng, Z., Mo, W.Y.,Chan, Y.H.,Lam, J.C.W., Lau, F.T.K., Fung, W.C., Wong, M.H., 2016. Profiles and removal efficiency of polycyclic aromatic hydrocarbonsbytwodifferent types ofsewagetreatmentplants in HongKong. Journal of Environmental Sciences 53: 196–206.
Mantis, I., Voutsa, D., Samara, C., 2005. Assessment of the environmental hazard from municipal and industrial waste water treatment sludge by employing chemical and biological methods. Ecotoxicology and Environmental Safety 62(3): 397–407.
Martinez, F., Cuevas, C., Teresa, W., Iglesias I., 2002. Urban organic wastes effects on soil chemical properties in degraded semiarid ecosystem. 17th World Congress of Soil Science (WCSS). 14-21 August 2002. Bangkok, Thailand. Symposium No. 20, pp. 1–9.
McBride, M.B., 1995. Toxic metal accumulation from agricultural use of sludge: are USEPA regulations prospective?. Journal of Environmental Quality 24(1): 5–18.
McLachlan, M.S., Horstmann, M., Hinkel, M., 1996. Polychlorinated dibenzo-p-dioxins and dibenzofurans in sewage sludge: sources and fate following sludge application to land. Science of The Total Environment 185(1-3): 109–123.
Morera, M.T., Echeverria, J., Garrido, J., 2002. Bioavailability of heavy metals in soils amended with sewage sludge. Canadian Journal of Soil Science 82(4): 433–438.
Müller, J., Böhmer, W., Litz, N.T., 2006. Occurrence of polycyclic musks in sewage sludge and their behaviour in soils and plants—Part 1: behaviour of polycyclic musks in sewage sludge of different treatment plants in summer and winter. Journal of Soils and Sediments 6(4): 231–235.
Nandakumar, K., Ramamurthy, S., Rajarajan, A., Savarimuthu, E., 1998. Suitability of Dindigul town’s sewage sludge for field application: nutritional perspective. Pollution Research 17(1): 61–63.
Nielson, G.H., Hogue, E.J., Nielson, D., Zebarth, B.J., 1998. Evaluation of organic wastes as soil amendments for cultivation of carrot and chard on irrigated sandy soils. Canadian Journal of Soil Science 78, 217–225.
Ojeda, G., Alcaniz, J.M., Ortiz, O., 2003. Runoff and losses by erosion in soils amended with sewage sludge. Land Degradation & Development 14(6): 563–573.
Oleszczuk, P., 2006a. Characterization of Polish sewage sludges with respect to fertility and suitability for land application. Journal of Environmental Science and Health, Part A 41(7): 1119–1217.
Oleszczuk, P., 2006b. Persistence of polycyclic aromatic hydrocarbons (PAHs) in sewage sludge-amended soil. Chemosphere 65(9): 1616–1626.
Oleszczuk, P., Malara, A., Jośko, I., Lesiuk, A., 2012. The phytotoxicity changes of sewage sludge-amended soils. Water, Air, and Soil Pollution 223(8): 4937–4948.
Ozcan, S., Tor, A., Aydin, M. E., 2013. Investigation on the levels of heavy metals, polycyclic aromatic hydrocarbons, and polychlorinated biphenyls in sewage sludge samples and ecotoxicological testing. CLEAN Soil Air Water 41(4): 411–418.
Pappu, A., Saxena, M., Asolekar, S.R., 2007. Solid wastes generation in India and their recycling potential in building materials. Building and Environment 42(6): 2311–2320.
Parkpain, P., Sirisukhodom, S., Carbonell-Barrachina, A.A., 1998. Heavy metals and nutrients chemistry in sewage sludge amended Thai soils. Journal of Environmental Science and Health, Part A 33(4): 573–597.
Pascual, M., Hugas, M., Badiola, J.I., Monfort, J.M., Garriga, M., 1999. Lactobacillus salivarius CTC2197 Prevents Salmonella enteritidis colonization in chickens. Applied and Environmental Microbiology 65(11): 4981-4986.
Poluszyńska, J., Jarosz-Krzemińska, E., Helios-Rybicka, E., 2017. Studying the effects of two various methods of composting on the degradation levels of polycyclic aromatic hydrocarbons (PAHs) in sewage sludge. Water, Air, and Soil Pollution 228: 305.
Ramírez, W.A., Domene, X., Andrés, P., Alcañiz, J.M., 2008a. Phytotoxic effects of sewage sludge extracts on the germination of three plant species. Ecotoxicology 17(8): 834–844.
Ramírez,W. A., Domene, X., Ortiz, O., Alcañiz, J.M., 2008b. Toxic effects of digested, composted and thermally-dried sewage sludge on three plants. Bioresource Technology 99(15): 7168–7175.
Ramulu, U.S. Sree, 2002. Reuse of municipal sewage and sludge in agriculture. Scientific Publishers, Jodhpur, India. Reynolds, E.R., 2018. Shortened lifespan and other age-related defects in bang-sensitive mutants of Drosophila
melanogaster. G3: Genes, Genomes, Genetics 8(12): 3953-3960. Rosińska, A., Dąbrowska, L., 2014. Sewage sludge digestion at increased micropollutant content. Chemical Engineering
Research and Design 92(4): 752-757.
Rowell, D.M., Prescott, C.E., Preston, C.M., 2001. Decomposition and nitrogen mineralization from biosolids and other
organic materials: relationship with initial chemistry. Journal of Environmental Quality 30(4): 1401–1410.
S.Delibacak et al. / Eurasian J Soil Sci 2020, 9 (2) 126 - 139
139
Sanchez Monedero, M.A., Mondini, C., De Nobili, M., Leita, L., Roig, A., 2004. Land applications of biosolids. Soil response to different stabilization degree or treated organic matter. Waste Management 24(4): 325–332.
Sanitary and epidemiological rules 2.1.7.573-96 (SanPiN 2.1.7.573-96), "Hygienic requirements for the use of wastewater and its precipitation for irrigation and fertilizer" [in Russian].
Sanitary and epidemiological rules GN 2.1.7.2041-06 (SanPiN GN 2.1.7.2041-06) [in Russian]. Schröder, J.J., Cordell, D., Smit, A.L., Rosemarin, A., 2011. Sustainable Use of Phosphorus, EU Tender
ENV.B.1/ETU/2009/0025, Wagenigen UR Report 357. Singh, R.P., Agrawal, M., 2008. Potential Benefits and Risks of Land Application of Sewage Sludge. Waste Management
28(2): 347-358. Singh, R.P., Sharma, B., Sarkar, A., Sengupta, C., Singh, P., Ibrahim, M.H., 2014. Biological responses of agricultural soils to
fly ash amendments. In: Reviews of Environmental Contamination and Toxicology. Whitacre, D.M. (Ed.). Vol. 232, Springer International Publishing, Switzerland, pp. 45–60.
Smith, S. R., 2009. Organic contaminants in sewage sludge (biosolids) and their significance for agricultural recycling. Philosophical Transactions of The Royal Society A 367: 4005–4041.
Soclo, H. H., Garrigues, P.H., Ewald, M., 2000. Origin of polycyclic aromatic hydrocarbons (PAHs) in coastal marine sediments: Case studies in Cotonou (Benin) and Aquitaine (France) Areas. Marine Pollution Bulletin 40(5): 387–396.
Sommers, L.E., 1977. Chemical composition of sewage sludges and analysis of their potential use as fertilizers. Journal of Environmental Quality 6(2): 225–232.
Sommers, L.E., Nelson, D.W., Yost, K.J., 1976. Variable nature of chemical composition of sewage sludges. Journal of Environmental Quality 5(3): 303–306.
Soon, Y.K., 1981. Solubility and sorption of cadmium in soils amended with sewage sludge. J. Soil Sci. 32, 85–95. State All-Union Regulations R 17.4.3.07-2001 (GOST R standards 17.4.3.07-2001) "Requirements for the composition
and properties of sewage sludge when used as fertilizers” [in Russian]. Suchkova, N., Darakas, E., Ganoulis, J., 2010. Phytoremediation as a prospective method for rehabilitation of
areascontaminated by long-term sewage sludge storage: a Ukrainian-Greek case study. Ecological Engineering 36(4): 373–378.
Terry, R.E., Nelson, D.W., Sommers, L.E., 1979. Decomposition of anaerobically digested sewage sludge as affected by soil environmental conditions. Journal of Environmental Quality 8(3):342–347.
Tsadilas, C.D., Matsi, T., Barbayiannis, N., Dimoyiannis, D., 1995. Influence of sewage sludge application on soil properties and on the distribution and availability of heavy metal fractions. Communications in Soil Science and Plant Analysis 26(15-16): 2603–2619.
Urbaniak, M., Wyrwicka, A., Serwecińska, L., Zieliński, M., Tołoczko, W., 2014 Impact of sludge originated PCDDs/PCDFs on soil contamination and Salix sp. metabolism. 14th International Multidisciplinary Scientific Geoconference and EXPO. SGEM 2014. 17-26 June 2014, Albena, Bulgaria. 2(3): 169–174
USEPA, 1994. Guide to Septage Treatment and Disposal. EPA/625/R-94/ 002. Office of Research and Development, Washington, DC.
USEPA, 1999a. Control of pathogens and vector attraction in sewage sludge. United States Environmental Protection Agency (USEPA). Washington D.C.
USEPA, 1999b. Phytoremediation resource guide. Washington: U.S. Environmental Protection Agency, EPA, 542-B-99-003.
Walter, I., Cuevas, G., Garcia, S., Martinez, F., 2000. Biosolid effects on soil and native plants production in a degraded semiarid ecosystem in central Spain. Waste Management and Research 18(3): 259–263.
Wang, P., Qu, E., Li, Z., Shuman, L.M., 1997. Fractions and availability of nickel in loessial soil amended with sewage or sewage sludge. Journal of Environmntal Quality 26(3): 795–801.
Wong, J.W.C., Li, K., Su, M., Fang, D.C., 2001. Toxicity evaluation of sewage sludge in Hong Kong. Environmental International 27(5): 373–380.
Wong, J.W.C., 1995. The production of artificial soil mix from coal fly ash and sewage sludge. Environmental Technology 16(8): 741–751.
Wyrwicka A, Steffani S, Urbaniak M. 2014. The effect of PCB-contaminated sewage sludge and sediment on metabolism of cucumber plants (Cucumis sativus L.). Ecohydrology & Hydrobiology 14(1): 75-82.
Yunker, M.B., Macdonald, R.W., Vingarzan, R., Mitchell, R.H., 2002. PAHs in the Fraser river basin: A critical appraisal of PAH ratios as indicators of PAH source and composition. Organic Geochemistry 33(4): 489–515.
Zhai, J., Tian, W. Liu, K., 2011. Quantitative assessment of polycyclic aromatic hydrocarbons in sewage sludge from wastewater treatment plants in Qingdao, China. Environmental Monitoring and Assessment 180(1-4): 303-311.
Zhang, H., Xu, L., Zhang, Y., Jiang, M., 2014. The transformation of PAHs in the sewage sludge incineration treatment. Frontiers of Environmental Science & Engineering 10(2): 336–340.
Zhang, P., Ge, L., Zhou, C., Yao, Z., 2011. Evaluating the performances of accelerated-solvent extraction, microwave-assisted extraction, and ultrasonic-assisted extraction for determining PCBs, HCHs and DDTs in sediments. Chinese Journal of Oceanology and Limnology 29(5): 1103-1112.
Zhidong, Li., Wenjing, Li., 2009. Technological parameters of exceed sludge anaerobic digestion in industrial waste water treatment plant. The Electronic Journal of Geotechnical Engineering Vol.14.
O. Alsalam et al. / Eurasian J Soil Sci 2020, 9 (2) 140 - 150
140
Quantifying the role of chemical weathering rates on soil developed along an altitudinal transect in the mountainous
environments, Turkey Omar Alsalam a,*, Cevdet Şeker b, Mert Dedeoğlu b
a Baghdad University, Faculty of Agriculture, Department of Soil Science and Water Resources, Baghdad, Iraq b Selçuk University, Faculty of Agriculture, Department of Soil Science and Plant Nutrition, Konya, Turkey
Abstract Article Info Received : 21.06.2019 Accepted : 07.02.2020
Climate and elevations play an important role in controlling rate of weathering and soil formation. The role of chemical weathering rate on soil developed along an altitudinal transect in the mountainous environments in Turkey was investigated to determine the effects of climate on the geochemical characteristics of the soil. The main purposes of this study were: i) To characterize the geochemical characteristics of soils as a function of climate ii) To evaluate the soil formation and decomposition rates in Climosequence depending on the elevation by using geochemical data. For this purpose, four representative profiles were dug at different elevations. The transect of four soils formed in limestone elevations from 1139 to 1809 m. Our results showed that the rate of chemical weathering of CIA, CIW, PIA and MIA indicators decreased with the increase in elevation. In contrast, WIP value increased at higher altitudes and exhibited different weathering directions by deviating from the main trend in the A–CN–K diagram that composition of weathered soils was easily influenced by the quantity of precipitation, degree of gradient and height differences. Therefore, it was concluded that the main factors determining soil development was climate and elevations, and both determine the leaching regime and weathering rates.
Keywords: Climosequence, elevations, geochemical, soil development, weathering index.
© 2020 Federation of Eurasian Soil Science Societies. All rights reserved
Introduction Soil development is closely associated with specific weathering intensities under special mountainous environmental conditions Baumann et al. (2014). Soil development occurs through numerous physical, biological and chemical weathering processes acting to alter the parent rock on the soil surface. The formation of soils (pedogenesis) is a process by which weathering alters constituents within the parent material through the loss of more mobile (i.e., soluble) elements, concurrent enrichment of less mobile elements Le Blond et al. (2015). It is well established that soil-pedogenesis processes result in losses, gains or redistribution of elements, and that not all elements are affected in the same way. Elements are also recycled by the forest vegetation and such recycling can play a major role in soil development and the redistribution of elements. This is mainly the case with forest ecosystems, which are very efficient at recycling major nutrients. (Barbosa et al., 2015; Rate and Sheikh-Abdullah, 2017). Geochemical-based weathering indices are commonly used to measure and compare the relative extent and intensity of soil pedogenesis based on the chemistry of the surface soils (Osat et al., 2016) and weathering indices are used for evaluating soil fertility and development, demonstrating the impact of climate on soil surface weathering (Price and Velbel, 2003; Baumann et al., 2014). Chemical weathering indices incorporate major element oxides chemistry into a single value for each sample Egli et al. (2006). Studies in the regions of altitudinal gradient characterized by decreasing temperatures and increasing rainfalls, have shown the influence of the
* Corresponding author. Baghdad University, Faculty of Agriculture, Department of Soil Science and Water Resources, Baghdad, Iraq Tel.: +90 539 4332321 E-mail address: [email protected] e-ISSN: 2147-4249 DOI: 10.18393/ejss.689428
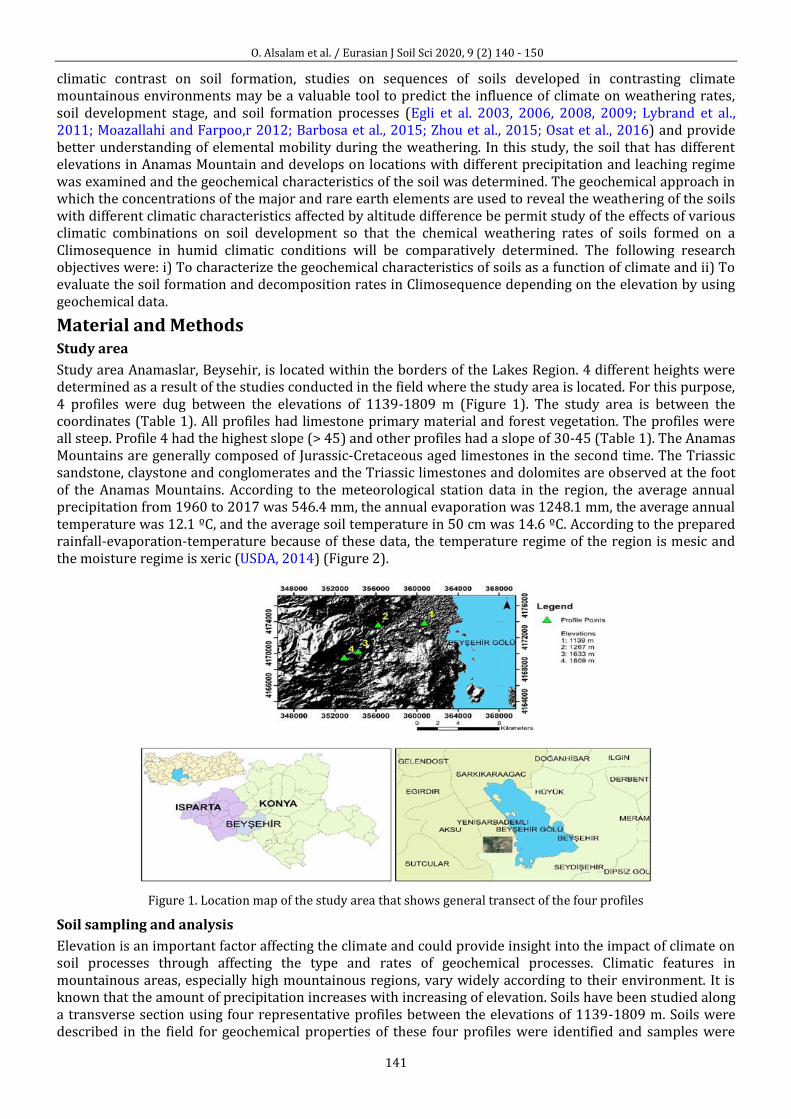
O. Alsalam et al. / Eurasian J Soil Sci 2020, 9 (2) 140 - 150
141
climatic contrast on soil formation, studies on sequences of soils developed in contrasting climate mountainous environments may be a valuable tool to predict the influence of climate on weathering rates, soil development stage, and soil formation processes (Egli et al. 2003, 2006, 2008, 2009; Lybrand et al., 2011; Moazallahi and Farpoo,r 2012; Barbosa et al., 2015; Zhou et al., 2015; Osat et al., 2016) and provide better understanding of elemental mobility during the weathering. In this study, the soil that has different elevations in Anamas Mountain and develops on locations with different precipitation and leaching regime was examined and the geochemical characteristics of the soil was determined. The geochemical approach in which the concentrations of the major and rare earth elements are used to reveal the weathering of the soils with different climatic characteristics affected by altitude difference be permit study of the effects of various climatic combinations on soil development so that the chemical weathering rates of soils formed on a Climosequence in humid climatic conditions will be comparatively determined. The following research objectives were: i) To characterize the geochemical characteristics of soils as a function of climate and ii) To evaluate the soil formation and decomposition rates in Climosequence depending on the elevation by using geochemical data.
Material and Methods Study area
Study area Anamaslar, Beysehir, is located within the borders of the Lakes Region. 4 different heights were determined as a result of the studies conducted in the field where the study area is located. For this purpose, 4 profiles were dug between the elevations of 1139-1809 m (Figure 1). The study area is between the coordinates (Table 1). All profiles had limestone primary material and forest vegetation. The profiles were all steep. Profile 4 had the highest slope (> 45) and other profiles had a slope of 30-45 (Table 1). The Anamas Mountains are generally composed of Jurassic-Cretaceous aged limestones in the second time. The Triassic sandstone, claystone and conglomerates and the Triassic limestones and dolomites are observed at the foot of the Anamas Mountains. According to the meteorological station data in the region, the average annual precipitation from 1960 to 2017 was 546.4 mm, the annual evaporation was 1248.1 mm, the average annual temperature was 12.1 ºC, and the average soil temperature in 50 cm was 14.6 ºC. According to the prepared rainfall-evaporation-temperature because of these data, the temperature regime of the region is mesic and the moisture regime is xeric (USDA, 2014) (Figure 2).
Figure 1. Location map of the study area that shows general transect of the four profiles
Soil sampling and analysis
Elevation is an important factor affecting the climate and could provide insight into the impact of climate on soil processes through affecting the type and rates of geochemical processes. Climatic features in mountainous areas, especially high mountainous regions, vary widely according to their environment. It is known that the amount of precipitation increases with increasing of elevation. Soils have been studied along a transverse section using four representative profiles between the elevations of 1139-1809 m. Soils were described in the field for geochemical properties of these four profiles were identified and samples were
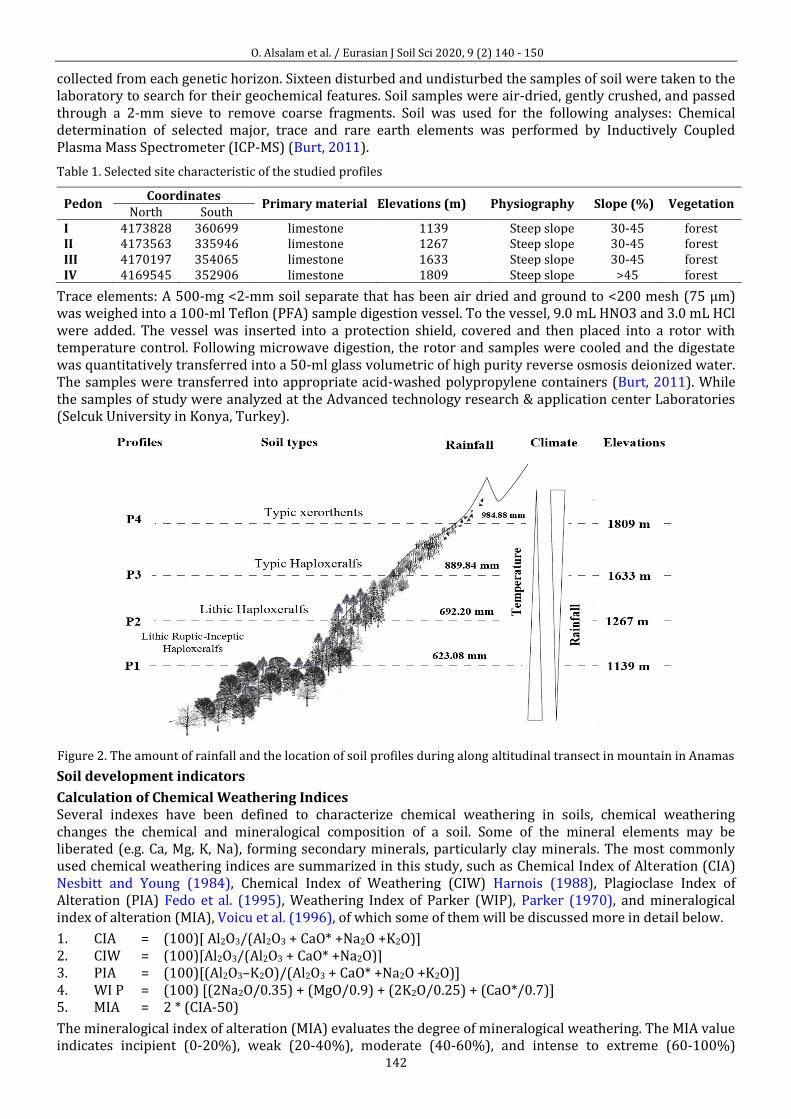
O. Alsalam et al. / Eurasian J Soil Sci 2020, 9 (2) 140 - 150
142
collected from each genetic horizon. Sixteen disturbed and undisturbed the samples of soil were taken to the laboratory to search for their geochemical features. Soil samples were air-dried, gently crushed, and passed through a 2-mm sieve to remove coarse fragments. Soil was used for the following analyses: Chemical determination of selected major, trace and rare earth elements was performed by Inductively Coupled Plasma Mass Spectrometer (ICP-MS) (Burt, 2011).
Table 1. Selected site characteristic of the studied profiles
Pedon Coordinates
Primary material Elevations (m) Physiography Slope (%) Vegetation North South
I 4173828 360699 limestone 1139 Steep slope 30-45 forest II 4173563 335946 limestone 1267 Steep slope 30-45 forest III 4170197 354065 limestone 1633 Steep slope 30-45 forest IV 4169545 352906 limestone 1809 Steep slope >45 forest
Trace elements: A 500-mg <2-mm soil separate that has been air dried and ground to <200 mesh (75 µm) was weighed into a 100-ml Teflon (PFA) sample digestion vessel. To the vessel, 9.0 mL HNO3 and 3.0 mL HCl were added. The vessel was inserted into a protection shield, covered and then placed into a rotor with temperature control. Following microwave digestion, the rotor and samples were cooled and the digestate was quantitatively transferred into a 50-ml glass volumetric of high purity reverse osmosis deionized water. The samples were transferred into appropriate acid-washed polypropylene containers (Burt, 2011). While the samples of study were analyzed at the Advanced technology research & application center Laboratories (Selcuk University in Konya, Turkey).
Figure 2. The amount of rainfall and the location of soil profiles during along altitudinal transect in mountain in Anamas
Soil development indicators
Calculation of Chemical Weathering Indices Several indexes have been defined to characterize chemical weathering in soils, chemical weathering changes the chemical and mineralogical composition of a soil. Some of the mineral elements may be liberated (e.g. Ca, Mg, K, Na), forming secondary minerals, particularly clay minerals. The most commonly used chemical weathering indices are summarized in this study, such as Chemical Index of Alteration (CIA) Nesbitt and Young (1984), Chemical Index of Weathering (CIW) Harnois (1988), Plagioclase Index of Alteration (PIA) Fedo et al. (1995), Weathering Index of Parker (WIP), Parker (1970), and mineralogical index of alteration (MIA), Voicu et al. (1996), of which some of them will be discussed more in detail below.
1. CIA = (100)[ Al2O3/(Al2O3 + CaO* +Na2O +K2O)] 2. CIW = (100)[Al2O3/(Al2O3 + CaO* +Na2O)] 3. PIA = (100)[(Al2O3–K2O)/(Al2O3 + CaO* +Na2O +K2O)] 4. WI P = (100) [(2Na2O/0.35) + (MgO/0.9) + (2K2O/0.25) + (CaO*/0.7)] 5. MIA = 2 * (CIA-50)
The mineralogical index of alteration (MIA) evaluates the degree of mineralogical weathering. The MIA value indicates incipient (0-20%), weak (20-40%), moderate (40-60%), and intense to extreme (60-100%)
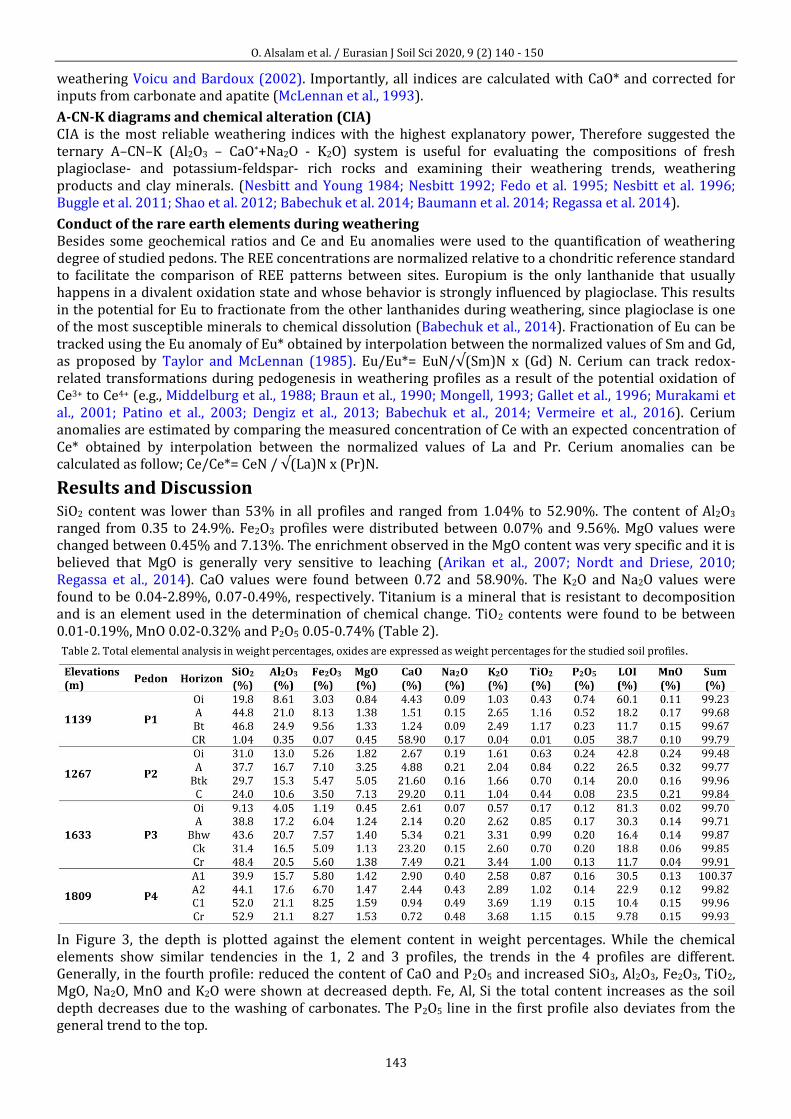
O. Alsalam et al. / Eurasian J Soil Sci 2020, 9 (2) 140 - 150
143
weathering Voicu and Bardoux (2002). Importantly, all indices are calculated with CaO* and corrected for inputs from carbonate and apatite (McLennan et al., 1993).
A-CN-K diagrams and chemical alteration (CIA) CIA is the most reliable weathering indices with the highest explanatory power, Therefore suggested the ternary A–CN–K (Al2O3 – CaO*+Na2O - K2O) system is useful for evaluating the compositions of fresh plagioclase- and potassium-feldspar- rich rocks and examining their weathering trends, weathering products and clay minerals. (Nesbitt and Young 1984; Nesbitt 1992; Fedo et al. 1995; Nesbitt et al. 1996; Buggle et al. 2011; Shao et al. 2012; Babechuk et al. 2014; Baumann et al. 2014; Regassa et al. 2014).
Conduct of the rare earth elements during weathering Besides some geochemical ratios and Ce and Eu anomalies were used to the quantification of weathering degree of studied pedons. The REE concentrations are normalized relative to a chondritic reference standard to facilitate the comparison of REE patterns between sites. Europium is the only lanthanide that usually happens in a divalent oxidation state and whose behavior is strongly influenced by plagioclase. This results in the potential for Eu to fractionate from the other lanthanides during weathering, since plagioclase is one of the most susceptible minerals to chemical dissolution (Babechuk et al., 2014). Fractionation of Eu can be tracked using the Eu anomaly of Eu* obtained by interpolation between the normalized values of Sm and Gd, as proposed by Taylor and McLennan (1985). Eu/Eu*= EuN/√(Sm)N x (Gd) N. Cerium can track redox-related transformations during pedogenesis in weathering profiles as a result of the potential oxidation of Ce3+ to Ce4+ (e.g., Middelburg et al., 1988; Braun et al., 1990; Mongell, 1993; Gallet et al., 1996; Murakami et al., 2001; Patino et al., 2003; Dengiz et al., 2013; Babechuk et al., 2014; Vermeire et al., 2016). Cerium anomalies are estimated by comparing the measured concentration of Ce with an expected concentration of Ce* obtained by interpolation between the normalized values of La and Pr. Cerium anomalies can be calculated as follow; Ce/Ce*= CeN / √(La)N x (Pr)N.
Results and Discussion SiO2 content was lower than 53% in all profiles and ranged from 1.04% to 52.90%. The content of Al2O3 ranged from 0.35 to 24.9%. Fe2O3 profiles were distributed between 0.07% and 9.56%. MgO values were changed between 0.45% and 7.13%. The enrichment observed in the MgO content was very specific and it is believed that MgO is generally very sensitive to leaching (Arikan et al., 2007; Nordt and Driese, 2010; Regassa et al., 2014). CaO values were found between 0.72 and 58.90%. The K2O and Na2O values were found to be 0.04-2.89%, 0.07-0.49%, respectively. Titanium is a mineral that is resistant to decomposition and is an element used in the determination of chemical change. TiO2 contents were found to be between 0.01-0.19%, MnO 0.02-0.32% and P2O5 0.05-0.74% (Table 2).
In Figure 3, the depth is plotted against the element content in weight percentages. While the chemical elements show similar tendencies in the 1, 2 and 3 profiles, the trends in the 4 profiles are different. Generally, in the fourth profile: reduced the content of CaO and P2O5 and increased SiO3, Al2O3, Fe2O3, TiO2, MgO, Na2O, MnO and K2O were shown at decreased depth. Fe, Al, Si the total content increases as the soil depth decreases due to the washing of carbonates. The P2O5 line in the first profile also deviates from the general trend to the top.
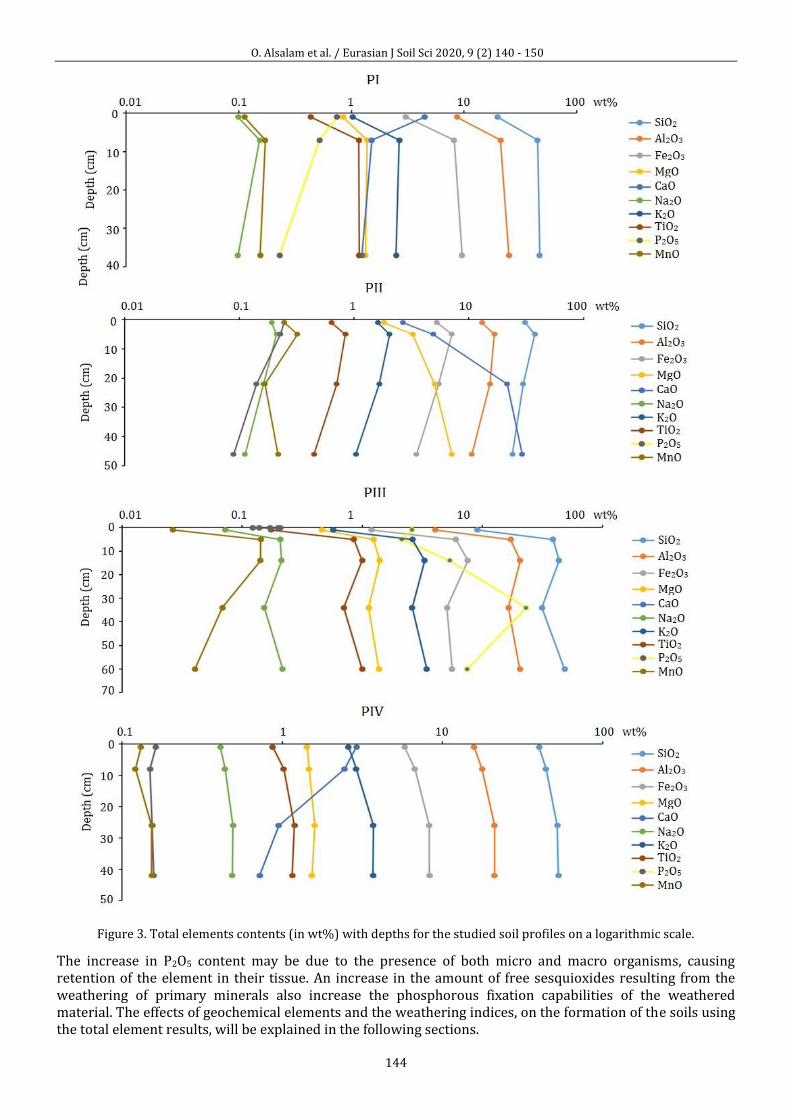
O. Alsalam et al. / Eurasian J Soil Sci 2020, 9 (2) 140 - 150
144
Figure 3. Total elements contents (in wt%) with depths for the studied soil profiles on a logarithmic scale.
The increase in P2O5 content may be due to the presence of both micro and macro organisms, causing retention of the element in their tissue. An increase in the amount of free sesquioxides resulting from the weathering of primary minerals also increase the phosphorous fixation capabilities of the weathered material. The effects of geochemical elements and the weathering indices, on the formation of the soils using the total element results, will be explained in the following sections.
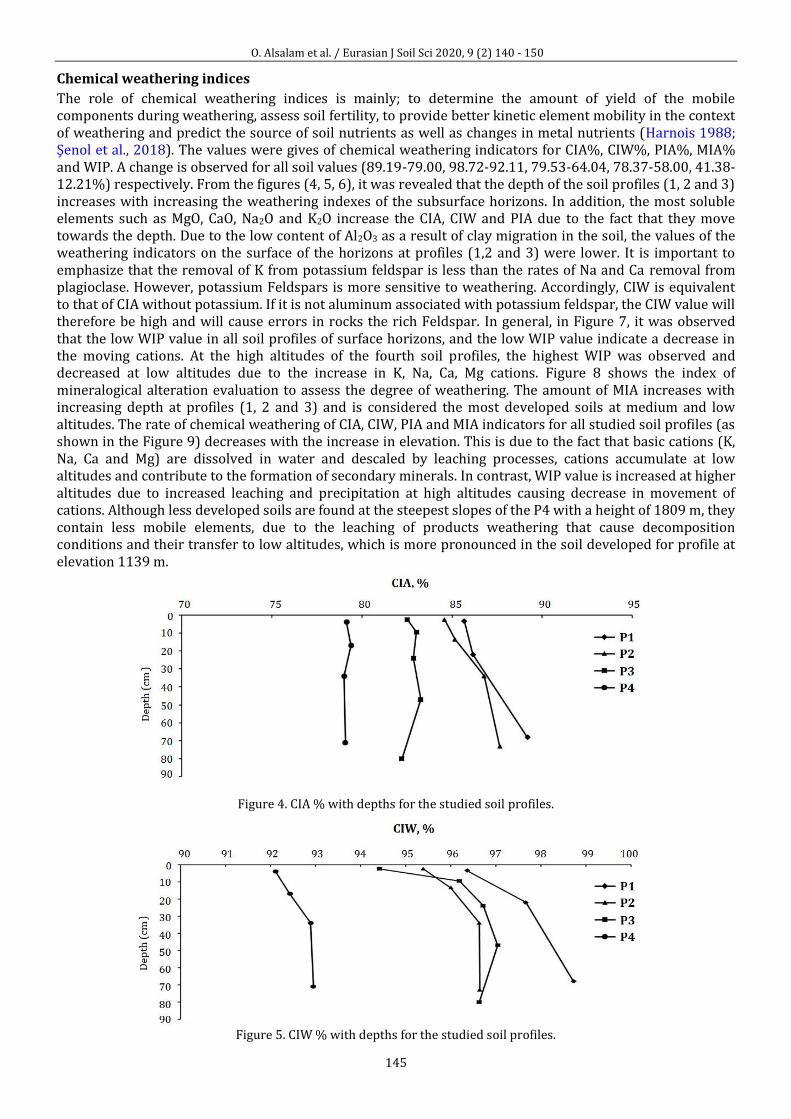
O. Alsalam et al. / Eurasian J Soil Sci 2020, 9 (2) 140 - 150
145
Chemical weathering indices
The role of chemical weathering indices is mainly; to determine the amount of yield of the mobile components during weathering, assess soil fertility, to provide better kinetic element mobility in the context of weathering and predict the source of soil nutrients as well as changes in metal nutrients (Harnois 1988; Şenol et al., 2018). The values were gives of chemical weathering indicators for CIA%, CIW%, PIA%, MIA% and WIP. A change is observed for all soil values (89.19-79.00, 98.72-92.11, 79.53-64.04, 78.37-58.00, 41.38-12.21%) respectively. From the figures (4, 5, 6), it was revealed that the depth of the soil profiles (1, 2 and 3) increases with increasing the weathering indexes of the subsurface horizons. In addition, the most soluble elements such as MgO, CaO, Na2O and K2O increase the CIA, CIW and PIA due to the fact that they move towards the depth. Due to the low content of Al2O3 as a result of clay migration in the soil, the values of the weathering indicators on the surface of the horizons at profiles (1,2 and 3) were lower. It is important to emphasize that the removal of K from potassium feldspar is less than the rates of Na and Ca removal from plagioclase. However, potassium Feldspars is more sensitive to weathering. Accordingly, CIW is equivalent to that of CIA without potassium. If it is not aluminum associated with potassium feldspar, the CIW value will therefore be high and will cause errors in rocks the rich Feldspar. In general, in Figure 7, it was observed that the low WIP value in all soil profiles of surface horizons, and the low WIP value indicate a decrease in the moving cations. At the high altitudes of the fourth soil profiles, the highest WIP was observed and decreased at low altitudes due to the increase in K, Na, Ca, Mg cations. Figure 8 shows the index of mineralogical alteration evaluation to assess the degree of weathering. The amount of MIA increases with increasing depth at profiles (1, 2 and 3) and is considered the most developed soils at medium and low altitudes. The rate of chemical weathering of CIA, CIW, PIA and MIA indicators for all studied soil profiles (as shown in the Figure 9) decreases with the increase in elevation. This is due to the fact that basic cations (K, Na, Ca and Mg) are dissolved in water and descaled by leaching processes, cations accumulate at low altitudes and contribute to the formation of secondary minerals. In contrast, WIP value is increased at higher altitudes due to increased leaching and precipitation at high altitudes causing decrease in movement of cations. Although less developed soils are found at the steepest slopes of the P4 with a height of 1809 m, they contain less mobile elements, due to the leaching of products weathering that cause decomposition conditions and their transfer to low altitudes, which is more pronounced in the soil developed for profile at elevation 1139 m.
Figure 4. CIA % with depths for the studied soil profiles.
Figure 5. CIW % with depths for the studied soil profiles.

O. Alsalam et al. / Eurasian J Soil Sci 2020, 9 (2) 140 - 150
146
Figure 6. PIA % with depths for the studied soil profiles.
Figure 7. PIA % with depths for the studied soil profiles.
Figure 8. MIA % with depths for the studied soil profiles.
Figure 9. Weathering Indexes % with elevations for the studied soil profiles.
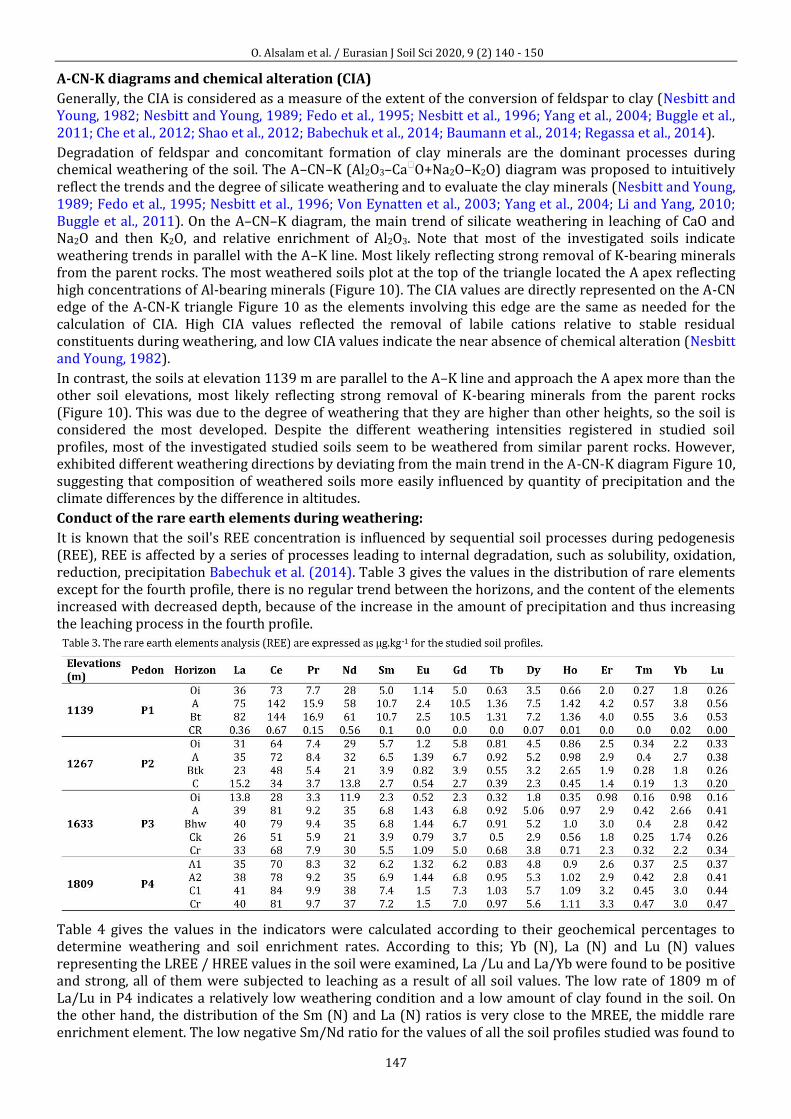
O. Alsalam et al. / Eurasian J Soil Sci 2020, 9 (2) 140 - 150
147
A-CN-K diagrams and chemical alteration (CIA)
Generally, the CIA is considered as a measure of the extent of the conversion of feldspar to clay (Nesbitt and Young, 1982; Nesbitt and Young, 1989; Fedo et al., 1995; Nesbitt et al., 1996; Yang et al., 2004; Buggle et al., 2011; Che et al., 2012; Shao et al., 2012; Babechuk et al., 2014; Baumann et al., 2014; Regassa et al., 2014).
Degradation of feldspar and concomitant formation of clay minerals are the dominant processes during chemical weathering of the soil. The A–CN–K (Al2O3–Ca⁎O+Na2O–K2O) diagram was proposed to intuitively reflect the trends and the degree of silicate weathering and to evaluate the clay minerals (Nesbitt and Young, 1989; Fedo et al., 1995; Nesbitt et al., 1996; Von Eynatten et al., 2003; Yang et al., 2004; Li and Yang, 2010; Buggle et al., 2011). On the A–CN–K diagram, the main trend of silicate weathering in leaching of CaO and Na2O and then K2O, and relative enrichment of Al2O3. Note that most of the investigated soils indicate weathering trends in parallel with the A–K line. Most likely reflecting strong removal of K-bearing minerals from the parent rocks. The most weathered soils plot at the top of the triangle located the A apex reflecting high concentrations of Al-bearing minerals (Figure 10). The CIA values are directly represented on the A-CN edge of the A-CN-K triangle Figure 10 as the elements involving this edge are the same as needed for the calculation of CIA. High CIA values reflected the removal of labile cations relative to stable residual constituents during weathering, and low CIA values indicate the near absence of chemical alteration (Nesbitt and Young, 1982).
In contrast, the soils at elevation 1139 m are parallel to the A–K line and approach the A apex more than the other soil elevations, most likely reflecting strong removal of K-bearing minerals from the parent rocks (Figure 10). This was due to the degree of weathering that they are higher than other heights, so the soil is considered the most developed. Despite the different weathering intensities registered in studied soil profiles, most of the investigated studied soils seem to be weathered from similar parent rocks. However, exhibited different weathering directions by deviating from the main trend in the A-CN-K diagram Figure 10, suggesting that composition of weathered soils more easily influenced by quantity of precipitation and the climate differences by the difference in altitudes.
Conduct of the rare earth elements during weathering:
It is known that the soil's REE concentration is influenced by sequential soil processes during pedogenesis (REE), REE is affected by a series of processes leading to internal degradation, such as solubility, oxidation, reduction, precipitation Babechuk et al. (2014). Table 3 gives the values in the distribution of rare elements except for the fourth profile, there is no regular trend between the horizons, and the content of the elements increased with decreased depth, because of the increase in the amount of precipitation and thus increasing the leaching process in the fourth profile.
Table 4 gives the values in the indicators were calculated according to their geochemical percentages to determine weathering and soil enrichment rates. According to this; Yb (N), La (N) and Lu (N) values representing the LREE / HREE values in the soil were examined, La /Lu and La/Yb were found to be positive and strong, all of them were subjected to leaching as a result of all soil values. The low rate of 1809 m of La/Lu in P4 indicates a relatively low weathering condition and a low amount of clay found in the soil. On the other hand, the distribution of the Sm (N) and La (N) ratios is very close to the MREE, the middle rare enrichment element. The low negative Sm/Nd ratio for the values of all the soil profiles studied was found to
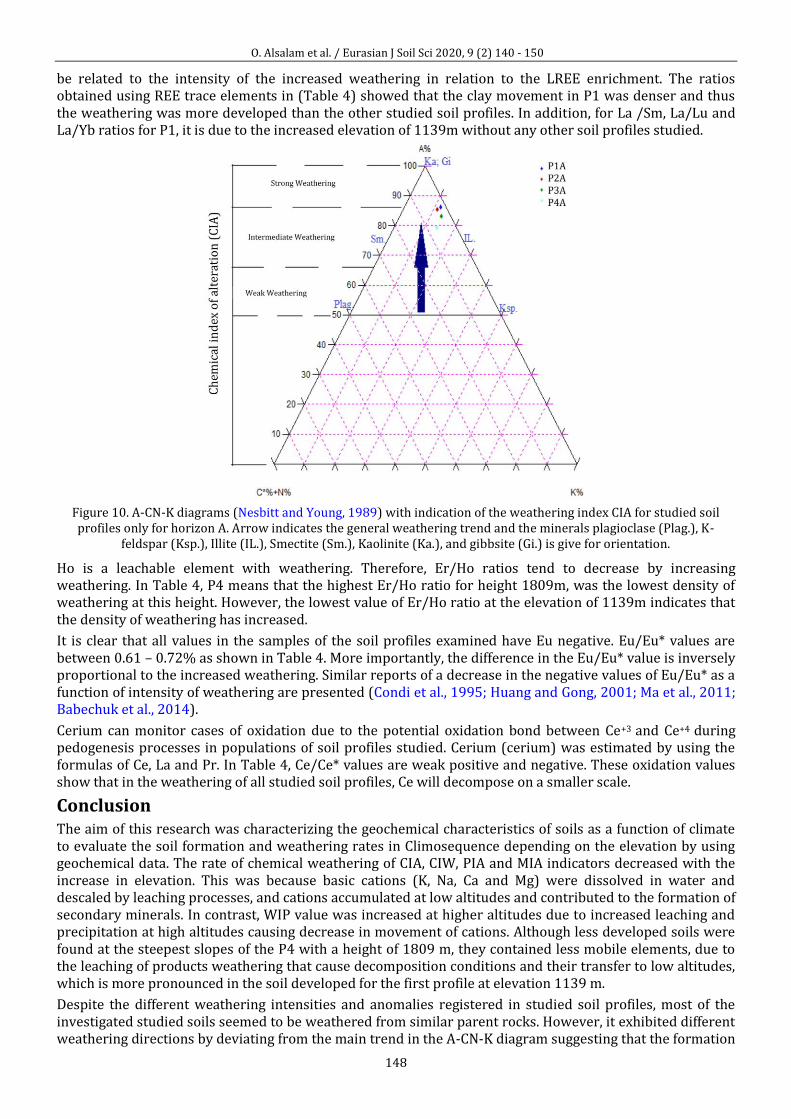
O. Alsalam et al. / Eurasian J Soil Sci 2020, 9 (2) 140 - 150
148
be related to the intensity of the increased weathering in relation to the LREE enrichment. The ratios obtained using REE trace elements in (Table 4) showed that the clay movement in P1 was denser and thus the weathering was more developed than the other studied soil profiles. In addition, for La /Sm, La/Lu and La/Yb ratios for P1, it is due to the increased elevation of 1139m without any other soil profiles studied.
Figure 10. A-CN-K diagrams (Nesbitt and Young, 1989) with indication of the weathering index CIA for studied soil profiles only for horizon A. Arrow indicates the general weathering trend and the minerals plagioclase (Plag.), K-
feldspar (Ksp.), Illite (IL.), Smectite (Sm.), Kaolinite (Ka.), and gibbsite (Gi.) is give for orientation.
Ho is a leachable element with weathering. Therefore, Er/Ho ratios tend to decrease by increasing weathering. In Table 4, P4 means that the highest Er/Ho ratio for height 1809m, was the lowest density of weathering at this height. However, the lowest value of Er/Ho ratio at the elevation of 1139m indicates that the density of weathering has increased.
It is clear that all values in the samples of the soil profiles examined have Eu negative. Eu/Eu* values are between 0.61 – 0.72% as shown in Table 4. More importantly, the difference in the Eu/Eu* value is inversely proportional to the increased weathering. Similar reports of a decrease in the negative values of Eu/Eu* as a function of intensity of weathering are presented (Condi et al., 1995; Huang and Gong, 2001; Ma et al., 2011; Babechuk et al., 2014).
Cerium can monitor cases of oxidation due to the potential oxidation bond between Ce+3 and Ce+4 during pedogenesis processes in populations of soil profiles studied. Cerium (cerium) was estimated by using the formulas of Ce, La and Pr. In Table 4, Ce/Ce* values are weak positive and negative. These oxidation values show that in the weathering of all studied soil profiles, Ce will decompose on a smaller scale.
Conclusion The aim of this research was characterizing the geochemical characteristics of soils as a function of climate to evaluate the soil formation and weathering rates in Climosequence depending on the elevation by using geochemical data. The rate of chemical weathering of CIA, CIW, PIA and MIA indicators decreased with the increase in elevation. This was because basic cations (K, Na, Ca and Mg) were dissolved in water and descaled by leaching processes, and cations accumulated at low altitudes and contributed to the formation of secondary minerals. In contrast, WIP value was increased at higher altitudes due to increased leaching and precipitation at high altitudes causing decrease in movement of cations. Although less developed soils were found at the steepest slopes of the P4 with a height of 1809 m, they contained less mobile elements, due to the leaching of products weathering that cause decomposition conditions and their transfer to low altitudes, which is more pronounced in the soil developed for the first profile at elevation 1139 m.
Despite the different weathering intensities and anomalies registered in studied soil profiles, most of the investigated studied soils seemed to be weathered from similar parent rocks. However, it exhibited different weathering directions by deviating from the main trend in the A-CN-K diagram suggesting that the formation
O. Alsalam et al. / Eurasian J Soil Sci 2020, 9 (2) 140 - 150
149
of weathered soils more easily influenced by quantity of precipitation, degree of gradient and difference elevations. Therefore, it was concluded that the main factors determining soil formation are climate and elevations, both of which determine the leaching regime and weathering rates.
Acknowledgments
This study is a part of Ph.D Thesis titled “Pedogenic evaluation and chemical weathering rates of soils developed along an altitudinal transect” conducted by Omar ALSALAM and it was taken from a research project supported by Selçuk University (S.U.) BAP Office (Coordinating Office of Scientific Research Projects, Project No: 18201141). The authors would like to thank ‘‘the S.U.-BAP staffs’’.
References Arikan, F., Ulusay, R., Aydin, N., 2007. Characterization of weathered acidic volcanic rocks and a weathering
classification based on a rating system. Bulletin of Engineering Geology and the Environment 66: 415-430. Babechuk, M.G., Widdowson, M., Kamber, B.S., 2014. Quantifying chemical weathering intensity and trace element
release from two contrasting basalt profiles, Deccan Traps, India. Chemical Geology 363: 56–75. Barboso, W.R., Romero, R.E., de Souza Júnior, M.S., Cooper, M., Sartor, L.R., de Moya Partiti, C.S., de Oliveira Jorge, O.,
Cohen, R., de Jesus, S.L., Ferreira, T.O., 2015. Effects of slope orientation on pedogenesis of altimontane soils from the Brazilian semi-arid region (Baturité massif, Ceará). Environmental Earth Sciences 73(7): 3731–3743.
Baumann, F., Schmidt, K., Dörfer, C., He, S.J., Scholten, T., Kühn, P., 2014. Pedogenesis, permafrost, substrate and topography: Plot and landscape scale interrelations of weathering processes on the central-eastern Tibetan Plateau. Geoderma 226-227: 300–316.
Braun, J.J., Viers, J., Dupré, B., Polve, M., Ndam, J., Muller, J.P., 1998. Solid/Liquid REE fractionation in the lateritic system of Goyoum, East Cameroon: The implication for the present dynamics of the soil covers of the humid tropical regions. Acta 62(2): 273–299.
Buggle, B., Glaser, B., Hambach, U., Gerasimenko, N., Marković, S., 2011. An evaluation of geochemical weathering indices in loess–paleosol studies. Quaternary International 240(1-2): 12-21.
Burt, R., 2011. Soil Survey laboratory information Manual. 2nd Edition. United States Department of Agriculture, Natural Resources Conservation Service. 305p.
Che, V.B., Fontijn, K., Ernst, G.G.J., Kervyn, M., Elburg, M., Van Ranst, E., Suh, C.E., 2012. Evaluating the degree of weathering in landslide-prone soils in the humid tropics: The case of Limbe, SW Cameroon. Geoderma 170: 378-389.
Condie, K.C. Dengate, J., Cullers, R.L., 1995. Behavior of rare earth elements in a paleoweathering profile on granodiorite in the Front Range, Colorado, USA. Geochimica et Cosmochimica Acta 59(2): 279-294.
Dengiz, O., Saglam, M., Ozaytekin, H.H., Baskan, O., 2013. Weathering rates and some physico-chemical characteristics of soils developed on a calcic toposequences. Carpathian Journal of Earth and Environmental Sciences 8(2): 13-24.
Egli, M., Mirabella, A., Sartori, G., Fitze, P., 2003. Weathering rates as a function of climate: results from a climosequence of the Val Genova (Trentino, Italian Alps). Geoderma 111(1-2): 99–121.
Egli, M., Mirabella, A. , Sartori, G. , Zanelli, R. , Bischof , S., 2006. Effect of north and south exposure on weathering rates and clay mineral formation in Alpine soils. Catena 67(3): 155 –174.
Egli, M, Mirabella, A., Sartori, G., 2008. The role of climate and vegetation in weathering and clay mineral formation in late Quaternary soils of the Swiss and Italian Alps. Geomorphology 102(3-4): 307–324.
Egli, M., Sartori, G., Mirabella, A., Favilli, F., Giaccai, D., Delbos, E., 2009. Effect of north and south exposure on organic matter in high Alpine soils. Geoderma 149(1-2):124–136.
Fedo, C.M., Nesbitt, H.W., Young, G.M., 1995. Unraveling the effects of potassium metasomatism in sedimentary rocks and paleosols, with implications for paleoweathering conditions and provenance. Geology 23(10): 921-924.
Gallet, S., Jahn, B.M., Torii, M., 1996. Geochemical characterization of the Luochuan loess-paleosol sequence, China, and paleoclimatic implications. Chemical Geology 133(1-4): 67-88.
Harnois, L., 1988. The CIW index: A new chemical index of weathering. Sedimentary Geology 55(3-4): 319-322. Huang, C.M., Gong, Z.T., 2001. Geochemical implication of rare earth elements in process of soil development. Journal
Rare Earths 19(1): 57-62. Le Blond , J.S. , Cuadros, J., Molla, Y.B. , Berhanu, T., Umer, M., Baxter, P.J., Davey, G., 2015. Weathering of the Ethiopian
volcanic province: A new weathering index to characterize and compare soils. American Mineralogist 100(11-12): 2518–2232.
Li, C., Yang, S.Y., 2010. Is chemical index of alteration a reliable proxy for chemical weathering in global drainage basins? American Journal of Science 310 (2): 111–127.
Lybrand, R., Rasmussen, C., Jardine, A., Troch, P., Chorover, J., 2011. The effects of climate and landscape position on chemical denudation and mineral transformation in the Santa Catalina mountain critical zone observatory. Applied Geochemistry 26:S80–S84.
Ma, L., Jin, L., Brantley, S. L., .2011. How mineralogy and slope aspect affect REE release and fractionation during shale weathering in the Susquehanna/Shale Hills Critical Zone Observatory. Chemical Geology 290(1-2): 31-49.
McLennan, S.M., 1993. Weathering and global denudation. The Journal of Geology 101(2): 295–303. Middelburg, J.J., van der Weijden, C.H., Woittiez, J.R.W., 1988. Chemical processes affecting the mobility of major, minor
O. Alsalam et al. / Eurasian J Soil Sci 2020, 9 (2) 140 - 150
150
and trace elements during weathering of granitic rocks. Chemical Geology 68(3-4): 253–273. Moazallahi, M., Farpoor, M.H., 2012. Soil genesis and clay mineralogy along the xeric aridic climotoposequence in South
Central Iran. Journal of Agricultural Science and Technology 14(3): 683–696. Mongelli, G., 1993. REE and other trace elements in a granitic weathering profile from “Serre”, southern Italy. Chemical
Geology 103(1-4): 17–25. Murakami, T., Utsunomiya, S., Imazu, Y., Prasad, N., 2001. Direct evidence of late Archean to early Proterozoic anoxic
atmosphere from a product of 2.5 Ga old weathering. Earth and Planetary Science Letters 184(2): 523–528. Nesbitt, H.W., Young, G.M., 1982. Early Proterozoic climates and plate motions inferred from major element chemistry
of lutites. Nature 279: 715-717. Nesbitt, H.W., Young, G.M., 1984. Prediction of some weathering trends of plutonic and volcanic rocks based on
thermodynamic and kinetic considerations. Geochimica et Cosmochimica Acta 48(7): 1523-1534. Nesbitt, H.W., Young, G.M., 1989. Formation and diagenesis of weathering profiles. Journal of Geology 97(2): 129-147. Nesbitt, H.W., 1992. Diagenesis and metasomatism of weathering profiles, with emphasis on Precambrian paleosols.
Developments in Earth Surface Processes 2:127–152. Nesbitt, H.W., Young, G.M., McLennan, S., Keays, R., 1996. Effects of chemical weathering and sorting on the petrogenesis
of siliciclastic sediments, with ımplications for provenance studies. Journal Geology 104(5): 525–542. Nordt, L.C., Driese, S.D., 2010. New weathering index improves paleorainfall estimates from Vertisols. Geology 38(5):
407-410. Osat, M., Heidari, A., Eghbal, M.K., Mahmoodi, S., 2016. Impacts of topographic attributes on Soil Taxonomic Classes and
weathering indices in a hilly landscape in Northern Iran. Geoderma 281: 90–101. Parker, A., 1970. An index of weathering for silicate rocks. Geological Magazine 107(6): 501-504. Patino, L.C., Velbel, M.A., Price, J.R., Wade, J.A., 2003. Trace element mobility during spheroidal weathering of basalts
and andesites in Hawaii and Guatemala. Chemical Geology 202(3-4): 343–364. Pettapiece, W.W., Pawluc, S., 1972. Clay mineralogy of soils developed partially from volcanic ash. Soil Science Society of
America journal 36(3): 515-519. Price, J.R., Velbel, M.A., 2003. Chemical weathering indices applied to weathering profiles developed on heterogeneous
felsic metamorphic parent rocks. Chemical Geology 202(3-4): 397– 416. Rate, A.W., Sheikh-Abdullah, S.M., 2017. The geochemistry of calcareous forest soils in Sulaimani Governorate,
Kurdistan Region, Iraq. Geoderma 289: 54–65. Regassa, A., van Daele, K.V., De Paepe, P., Dumon, M., Deckers, J., Asrat, A., van Ranst, E., 2014. Characterizing weathering
intensity and trends of geological materials in the Gilgel Gibe catchment, southwestern Ethiopia. Journal of African Earth Sciences 99(2): 568-580.
Shao, J., Yang, S., Li, C., 2012. Chemical indices (CIA and WIP) as proxies for integrated chemical weathering in China: Inferences from analysis of fluvial sediments. Sedimentary Geology 265-266: 110–120.
Şenol, H., Tunçay, T., Dengiz, O., 2018. Geochemical Mass balance applied to the study of weathering and evolution of soil. Indian Journal of Geo-Marine Sciences 47(9):1851-1865.
Taylor, S.R., McLennan, S.M., 1985. The Continental Crust: its Composition and Evolution. 3rd Edition. Blackwell Scientific Publications, Oxford, 312p..
Vermeire, M.L., Cornu, S., Fekiacova , Z., Detienne , M., Delvaux , B., Cornélis, J.T., 2016. Rare earth elements dynamics along pedogenesis in a chronosequence of podzolic soils. Chemical Geology 446: 163–174.
Voicu, G., Bardoux, M., 2002. Geochemical behavior under tropical weathering of the Barama–Mazaruni greenstone belt at Omai gold mine, Guiana Shield. Applied Geochemistry 17(3): 321-336.
Voicu, G., Bardoux, M., Jébrak, M., Voicu, D., 1996. Normative mineralogical calculations for tropical weathering profiles. Geological Association of Canade and Mineral Association of Canadian 21: 58-69.
von Eynatten, H., Barceló-Vidal, C., Pawlowsky-Glahn, V., 2003. Modelling compositional change: The example of chemical weathering of granitoid rocks. Mathematical Geology 35(3): 231–351.
Yang, S.Y., Jung, H.S., Li, C.X., 2004. Two unique weathering regimes in the Changjiang and Huanghe drainage basins: geochemical evidence from river sediments. Sedimentary Geology 164(1-2): 19–34.
Zhou, X., Li, A., Jiang, F., Lu, J., 2015. Effects of grain size distribution on mineralogical and chemical compositions: a case study from size‐fractional sediments of the Huanghe (Yellow River) and Changjiang (Yangtze River). Geological Journal 50(4): 414–433.
Z.Demir / Eurasian J Soil Sci 2020, 9 (2) 151 - 164
151
The evaluation of basal respiration and some chemical properties of soils under cover crop treatments in a
cherry orchard Zeynep Demir *
Soil, Fertilizer and Water Resources Central Research Institute, Ankara, Turkey
Abstract Article Info Received : 06.10.2019 Accepted : 18.03.2020
Effects of different cover crops (CCs), mechanical cultivation and herbicide treatments on some soil chemical properties [pH, EC, total N, available P, exchangeable cations (Ca, Mg, K, Na) and the DTPA-extractable micronutrients (Fe, Mn, Zn, Cu)] and basal soil respiration (BSR) were investigated in a cherry orchard from 2013 to 2014. The present study was conducted in a cherry orchard located at the Experiment Station of Black Sea Agricultural Research Institute in Samsun province on the Northern side of Turkey. CC treatments, included Trifolium repens L. (TR), Festuca rubra subsp. Rubra (FRR), Festuca arundinacea (FA), T. repens (40%)+F. rubra rubra (30%)+F. arundinacea (30%) mixture (TFF), Vicia villosa (VV) and Trifolium meneghinianum (TM). Control treatments included mechanical cultivated (weed-free), herbicide treated (weed-free) and control plots, i.e., bare ground plots (with no cover crop) were allowed to become weedy. The experiment was conducted in a randomized complete block design with four replicates. The CCs were mowed in the flowering stages of the plants. After 90 days following seed harvest, soil samples were collected from two depths (0-20 and 20-40 cm) in each plot. All cropping species showed positive effects on soil chemical properties and BSR. The CC treatments decreased soil pH and exchangeable Na and increased EC, total N, available P, exchangeable cations (Ca, Mg, K) and the DTPA-extractable micronutrients (Fe, Mn, Zn). Effects of mechanical cultivation and herbicide treatments on soil chemical properties and BSR values were not found significant for both soil depths as compared to control (p<0.01). Results of the study showed that CCs, especially TR and VV treatments as legume plants improved soil chemical properties and BSR values in short term period. However, longer term studies are needed to evaluate the long-term effects of these sustainable management practices which have the potential to improve soil quality variables are encouraged.
Keywords: Basal soil respiration, cherry orchard, cover crops, macronutrients, micronutrients.
© 2020 Federation of Eurasian Soil Science Societies. All rights reserved
Introduction Turkey is a unique country in the world where several types of fruit can be cultivated under good conditions and with superior quality owing to vast, fertile agricultural fields suitable for production and with the help of the ecological diversity in various regions (Erogul, 2018). Turkey has a considerable share in fruit production, which is like apple, orange, banana, carob, loquat and cherry are the most prominent fruits regarding their share in Turkey’s production. Cherry is an significant agriculture product which is generally produced and exported. For regional rural development one of the most significant sectors is agricultural production in Turkey. Recently in agriculture sector another activity is orchard production which increasing areas and economic importance (Doganay, 1998). Among major countries producing cherry in the world, in our country ranks the first both in the northern hemisphere and in the world with 599.650 tons of
* Corresponding author. Soil, Fertilizer and Water Resources Central Research Institute, Ankara, Turkey Tel.: +90 5052914548 E-mail address: [email protected] e-ISSN: 2147-4249 DOI: 10.18393/ejss.706686
Z.Demir / Eurasian J Soil Sci 2020, 9 (2) 151 - 164
152
production in 2017, corresponding to 20.3% of world cherry production (FAOSTAT, 2017). Cherry fruit cultivation is carried out in an area of 847.461 da in Turkey (TURKSTAT, 2018). The U.S. with 288.480 tons of production and 13.8% share and Iran with 220.393 tons of production and 11.8% follow it. Turkey is leader country in terms of volume of cherry production in the World (FAOSTAT, 2017). Cherry production is an significant production activity for the Turkish Economy (Bal and Cercinli, 2013).
Cover crops (CCs) is defined as crops that provides soil protection, seedling protection, and soil improvement between vines in vineyards and trees in orchards between periods of normal crop production, or between periods of normal crop production (SSSA, 2001). Cover crop management systems affect soil quality variables (Demir and Gülser, 2015; Çerçioğlu et al., 2019) and health and thereby orchards growth and productivity. CCs also are precisely grown to prevent loss of nutrients in deep layers through surface runoff and leaching (Kaye and Quemada, 2017). The CCs can be used as legume or non-legume. Leguminous crops are used to fix atmospheric nitrogen (N) which is used by succeeding crop (Blanco-Canqui et al., 2011). N fixation by leguminous helps to decrease the use of N fertilizers for next crop (Ladha et al., 2004). Genelrally, the legumes and non-legume crops are the plants that are grown to provide soil cover and help to enhance chemical, biological and physical characteristics of the soil (Reddy, 2016). A bicultural of leguminous and non-leguminous may be used with the purpose to provide both benefits together (Ranells and Wagger, 1996). The CCs provide some benefits to soils used for agriculture production. CCs primarily effect soil nutrient dynamics and balance by scavenging nutrients, fixing atmospheric N2, decreasing nutrient erosion and decreasing nutrient leaching. Including CCs in intensively managed agroecosystems could thus effect nutrient recovery, accumulation, cycling and storage. In addition, the CCs can be utilized to manage N in agricultural soils by altering N cycling and availability. The CCs grown during fallow periods in cropping systems change the annual patterns of N uptake and mineralization. The CCs also impact soil N availability by increasing total N through prevention of N losses or additions of fixed N. The CCs that are grown during fallow periods in cropping systems to take up nutrients, especially N, that would be lost if plants are not present. Ultimately, successful management of N using the CCs requires that N availability be synchronized. Various aspects of the relationship between the CCs and total N have been discussed in a number of previous studies (Thorup-Kristensen et al., 2003; Demir et al., 2019a; Demir and Işık, 2019a).
Additionally, the CCs are helpful in sustaining and increasing microbial biodiversity in soils. The CCs that biologically fix atmospheric N can provide a source of orchard tree nutrition. Many crops are excellent nutrient scavengers and can aid in the recycling of orchard nutrients and prevention of runoff and groundwater losses, particularly of N (Delgado et al., 2007). In recent times, the CCs are also used for increasing exchangeable nutrients such as K+ and Mg2+. Lal et al. (1991) found that following factors effect soil fertility when the CCs are grown in the rotation cycle: cover crop species, quantity of biomass produced by cover crop, length and time of cover crop growth, and soil and weather conditions. Aside from the various benefits or effects of the CCs on soil discussed above, very little is known about the affect of the CCs on soil micronutrients and exchangeable cations. The amount of exchangeable cations (Ca, Mg, K and Na) are important attributes of soils and sediments for different processes.
Herbicide treatment and mechanical cultivation are significant among the current weed control practices in orchards. Using CCs for weed control in orchards is one of the broadly applied alternative methods to the mechanically cultivation and herbicide treatment (Mennan et al., 2009; Işık et al., 2009). Herbicide and mechanical cultivation are expected to provide weed-free orchards. However, coverless (bare) fields can bring about increased run-off and erosion, damage the soil chemical and physical properties (Keesstra et al., 2016). In this study, effects of different cover crops, mechanically cultivation and herbicide treatments on some chemical properties and basal respiration of soil were investigated in a cherry orchard (Latitude, 41°22′93′′ N; Longitude, 36°50′19′′ E) in Samsun province on the Northern side of Turkey between 2013 and 2014.
Material and Methods Experimental site and treatments
The study was conducted in a cherry orchard at the Experiment Station of Black Sea Agricultural Research Institute in Samsun province (Latitude, 41° 22′ 93′′ N; Longitude, 36° 50′ 19′′ E) on the Northern side of Turkey from 2013 to 2014. The location of the orchard was in the Middle Black Sea region. Annual average precipitation was 685.5 mm and annual average temperature was 14.5 °C. There was 1 m spacing between the plots and 3 m between the blocks. Each plot had a size of 35 m2 (5 × 7 m). Experiments were conducted in randomized complete blocks design with four replications.
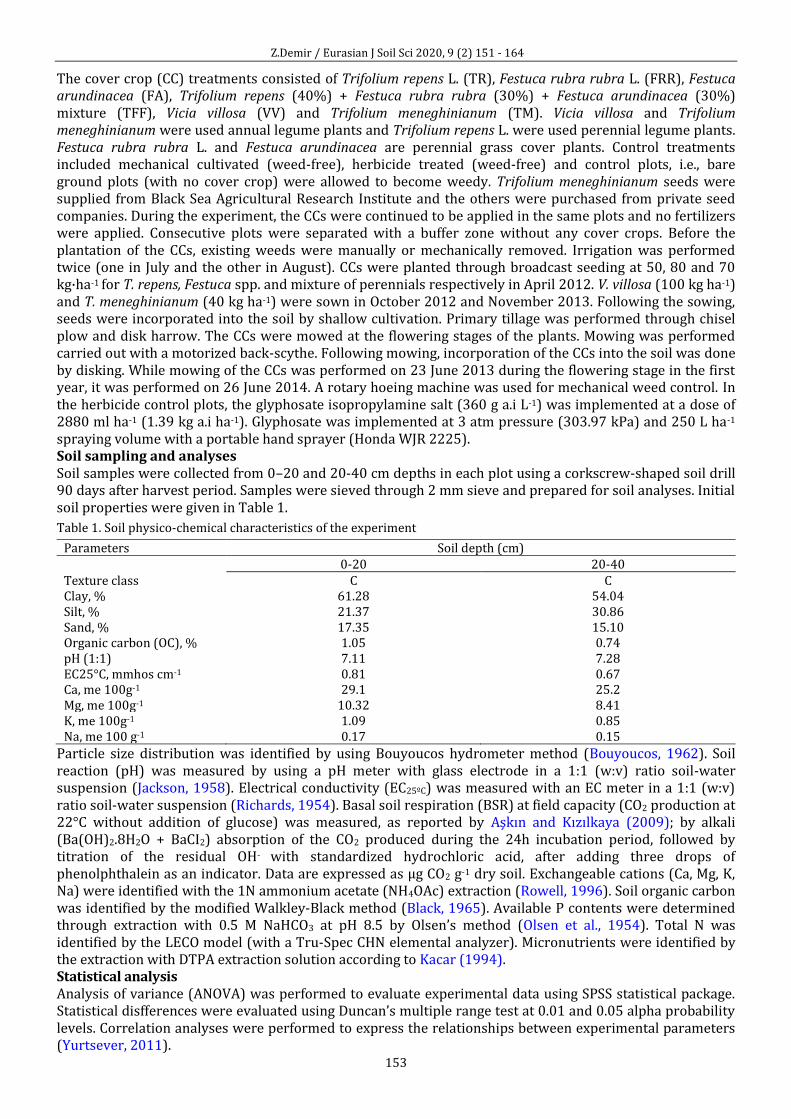
Z.Demir / Eurasian J Soil Sci 2020, 9 (2) 151 - 164
153
The cover crop (CC) treatments consisted of Trifolium repens L. (TR), Festuca rubra rubra L. (FRR), Festuca arundinacea (FA), Trifolium repens (40%) + Festuca rubra rubra (30%) + Festuca arundinacea (30%) mixture (TFF), Vicia villosa (VV) and Trifolium meneghinianum (TM). Vicia villosa and Trifolium meneghinianum were used annual legume plants and Trifolium repens L. were used perennial legume plants. Festuca rubra rubra L. and Festuca arundinacea are perennial grass cover plants. Control treatments included mechanical cultivated (weed-free), herbicide treated (weed-free) and control plots, i.e., bare ground plots (with no cover crop) were allowed to become weedy. Trifolium meneghinianum seeds were supplied from Black Sea Agricultural Research Institute and the others were purchased from private seed companies. During the experiment, the CCs were continued to be applied in the same plots and no fertilizers were applied. Consecutive plots were separated with a buffer zone without any cover crops. Before the plantation of the CCs, existing weeds were manually or mechanically removed. Irrigation was performed twice (one in July and the other in August). CCs were planted through broadcast seeding at 50, 80 and 70 kg·ha-1 for T. repens, Festuca spp. and mixture of perennials respectively in April 2012. V. villosa (100 kg ha-1) and T. meneghinianum (40 kg ha-1) were sown in October 2012 and November 2013. Following the sowing, seeds were incorporated into the soil by shallow cultivation. Primary tillage was performed through chisel plow and disk harrow. The CCs were mowed at the flowering stages of the plants. Mowing was performed carried out with a motorized back-scythe. Following mowing, incorporation of the CCs into the soil was done by disking. While mowing of the CCs was performed on 23 June 2013 during the flowering stage in the first year, it was performed on 26 June 2014. A rotary hoeing machine was used for mechanical weed control. In the herbicide control plots, the glyphosate isopropylamine salt (360 g a.i L-1) was implemented at a dose of 2880 ml ha-1 (1.39 kg a.i ha-1). Glyphosate was implemented at 3 atm pressure (303.97 kPa) and 250 L ha-1 spraying volume with a portable hand sprayer (Honda WJR 2225). Soil sampling and analyses Soil samples were collected from 0–20 and 20-40 cm depths in each plot using a corkscrew-shaped soil drill 90 days after harvest period. Samples were sieved through 2 mm sieve and prepared for soil analyses. Initial soil properties were given in Table 1.
Table 1. Soil physico-chemical characteristics of the experiment
Parameters Soil depth (cm) 0-20 20-40 Texture class C C Clay, % 61.28 54.04 Silt, % 21.37 30.86 Sand, % 17.35 15.10 Organic carbon (OC), % 1.05 0.74 pH (1:1) 7.11 7.28 EC25°C, mmhos cm-1 0.81 0.67 Ca, me 100g-1 29.1 25.2 Mg, me 100g-1 10.32 8.41 K, me 100g-1 1.09 0.85 Na, me 100 g-1 0.17 0.15
Particle size distribution was identified by using Bouyoucos hydrometer method (Bouyoucos, 1962). Soil reaction (pH) was measured by using a pH meter with glass electrode in a 1:1 (w:v) ratio soil-water suspension (Jackson, 1958). Electrical conductivity (EC25ºC) was measured with an EC meter in a 1:1 (w:v) ratio soil-water suspension (Richards, 1954). Basal soil respiration (BSR) at field capacity (CO2 production at 22°C without addition of glucose) was measured, as reported by Aşkın and Kızılkaya (2009); by alkali (Ba(OH)2.8H2O + BaCI2) absorption of the CO2 produced during the 24h incubation period, followed by titration of the residual OH- with standardized hydrochloric acid, after adding three drops of phenolphthalein as an indicator. Data are expressed as μg CO2 g-1 dry soil. Exchangeable cations (Ca, Mg, K, Na) were identified with the 1N ammonium acetate (NH4OAc) extraction (Rowell, 1996). Soil organic carbon was identified by the modified Walkley-Black method (Black, 1965). Available P contents were determined through extraction with 0.5 M NaHCO3 at pH 8.5 by Olsen’s method (Olsen et al., 1954). Total N was identified by the LECO model (with a Tru-Spec CHN elemental analyzer). Micronutrients were identified by the extraction with DTPA extraction solution according to Kacar (1994). Statistical analysis Analysis of variance (ANOVA) was performed to evaluate experimental data using SPSS statistical package. Statistical disfferences were evaluated using Duncan’s multiple range test at 0.01 and 0.05 alpha probability levels. Correlation analyses were performed to express the relationships between experimental parameters (Yurtsever, 2011).
Z.Demir / Eurasian J Soil Sci 2020, 9 (2) 151 - 164
154
Results and Discussion Soil reaction (pH) and electrical conductivity (EC25C)
The pH of the soil is a determining factor of soil fertility greatly influenced by the crop residues incorporated in the soil. The simplest and most important factor in all growing systems is to maintain optimal soil pH levels. The pH level of soil influences microbial activity, nutrient solubility and root growth. Soil pH values were significantly affected by CC management in both years of the experiment (p<0.01). The CC treatments significantly reduced pH from 7.48 in control plot to 6.92 for VV treatment at the 0-20 cm soil depth in 2013 (Table 2). Soil pH significantly decreased from 7.46 in the control plot to 6.90 in TR treatment at 0-20 cm soil depth in 2014. Gülser (2004) found that values of soil pH importantly reduced with the cropping applications and percent decreases in pH compared the control soil were between 5.96% for crownvetch and 0.31% for bromegrass treatment. Similarly, cover cropping significantly reduced soil pH (Demir and Işık 2019b; Demir and Işık 2019c; Demir et al., 2019b), due to the acidic root exudates, and this may alter nutrient availability at the root surface (Rengel and Marschner, 2005). Such decreases were mainly because of CO2 release into the soil ambient, decomposition of organic amendments and conversion of these organic amendments into carbonic acid (H2CO3) through reactions with water. Besides, when the organic matter is mineralized there is a production of organic acids that could raise the soil acidity (Garcia and Rosolem, 2010). In present study, when compared to the control plot, percent decreases in soil pH values between -3.3% in FRR treatment and -7.5% in VV treatment in 2013 and between -4.8% in TM treatment and -7.6% in TR treatments in 2014. The differences in soil pH values were not found to be statistically significant for the 20-40 cm soil depth in both years of the experiment (Table 3). The mean pH values for 20-40 cm soil depth were 7.46 in 2013 and 7.51 in 2014.
The CC treatments increased soil EC25C values at 0-20 cm soil depth as compared to the soil of an untreated control plot (Table 2). The highest EC25C values were obtained from TR treatment 1.185 ds m-1 in 2013 and 1.186 ds m-1 in 2014. EC25C values significantly increased from 0.689 ds m-1 in the control to 1.186 ds m-1 in TR treatment at 0-20 cm soil depth at the end of the experiment. EC25C has been used successfully as an indirect indicator of significant soil quality variables, such as soil salinity hazard (Demir and Gülser, 2015), soil water content (Khakural et al., 1998), topsoil thickness (Kitchen et al., 1999), clay pan thickness (Doolittle et al., 1994), nutrient levels (Heiniger et al., 2003) and depth of sand deposition (Kitchen et al., 1996). The soil EC is also a significant indicator of dissolved nutrients and can be used to monitor mineralization (Candemir and Gülser, 2010). The findings of this research suggest that soil EC may serve as a useful indicator of available N in soil as suggested by Gajda et al. (2000). Three potential pathways of EC exist in soil: through the liquid phase (via salts contained in soil water), through the solid phase (soil particles in direct and continuous contact with one another), and through the liquid-solid phase (primarily via the exchangeable cations associated with clay minerals) (Corwin and Lesch, 2003). Therefore, many soil attributes affect EC in soil (Sudduth et al., 2003). In this study, EC values significantly increased with the cropping treatments and percent increases in EC25C over the control soil were between 37.7% in FRR and 69.9% in TR treatments in 2013 and between 41.0% in FA and 72.1% in TR treatments in 2014. Gülser (2004) reported that highest percent change in EC25C values over the control plots was determined as 124.6% for alfalfa treatment while lowest percent increase in EC25C values was 15.97% for bromegrass treatment. Eigenberg et al. (2002) determined that EC was effective in determining the dynamic changes in plant available soil N throughout the growing season of crops, i.e. over a range of soil water conditions. Zhang and Wienhold (2002) reported very strong correlation between EC and soil N in the upper 15 cm. In this study, increasing total N content in the soil due to crop applications caused increased in soil EC. However, legume cover crops (Trifolium repens L., Vicia villosa and Trifolium meneghinianum) were found more effective non-legume (Festuca rubra rubra L. and Festuca arundinacea). The differences in EC25C values were not found to be statistically significant for the 20-40 cm soil depth in both years of experiments (Table 4). EC25C values ranged from 0.624 ds m-1 in control treatment to 0.711 ds m-1 in TR treatment for the 20-40 cm soil depth in 2013. EC25C values ranged from 0.611 ds m-1 in HC treatment to 0.733 ds m-1 in VV treatment for the 20-40 cm soil depth in 2014 (Table 3).
Total N
The CC treatments increased total N at 0-20 cm soil depth as compared to the soil of an untreated control plot in both years of the experiments (Table 2). The highest total N values (0.206%) were seen at 0-20 cm in 2013 in the VV treatment while the lowest total N value (0.120%) was seen in HC treatment. Total N significantly increased from 0.121% in the control to 0.210% in VV treatment at 0-20 cm soil depth in 2014.
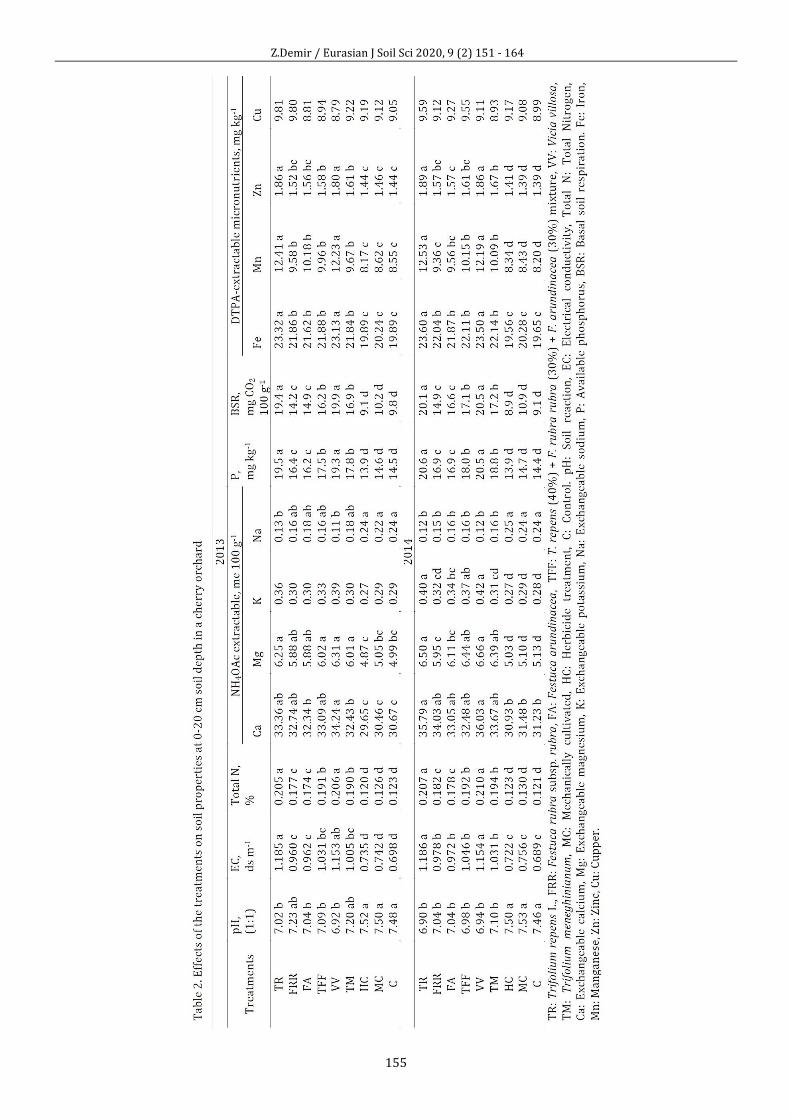
Z.Demir / Eurasian J Soil Sci 2020, 9 (2) 151 - 164
155
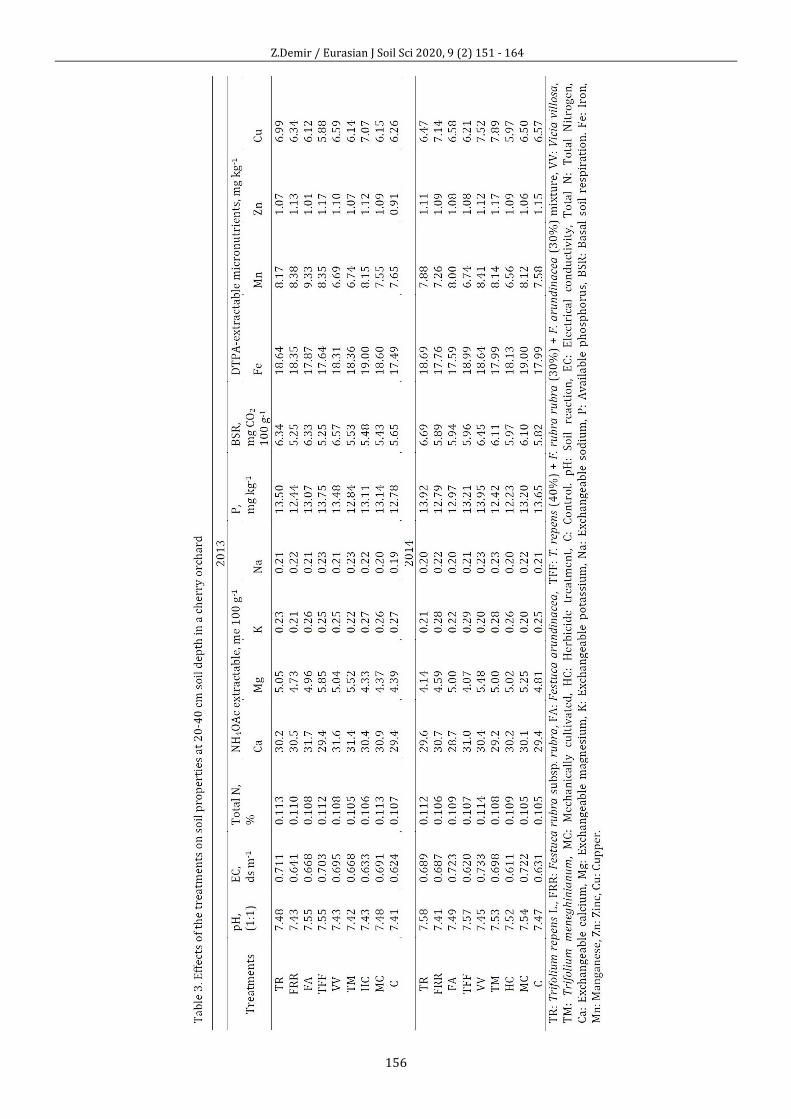
Z.Demir / Eurasian J Soil Sci 2020, 9 (2) 151 - 164
156
Z.Demir / Eurasian J Soil Sci 2020, 9 (2) 151 - 164
157
The results of this study showed that the CCs can be used to manage N in agricultural soils by altering N cycling and availability. The affects of CCs on soil nutrients, especially N, have been previously investigated (Dabney et al., 2010; Kaspar and Singer, 2011; Blanco-Canqui et al., 2011). Dabney et al. (2010) investigated this subject for four regions in the United States. The researchers found that significant total N can be derived from cover crops. Blanco-Canqui et al. (2011) reported that, after four rotation cycles, total N increased by 279 kg ha-1 under sunn hemp and by 258 kg ha–1 under late-maturing soybean compared with non-CCs plots when both leguminous CCs were planted after each winter wheat harvest in a winter wheat-grain sorghum rotation in eastern Kansas. Others also reported high total N contributions from legume CCs (Mansoer et al., 1997). Ramos et al. (2011) reported in a previous study that two cover crop (oat-vetch-Vicia sativa L. and oat-Avena sativa L.) treatments increased total N (32.5%) according to control. Similarly, greater N accumulation by hairy vetch compared to non-legume CCs like cereal rye, austrian winter pea (Lathryrus hirsutus L.), annual ryegrass (Lolium multiflorum Lam. cv. Billion), canola (Brassica napus L. cv. Santana), and no CC treatments was also reported by Kuo et al. (1997). Previous studies have found that legume crops have greater total N content due to their higher N concentration (Shipley et al., 1992). In this study, the CC treatments increased total N supply through improving the availability of residual N and through N2 fixation with legume crops. The legume crops can have great effects on soil N. Gülser (2004) found that present increases in the total N over the control were between 8.85% for the crownvetch and 36.46% for the alfalfa application. Harris et al. (1994) determined that CCs impacted soil N availability by increasing total N through additions of fixed N or prevention of N losses. Reeves (1994) found that growing CC treatments contributed 36 to 226 kg N ha-1 by legumes and 25 to 50 kg N ha-1 by small grains. Similar results were found at by Kuo et al. (1997), who determined that leguminous CC treatments provide important quantities of total N. In this study, percent increases in the total N over the control soil varied between 41.4-66.9% in 2013 and 47.1-72.8% in 2014. Hoagland et al (2008) reported that a cover of mixed leguminous established in an cherry orchard raised the total N, potentially available N and soil biological activity for trees over a two-year period. Ingels et al. (1994) found that winter legumes can add 112-224 kg N ha-1 and cowpea and other summer legumes can contribute 112-145 kg N ha-1 to the soil nitrogen pool. Ladha and Peoples (1994) reported inputs of N from N fixation between 124-185 kg ha-1 for crimson clover, and 9-201 kg ha-1 for cowpea. Wagger (1989) reported crimson clover N fixation of 100-150 kg ha-1, and Odhiambo and Bomke (2000) concluded that crimson clover could provide the rapid release of enough N to sustain the growth of crops. Present findings of total N well comply with the findings of those earlier studies. However, the differences in total N values were not found to be statistically significant for the 20-40 cm soil depth in both years of experiments (Table 3). Mean total N values at 20-40 cm soil depth varied between 0.105-0.129% with a mean value of 0.109%.
Basal soil respiration (BSR)
In both years of the experiment, the basal soil respiration (BSR) importantly increased with the CC treatments (p<0.01). In 2013, BSR values was the lowest (9.10 mg CO2 100 g-1) in the herbicide treatment followed by HC < C < MC < FRR < FA < TFF < TM < TR < VV treatments. The highest BSR values (26.48 mg CO2 100 g-1) were seen at 0-20 cm in 2014 in the VV treatment while the lowest BSR value (8.89 mg CO2 100 g-1) was seen in HC treatment (Table 2). CCs increase the potential for macro- and microfaunal activity in soils because they increase the total inputs of organic material to soils (Kaspar and Singer, 2011; Demir, 2019). CCs also are broadly growing strategy to improve soil microbial growth in agricultural systems. The soil microbial activity reflects the soil's ability to store and cycle nutrients. Crop residues are also known to enhance N fixation in soil by asymbiotic bacteria. Conventional tillage (Canadian Environmental Protection Act, 1993) and no-tillage system with a ryegrass cover crop in cotton (Gossipium hirsutum L.) was investigated for the microbial count in soil. Ryegrass cover crop in conventional tillage and no-tillage system maintained a higher microbial population in the upper layer compare to no-cover plots (Sharma et al., 2018a). Demir et al (2019a) found that highest basal soil respiration values (41.5 mg CO2 100 g-1) was obtained in the Vicia villosa Roth treatment while the lowest BSR values (12.5 mg CO2 100 g-1) was in the control in the apricot orchard with a clay textured. Reddy et al. (2003) found that after 3 yr with crimson clover or cereal rye CCs soil had greater microfaunal activity than the soil without a cover crop. In their research, the crimson clover cover crop had a greater stimulatory affect on soil biology than cereal rye. The researchers speculated that the leguminous CCs had more readily available amino acids and carbohydrates than the grass CCs due to a lower C to N ratio. In this study, the greatest increase in BSR values was obtained in VV treatment (164.9%) and the least increase was observed in MC treatment (4.0%) in 2013. As compared to control, percent increases in BSR values between 19.4% in MC treatment and 190.3% in VV treatment in 2014. Lundquist et al. (1999) found on the short-term (42-d) effects of cereal rye incorporation
Z.Demir / Eurasian J Soil Sci 2020, 9 (2) 151 - 164
158
in contrasting vegetable management systems. Their findings illustrated that following rye incorporation, counts of active bacteria increased 24 to 52% in the first 7 d and populations of bacterial-feeding nematodes increased 400 to 600% between 7 and 14 d. Active fungal hyphal lengths and fungal-feeding nematodes were less responsive to rye incorporation during the 42-d period. In this study, legume cover crops (Trifolium repens L., Vicia villosa and Trifolium meneghinianum) treatments were found mostly more effective non-legume (Festuca rubra rubra L. and Festuca arundinacea) treatments. CC treatments enhance nutrient utilization when the species have root systems that are able to extract and mobilize nutrients from deeper layers and the leguminous may add nutrients to the soil by biological fixation (USDA, 1996). Therefore, in this study, the improvements in soil properties were more pronounced with legume and grass cover crops mixture (T. repens (40%) + F. rubra rubra (30%) + F. arundinacea (30%)) than with grass cover (Festuca rubra subsp. rubra and Festuca arundinacea) treatments. Availability of nutrients like N and P is especially dependent upon soil microbial activity and microbial biomass, which in turn depend on the supply of organic substrates in soil. The population of soil flora and fauna is positively correlated with the phyto-biomass present in soil. Beri et al. (1992) and Sindu et al. (1995) obtained that soil applicated with crop residues held 5-10 times more aerobic bacteria and 1.5-11 times more fungi than soil were either burn or removed. The study of Verhulst et al. (2011) reveled that, soil microbial activity increased with increasing amount of crop residues retained on the soil surface in the zero till treatments. Present findings of basal soil respiration well comply with the findings of those earlier studies. However, the differences in the BSR values were not found to be statistically significant for the 20-40 cm soil depth in both years of experiments (Table 3). The mean BSR values for 20-40 cm soil depth were 5.76 mg CO2 100 g-1 in 2013 and 6.10 mg CO2 100 g-1 in 2014.
Available P
The CC treatments significantly increased available P at 0-20 cm soil depth as compared to the soil of an untreated control plot in both years of experiments (p<0.01). In 2013, available P value was the lowest (13.9 mg kg-1) in the herbicide treatment followed by HC< C< MC <FA < FRR < TFF < TM < VV < TR treatments (Table 2). Available P significantly increased from 14.4 mg kg-1 in the control to 20.6 mg kg-1 in TR treatment at 0-20 cm soil depth in 2014. In a study conducted on loamy sand soil by Beri et al. (1995), it has been seen that the incorporation of cover crops as increased the available P and K content. Gupta et al. (2007) reported from the 3 year study that P consantrations in soil increased with the incorporation of cover crops. Some research has been conducted using cover crops within orchard tree rows for potential nutrient contribution (Atucha et al., 2011; Mays et al., 2014). The potential benefits of cover crops use in annual cropping systems have been supported by many studies (Parr et al., 2011). Labarta et al. (2002) reported that available P values was higher for legume cover crops than for grass cover crops, probably due to higher P requirements for legumes due to the mechanisms involved in nitrogen fixation. In this study, available P values significantly increased with the cropping applications and percent increases in available P over the control soil were between 11.9% in FA and 35.2% in TR treatments in 2013 and between 17.5% in FRR and 43.2% in TR treatments in 2014. However, the differences in available P were not found to be statistically significant for the 20-40 cm soil depth in both years of experiments (Table 3). Available P values at 20-40 cm soil depth varied between 12.44-13.75 ppm with a mean value of 13.12 ppm in 2013 and between 12.23-13.95 ppm with a mean value of 13.15 ppm in 2014.
Exchangeable cations (Ca, Mg, K, Na)
In this study, it was found that whereas the CC treatments significantly increased the Ca, Mg and K, it reduced the Na in the soil (Table 2). The CC treatments significantly increased extractable K at 0-20 cm soil depth as compared to the soil of an untreated control plot (p<0.01). In addition, significantly higher exchangeable K was obtained in 2014 than in 2013. While the exchangeable K contents varied between 0.27 me 100 g-1 in HC treatment and 0.42 me 100 g-1 in VV treatment. Percent increases in the extractable K over the control soil varied between 3.4–34.5% in 2013 and 9.5–49.4% in 2014. Aside from the diverse benefits or effects of cover crops on soil, very little is known about the effect of CCs on exchangeable cations and micronutrients of soils (Sharma et al., 2018a). The amount of exchangeable Ca, Mg, K and Na are vital attribute of soils. They relate information on soils’ abilities to sustain plant growth, retain nutrients, sequester toxic heavy metals, or buffer acid deposition. Sharma et al. (2018b) obtained accumulation of K at the surface due to deposition of crop residue and lack of incorporation. Eckert (1991) found that the accumulation of exchangeable K at the surface soil was improved by inclusion of rye cover crop. Sharma et al. (2018a) determined that incorporating cover crops in no-tillage seed soybean or maize cropping systems might help in maintaining the exchangeable Mg content better than no cover crop application.
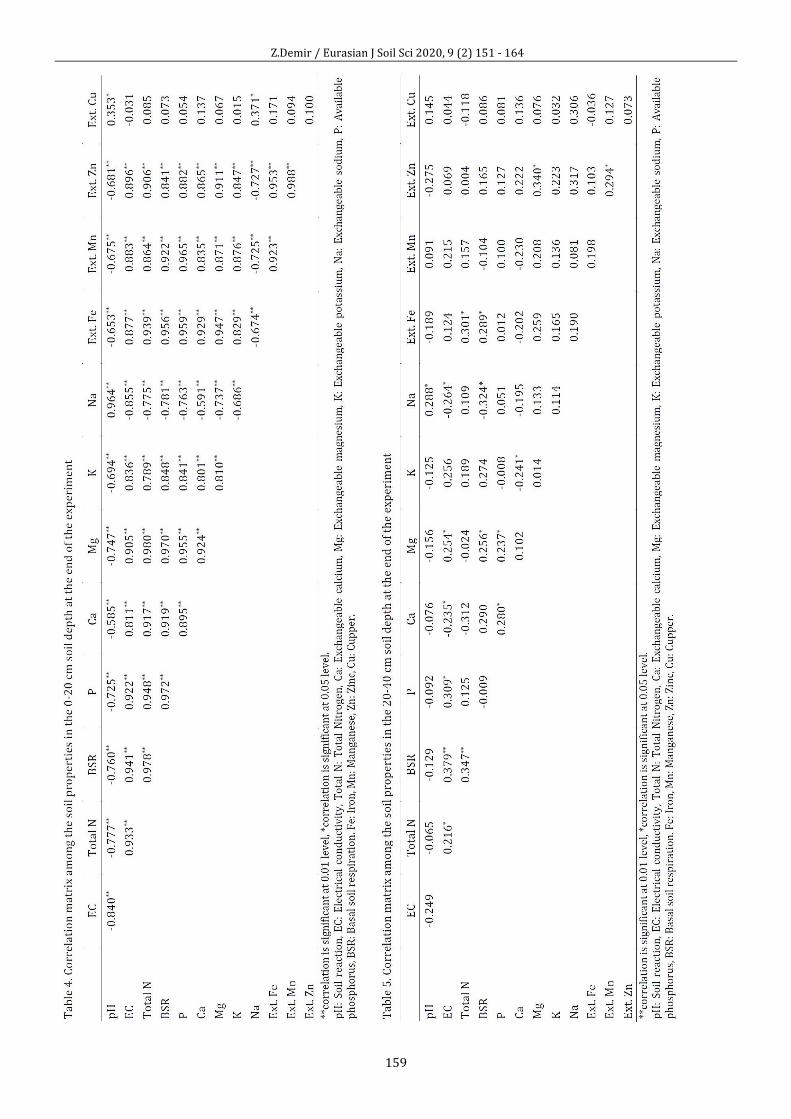
Z.Demir / Eurasian J Soil Sci 2020, 9 (2) 151 - 164
159
Z.Demir / Eurasian J Soil Sci 2020, 9 (2) 151 - 164
160
This would depend on the cover crop species used, as the crop rooting depths and nutrient uptake effect the distribution and magnitude of the nutrients and micronutrients in the soil profile. The CC treatments significantly reduced exchangeable Na from 0.248 me 100 g-1 in control to 0.116 me 100 g-1 in Trifolium repens (TR) treatment in 2014. As compared to control, percent decreases in exchangeable Na value at the 0-20 cm soil depth in 2014 varied between 30.6% in TFF treatment and 50.4% in TR and VV treatments. Demir et al (2019a) cover crop treatments in an apricot orchard with clay soil significantly reduced exchangeable Na and pH from 0.35 me 100 g-1 and 7.47 for the bare control treatment to 0.20 me 100 g-1 for the Vicia pannonica Crantz treatment and to 7.02 for the Vicia villosa Roth and Vicia pannonica Crantz treatments, respectively. The differences in the exchangeable cations (Ca, Mg, K, Na) were not found to be statistically significant for the 20-40 cm soil depth in both years of experiments (Table 3). The exchangeable Ca concentrations varied between 28.7-31.7 me 100 g-1, the exchangeable Mg concentrations between 4.07-5.85 me 100 g-1, the exchangeable K concentrations between 0.20-0.29 me 100 g-1, the exchangeable Na concentrations between 0.19-0.23 me 100 g-1.
The DTPA-extractable micronutrients (Fe, Mn, Zn, Cu)
Ext. Fe concentration of the soils generally increased with the CC treatments according to the control in the cherry orchard (Table 2). Ext. Fe contents (mg kg-1) in the cherry orchard in 2013 was ordered as; HC (19.87) < C (19.89) < MC (20.24) < FA (21.62) < TM (21.84) < FRR (21.86) < TFF (21.88) < VV (23.13) < TR (23.32). As compared to control, percent increases at 0-20 cm soil depth in ext. Fe content varied between 8.7% in FA and 17.3% in TR treatments. The highest ext. Fe content (23.60 mg kg-1) in 2014 was obtained in the TR application while the lowest ext. Fe content (19.56 mg kg-1) was in the HC treatment at 0-20 cm soil depth. As compared to control, percent increases in ext. Fe content at 0-20 cm soil depth varied between 11.3% in FA and 20.1% in TR treatments in the cherry orchard. In addition to exchangeable cations, soil micronutrients also play an significant role in plant yield and growth. Shortage of micronutrients may limit the plant growth and could even cause plant death. The importance of micronutrients to a plant’s health has gotten more attention recently with increasing trends of per area basis crop yields. This trend removes very high amounts of micronutrients from the fields, and soils can not be able to compensate this loss naturally. However, cover crops may have a big effect on soil micronutrients and help in their replenishment (Sharma et al., 2018a). The differences in ext. Fe content were not found to be significant for the 20-40 cm soil depth in both years of experiments (Table 3). Ext. Fe contents ranged from 17.49 mg kg-1 in control plots to 19.00
mg kg-1 in HC treatment for the 20-40 cm soil depth in 2013. Ext. Fe contents ranged from 17.59 mg kg-1 in FA treatment to 19.00 mg kg-1 in MC treatment for the 20-40 cm soil depth in 2014.
Ext. Mn contents of the soils generally increased with the CC treatments according to the control in the cherry orchard (Table 2). The highest ext. Mn content (12.41 mg kg-1) in 2013 was observed in the TR application while the lowest ext. Mn content (8.17 mg kg-1) was in the HC treatment at 0-20 cm soil depth. As compared to control, percent increases in ext. Mn content at 0-20 cm soil depth in 2013 varied between 12% in FRR and 45% in TR treatments in the cherry orchard. Ext. Mn contents (mg kg-1) in the cherry orchard in 2014 was ordered as; C (8.20) < HC (8.34) < MC (8.43) < FRR (9.36) < FA (9.56) < TM (10.09) < TFF (10.15) < VV (12.19) < TR (12.53) treatments. As compared to control, percent increases in ext. Mn content in 2014 varied between 14.2% in FRR and 52.8% in TR treatments in the cherry orchard. The increase might be due to decline in soil reaction and improved dissolution of Mn compounds. Similar conclusions were also determined by Sidhu and Sharma (2010) and Yadav (2011). In this study, the CC treatments caused notable changes of ext. Mn. Wei et al. (2006) studied the influence of cropping practices on soil micronutrients in China. They suggested an important correlation between cropping practices and plant available micronutrients. Their conclusions indicate that available Fe and Mn consantrations in the surface layer were higher in cropped applications compared to the control treatment. Sharma et al. (2018a) found that CCs have the potential in maintaining the optimum levels of Fe, Mn and Zn in the topsoil as compared to the control. The differences in ext. Mn content were not found to be significant for the 20-40 cm soil depth in both years of experiments (Table 3). Ext. Mn contents ranged from 6.69 mg kg-1 in VV treatment to 9.33 mg kg-1 in FA treatment for the 20-40 cm soil depth in 2013. Ext. Mn contents ranged from 6.56 mg kg-1 in HC treatment to 8.41 mg kg-1 in VV treatment for the 20-40 cm soil depth in 2014.
Ext. Zn consantrations of the soils generally increased with the CC treatments according to the control in the cherry orchard (Table 2). Ext. Zn contents (mg kg-1) at 0-20 cm soil depth in 2013 was ordered as; HC (1.43) < C (1.44) < MC (1.46) < FRR (1.52) < FA (1.56) < TFF (1.58) < TM (1.61) < VV (1.80) < TR (1.86). The highest ext. Zn concentrations (1.89 mg kg-1) in 2014 was observed in the TR application while the lowest Zn concentration (1.39 mg kg-1) was in the control at 0-20 cm soil depth. As compared to control, percent increases in ext. Zn over the control soil were between 6.1% in FRR treatment and 29.3% in TR treatment in
Z.Demir / Eurasian J Soil Sci 2020, 9 (2) 151 - 164
161
2013 and between 13.6% in FRR treatment and 36.7% in TR treatment in 2014. Franzluebbers and Hons (1996) also determined increases in ext. Zn consantration in soil under CC treatments. The differences in ext. Zn content were not found to be significant for the 20-40 cm soil depth in both years of experiments (Table 3). Ext. Zn contents ranged from 0.91 mg kg-1 in control plots to 1.17 mg kg-1 in TFF treatment for the 20-40 cm soil depth in 2013. Ext. Zn contents ranged from 1.06 mg kg-1 in MC treatment to 1.17 mg kg-1 in TM treatment for the 20-40 cm soil depth in 2014.
The differences in the ext. Cu concentrations of soils in the cherry orchard were not found to be statistically significant for 0-20 cm soil depths in both years of experiments (Table 2). Ext. Cu content in 2013 varied between 8.81 mg kg-1 in HC treatment and 9.81 mg kg-1 in TR treatment. Ext. Cu content at 0-20 cm soil depth in 2014 varied between 8.99 mg kg-1 in control and 9.59 mg kg-1 in TR treatment. Mengel et al. (2001) determined that Cu is taken up by the plants in very little amounts because the Cu requirement of crop plants is relatively low. The differences in the DTPA-extractable Cu of soils in the orchard were not found to be statistically significant for 20-40 cm soil depth in both years of experiments (Table 3). The ext. Cu contents between 5.88-7.89 me 100 g-1.
Relationships among the selected soil properties
Significant positive correlations were observed between total N and EC (0.933**), BSR and EC (0.941**), total N and BSR (0.978**), total N and P (0.948**), EC and P (0.922**), BSR and P (0.972**), total N and ext. Fe (0.939**), P and ext. Fe (0.959**), total N and Mg (0.980**) at the 0-20 cm soil depth in a cherry orchard (Table 4). The positive association between total N, exchangeable Mg, K, Na, and soil micronutrients (Fe, Mn and Zn) indicate an increase in exchangeable Ca, Mg, K and ext. Fe, Mn and Zn consantrations with increasing total N contents. The pH had important negative correlations with EC (-0.840**), total N (-0.777**), BSR (-0.760**), ext. Fe (-0.653**), P (-0.725**), K (-0.694**) and important negative correlations with BD (-0.954**), RS (-0.821**) and PR (-0.869**) at the 0-20 cm soil depth in a cherry orchard (Table 3). Exchangeable Na consantration had important negative correlations with EC (-0.855**), total N (-0.775**), BSR (-0.781**), P (-0.763**), Mg (-0.737**), Ca (-0.591**) and K (-0.686**) at the 0-20 cm soil depth in a cherry orchard. Ext. Cu concentrations gave the lower correlations with all properties. The soil pH and exchangeable Na concentrations decreased with increase in total N, BSR, EC, available P, exchangeable cations (Ca, Mg and K) and the DTPA-extractable micronutrients (Fe, Mn and Zn). These results indicated that other than total N, EC, available P, exchangeable cations (Ca, Mg, K and Na) and the DTPA-extractable micronutrients (Fe, Mn, Zn and Cu) were useful indicators to define soil chemical properties and BSR under different cropping treatments. Correlation matrix among the soil properties in the 20-40 cm soil depth at the end of the experiment was given in Table 5. Significant correlations were observed between EC and BSR (0.379**), between the total N and BSR (0.347**), between the BSR and Na (-0.324*), between EC and total N (0.216*).
Conclusion The findings of this study indicated that the cover crop managements in a cherry orchard with clay textured soil have ability to contribute to sustainable agriculture production. However, benefits of using cover crops depend on the selection of species (leguminous, non-leguminous and grasses). The cover crop treatments improved the chemical properties and basal respiration of soils at 0-20 cm depth compared to the control. These treatments decreased soil pH and exchangeable Na and increased total N, EC, available P, exchangeable cations (Ca, K, Mg) and the DTPA-extractable micronutrients (Fe, Zn, Mn). Effects of mechanical cultivation and herbicide treatments on chemical properties and basal respiration of soils were not found statistically significant for the 0-20 and 20-40 cm soil depths as compared to control (p<0.01). The improvements in soil quality variables were more pronounced with legume and grass cover crops mixture (T. repens (40%) + F. rubra rubra (30%) + F. arundinacea (30%)) than with grass cover (Festuca rubra subsp. rubra and Festuca arundinacea) treatments. It is clearly known that leguminous and grass crops have positive effects on soil quality variables, but these impacts vary depending on plant species. Therefore, it is very important to select the right cover crop species to enhance the soil quality variables. Researchers needed to demonstrate with farmers for long-term integrated studies that enhancing or maintaining soil productivity with cover crop provides long-term financial benefits. As a conclusion, cover crops especially Vicia villosa (VV) and Trifolium repens (VV) could be incorporated into cropping systems to improve soil chemical properties, basal respiration and to provide sustainable soil management.
Acknowledgments The author would like to thank the Black Sea Agricultural Research Institute and Soil, Fertilizer and Water Resources Central Research Institute for providing the working environment and facilities for this study.
Z.Demir / Eurasian J Soil Sci 2020, 9 (2) 151 - 164
162
References
Aşkin, T., Kızılkaya, R., 2009. Soil basal respiration and dehydrogenase activity of aggregates: a study in a toposequence of pasture soils. Zemdirbyste-Agriculture 96(1): 98-112.
Atucha, A., Merwin, I.A., Brown, M.G., 2011. Long-term effects of four groundcover management systems in an apple orchard. HortScience 46(8): 1176-1183.
Bal, T., Cercinli, F., 2013. The analysis of cherry production and trade in Turkey: the case of Uluborlu district. Bulgarian Journal of Agricultural Science 19(3): 398-415.
Beri, V., Sidhu, B.S., Bhat, A.K., Singh, B.P., 1992. Nutrient balance and soil properties as affected by management of crop residues. In: Proceedings of the international symposium on nutrient management for sustained productivity. Bajwa, M.S. (Ed)., Punjab Agricultural University, Ludhiana, Punjab, India. Vol. II, pp.133-135.
Beri, V., Sidhu, B.S., Bahl, G.S., Bhat, A.K., 1995. Nitrogen and phosphorus transformations as affected by crop residue management practices and their influence on crop yield. Soil Use and Management 11(2): 51-54.
Black, C.A., 1965. Methods of soil analysis. Part 1 Physical and mineralogical properties. Agronomy Monograph 9.1, American Society of Agronomy (ASA), Soil Science Society of America (SSSA), Madison, Wisconsin, USA.
Blanco-Canqui, H., Mikha, M.M., Presley, D.R., Claassen, M.M., 2011. Addition of cover crops enhances no-till potential for improving soil physical properties. Soil Science Society America Journal 75(4): 1471–1482.
Bouyoucos, G.J., 1962. Hydrometer method ımproved for making particle size analyses of soils. Agronomy Journal 54(5): 464-465.
Canadian Environmental Protection Act, 1993. Priority Substances List Assessment Report. Environment Canada and Health Canada, Ottawa, Ontario, 1-56.
Candemir, F., Gulser, C., 2010. Effects of different agricultural wastes on some soil quality indexes at clay and loamy sand fields. Communications in Soil Science and Plant Analysis 42(1): 13-28.
Corwin, D.L., Lesch, S.M., 2003. Application of soil electrical conductivity to precision agriculture: Theory, principles, and guidelines. Agronomy Journal 95(3): 455-471.
Çerçioğlu, M., Anderson, S.H., Udawatta, R.P., Alagele, S., 2019. Effect of cover crop management on soil hydraulic properties. Geoderma 343: 247-253.
Dabney, S.M., Delgado, J.A., Meisinger, J.J., Schomberg, H.H., Liebig, M.A., Kaspar, T., Mitchell, J., Reeves, W., 2010. Using cover crops and cropping systems for nitrogen management. In: Advances in nitrogen management for water quality. Delgado, J.A., Follett, R.F. (Eds.). Soil and Water Conservation Society, Ankeny, IA. pp. 230-281.
Delgado, J.A., Dillon, M.A. Sparks, R.T., Essah. S.Y., 2007. A decade of advances in cover crops. Journal of Soil and Water Conservation 62(5): 110A-117A.
Demir, Z., 2019. Effects of vermicompost on soil physicochemical properties and lettuce (Lactuca sativa Var. Crispa) yield in greenhouse under different soil water regimes, Communications in Soil Science and Plant Analysis 50(17): 2151-2168.
Demir, Z., Gülser, C., 2015. Effects of rice husk compost application on soil quality parameters in greenhouse conditions. Eurasian Journal of Soil Science 4(3): 185-190.
Demir, Z., Işık, D., 2019a. Effects of cover crop treatments on some soil quality parameters and yield in a kiwifruit orchard in Turkey. Fresenius Environmental Bulletin 28(9): 6988-6997.
Demir, Z., Işık, D., 2019b. Comparison of different cover crops on DTPA-extractable micronutrients in hazelnut and apple orchards. Türk Tarım ve Doğa Bilimleri Dergisi 6(2): 137-147.
Demir, Z., Işık, D., 2019c. The comparative effects of different cover crops on DTPA-extractable micronutrients in orchards with loam and clay textured soils. Journal of Agricultural Faculty of Gaziosmanpasa University 36(2): 107-116.
Demir, Z., Tursun, N., Işık, D., 2019a. Effects of different cover crops on soil quality parameters and yield in an apricot orchard. International Journal of Agriculture & Biology 21: 399-408.
Demir, Z., Tursun, N., Işık, D., 2019b. Role of different cover crops on DTPA-extractable micronutrients in an apricot orchard. Turkish Journal of Agriculture-Food Science and Technology 7(5): 698-706.
Doganay, H., 1998. Turkiye Ekonomik Cografyası. Çizgi Kitabevi, Konya, Turkey. [in Turkish]. Doolittle, J.A., Sudduth, K.A., Kitchen, N.R., Indorante, S.J., 1994. Estimating depths to claypans using electromagnetic
induction methods. Journal of Soil and Water Conservation 49(6): 572-575. Eckert, D., 1991. Chemical attributes of soils subjected to no-till cropping with rye cover crops. Soil Science Society of
America Journal 55(2): 405-409. Eigenberg, R.A., Doran, J.W., Nienaber, J.A., Ferguson, R.B., Woodbury, B.L., 2002. Electrical conductivity monitoring of
soil condition and available N with animal manure and a cover crop. Agriculture, Ecosystems & Environment 88(2): 183-193.
Erogul, D., 2018. An overview of sweet cherry fruit cultivation in Turkey. Trends in Horticulture Volume 1. FAOSTAT, 2017. The statistics division of the food and agriculture organization (FAO). Available at [Access date:
10.06.2019]: http://faostat.fao.org/site Franzluebbers, A.J., Hons, F.M., 1996. Soil-profile distribution of primary and secondary plant-avaliable nutrients under
conventional and no tillage. Soil and Tillage Research 39(3-4): 229-239.
Z.Demir / Eurasian J Soil Sci 2020, 9 (2) 151 - 164
163
Gajda, A.M., Doran, J.W., Wienhold, B.J., Kettler, T.A., Pikul Jr., J.L., Cambardella, C.A., 2000. Soil quality evaluations of alternative and conventional management systems in the Great Plains. In: Methods of Assessment of Soil Carbon, Lal, R., Kimble, J.F., Follett, R.F., Stewart, B.A. (Eds.). CRC Press, Boca Raton, FL, USA. pp.381-40.
Garcia, R.A., Rosolem, C.A., 2010. Aggregates in a rhodic ferralsol under no-tillage and crop rotation. Pesquisa Agropecuária Brasileira 45(12): 1489-1498 [in Portuguese].
Gupta, R.K., Singh, Y., Ladha, J.K., Singh, B., Singh, J., Singh, G., Pathak, H.,, 2007. Yield and phosphorus transformations in a rice–wheat system with crop residue and phosphorus management. Soil Science Society America Journal 71(5): 1500-1507.
Gülser, C., 2004. A Comparison of Some Physical and Chemical Soil Quality Indicators Influenced by Different Crop Species. Pakistan Journal of Biological Sciences 7(6): 905-911.
Harris, G.H., Hesterman, O.B., Paul, E.A., Peters, S.E., Janke, R.R., 1994. Fate of legume and fertilizer Nitrogen‐15 in a long‐term cropping systems experiment. Agronomy Journal 86(5): 910-915.
Heiniger, R.W., McBride, R.G., Clay, D.E., 2003. Using soil electrical conductivity to improve nutrient management. Agronomy Journal 95(3): 508-519.
Hoagland, L., Carpenter-Boggs, L., Granatstein, D., Azzola, M., Smith, J., Peryea, F., Reganold, J.P., 2008. Orchard floor management effects on nitrogen fertility and soil biological activity in a newly established organic apple orchard. Biology and Fertility of Soils 45: 11-18.
Ingels, C., Van Horn, M., Bugg, R., Miller, P.R., 1994. Selecting the right cover crop gives multiple benefits. California Agriculture 48(5): 43-48.
Işık, D., Kaya, E., Ngouajio, M., Mennan, H., 2009. Summer cover crops for weed management and yield improvement in organic lettuce (Lactuca sativa) production. Phytoparasitica 37: 193-203.
Jackson, M.L., 1958. Soil Chemical Analysis, Prentice Hall Inc. Englewood Cliffs, New Jersey, USA. 498p. Kacar, B., 1994. Bitki ve Toprağın Kimyasal Analizleri III. Toprak Analizleri. Ankara Üniversitesi Ziraat Fakültesi Eğitim
Araştırma ve Geliştirme Vakfı Yayınları No:3. Ankara, Turkey [in Turkish]. Kaspar, T.C., Singer, J.W., 2011. The use of cover crops to manage soil. In: Soil management: Building a stable base for
agriculture. Hatfield, J.L., Sauer, T.J. (Eds.), Am. Soc. Agron. and Soil Sci. Soc. Amer., Madison, WI. pp. 321-337 Kaye, J.P., Quemada, M., 2017. Using cover crops to mitigate and adapt to climate change. A review. Agronomy for
Sustainable Development 37: 4. Keesstra, S., Pereira, P., Novara, A., Brevik, E.C., Azorin-Molina, C., Parras-Alcántara, L., Jordán, A., Cerdà, A., 2016. Effects
of soil management techniques on soil water erosion in apricot orchards. Science of The Total Environment 551-552: 357-366.
Khakural, B.R., Robert, P.C., Hugins, D.R., 1998. Use of non-contacting electromagnetic inductive method for estimating soil moisture across a landscape. Communications in Soil Science and Plant Analysis 29(11-14): 2055–2065.
Kitchen, N.R., Sudduth, K.A., Drummond, S.T., 1996. Mapping of sand deposition from 1993 midwest floods with electromagnetic induction measurements. Journal of Soil and Water Conservation 51 (4): 336-340.
Kuo, S., Sainju, U., Jellum, E., 1997. Winter cover cropping influence on nitrogen in soil. Soil Science Society of America Journal 61(5): 1392–1399.
Labarta, R., Swinton, S.M., Black, J.R., Snapp, S., Leep, R., 2002. Economic analysis approaches to potato-based integrated crop systems: Issues and methods. Staff Paper 2002–32. Department of Agricultural Economics, Michigan State University, East Lansing, Michigan 48824, USA.
Ladha, J.K., Peoples, M.B., 1994. Management of biological nitrogen fixation for the development of more productive and sustainable agricultural systems. Symposium on Biological Nitrogen Fixation for Sustainable Agriculture at the 15th Congress of Soil Science, Acapulco, Mexico.
Ladha, J., Khind, C., Gupta, R., Meelu, O., Pasuquin, E., 2004. Long-term effects of organic ınputs on yield and soil fertility in the rice-wheat rotation. Soil Science Society of America Journal 68(3): 845-853.
Lal, R., Regnier, E., Eckert, D.J., Edwards, W.M., Hammond, R., 1991. Expectations of cover crops for sustainable agricul- ture. In: Cover Crops for Clean Water. Hargrove, W.L., (Ed.). Soil and Water Conservation Society, Ankeny, USA. pp. 1-11.
Lundquist, E.J., Jackson, L.E., Scow, K.M., Hsu, C., 1999. Changes in microbial biomass and community composition, and soil carbon and nitrogen pools aft er incorporation of rye into three California agricultural soils. Soil Biology and Biochemistry 31(2): 221-236.
Mansoer, Z., Reeves, D.W., Wood. C.W., 1997. Suitability of sunn hemp as an alternative late-summer legume cover crop. Soil Science Society of America Journal 61(1): 246-253.
Mays, N., Brye, K.R., Rom, C.R., Savin, M., Garcia, M.E., 2014. Groundcover management and nutrient source effects on soil carbon and nitrogen sequestration in an organically managed apple orchard in the Ozark highlands. HortScience 49(5): 637-644.
Mengel, K., Kirkby, E.A., Kosegarten, H., Appel, T., 2001. Principles of plant nutrition, 5th edition. Kluwer Academic Publishers. Dordrecht, Netherlands. 848p.
Mennan, H., Ngouajio, M., Işık, D., Kaya, E., 2009. Effects of alternative winter cover cropping systems on weed suppression in organically grown tomato (Solanum lycopersicum L.). Phytoparasitica 37(4):385-396.
Odhiambo, J.J.O., Bomke, A.A., 2000. Short term nitrogen availability following overwinter cereal/grass and legume cover crop monocultures and mixtures in south coastal British Columbia. Journal of Soil and Water Conservation 55(3): 347-354.
Z.Demir / Eurasian J Soil Sci 2020, 9 (2) 151 - 164
164
Olsen, S.R., Cole, C.V., Watanabe, F.S., Dean, L.A., 1954. Estimation of available phosphorus in soils by extraction with sodium bicarbonate. U.S. Department of Agriculture, Circular No 939, USA, 19p.
Parr, M., Grossman, J.M., Reberg-Horton, S.C., Brinton, C., Crozier, C., 2011. Nitrogen delivery from legume cover crops in no-till organic corn production. Agronomy Journal 103(6): 1578-1590.
Ramos, M.E., Altieri, M.A., Garcia, P.A., Robles. A.B., 2011. Oat and oat-vetch as rainfed fodder-cover crops in semiarid environments: Effects of fertilization and harvest time on forage yield and quality. Journal of Sustainable Agriculture 35(7): 726-744.
Ranells, N.N., Wagger, M.G., 1996. Nitrogen release from grass and legume cover crop monocultures and bicultures. Agronomy Journal 88(5): 777-882.
Reddy, K.N., Zablotowicz, R.M., Locke, M.A., Koger. C.H., 2003. Cover crop, tillage, and herbicide effects on weeds, soil properties, microbial populations, and soybean yield. Weed Science 51(6): 987–994.
Reddy, P.P., 2016. Cover/Green Manure Crops. In: Sustainable Intensification of Crop Production. Reddy, P.P.(Ed.). Springer, Singapore, pp. 55-67.
Reeves, D.W., 1994. Cover crop and rotations. In: Crops residue management. Hatfield, J.L., Stewart, B.A. (Ed.). Lewis Publications., Boca Raton, FL. USA. pp. 125–172.
Rengel, Z., Marschner, P., 2005. Nutrient availability and management in the rhizosphere: exploiting genotypic differences, New Phytologist 168(2): 305–312.
Richards, L.A., 1954. Diagnosis and improvement of saline and alkali soil. U.S. Salinity Lab. Staff, U.S. Department of Agriculture, Agricultural Research Service, Handbook 60. Washington D.C. USA. 160p.
Rowell, D.L., 1996. Soil science: Methods and applications. Longman Scientific & Technical, Longman Group UK Ltd, Harlow, Essex, UK. 350 p.
Sharma, P., Singh, A., Kahlon, C.S., Brar, A.S., Grover, K.K., Dia, M., Steiner, R.L., 2018a. The role of cover crops towards sustainable soil health and agriculture-A review paper. American Journal of Plant Sciences 9: 1935-1951.
Sharma, V., Irmak, S., Padhi, J., 2018b. Effects of cover crops on soil quality: Part II. Soil exchangeable bases (potassium, magnesium, sodium, and calcium), cation exchange capacity, and soil micronutrients (zinc, manganese, iron, copper, and boron). Journal of Soil and Water Conservation 73(6): 652-668.
Shipley, P.R., Messinger, J., Decker, A., 1992. Conserving residual corn fertilizer nitrogen with winter cover crops. Agronomy Journal 84(5): 869-876.
Sidhu, G.S., Sharma, B.D., 2010. Diethylenetriaminepentaacetic acid–extractable micronutrients status in soil under a rice–wheat system and their relationship with soil properties in different agroclimatic zones of Indo‐Gangetic Plains of India, Communications in Soil Science and Plant Analysis 41(1): 29-51.
Sindu, B.S., Beri, V., Gosal, S.K., 1995. Soil microbial health as affected by crop residue management. Proceedings of the National Symposium on Developments in Soil Science. 2-5 November 1995. Indian Society of Soil Science, Benbi, D.K., Brar, M.S., Bansal, S.K., (Eds.). pp.45–46.
Soil Science Society of America (SSSA), 2001. Internet Glossary of Soil Science. Available at [Access date : 10.09.2019]: https://www.soils.org/publications/soils-glossary
Sudduth, K.A., Kitchen, N.R., Bollero, G.A., Bullock, D.G., Wiebold, W.J., 2003. Comparison of electromagnetic induction and direct sensing of soil electrical conductivity. Agronomy Journal 95(3): 472-482.
Thorup-Kristensen, K., Magid, J., Jensen, L.S., 2003. Catch crops and green manures as biological tools in nitrogen management in temperate zones. Advances in Agronomy 79: 227–302.
TURKSTAT, 2018. Turkish statistical institute, crop production statistics. Available at [Access date: 10.06.2019]: http://www.tuik.gov.tr/PreTablo.do?alt_id=1001 [in Turkish].
USDA, NRCS, Soil Quality Institute, 1996. Cover and green manure crop benefits to soil quality. Soil Quality-Agronomy, Technical Note, No.1. Available at [Access date: 10.06.2019]: https://www.nrcs.usda.gov/Internet/FSE_DOCUMENTS/nrcs142p2_053282.pdf
Verhulst, N., Sayre, K.D., Vargas, M., Crossa, J., Deckers, J., Raes, D., Govaerts, B., 2011. Wheat yield and tillage–straw management system × year interaction explained by climatic co-variables for an irrigated bed planting system in northwestern Mexico. Field Crops Research 124(3): 347-356.
Wagger, M.G., 1989. Time of desiccation effects on plant composition and subsequent nitrogen release from several winter annual cover crops. Agronomy Journal 81(2): 236-241.
Wei, X.R., Hao, M.D., Shao, M.G., Gale, W.J., 2006. Changes in soil properties and availability of soil micronutrientsafter18years of cropping and fertilization. Soil and Tillage Research 91(1-2): 120-130.
Yadav, B.K., 2011. Micronutrient status of soils under legume crops in arid region of Western Rajasthan, India. Academic Journal of Plant Sciences 4(3): 94-97.
Yurtsever, N. 2011. Deneysel İstatistik Metotları. Toprak Gübre ve Su Kaynakları Merkez Araştırma Enstitüsü Yayınları. 2.Baskı, Ankara, Turkey. [in Turkish].
Zhang, R., Wienhold, B.J., 2002. The effect of soil moisture on mineral nitrogen, soil electrical conductivity, and pH. Nutrient Cycling in Agroecosystems 63: 251-254.
V. Chaplygin et al./ Eurasian J Soil Sci 2020, 9 (2) 165 - 172
165
Accumulating capacity of herbaceous plants of the Asteraceae and Poaceae families under technogenic soil pollution with
zinc and cadmium Victor Chaplygin a, Saglara Mandzhieva a, Tatiana Minkina a,*, Svetlana Sushkova a,
Anatolii Barahov a, Dina Nevidomskaya a, Rıdvan Kızılkaya b,c, Coşkun Gülser b, Natalia Chernikova a, Mahmoud Mazarji a, Luydmila Iljina d, Vishnu Rajput a
a Southern Federal University, Rostov-on-Don, Russia b Ondokuz Mayıs University, Faculty ofAgriculture, Department of Soil Science and Plant Nutrition, Samsun, Turkey
c Agrobigen Research & Development Trade Ltd.Co, Samsun Technopark, Samsun, Turkey d Federal Research Centre the Southern Scientific Centre of the Russian Academy of Sciences, Rostov-on-Don, Russia
Abstract Article Info Received : 12.09.2019 Accepted : 18.03.2020
In this study, the environmental monitoring of the long-term technogenic pollution zone of Novocherkassk, a region containing numerous heavy metal contaminations, was carried out. In the plants growing in the 5 km zone around Novocherkasskaya power station, contamination with the studied elements was revealed. The dependence of the content of Zn and Cd in herbaceous plants of the families Asteraceae and Poaceae on the distance to the source of the anthropogenic load was established. The selectivity of accumulation of metals by studied species of herbaceous plants at different levels of technogenic pollution is revealed. Achillea nobilis has the least pollutants resistant from the soil. Poa pratensis has the highest resistance to Zn and Cd pollution in terms of the set of assessment indicators. The granulometric composition of the soil has a significant impact on the availability of metals to plants.
Keywords: Heavy metals, technogenic pollution, soil-plant system.
© 2020 Federation of Eurasian Soil Science Societies. All rights reserved
Introduction Environmental pollution is one of the most serious problems nowadays. These pollutants are found to be common wherever industrial enterprises or urban infrastructure presented. Emissions from chemical and energy industries are the most significant sources of pollutant release into the environment. Among the chemical elements, heavy metals (HM) are the most toxic; many of them exhibit high toxicity even in trace amount levels (Seregin and Ivanov, 2001; Zhuikova and Zinnatova, 2014). The concentration of HM in the natural environment tends to increase over time due to their persistence and non-biodegradability. For this reason, territories subject to long-term industrial pollution are important cases for research aiming at evaluating the distribution of trace elements in plant communities (Plyaskina, Ladonin, 2005; Chaplygin et al., 2018; Minkina et al., 2018). The risk associated with metals is attributed to an accumulation and toxicity characteristic which makes them remain in the soil for a long time.
Technogenic pollution mainly targets and affects the soil as the basis of any terrestrial ecosystem. The HM contamination of soils can impose major threats to agricultural sectors for a long period of time. Soil-to-crop transfer mechanism of HM is considered as the direct transformation pathway to humans. Food crops grown on the metal contaminated soil can easily uptake and accumulate metals in high quantities which in turn affect food quality and safety. To this end, special attention should be given to herbaceous plants as they represent the majority of agricultural crops and the convenient indicator for studying technogenic stress.
* Corresponding author. Southern Federal University, pr. Stachki 194/1, Rostov-on-Don, 344090, Russia Tel.: +79185531632 E-mail address: [email protected] e-ISSN: 2147-4249 DOI: 10.18393/ejss.707659
V. Chaplygin et al./ Eurasian J Soil Sci 2020, 9 (2) 165 - 172
166
Moreover, wild herbaceous plants as recourses of livestock feed and raw medicinal can be of a possible threat case to humans and animals.
Zn and Cd are some of the most common HM in industrial emissions related to the first hazard class. Cd and Zn are the most toxic elements that have multiple toxic effects on plants (Andresen and Kupper, 2013; Zhao et al., 2014; Shtangeeva et al., 2019). In addition, these elements demonstrate similar geochemical behavior and have additive properties, replacing each other in the physiological processes in plants. The results of studying the Zn-Cd interaction are controversial since there is evidence of both antagonism and synergism between these elements during absorption and transfer (Andresen and Kupper, 2013; Zhao et al., 2014). For example, there is evidence that Cd is able to replace Zn in many vital enzymatic reactions, leading to their rupture or inhibition. It is assumed that Cd-Zn interaction mechanisms are controlled by the ratio of their concentrations in the plant habitat, the physico-chemical properties of the soil, and the biological characteristics of the absorbing plants (Kabata-Pendias and Pendias, 2001; Maksimov et al., 2018). Interdependent physico-chemical and biological factors affect the release of metal ions into soil solution and, therefore, the capacity of plants to absorb them from the soil would increase.
The aim of the work is to study the accumulation of Cd and Zn in various species of wild herbaceous plants of the Asteraceae and Poaceae families under long-term technogenic pollution.
Material and Methods The object of the present work is soil of monitoring plots laid at a distance of 1-20 km from Novocherkassk Power Station (NPS). It is the largest enterprise in the south of Russia. This enterprise emits 1% of all pollutants into the atmosphere in the Russian Federation, over 50% in Rostov Region, and about 90% in Novocherkassk (Environmental Bulletin, 2018).
Monitoring plots were laid at a distance of 1-20 km from NPS. The choice of the plots was done in accordance with the air sampling plot conducted within the project in order to organize and set a sanitary protection zone of the northern industrial hub in Novocherkassk. Besides, all herbaceous plant species under investigation were grown on the chosen monitoring plots. Plant samples were collected in accordance with the prevailing north-west direction of the winds at monitoring plots No. 4, No. 8, No. 9, No. 10, and plot No. 5, located close to this direction. Points No. 1, No. 2, No. 3, No. 7, No. 11, No. 12, No. 16, and No. 17 were laid at a distance of 1-3 km from NPS in various directions to determine the pollution level of the territories located to the side away from the prevailing wind direction. Plot No. 10 was located 400 meters from the highway. Over the decades of vehicle emissions, a significant amount of HM has entered the soil of plot No. 10, which currently continues to move from soil to plants as an additional source of anthropogenic load. Plot No. 9 was selected as the background due to its great remote location (15 km) from the NPS and the absence of additional sources of pollution.
The soils at the monitoring plots were represented by Haplic Chernozem, Meadow-Chernozemic, and alluvial soil. Haplic Chernozem (plots No. 1, No. 4, No. 5, No. 7, No. 9, No. 10, No. 16, and No. 17) has 3.6 – 4.2% humus content, 50.6 – 56.3% physical clay, 40.4 – 44.6% silt, 0.5–1.1% CaCO3, 7.4–7.7 pH, 31–36 cmol (+)/kg CEC. Meadow-chernozemic soils was monitored at plots No. 3, No. 6, No. 8, No. 11 with 4.2–5.1% humus content, 65.3–67% physical clay, 44.0–49.3% silt, 0.2–0.7% CaCO3, 7.3–7.7 pH, 31–45 cmol (+)/kg CEC. Alluvial soil of the Tuzlov river floodplain (plots No. 2, No. 12) was characterized to have 1.3–3.1% humus content, 7.5–7.9 pH, 5.9–6.9% physical clay, 0.9–2.9% silt, 0.4–0.5% CaCO3,12–21 cmol ( +)/kg CEC.
Study objects were grass plants of the Asteraceae family and Poaceae family. Plants of these families were found to be predominant at the monitoring plots including ragweed (Ambrosia artemisiifolia L.), Austrian wormwood (Artemisia austriaca Pall. Ex. Wild.), Noble yarrow (Achillea nobilis L.), and common tansy (Tanacetum vulgare L.), as well as bluegrass (Poa pratensis L.) and creeping wheatgrass (Elytrigia repens (L.) Nevski). Plant samples were collected in triplicate in the second half of June during the mass flowering stage. The sampling period was chosen due to the fact that the maximum entry of elements into the plants takes place at this stage (Ilyin and Syso, 2012).
The Cd and Zn are the metals of the first hazard class found remarkably in the emissions of NPS (Environmental Bulletin, 2018). The content of these metals was determined in the samples of plants and soils. Mineralization of plant samples was carried out by the dry ashing method according to GOST 26929-94. Afterward, HM were extracted from ash by dissolving in a 20% HCl solution with further determination using atomic absorption spectrophotometry (AAS) (Guidelines for the determination…, 1992). The HM pollution in plants was assessed by comparing the concentration of elements in plants with the maximum permissible level (MPL) of metal content in farm animals feed (Provisional maximum permissible levels…, 1987).
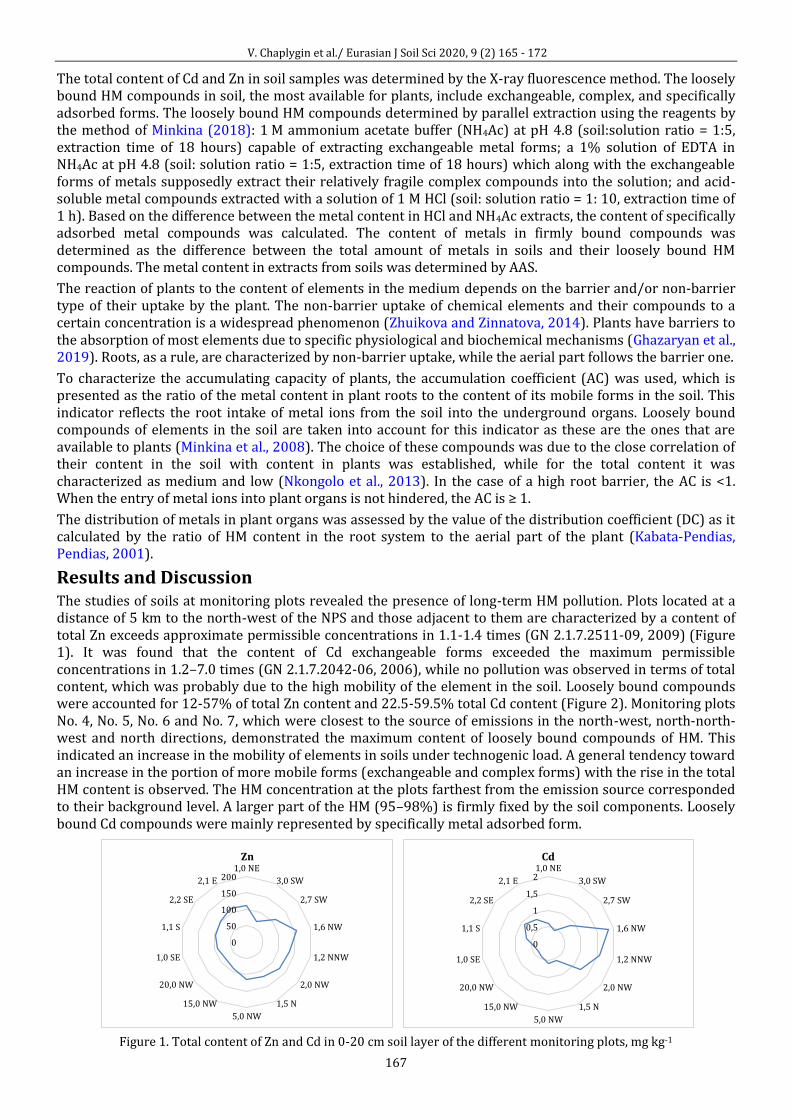
V. Chaplygin et al./ Eurasian J Soil Sci 2020, 9 (2) 165 - 172
167
The total content of Cd and Zn in soil samples was determined by the X-ray fluorescence method. The loosely bound HM compounds in soil, the most available for plants, include exchangeable, complex, and specifically adsorbed forms. The loosely bound HM compounds determined by parallel extraction using the reagents by the method of Minkina (2018): 1 M ammonium acetate buffer (NH4Ac) at pH 4.8 (soil:solution ratio = 1:5, extraction time of 18 hours) capable of extracting exchangeable metal forms; a 1% solution of EDTA in NH4Ac at pH 4.8 (soil: solution ratio = 1:5, extraction time of 18 hours) which along with the exchangeable forms of metals supposedly extract their relatively fragile complex compounds into the solution; and acid-soluble metal compounds extracted with a solution of 1 M HCl (soil: solution ratio = 1: 10, extraction time of 1 h). Based on the difference between the metal content in HCl and NH4Ac extracts, the content of specifically adsorbed metal compounds was calculated. The content of metals in firmly bound compounds was determined as the difference between the total amount of metals in soils and their loosely bound HM compounds. The metal content in extracts from soils was determined by AAS.
The reaction of plants to the content of elements in the medium depends on the barrier and/or non-barrier type of their uptake by the plant. The non-barrier uptake of chemical elements and their compounds to a certain concentration is a widespread phenomenon (Zhuikova and Zinnatova, 2014). Plants have barriers to the absorption of most elements due to specific physiological and biochemical mechanisms (Ghazaryan et al., 2019). Roots, as a rule, are characterized by non-barrier uptake, while the aerial part follows the barrier one.
To characterize the accumulating capacity of plants, the accumulation coefficient (AC) was used, which is presented as the ratio of the metal content in plant roots to the content of its mobile forms in the soil. This indicator reflects the root intake of metal ions from the soil into the underground organs. Loosely bound compounds of elements in the soil are taken into account for this indicator as these are the ones that are available to plants (Minkina et al., 2008). The choice of these compounds was due to the close correlation of their content in the soil with content in plants was established, while for the total content it was characterized as medium and low (Nkongolo et al., 2013). In the case of a high root barrier, the АC is <1. When the entry of metal ions into plant organs is not hindered, the AC is ≥ 1.
The distribution of metals in plant organs was assessed by the value of the distribution coefficient (DC) as it calculated by the ratio of HM content in the root system to the aerial part of the plant (Kabata-Pendias, Pendias, 2001).
Results and Discussion The studies of soils at monitoring plots revealed the presence of long-term HM pollution. Plots located at a distance of 5 km to the north-west of the NPS and those adjacent to them are characterized by a content of total Zn exceeds approximate permissible concentrations in 1.1-1.4 times (GN 2.1.7.2511-09, 2009) (Figure 1). It was found that the content of Cd exchangeable forms exceeded the maximum permissible concentrations in 1.2–7.0 times (GN 2.1.7.2042-06, 2006), while no pollution was observed in terms of total content, which was probably due to the high mobility of the element in the soil. Loosely bound compounds were accounted for 12-57% of total Zn content and 22.5-59.5% total Cd content (Figure 2). Monitoring plots No. 4, No. 5, No. 6 and No. 7, which were closest to the source of emissions in the north-west, north-north-west and north directions, demonstrated the maximum content of loosely bound compounds of HM. This indicated an increase in the mobility of elements in soils under technogenic load. A general tendency toward an increase in the portion of more mobile forms (exchangeable and complex forms) with the rise in the total HM content is observed. The HM concentration at the plots farthest from the emission source corresponded to their background level. A larger part of the HM (95–98%) is firmly fixed by the soil components. Loosely bound Cd compounds were mainly represented by specifically metal adsorbed form.
Figure 1. Total content of Zn and Cd in 0-20 cm soil layer of the different monitoring plots, mg kg-1
0
50
100
150
2001,0 NE
3,0 SW
2,7 SW
1,6 NW
1,2 NNW
2,0 NW
1,5 N
5,0 NW
15,0 NW
20,0 NW
1,0 SE
1,1 S
2,2 SE
2,1 E
Zn
0
0,5
1
1,5
21,0 NE
3,0 SW
2,7 SW
1,6 NW
1,2 NNW
2,0 NW
1,5 N
5,0 NW
15,0 NW
20,0 NW
1,0 SE
1,1 S
2,2 SE
2,1 E
Cd
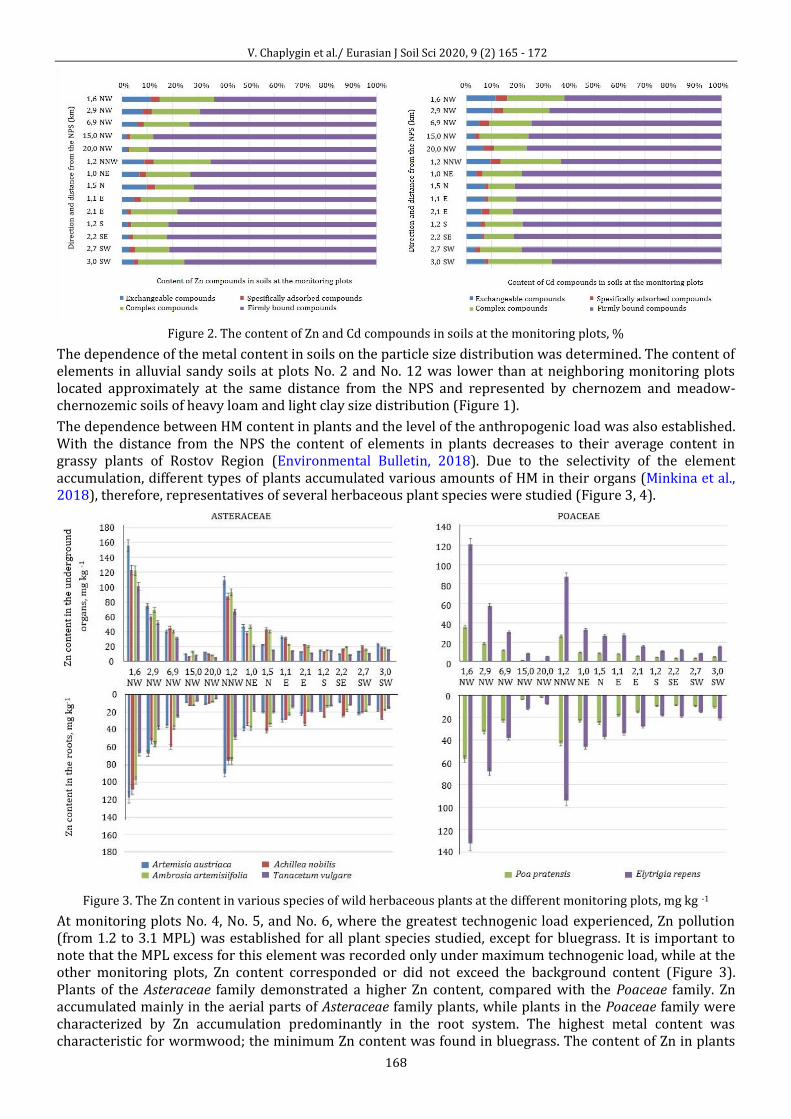
V. Chaplygin et al./ Eurasian J Soil Sci 2020, 9 (2) 165 - 172
168
Figure 2. The content of Zn and Cd compounds in soils at the monitoring plots, %
The dependence of the metal content in soils on the particle size distribution was determined. The content of elements in alluvial sandy soils at plots No. 2 and No. 12 was lower than at neighboring monitoring plots located approximately at the same distance from the NPS and represented by chernozem and meadow-chernozemic soils of heavy loam and light clay size distribution (Figure 1).
The dependence between HM content in plants and the level of the anthropogenic load was also established. With the distance from the NPS the content of elements in plants decreases to their average content in grassy plants of Rostov Region (Environmental Bulletin, 2018). Due to the selectivity of the element accumulation, different types of plants accumulated various amounts of HM in their organs (Minkina et al., 2018), therefore, representatives of several herbaceous plant species were studied (Figure 3, 4).
Figure 3. The Zn content in various species of wild herbaceous plants at the different monitoring plots, mg kg -1
At monitoring plots No. 4, No. 5, and No. 6, where the greatest technogenic load experienced, Zn pollution (from 1.2 to 3.1 MPL) was established for all plant species studied, except for bluegrass. It is important to note that the MPL excess for this element was recorded only under maximum technogenic load, while at the other monitoring plots, Zn content corresponded or did not exceed the background content (Figure 3). Plants of the Asteraceae family demonstrated a higher Zn content, compared with the Poaceae family. Zn accumulated mainly in the aerial parts of Asteraceae family plants, while plants in the Poaceae family were characterized by Zn accumulation predominantly in the root system. The highest metal content was characteristic for wormwood; the minimum Zn content was found in bluegrass. The content of Zn in plants
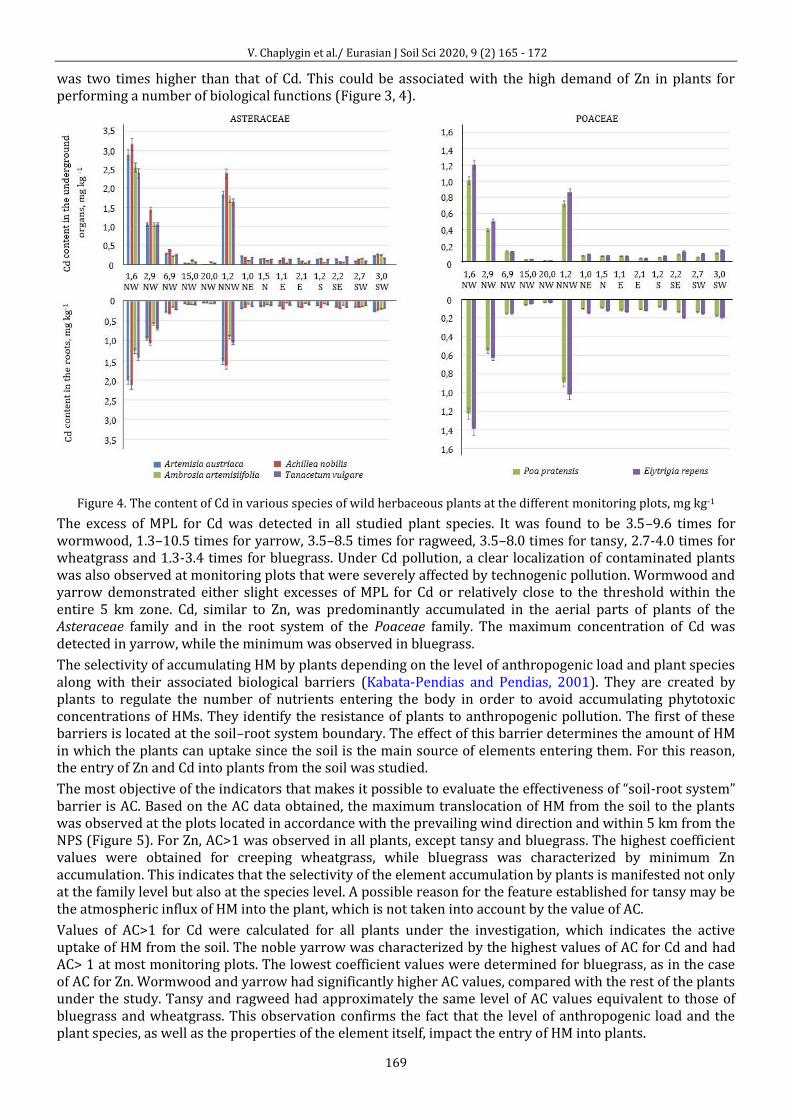
V. Chaplygin et al./ Eurasian J Soil Sci 2020, 9 (2) 165 - 172
169
was two times higher than that of Cd. This could be associated with the high demand of Zn in plants for performing a number of biological functions (Figure 3, 4).
Figure 4. The content of Cd in various species of wild herbaceous plants at the different monitoring plots, mg kg-1
The excess of MPL for Cd was detected in all studied plant species. It was found to be 3.5–9.6 times for wormwood, 1.3–10.5 times for yarrow, 3.5–8.5 times for ragweed, 3.5–8.0 times for tansy, 2.7-4.0 times for wheatgrass and 1.3-3.4 times for bluegrass. Under Cd pollution, a clear localization of contaminated plants was also observed at monitoring plots that were severely affected by technogenic pollution. Wormwood and yarrow demonstrated either slight excesses of MPL for Cd or relatively close to the threshold within the entire 5 km zone. Cd, similar to Zn, was predominantly accumulated in the aerial parts of plants of the Asteraceae family and in the root system of the Poaceae family. The maximum concentration of Cd was detected in yarrow, while the minimum was observed in bluegrass.
The selectivity of accumulating HM by plants depending on the level of anthropogenic load and plant species along with their associated biological barriers (Kabata-Pendias and Pendias, 2001). They are created by plants to regulate the number of nutrients entering the body in order to avoid accumulating phytotoxic concentrations of HMs. They identify the resistance of plants to anthropogenic pollution. The first of these barriers is located at the soil–root system boundary. The effect of this barrier determines the amount of HM in which the plants can uptake since the soil is the main source of elements entering them. For this reason, the entry of Zn and Cd into plants from the soil was studied.
The most objective of the indicators that makes it possible to evaluate the effectiveness of “soil-root system” barrier is AC. Based on the AC data obtained, the maximum translocation of HM from the soil to the plants was observed at the plots located in accordance with the prevailing wind direction and within 5 km from the NPS (Figure 5). For Zn, AC>1 was observed in all plants, except tansy and bluegrass. The highest coefficient values were obtained for creeping wheatgrass, while bluegrass was characterized by minimum Zn accumulation. This indicates that the selectivity of the element accumulation by plants is manifested not only at the family level but also at the species level. A possible reason for the feature established for tansy may be the atmospheric influx of HM into the plant, which is not taken into account by the value of AC.
Values of AC>1 for Cd were calculated for all plants under the investigation, which indicates the active uptake of HM from the soil. The noble yarrow was characterized by the highest values of AC for Cd and had AC> 1 at most monitoring plots. The lowest coefficient values were determined for bluegrass, as in the case of AC for Zn. Wormwood and yarrow had significantly higher AC values, compared with the rest of the plants under the study. Tansy and ragweed had approximately the same level of AC values equivalent to those of bluegrass and wheatgrass. This observation confirms the fact that the level of anthropogenic load and the plant species, as well as the properties of the element itself, impact the entry of HM into plants.
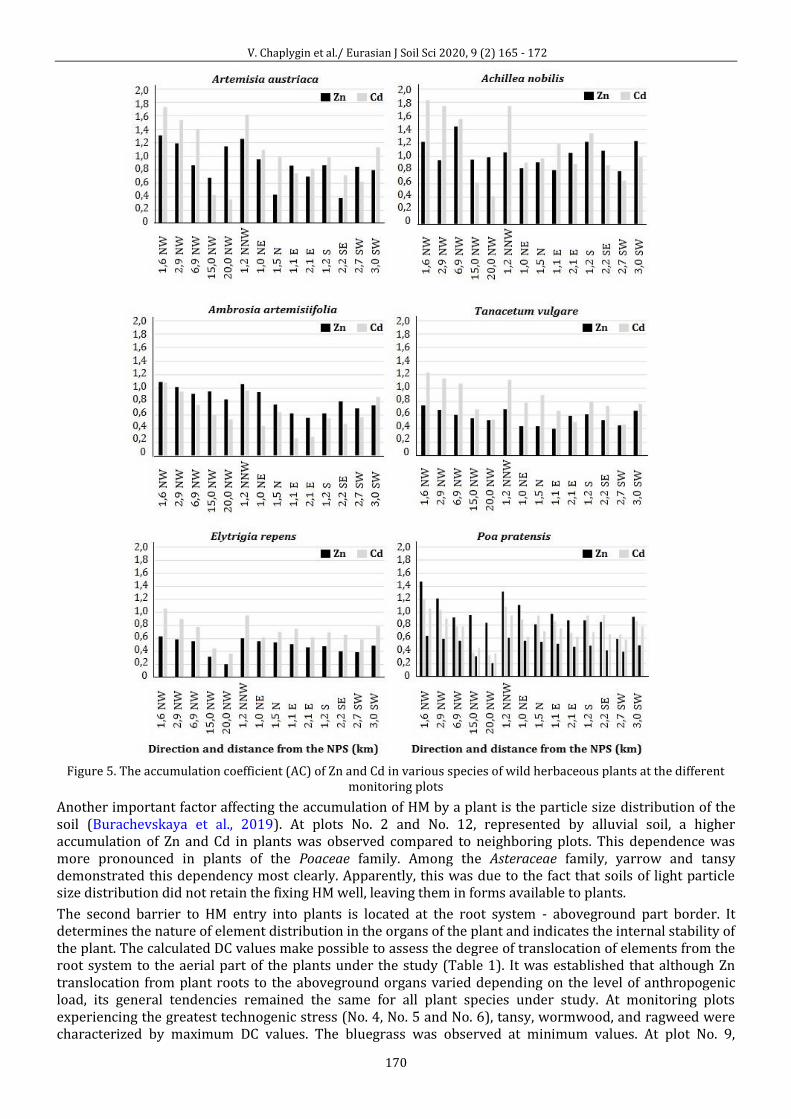
V. Chaplygin et al./ Eurasian J Soil Sci 2020, 9 (2) 165 - 172
170
Figure 5. The accumulation coefficient (AC) of Zn and Cd in various species of wild herbaceous plants at the different
monitoring plots
Another important factor affecting the accumulation of HM by a plant is the particle size distribution of the soil (Burachevskaya et al., 2019). At plots No. 2 and No. 12, represented by alluvial soil, a higher accumulation of Zn and Cd in plants was observed compared to neighboring plots. This dependence was more pronounced in plants of the Poaceae family. Among the Asteraceae family, yarrow and tansy demonstrated this dependency most clearly. Apparently, this was due to the fact that soils of light particle size distribution did not retain the fixing HM well, leaving them in forms available to plants.
The second barrier to HM entry into plants is located at the root system - aboveground part border. It determines the nature of element distribution in the organs of the plant and indicates the internal stability of the plant. The calculated DC values make possible to assess the degree of translocation of elements from the root system to the aerial part of the plants under the study (Table 1). It was established that although Zn translocation from plant roots to the aboveground organs varied depending on the level of anthropogenic load, its general tendencies remained the same for all plant species under study. At monitoring plots experiencing the greatest technogenic stress (No. 4, No. 5 and No. 6), tansy, wormwood, and ragweed were characterized by maximum DC values. The bluegrass was observed at minimum values. At plot No. 9,
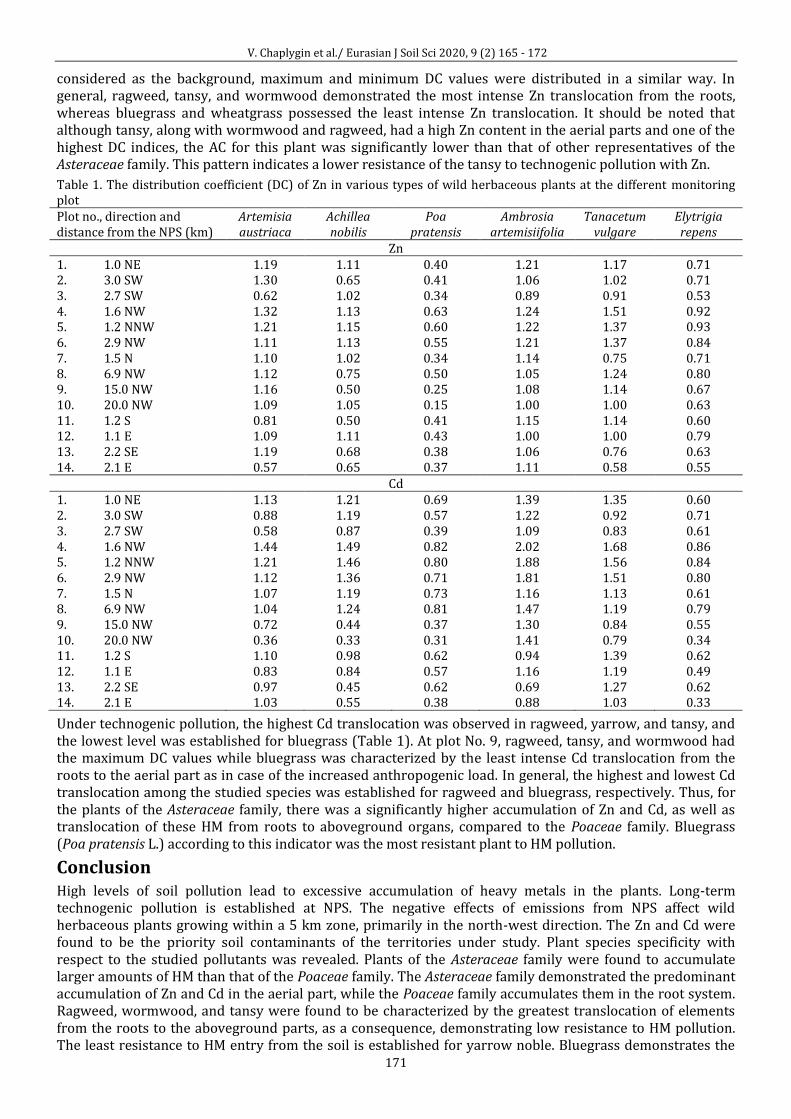
V. Chaplygin et al./ Eurasian J Soil Sci 2020, 9 (2) 165 - 172
171
considered as the background, maximum and minimum DC values were distributed in a similar way. In general, ragweed, tansy, and wormwood demonstrated the most intense Zn translocation from the roots, whereas bluegrass and wheatgrass possessed the least intense Zn translocation. It should be noted that although tansy, along with wormwood and ragweed, had a high Zn content in the aerial parts and one of the highest DC indices, the AC for this plant was significantly lower than that of other representatives of the Asteraceae family. This pattern indicates a lower resistance of the tansy to technogenic pollution with Zn.
Table 1. The distribution coefficient (DC) of Zn in various types of wild herbaceous plants at the different monitoring plot Plot no., direction and distance from the NPS (km)
Artemisia austriaca
Achillea nobilis
Poa pratensis
Ambrosia artemisiifolia
Tanacetum vulgare
Elytrigia repens
Zn 1. 1.0 NE 1.19 1.11 0.40 1.21 1.17 0.71 2. 3.0 SW 1.30 0.65 0.41 1.06 1.02 0.71 3. 2.7 SW 0.62 1.02 0.34 0.89 0.91 0.53 4. 1.6 NW 1.32 1.13 0.63 1.24 1.51 0.92 5. 1.2 NNW 1.21 1.15 0.60 1.22 1.37 0.93 6. 2.9 NW 1.11 1.13 0.55 1.21 1.37 0.84 7. 1.5 N 1.10 1.02 0.34 1.14 0.75 0.71 8. 6.9 NW 1.12 0.75 0.50 1.05 1.24 0.80 9. 15.0 NW 1.16 0.50 0.25 1.08 1.14 0.67 10. 20.0 NW 1.09 1.05 0.15 1.00 1.00 0.63 11. 1.2 S 0.81 0.50 0.41 1.15 1.14 0.60 12. 1.1 E 1.09 1.11 0.43 1.00 1.00 0.79 13. 2.2 SE 1.19 0.68 0.38 1.06 0.76 0.63 14. 2.1 E 0.57 0.65 0.37 1.11 0.58 0.55
Cd 1. 1.0 NE 1.13 1.21 0.69 1.39 1.35 0.60 2. 3.0 SW 0.88 1.19 0.57 1.22 0.92 0.71 3. 2.7 SW 0.58 0.87 0.39 1.09 0.83 0.61 4. 1.6 NW 1.44 1.49 0.82 2.02 1.68 0.86 5. 1.2 NNW 1.21 1.46 0.80 1.88 1.56 0.84 6. 2.9 NW 1.12 1.36 0.71 1.81 1.51 0.80 7. 1.5 N 1.07 1.19 0.73 1.16 1.13 0.61 8. 6.9 NW 1.04 1.24 0.81 1.47 1.19 0.79 9. 15.0 NW 0.72 0.44 0.37 1.30 0.84 0.55 10. 20.0 NW 0.36 0.33 0.31 1.41 0.79 0.34 11. 1.2 S 1.10 0.98 0.62 0.94 1.39 0.62 12. 1.1 E 0.83 0.84 0.57 1.16 1.19 0.49 13. 2.2 SE 0.97 0.45 0.62 0.69 1.27 0.62 14. 2.1 E 1.03 0.55 0.38 0.88 1.03 0.33
Under technogenic pollution, the highest Cd translocation was observed in ragweed, yarrow, and tansy, and the lowest level was established for bluegrass (Table 1). At plot No. 9, ragweed, tansy, and wormwood had the maximum DC values while bluegrass was characterized by the least intense Cd translocation from the roots to the aerial part as in case of the increased anthropogenic load. In general, the highest and lowest Cd translocation among the studied species was established for ragweed and bluegrass, respectively. Thus, for the plants of the Asteraceae family, there was a significantly higher accumulation of Zn and Cd, as well as translocation of these HM from roots to aboveground organs, compared to the Poaceae family. Bluegrass (Poa pratensis L.) according to this indicator was the most resistant plant to HM pollution.
Conclusion High levels of soil pollution lead to excessive accumulation of heavy metals in the plants. Long-term technogenic pollution is established at NPS. The negative effects of emissions from NPS affect wild herbaceous plants growing within a 5 km zone, primarily in the north-west direction. The Zn and Cd were found to be the priority soil contaminants of the territories under study. Plant species specificity with respect to the studied pollutants was revealed. Plants of the Asteraceae family were found to accumulate larger amounts of HM than that of the Poaceae family. The Asteraceae family demonstrated the predominant accumulation of Zn and Cd in the aerial part, while the Poaceae family accumulates them in the root system. Ragweed, wormwood, and tansy were found to be characterized by the greatest translocation of elements from the roots to the aboveground parts, as a consequence, demonstrating low resistance to HM pollution. The least resistance to HM entry from the soil is established for yarrow noble. Bluegrass demonstrates the
V. Chaplygin et al./ Eurasian J Soil Sci 2020, 9 (2) 165 - 172
172
highest resistance to Zn and Cd pollution in terms of the aggregate DC and AC indicators. The light granulometric composition of soil contributed to greater HM availability to plants. Along with general patterns, specific features of Zn and Cd accumulation by plants were revealed. The Cd exhibited a noticeably greater mobility in soils than Zn, which led to a higher level of plant contamination and higher AC values. A successful integrated approach suggested in for studying Zn and Cd accumulation along with consideration of plant barrier functions pave the way to successfully predict the negative effects of technogenic environmental pollution in the future.
Acknowledgments The research was supported by the project of the Ministry of Science and Higher Education of the Russian Federation within the framework of the state task of the Southern Federal University for 2020-2022 (№ FENW-2020-0028).
References Andresen, E., Küpper, H., 2013. Cadmium toxicity in plants. In: Cadmium: from toxicity to essentiality. Sigel, A., Sigel, H.,
Sigel, R.C.O. (Eds.). Springer, Dordrecht. pp. 395-413 Burachevskaya, M., Minkina, T., Mandzhieva, S., Bauer, T., Chaplygin, V., Zamulina, I., Sushkova, S., Fedorenko, A.,
Ghazaryan, K., Movsesyan, H., Makhinya, D., 2019. Study of copper, lead, and zinc speciation in the Haplic Chernozem surrounding coal-fired power plant. Applied Geochemistry 104: 102-108.
Chaplygin, V., Minkina, T., Mandzhieva, S., Burachevskaya, M., Sushkova, S., Poluektov, E., Antonenko, E., Kumacheva, V., 2018. The effect of technogenic emissions on the heavy metals accumulation by herbaceous plants. Environmental Monitoring and Assessment 190(3): 124.
Environmental Bulletin of the Don: On the state of the environment and natural resources of the Rostov region in 2017. 2018. Rostov-on-Don, Russian Federation. 283p. [in Russian].
Ghazaryan, K.A., Movsesyan, H.S., Minkina, T.M., Sushkova, S.N., Rajput, V.D., 2019.. The identification of phytoextraction potential of Melilotus officinalis and Amaranthus retroflexus growing on copper- and molybdenum-polluted soils. Environmental Geochemistry and Health [in press]
GN 2.1.7.2042-06. 2006. Maximum permissible concentrations of chemicals in the soil: Hygienic standards. Rospotrebnadzor, Moscow, Russian Federation. [in Russian].
GN 2.1.7.2511-09. 2009. Approximate permissible concentrations of chemicals in soil: Hygiene standards. Rospotrebnadzor, Moscow, Russian Federation. [in Russian].
Guidelines for the determination of heavy metals in farmland soils and crop production. 1992. Moscow, Russian Federation. TSINAO. 61p. [in Russian].
Ilyin, V.B., Syso, A.I., 2012. Heavy metals and nonmetals in the soil-plant system. Siberian branch RAS publishing House, Novosibirsk. Russian Federation. 220 р. [in Russian].
Kabata-Pendias, A., Pendias, H. (2001). Trace elements in soils and plants. CRC Press, Boca Raton. 403p. Maksimov, N., Evmenyeva, A., Breygina, M. Yermakov, I., 2018. The role of reactive oxygen species in pollen germination
in Picea pungens (blue spruce). Plant Reproduction 31(4): 357-365. Minkina, T.M., Mandzhieva, S.S., Burachevskaya, M.V., Bauer, T.V., Sushkova, S.N., 2018. Method of determining loosely
bound compounds of heavy metals in the soil. MethodsX 5: 217-226. Minkina, T.M., Mandzhieva, S.S., Chaplygin, V.A., Nazarenko, O.G., Maksimov, A.Y., Zamulina, I.V., Burachevskaya, M.V.,
Sushkova, S.N., 2018. Accumulation of heavy metals by forb steppe vegetation according to long-term monitoring data. Arid Ecosystems 8(3): 190-202.
Minkina, T.M., Motuzova, G.V., Mandzhieva, S.S., 2008. Barrier functions of the soil-plant system. Moscow University Soil Science Bulletin 63(2): 45-50.
Nkongolo, K.K., Spiers, G., Beckett, P., Narendrula, R., Theriault, G., Tran, A., Kalubi, K.N., 2013. Long-term effects of liming on soil chemistry in stable and eroded upland areas in a mining region. Water, Air, & Soil Pollution 224(7): 1618.
Plyaskina, O.V., Ladonin, D.V., 2005. Compounds of heavy metals in granulometric fractions of certain soil types. Moscow University Soil Science Bulletin 4:36-43. [in Russian].
Provisional maximum permissible levels (MPL) for some chemical elements and gossypol in forage for farm animals and feed additives, 1987. Moscow, Russian Federation. [in Russian].
Seregin, I.V., Ivanov, V.B., 2001. Physiological aspects of cadmium and lead toxic effects on higher plants. Russian Journal of Plant Physiology 48(4): 523-544.
Shtangeeva, I., Viksna, A., Grebnevs, V., 2020. Geochemical (soil) and phylogenetic (plant taxa) factors affecting accumulation of macro-and trace elements in three natural plant species. Environmental Geochemistry and Health 42(1): 209-219.
Zhao, Z.J., Nan, Z.R., Wang, Z.W., Yang, Y.M., Shimizu, M. (2014). Interaction between Cd and Pb in the soil-plant system: a case study of an arid oasis soil-cole system. Journal of Arid Land 6(1): 59-68.
Zhuikova, T.V., Zinnatova, E.R., 2014. Accumulating capacity of plants in conditions of technogenic soil pollution with heavy metals. Volga Ecological Journal 2: 196-207 [in Russian].
F.Tesfay et al. / Eurasian J Soil Sci 2020, 9 (2) 173 - 185
173
Changes in selected soil properties across a chronosequence of exclosures in the central dry lowlands of Ethiopia
Fikrey Tesfay a,*, Kibebew Kibret a, Aster Gebrekirstos b, Kiros Meles Hadigu c a Haramaya University, School of Natural Resources Management and Environmental Sciences, Dire Dawa, Ethiopia
b World Agroforestry Centre (ICRAF), United Nations Avenue, Nairobi, Kenya c World Agroforestry Centre (ICRAF), ILRI Campus, Addis Ababa, Ethiopia
Abstract Article Info Received : 19.08.2019 Accepted : 12.03.2020
In Ethiopia, rehabilitation of the natural resource-base in degraded lands through area exclosures has become a necessary intervention, albeit empirical studies on the impact of these exclosures are limited. This study was conducted to investigate changes in selected soil properties along exclosures’ age and slope positions in Kewet district, central dry lowlands of Ethiopia. Soil samples were collected from three slope positions of three purposively selected exclosures of 5, 15 and 20 years old and one adjacent open grazing land from 0-10 cm soil depth for analysis of pertinent soil properties. The effect of exclosure age on bulk density, contents of sand, clay, organic carbon, total nitrogen, available phosphorus, CEC, and exchangeable Mg+ and K+ was significant (P<0.05). All exclosures had low bulk density (1.14-1.16 g cm-3) as compared to the grazing land. Higher available water content (173 mm m-1) was recorded in the old exclosure. Soil organic carbon ranged from 2.58% (young exclosure) to 3.37% (middle age exclosure). Soil total nitrogen increased from 0.24-0.34%, while available phosphorus increased from 27-34%, from young to the old exclosure respectively. However, the influence of exclosures’ age on other soil properties was not significant. The young exclosure had the highest CEC (57 cmolc kg-1), whereas the grazing land had the highest total nitrogen and exchangeable Ca2+. From this result, it can be concluded that area exclosures, if managed properly, can improve some of the dynamic soil properties of open degraded grazing lands in the dry lowlands of Ethiopia.
Keywords: Age, degradation, grazing land, restoration, slope position.
© 2020 Federation of Eurasian Soil Science Societies. All rights reserved
Introduction
Land degradation is widely recognized as a global problem occurring in most terrestrial biomes and agro-ecologies (Nkonya et al., 2015). Land degradation refers to processes that diminish the capacity of the land to perform essential functions and services of ecosystems (Hurni et al., 2010). In Ethiopia, land degradation has been identified as the most serious environmental and economic problem (Gebrehiwot and van der Veen, 2013). Deforestation, unsustainable land-use practices on deforested lands (Haile et al., 2006), traditional practice of free grazing and population pressure (Taddese, 2001), limited agricultural inputs per unit area combined with rapid population growth (Nyssen et al., 2009) have been cited as the major contributing factors for land degradation in the Ethiopian highlands.
The disturbance of natural ecosystems in Ethiopia causes widespread soil degradation (soil erosion, nutrient depletion, and salinization) (Girmay et al., 2008), and ecosystem services (Mekuria et al., 2018). Particularly, soil loss, nutrient depletion, and a decline in soil quality are some of the manifestations of land degradation (Haile et al., 2006). Soil fertility depletion is one of the most important consequences of land degradation (Girmay et al., 2008). Land degradation resulted in erosion induced soil carbon depletion at a rate of up to 970 kg ha-1 (Shiferaw et al., 2013). As a result of land degradation due to deforestation, the country loses 30
* Corresponding author. Haramaya University, School of Natural Resources Management and Environmental Sciences, P.O.Box 138 Dire Dawa, Ethiopia Tel.: +251 966816125 E-mail address: [email protected] e-ISSN: 2147-4249 DOI: 10.18393/ejss.707667
F.Tesfay et al. / Eurasian J Soil Sci 2020, 9 (2) 173 - 185
174
kg of nitrogen and 15 - 20 kg of phosphorous ha-1 yr-1 (Haile et al., 2006). The effects of land degradation also include sedimentation of reservoirs and the sediments are prone to gully erosion (Hurni et al., 2010). The average annual rate of deforestation in Ethiopia is estimated to be around 1.25% (FAO, 2015). Therefore, environmental rehabilitation becomes a necessary intervention to combat the fast deterioration of the natural resource base in the country.
Since the 1980s, restoration of degraded lands of steep slopes through interventions that involve area exclosures have been a common practice in many parts of Ethiopia (Descheemaeker et al., 2006b). Area exclosure refers to a practice of land management whereby humans and livestock are excluded from openly accessing severely degraded lands to promote natural regeneration of vegetation cover and foster natural ecological succession (Aerts et al., 2009; Mekuria et al., 2018). Excluding degraded lands from livestock and human interference is commonly performed in two forms; 1) without additional management activities and 2) involving the planting of seedlings, aerial seeding, and construction of soil water and conservation structures (Lemenih and Kassa, 2014). The second form of exclosure speeds up succession through modification of microclimate and soil conditions.
Exclosures are believed to play a significant role in restoring soil fertility, limiting nutrient loss, and reducing soil erosion (Damene et al., 2013; Mekuria et al., 2018). The response of selected soil properties to exclusion of degraded lands from interference depends largely upon plant community composition and climate, and most likely initial soil conditions (Raiesi and Riahi, 2014). Studies have suggested that soil organic carbon (SOC) and total nitrogen (TN) (Damene et al., 2013) and available phosphorus (AP) (Mekuria et al., 2007), were influenced positively by excluding degraded lands from human and livestock interference. The improvement of soil nutrient content is attributed to the high sediment trapping capacity (i.e., relatively fertile) of exclosures (Nyssen et al., 2008).
Rehabilitation efforts of open degraded grazing lands in the Kewet district were initiated in the early 1990s (Bizuayehu and Tefera, 2013). Despite the potential role of exclosures in the recovery of vegetation and improvement of soil nutrients, some studies have indicated that the impact of exclosure on soil properties is not consistent. For example, (Aynekulu et al. 2017) did not find any difference in SOC and TN between exclosure and the adjacent open grazing land. Mekuria et al. (2007) and Raiesi and Riahi (2014) have also reported a lack of difference in soil properties among exclosures and open grazing lands. Slope position is one of the factors that affect soil properties. Mostly, area exclosures are situated at the moderately to very steep slope landscapes (Descheemaeker et al., 2006b) from shoulder to foot slope positions. Studying the change of soil properties along a chronosequence of exclosures and slope position may elucidate the role of exclosures in restoring soil fertility on degraded landscapes. This may create more opportunities to evaluate the effectiveness of area exclosures on the rehabilitation of degraded lands and to improve their management for better ecosystem services in the dry low land areas. Such baseline information is useful to assist policymakers to recognize and consider the value of exclosures as necessary parts of packages of activities in natural resource planning and management (Appanah et al., 2015). Therefore, this study was conducted to investigate the change in some selected soil physical and chemical properties along area exclosures’ ages and slope positions in the central dry lowlands of Ethiopia.
Material and Methods Site description
Kewet district is located at 213 km northeast of Addis Ababa at the foot of the western escarpment of the Ethiopian highlands within the coordinates of 9°49’ and 10°11’ latitude North and 39°45’ to 40°6’ longitude East in the Amhara National Regional State (Figure 1). Elevation of the district ranges from 1062 to 3148 m a.s.l. The area is characterized by a dry lowlands climate with an average annual rainfall of 916 mm and annual mean minimum and maximum temperature of 16 and 310C, respectively (Figure 2). The district covers an area of about 74600 ha of land.
Kewet district is situated at Robit marginal graben (small rifts), which is widely covered by transitional and sub-alkaline basalt with minor rhyolite and trachyte eruptive developed from early Tertiary age basalt rock (Tefera et al., 1996). All alluvial and colluvial deposits that occur in the valley are derived from these rocks. Eutric Cambisols and Pellic Vertisols are the dominant soil groups at the alluvial fan area of the district, while the lower Piedmont areas are dominantly covered by Calaric Gleysols and Calcic Cambisols (Paris, 1986). Over 41 and 26% of the district’s land is covered by cultivated land, and forest and shrubland, respectively.
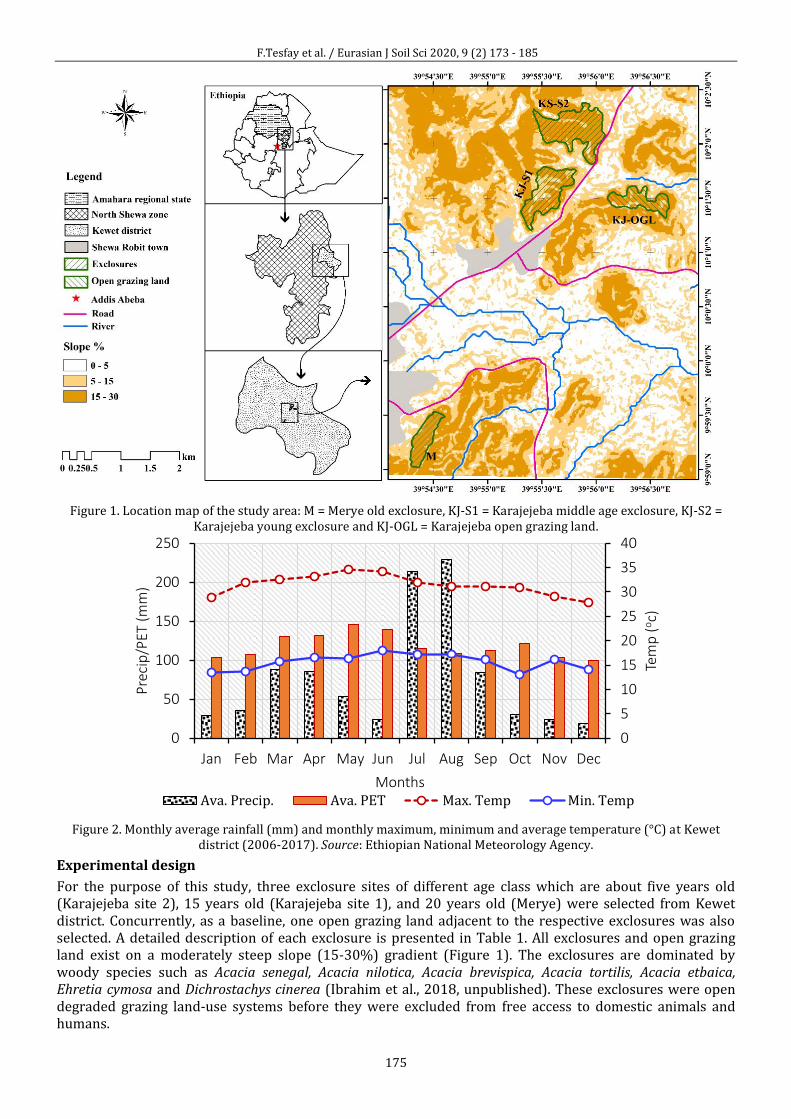
F.Tesfay et al. / Eurasian J Soil Sci 2020, 9 (2) 173 - 185
175
Figure 1. Location map of the study area: M = Merye old exclosure, KJ-S1 = Karajejeba middle age exclosure, KJ-S2 =
Karajejeba young exclosure and KJ-OGL = Karajejeba open grazing land.
Figure 2. Monthly average rainfall (mm) and monthly maximum, minimum and average temperature (°C) at Kewet
district (2006-2017). Source: Ethiopian National Meteorology Agency.
Experimental design
For the purpose of this study, three exclosure sites of different age class which are about five years old (Karajejeba site 2), 15 years old (Karajejeba site 1), and 20 years old (Merye) were selected from Kewet district. Concurrently, as a baseline, one open grazing land adjacent to the respective exclosures was also selected. A detailed description of each exclosure is presented in Table 1. All exclosures and open grazing land exist on a moderately steep slope (15-30%) gradient (Figure 1). The exclosures are dominated by woody species such as Acacia senegal, Acacia nilotica, Acacia brevispica, Acacia tortilis, Acacia etbaica, Ehretia cymosa and Dichrostachys cinerea (Ibrahim et al., 2018, unpublished). These exclosures were open degraded grazing land-use systems before they were excluded from free access to domestic animals and humans.
0
5
10
15
20
25
30
35
40
0
50
100
150
200
250
Jan Feb Mar Apr May Jun Jul Aug Sep Oct Nov Dec
Months
Tem
p (
oc)
Prec
ip/P
ET (
mm
)
Ava. Precip. Ava. PET Max. Temp Min. Temp
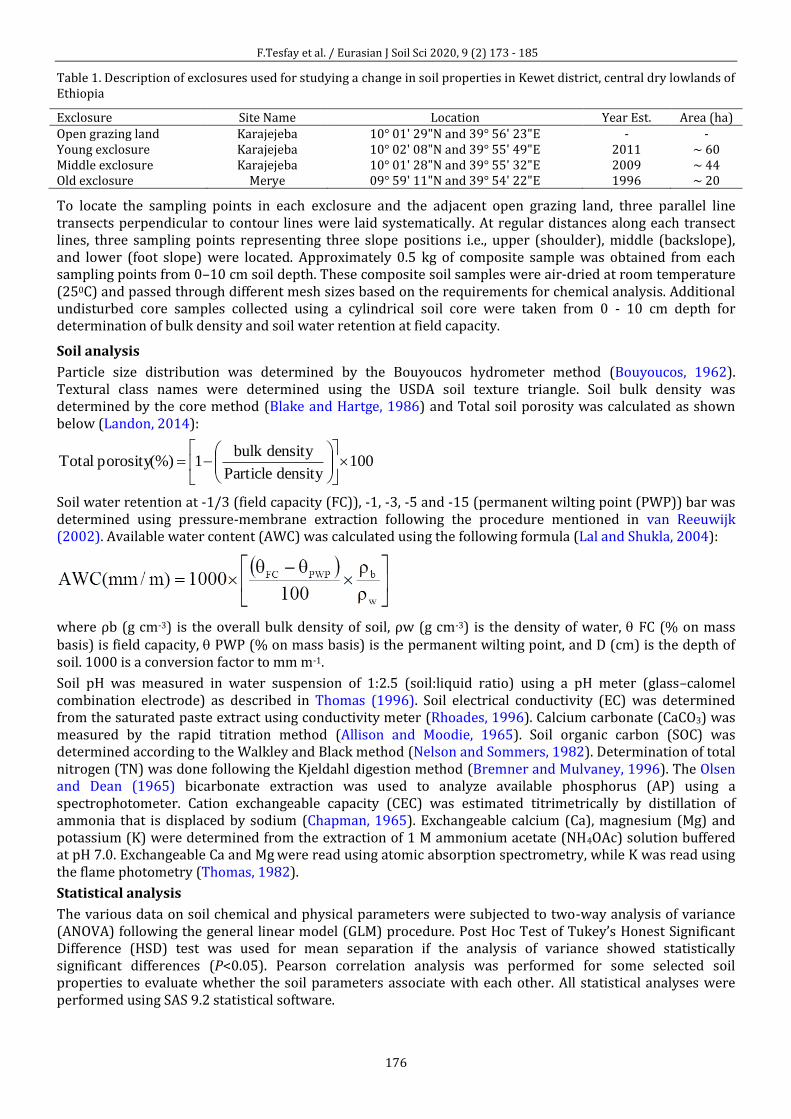
F.Tesfay et al. / Eurasian J Soil Sci 2020, 9 (2) 173 - 185
176
Table 1. Description of exclosures used for studying a change in soil properties in Kewet district, central dry lowlands of Ethiopia
Exclosure Site Name Location Year Est. Area (ha) Open grazing land Karajejeba 10° 01' 29"N and 39° 56' 23"E - - Young exclosure Karajejeba 10° 02' 08"N and 39° 55' 49"E 2011 ~ 60 Middle exclosure Karajejeba 10° 01' 28"N and 39° 55' 32"E 2009 ~ 44 Old exclosure Merye 09° 59' 11"N and 39° 54' 22"E 1996 ~ 20
To locate the sampling points in each exclosure and the adjacent open grazing land, three parallel line transects perpendicular to contour lines were laid systematically. At regular distances along each transect lines, three sampling points representing three slope positions i.e., upper (shoulder), middle (backslope), and lower (foot slope) were located. Approximately 0.5 kg of composite sample was obtained from each sampling points from 0–10 cm soil depth. These composite soil samples were air-dried at room temperature (250C) and passed through different mesh sizes based on the requirements for chemical analysis. Additional undisturbed core samples collected using a cylindrical soil core were taken from 0 - 10 cm depth for determination of bulk density and soil water retention at field capacity.
Soil analysis
Particle size distribution was determined by the Bouyoucos hydrometer method (Bouyoucos, 1962). Textural class names were determined using the USDA soil texture triangle. Soil bulk density was determined by the core method (Blake and Hartge, 1986) and Total soil porosity was calculated as shown below (Landon, 2014):
100densityParticle
densitybulk1(%)porosityTotal
Soil water retention at -1/3 (field capacity (FC)), -1, -3, -5 and -15 (permanent wilting point (PWP)) bar was determined using pressure-membrane extraction following the procedure mentioned in van Reeuwijk (2002). Available water content (AWC) was calculated using the following formula (Lal and Shukla, 2004):
where ρb (g cm-3) is the overall bulk density of soil, ρw (g cm-3) is the density of water, FC (% on mass basis) is field capacity, PWP (% on mass basis) is the permanent wilting point, and D (cm) is the depth of soil. 1000 is a conversion factor to mm m-1.
Soil pH was measured in water suspension of 1:2.5 (soil:liquid ratio) using a pH meter (glass–calomel combination electrode) as described in Thomas (1996). Soil electrical conductivity (EC) was determined from the saturated paste extract using conductivity meter (Rhoades, 1996). Calcium carbonate (CaCO3) was measured by the rapid titration method (Allison and Moodie, 1965). Soil organic carbon (SOC) was determined according to the Walkley and Black method (Nelson and Sommers, 1982). Determination of total nitrogen (TN) was done following the Kjeldahl digestion method (Bremner and Mulvaney, 1996). The Olsen and Dean (1965) bicarbonate extraction was used to analyze available phosphorus (AP) using a spectrophotometer. Cation exchangeable capacity (CEC) was estimated titrimetrically by distillation of ammonia that is displaced by sodium (Chapman, 1965). Exchangeable calcium (Ca), magnesium (Mg) and potassium (K) were determined from the extraction of 1 M ammonium acetate (NH4OAc) solution buffered at pH 7.0. Exchangeable Ca and Mg were read using atomic absorption spectrometry, while K was read using the flame photometry (Thomas, 1982).
Statistical analysis
The various data on soil chemical and physical parameters were subjected to two-way analysis of variance (ANOVA) following the general linear model (GLM) procedure. Post Hoc Test of Tukey’s Honest Significant Difference (HSD) test was used for mean separation if the analysis of variance showed statistically significant differences (P<0.05). Pearson correlation analysis was performed for some selected soil properties to evaluate whether the soil parameters associate with each other. All statistical analyses were performed using SAS 9.2 statistical software.
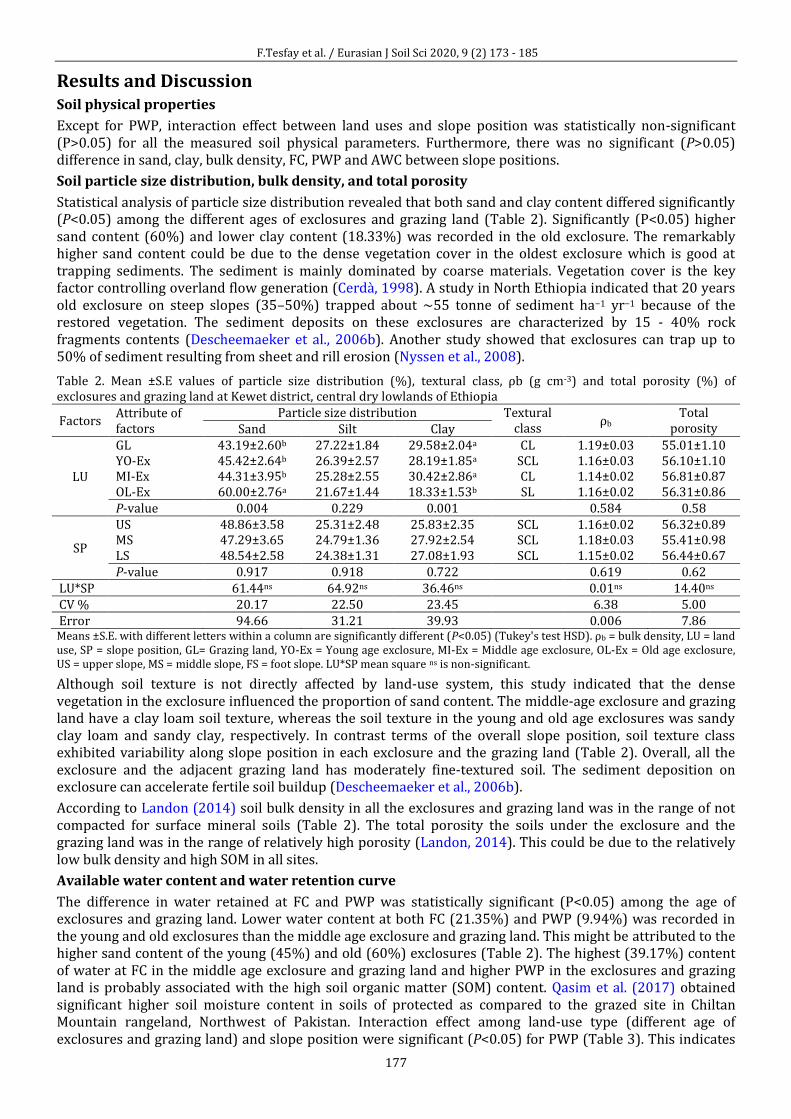
F.Tesfay et al. / Eurasian J Soil Sci 2020, 9 (2) 173 - 185
177
Results and Discussion Soil physical properties
Except for PWP, interaction effect between land uses and slope position was statistically non-significant (P>0.05) for all the measured soil physical parameters. Furthermore, there was no significant (P>0.05) difference in sand, clay, bulk density, FC, PWP and AWC between slope positions.
Soil particle size distribution, bulk density, and total porosity
Statistical analysis of particle size distribution revealed that both sand and clay content differed significantly (P<0.05) among the different ages of exclosures and grazing land (Table 2). Significantly (P<0.05) higher sand content (60%) and lower clay content (18.33%) was recorded in the old exclosure. The remarkably higher sand content could be due to the dense vegetation cover in the oldest exclosure which is good at trapping sediments. The sediment is mainly dominated by coarse materials. Vegetation cover is the key factor controlling overland flow generation (Cerdà, 1998). A study in North Ethiopia indicated that 20 years old exclosure on steep slopes (35–50%) trapped about ~55 tonne of sediment ha−1 yr−1 because of the restored vegetation. The sediment deposits on these exclosures are characterized by 15 - 40% rock fragments contents (Descheemaeker et al., 2006b). Another study showed that exclosures can trap up to 50% of sediment resulting from sheet and rill erosion (Nyssen et al., 2008).
Table 2. Mean ±S.E values of particle size distribution (%), textural class, ρb (g cm-3) and total porosity (%) of exclosures and grazing land at Kewet district, central dry lowlands of Ethiopia
Factors Attribute of factors
Particle size distribution Textural class
ρb Total
porosity Sand Silt Clay
LU
GL 43.19±2.60b 27.22±1.84 29.58±2.04a CL 1.19±0.03 55.01±1.10 YO-Ex 45.42±2.64b 26.39±2.57 28.19±1.85a SCL 1.16±0.03 56.10±1.10 MI-Ex 44.31±3.95b 25.28±2.55 30.42±2.86a CL 1.14±0.02 56.81±0.87 OL-Ex 60.00±2.76a 21.67±1.44 18.33±1.53b SL 1.16±0.02 56.31±0.86 P-value 0.004 0.229 0.001 0.584 0.58
SP
US 48.86±3.58 25.31±2.48 25.83±2.35 SCL 1.16±0.02 56.32±0.89 MS 47.29±3.65 24.79±1.36 27.92±2.54 SCL 1.18±0.03 55.41±0.98 LS 48.54±2.58 24.38±1.31 27.08±1.93 SCL 1.15±0.02 56.44±0.67 P-value 0.917 0.918 0.722 0.619 0.62
LU*SP 61.44ns 64.92ns 36.46ns 0.01ns 14.40ns CV % 20.17 22.50 23.45 6.38 5.00 Error 94.66 31.21 39.93 0.006 7.86 Means ±S.E. with different letters within a column are significantly different (P<0.05) (Tukey's test HSD). ρb = bulk density, LU = land use, SP = slope position, GL= Grazing land, YO-Ex = Young age exclosure, MI-Ex = Middle age exclosure, OL-Ex = Old age exclosure, US = upper slope, MS = middle slope, FS = foot slope. LU*SP mean square ns is non-significant.
Although soil texture is not directly affected by land-use system, this study indicated that the dense vegetation in the exclosure influenced the proportion of sand content. The middle-age exclosure and grazing land have a clay loam soil texture, whereas the soil texture in the young and old age exclosures was sandy clay loam and sandy clay, respectively. In contrast terms of the overall slope position, soil texture class exhibited variability along slope position in each exclosure and the grazing land (Table 2). Overall, all the exclosure and the adjacent grazing land has moderately fine-textured soil. The sediment deposition on exclosure can accelerate fertile soil buildup (Descheemaeker et al., 2006b).
According to Landon (2014) soil bulk density in all the exclosures and grazing land was in the range of not compacted for surface mineral soils (Table 2). The total porosity the soils under the exclosure and the grazing land was in the range of relatively high porosity (Landon, 2014). This could be due to the relatively low bulk density and high SOM in all sites.
Available water content and water retention curve
The difference in water retained at FC and PWP was statistically significant (P<0.05) among the age of exclosures and grazing land. Lower water content at both FC (21.35%) and PWP (9.94%) was recorded in the young and old exclosures than the middle age exclosure and grazing land. This might be attributed to the higher sand content of the young (45%) and old (60%) exclosures (Table 2). The highest (39.17%) content of water at FC in the middle age exclosure and grazing land and higher PWP in the exclosures and grazing land is probably associated with the high soil organic matter (SOM) content. Qasim et al. (2017) obtained significant higher soil moisture content in soils of protected as compared to the grazed site in Chiltan Mountain rangeland, Northwest of Pakistan. Interaction effect among land-use type (different age of exclosures and grazing land) and slope position were significant (P<0.05) for PWP (Table 3). This indicates
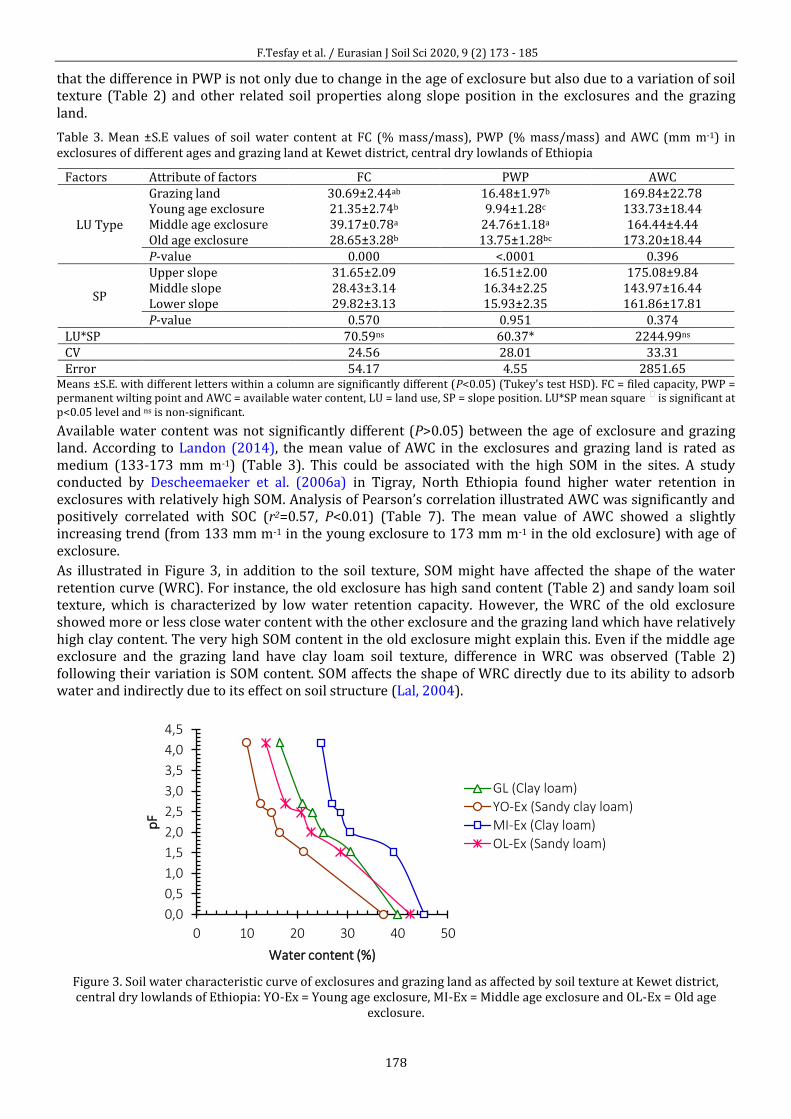
F.Tesfay et al. / Eurasian J Soil Sci 2020, 9 (2) 173 - 185
178
that the difference in PWP is not only due to change in the age of exclosure but also due to a variation of soil texture (Table 2) and other related soil properties along slope position in the exclosures and the grazing land.
Table 3. Mean ±S.E values of soil water content at FC (% mass/mass), PWP (% mass/mass) and AWC (mm m-1) in exclosures of different ages and grazing land at Kewet district, central dry lowlands of Ethiopia
Factors Attribute of factors FC PWP AWC
LU Type
Grazing land 30.69±2.44ab 16.48±1.97b 169.84±22.78 Young age exclosure 21.35±2.74b 9.94±1.28c 133.73±18.44 Middle age exclosure 39.17±0.78a 24.76±1.18a 164.44±4.44 Old age exclosure 28.65±3.28b 13.75±1.28bc 173.20±18.44 P-value 0.000 <.0001 0.396
SP
Upper slope 31.65±2.09 16.51±2.00 175.08±9.84 Middle slope 28.43±3.14 16.34±2.25 143.97±16.44 Lower slope 29.82±3.13 15.93±2.35 161.86±17.81 P-value 0.570 0.951 0.374
LU*SP 70.59ns 60.37* 2244.99ns CV 24.56 28.01 33.31 Error 54.17 4.55 2851.65
Means ±S.E. with different letters within a column are significantly different (P<0.05) (Tukey's test HSD). FC = filed capacity, PWP = permanent wilting point and AWC = available water content, LU = land use, SP = slope position. LU*SP mean square ⁎ is significant at p<0.05 level and ns is non-significant.
Available water content was not significantly different (P>0.05) between the age of exclosure and grazing land. According to Landon (2014), the mean value of AWC in the exclosures and grazing land is rated as medium (133-173 mm m-1) (Table 3). This could be associated with the high SOM in the sites. A study conducted by Descheemaeker et al. (2006a) in Tigray, North Ethiopia found higher water retention in exclosures with relatively high SOM. Analysis of Pearson’s correlation illustrated AWC was significantly and positively correlated with SOC (r2=0.57, P<0.01) (Table 7). The mean value of AWC showed a slightly increasing trend (from 133 mm m-1 in the young exclosure to 173 mm m-1 in the old exclosure) with age of exclosure.
As illustrated in Figure 3, in addition to the soil texture, SOM might have affected the shape of the water retention curve (WRC). For instance, the old exclosure has high sand content (Table 2) and sandy loam soil texture, which is characterized by low water retention capacity. However, the WRC of the old exclosure showed more or less close water content with the other exclosure and the grazing land which have relatively high clay content. The very high SOM content in the old exclosure might explain this. Even if the middle age exclosure and the grazing land have clay loam soil texture, difference in WRC was observed (Table 2) following their variation is SOM content. SOM affects the shape of WRC directly due to its ability to adsorb water and indirectly due to its effect on soil structure (Lal, 2004).
Figure 3. Soil water characteristic curve of exclosures and grazing land as affected by soil texture at Kewet district, central dry lowlands of Ethiopia: YO-Ex = Young age exclosure, MI-Ex = Middle age exclosure and OL-Ex = Old age
exclosure.
0,0
0,5
1,0
1,5
2,0
2,5
3,0
3,5
4,0
4,5
0 10 20 30 40 50
pF
Water content (%)
GL (Clay loam)
YO-Ex (Sandy clay loam)
MI-Ex (Clay loam)
OL-Ex (Sandy loam)
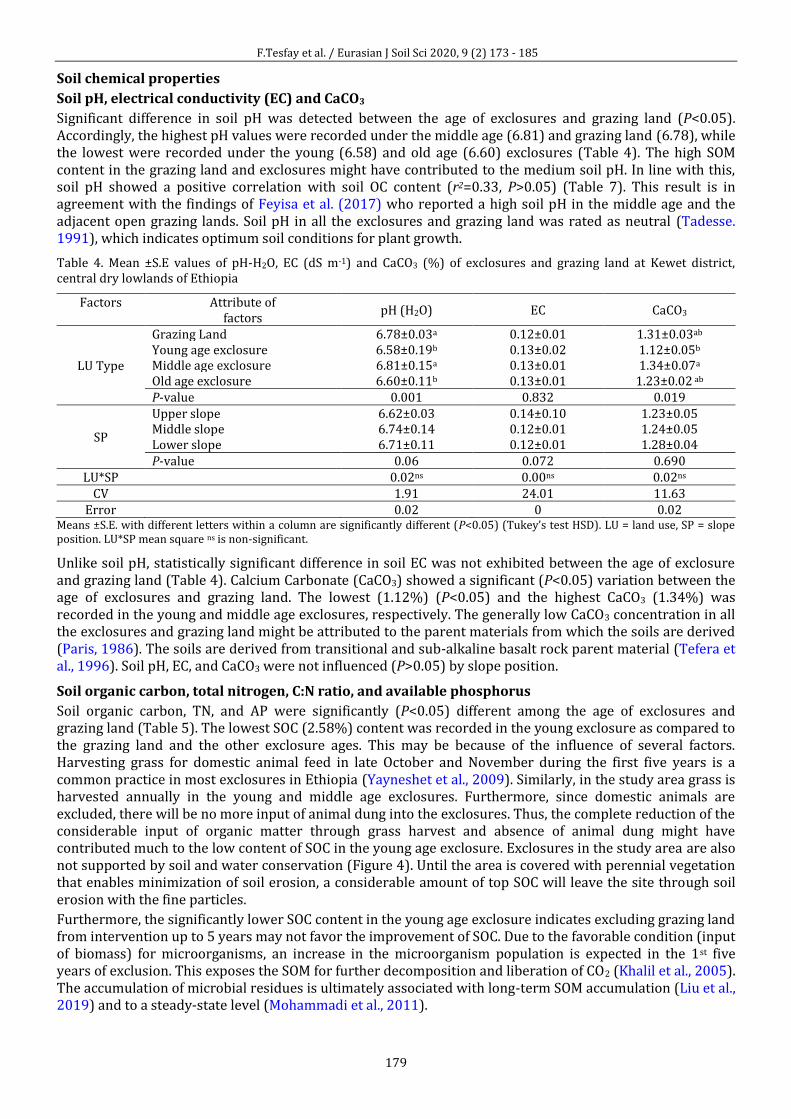
F.Tesfay et al. / Eurasian J Soil Sci 2020, 9 (2) 173 - 185
179
Soil chemical properties
Soil pH, electrical conductivity (EC) and CaCO3
Significant difference in soil pH was detected between the age of exclosures and grazing land (P<0.05). Accordingly, the highest pH values were recorded under the middle age (6.81) and grazing land (6.78), while the lowest were recorded under the young (6.58) and old age (6.60) exclosures (Table 4). The high SOM content in the grazing land and exclosures might have contributed to the medium soil pH. In line with this, soil pH showed a positive correlation with soil OC content (r2=0.33, P>0.05) (Table 7). This result is in agreement with the findings of Feyisa et al. (2017) who reported a high soil pH in the middle age and the adjacent open grazing lands. Soil pH in all the exclosures and grazing land was rated as neutral (Tadesse. 1991), which indicates optimum soil conditions for plant growth.
Table 4. Mean ±S.E values of pH-H2O, EC (dS m-1) and CaCO3 (%) of exclosures and grazing land at Kewet district, central dry lowlands of Ethiopia
Factors Attribute of factors
pH (H2O) EC CaCO3
LU Type
Grazing Land 6.78±0.03a 0.12±0.01 1.31±0.03ab Young age exclosure 6.58±0.19b 0.13±0.02 1.12±0.05b Middle age exclosure 6.81±0.15a 0.13±0.01 1.34±0.07a Old age exclosure 6.60±0.11b 0.13±0.01 1.23±0.02 ab P-value 0.001 0.832 0.019
SP
Upper slope 6.62±0.03 0.14±0.10 1.23±0.05 Middle slope 6.74±0.14 0.12±0.01 1.24±0.05 Lower slope 6.71±0.11 0.12±0.01 1.28±0.04 P-value 0.06 0.072 0.690
LU*SP 0.02ns 0.00ns 0.02ns CV
1.91 24.01 11.63
Error 0.02 0 0.02 Means ±S.E. with different letters within a column are significantly different (P<0.05) (Tukey’s test HSD). LU = land use, SP = slope position. LU*SP mean square ns is non-significant.
Unlike soil pH, statistically significant difference in soil EC was not exhibited between the age of exclosure and grazing land (Table 4). Calcium Carbonate (CaCO3) showed a significant (P<0.05) variation between the age of exclosures and grazing land. The lowest (1.12%) (P<0.05) and the highest CaCO3 (1.34%) was recorded in the young and middle age exclosures, respectively. The generally low CaCO3 concentration in all the exclosures and grazing land might be attributed to the parent materials from which the soils are derived (Paris, 1986). The soils are derived from transitional and sub-alkaline basalt rock parent material (Tefera et al., 1996). Soil pH, EC, and CaCO3 were not influenced (P>0.05) by slope position.
Soil organic carbon, total nitrogen, C:N ratio, and available phosphorus
Soil organic carbon, TN, and AP were significantly (P<0.05) different among the age of exclosures and grazing land (Table 5). The lowest SOC (2.58%) content was recorded in the young exclosure as compared to the grazing land and the other exclosure ages. This may be because of the influence of several factors. Harvesting grass for domestic animal feed in late October and November during the first five years is a common practice in most exclosures in Ethiopia (Yayneshet et al., 2009). Similarly, in the study area grass is harvested annually in the young and middle age exclosures. Furthermore, since domestic animals are excluded, there will be no more input of animal dung into the exclosures. Thus, the complete reduction of the considerable input of organic matter through grass harvest and absence of animal dung might have contributed much to the low content of SOC in the young age exclosure. Exclosures in the study area are also not supported by soil and water conservation (Figure 4). Until the area is covered with perennial vegetation that enables minimization of soil erosion, a considerable amount of top SOC will leave the site through soil erosion with the fine particles.
Furthermore, the significantly lower SOC content in the young age exclosure indicates excluding grazing land from intervention up to 5 years may not favor the improvement of SOC. Due to the favorable condition (input of biomass) for microorganisms, an increase in the microorganism population is expected in the 1st five years of exclusion. This exposes the SOM for further decomposition and liberation of CO2 (Khalil et al., 2005). The accumulation of microbial residues is ultimately associated with long-term SOM accumulation (Liu et al., 2019) and to a steady-state level (Mohammadi et al., 2011).
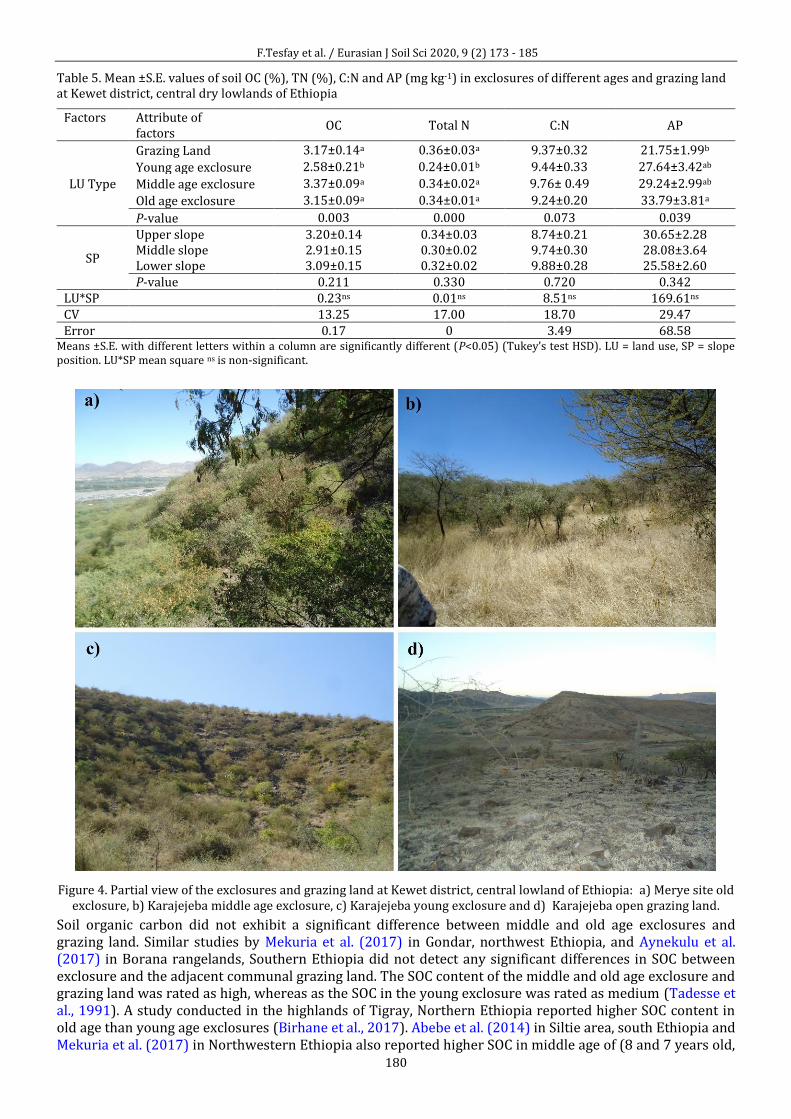
F.Tesfay et al. / Eurasian J Soil Sci 2020, 9 (2) 173 - 185
180
Table 5. Mean ±S.E. values of soil OC (%), TN (%), C:N and AP (mg kg-1) in exclosures of different ages and grazing land at Kewet district, central dry lowlands of Ethiopia
Factors Attribute of factors
OC Total N C:N AP
LU Type
Grazing Land 3.17±0.14a 0.36±0.03a 9.37±0.32 21.75±1.99b
Young age exclosure 2.58±0.21b 0.24±0.01b 9.44±0.33 27.64±3.42ab
Middle age exclosure 3.37±0.09a 0.34±0.02a 9.76± 0.49 29.24±2.99ab
Old age exclosure 3.15±0.09a 0.34±0.01a 9.24±0.20 33.79±3.81a
P-value 0.003 0.000 0.073 0.039
SP
Upper slope 3.20±0.14 0.34±0.03 8.74±0.21 30.65±2.28 Middle slope 2.91±0.15 0.30±0.02 9.74±0.30 28.08±3.64 Lower slope 3.09±0.15 0.32±0.02 9.88±0.28 25.58±2.60 P-value 0.211 0.330 0.720 0.342
LU*SP 0.23ns 0.01ns 8.51ns 169.61ns CV 13.25 17.00 18.70 29.47 Error 0.17 0 3.49 68.58
Means ±S.E. with different letters within a column are significantly different (P<0.05) (Tukey’s test HSD). LU = land use, SP = slope position. LU*SP mean square ns is non-significant.
Figure 4. Partial view of the exclosures and grazing land at Kewet district, central lowland of Ethiopia: a) Merye site old exclosure, b) Karajejeba middle age exclosure, c) Karajejeba young exclosure and d) Karajejeba open grazing land.
Soil organic carbon did not exhibit a significant difference between middle and old age exclosures and grazing land. Similar studies by Mekuria et al. (2017) in Gondar, northwest Ethiopia, and Aynekulu et al. (2017) in Borana rangelands, Southern Ethiopia did not detect any significant differences in SOC between exclosure and the adjacent communal grazing land. The SOC content of the middle and old age exclosure and grazing land was rated as high, whereas as the SOC in the young exclosure was rated as medium (Tadesse et al., 1991). A study conducted in the highlands of Tigray, Northern Ethiopia reported higher SOC content in old age than young age exclosures (Birhane et al., 2017). Abebe et al. (2014) in Siltie area, south Ethiopia and Mekuria et al. (2017) in Northwestern Ethiopia also reported higher SOC in middle age of (8 and 7 years old,
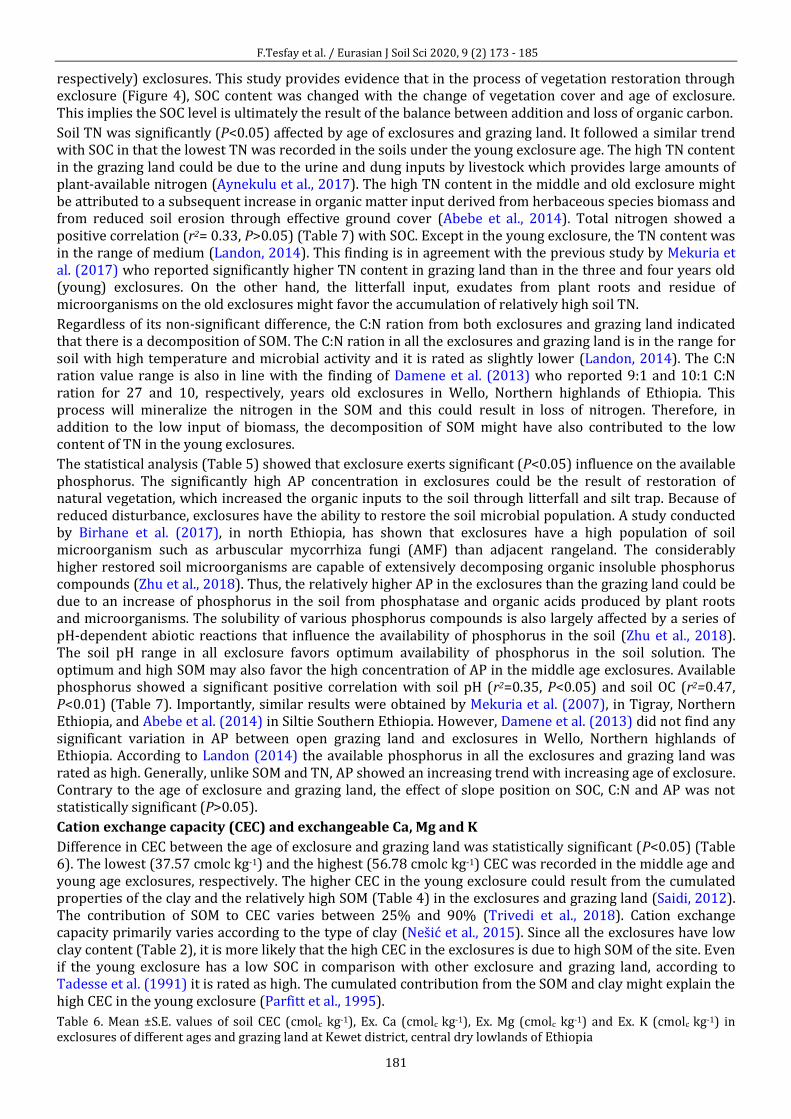
F.Tesfay et al. / Eurasian J Soil Sci 2020, 9 (2) 173 - 185
181
respectively) exclosures. This study provides evidence that in the process of vegetation restoration through exclosure (Figure 4), SOC content was changed with the change of vegetation cover and age of exclosure. This implies the SOC level is ultimately the result of the balance between addition and loss of organic carbon.
Soil TN was significantly (P<0.05) affected by age of exclosures and grazing land. It followed a similar trend with SOC in that the lowest TN was recorded in the soils under the young exclosure age. The high TN content in the grazing land could be due to the urine and dung inputs by livestock which provides large amounts of plant-available nitrogen (Aynekulu et al., 2017). The high TN content in the middle and old exclosure might be attributed to a subsequent increase in organic matter input derived from herbaceous species biomass and from reduced soil erosion through effective ground cover (Abebe et al., 2014). Total nitrogen showed a positive correlation (r2= 0.33, P>0.05) (Table 7) with SOC. Except in the young exclosure, the TN content was in the range of medium (Landon, 2014). This finding is in agreement with the previous study by Mekuria et al. (2017) who reported significantly higher TN content in grazing land than in the three and four years old (young) exclosures. On the other hand, the litterfall input, exudates from plant roots and residue of microorganisms on the old exclosures might favor the accumulation of relatively high soil TN.
Regardless of its non-significant difference, the C:N ration from both exclosures and grazing land indicated that there is a decomposition of SOM. The C:N ration in all the exclosures and grazing land is in the range for soil with high temperature and microbial activity and it is rated as slightly lower (Landon, 2014). The C:N ration value range is also in line with the finding of Damene et al. (2013) who reported 9:1 and 10:1 C:N ration for 27 and 10, respectively, years old exclosures in Wello, Northern highlands of Ethiopia. This process will mineralize the nitrogen in the SOM and this could result in loss of nitrogen. Therefore, in addition to the low input of biomass, the decomposition of SOM might have also contributed to the low content of TN in the young exclosures.
The statistical analysis (Table 5) showed that exclosure exerts significant (P<0.05) influence on the available phosphorus. The significantly high AP concentration in exclosures could be the result of restoration of natural vegetation, which increased the organic inputs to the soil through litterfall and silt trap. Because of reduced disturbance, exclosures have the ability to restore the soil microbial population. A study conducted by Birhane et al. (2017), in north Ethiopia, has shown that exclosures have a high population of soil microorganism such as arbuscular mycorrhiza fungi (AMF) than adjacent rangeland. The considerably higher restored soil microorganisms are capable of extensively decomposing organic insoluble phosphorus compounds (Zhu et al., 2018). Thus, the relatively higher AP in the exclosures than the grazing land could be due to an increase of phosphorus in the soil from phosphatase and organic acids produced by plant roots and microorganisms. The solubility of various phosphorus compounds is also largely affected by a series of pH-dependent abiotic reactions that influence the availability of phosphorus in the soil (Zhu et al., 2018). The soil pH range in all exclosure favors optimum availability of phosphorus in the soil solution. The optimum and high SOM may also favor the high concentration of AP in the middle age exclosures. Available phosphorus showed a significant positive correlation with soil pH (r2=0.35, P<0.05) and soil OC (r2=0.47, P<0.01) (Table 7). Importantly, similar results were obtained by Mekuria et al. (2007), in Tigray, Northern Ethiopia, and Abebe et al. (2014) in Siltie Southern Ethiopia. However, Damene et al. (2013) did not find any significant variation in AP between open grazing land and exclosures in Wello, Northern highlands of Ethiopia. According to Landon (2014) the available phosphorus in all the exclosures and grazing land was rated as high. Generally, unlike SOM and TN, AP showed an increasing trend with increasing age of exclosure. Contrary to the age of exclosure and grazing land, the effect of slope position on SOC, C:N and AP was not statistically significant (P>0.05).
Cation exchange capacity (CEC) and exchangeable Ca, Mg and K
Difference in CEC between the age of exclosure and grazing land was statistically significant (P<0.05) (Table 6). The lowest (37.57 cmolc kg-1) and the highest (56.78 cmolc kg-1) CEC was recorded in the middle age and young age exclosures, respectively. The higher CEC in the young exclosure could result from the cumulated properties of the clay and the relatively high SOM (Table 4) in the exclosures and grazing land (Saidi, 2012). The contribution of SOM to CEC varies between 25% and 90% (Trivedi et al., 2018). Cation exchange capacity primarily varies according to the type of clay (Nešić et al., 2015). Since all the exclosures have low clay content (Table 2), it is more likely that the high CEC in the exclosures is due to high SOM of the site. Even if the young exclosure has a low SOC in comparison with other exclosure and grazing land, according to Tadesse et al. (1991) it is rated as high. The cumulated contribution from the SOM and clay might explain the high CEC in the young exclosure (Parfitt et al., 1995).
Table 6. Mean ±S.E. values of soil CEC (cmolc kg-1), Ex. Ca (cmolc kg-1), Ex. Mg (cmolc kg-1) and Ex. K (cmolc kg-1) in exclosures of different ages and grazing land at Kewet district, central dry lowlands of Ethiopia
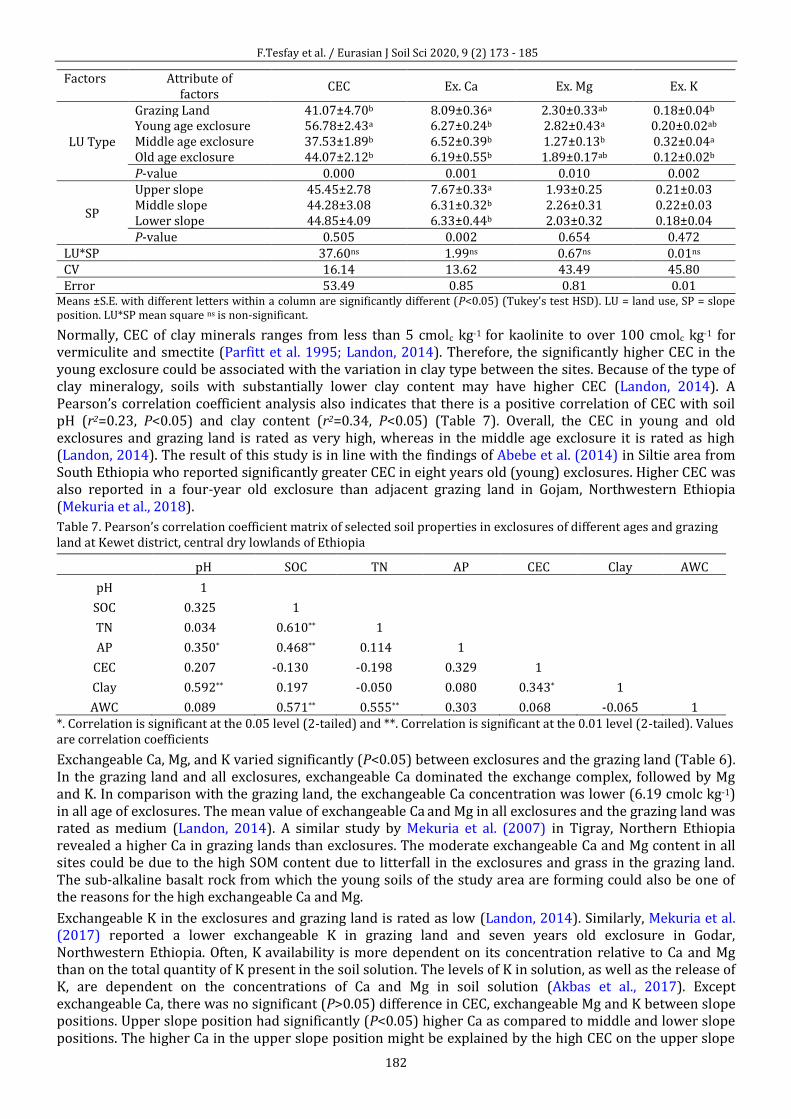
F.Tesfay et al. / Eurasian J Soil Sci 2020, 9 (2) 173 - 185
182
Factors Attribute of factors
CEC Ex. Ca Ex. Mg Ex. K
LU Type
Grazing Land 41.07±4.70b 8.09±0.36a 2.30±0.33ab 0.18±0.04b Young age exclosure 56.78±2.43a 6.27±0.24b 2.82±0.43a 0.20±0.02ab Middle age exclosure 37.53±1.89b 6.52±0.39b 1.27±0.13b 0.32±0.04a Old age exclosure 44.07±2.12b 6.19±0.55b 1.89±0.17ab 0.12±0.02b P-value 0.000 0.001 0.010 0.002
SP
Upper slope 45.45±2.78 7.67±0.33a 1.93±0.25 0.21±0.03 Middle slope 44.28±3.08 6.31±0.32b 2.26±0.31 0.22±0.03 Lower slope 44.85±4.09 6.33±0.44b 2.03±0.32 0.18±0.04 P-value 0.505 0.002 0.654 0.472
LU*SP 37.60ns 1.99ns 0.67ns 0.01ns CV 16.14 13.62 43.49 45.80 Error 53.49 0.85 0.81 0.01
Means ±S.E. with different letters within a column are significantly different (P<0.05) (Tukey's test HSD). LU = land use, SP = slope position. LU*SP mean square ns is non-significant.
Normally, CEC of clay minerals ranges from less than 5 cmolc kg-1 for kaolinite to over 100 cmolc kg-1 for vermiculite and smectite (Parfitt et al. 1995; Landon, 2014). Therefore, the significantly higher CEC in the young exclosure could be associated with the variation in clay type between the sites. Because of the type of clay mineralogy, soils with substantially lower clay content may have higher CEC (Landon, 2014). A Pearson’s correlation coefficient analysis also indicates that there is a positive correlation of CEC with soil pH (r2=0.23, P<0.05) and clay content (r2=0.34, P<0.05) (Table 7). Overall, the CEC in young and old exclosures and grazing land is rated as very high, whereas in the middle age exclosure it is rated as high (Landon, 2014). The result of this study is in line with the findings of Abebe et al. (2014) in Siltie area from South Ethiopia who reported significantly greater CEC in eight years old (young) exclosures. Higher CEC was also reported in a four-year old exclosure than adjacent grazing land in Gojam, Northwestern Ethiopia (Mekuria et al., 2018).
Table 7. Pearson’s correlation coefficient matrix of selected soil properties in exclosures of different ages and grazing land at Kewet district, central dry lowlands of Ethiopia
pH SOC TN AP CEC Clay AWC
pH 1 SOC 0.325** 1
TN 0.034** 0.610** 1 AP 0.350** 0.468** 0.114** 1
CEC 0.207** -0.130*** -0.198*** 0.329 1 Clay 0.592** 0.197** -0.050*** 0.080 0.343** 1
AWC 0.089** 0.571** 0.555** 0.303 0.068** -0.065 1 *. Correlation is significant at the 0.05 level (2-tailed) and **. Correlation is significant at the 0.01 level (2-tailed). Values are correlation coefficients
Exchangeable Ca, Mg, and K varied significantly (P<0.05) between exclosures and the grazing land (Table 6). In the grazing land and all exclosures, exchangeable Ca dominated the exchange complex, followed by Mg
and K. In comparison with the grazing land, the exchangeable Ca concentration was lower (6.19 cmolc kg-1) in all age of exclosures. The mean value of exchangeable Ca and Mg in all exclosures and the grazing land was rated as medium (Landon, 2014). A similar study by Mekuria et al. (2007) in Tigray, Northern Ethiopia revealed a higher Ca in grazing lands than exclosures. The moderate exchangeable Ca and Mg content in all sites could be due to the high SOM content due to litterfall in the exclosures and grass in the grazing land. The sub-alkaline basalt rock from which the young soils of the study area are forming could also be one of the reasons for the high exchangeable Ca and Mg.
Exchangeable K in the exclosures and grazing land is rated as low (Landon, 2014). Similarly, Mekuria et al. (2017) reported a lower exchangeable K in grazing land and seven years old exclosure in Godar, Northwestern Ethiopia. Often, K availability is more dependent on its concentration relative to Ca and Mg than on the total quantity of K present in the soil solution. The levels of K in solution, as well as the release of K, are dependent on the concentrations of Ca and Mg in soil solution (Akbas et al., 2017). Except exchangeable Ca, there was no significant (P>0.05) difference in CEC, exchangeable Mg and K between slope positions. Upper slope position had significantly (P<0.05) higher Ca as compared to middle and lower slope positions. The higher Ca in the upper slope position might be explained by the high CEC on the upper slope
F.Tesfay et al. / Eurasian J Soil Sci 2020, 9 (2) 173 - 185
183
position. This result is in line with the study of Moges and Holden (2008) in Southern Ethiopia which revealed higher Ca on upper slope position. In Gerado catchment, Northeastern Ethiopia, slope gradient was found to be the major factor that affects the variation of exchangeable Ca (Asmamaw and Mohammed, 2013).
Conclusion This study generated clear evidence on the importance of exclosure in improving soil properties on degraded landscapes in the central dry lowlands of Ethiopia. Most soil parameters showed a change along chronosequence of exclosures. Nevertheless, almost all the measured soil properties were not affected by slope position. It seemed that the impact of slope position is masked by vegetation coverage in the exclosures. It can be concluded that soil properties such as SOC, TN and AP can be influenced positively by excluding open degraded grazing land from unmanaged human and domestic animal intervention for a longer period of time to ensure remarkable rehabilitation. It should be noted that the current study only focused on the effect of exclosure age and slope positions on some selected soil properties. To deeply understand exclosure’s influence on soil fertility and understand its carbon sequestration potential, further analysis of other aspects of soil characteristics such as soil aggregate size distribution, water-stable aggregates, soil carbon stock, and soil microbial biomass is recommended.
Acknowledgments The Federal Ministry of Education of Ethiopia is duly acknowledged for financing the research work through Debre Birhan University and for sponsoring Mr. Fikrey Tesfay to pursue his Ph.D. study at Haramaya University, Ethiopia.
References
Abebe, T., Feyssa, D.H., Kissi, E., 2014. Area exclosure as a strategy to restore soil fertility status in degraded land in southern Ethiopia. Journal of Biological and Chemical Research 31(1): 482–494.
Aerts, R., Nyssen, J., Haile, M., 2009. On the difference between “exclosures” and “enclosures” in ecology and the environment. Journal of Arid Environments 73(8): 762–763.
Akbas, F., Gunal, H., Acir, N., 2017. Spatial variability of soil potassium and its relationship to land use and parent material. Soil and Water Research 12(4): 202–211.
Allison, L.E., Moodie, C.D., 1965. Carbonate. In: Methods of Soil Analysis. Part 2 Chemical and Microbiological Properties, Norman, A.G., (Ed.). American Society of Agronomy - Soil Science Society of America, WI, USA. pp. 1379–1396.
Appanah, S., Shono, K., Durst, P.B., 2015. Restoration of forests and degraded lands in Southeast Asia. Unasylva - An International Journal of Forestry and Forest Industries 66(245): 52–63.
Asmamaw, L.B., Mohammed, A.A., 2013. Effects of slope gradient and changes in land use/cover on selected soil physico-biochemical properties of the Gerado catchment, north-eastern Ethiopia. International Journal of Environmental Studies 70(1): 111–125.
Aynekulu, E., Mekuria, W., Tsegaye, D., Feyissa, K., Angassa, A., Leeuw, J.De, Shepherd, K., 2017. Long-term livestock exclosure did not affect soil carbon in southern Ethiopian rangelands. Geoderma 307: 1–7.
Birhane, E., Aregawi, K., Giday, K., 2017. Changes in arbuscular mycorrhiza fungi spore density and root colonization of woody plants in response to exclosure age and slope position in the highlands of Tigray, Northern Ethiopia. Journal of Arid Environments 142: 1–10.
Bizuayehu, S., Tefera, B., 2013. Assessment on the socioeconomics aspects of area enclosures in North Shewa Zone: The case of Kewote and Basona Worena woredas. Proceedings of the 5th Annual Regional Conference on Completed Research Activities of 2010 and 2011. Amhara Agricultural Research Institute. Bahir Dar, Ethiopia. pp. 72-85.
Blake, G.R., Hartge, K.H., 1986. Bulk density. In: Methods of Soil Analysis, Part 1 Physical and Mineralogical Methods, Klute A., (Ed.). American Society of Agronomy-Soil Science Society of America, Madison, WI, USA. pp. 363–375.
Bouyoucos, G.J., 1962. Hydrometer method improved for making particle size analyses of soils. Agronomy Journal 54(5): 464–465.
Bremner, J.M., Mulvaney, C.S., 1996. Nitrogen-Total. In: Methods of Soil Analysis. Part 3 Chemical Methods. Bigham J.M., (Ed.). American Society of Agronomy - Soil Science Society of America, WI, USA. pp. 1085–1121.
Cerdà, A., 1998. The influence of geomorphological position and vegetation cover on the erosional and hydrological processes on a Mediterranean hillslope. Hydrological Processes 12(4): 661–671.
Chapman, H.D., 1965. Cation exchange capacity. In: Methods of Soil Analysis. Part 2 Chemical and Microbiological Properties, Norman, A.G., (Ed.). American Society of Agronomy - Soil Science Society of America, WI, USA. pp. 891–901.
Damene, S., Tamene, L., Vlek, P.L.G., 2013. Performance of exclosure in restoring soil fertility: A case of Gubalafto district in North Wello Zone, northern highlands of Ethiopia. Catena 101: 136–142.
Descheemaeker, K., Nyssen, J., Poesen, J., Raes, D., Haile, M., Muys, B., Deckers, S., 2006a. Runoff on slopes with restoring vegetation: A case study from the Tigray highlands, Ethiopia. Journal of Hydrology 331(1–2): 219–241.
F.Tesfay et al. / Eurasian J Soil Sci 2020, 9 (2) 173 - 185
184
Descheemaeker, K., Nyssen, J., Rossi, J., Poesen, J., Haile, M., Raes, D., Muys, B., Moeyersons, J., Deckers, S., 2006b. Sediment deposition and pedogenesis in exclosures in the Tigray highlands, Ethiopia. Geoderma 132(3–4): 291–314.
FAO, 2015. Global Forest Resources Assessment (FRA)-Country Report, Ethiopia. Rome, Italy. Available at [Access date: 19.08.2019]: http://www.fao.org/3/a-az209e.pdf
Feyisa, K., Beyene, S., Angassa, A., Said, M. Y., de Leeuw, J., Abebe, A., Megersa, B., 2017. Effects of enclosure management on carbon sequestration, soil properties and vegetation attributes in East African rangelands. Catena 159: 9–19.
Gebrehiwot, T., van der Veen, A., 2013. Climate change vulnerability in Ethiopia: disaggregation of Tigray Region. Journal of Eastern African Studies, 7(4): 607–629.
Girmay, G., Singh, B. R., Mitiku, H., Borresen, T., Lal, R., 2008. Carbon stocks in Ethiopian soils in relation to land use and soil management. Land Degradation and Development 19(4): 351–367.
Haile, M., Herweg, K., Stillhardt, B., 2006. Sustainable Land Management – A New Approach to Soil and Water Conservation in Ethiopia. Mekelle University, Ethiopia. 305p.
Hurni, H., Solomon, A., Amare, B., Berhanu, D., Ludi, E., Portner, B., Birru, Y., Gete, Z., 2010. Land degradation and sustainable land management in the highlands of Ethiopia. In: Global Change and Sustainable Development: A Synthesis of Regional Experiences from Research Partnerships, Hurni, H., Wiesmann, U. (Eds). Vol. 5. Bern: Geographica Bernensia: Perspectives of the Swiss National Centre of Competence in Research (NCCR) North-South, University of Bern, pp. 187–207.
Khalil, M.I., Hossain, M.B., Schmidhalter, U., 2005. Carbon and nitrogen mineralization in different upland soils of the subtropics treated with organic materials. Soil Biology and Biochemistry 37(8): 1507–1518.
Lal, R., 2004. Soil carbon sequestration to mitigate climate change. Geoderma 123(1–2): 1–22. Lal, R., Shukla, M.K., 2004. Principles of Soil Physics. New York, USA. 699p. Landon, J.R., 2014. Booker tropical soil manual: A handbook for soil survey and agricultural land evaluation in the
tropics and subtropics. Routledge, New York, USA. 531p. Lemenih, M., Kassa, H., 2014. Re-greening Ethiopia: history, challenges and lessons. Forests 5(8): 1896–1909. Liu, X., Zhou, F., Hu, G., Shao, S., He, H., Zhang, W., Zhang, X., Li, L., 2019. Dynamic contribution of microbial residues to
soil organic matter accumulation influenced by maize straw mulching. Geoderma 333: 35–42. Mekuria, W., Langan, S., Noble, A., Johnston, R., 2017. Soil restoration after seven years of exclosure management in
northwestern Ethiopia. Land Degradation and Development 28(4): 1287–1297. Mekuria, W., Veldkamp, E., Haile, M., Nyssen, J., Muys, B., Gebrehiwot, K., 2007. Effectiveness of exclosures to restore
degraded soils as a result of overgrazing in Tigray, Ethiopia. Journal of Arid Environments 69(2): 270–284. Mekuria, W., Wondie, M., Amare, T., Wubet, A., Feyisa, T., Yitaferu, B., 2018. Restoration of degraded landscapes for
ecosystem services in North-Western Ethiopia. Heliyon 4(8): e00764. Moges, A., Holden, N. M., 2008. Soil fertility in relation to slope position and agricultural land use: A case study of
umbulo catchment in Southern Ethiopia. Environmental Management 42(5): 753–763. Mohammadi, K., Heidari, G., Khalesro, S., Sohrabi, Y., 2011. Soil management, microorganisms and organic matter
interactions: A review. African Journal of Biotechnology 10(86): 19840–19849. Nelson, D.W., Sommers, L.E., 1982. Total carbon, organic carbon, and organic matter. In: Methods of Soil Analysis, Part 2.
Chemical and Microbiological Properties. Page, A.L, Miller, R.H., Keeney, D.R. (Eds.). 2nd Edition. Agronomy Monograph, vol. 9. American Society of Agronomy - Soil Science Society of America, WI, USA. pp. 593–579.
Nešić, L., Vasin, J., Belić, M., Ćirić, V., Gligorijević, J., Milunović, K., Sekulić, P., 2015. The colloid fraction and cation-exchange capacity in the soils of Vojvodina, Serbia. Ratarstvo i povrtarstvo 52(1): 18–23.
Nkonya, E., Mirzabaev, A., von Braun, J., 2015. Economics of land degradation and improvement - A global assessment for sustainable development. Springer International Publishing, Switzerland. 695p.
Nyssen, J., Poesen, J., Moeyersons, J., Haile, M., Deckers, J., 2008. Dynamics of soil erosion rates and controlling factors in the Northern Ethiopian highlands - Towards a sediment budget. Earth Surface Processes and Landforms 33(5): 695–711.
Nyssen, J., Simegn, G., Taha, N., 2009. An upland farming system under transformation: Proximate causes of land use change in Bela-Welleh catchment (Wag, Northern Ethiopian Highlands). Soil and Tillage Research 103(2): 231–238.
Olsen, S.R., Dean, L.A., 1965. Phosphorus. In: Methods of Soil Analysis. Part 2. Chemical and Microbiological Properties, Norman, A.G., (Ed.). American Society of Agronomy - Soil Science Society of America, WI, USA. pp. 1035–1049.
Parfitt, R.L., Giltrap, D.J., Whitton, J.S., 1995. Contribution of organic matter and clay minerals to the cation exchange capacity of soils. Communications in Soil Science and Plant Analysis 26(9–10): 1343–1355.
Paris, S., 1986. Reconnaissance Soil Survey and Land Evaluation for Irrigation Purposes of an area near Robit Shewa. National Water Resource Commission, Water Resource Development Authority of Ethiopia. Addis Ababa, Ethiopia.
Qasim, S., Gul, S., Shah, M.H., Hussain, F., Ahmad, S., Islam, M., Rehman, G., Yaqoob, M., Shah, S.Q., 2017. Influence of grazing exclosure on vegetation biomass and soil quality. International Soil and Water Conservation Research 5(1): 62–68.
Raiesi, F., Riahi, M., 2014. The influence of grazing exclosure on soil C stocks and dynamics, and ecological indicators in upland arid and semi-arid rangelands. Ecological Indicators 41: 145–154.
F.Tesfay et al. / Eurasian J Soil Sci 2020, 9 (2) 173 - 185
185
Rhoades, J.D., 1996. Salinity: electrical conductivity and total dissolved solids. In: Methods of Soil Analysis Part 3. Chemical Methods. Bigham J.M., (Ed.). American Society of Agronomy - Soil Science Society of America, WI, USA. pp. 417–435.
Saidi, D., 2012. Importance and role of cation exchange capacity on the physical’s properties of the Cheliff saline soils (Algeria). Procedia Engineering 33: 435–449.
Shiferaw, A., Hurni, H., Zeleke, G., 2013. A review on soil carbon sequestration in Ethiopia to mitigate land degradation and climate change. Journal of Environment and Earth Science 3(12): 187–200.
Taddese, G., 2001. Land degradation: A challenge to Ethiopia. Environmental Management 27(6): 815–824. Tadesse, T., Haque, I., Aduayi, E.A., 1991. Soil, plant, water, fertilizer, animal manure and compost analysis manual.
Addis Ababa, Ethiopia. Tefera, M., Chernet, T., Haro, W., 1996. Geological Map of Ethiopia. Topographic Base Map, scale 1:2,000,000. Ministry of
Mines, Geological Survey of Ethiopia. Addis Abeba, Ethiopia. Thomas, G. W., 1996. Soil pH and soil acidity. In: Methods of Soil Analysis Part 3. Chemical Methods. Bigham J.M., (Ed.).
American Society of Agronomy - Soil Science Society of America, WI, USA. pp. 475–490. Thomas, G.W., 1982. Exchangeable cations. In: Methods of Soil Analysis. Part 2. Chemical and Microbiological Properties,
Norman, A.G., (Ed.). American Society of Agronomy - Soil Science Society of America, WI, USA. pp. 159–165. Trivedi, P., Singh, B.P., Singh, B.K., 2018. Soil carbon: introduction, importance, status, threat, and mitigation. In: Soil
Carbon Storage, Singh, B.K. (Ed.). Elsevier Inc., USA, pp 1–28. van Reeuwijk, L.P., 2002. Procedures for Soil Analysis: Technical Paper 9. 6th ed. International Soil Reference and
Information Centre. Wageningen, The Netherlands. Yayneshet, T., Eik, L.O., Moe, S.R., 2009. Seasonal variations in the chemical composition and dry matter degradability of
exclosure forages in the semi-arid region of northern Ethiopia. Animal Feed Science and Technology 148(1): 12–33.
Zhu, J., Li, M., Whelan, M., 2018. Phosphorus activators contribute to legacy phosphorus availability in agricultural soils: A review. Science of the Total Environment 612: 522–537.
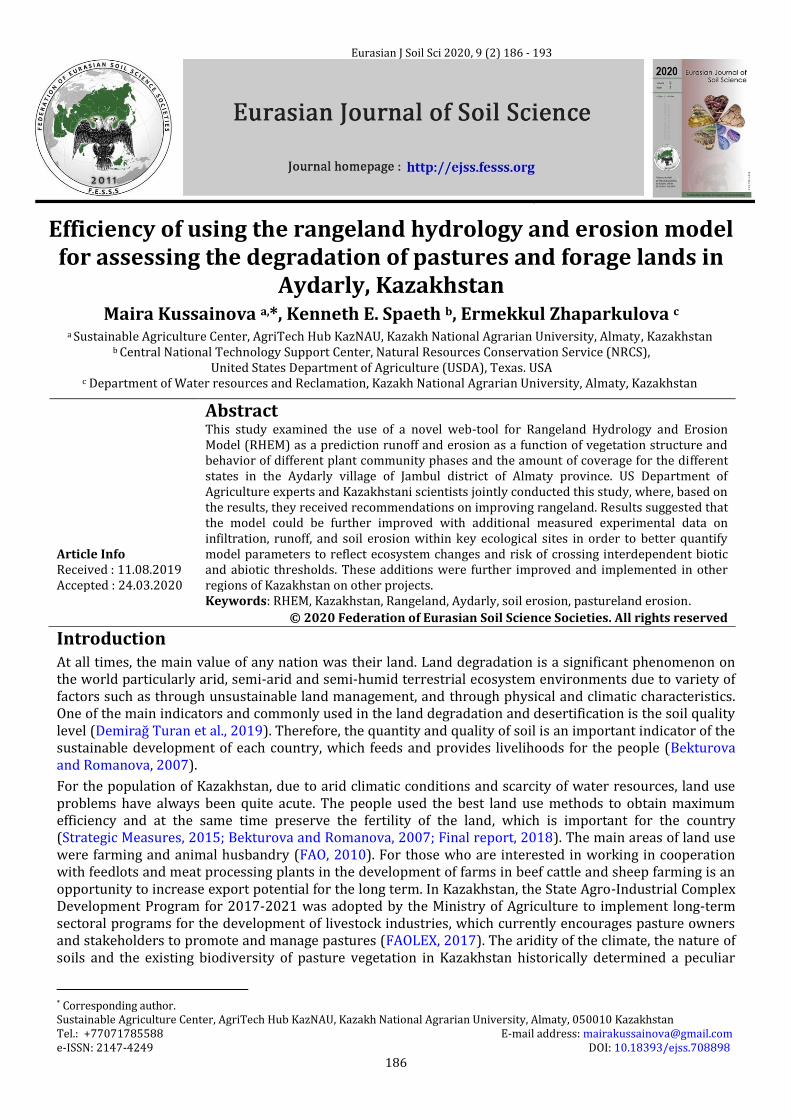
M. Kussainova et al./ Eurasian J Soil Sci 2020, 9 (2) 186 - 193
186
Efficiency of using the rangeland hydrology and erosion model for assessing the degradation of pastures and forage lands in
Aydarly, Kazakhstan Maira Kussainova a,*, Kenneth E. Spaeth b, Ermekkul Zhaparkulova c
a Sustainable Agriculture Center, AgriTech Hub KazNAU, Kazakh National Agrarian University, Almaty, Kazakhstan b Central National Technology Support Center, Natural Resources Conservation Service (NRCS),
United States Department of Agriculture (USDA), Texas. USA c Department of Water resources and Reclamation, Kazakh National Agrarian University, Almaty, Kazakhstan
Abstract Article Info Received : 11.08.2019 Accepted : 24.03.2020
This study examined the use of a novel web-tool for Rangeland Hydrology and Erosion Model (RHEM) as a prediction runoff and erosion as a function of vegetation structure and behavior of different plant community phases and the amount of coverage for the different states in the Aydarly village of Jambul district of Almaty province. US Department of Agriculture experts and Kazakhstani scientists jointly conducted this study, where, based on the results, they received recommendations on improving rangeland. Results suggested that the model could be further improved with additional measured experimental data on infiltration, runoff, and soil erosion within key ecological sites in order to better quantify model parameters to reflect ecosystem changes and risk of crossing interdependent biotic and abiotic thresholds. These additions were further improved and implemented in other regions of Kazakhstan on other projects.
Keywords: RHEM, Kazakhstan, Rangeland, Aydarly, soil erosion, pastureland erosion.
© 2020 Federation of Eurasian Soil Science Societies. All rights reserved
Introduction At all times, the main value of any nation was their land. Land degradation is a significant phenomenon on the world particularly arid, semi-arid and semi-humid terrestrial ecosystem environments due to variety of factors such as through unsustainable land management, and through physical and climatic characteristics. One of the main indicators and commonly used in the land degradation and desertification is the soil quality level (Demirağ Turan et al., 2019). Therefore, the quantity and quality of soil is an important indicator of the sustainable development of each country, which feeds and provides livelihoods for the people (Bekturova and Romanova, 2007).
For the population of Kazakhstan, due to arid climatic conditions and scarcity of water resources, land use problems have always been quite acute. The people used the best land use methods to obtain maximum efficiency and at the same time preserve the fertility of the land, which is important for the country (Strategic Measures, 2015; Bekturova and Romanova, 2007; Final report, 2018). The main areas of land use were farming and animal husbandry (FAO, 2010). For those who are interested in working in cooperation with feedlots and meat processing plants in the development of farms in beef cattle and sheep farming is an opportunity to increase export potential for the long term. In Kazakhstan, the State Agro-Industrial Complex Development Program for 2017-2021 was adopted by the Ministry of Agriculture to implement long-term sectoral programs for the development of livestock industries, which currently encourages pasture owners and stakeholders to promote and manage pastures (FAOLEX, 2017). The aridity of the climate, the nature of soils and the existing biodiversity of pasture vegetation in Kazakhstan historically determined a peculiar
* Corresponding author. Sustainable Agriculture Center, AgriTech Hub KazNAU, Kazakh National Agrarian University, Almaty, 050010 Kazakhstan Tel.: +77071785588 E-mail address: [email protected] e-ISSN: 2147-4249 DOI: 10.18393/ejss.708898
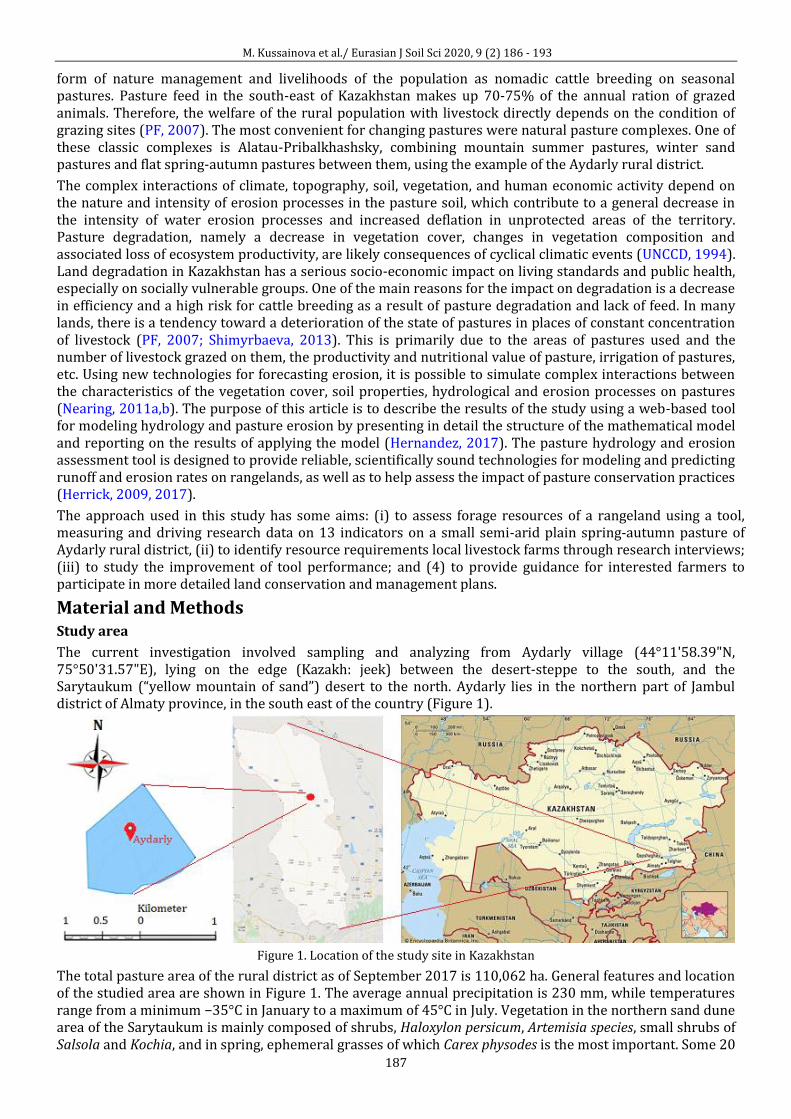
M. Kussainova et al./ Eurasian J Soil Sci 2020, 9 (2) 186 - 193
187
form of nature management and livelihoods of the population as nomadic cattle breeding on seasonal pastures. Pasture feed in the south-east of Kazakhstan makes up 70-75% of the annual ration of grazed animals. Therefore, the welfare of the rural population with livestock directly depends on the condition of grazing sites (PF, 2007). The most convenient for changing pastures were natural pasture complexes. One of these classic complexes is Alatau-Pribalkhashsky, combining mountain summer pastures, winter sand pastures and flat spring-autumn pastures between them, using the example of the Aydarly rural district.
The complex interactions of climate, topography, soil, vegetation, and human economic activity depend on the nature and intensity of erosion processes in the pasture soil, which contribute to a general decrease in the intensity of water erosion processes and increased deflation in unprotected areas of the territory. Pasture degradation, namely a decrease in vegetation cover, changes in vegetation composition and associated loss of ecosystem productivity, are likely consequences of cyclical climatic events (UNCCD, 1994). Land degradation in Kazakhstan has a serious socio-economic impact on living standards and public health, especially on socially vulnerable groups. One of the main reasons for the impact on degradation is a decrease in efficiency and a high risk for cattle breeding as a result of pasture degradation and lack of feed. In many lands, there is a tendency toward a deterioration of the state of pastures in places of constant concentration of livestock (PF, 2007; Shimyrbaeva, 2013). This is primarily due to the areas of pastures used and the number of livestock grazed on them, the productivity and nutritional value of pasture, irrigation of pastures, etc. Using new technologies for forecasting erosion, it is possible to simulate complex interactions between the characteristics of the vegetation cover, soil properties, hydrological and erosion processes on pastures (Nearing, 2011a,b). The purpose of this article is to describe the results of the study using a web-based tool for modeling hydrology and pasture erosion by presenting in detail the structure of the mathematical model and reporting on the results of applying the model (Hernandez, 2017). The pasture hydrology and erosion assessment tool is designed to provide reliable, scientifically sound technologies for modeling and predicting runoff and erosion rates on rangelands, as well as to help assess the impact of pasture conservation practices (Herrick, 2009, 2017).
The approach used in this study has some aims: (i) to assess forage resources of a rangeland using a tool, measuring and driving research data on 13 indicators on a small semi-arid plain spring-autumn pasture of Aydarly rural district, (ii) to identify resource requirements local livestock farms through research interviews; (iii) to study the improvement of tool performance; and (4) to provide guidance for interested farmers to participate in more detailed land conservation and management plans.
Material and Methods Study area
The current investigation involved sampling and analyzing from Aydarly village (44°11'58.39"N, 75°50'31.57"E), lying on the edge (Kazakh: jeek) between the desert-steppe to the south, and the Sarytaukum (“yellow mountain of sand”) desert to the north. Aydarly lies in the northern part of Jambul district of Almaty province, in the south east of the country (Figure 1).
Figure 1. Location of the study site in Kazakhstan
The total pasture area of the rural district as of September 2017 is 110,062 ha. General features and location of the studied area are shown in Figure 1. The average annual precipitation is 230 mm, while temperatures range from a minimum −35°C in January to a maximum of 45°C in July. Vegetation in the northern sand dune area of the Sarytaukum is mainly composed of shrubs, Haloxylon persicum, Artemisia species, small shrubs of Salsola and Kochia, and in spring, ephemeral grasses of which Carex physodes is the most important. Some 20
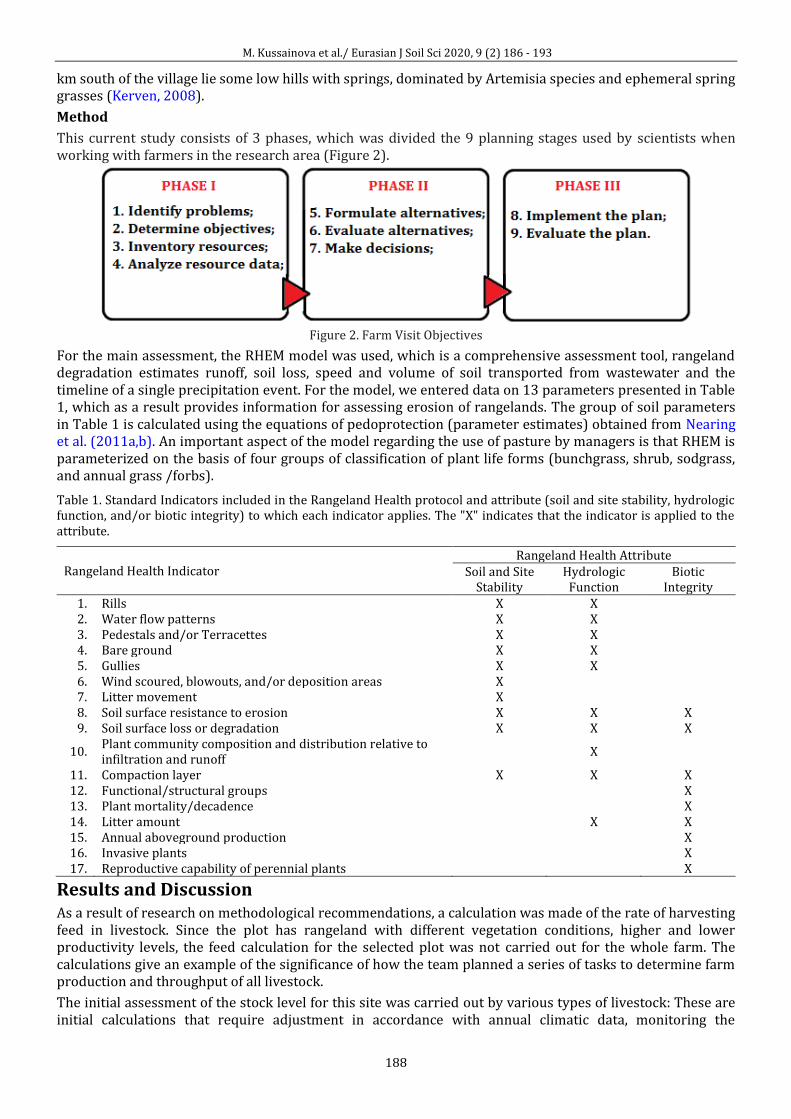
M. Kussainova et al./ Eurasian J Soil Sci 2020, 9 (2) 186 - 193
188
km south of the village lie some low hills with springs, dominated by Artemisia species and ephemeral spring grasses (Kerven, 2008).
Method
This current study consists of 3 phases, which was divided the 9 planning stages used by scientists when working with farmers in the research area (Figure 2).
Figure 2. Farm Visit Objectives
For the main assessment, the RHEM model was used, which is a comprehensive assessment tool, rangeland degradation estimates runoff, soil loss, speed and volume of soil transported from wastewater and the timeline of a single precipitation event. For the model, we entered data on 13 parameters presented in Table 1, which as a result provides information for assessing erosion of rangelands. The group of soil parameters in Table 1 is calculated using the equations of pedoprotection (parameter estimates) obtained from Nearing et al. (2011a,b). An important aspect of the model regarding the use of pasture by managers is that RHEM is parameterized on the basis of four groups of classification of plant life forms (bunchgrass, shrub, sodgrass, and annual grass /forbs).
Table 1. Standard Indicators included in the Rangeland Health protocol and attribute (soil and site stability, hydrologic function, and/or biotic integrity) to which each indicator applies. The "X" indicates that the indicator is applied to the attribute.
Rangeland Health Indicator
Rangeland Health Attribute Soil and Site
Stability Hydrologic
Function Biotic
Integrity 1. Rills X X 2. Water flow patterns X X 3. Pedestals and/or Terracettes X X 4. Bare ground X X 5. Gullies X X 6. Wind scoured, blowouts, and/or deposition areas X 7. Litter movement X 8. Soil surface resistance to erosion X X X 9. Soil surface loss or degradation X X X
10. Plant community composition and distribution relative to infiltration and runoff
X
11. Compaction layer X X X 12. Functional/structural groups X 13. Plant mortality/decadence X 14. Litter amount X X 15. Annual aboveground production X 16. Invasive plants X 17. Reproductive capability of perennial plants X
Results and Discussion As a result of research on methodological recommendations, a calculation was made of the rate of harvesting feed in livestock. Since the plot has rangeland with different vegetation conditions, higher and lower productivity levels, the feed calculation for the selected plot was not carried out for the whole farm. The calculations give an example of the significance of how the team planned a series of tasks to determine farm production and throughput of all livestock.
The initial assessment of the stock level for this site was carried out by various types of livestock: These are initial calculations that require adjustment in accordance with annual climatic data, monitoring the
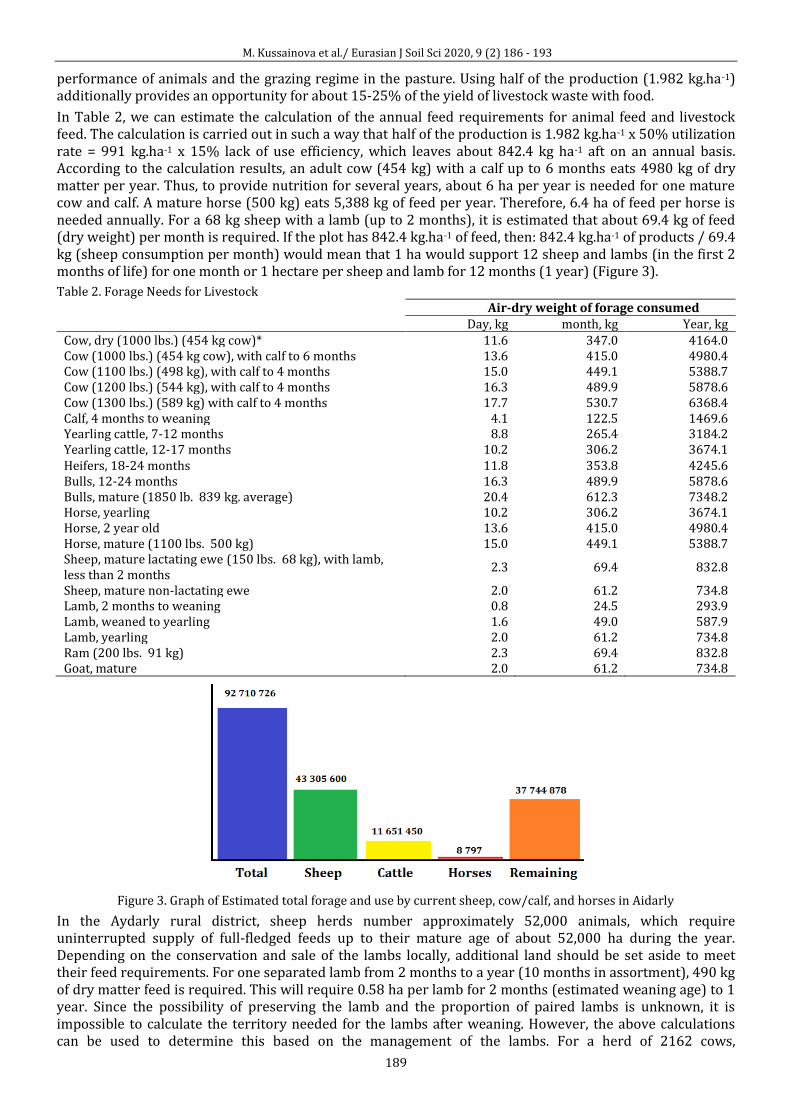
M. Kussainova et al./ Eurasian J Soil Sci 2020, 9 (2) 186 - 193
189
performance of animals and the grazing regime in the pasture. Using half of the production (1.982 kg.ha-1) additionally provides an opportunity for about 15-25% of the yield of livestock waste with food.
In Table 2, we can estimate the calculation of the annual feed requirements for animal feed and livestock feed. The calculation is carried out in such a way that half of the production is 1.982 kg.ha-1 x 50% utilization rate = 991 kg.ha-1 x 15% lack of use efficiency, which leaves about 842.4 kg ha-1 aft on an annual basis. According to the calculation results, an adult cow (454 kg) with a calf up to 6 months eats 4980 kg of dry matter per year. Thus, to provide nutrition for several years, about 6 ha per year is needed for one mature cow and calf. A mature horse (500 kg) eats 5,388 kg of feed per year. Therefore, 6.4 ha of feed per horse is needed annually. For a 68 kg sheep with a lamb (up to 2 months), it is estimated that about 69.4 kg of feed (dry weight) per month is required. If the plot has 842.4 kg.ha-1 of feed, then: 842.4 kg.ha-1 of products / 69.4 kg (sheep consumption per month) would mean that 1 ha would support 12 sheep and lambs (in the first 2 months of life) for one month or 1 hectare per sheep and lamb for 12 months (1 year) (Figure 3).
Table 2. Forage Needs for Livestock Air-dry weight of forage consumed Day, kg month, kg Year, kg
Cow, dry (1000 lbs.) (454 kg cow)* 11.6 347.0 4164.0 Cow (1000 lbs.) (454 kg cow), with calf to 6 months 13.6 415.0 4980.4 Cow (1100 lbs.) (498 kg), with calf to 4 months 15.0 449.1 5388.7 Cow (1200 lbs.) (544 kg), with calf to 4 months 16.3 489.9 5878.6 Cow (1300 lbs.) (589 kg) with calf to 4 months 17.7 530.7 6368.4 Calf, 4 months to weaning 4.1 122.5 1469.6 Yearling cattle, 7-12 months 8.8 265.4 3184.2 Yearling cattle, 12-17 months 10.2 306.2 3674.1 Heifers, 18-24 months 11.8 353.8 4245.6 Bulls, 12-24 months 16.3 489.9 5878.6 Bulls, mature (1850 lb. 839 kg. average) 20.4 612.3 7348.2 Horse, yearling 10.2 306.2 3674.1 Horse, 2 year old 13.6 415.0 4980.4 Horse, mature (1100 lbs. 500 kg) 15.0 449.1 5388.7 Sheep, mature lactating ewe (150 lbs. 68 kg), with lamb, less than 2 months
2.3 69.4 832.8
Sheep, mature non-lactating ewe 2.0 61.2 734.8 Lamb, 2 months to weaning 0.8 24.5 293.9 Lamb, weaned to yearling 1.6 49.0 587.9 Lamb, yearling 2.0 61.2 734.8 Ram (200 lbs. 91 kg) 2.3 69.4 832.8 Goat, mature 2.0 61.2 734.8
Figure 3. Graph of Estimated total forage and use by current sheep, cow/calf, and horses in Aidarly
In the Aydarly rural district, sheep herds number approximately 52,000 animals, which require uninterrupted supply of full-fledged feeds up to their mature age of about 52,000 ha during the year. Depending on the conservation and sale of the lambs locally, additional land should be set aside to meet their feed requirements. For one separated lamb from 2 months to a year (10 months in assortment), 490 kg of dry matter feed is required. This will require 0.58 ha per lamb for 2 months (estimated weaning age) to 1 year. Since the possibility of preserving the lamb and the proportion of paired lambs is unknown, it is impossible to calculate the territory needed for the lambs after weaning. However, the above calculations can be used to determine this based on the management of the lambs. For a herd of 2162 cows,
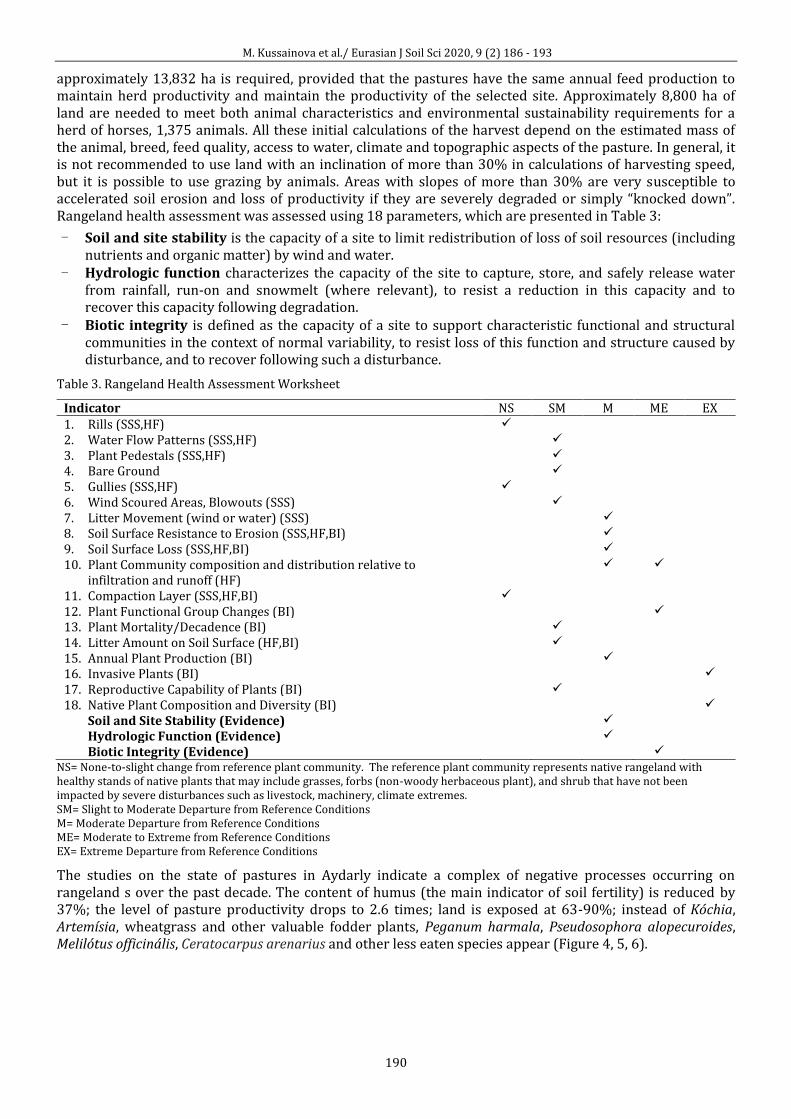
M. Kussainova et al./ Eurasian J Soil Sci 2020, 9 (2) 186 - 193
190
approximately 13,832 ha is required, provided that the pastures have the same annual feed production to maintain herd productivity and maintain the productivity of the selected site. Approximately 8,800 ha of land are needed to meet both animal characteristics and environmental sustainability requirements for a herd of horses, 1,375 animals. All these initial calculations of the harvest depend on the estimated mass of the animal, breed, feed quality, access to water, climate and topographic aspects of the pasture. In general, it is not recommended to use land with an inclination of more than 30% in calculations of harvesting speed, but it is possible to use grazing by animals. Areas with slopes of more than 30% are very susceptible to accelerated soil erosion and loss of productivity if they are severely degraded or simply “knocked down”. Rangeland health assessment was assessed using 18 parameters, which are presented in Table 3:
- Soil and site stability is the capacity of a site to limit redistribution of loss of soil resources (including nutrients and organic matter) by wind and water.
- Hydrologic function characterizes the capacity of the site to capture, store, and safely release water from rainfall, run-on and snowmelt (where relevant), to resist a reduction in this capacity and to recover this capacity following degradation.
- Biotic integrity is defined as the capacity of a site to support characteristic functional and structural communities in the context of normal variability, to resist loss of this function and structure caused by disturbance, and to recover following such a disturbance.
Table 3. Rangeland Health Assessment Worksheet
Indicator NS SM M ME EX 1. Rills (SSS,HF) 2. Water Flow Patterns (SSS,HF) 3. Plant Pedestals (SSS,HF) 4. Bare Ground 5. Gullies (SSS,HF) 6. Wind Scoured Areas, Blowouts (SSS) 7. Litter Movement (wind or water) (SSS) 8. Soil Surface Resistance to Erosion (SSS,HF,BI) 9. Soil Surface Loss (SSS,HF,BI) 10. Plant Community composition and distribution relative to
infiltration and runoff (HF)
11. Compaction Layer (SSS,HF,BI) 12. Plant Functional Group Changes (BI) 13. Plant Mortality/Decadence (BI) 14. Litter Amount on Soil Surface (HF,BI) 15. Annual Plant Production (BI) 16. Invasive Plants (BI) 17. Reproductive Capability of Plants (BI) 18. Native Plant Composition and Diversity (BI)
Soil and Site Stability (Evidence) Hydrologic Function (Evidence) Biotic Integrity (Evidence)
NS= None-to-slight change from reference plant community. The reference plant community represents native rangeland with healthy stands of native plants that may include grasses, forbs (non-woody herbaceous plant), and shrub that have not been impacted by severe disturbances such as livestock, machinery, climate extremes. SM= Slight to Moderate Departure from Reference Conditions M= Moderate Departure from Reference Conditions ME= Moderate to Extreme from Reference Conditions EX= Extreme Departure from Reference Conditions
The studies on the state of pastures in Aydarly indicate a complex of negative processes occurring on rangeland s over the past decade. The content of humus (the main indicator of soil fertility) is reduced by 37%; the level of pasture productivity drops to 2.6 times; land is exposed at 63-90%; instead of Kóchia, Artemísia, wheatgrass and other valuable fodder plants, Peganum harmala, Pseudosophora alopecuroides, Melilótus officinális, Ceratocarpus arenarius and other less eaten species appear (Figure 4, 5, 6).
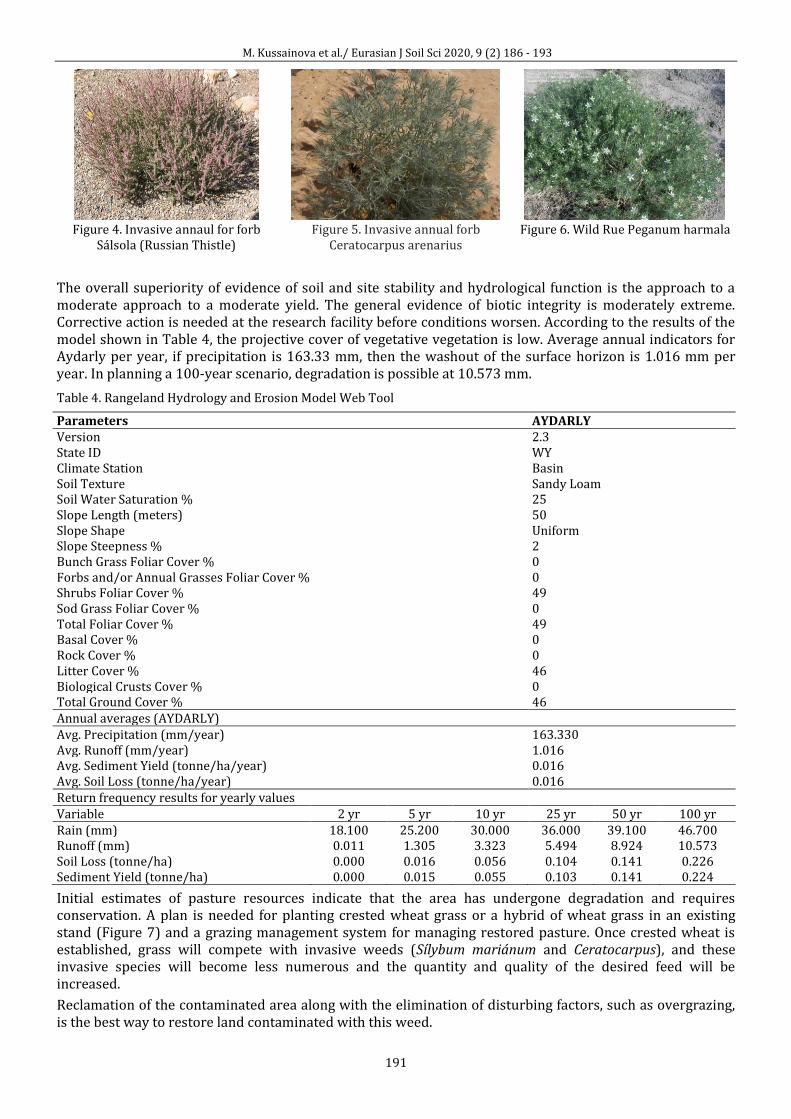
M. Kussainova et al./ Eurasian J Soil Sci 2020, 9 (2) 186 - 193
191
Figure 4. Invasive annaul for forb
Sálsola (Russian Thistle) Figure 5. Invasive annual forb
Ceratocarpus arenarius Figure 6. Wild Rue Peganum harmala
The overall superiority of evidence of soil and site stability and hydrological function is the approach to a moderate approach to a moderate yield. The general evidence of biotic integrity is moderately extreme. Corrective action is needed at the research facility before conditions worsen. According to the results of the model shown in Table 4, the projective cover of vegetative vegetation is low. Average annual indicators for Aydarly per year, if precipitation is 163.33 mm, then the washout of the surface horizon is 1.016 mm per year. In planning a 100-year scenario, degradation is possible at 10.573 mm.
Table 4. Rangeland Hydrology and Erosion Model Web Tool
Parameters AYDARLY Version 2.3 State ID WY Climate Station Basin Soil Texture Sandy Loam Soil Water Saturation % 25 Slope Length (meters) 50 Slope Shape Uniform Slope Steepness % 2 Bunch Grass Foliar Cover % 0 Forbs and/or Annual Grasses Foliar Cover % 0 Shrubs Foliar Cover % 49 Sod Grass Foliar Cover % 0 Total Foliar Cover % 49 Basal Cover % 0 Rock Cover % 0 Litter Cover % 46 Biological Crusts Cover % 0 Total Ground Cover % 46 Annual averages (AYDARLY) Avg. Precipitation (mm/year) 163.330 Avg. Runoff (mm/year) 1.016 Avg. Sediment Yield (tonne/ha/year) 0.016 Avg. Soil Loss (tonne/ha/year) 0.016 Return frequency results for yearly values Variable 2 yr 5 yr 10 yr 25 yr 50 yr 100 yr Rain (mm) 18.100 25.200 30.000 36.000 39.100 46.700 Runoff (mm) 0.011 1.305 3.323 5.494 8.924 10.573 Soil Loss (tonne/ha) 0.000 0.016 0.056 0.104 0.141 0.226 Sediment Yield (tonne/ha) 0.000 0.015 0.055 0.103 0.141 0.224
Initial estimates of pasture resources indicate that the area has undergone degradation and requires conservation. A plan is needed for planting crested wheat grass or a hybrid of wheat grass in an existing stand (Figure 7) and a grazing management system for managing restored pasture. Once crested wheat is established, grass will compete with invasive weeds (Sílybum mariánum and Ceratocarpus), and these invasive species will become less numerous and the quantity and quality of the desired feed will be increased.
Reclamation of the contaminated area along with the elimination of disturbing factors, such as overgrazing, is the best way to restore land contaminated with this weed.
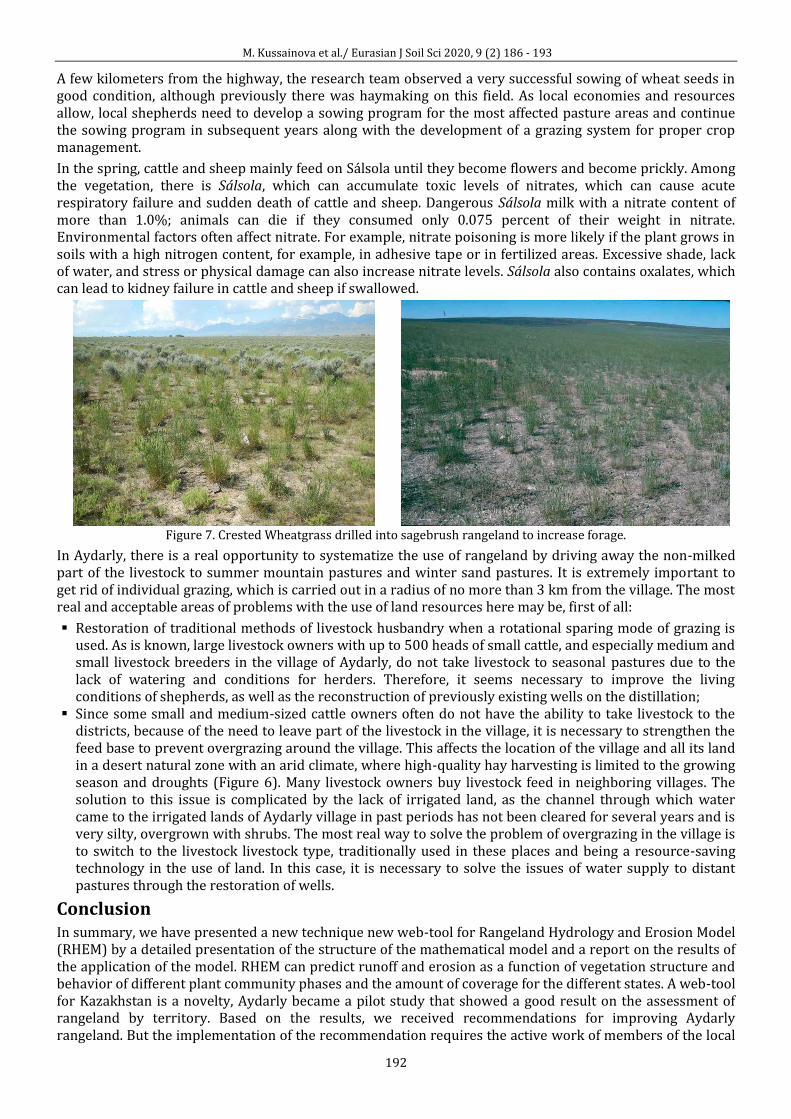
M. Kussainova et al./ Eurasian J Soil Sci 2020, 9 (2) 186 - 193
192
A few kilometers from the highway, the research team observed a very successful sowing of wheat seeds in good condition, although previously there was haymaking on this field. As local economies and resources allow, local shepherds need to develop a sowing program for the most affected pasture areas and continue the sowing program in subsequent years along with the development of a grazing system for proper crop management.
In the spring, cattle and sheep mainly feed on Sálsola until they become flowers and become prickly. Among the vegetation, there is Sálsola, which can accumulate toxic levels of nitrates, which can cause acute respiratory failure and sudden death of cattle and sheep. Dangerous Sálsola milk with a nitrate content of more than 1.0%; animals can die if they consumed only 0.075 percent of their weight in nitrate. Environmental factors often affect nitrate. For example, nitrate poisoning is more likely if the plant grows in soils with a high nitrogen content, for example, in adhesive tape or in fertilized areas. Excessive shade, lack of water, and stress or physical damage can also increase nitrate levels. Sálsola also contains oxalates, which can lead to kidney failure in cattle and sheep if swallowed.
Figure 7. Crested Wheatgrass drilled into sagebrush rangeland to increase forage.
In Aydarly, there is a real opportunity to systematize the use of rangeland by driving away the non-milked part of the livestock to summer mountain pastures and winter sand pastures. It is extremely important to get rid of individual grazing, which is carried out in a radius of no more than 3 km from the village. The most real and acceptable areas of problems with the use of land resources here may be, first of all:
Restoration of traditional methods of livestock husbandry when a rotational sparing mode of grazing is used. As is known, large livestock owners with up to 500 heads of small cattle, and especially medium and small livestock breeders in the village of Aydarly, do not take livestock to seasonal pastures due to the lack of watering and conditions for herders. Therefore, it seems necessary to improve the living conditions of shepherds, as well as the reconstruction of previously existing wells on the distillation;
Since some small and medium-sized cattle owners often do not have the ability to take livestock to the districts, because of the need to leave part of the livestock in the village, it is necessary to strengthen the feed base to prevent overgrazing around the village. This affects the location of the village and all its land in a desert natural zone with an arid climate, where high-quality hay harvesting is limited to the growing season and droughts (Figure 6). Many livestock owners buy livestock feed in neighboring villages. The solution to this issue is complicated by the lack of irrigated land, as the channel through which water came to the irrigated lands of Aydarly village in past periods has not been cleared for several years and is very silty, overgrown with shrubs. The most real way to solve the problem of overgrazing in the village is to switch to the livestock livestock type, traditionally used in these places and being a resource-saving technology in the use of land. In this case, it is necessary to solve the issues of water supply to distant pastures through the restoration of wells.
Conclusion In summary, we have presented a new technique new web-tool for Rangeland Hydrology and Erosion Model (RHEM) by a detailed presentation of the structure of the mathematical model and a report on the results of the application of the model. RHEM can predict runoff and erosion as a function of vegetation structure and behavior of different plant community phases and the amount of coverage for the different states. A web-tool for Kazakhstan is a novelty, Aydarly became a pilot study that showed a good result on the assessment of rangeland by territory. Based on the results, we received recommendations for improving Aydarly rangeland. But the implementation of the recommendation requires the active work of members of the local
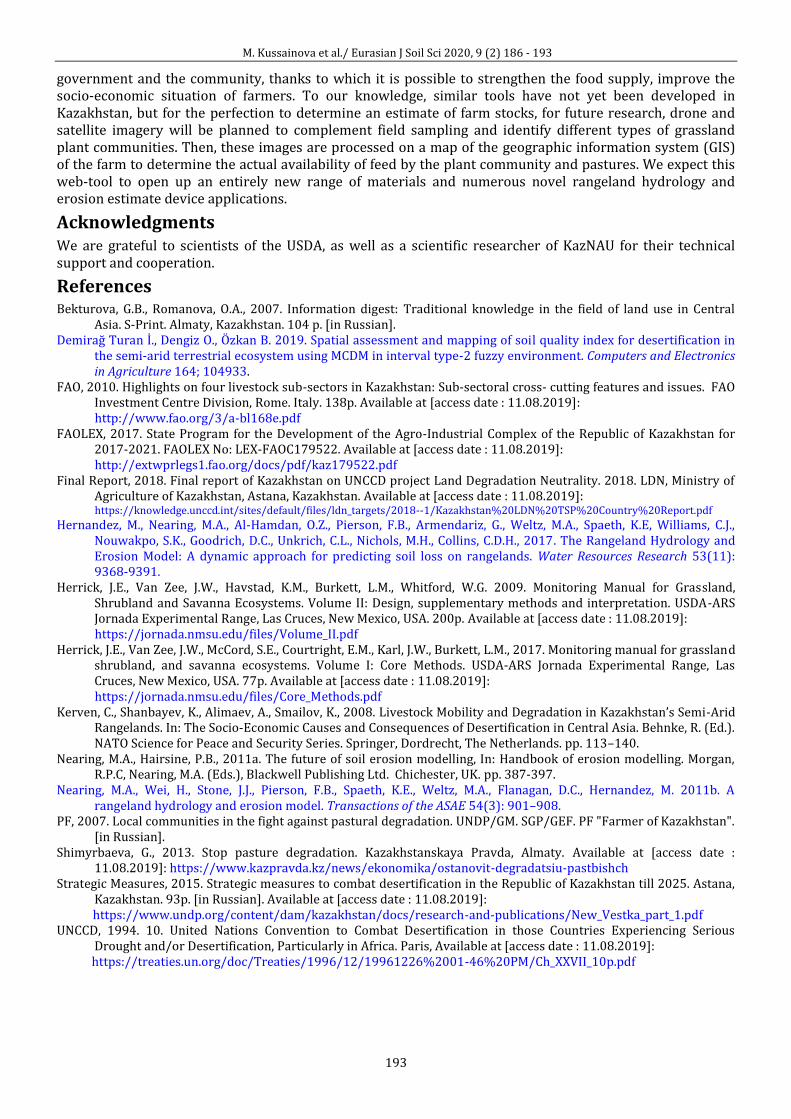
M. Kussainova et al./ Eurasian J Soil Sci 2020, 9 (2) 186 - 193
193
government and the community, thanks to which it is possible to strengthen the food supply, improve the socio-economic situation of farmers. To our knowledge, similar tools have not yet been developed in Kazakhstan, but for the perfection to determine an estimate of farm stocks, for future research, drone and satellite imagery will be planned to complement field sampling and identify different types of grassland plant communities. Then, these images are processed on a map of the geographic information system (GIS) of the farm to determine the actual availability of feed by the plant community and pastures. We expect this web-tool to open up an entirely new range of materials and numerous novel rangeland hydrology and erosion estimate device applications.
Acknowledgments We are grateful to scientists of the USDA, as well as a scientific researcher of KazNAU for their technical support and cooperation.
References Bekturova, G.B., Romanova, O.A., 2007. Information digest: Traditional knowledge in the field of land use in Central
Asia. S-Print. Almaty, Kazakhstan. 104 p. [in Russian]. Demirağ Turan İ., Dengiz O., Özkan B. 2019. Spatial assessment and mapping of soil quality index for desertification in
the semi-arid terrestrial ecosystem using MCDM in interval type-2 fuzzy environment. Computers and Electronics in Agriculture 164; 104933.
FAO, 2010. Highlights on four livestock sub-sectors in Kazakhstan: Sub-sectoral cross- cutting features and issues. FAO Investment Centre Division, Rome. Italy. 138p. Available at [access date : 11.08.2019]:
http://www.fao.org/3/a-bl168e.pdf FAOLEX, 2017. State Program for the Development of the Agro-Industrial Complex of the Republic of Kazakhstan for
2017-2021. FAOLEX No: LEX-FAOC179522. Available at [access date : 11.08.2019]: http://extwprlegs1.fao.org/docs/pdf/kaz179522.pdf Final Report, 2018. Final report of Kazakhstan on UNCCD project Land Degradation Neutrality. 2018. LDN, Ministry of
Agriculture of Kazakhstan, Astana, Kazakhstan. Available at [access date : 11.08.2019]: https://knowledge.unccd.int/sites/default/files/ldn_targets/2018--1/Kazakhstan%20LDN%20TSP%20Country%20Report.pdf
Hernandez, M., Nearing, M.A., Al-Hamdan, O.Z., Pierson, F.B., Armendariz, G., Weltz, M.A., Spaeth, K.E, Williams, C.J., Nouwakpo, S.K., Goodrich, D.C., Unkrich, C.L., Nichols, M.H., Collins, C.D.H., 2017. The Rangeland Hydrology and Erosion Model: A dynamic approach for predicting soil loss on rangelands. Water Resources Research 53(11): 9368-9391.
Herrick, J.E., Van Zee, J.W., Havstad, K.M., Burkett, L.M., Whitford, W.G. 2009. Monitoring Manual for Grassland, Shrubland and Savanna Ecosystems. Volume II: Design, supplementary methods and interpretation. USDA-ARS Jornada Experimental Range, Las Cruces, New Mexico, USA. 200p. Available at [access date : 11.08.2019]:
https://jornada.nmsu.edu/files/Volume_II.pdf Herrick, J.E., Van Zee, J.W., McCord, S.E., Courtright, E.M., Karl, J.W., Burkett, L.M., 2017. Monitoring manual for grassland
shrubland, and savanna ecosystems. Volume I: Core Methods. USDA-ARS Jornada Experimental Range, Las Cruces, New Mexico, USA. 77p. Available at [access date : 11.08.2019]:
https://jornada.nmsu.edu/files/Core_Methods.pdf Kerven, C., Shanbayev, K., Alimaev, A., Smailov, K., 2008. Livestock Mobility and Degradation in Kazakhstan’s Semi-Arid
Rangelands. In: The Socio-Economic Causes and Consequences of Desertification in Central Asia. Behnke, R. (Ed.). NATO Science for Peace and Security Series. Springer, Dordrecht, The Netherlands. pp. 113–140.
Nearing, M.A., Hairsine, P.B., 2011a. The future of soil erosion modelling, In: Handbook of erosion modelling. Morgan, R.P.C, Nearing, M.A. (Eds.), Blackwell Publishing Ltd. Chichester, UK. pp. 387-397.
Nearing, M.A., Wei, H., Stone, J.J., Pierson, F.B., Spaeth, K.E., Weltz, M.A., Flanagan, D.C., Hernandez, M. 2011b. A rangeland hydrology and erosion model. Transactions of the ASAE 54(3): 901–908.
PF, 2007. Local communities in the fight against pastural degradation. UNDP/GM. SGP/GEF. PF "Farmer of Kazakhstan". [in Russian].
Shimyrbaeva, G., 2013. Stop pasture degradation. Kazakhstanskaya Pravda, Almaty. Available at [access date : 11.08.2019]: https://www.kazpravda.kz/news/ekonomika/ostanovit-degradatsiu-pastbishch
Strategic Measures, 2015. Strategic measures to combat desertification in the Republic of Kazakhstan till 2025. Astana, Kazakhstan. 93p. [in Russian]. Available at [access date : 11.08.2019]:
https://www.undp.org/content/dam/kazakhstan/docs/research-and-publications/New_Vestka_part_1.pdf UNCCD, 1994. 10. United Nations Convention to Combat Desertification in those Countries Experiencing Serious
Drought and/or Desertification, Particularly in Africa. Paris, Available at [access date : 11.08.2019]: https://treaties.un.org/doc/Treaties/1996/12/19961226%2001-46%20PM/Ch_XXVII_10p.pdf
Related Documents


