EURASIAN JOURNAL OF EDUCATIONAL RESEARCH Bimontly Peer-Reviewed Journal, Year: 19 Issue: 84 / 2019 İki Ayda Bir Yayımlanan Hakemli Dergi, Yıl: 19 Sayı: 84 / 2019 FOUNDING EDITOR / Kurucu Editör Veysel Sönmez, Hacettepe University, Ankara, TURKEY EDITOR IN CHIEF / Baş Editör Şakir Çınkır, Ankara University, Ankara, TURKEY EDITORS / Editörler Ali Ersoy, Anadolu University, Eskişehir, TURKEY Andrey A. Kiselnikov, Lomonosov Moscow State University, Moscow, RUSSIA Antonio E. Puente, University of North Carolina Wilmington, Washington, USA Arda Arıkan, Akdeniz University, Antalya, TURKEY Ayşe Çiftçi, Purdue University, IN, USA Cevriye Ergül, Ankara University, Ankara, TURKEY Deha Doğan, Ankara University, Ankara, TURKEY Funda Nayır, Pamukkale University, Denizli, TURKEY Engin Karahan, Eskişehir Osmangazi University, Eskişehir, TURKEY Gökhan Atik, Ankara University, Ankara, TURKEY Gülseren Karagöz Akar, Boğaziçi University, İstanbul, TURKEY Hakan Atılgan, Ege University, İzmir, TURKEY Işıl Kabakçı Yurdakul, Anadolu University, Eskişehir, TURKEY Jale Çakıroğlu, Middle East Technical University, Ankara, TURKEY Joe O'Hara, Dublin City University, Dublin, IRELAND Kürşat Erbaş, Middle East Technical University, Ankara, TURKEY Laura M. Reid Marks, University of Memphis, USA Martin Brown, Dublin City University, Dublin, IRELAND Mehmet Bekdemir, Erzincan Binali Yıldırım University, Erzincan, TURKEY Meral Hakverdi Can, Hacettepe University, Ankara, TURKEY Refika Olgan, Middle East Technical University, Ankara, TURKEY Sedef Canbazoğlu Bilici, Aksaray University, Aksaray, TURKEY Şenel Poyrazlı, Penn State University, PA, USA Taner Altun, Trabzon University, Trabzon, TURKEY Vesile Alkan, Pamukkale University, Denizli, TURKEY INTERNATIONAL EDITORIAL BOARD / Uluslararası Editörler Kurulu Anita Pipere, Daugavpils University, LATVIA Ann-Katrin Sward, Göteborg University, Göteborg, SWEDEN Anthony Onwuegbuzie, Sam Houston State University, USA Aslı Özgün Koca, Wayne State University, USA Beatrice Adeara, West Chester University, USA Birgit Pepin, Sor-Trondelag University College, NORWAY Burke Johnson, University of South Alabama, USA Corrine Glesne, University of Vermont, USA Danny Wyffels, KATHO University, Kortrijk, BELGIUM David Bridges, Cambridge University, UK David L. Haury, National Science Foundation, USA Ekber Tomul, Mehmet Akif Ersoy University, Burdur, TURKEY Erdinç Duru, Pamukkale University, Denizli, TURKEY Fatma Hazır Bıkmaz, Ankara University, TURKEY Gerry McNamara, Dublin City University, IRELAND Hasan Hüseyin Aksoy, Ankara University, Ankara, TURKEY Iordanescu Eugen, Lucian Blaga University of Sibiu, ROMANIA Okan Bulut, Alberta University, Alberta, CANADA Sven Persson, Malmö University, Malmö, SWEDEN Theo Wubbels, University of Utrecht, NETHERLAND

Welcome message from author
This document is posted to help you gain knowledge. Please leave a comment to let me know what you think about it! Share it to your friends and learn new things together.
Transcript
EURASIAN JOURNAL OF EDUCATIONAL RESEARCH
Bimontly Peer-Reviewed Journal, Year: 19 Issue: 84 / 2019 İki Ayda Bir Yayımlanan Hakemli Dergi, Yıl: 19 Sayı: 84 / 2019
FOUNDING EDITOR / Kurucu Editör Veysel Sönmez, Hacettepe University, Ankara, TURKEY
EDITOR IN CHIEF / Baş Editör Şakir Çınkır, Ankara University, Ankara, TURKEY
EDITORS / Editörler Ali Ersoy, Anadolu University, Eskişehir, TURKEY Andrey A. Kiselnikov, Lomonosov Moscow State University, Moscow, RUSSIA Antonio E. Puente, University of North Carolina Wilmington, Washington, USA
Arda Arıkan, Akdeniz University, Antalya, TURKEY Ayşe Çiftçi, Purdue University, IN, USA Cevriye Ergül, Ankara University, Ankara, TURKEY Deha Doğan, Ankara University, Ankara, TURKEY Funda Nayır, Pamukkale University, Denizli, TURKEY
Engin Karahan, Eskişehir Osmangazi University, Eskişehir, TURKEY Gökhan Atik, Ankara University, Ankara, TURKEY Gülseren Karagöz Akar, Boğaziçi University, İstanbul, TURKEY Hakan Atılgan, Ege University, İzmir, TURKEY Işıl Kabakçı Yurdakul, Anadolu University, Eskişehir, TURKEY
Jale Çakıroğlu, Middle East Technical University, Ankara, TURKEY Joe O'Hara, Dublin City University, Dublin, IRELAND Kürşat Erbaş, Middle East Technical University, Ankara, TURKEY Laura M. Reid Marks, University of Memphis, USA Martin Brown, Dublin City University, Dublin, IRELAND
Mehmet Bekdemir, Erzincan Binali Yıldırım University, Erzincan, TURKEY Meral Hakverdi Can, Hacettepe University, Ankara, TURKEY Refika Olgan, Middle East Technical University, Ankara, TURKEY Sedef Canbazoğlu Bilici, Aksaray University, Aksaray, TURKEY Şenel Poyrazlı, Penn State University, PA, USA
Taner Altun, Trabzon University, Trabzon, TURKEY Vesile Alkan, Pamukkale University, Denizli, TURKEY
INTERNATIONAL EDITORIAL BOARD / Uluslararası Editörler Kurulu Anita Pipere, Daugavpils University, LATVIA Ann-Katrin Sward, Göteborg University, Göteborg, SWEDEN Anthony Onwuegbuzie, Sam Houston State University, USA Aslı Özgün Koca, Wayne State University, USA
Beatrice Adeara, West Chester University, USA Birgit Pepin, Sor-Trondelag University College, NORWAY Burke Johnson, University of South Alabama, USA Corrine Glesne, University of Vermont, USA Danny Wyffels, KATHO University, Kortrijk, BELGIUM
David Bridges, Cambridge University, UK David L. Haury, National Science Foundation, USA Ekber Tomul, Mehmet Akif Ersoy University, Burdur, TURKEY Erdinç Duru, Pamukkale University, Denizli, TURKEY Fatma Hazır Bıkmaz, Ankara University, TURKEY
Gerry McNamara, Dublin City University, IRELAND Hasan Hüseyin Aksoy, Ankara University, Ankara, TURKEY Iordanescu Eugen, Lucian Blaga University of Sibiu, ROMANIA Okan Bulut, Alberta University, Alberta, CANADA Sven Persson, Malmö University, Malmö, SWEDEN
Theo Wubbels, University of Utrecht, NETHERLAND

EURASIAN JOURNAL OF EDUCATIONAL RESEARCH
Bimontly Peer-Reviewed Journal, Year: 19 Issue: 84 / 2019 İki Ayda Bir Yayımlanan Hakemli Dergi, Yıl: 19 Sayı: 84 / 2019
PUBLISHING MANAGER / Sahibi ve Sorumlu Yazı İşleri Müdürü
Anı Publishing Education and Consultancy Advertisement Stationary Industry Trade Co. Ltd. in the name of
Anı Yayıncılık Eğitim ve Danışmanlık Reklam Kırtasiye Sanayi Ticaret Ltd. Şti. adına
Özer DAŞCAN
EDITORIAL PRODUCTION ADMINISTRATOR / Yayın Yönetim
Özgür GÜLER
HEADQUARTER / Yönetim Merkezi
Anı Yayıncılık, Kızılırmak Sokak 10/A
06640 Bakanlıklar Ankara, TURKEY
Tel: +90 312 425 81 50 pbx Fax: +90 312 425 81 11
Printing Date / Basım Tarihi: 30.11.2019
Printing Address / Matbaa Adresi: Vadi Grafik Tasarım Ltd. Şti.
İvedik Org. San. Bölgesi 88 Oto 3. Bölge 2284. Sok. No: 101 Yenimahalle/ANKARA P: +90 312 395 85 71
Broadcast Type / Yayın Türü: Local Broadcast / Yerel Süreli Yayın
Cover Design / Kapak Tasarımı: Anı Publishing / Anı Yayıncılık
Composition / Dizgi: Göksel ÇAKIR
The ideas published in the journal belong to the authors.
Dergide yayınlanan yazıların tüm sorumluluğu yazarlarına aittir.
Eurasian Journal of Educational Research (Print ISSN 1302-597X, e-ISSN: 2528-8911) is a bimonthly (6 issues per year) peer-reviewed journal published by Anı Yayıncılık.
© 2019 ANI Publishing. All rights reserved. © 2019 ANI Yayıncılık. Tüm hakları saklıdır.
Eurasian Journal of Educational Research/EJER is abstracted and indexed in;
ESCI, Emerging Sources Citation Index
ERIC, The Education Resources Information Center
HERDC, Higher Education Research Data Collection
ERA, Educational Research Abstracts
SCOPUS database
EBSCO Host database
ULAKBİM national index
Social SciSearch
Journal Citation Reports / Social Sciences Edition

CONTENTS
İçindekiler
REVIEWERS of the 84th ISSUE 84. Sayı Hakemleri
The Relationship between Primary School Teachers'
Organizational Citizenship Behaviors and Counter-productive Work Behaviors
Burcu AKKAYA ....................................................................... 1-28
The Effect of Mobbing Levels Experienced by Music Teachers on Organizational Commitment and Job
Satisfaction Ayda ARAS............................................................................29-56
Rasch-Based Objective Standard Setting for University Placement Test Ado Abdu BICHI, Rohaya TALIB, Rahimah EMBONG,
Hasnah Binti MOHAMED, Mohd Sani ISMAIL, Abdallah IBRAHIM ................................................................................57-70
Foundation University Students’ Consumer Orientation and Learner Identity Levels and Their Correlations with
Academic Performance Betul ISCAN, Aydin BALYER..............................................71-92
Early Childhood Preservice Teachers’ Experiences with
Reflective Journal Writing Figen SAHIN, Muge SEN, Caglayan DINCER.............. 93-114
Comparison of Results Obtained from Logistic Regression, CHAID Analysis and Decision Tree Methods
Gokhan AKSU, Cigdem REYHANLIOGLU KECEOGLU
............................................................................................ 115-134
The Mediator Roles of Mothers in Father-Child Communications and Family Relationships*
Hilal CELIK........................................................................ 135-158
Narcissism, Life Satisfaction, and Harmony: The Mediating Role of Self-Esteem and Self-Compassion
Ibrahim DEMIRCI, Halil EKSI, Fusun EKSI ................. 159-178
Problem-Posing Skills for Mathematical Literacy: The
sample of Teachers and Pre-Service Teachers Kemal OZGEN ................................................................. 179-214
The Impacts of a University’s Organizational Reputation
and Organizational Attraction on Students’ Intention to Pursue
Soner POLAT, Gizem GUNCAVDI, Yaser ARSLAN . 215-240
Abdurrahman Abdurrahman
Celal Uğurlu
Cevat Elma
Demet Girgin
Durmuş Özbaşı
Ergül Demir
Fadime Ulusoy
Fey za Erden
Funda Nalbantoğlu Yılmaz
Gökhan Atik
Gökhan Malkoç
Kürşat Erbaş
Lokman Akbay
Mehmet Sincar
Merih Dogan
Murat Genç
Mustafa Bayrakçı
Nesrin Işıkoğlu Erdoğan
Oğuzcan Çığ
Oğuzhan Kırdök
Refika Olgan
Seher Yalçın
Sevda Çetin
Sedef Canbazoğlu
Şenel Poyrazlı
Tufan Ay taç
Vesile Alkan

Euras ian Journal of Educational Research 84 (2019) 1-28
Eurasian Journal of Educational Research
www.ejer.com.tr
The Relationship between Primary School Teachers' Organizational Citizenship Behaviors and Counter-productive Work Behaviors*
Burcu AKKAYA1
A R T I C L E I N F O A B S T R A C T
Article History: Purpose: The present study aims to investigate the
level of teachers' organizational citizenship behaviors
and counter-productive work behaviors (CWBs)
based on public primary school administrators’ and
teachers' perceptions and the relationship between
these two variables.
Research Methods: This study was conducted in a
correlational survey model. The sample of this study
was formed in the 2018-2019 academic year,
consisted of public primary school administrators
and teachers who worked in nine different districts
Received: 18 Jun., 2019
Received in revised form: 22 Sept. 2019
Accepted: 14 Oct. 2019
DOI: 10.14689/ejer.2019.84.1
Keywords
Counter-productive work behaviors,
organizational citizenship, extra-role
behavior.
of Ankara. This study employed the stratified sampling method. The data were collected using
the Counter-productive Work Behavior Scale and Organizational Citizenship Behavior Scale.
In the data analysis, arithmetic means, standard deviation and multilinear regression analysis
were used.
Findings: The findings showed that teachers rarely exhibited counter-productive work
behaviors. The most frequently exhibited behaviors were identified as ‘withdrawal’ and
‘abuse toward others’, and the least frequently exhibited behavior was identified as ‘theft’. The
most important predictor of the sub-dimensions of CWBs was the courtesy sub-dimension of
Organizational Citizenship Behaviors (OCBs).
Implications for Research and Practice: The results revealed that teachers who exhibit CWBs
also show passive behaviors more frequently and avoid active aggressive behaviors that
require one-to-one interaction. The behaviors included that the courtesy dimension had a
preventing or reducing effect on CWBs. Thus, teachers should be encouraged to follow the
rules of courtesy, and the teachers who deliver successful performance should be rewarded to
highlight the issue.
© 2019 Ani Publishing Ltd. All rights reserved
* This article has been produced from the PhD thesis supervised by Professor Dr. Yasemin Kepenekçi at the
Department of Education Management and Policy, Faculty of Educational Sciences, Ankara University. 1 PhD Candidate, Ankara University, [email protected] TURKEY ORCID: https://orcid.org/0000-0002-
4571-9065
2 Burcu AKKAYA Eurasian Journal of Educational Research 84 (2019) 1-28
Introduction
The behaviors exhibited by the employee in the organization can affect both the
other employees, thus the whole organization. Formal role behaviors exhibited by employees have a key role in organizations’ viability (Barksdale & Werner, 2001).
These behaviors are defined as the set of behaviors identified by the administration,
included in the punishment and rewards system (Barksdale & Werner, 2001) and required to be performed by employees (Van Dyne & LePine, 1998). Podsakoff and
MacKenzie (1997) emphasized that while employees’ behaviors are considered in the
context of formal role behavior in some cases, they may also be considered as extra-role behaviors (Van Dyne, Cummings, & Parks, 1995). All kinds of volitional behaviors
that are not required to be exhibited by employees are defined as extra-role behavior.
Extra-role behavior consists of two dimensions, including counter-productive work behavior and organizational citizenship behavior (Miles, Borman, Spector & Fox,
2002).
Counter-productive Work Behaviors (CWBs)
Counter-productive Work Behaviors (henceforth referred to as CWBs) consist of acts that are engaged by employees to abuse the organization or its members due to
negative situations experienced within the organization (Spector & Fox, 2010).
Volitional behaviors which are exhibited with the intention to harm (Dalal, 2005), jeopardize the well-being of the organization and employees, reduce job performance,
violate organizational norms through acts as aggression/theft/not performing at
work (Gualandri, 2012) are defined as CWBs. In the literature, CWBs were discussed as behaviors related to aggression, abusing production, sabotage, theft, withdrawal
and retaliation (Ozdevecioglu, 2003; Skarlicki & Folger, 1997; Spector, 2011). The aggressiveness of the employee or a reaction to unfair practices experienced within an
organization forms the basis of these behaviors (Spector, Fox, & Domagalski, 2006;
Spector, Fox, Penney, et al., 2006).
Several research studies reported that CWBs result in consequences that pose
direct or indirect threats to the viability of an organization. These threats include the
abuse of organizational structure, resources and employees (Spector & Fox, 2002), deviation from organizational purposes (Mount, Ilies, & Johnson, 2006), decrease in
organizational activity, financial loss of the organization (Dunlop & Lee, 2004) and
deterioration of organizational ethical climate (Kidwell Jr & Kochanowski, 2005).
CWBs Dimensions
In the literature, CWBs were categorized in different ways. Buss (1961) analyzed
CWBs in the context of three main dimensions, including ‘physical-verbal’, ‘active-
passive’ and ‘direct-indirect’, and of eight sub-dimensions that were built by crossing these main dimensions. Baron and Neuman (1996) accepted the categorization of Buss
and expanded them by adding the effect/danger ratio and overt/covert dimensions.
Gruys (1999) assessed counter-productive work behavior under 11 categories without any forming any categories: (1) Theft and related behavior; (2) destruction of property;
(3) misuse of information; (4) misuse of time and resources; (5) unsafe behavior; (6)
Burcu AKKAYA Eurasian Journal of Educational Research 84 (2019) 1-28
3
poor attendance; (7) poor quality work; (8) alcohol use; (9) drug use; (10) inappropriate
verbal actions; and (11) inappropriate physical actions. Although the way of categorization varied, CWBs can be elucidated in the scope of two main dimensions of
‘individual- targeted’ and ‘organization-targeted’. Thus, the model of Spector, Fox,
Penney, et al. (2006), which analyzed CWBs within these two dimensions, has been widely accepted in the literature. The model of Spector et al. also formed the basis of
this study.
Spector et al. (2006) addressed CWBs within two main groups: ‘individual-targeted’ and ‘organization-targeted’. In this context, the researchers argued that
CWBs could be explored under two main dimensions and five sub-dimensions,
including (i) abuse toward others, (ii) production deviance, (iii) sabotage, (iv) theft and (v) withdrawal.
Behaviors that aim the direct abuse of the employee/employees present CWBs that are ‘individual- targeted’. This main dimension consists of “abuse toward others”.
According to Spector, Fox, Penney, et al. (2006), behaviors examined under this
dimension include threatening words and actions, insulting, ignoring and using
physical violence. On the other hand, behaviors that aim the direct abuse of the organization present CWBs that are ‘organization-targeted’. The direct target of such
kind of behaviors is the organization, yet employees CWBs behaviors targeted toward
individuals also make a direct and negative effect on the organization. This main dimension includes the sub-dimensions of production deviance, sabotage, theft, and
withdrawal.
Production deviance is defined as deliberate failure or mistake of the employee to
harm the organization (Spector, Fox, Penney et al., 2006). In other words, production
deviance is described as a negative impact on the quality of a provided
product/service due to employee’s neglect of duty.
The concept of sabotage implies deliberate defacement or destruction of physical
property belonging to the organization (Spector, Fox, Penney et al., 2006). This
dimension includes volitional behaviors exhibited by the employee to damage an organization’s property, equipment, image and reputation (Giacalone & Rosenfeld, 1987). Theft is the act of stealing by employees. Employees may engage in this
behavior to harm the organization due to financial needs, lack of work satisfaction, or low perception of organizational justice (Spector, Fox, Penney, et al., 2006). Withdrawal is the inadequate active participation of the employee in the activities of
an organization (Shore & Shore, 1995). Withdrawal behaviors include being absent from work, arriving late, or leaving early and taking longer breaks (Spector, Fox,
Penney, et al., 2006).
Relevant studies reported that such kinds of behaviors cause pecuniary and non-
pecuniary damages for individuals and organizations. For instance, Fox and
Stallworth (2004) found that 74.8% of the participants had severe intentions to leave employment, and 66% of them suffered from headaches, stomachache and chest pain
for five years. The findings demonstrated that CWBs caused both psychological and
physiological damage to individuals. However, the psychological impacts of CWBs
4 Burcu AKKAYA Eurasian Journal of Educational Research 84 (2019) 1-28
are not limited to those noted above. The findings in the literature have shown that in
organizations where such behaviors are exhibited by employees, it is possible to
observe experiencing low self-esteem and self-efficacy (Duffy, Ganster, & Pagon, 2002; Duffy, Ganster, Shaw, Johnson, & Pagon, 2006; Low, Radhakrishnan, Schneider, &
Rounds, 2007), extreme anger (Aquino, Douglas, & Martinko, 2004; Spector, Fox, &
Domagalski, 2006), depression and high levels of anxiety (Berry, Carpenter, & Barratt, 2012; Duffy et al., 2006) and stress (Berry et al., 2012).
CWBs in Schools
CWBs can also be exhibited by teachers and administrators in educational institutions, such as schools. As Dogruoz and Ozdemir (2018) assumed, the existing
findings in the literature have shown that teachers and administrators exhibit CWBs,
such as damaging the property of the school, harassment, psychological mobbing and absence from work, and these behaviors have become more common in schools.
According to Unal (2012), CWBs exhibited by teachers in schools include threatening,
being disrespectful, sending off students out of the classroom, threatening students with expelling from school, misinforming parents and being impolite, being late to the
lecture, violation of rules and consumption of alcohol at work.
Organizational Citizenship Behaviors (OCBs)
The concept of Organizational Citizenship Behaviors (henceforth referred to as OCBs) was mentioned by Bateman and Organ (1983) for the first time. The researchers
assumed that it is appropriate to include the type of extra-role behaviors that do not
harm an organization in the context of OCBs. Organ (1988) emphasized that the scope of organizational citizenship consisted of behaviors that are ‘beyond extra-role
behaviors’ and defined organizational citizenship behavior as “individual behavior that is discretionary, not directly or explicitly recognized by the formal reward system,
and that in the aggregate promotes the effective functioning of the organization". OCBs
consist of volitional behaviors of the employee that directly support the efficient functioning of an organization (Podsakoff & MacKenzie, 1994).
Dimensions of OCBs
The study conducted by Smith, Organ, and Near (1983) categorized organizational
citizenship for the first time. The researchers categorized OCBs into two main dimensions: altruism (generosity) and general compliance. Altruism includes direct
and intentional behaviors that are exhibited to help others in the case of face-to-face
situations, such as providing guidance or assistance. The general compliance dimension consists of impersonal behaviors that make an indirect impact on
employees or employers and these behaviors are related to the concept of
conscientiousness.
Farh, Earley and Lin (1997) revealed that organizational citizenship behavior
consists of identification, protecting company resources, altruism toward colleagues,
interpersonal harmony and conscientiousness. Podsakoff et al. (2000) analyzed organizational citizenship behavior under seven dimensions as follows: (i) altruism,

Burcu AKKAYA Eurasian Journal of Educational Research 84 (2019) 1-28
5
(ii) sportsmanship, (iii) organizational loyalty, (iv) organizational compliance (v)
individual initiative, (vi) civic virtue and (vii) self-improvement.
The categorization of Organ (1988) has been widely accepted in the literature given
that the researcher defined the concept of organizational citizenship for the first time.
The researcher analyzed organizational citizenship behavior under five dimensions: altruism, courtesy, conscientiousness, civic courtesy and sportsmanship. This study is
also based on the categorization of Organ (1988), and these dimensions are explained
below.
Altruism
In general terms, altruism, which means generosity, is defined as “deliberate,
conscious, well-intended and voluntary helping behavior of the employee directed
toward other employees concerning work-related issues.” Smith, Organ ve Near’a (1983).
Courtesy
The courtesy dimension implies being thoughtful and controlled before exhibiting a behavior (Allison, Voss, & Dryer, 2001). This dimension includes interpersonal
behaviors of employees in an organization, such as establishing healthy
communication, informing and reminding colleagues, and showing respect.
Conscientiousness
The conscientiousness dimension consists of volitional behaviors of employees that
go beyond the designated tasks (Podsakoff et al., 2000). Continuing to be engaged at
work, using the work time efficiently and following the rules of the organization are among the behaviors included in this dimension (Barksdale & Werner, 2001), such as
going beyond the minimum role requirement in one’s work
Civic Virtue
According to Organ (1988), civic virtue is the employee’s interest in the activities
of the organization and active and responsible involvement in organizational
processes. According to Podsakoff and MacKenzie (1994), such kind of involvement encompasses the employee's behaviors, such as feeling responsible for the problems
that occur within the organization, actively participating in solution processes and
attending meetings and decision making processes.
Sportsmanship
Sportsmanship consists of the employee’s efforts to develop positive attitudes
toward the organization under difficult circumstances (Sezgin, 2005), willingness to
solve the problems that are occurring within the organization (MacKenzie, Podsakoff, & Fetter, 1993) and avoiding behaviors that will give rise to distress (Organ, 1988).
In the context of schools, OCBs can be addressed as behaviors that make positive
contributions to the functioning of the school and the education process. DiPaola and
6 Burcu AKKAYA Eurasian Journal of Educational Research 84 (2019) 1-28
Hoy (2005) listed the OCBs that teachers exhibit to contribute to the success of students
and the school as follows:
helping new colleagues,
making innovative suggestions regarding the functioning of the school,
volunteering to attend extracurricular activities,
sparing time for students on their own time,
staying after school to continue working,
taking care of students voluntarily,
attending work consistently,
making efficient use of their time while at school,
working productively with their colleagues,
showing performance beyond requirements.
In light of this conceptual framework, it can be asserted that OCBs may bring about
the opposite of impacts made by CWBs.
The primary aim of this paper is to explore the relationship between teachers' OCBs and CWBs based on public primary school administrators’ and teachers' perceptions.
In line with this general objective, this study sought to answer the following specific research questions:
1. What is the extent of perceptions of administrators and teachers on teachers’
CWBs concerning the dimensions;
a) Abuse toward others
b) Abuse toward administrative functioning
c) Sabotage
d) Theft
e) Withdrawal
f) Abuse toward school image
g) Abuse toward schooling
2. What is the extent of perceptions of administrators and teachers on teachers’ organizational citizenship behavior concerning the dimensions;
a) Altruism,
b) Conscientiousness,
c) Sportsmanship,
d) Courtesy,
e) Civic Virtue.
Burcu AKKAYA Eurasian Journal of Educational Research 84 (2019) 1-28
7
3. Are the sub-dimensions of the organizational citizenship behavior significant predictors of CWBs based on administrators’ and teachers' perceptions?
Method
Research Design
The main objective of this study was to establish the level of OCBs and CWBs based
on public primary school administrators’ and teachers' perceptions, and the relationship between these two variables. Therefore, this study was conducted in a
correlational survey model. The correlational survey is a research model to determine the existence of covariance or its level between two or more variables (Karasar, 2015,
81).
Research Sample
The sample of this study was formed in the 2018-2019 academic year, consisted of
public primary school administrators and teachers who worked in nine different districts of Ankara. This study employed the stratified sampling method to take
samples from this population. Each of the administrators and teachers who worked in
the primary schools located in these nine districts was considered as a sub-population, and samples were taken from these groups. The sample size of this study was
calculated using Cochran’s formula (1962, cited in Balci, 2004, 95), and the tolerance
level was accepted as 0.05, and confidence level was accepted as 1.96. All in all, 360 school administrators and 430 teachers participated in this study.
Research Instruments and Procedure
The research data were collected using the “Counter-productive Work Behavior Scale (CWB-S)” developed by the researcher and “Organizational Citizenship
Behavior Scale (OCB-S)” developed by Basim and Sesen (2006).
CWB Scale
A pre-implementation was performed to examine the construct validity and reliability of the CWB Scale. The pre-implementation data were collected from 413
participants, including 331 teachers and 82 administrators who worked in official
primary and secondary schools located in Ankara province. The exploratory factor analysis method (EFA) was used to control the construct validity of the scale. Also, the
Kaiser-Meyer-Olkin (KMO) test was performed to control the appropriateness of the
data structure concerning sample size for the factor analysis. The KMO value was found as 0.96, and the sample size was found highly appropriate for exploratory factor
analysis. The chi-square value obtained from Bartlett's test for sphericity yielded a
significant result, and it was reported that the data were produced by a multivariate normal distribution (X2(1711) = 21800.176; p<0.01).
8 Burcu AKKAYA Eurasian Journal of Educational Research 84 (2019) 1-28
To identify the number of factors in the exploratory factor analysis process, the
variance ratios explained by eigenvalues were considered, varimax rotation technique
was applied, and the acceptance level for factor load values was found as 0.45. As a result of the exploratory factor analysis, a total of 59 items were distributed among
seven sub-dimensions, and these seven dimensions explained the 67.92% of the total
variance. The categorizations included in the literature were considered while naming the sub-dimensions. The dimensions of CWBs were analyzed under seven sub-
dimensions: (i) abuse toward others, (ii) abuse toward administrative functioning, (iii)
sabotage, (iv) theft, (v) withdrawal, vi) abuse toward school image and vii) abuse toward schooling.
The total item correlation values and Chronbach’s Alpha values were calculated for the reliability analysis of the items. The total correlation values were found above
0.50 for all items, and Cronbach’s Alpha values changed between 0.86 and 0.95.
OCB Scale
The Organizational Citizenship Behavior Scale, which was adapted to Turkish by Basim ve Sesen (2006), was used to identify participants' perceptions towards
organizational citizenship behavior. The scale consists of five dimensions as follows:
Altruism, Courtesy, Conscientiousness, Sportsmanship, and Civic Virtue. A first-level confirmatory factor analysis was performed to control whether the structure of the
scale was maintained for teachers and administrators who work in educational
institutions. In the examination of analysis findings, t-values, error variances, p significance values, chi-square/ degrees of freedom, (X²/df) ratio and RMSEA values
and the fit indices, including GFI, AGFI, RMR, NNFI, CFI were assessed, and the
findings provided below were reached.
The findings showed that each of the t-values of the observed variables was above
2.58, between 9.96 and 22.51, and were significant at p<0.01. The error variances
included in the standardized solution part showed that most of the items produced considerably low results between 0.20 - 0.40 and were at the acceptance level. The
indicators were decided to be kept in the model.
The ratio of the Chi/square (X²) value (538.50), which is one of the most common cohesion criteria for confirmatory factor analysis, to the degree of freedom (140) was
found as 3.85. The value of this ratio between 3 and 5 corresponds to a medium level
cohesion (Sumer, 2000). RMSEA value was found as 0.076 and indicated a good fit (Cokluk, Sekercioglu, Buyukozturk, 2010). The GFI value was reported as 0.88, and
AGFI value was reported as 0.84, and it was found at the adequate cohesion level. The
standardized RMR value was found as 0.037. This value indicates a perfect fit under 0.05 (Brown 2006, cited in Cokluk, Sekercioglu, Buyukozturk, 2010). Therefore, it can
be seen that the RMR value showed a perfect fit. Both of the NNFI and CFI values were found as 0.98. NNFI and CFI indexes above 0.95 indicate a perfect fit (Sumer, 2000). In
this framework, the level of fit indices of the confirmatory factor analysis can be
assumed at an adequate level.
Burcu AKKAYA Eurasian Journal of Educational Research 84 (2019) 1-28
9
Within the scope of the reliability analysis, the item-total correlation values of the
scale were found above 0.40 for all items, and the Cronbach’s Alpha values varied between 0.87 and 0.89.
Data Analysis
The SPSS and Lisrel package programs were used in the data analysis. Descriptive statistics, including arithmetic, mean and standard deviation, and parametric statistics
technique, linear regression analysis, were employed in the data analysis process. In
multilinear regression analysis, multivariate normality, linearity and multicollinearity conditions were controlled. Thus, histogram, scatter plot, the relationship between the
independent variables, tolerance and VIF values were examined. The findings
demonstrated that histograms showed a normal distribution curve for all variables; in the scatter plot the dots gathered around the zero lines to a large extent (Cokluk,
Sekercioglu, & Buyukozturk, 2010, p. 18), and the conditions of normality and linearity
of the relationship were met.
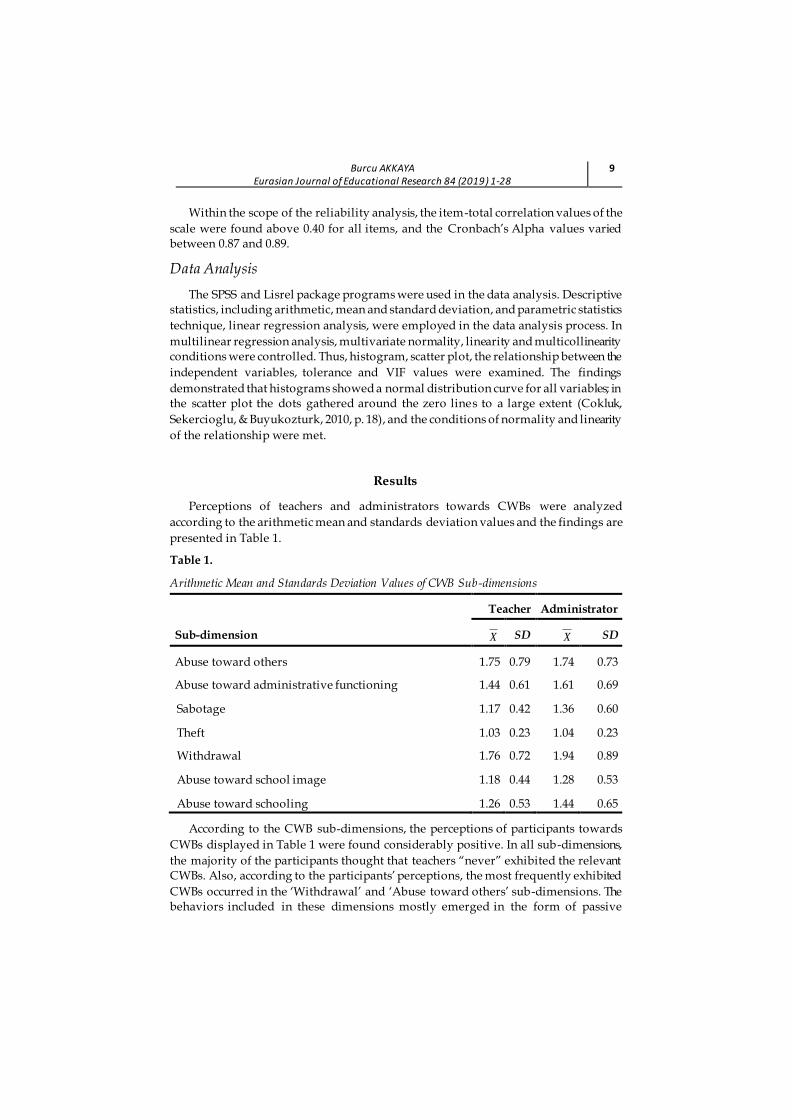
Results
Perceptions of teachers and administrators towards CWBs were analyzed
according to the arithmetic mean and standards deviation values and the findings are
presented in Table 1.
Table 1.
Arithmetic Mean and Standards Deviation Values of CWB Sub-dimensions
Teacher Administrator
Sub-dimension X SD X SD
Abuse toward others 1.75 0.79 1.74 0.73
Abuse toward administrative functioning 1.44 0.61 1.61 0.69
Sabotage 1.17 0.42 1.36 0.60
Theft 1.03 0.23 1.04 0.23
Withdrawal 1.76 0.72 1.94 0.89
Abuse toward school image 1.18 0.44 1.28 0.53
Abuse toward schooling 1.26 0.53 1.44 0.65
According to the CWB sub-dimensions, the perceptions of participants towards
CWBs displayed in Table 1 were found considerably positive. In all sub-dimensions,
the majority of the participants thought that teachers “never” exhibited the relevant CWBs. Also, according to the participants’ perceptions, the most frequently exhibited
CWBs occurred in the ‘Withdrawal’ and ‘Abuse toward others’ sub-dimensions. The behaviors included in these dimensions mostly emerged in the form of passive
10 Burcu AKKAYA Eurasian Journal of Educational Research 84 (2019) 1-28
behaviors, such as gossiping or ignoring that do not involve face-to-face interactions
or reactions.
The least frequent CWBs were included in the ‘Theft’ sub-dimension. Besides, the teachers and administrators thought that teachers seldomly exhibit the behaviors
included in the ‘Theft’ sub-dimension. On the other hand, the teachers and
administrators believed that teachers rarely exhibit behaviors included in the ‘Withdrawal’ sub-dimension more than others, such as unwillingness to stay after
school to continue working, avoid to take a risk and reluctance to participate in
decision-making processes. On this matter, administrators’ perceptions were more negative in comparison to the teachers’ perceptions. Furthermore, standard deviation
values that were found below 1 in all dimensions for teachers and administrators showed that both groups had a consensus and similar perceptions in all dimensions.
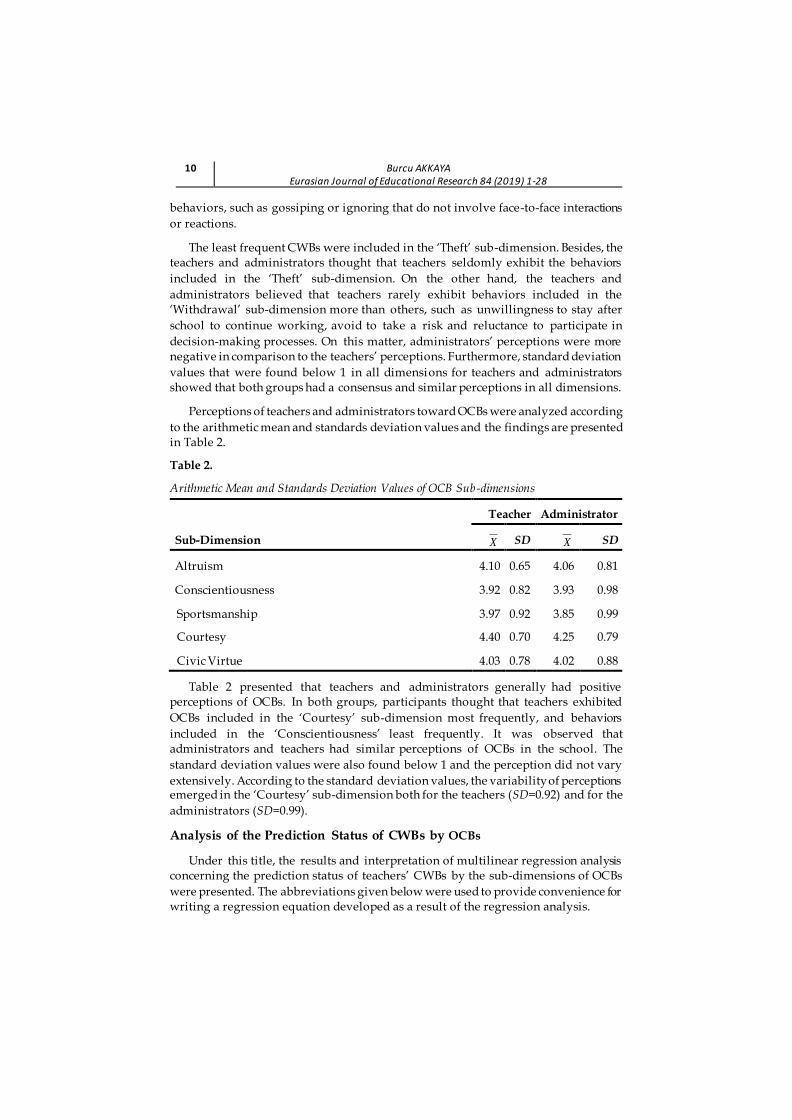
Perceptions of teachers and administrators toward OCBs were analyzed according
to the arithmetic mean and standards deviation values and the findings are presented in Table 2.
Table 2.
Arithmetic Mean and Standards Deviation Values of OCB Sub-dimensions
Teacher Administrator
Sub-Dimension X SD X SD
Altruism 4.10 0.65 4.06 0.81
Conscientiousness 3.92 0.82 3.93 0.98
Sportsmanship 3.97 0.92 3.85 0.99
Courtesy 4.40 0.70 4.25 0.79
Civic Virtue 4.03 0.78 4.02 0.88
Table 2 presented that teachers and administrators generally had positive perceptions of OCBs. In both groups, participants thought that teachers exhibited
OCBs included in the ‘Courtesy’ sub-dimension most frequently, and behaviors
included in the ‘Conscientiousness’ least frequently. It was observed that administrators and teachers had similar perceptions of OCBs in the school. The
standard deviation values were also found below 1 and the perception did not vary
extensively. According to the standard deviation values, the variability of perceptions emerged in the ‘Courtesy’ sub-dimension both for the teachers (SD=0.92) and for the
administrators (SD=0.99).
Analysis of the Prediction Status of CWBs by OCBs
Under this title, the results and interpretation of multilinear regression analysis concerning the prediction status of teachers’ CWBs by the sub-dimensions of OCBs
were presented. The abbreviations given below were used to provide convenience for writing a regression equation developed as a result of the regression analysis.
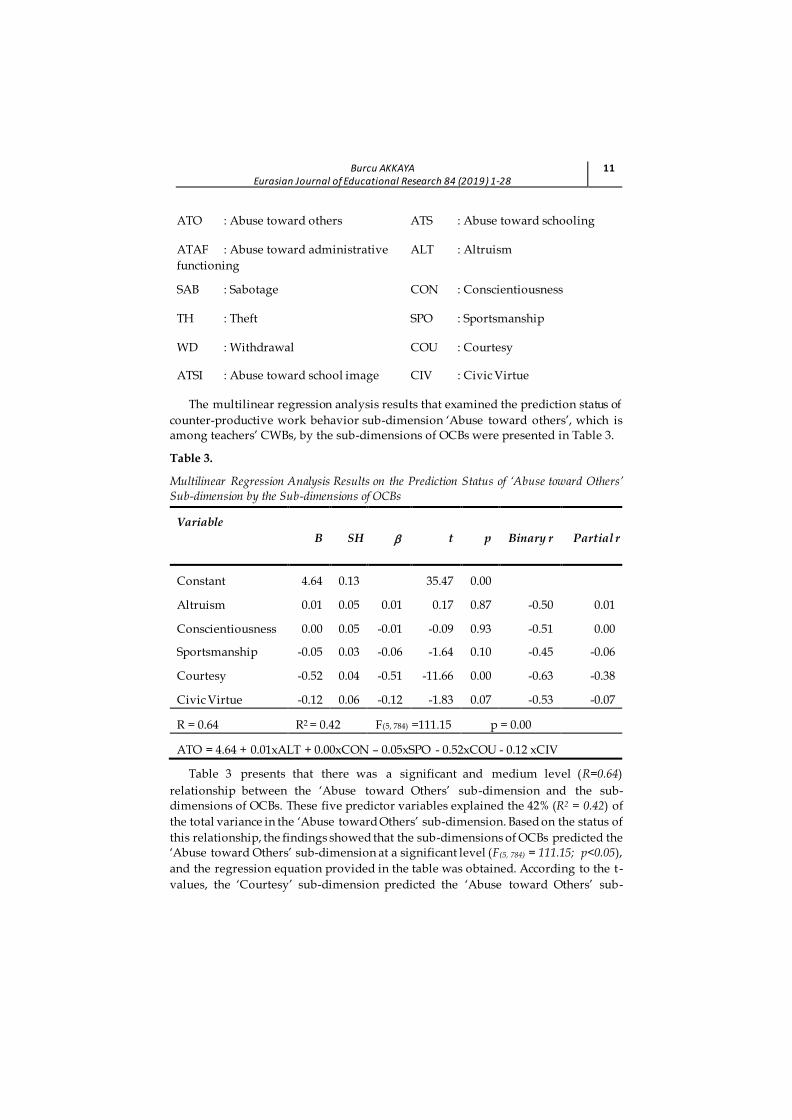
Burcu AKKAYA Eurasian Journal of Educational Research 84 (2019) 1-28
11
ATO : Abuse toward others ATS : Abuse toward schooling
ATAF : Abuse toward administrative
functioning
ALT : Altruism
SAB : Sabotage CON : Conscientiousness
TH : Theft SPO : Sportsmanship
WD : Withdrawal COU : Courtesy
ATSI : Abuse toward school image CIV : Civic Virtue
The multilinear regression analysis results that examined the prediction status of
counter-productive work behavior sub-dimension ‘Abuse toward others’, which is among teachers’ CWBs, by the sub-dimensions of OCBs were presented in Table 3.
Table 3.
Multilinear Regression Analysis Results on the Prediction Status of ‘Abuse toward Others’ Sub-dimension by the Sub-dimensions of OCBs
Variable
B SH t p Binary r Partial r
Constant 4.64 0.13 35.47 0.00
Altruism 0.01 0.05 0.01 0.17 0.87 -0.50 0.01
Conscientiousness 0.00 0.05 -0.01 -0.09 0.93 -0.51 0.00
Sportsmanship -0.05 0.03 -0.06 -1.64 0.10 -0.45 -0.06
Courtesy -0.52 0.04 -0.51 -11.66 0.00 -0.63 -0.38
Civic Virtue -0.12 0.06 -0.12 -1.83 0.07 -0.53 -0.07
R = 0.64 R2 = 0.42 F(5, 784) =111.15 p = 0.00
ATO = 4.64 + 0.01xALT + 0.00xCON – 0.05xSPO - 0.52xCOU - 0.12 xCIV
Table 3 presents that there was a significant and medium level (R=0.64)
relationship between the ‘Abuse toward Others’ sub-dimension and the sub-dimensions of OCBs. These five predictor variables explained the 42% (R2 = 0.42) of
the total variance in the ‘Abuse toward Others’ sub-dimension. Based on the status of
this relationship, the findings showed that the sub-dimensions of OCBs predicted the ‘Abuse toward Others’ sub-dimension at a significant level (F(5, 784) = 111.15; p<0.05),
and the regression equation provided in the table was obtained. According to the t -
values, the ‘Courtesy’ sub-dimension predicted the ‘Abuse toward Others’ sub-
12 Burcu AKKAYA Eurasian Journal of Educational Research 84 (2019) 1-28
dimension at a significant level (p<0.05). A negative and significant relationship was
found between the ‘Courtesy’ and ‘Abuse toward Others’ sub-dimensions.
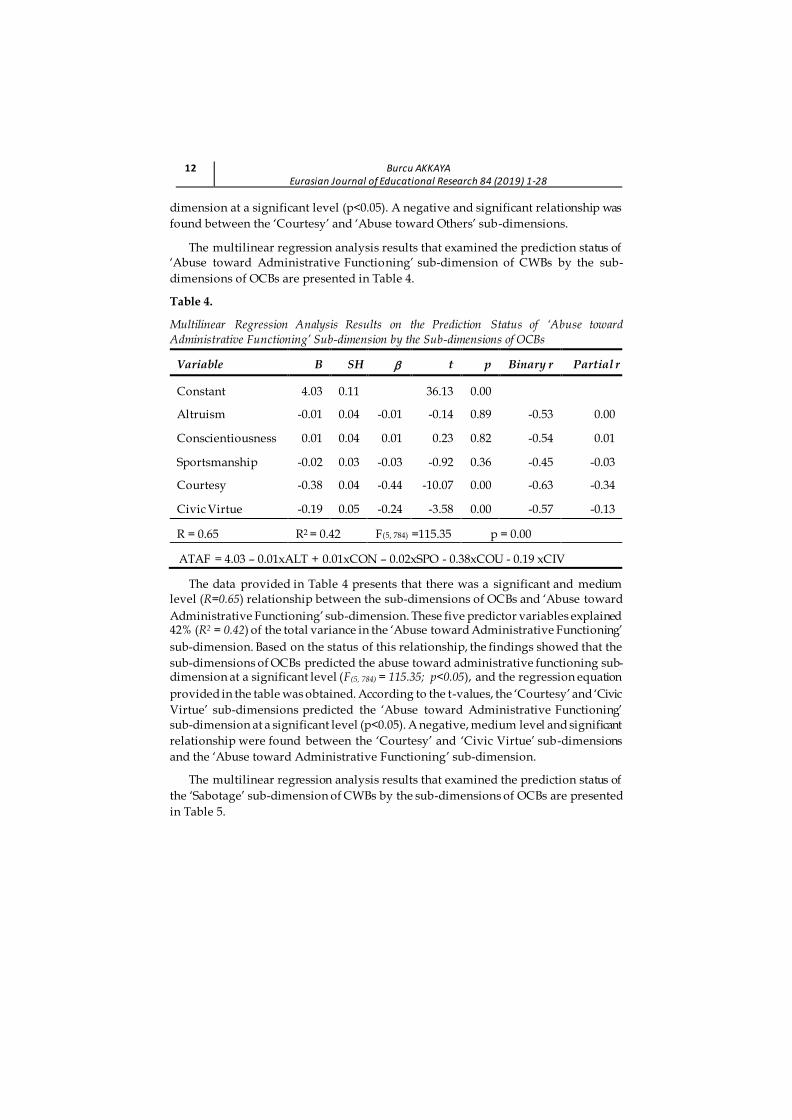
The multilinear regression analysis results that examined the prediction status of ‘Abuse toward Administrative Functioning’ sub-dimension of CWBs by the sub-
dimensions of OCBs are presented in Table 4.
Table 4.
Multilinear Regression Analysis Results on the Prediction Status of ‘Abuse toward Administrative Functioning’ Sub-dimension by the Sub-dimensions of OCBs
Variable B SH t p Binary r Partial r
Constant 4.03 0.11 36.13 0.00
Altruism -0.01 0.04 -0.01 -0.14 0.89 -0.53 0.00
Conscientiousness 0.01 0.04 0.01 0.23 0.82 -0.54 0.01
Sportsmanship -0.02 0.03 -0.03 -0.92 0.36 -0.45 -0.03
Courtesy -0.38 0.04 -0.44 -10.07 0.00 -0.63 -0.34
Civic Virtue -0.19 0.05 -0.24 -3.58 0.00 -0.57 -0.13
R = 0.65 R2 = 0.42 F(5, 784) =115.35 p = 0.00
ATAF = 4.03 – 0.01xALT + 0.01xCON – 0.02xSPO - 0.38xCOU - 0.19 xCIV
The data provided in Table 4 presents that there was a significant and medium level (R=0.65) relationship between the sub-dimensions of OCBs and ‘Abuse toward
Administrative Functioning’ sub-dimension. These five predictor variables explained 42% (R2 = 0.42) of the total variance in the ‘Abuse toward Administrative Functioning’
sub-dimension. Based on the status of this relationship, the findings showed that the
sub-dimensions of OCBs predicted the abuse toward administrative functioning sub-dimension at a significant level (F(5, 784) = 115.35; p<0.05), and the regression equation
provided in the table was obtained. According to the t-values, the ‘Courtesy’ and ‘Civic
Virtue’ sub-dimensions predicted the ‘Abuse toward Administrative Functioning’ sub-dimension at a significant level (p<0.05). A negative, medium level and significant
relationship were found between the ‘Courtesy’ and ‘Civic Virtue’ sub-dimensions
and the ‘Abuse toward Administrative Functioning’ sub-dimension.
The multilinear regression analysis results that examined the prediction status of
the ‘Sabotage’ sub-dimension of CWBs by the sub-dimensions of OCBs are presented
in Table 5.

Burcu AKKAYA Eurasian Journal of Educational Research 84 (2019) 1-28
13
Table 5.
Multilinear Regression Analysis Results on the Prediction Status of ‘Sabotage’ Sub-dimension
by the Sub-dimensions of OCBs
Variable B SH t p Binary r Partial r
Constant 2.91 0.10 29.85 0.00
Altruism -0.04 0.04 -0.05 -0.97 0.33 -0.45 -0.03
Conscientiousness -0.07 0.04 -0.12 -1.88 0.06 -0.47 -0.07
Sportsmanship -0.02 0.02 -0.04 -1.03 0.30 -0.39 -0.04
Courtesy -0.24 0.03 -0.35 -7.20 0.00 -0.52 -0.25
Civic Virtue -0.02 0.05 -0.03 -0.46 0.65 -0.46 -0.02
R = 0.54 R2 = 0.30 F(5, 784) =65.53 p = 0.00
SAB = 2.91 – 0.04xALT - 0.07xCON – 0.02xSPO - 0.24xCOU - 0.02xCIV
The data provided in Table 5 present that there was a significant and medium level (R=0.54) relationship between the sub-dimensions of OCBs ‘Sabotage’ sub-dimension. These five predictor variables explained 30% (R2 = 0.30) of the total variance in the
‘Sabotage’ sub-dimension. Based on the status of this relationship, the findings
showed that the sub-dimensions of OCBs predicted the ‘Sabotage’ sub-dimension at a significant level (F(5, 784) = 65.53; p<0.05), and the regression equation provided in the
table was obtained. According to the t-values, the ‘Courtesy’ sub-dimension predicted
the ‘Sabotage’ sub-dimension at a significant level (p<0.05). A negative and significant relationship was found between the ‘Courtesy’ sub-dimension and the ‘Sabotage’ sub-
dimension.
The multilinear regression analysis results that examined the prediction status of the ‘Theft’ sub-dimension of CWBs by the sub-dimensions of OCBs are presented in
Table 6.
Tablo 6.
Multilinear Regression Analysis Results on the Prediction Status of ‘Theft’ Sub-dimension by the Sub-dimensions of OCBs
Variable B SH t p Binary r Partial r
Constant 1.32 0.05 25.73 0.00
Altruism -0.02 0.02 -0.07 -1.13 0.26 -0.17 -0.04
Conscientiousness -0.02 0.02 -0.06 -0.77 0.44 -0.16 -0.03
Sportsmanship 0.00 0.01 0.01 0.15 0.88 -0.12 0.01
Courtesy -0.05 0.02 -0.15 -2.67 0.01 -0.20 -0.09
Civic Virtue 0.02 0.02 0.06 0.70 0.48 -0.15 0.03
R = 0.20 R2 = 0.04 F(5, 784) =6.65 p = 0.00
TH = 1.32 – 0.02xALT - 0.02xCON + 0.00xSPO - 0.05xCOU + 0.02xCIV
14 Burcu AKKAYA Eurasian Journal of Educational Research 84 (2019) 1-28
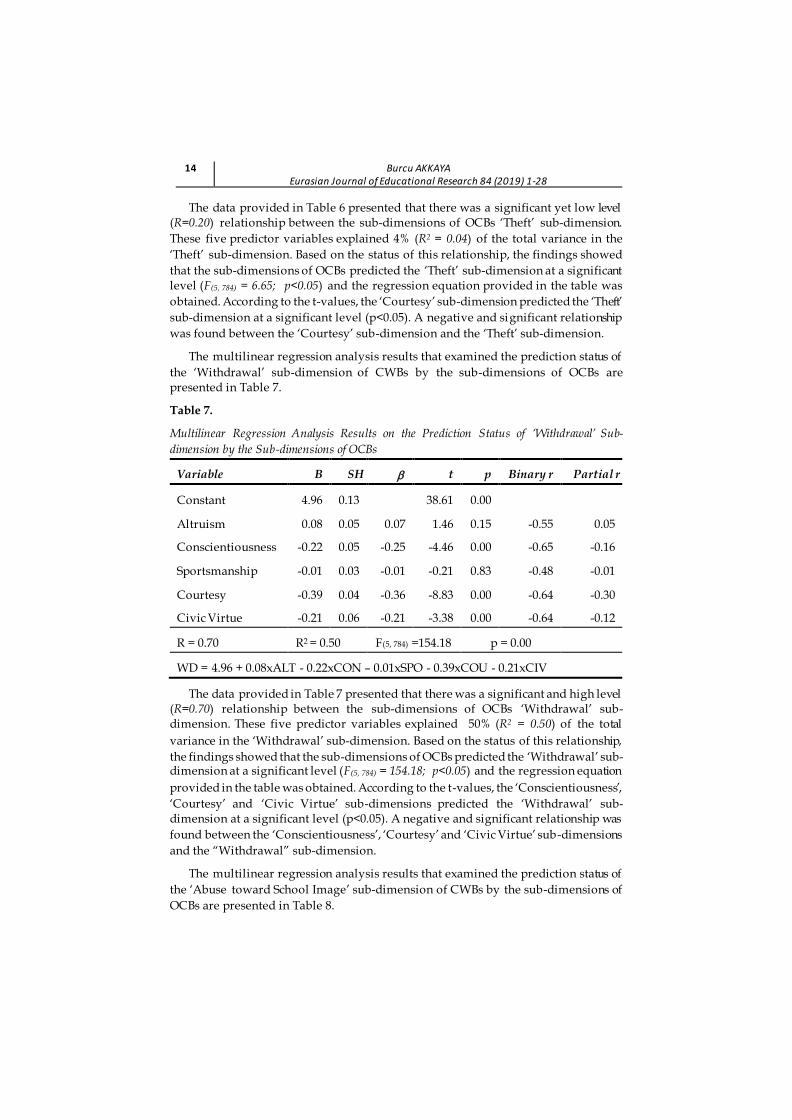
The data provided in Table 6 presented that there was a significant yet low level (R=0.20) relationship between the sub-dimensions of OCBs ‘Theft’ sub-dimension.
These five predictor variables explained 4% (R2 = 0.04) of the total variance in the
‘Theft’ sub-dimension. Based on the status of this relationship, the findings showed
that the sub-dimensions of OCBs predicted the ‘Theft’ sub-dimension at a significant level (F(5, 784) = 6.65; p<0.05) and the regression equation provided in the table was
obtained. According to the t-values, the ‘Courtesy’ sub-dimension predicted the ‘Theft’
sub-dimension at a significant level (p<0.05). A negative and significant relationship
was found between the ‘Courtesy’ sub-dimension and the ‘Theft’ sub-dimension.
The multilinear regression analysis results that examined the prediction status of
the ‘Withdrawal’ sub-dimension of CWBs by the sub-dimensions of OCBs are presented in Table 7.
Table 7.
Multilinear Regression Analysis Results on the Prediction Status of ‘Withdrawal’ Sub-
dimension by the Sub-dimensions of OCBs
Variable B SH t p Binary r Partial r
Constant 4.96 0.13 38.61 0.00
Altruism 0.08 0.05 0.07 1.46 0.15 -0.55 0.05
Conscientiousness -0.22 0.05 -0.25 -4.46 0.00 -0.65 -0.16
Sportsmanship -0.01 0.03 -0.01 -0.21 0.83 -0.48 -0.01
Courtesy -0.39 0.04 -0.36 -8.83 0.00 -0.64 -0.30
Civic Virtue -0.21 0.06 -0.21 -3.38 0.00 -0.64 -0.12
R = 0.70 R2 = 0.50 F(5, 784) =154.18 p = 0.00
WD = 4.96 + 0.08xALT - 0.22xCON – 0.01xSPO - 0.39xCOU - 0.21xCIV
The data provided in Table 7 presented that there was a significant and high level (R=0.70) relationship between the sub-dimensions of OCBs ‘Withdrawal’ sub-dimension. These five predictor variables explained 50% (R2 = 0.50) of the total
variance in the ‘Withdrawal’ sub-dimension. Based on the status of this relationship,
the findings showed that the sub-dimensions of OCBs predicted the ‘Withdrawal’ sub-dimension at a significant level (F(5, 784) = 154.18; p<0.05) and the regression equation
provided in the table was obtained. According to the t-values, the ‘Conscientiousness’,
‘Courtesy’ and ‘Civic Virtue’ sub-dimensions predicted the ‘Withdrawal’ sub-dimension at a significant level (p<0.05). A negative and significant relationship was
found between the ‘Conscientiousness’, ‘Courtesy’ and ‘Civic Virtue’ sub -dimensions
and the “Withdrawal” sub-dimension.
The multilinear regression analysis results that examined the prediction status of
the ‘Abuse toward School Image’ sub-dimension of CWBs by the sub-dimensions of
OCBs are presented in Table 8.
Burcu AKKAYA Eurasian Journal of Educational Research 84 (2019) 1-28
15
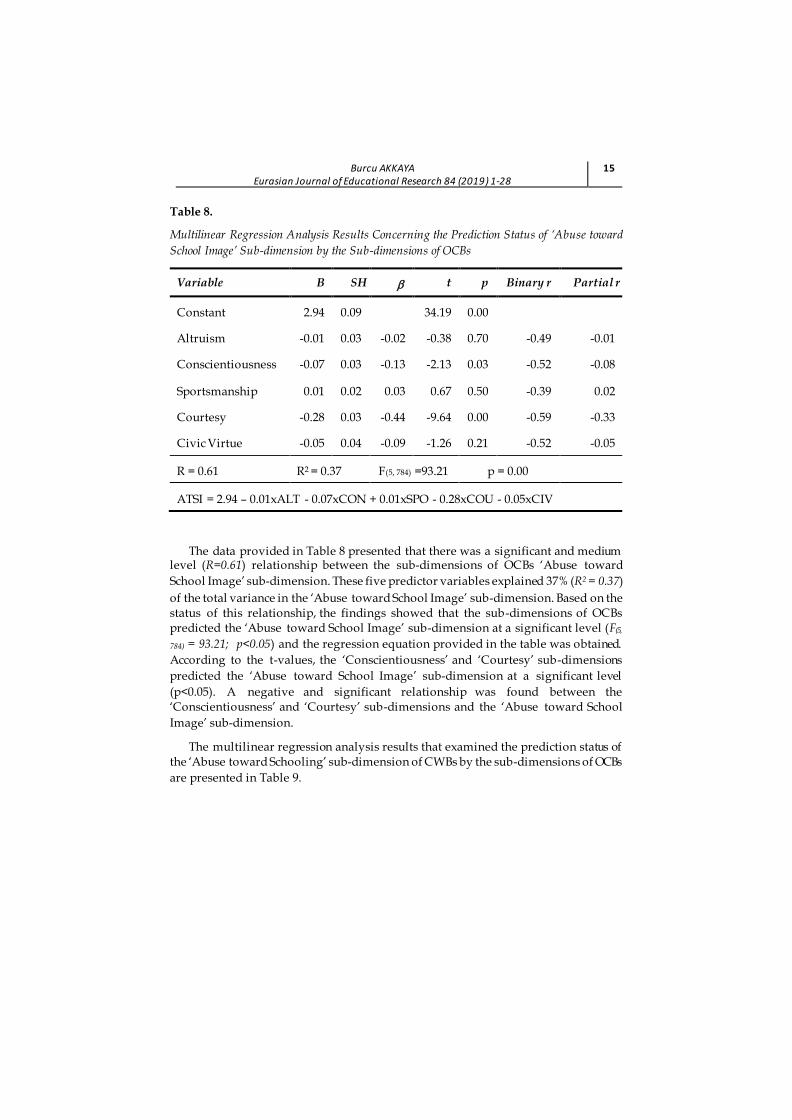
Table 8.
Multilinear Regression Analysis Results Concerning the Prediction Status of ‘Abuse toward
School Image’ Sub-dimension by the Sub-dimensions of OCBs
Variable B SH t p Binary r Partial r
Constant 2.94 0.09 34.19 0.00
Altruism -0.01 0.03 -0.02 -0.38 0.70 -0.49 -0.01
Conscientiousness -0.07 0.03 -0.13 -2.13 0.03 -0.52 -0.08
Sportsmanship 0.01 0.02 0.03 0.67 0.50 -0.39 0.02
Courtesy -0.28 0.03 -0.44 -9.64 0.00 -0.59 -0.33
Civic Virtue -0.05 0.04 -0.09 -1.26 0.21 -0.52 -0.05
R = 0.61 R2 = 0.37 F(5, 784) =93.21 p = 0.00
ATSI = 2.94 – 0.01xALT - 0.07xCON + 0.01xSPO - 0.28xCOU - 0.05xCIV
The data provided in Table 8 presented that there was a significant and medium level (R=0.61) relationship between the sub-dimensions of OCBs ‘Abuse toward
School Image’ sub-dimension. These five predictor variables explained 37% (R2 = 0.37)
of the total variance in the ‘Abuse toward School Image’ sub-dimension. Based on the status of this relationship, the findings showed that the sub-dimensions of OCBs predicted the ‘Abuse toward School Image’ sub-dimension at a significant level (F(5,
784) = 93.21; p<0.05) and the regression equation provided in the table was obtained.
According to the t-values, the ‘Conscientiousness’ and ‘Courtesy’ sub-dimensions
predicted the ‘Abuse toward School Image’ sub-dimension at a significant level
(p<0.05). A negative and significant relationship was found between the ‘Conscientiousness’ and ‘Courtesy’ sub-dimensions and the ‘Abuse toward School
Image’ sub-dimension.
The multilinear regression analysis results that examined the prediction status of the ‘Abuse toward Schooling’ sub-dimension of CWBs by the sub-dimensions of OCBs
are presented in Table 9.
16 Burcu AKKAYA Eurasian Journal of Educational Research 84 (2019) 1-28
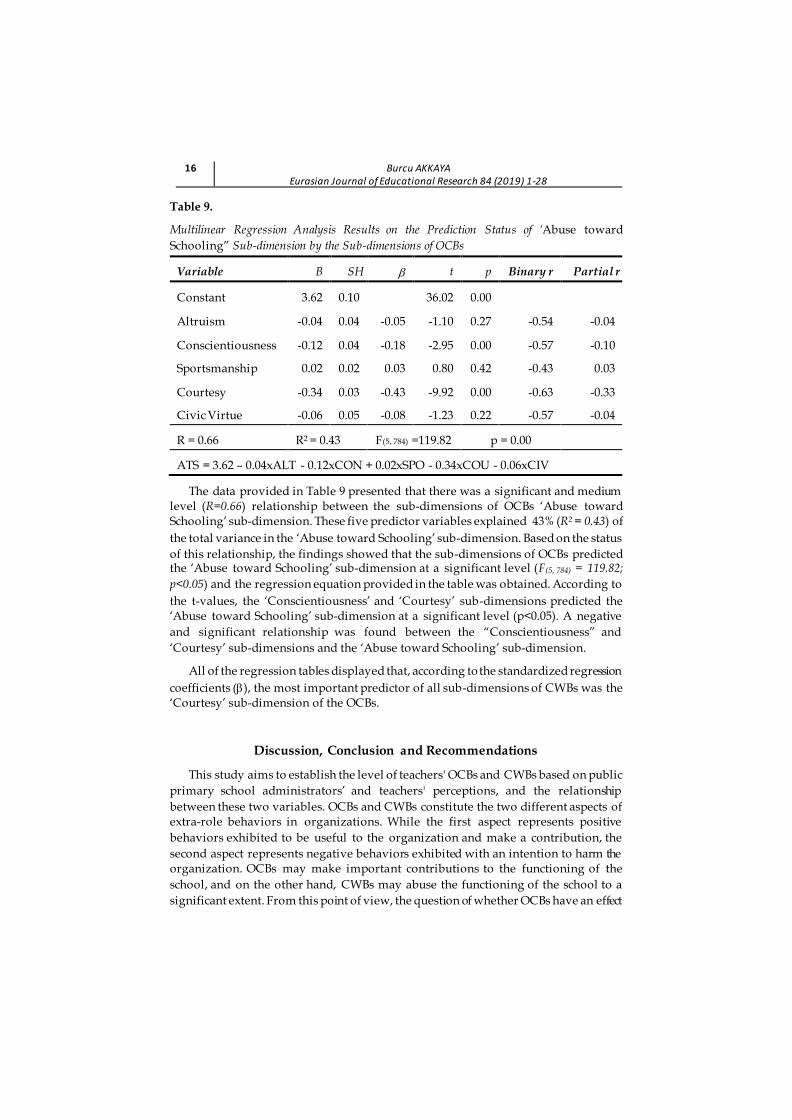
Table 9.
Multilinear Regression Analysis Results on the Prediction Status of ‘Abuse toward
Schooling” Sub-dimension by the Sub-dimensions of OCBs
Variable B SH t p Binary r Partial r
Constant 3.62 0.10 36.02 0.00
Altruism -0.04 0.04 -0.05 -1.10 0.27 -0.54 -0.04
Conscientiousness -0.12 0.04 -0.18 -2.95 0.00 -0.57 -0.10
Sportsmanship 0.02 0.02 0.03 0.80 0.42 -0.43 0.03
Courtesy -0.34 0.03 -0.43 -9.92 0.00 -0.63 -0.33
Civic Virtue -0.06 0.05 -0.08 -1.23 0.22 -0.57 -0.04
R = 0.66 R2 = 0.43 F(5, 784) =119.82 p = 0.00
ATS = 3.62 – 0.04xALT - 0.12xCON + 0.02xSPO - 0.34xCOU - 0.06xCIV
The data provided in Table 9 presented that there was a significant and medium level (R=0.66) relationship between the sub-dimensions of OCBs ‘Abuse toward Schooling’ sub-dimension. These five predictor variables explained 43% (R2 = 0.43) of
the total variance in the ‘Abuse toward Schooling’ sub-dimension. Based on the status
of this relationship, the findings showed that the sub-dimensions of OCBs predicted the ‘Abuse toward Schooling’ sub-dimension at a significant level (F(5, 784) = 119.82;
p<0.05) and the regression equation provided in the table was obtained. According to
the t-values, the ‘Conscientiousness’ and ‘Courtesy’ sub-dimensions predicted the ‘Abuse toward Schooling’ sub-dimension at a significant level (p<0.05). A negative
and significant relationship was found between the “Conscientiousness” and
‘Courtesy’ sub-dimensions and the ‘Abuse toward Schooling’ sub-dimension.
All of the regression tables displayed that, according to the standardized regression
coefficients (), the most important predictor of all sub-dimensions of CWBs was the ‘Courtesy’ sub-dimension of the OCBs.
Discussion, Conclusion and Recommendations
This study aims to establish the level of teachers' OCBs and CWBs based on public
primary school administrators’ and teachers' perceptions, and the relationship
between these two variables. OCBs and CWBs constitute the two different aspects of extra-role behaviors in organizations. While the first aspect represents positive
behaviors exhibited to be useful to the organization and make a contribution, the
second aspect represents negative behaviors exhibited with an intention to harm the organization. OCBs may make important contributions to the functioning of the
school, and on the other hand, CWBs may abuse the functioning of the school to a
significant extent. From this point of view, the question of whether OCBs have an effect
Burcu AKKAYA Eurasian Journal of Educational Research 84 (2019) 1-28
17
on CWBs was considered as a significant question to be analyzed. This study
employed the correlational survey model, and the data collected from the participants via scales were analyzed using the multilinear regression analysis method.
The research findings showed that CWBs are not frequently exhibited in schools.
Although these behaviors rarely occurred, the most common behaviors included withdrawal and abuse toward others. The CWBs exhibited by teachers mostly
included passive behaviors that do not require face-to-face interaction between
individuals, such as not staying after school to continue working, gossiping and ignoring. Behaviors, such as theft, putting pressure on others and mocking, were not
commonly observed in schools. These findings of the study are in line with Greenberg
and Barling's (1999) research, while they differ from Bulbul's (2013) research. In their research on the aggressive behaviors of employees, Greenberg and Barling (1999)
found that participants used psychological violence against their colleagues (82%),
subordinates (74%) and superiors (76%) at least once and that the most common behavior in this type of violence was gossip. Bulbul (2013), on the other hand, stated
that the most commonly observed behaviors among violent behaviors were verbal
harassment behaviors. A similar finding was obtained in the study of Verona, Reed, Curtin and Pole (2007), which discussed CWBs in two dimensions: explicit and
implicit. In this study, implicit behaviors were reported to be more frequent than
explicit behaviors. Considering that implicit behaviors are passive behaviors, it can be said that the findings of Verona et al. (2007) are in the same l ine with this research
findings. Teachers who exhibit CWBs mostly prefer to exhibit passive behaviors; a
possible explanation for this situation might be that such kind of direct, obvious and active behaviors exhibited in organizations may constitute an offense within the
regulations and there is a high probability to be penalized.
OCBs were frequently exhibited in schools. In the study of Yaylaci (2004), teachers and administrators stated that their colleagues generally exhibited OCBs. Also, in
many studies about organizational citizenship behaviors, this kind of behavior of
employees was examined. For example, in the research conducted by Işbaşi (2001) in the field of tourism, Loga (2003), in the military field and Unal (2003) in the field of
education, the findings showed that the employees exhibited high levels of OCBs.
Therefore, it is possible to say that the findings of this study are consistent with the above-mentioned studies. In addition, the results of this research support many
studies conducted in the field of education. For example, Bas and Sentürk (2011),
Bogler and Somech (2005), Cetin, Yesilbag and Akdag Cetin, Yesilbag, and Akdag (2003), Karaman, Yucel and Donder (2008), Nguni, Sleegers and Denessen (2006)
found that these behaviors were frequently exhibited by teachers in schools.
Research shows that female teachers in Turkey, compared to men, exhibit more
OCBs. On the other hand, Aytac, Elma, and Cinkir (2019) have conducted a meta-
analysis of the research on teachers’ OCB and found that gender caused a minor difference in teachers' perceptions. These researchers have stated that not using the
gender variable in future studies may be on the agenda.
18 Burcu AKKAYA Eurasian Journal of Educational Research 84 (2019) 1-28
According to the results of the research, most common behaviors, such as
respecting the rights of others and not causing problems, are the most common OCBs.
Courtesy behaviors, such as showing respect to others and avoiding problems were among the most common behaviors. Similarly, while OCBs were frequently exhibited
in schools, conscientiousness behaviors, such as spending extra time and helping
others, were relatively rare. Podsakoff and MacKenzie (1994) defined courtesy as foresightful gestures that express kindness towards others. The focus of the courtesy
behaviors is not the organization but the employees. Therefore, Turnipseed and
Murkison (2000) indicated that such kinds of behaviors have a direct impact on employees and indirect impact on the organization. According to the researchers, the
positive impact on the employees affects the organizational climate, and accordingly, this situation positively affects the organizational outcome and productivity. In this
respect, courtesy behaviors that are exhibited frequently can make positive
contributions to the school climate.
The findings showed that OCBs under the courtesy dimension significantly
predicted the CVBs sub-dimension ‘Abuse toward others’. The ‘Courtesy’ sub-
dimension mostly consists of proactive behaviors, such as showing respect to others (Schnake, Cochran, & Dumler, 1995), protecting one’s rights (Cilla, 2011) and warning
others toward hazards (Deluga, 1994). In other words, behaviors related to taking
precautions exhibited to avoid problems in the workplace are associated with courtesy. An employee who exhibits such kinds of behaviors is highly-likely to avoid
behaviors of abusing others. The findings of the study also show similarities with the
study conducted by Dunlop and Lee (2004). The researchers examined CWBs under two dimensions: ‘individual-targeted’ and ‘organization-targeted’. In other words,
they named the ‘abuse toward others’ dimension as ‘CWB toward an individual’. The
relevant study reported a negative and significant relationship between CWB toward an individual and OCBs.
The findings showed that there was a negative and significant relationship
between the ‘Courtesy’ sub-dimension and ‘Abuse toward Administrative Functioning’ sub-dimension. ‘Courtesy’ represented the most important predictor of
this sub-dimension. As mentioned previously, courtesy is associated with behaviors
of preventing/avoiding problems, and therefore, it was expected to find a negative relationship with abuse toward administrative functioning behaviors. Civic virtue
includes behaviors, such as being interested/sensitive towards experiences that occur
within organizational processes and active participation in these processes (Organ, 1988). Examples of these behaviors include participation in problem-solving processes,
work-related meetings, and administrative decision-making processes (Podsakoff &
MacKenzie, 1994). It can be seen that ‘Civic Virtue’ sub-dimension includes active participation in administrative processes, and in a way, these behaviors can also be
described as supporting administrative functioning behaviors. Therefore, it can be
assumed that an employee who exhibits civic virtue behaviors would avoid abuse toward administrative functioning behaviors. In this context, the findings of this study
are consistent with the literature.
Burcu AKKAYA Eurasian Journal of Educational Research 84 (2019) 1-28
19
The findings of the study showed that the ‘Courtesy’ sub-dimension significantly
predicted the ‘Sabotage’ sub-dimension. This finding indicated that the tendency of an employee -who exhibits courtesy behaviors, that include controlled (Allison et al.,
2001) and proactive behaviors to avoid problems in the workplace (Cilla, 2011) to
exhibit sabotage behaviors would be low, and this finding was also in line with the literature. Moreover, the findings of this study are consistent with Hafidz, Hoesni and
Fatimah’s (2012) findings to a certain extent. The aforementioned researchers also
reported a negative and significant relationship between the sabotage sub-dimension and OCBs. The same study revealed that there was a negative and significant
relationship between courtesy sub-dimension and CWBs.
The most important predictor of the ‘Theft’ sub-dimension was also the ‘Courtesy’ sub-dimension. This suggests that an employee who exhibits proactive behaviors to
make positive contributions to the organization would also avoid ‘Theft’ behaviors
targeted at the organization and employees. The findings of this study are in agreement with the findings of Hafidz et al. (2012). The researchers showed that there
was a negative and significant relationship between both ‘Theft’ and OCBs and
between ‘Courtesy’ and CWBs.
The findings showed that ‘Conscientiousness’, ‘Courtesy’ and ‘Civic Virtue’
dimensions significantly predicted the ‘Withdrawal’ sub-dimension. These results
indicate that withdrawal behaviors will decrease with an increase in conscientiousness, courtesy and civic virtue behaviors. Conscientiousness is
associated with avoiding violation of established rules in an organization and acting
in compliance with work ethics. The examples of behaviors in this sub-dimension include complying with the work schedule, using the work time properly and
effectively, and continuing to work (Barksdale & Werner, 2001). As presented, these
behaviors are situated in the negative direction to the behaviors included in the ‘Withdrawal’ sub-dimension of CWBs, such as absence in work, non-compliance with
working time and spending time for other activities during working. The same
situation is also relevant for ‘Courtesy’ and ‘Civic Virtue’ sub -dimensions. Thus an employee who puts an effort to prevent problems and avoid creating problems is
expected to have a low tendency to exhibit withdrawal behaviors. It can be argued that
civic virtue behavior that includes active participation in the organization is the opposite of the withdrawal behavior that indicates self-isolation behaviors. Thus, it is
possible to conclude that the findings of the study are consistent with the literature.
The conscientiousness and courtesy sub-dimensions significantly predicted the ‘Abuse toward School Image’ sub-dimension. The findings showed that an increase in
conscientiousness and courtesy behaviors lead to a decrease in abuse toward school image sub-dimension behaviors. The ‘Conscientiousness’ sub-dimension represents
the behaviors that are exhibited to protect and improve the pecuniary and non-
pecuniary assets of the organization. Therefore a teacher who exhibits such behaviors is expected to avoid behaviors that may abuse the school image. Furthermore, courtesy
is a sub-dimension that includes the controlled behavior of employees. A self-
controlled employee is also expected to avoid exhibiting behaviors that may abuse the school image.
20 Burcu AKKAYA Eurasian Journal of Educational Research 84 (2019) 1-28
The ‘Conscientiousness’ and ‘Courtesy’ sub-dimensions were important predictors
of the ‘Abuse toward Schooling’ sub-dimension. The ‘Abuse toward Schooling’ sub-
dimension includes adverse behaviors, such as establishing negative communication with parents, refusing to cooperate with parents and informing them about the
performance of the student. Thus, a teacher who exhibits conscientiousness and
courtesy sub-dimensions is also expected to avoid ‘Abuse toward Schooling’ behaviors.
Although CWBs are not observed in schools very frequently, enhancing control
mechanisms and disincentives would assist in improving the current situation. Furthermore, given the negative impacts of courtesy behaviors on CWBs, employees
should be encouraged to follow the rules of courtesy in interpersonal relationships, and the issue should be highlighted by rewarding teachers who show successful
performance.
Future studies on the current topic are needed to explore the relationship between CWBs in schools and various variables, including organizational commitment,
organizational climate, personality types and leadership styles adopted by
administrators. By this means, theoretical foundations towards preventing CWBs in schools will be enhanced and provide guidance to practitioners.
References
Allison, B. J., Voss, R. S., & Dryer, S. (2001). Student classroom and career success: The role of organizational citizenship behavior. Journal of Education for Business, 76(5), 282-288.
Aquino, K., Douglas, S., & Martinko, M. J. (2004). Overt anger in response to
victimization: Attributional style and organizational norms as moderators. Journal of Occupational Health Psychology, 9(2), 152-164.
Aytac, T., Elma, C., & Cinkir, S. (2019). Effect of gender on teachers' organizational citizenship behavior: A meta-analysis. Educational Policy Analysis and Strategic Research, 14(3).
Balci, A. (2004). Sosyal bilimlerde araştırma: Yöntem, teknik ve ilkeler. Ankara: PegemA
Yayıncılık.
Barksdale, K., & Werner, J. M. (2001). Managerial ratings of in-role behaviors,
organizational citizenship behaviors, and overall performance: Testing different models of their relationship. Journal of Business Research, 51(2), 145-
155.
Baron, R. A., & Neuman, J. H. (1996). Workplace violence and workplace aggression: Evidence on their relative frequency and potential causes. Aggressive Behavior: Official Journal of the International Society for Research on Aggression, 22(3), 161-
173.
Burcu AKKAYA Eurasian Journal of Educational Research 84 (2019) 1-28
21
Bas, G., & Senturk, C. (2011). İlköğretim okulu öğretmenlerinin örgütsel adalet,
örgütsel vatandaşlık ve örgütsel güven algıları. Kuram ve Uygulamada Eğitim Yönetimi, 17(1), 29-62.
Basim, H. N., & Sesen, H. (2006). Örgütsel vatandaşlık davranışı ölçeği uyarlama ve karşılaştırma çalışması. Ankara Üniversitesi SBF Dergisi, 61(4), 83-101.
Bateman, T. S., & Organ, D. W. (1983). Job satisfaction and the good soldier: The relationship between affect and employee “citizenship”. Academy of
management journal, 26(4), 587-595.
Berry, C. M., Carpenter, N. C., & Barratt, C. L. (2012). Do other-reports of
counterproductive work behavior provide an incremental contribution over self-reports? A meta-analytic comparison. Journal of Applied Psychology, 97(3),
613-636.
Bogler, R., & Somech, A. (2005). Organizational citizenship behavior in school: How does it relate to participation in decision making? Journal of Educational Administration, 43(5), 420-438.
Bulbul, G. (2013). Havayolu taşımacılığında üretkenlik karşıtı davranışlar ve kabin
görevlilerinin algısı üzerine bir araştırma. (Yayımlanmamış yüksek lisans tezi).
Anadolu Üniversitesi Sosyal Bilimler Enstitüsü, Eskişehir.
Buss, A. H. (1961). The psychology of aggression. NewYork: Wiley.
Cetin, M., Yesilbag, Y., & Akdag, B. (2003). Öğretmenlerin örgütsel vatandaşlık davranışı. M.Ü. Atatürk Eğitim Fakültesi Eğitim Bilimleri Dergisi, 17, 39-54.
Cilla, M. J. (2011). Exploring the relationship between organizational citizenship behavior and
organizational climates for creativity. (Master's thesis). San José State University
The Faculty of the Department of Psychology, San Jose.
Cokluk, O., Sekercioglu, G., & Buyukozturk, S. (2010). Sosyal bilimler için çok değişkenli
istatistik: SPSS ve LISREL uygulamaları. Ankara: Pegem Akademi Yayıncılık.
Dalal, R. S. (2005). A meta-analysis of the relationship between organizational citizenship behavior and counterproductive work behavior. Journal of Applied
Psychology, 90(6), 1241-1255.
Deluga, R. J. (1994). Supervisor trust building, leader‐member exchange and organizational citizenship behaviour. Journal of occupational and Organizational
Psychology, 67(4), 315-326.
DiPaola, M. F., & Hoy, W. K. (2005). Organizational citizenship of faculty and achievement of high school students. The high school journal, 88(3), 35-44.
Dogruoz, E., & Ozdemir, M. (2018). Eğitim örgütlerinde üretim karşıtı iş davranışları ve örgütsel bağlılık İlişkisi. İlköğretim Online, 17(1), 396-413.
Duffy, M. K., Ganster, D. C., & Pagon, M. (2002). Social undermining in the workplace. Academy of management journal, 45(2), 331-351.
22 Burcu AKKAYA Eurasian Journal of Educational Research 84 (2019) 1-28
Duffy, M. K., Ganster, D. C., Shaw, J. D., Johnson, J. L., & Pagon, M. (2006). The social context of undermining behavior at work. Organizational behavior and human
decision processes, 101(1), 105-126.
Dunlop, P. D., & Lee, K. (2004). Workplace deviance, organizational citizenship
behavior, and business unit performance: The bad apples do spoil the whole barrel. Journal of Organizational Behavior, 25, 67-80.
Farh, J.-L., Earley, P. C., & Lin, S.-C. (1997). Impetus for action: A cultural analysis of
justice and organizational citizenship behavior in Chinese society. Administrative science quarterly, 42(3), 421-444.
Fox, S., & Stallworth, L. E. (2004). Racial/ethnic bullying: Exploring links between bullying and racism in the US workplace. Journal of vocational behavior, 66(3),
438-456.
Giacalone, R. A., & Rosenfeld, P. (1987). Reasons for employee sabotage in the workplace. Journal of Business and Psychology, 1(4), 367-378.
Greenberg, L., & Barling, J. (1999). Predicting employee aggression against coworkers,
subordinates and supervisors: The roles of person behaviors and perceived workplace factors. Journal of Organizational Behavior, 20, 897-913.
Gruys, M. L. (1999). The dimensionality of deviant employee behavior in the workplace.
(Unpublished doctoral dissertation). Minnesota University Industrial
Relations Center, Minneapolis.
Gualandri, M. (2012). Counterproductive work behaviors and moral disengagement.
(Unpublished doctoral dissertation). Sapienza University of Rome, Roma.
Hafidz, S. W. M., Hoesni, S. M., & Fatimah, O. (2012). The relationship between organizational citizenship behavior and counterproductive work behavior. Asian Social Science, 8(9), 32-37.
Isbaşi, J. O. (2001). Çalisanlarin yöneticilerine duyduklari güvenin ve örgütsel adalete iliskin algilamalarinin vatandaslik davranisinin olusumundaki rolü. Yönetim
Araştırmaları Dergisi, 1(1), 51-73.
Karaman, K., Yucel, C., & Donder, H. (2008). Öğretmen görüşlerine göre, okullardaki bürokrasi ile örgütsel vatandaşlık arasındaki ilişk i. Kuram ve Uygulamada
Eğitim Yönetimi, 53, 49-74.
Kidwell Jr, R. E., & Kochanowski, S. M. (2005). The morality of employee theft: Teaching about ethics and deviant behavior in the workplace. Journal of
management education, 29(1), 135-152.
Loga, A. (2003). Çalışanların demografik özelliklerinin örgütsel özdeşim, örgütsel bağlılık ve örgütsel vatandaşlık davranışına etkileri: Askeri birimlerde bir araştırma.
(Yayımlanmamış Yüksek Lisans Tezi). Başkent Üniversitesi Sosyal Bilimler
Enstitüsü, Ankara.
Burcu AKKAYA Eurasian Journal of Educational Research 84 (2019) 1-28
23
Low, K. D., Radhakrishnan, P., Schneider, K. T., & Rounds, J. (2007). The experiences
of bystanders of workplace ethnic harassment. Journal of Applied Social Psychology, 37(10), 2261-2297.
MacKenzie, S. B., Podsakoff, P. M., & Fetter, R. (1993). The impact of organizational citizenship behavior on evaluations of salesperson performance. Journal of marketing, 57(1), 70-80.
Miles, D. E., Borman, W. E., Spector, P. E., & Fox, S. (2002). Building an integrative
model of extra role work behaviors: A comparison of counterproductive work behavior with organizational citizenship behavior. International Journal
of Selection and Assessment, 10(1‐2), 51-57.
Mount, M., Ilies, R., & Johnson, E. (2006). Relationship of personality traits and counterproductive work behaviors: The mediating effects of job satisfaction. Personnel Psychology, 59(3), 591-622.
Nguni, S., Sleegers, P., & Denessen, E. (2006). Transformational and transactional leadership effects on teachers' job satisfaction, organizational commitment,
and organizational citizenship behavior in primary schools: The Tanzanian case. School effectiveness and school improvement, 17(2), 145-177.
Organ, D. W. (1988). Organizational citizenship behavior: The good soldier syndrome .
Lexington-MA, England: Lexington Books.
Ozdevecioglu, M. (2003). Algılanan örgütsel adaletin bireylerarası saldırgan davranışlar üzerindeki etkilerinin belirlenmesine yönelik bir araştırma. Erciyes üniversitesi iktisadi ve idari bilimler fakültesi dergisi, 21, 77-96.
Podsakoff, P. M., & MacKenzie, S. B. (1994). Organizational citizenship behaviors and sales unit effectiveness. Journal of marketing research, 31(3), 351-363.
Podsakoff, P. M., & MacKenzie, S. B. (1997). Impact of organizational citizenship
behavior on organizational performance: A review and suggestion for future research. Human performance, 10(2), 133-151.
Podsakoff, P. M., MacKenzie, S. B., Paine, J. B., & Bachrach, D. G. (2000).
Organizational citizenship behaviors: A critical review of the theoretical and empirical literature and suggestions for future research. Journal of
management, 26(3), 513-563.
Schnake, M., Cochran, D., & Dumler, M. (1995). Encouraging organizational citizenship: The effects of job satisfaction, perceived equity and leadership. Journal of Managerial Issues, 7(2), 209-221.
Sezgin, F. (2005). Örgütsel vatandaşlık davranışları: Kavramsal bir çözümleme ve okul açısından bazı çıkarımlar. Gazi Üniversitesi Gazi Eğitim Fakültesi Dergisi, 25(1),
317-339.
24 Burcu AKKAYA Eurasian Journal of Educational Research 84 (2019) 1-28
Shore, L. M., & Shore, T. H. (1995). Perceived organizational support and organizational justice. Organizational politics, justice, and support: Managing the
social climate of the workplace, 149, 164.
Skarlicki, D. P., & Folger, R. (1997). Retaliation in the workplace: The roles of distributive, procedural, and interactional justice. Journal of Applied
Psychology, 82(3), 434-443.
Smith, C., Organ, D. W., & Near, J. P. (1983). Organizational citizenship behavior: Its nature and antecedents. Journal of Applied Psychology, 68(4), 653-663.
Spector, P. E. (2011). The relationship of personality to counterproductive work behavior (CWB): An integration of perspectives. Human Resource Management
Review, 21(4), 342-352.
Spector, P. E., & Fox, S. (2002). An emotion-centered model of voluntary work behavior
some parallels between counterproductive work behavior and organizational citizenship behavior. Human Resource Management Review, 12, 1-24.
Spector, P. E., & Fox, S. (2010). Counterproductive work behavior and organisational citizenship behavior: Are they opposite forms of active behavior? Applied
Psychology: An International Review, 59(1), 21-39.
Spector, P. E., Fox, S., & Domagalski, T. (2006). Emotions, violence and
counterproductive work behavior. In E. K. Kelloway, J. Barling, & J. Hurrell (Eds.), Handbook of workplace violence (pp. 29-46). Thousand Oaks, CA: Sage
Publication.
Spector, P. E., Fox, S., Penney, L. M., Bruursema, K., Goh, A., & Kessler, S. (2006). The
dimensionality of counterproductivity: Are all counterproductive behaviors created equal? Journal of vocational behavior, 68(3), 446-460.
Sumer, N. (2000). Yapisal eşitlik modelleri: Temel kavramlar ve örnek uygulamalar. Turk Psikoloji Yazilari, 3(6), 49-74.
Turnipseed, D., & Murkison, G. (2000). Good soldiers and their syndrome: Organizational citizenship behavior and the work environment. North
American Journal of Psychology, 2(2), 281-302.
Unal, A. (2012). Deviant teacher behaviors and their influence on school rules and interpersonal relationships at school. Eurasian Journal of Educational Research,
49, 1-20.
Unal, Z. (2003). Öğretmenlerde iş doyumu ve örgütsel vatandaşlık. (Yayımlanmamış
yüksek lisans tezi). Afyon Kocatepe Üniversitesi Sosyal Bilimler Enstitüsü,
Afyon.
Van Dyne, L., Cummings, L. L., & Parks, J. M. (1995). Extra-role behaviors: In pursuit of construct and definitional clarity (a bridge over muddied waters). Research
in Organizational Behavior: An Annual Series of Analytical Essays and Critical Reviews, 17, 215-285.
Burcu AKKAYA Eurasian Journal of Educational Research 84 (2019) 1-28
25
Van Dyne, L., & LePine, J. A. (1998). Helping and voice extra-role behaviors: Evidence
of construct and predictive validity. Academy of management journal, 41(1), 108-
119.
Verona, E., Reed, A., Curtin, J. J., & Pole, M. (2007). Gender differences in emotional and overt/covert aggressive responses to stress. Aggressive Behavior: Official Journal of the International Society for Research on Aggression, 33(3), 261-271.
Yaylaci, A. F. (2004). İlköğretim okulları yönetici ve öğretmenlerinin örgütsel yurttaşlık
davranışları. (Doktora tezi). Ankara Üniversitesi Eğitim Bilimleri Enstitüsü,
Ankara.
İlkokul Öğretmenlerinin Örgütsel Vatandaşlık Davranışları ile
Üretkenlik Karşıtı İş Davranışları Arasındaki İlişki
Atıf:
Akkaya, B. (2019). The relationship between primary school teachers' organizational citizenship behaviors and counter-productive work behaviors. Eurasian
Journal of Educational Research, 84, 1-28, DOI: 10.14689/ejer.2019.84.1
Özet
Problem Durumu: Örgütsel vatandaşlık davranışları ve üretkenlik karşıtı iş davranışları
örgütlerde rol fazlası davranışların iki farklı yönünü oluşturmaktadır. Üretkenlik
karşıtı iş davranışı (ÜKİD) işgörenlerin örgüt içinde yaşadıkları olumsuz durumlar
nedeniyle örgüte ve üyelerine zarar verme amacıyla yaptıkları davranışlar olarak tanımlanmaktadır (Spector & Fox, 2010). Örgütün ve işgörenlerin sağlığını tehlikeye
atan, iş performansını düşüren, saldırganlık/hırsızlık/iş yapmama gibi örgütsel
normları ihlal edici nitelikteki (Gualandri, 2012) ve zarar verme niyeti içeren (Dalal, 2005) gönüllü davranışlar ÜKİD olarak isimlendirilmektedir. Spector ve diğerleri
(2006) ÜKİD kapsamına giren davranışların bireye yönelik ve örgüte yönelik
üretkenlik karşıtı iş davranışları olmak üzere iki ana boyut altında (i) başkalarına zarar verme, (ii) üretime zarar verme, (iii) kundaklama, (iv) çalma ve (v) geri çekilme olmak
üzere beş alt boyutta incelenebileceğini belirtmişlerdir. Eğitim örgütleri olan okullarda da öğretmenler ve yöneticiler arasında ÜKİD sergilenebilmektedir. Doğruöz ve
Özdemir’in (2018) de belirttiği gibi, alanyazında öğretmen ve yöneticilerin okulun
sahip olduğu maddi varlıklara zarar verme, taciz, hırsızlık, psikolojik yıldırma, işe devamsızlık gibi üretkenlik karşıtı iş davranışları sergilediklerine ve bu davranışların
okullarda giderek yaygınlaştığına dair bulgulara rastlamak mümkündür. Örgütsel
vatandaşlık davranışları ise “rol davranışlarından öte” davranışlardan oluşmakta ve “resmi ödül sistemi tarafından doğrudan veya açıkça tanımlanmayan ve örgütün etkin
işleyişini teşvik eden isteğe bağlı bireysel davranışlar” olarak tanımlanaktadır (Organ,
1988). Örgütsel vatandaşlık davranışları, işgörenin örgütün etkin işleyişini doğrudan
26 Burcu AKKAYA Eurasian Journal of Educational Research 84 (2019) 1-28
destekleyici nitelik taşıyan isteğe bağlı davranışlarından oluşmaktadır (Podsakoff &
MacKenzie, 1994). Organ (1988) örgütsel vatandaşlık davranışını diğergamlık,
nezaket, vicdanlılık, sivil erdem ve centilmenlik olarak beş boyutta incelemiştir. Bu araştırmada Organ’ın (1988) boyutlandırması temel alınmıştır. Okullarda örgütsel
vatandaşlık davranışlarının okulun işleyişine nitelikli katkılar sunarken, üretkenlik
karşıtı iş davranışlarının ciddi boyutta zararlar verebileceği düşünülmektedir. Buradan hareketle örgütsel vatandaşlık davranışlarının üretkenlik karşıtı iş
davranışları üzerinde etkisinin olup olmadığı araştırılmaya değer bir konu olarak
görülmüştür.
Araştırmanın Amacı: Bu araştırmanın amacı, kamu ilkokullarında görev yapan yönetici
ve öğretmenlerin algılarına göre, öğretmenlerin sergiledikleri örgütsel vatandaşlık davranışları ile üretkenlik karşıtı iş davranışları arasındaki ilişkiyi ortaya koymaktır.
Bu genel amaç doğrultusunda aşağıdaki sorulara yanıt aranmıştır:
1) Okul yöneticilerinin ve sınıf öğretmenlerinin, öğretmenlerin sergilediği üretkenlik karşıtı iş davranışlarına ilişkin algıları; (i) başkalarına zarar verme, (ii) yönetsel
işleyişe zarar verme, (iii) kundaklama, (iv) çalma, (v) geri çekilme, (vi) okulun
imajına zarar verme ve (vii) eğitim-öğretime zarar verme boyutlarında ne düzeydedir?
2) Okul yöneticilerinin ve sınıf öğretmenlerinin, öğretmenlerin sergilediği örgütsel
vatandaşlık davranışlarına ilişkin algıları; (i) diğergamlık, (ii) vicdanlılık, (iii) centilmenlik, (iv) nezaket ve (v) sivil erdem boyutlarında ne düzeydedir?
3) Okul yöneticilerinin ve sınıf öğretmenlerinin algılarına göre örgütsel vatandaşlık
davranışının alt boyutları üretkenlik karşıtı iş davranışlarının anlamlı bir yordayıcısı mıdır?
Araştırmanın Yöntemi: Araştırma, ilişkisel tarama modelindedir. Araştırmanın
örneklemi 2018-2019 eğitim-öğretim yılında Ankara’nın dokuz ilçesindeki kamu ilkokullarında görev yapan okul yöneticileri ve öğretmenlerden tabakalı örnekleme
yöntemiyle alınmış ve buna bağlı olarak araştırmaya 360 okul yöneticisi ve 430
öğretmen katılmıştır. Veriler, araştırmacı tarafından geliştirilen Üretkenlik Karşıtı İş Davranışı Ölçeği ve Basım ve Şeşen (2006) tarafından geliştirilen Örgütsel Vatandaşlık
Davranışları Ölçeği ile toplanmıştır. ÜKİD Ölçeği’nin geliştirilmesi için ön uygulama
yapılmıştır. Ön uygulama verileri Ankara ilinde resmi ilkokul ve ortaokullarda görev yapan 331’i öğretmen ve 82’si yönetici olmak üzere toplam 413 katılımcıdan
toplanmıştır. Ölçeğin yapı geçerliğinin kontrolü için Açımlayıcı Faktör Analizi (AFA)
yapılmıştır. Örgütsel Vatandaşlık Davranışları Ölçeğinin yapısını eğitim kurumlarında çalışan öğretmen ve yöneticilerde de koruyup korumadığını test etmek
amacıyla birinci düzey doğrulayıcı faktör analizi yapılmış ve uyum indekslerinin
yeterli düzeyde olduğu görülmüştür. Verilerin analizinde aritmetik ortalama, standart sapma ve çoklu doğrusal regresyon analizi kullanılmıştır.
Araştırmanın Bulguları: Katılımcı algılarına göre okullarda öğretmenler, üretkenlik
karşıtı iş davranışlarını neredeyse hiç sergilememektedir. Nadiren yaşanan durumlarda ise en çok geri çekilme ve başkalarına zarar verme, en az ise çalma
boyutundaki davranışlar sergilenmektedir. Örgütsel vatandaşlık davranışlarının
Burcu AKKAYA Eurasian Journal of Educational Research 84 (2019) 1-28
27
okullarda sıklıkla sergilendiği, bunların içinde en sık sergilenen davranışların ise
nezaket alt boyutundakiler olduğu belirlenmiştir. Örgütsel vatandaşlığın nezaket alt boyutu ÜKİD’in tüm alt boyutlarının anlamlı bir yordayıcısıdır. Bunun yanında
ÖVD’nin vicdanlılık boyutu, ÜKİD’in kundaklama, geri çekilme, okulun imajına zarar
verme ve eğitim öğretime zarar verme boyutlarının; sivil erdem boyutu ise yönetsel işleyişe zarar verme ve geri çekilme boyutlarının anlamlı birer yordayıcısıdır. ÜKİD’in
en önemli yordayıcısı ÖVD’nın nezaket alt boyutu olmuştur.
Araştırmanın Sonuçları ve Önerileri: Araştırma bulgularına dayalı olarak okullarda
üretkenlik karşıtı iş davranışlarının çok yaygın olmadığı sonucuna varılmıştır. Bu
davranışlar seyrek olarak yaşanmakla birlikte, görece en sık, geri çekilme ve
başkalarına zarar verme davranışları ile karşılaşılmaktadır. ÜKİD sergileyen öğretmenler ağırlıklı olarak kişilerle yüz yüze etkileşimi gerektirmeyen okulda mesai
dışında zaman geçirmeme, dedikodu, yok sayma gibi pasif davranışlar
sergilemektedir. Okullarda çalma, baskı uygulama, alay etme gibi somut ve birebir etkileşimi gerektiren davranışlarla pek karşılaşılmamaktadır. Okullarda örgütsel
vatandaşlık davranışları oldukça yaygın olarak yaşanmaktadır. Bu davranışlar
arasında başkalarının haklarına saygı duyma, sorun çıkarmama gibi nezaket davranışları en yaygın davranışlardır. Yine yaygın olarak yaşanmakla birlikte okul
için ekstra zaman harcama, başkalarının işlerine yardım etme gibi vicdanlılık
davranışları görece seyrek yaşanmaktadır. Okullarda nezaket, vicdanlılık ve sivil erdem boyutunda yer alan örgütsel vatandaşlık davranışlarının ÜKİD davranışlarını
önleyici veya azaltıcı etki yaptığı söylenebilir. Bu nedenle öğretmenlerin okuldaki
ilişkilerinde nezaket kurallarına uymaları, yeri geldiğinde meslektaşlarına yardım etmeleri, okulun sorunlarının çözümünde aktif rol almaları teşvik edilmeli, bu konuda
başarılı öğretmenler ödüllendirilerek konuya dikkat çekilmelidir. Okullarda ÜKİD’in
örgütsel bağlılık, örgüt kültürü, örgüt iklimi, kişilik tipleri, yöneticilerin benimsediği liderlik tipleri gibi başka değişkenlerle ilişkileri de araştırma konusu edilmeli ve
okullarda ÜKİD’in önlenmesine yönelik kuramsal temeller sağlamlaştırılmalıdır.
Anahtar Sözcükler: Üretkenlik karşıtı iş davranışı, örgütsel vatandaşlık, rol fazlası
davranışlar.

Eurasian Journal of Educational Research 84 (2019) 29-56 Eurasian Journal of Educational Research
www.ejer.com.tr
The Effect of Mobbing Levels Experienced by Music Teachers on Organizational Commitment and Job Satisfaction* Ayda ARAS1
A R T I C L E I N F O A B S T R A C T
Article History: Purpose: Music education is a learning and teaching process that creates cognitive, affective and psychomotor changes in the behaviors of an individual. One of the most important elements of this process is the music teacher. The experiences of music teachers in the work environment also affect the quality of education they provide. Therefore, this study aimed to determine the relationship between the levels of mobbing experienced by, and the organizational commitment and job satisfaction of music teachers working at primary schools. Research Methods: This research was conducted with relational survey model. The study group comprised of music teachers working at primary schools in Ankara province. 248 music teachers in
Received: 18 Jun. 2019
Received in revised form: 13 Oct. 2019
Accepted: 11 Nov. 2019 DOI: 10.14689/ejer.2019.84.2
Keywords mobbing, job satisfaction, organizational commitment, music teachers
total were included in the sampling by stratified sampling method. Research data were collected by means of Negative Behavior Scale, Organizational Commitment Scale and Job Satisfaction Scale. Findings: According to the results of the study, significant negative relationship was found between the level of mobbing experienced by, and the levels of job satisfaction and organizational commitment of music teachers. In addition, it was determined that organizational commitment and job satisfaction significantly predicted mobbing behavior. Implications for Research and Practice: When taking into consideration that music teachers experience mobbing in schools, especially in relation to their occupations, and the mobbing behaviors they are most exposed to, creating their role/position definitions at the level of their competences, taking into account their ideas and views and their requests when they ask to use their rights (sick leave, holiday entitlement) will help increase their organizational commitment and job satisfaction. In future studies, new research models may be formed with different variables on how to increase job satisfaction and organizational commitment or on how to reduce mobbing.
© 2019 Ani Publishing Ltd. All rights reserved
1 Dr. Aksaray University, e-mail: [email protected], TURKEY, ORCID: https://orcid.org/0000-0002-9591-6542
30 Ayda ARAS Eurasian Journal of Educational Research 84 (2019) 29-56
Introduction
Education can be expressed as an important process that enables individuals to be
beneficial to themselves, their surroundings, countries and humanity. Art education is
an important component of education, and music education is of art education. Music
education is a learning and teaching process that creates cognitive, affective and
psycho motor changes in the behaviors of an individual. One of the most important
elements of this process is the music teacher. The experiences of music teachers in the
work environment also affect the quality of education they provide. Therefore, job
satisfaction and organizational commitment of music teachers may be suggested to be
one of the factors of effective music education. However, it is possible that many
factors play part in the job satisfaction and organizational commitment of music
teachers. In this study, effect of mobbing, which is thought to be one of these factors,
on the organizational commitment and job satisfaction of music teachers was
examined.
The word ‘mob’, which derives from the words ‘mobile vulgus’ that means “fickle
crowd” in Latin, has the meaning of “irregular crowd or gang that resorts to illegal
violence” in English (Tinaz, 2008, p.7). Animal scientist Konrad Lorenz first used the
word ‘mobbing’ in the 1960s to describe some animal behaviors. Accordingly,
mobbing was used in the sense that a group or a flock of small animals threatened a
large animal strolling around alone (Karyagdi, 2007). At the workplace, mobbing is the
exposure of one or rarely several employees to emotionally damaging behaviors by
one or more employees (rarely more than four people) on a daily basis and for several
months in a systematic manner (Toker Gokce, 2008, p.4). Leymann has important
studies on mobbing and describes mobbing as an individual being attacked through
social interaction by one or more people almost on a daily basis and for months (1996,
p.168). A different definition of mobbing is, when a person gathers other people
around himself/herself with or without their consent, against another individual, and
forces those people to discharge the said individual by creating an aggressive
environment such as through perpetual malicious actions, making implications,
mockery, and degrading the public reputation of the said individual (Davenport,
Schwartz & Elliot, 2003, p.15). As one can see, all definitions include an individual
being exposed to aggressive behaviors of a person or a group. Moreover, the
systematicity or continuity of these behaviors is also emphasized in the definitions.
Davenport, Schwartz, and Elliot state that mobbing is an emotional attack (2003,
p.15) and express that this process begins when the individual is the target of
disrespectful and harmful behavior. According to Matthiesen (2006, p.14), such
behaviors may occur directly, such as through verbal attacks, or indirectly, such as
through insulting, slandering or retention of information. Similarly, Zapf and Einarsen
(2001) state that these behaviors can be listed in many different types that humiliate,
punish, frighten or intimidate the person. However, Leymann states that there are 45
different types of mobbing behaviors and classifies these behaviors under five groups
according to their characteristics. These behaviors described by Leymann are provided
in Table 1 (Davenport, Schwartz and Elliot, 2003, p.17-19).
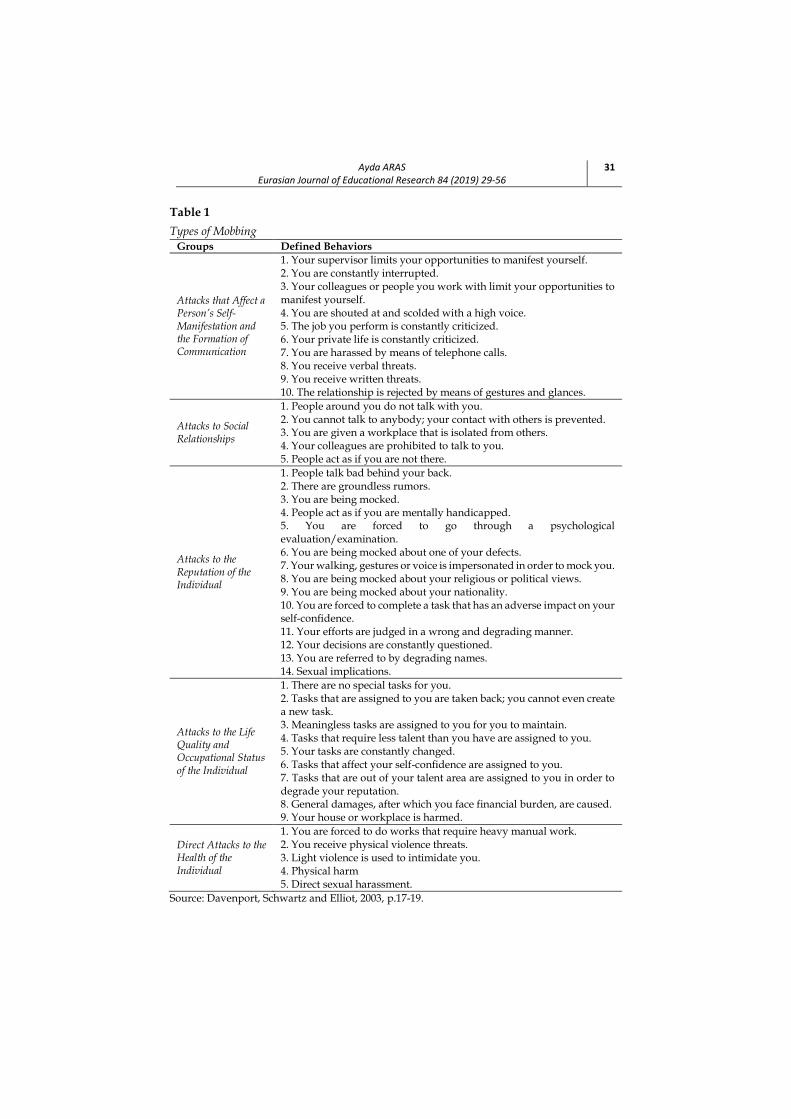
Ayda ARAS Eurasian Journal of Educational Research 84 (2019) 29-56
31
Table 1
Types of Mobbing Groups Defined Behaviors
Attacks that Affect a Person’s Self-Manifestation and the Formation of Communication
1. Your supervisor limits your opportunities to manifest yourself. 2. You are constantly interrupted. 3. Your colleagues or people you work with limit your opportunities to manifest yourself. 4. You are shouted at and scolded with a high voice. 5. The job you perform is constantly criticized. 6. Your private life is constantly criticized. 7. You are harassed by means of telephone calls. 8. You receive verbal threats. 9. You receive written threats. 10. The relationship is rejected by means of gestures and glances.
Attacks to Social Relationships
1. People around you do not talk with you. 2. You cannot talk to anybody; your contact with others is prevented. 3. You are given a workplace that is isolated from others. 4. Your colleagues are prohibited to talk to you. 5. People act as if you are not there.
Attacks to the Reputation of the Individual
1. People talk bad behind your back. 2. There are groundless rumors. 3. You are being mocked. 4. People act as if you are mentally handicapped. 5. You are forced to go through a psychological evaluation/examination. 6. You are being mocked about one of your defects. 7. Your walking, gestures or voice is impersonated in order to mock you. 8. You are being mocked about your religious or political views. 9. You are being mocked about your nationality. 10. You are forced to complete a task that has an adverse impact on your self-confidence. 11. Your efforts are judged in a wrong and degrading manner. 12. Your decisions are constantly questioned. 13. You are referred to by degrading names. 14. Sexual implications.
Attacks to the Life Quality and Occupational Status of the Individual
1. There are no special tasks for you. 2. Tasks that are assigned to you are taken back; you cannot even create a new task. 3. Meaningless tasks are assigned to you for you to maintain. 4. Tasks that require less talent than you have are assigned to you. 5. Your tasks are constantly changed. 6. Tasks that affect your self-confidence are assigned to you. 7. Tasks that are out of your talent area are assigned to you in order to degrade your reputation. 8. General damages, after which you face financial burden, are caused. 9. Your house or workplace is harmed.
Direct Attacks to the Health of the Individual
1. You are forced to do works that require heavy manual work. 2. You receive physical violence threats. 3. Light violence is used to intimidate you. 4. Physical harm 5. Direct sexual harassment.
Source: Davenport, Schwartz and Elliot, 2003, p.17-19.
32 Ayda ARAS Eurasian Journal of Educational Research 84 (2019) 29-56
As seen in Table 1, Leymann classifies mobbing behaviors as attacks that affect a
person’s self-manifestation and the formation of communication, attacks to social
relationships, attacks to the reputation of the individual, attacks to the life quality and
occupational status of the individual, and direct attacks to the health of the individual.
Matthiesen (2006), however, expresses that these behaviors will be grouped under two
more general groups as behaviors related to the work and behaviors related to the
person. According to the author, while behaviors that make it difficult for people who
experience mobbing to do their jobs or that try to take some or all of their
responsibilities away are related to the work, while behaviors such as social exclusion,
rumor mongering, insulting, ignoring views, teasing, unwanted sexual approach are
related to the person.
Poussard et al. (2003, p.21) expressed that individuals who experience mobbing
react to these behaviors in three different levels. Accordingly, in the first level, the
person who experience mobbing tries to resist such behaviors. In the second level, the
person can no longer resist such behaviors, may suffer from temporary or prolonged
mental or physical discomfort, and may have difficulty returning to work. In the third
level, the person who experienced mobbing can no longer return to the workplace, and
physical and mental harms reach to a point where they cannot be healed even by
means of rehabilitation. Matthiesen and Einarsen (2004, p.226), however, state that
people who suffer from mobbing will face serious emotional damage such as fear,
anxiety, desperation, depression and shock. In addition to the physical and
psychological losses faced by individuals during the mobbing process, the material
and labor losses of the organizations can be very high. This is because the employee
who suffered from mobbing will try to get away from the workplace, and thus he/she
will often try to take sick leave. Moreover, this employee may leave the organization
afterwards. These will result in a decrease in the effectiveness of the organization
(Toker Gokce, 2008, p.48). In addition, studies on mobbing demonstrate that mobbing
is an effective variable on human relations, organizational culture, organizational
climate, values and performance of the organization. In addition to these, job
satisfaction of employees also decreases because of mobbing (Tutar, 2007).
Job satisfaction is the pleasure or positive emotional state of an employee as a result
of evaluating his/her job or work life (Basaran, 2008). Locke made the most commonly
used definition of job satisfaction in the literature in 1976. Locke describes job
satisfaction as “a pleasing or positive emotional state of a person after evaluating
his/her work or work experiences” (Saari & Judge, 2004, p.396). Hackman and
Oldham (1975, p.162) describe job satisfaction as “the general measurement of how
satisfied and happy the employee is from his work”. On the other hand, Izgar (2008,
p.320) describes job satisfaction as the satisfaction of the expectations of the employees
in business life. According to the author, this is because the employees have positive
feelings towards the work and develop a positive attitude towards their business life
if their expectations are met.
Job satisfaction has many positive consequences for both employees and
organizations. High morale, positive relationships between employees, commitment
to work, attendance at work and motivation are among the most important
Ayda ARAS Eurasian Journal of Educational Research 84 (2019) 29-56
33
consequences. Job dissatisfaction is a distressing factor for the employee and can lead
him/her to negative emotions (Ozkaya, Ekinci Kaya, 2008). The physical, mental and
social adaptation of the employee who is dissatisfied with his/her job may be
impaired. Consequently, negative consequences may arise, such as employee's
withdrawal from work, abandonment of work, indifference towards work, continuous
complaining of work and having desperation thoughts about the future of the
profession (Izgar, 2008, p.320). In addition, absenteeism and low job performance may
also be a result of job dissatisfaction (Keser, 2005, p.78). An employee whose
expectations are not met at the workplace may react by demonstrating aggressive
behavior in the organization (Sevimli & Iscan, 2005, p.59).
The job satisfaction of employees who experienced mobbing, as well as their
organizational commitment is affected negatively by this situation. Organizational
commitment is a high level of self-sacrifice as a result of job satisfaction for the benefit
of the organization (Tutar, 2007). O'Reilly and Chatman (1986) emphasize that
organizational commitment is the psychological bond that the employee has towards
his/her organization and expresses that this concept demonstrates the extent to which
the individual internalizes or adopts the characteristics or perspectives of the
organization. This concept, which reflects the interaction of the employee with his/her
organization, is crucial for the effectiveness and development of the organizations. The
reason for this is that the employees with high organizational commitment will strive
to ensure the continuity and development of their organizations (Ozdevecioglu, 2003,
p.127). As a matter of fact, organizational commitment is an important phenomenon
in the employees’ embracement of the objectives of the organization, perseveration of
the desire to stay in the organization, participation in the management and activities
of the organization, and adoption of a creative and innovative attitude for the
organization (Durna & Eren, 2005). In this context, it is possible to suggest that
organizational commitment is one of the factors that play an important role in
reducing employee turnover and absenteeism and increasing their job performances
(Subramaniam, McManus & Mia, 2002).
Studies in the literature demonstrate that both job satisfaction and organizational
commitment play a critical role in the job performances of employees. However,
mobbing behaviors that employees suffer from may have a negative impact on these
two structures. As a matter of fact, there are studies that demonstrate the negative
relationship between mobbing and job satisfaction (Civilidag, 2011; Ozdemir, 2014;
Talas, 2016; Vural Ozkan, 2011) and organizational commitment (Aktas Kutukcu, 2015;
Hickorkmaz, 2016; Zorlu, 2017). However, no research has been found in the music
education field about the impact of this effective variable on music teachers working
at educational institutions, especially in primary education institutions, whether it has
an impact on the job satisfaction of the music teachers, and how much this situation is
a determinant on their organizational commitment. Therefore, this study is expected
to fill this void in the music education field. This study is significant for the reason that
it is the first study in the literature about music teachers, reflection of mobbing on the
outcomes such as organizational commitment and job satisfaction, and the first study
demonstrating that the profession of music teaching is nested in educational sciences
34 Ayda ARAS Eurasian Journal of Educational Research 84 (2019) 29-56
as well as field subjects. The managers who will take actions in increasing the
performance of music teachers, providing their job satisfaction and increasing their
organizational commitment will benefit from the findings of this research.
In this research, we tried to determine the relationship between the levels of
mobbing experienced by, and the organizational commitment and job satisfaction of
music teachers who are working at primary schools, by taking into consideration the
widespread implementation of the concept of mobbing in the institutions and
organizations operating as a group and the recognition of these implementations with
the effect of current interest.
Research Objective
This research aimed to determine the relationship between mobbing levels
experienced by, and organizational commitment and job satisfaction of music teachers
working at primary schools. Within the framework of this general-purpose, answers
to the following questions were sought:
In relation to the music teachers working at primary schools,
1. What are the levels of experiencing mobbing, organizational commitment
and job satisfaction?
2. Do the levels of experiencing mobbing, organizational commitment and job
satisfaction demonstrate a significant difference according to the education,
seniority, marital status, age and gender variables?
3. Is there a significant relationship between the mobbing they experience,
their organizational commitment and job satisfaction?
Method
Research Design
This research was designed with a relational screening model. The research was
designed in accordance with the relational survey model that is a research model
aiming at defining the presence and degree of change between two or more variables
(Karasar, 2009). This study aimed to determine the relationship between mobbing
levels experienced by, and organizational commitment and job satisfaction of music
teachers working at primary schools.
Research Sample
The population of the study consisted of 308 music teachers working at primary
schools in the central districts of Ankara, which are affiliated to the Ministry of
National Education. The sample of the study was determined by convenience
sampling method. Convenience sampling includes selecting samples that are both
easily accessible and willing to participate in research (Teddlie & Yu, 2007) and 248
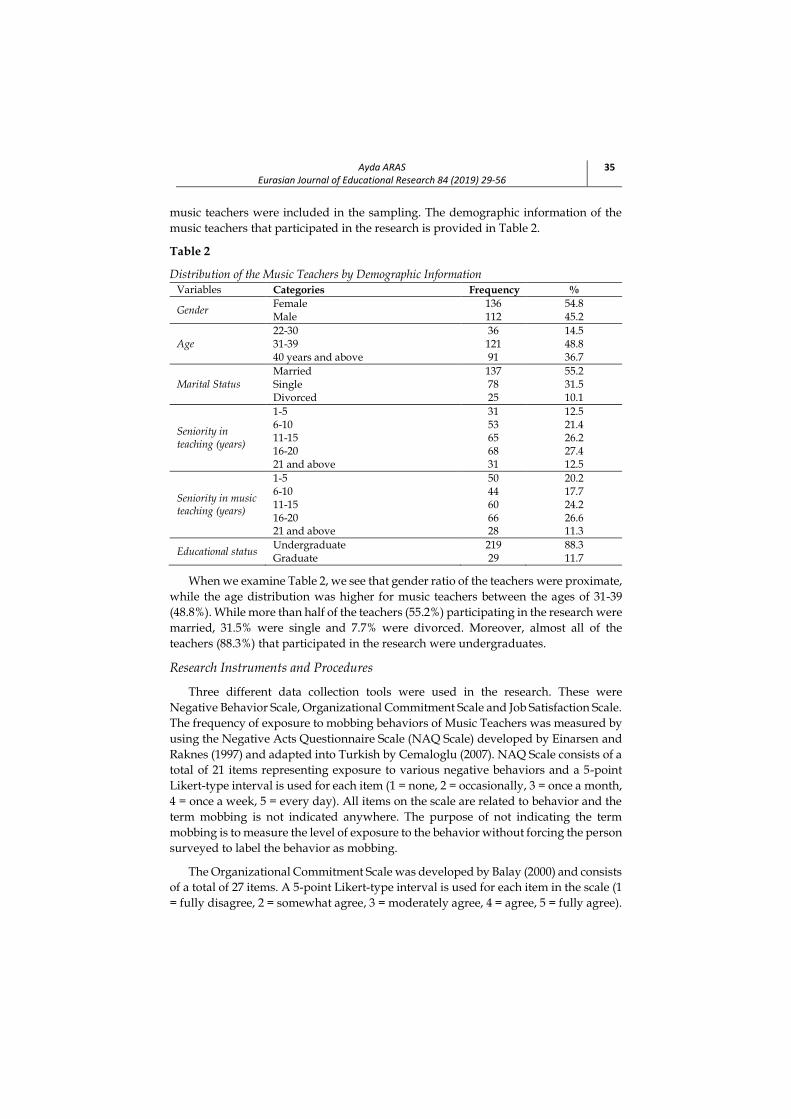
Ayda ARAS Eurasian Journal of Educational Research 84 (2019) 29-56
35
music teachers were included in the sampling. The demographic information of the
music teachers that participated in the research is provided in Table 2.
Table 2
Distribution of the Music Teachers by Demographic Information Variables Categories Frequency %
Gender Female Male
136 112
54.8 45.2
Age 22-30 31-39 40 years and above
36 121 91
14.5 48.8 36.7
Marital Status Married Single Divorced
137 78 25
55.2 31.5 10.1
Seniority in teaching (years)
1-5 6-10 11-15 16-20 21 and above
31 53 65 68 31
12.5 21.4 26.2 27.4 12.5
Seniority in music teaching (years)
1-5 6-10 11-15 16-20 21 and above
50 44 60 66 28
20.2 17.7 24.2 26.6 11.3
Educational status Undergraduate Graduate
219 29
88.3 11.7
When we examine Table 2, we see that gender ratio of the teachers were proximate,
while the age distribution was higher for music teachers between the ages of 31-39
(48.8%). While more than half of the teachers (55.2%) participating in the research were
married, 31.5% were single and 7.7% were divorced. Moreover, almost all of the
teachers (88.3%) that participated in the research were undergraduates.
Research Instruments and Procedures
Three different data collection tools were used in the research. These were
Negative Behavior Scale, Organizational Commitment Scale and Job Satisfaction Scale.
The frequency of exposure to mobbing behaviors of Music Teachers was measured by
using the Negative Acts Questionnaire Scale (NAQ Scale) developed by Einarsen and
Raknes (1997) and adapted into Turkish by Cemaloglu (2007). NAQ Scale consists of a
total of 21 items representing exposure to various negative behaviors and a 5-point
Likert-type interval is used for each item (1 = none, 2 = occasionally, 3 = once a month,
4 = once a week, 5 = every day). All items on the scale are related to behavior and the
term mobbing is not indicated anywhere. The purpose of not indicating the term
mobbing is to measure the level of exposure to the behavior without forcing the person
surveyed to label the behavior as mobbing.
The Organizational Commitment Scale was developed by Balay (2000) and consists
of a total of 27 items. A 5-point Likert-type interval is used for each item in the scale (1
= fully disagree, 2 = somewhat agree, 3 = moderately agree, 4 = agree, 5 = fully agree).
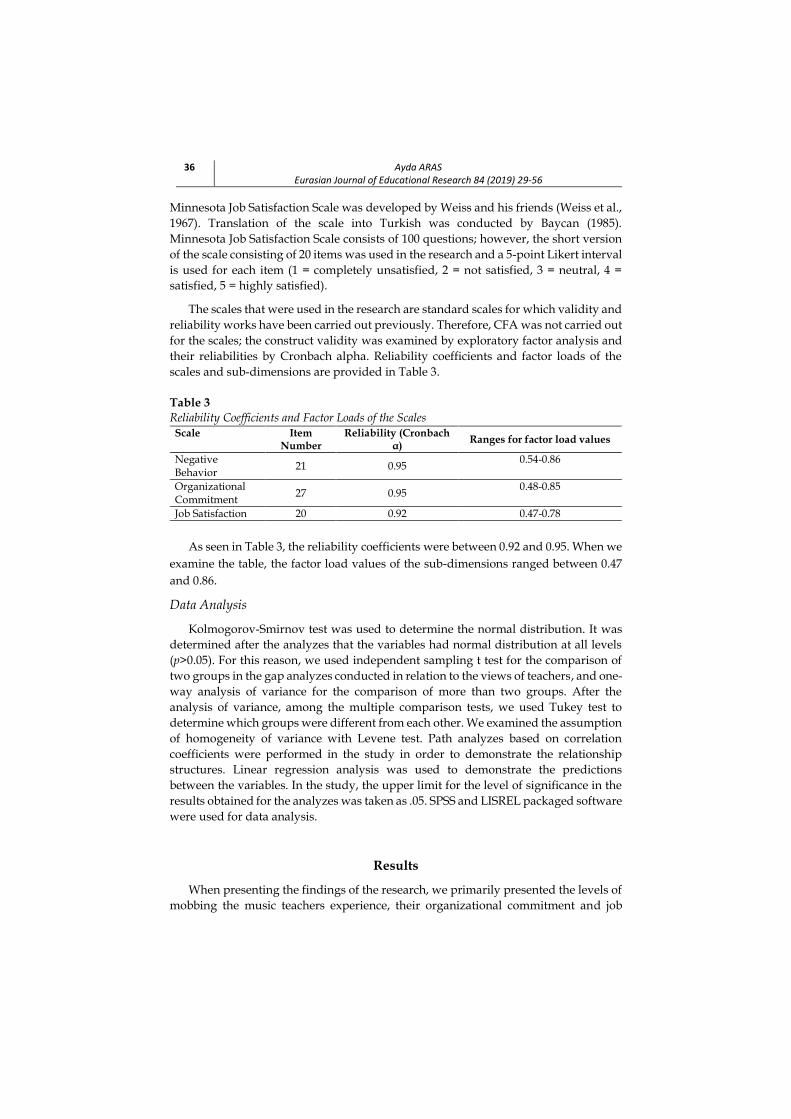
36 Ayda ARAS Eurasian Journal of Educational Research 84 (2019) 29-56
Minnesota Job Satisfaction Scale was developed by Weiss and his friends (Weiss et al.,
1967). Translation of the scale into Turkish was conducted by Baycan (1985).
Minnesota Job Satisfaction Scale consists of 100 questions; however, the short version
of the scale consisting of 20 items was used in the research and a 5-point Likert interval
is used for each item (1 = completely unsatisfied, 2 = not satisfied, 3 = neutral, 4 =
satisfied, 5 = highly satisfied).
The scales that were used in the research are standard scales for which validity and
reliability works have been carried out previously. Therefore, CFA was not carried out
for the scales; the construct validity was examined by exploratory factor analysis and
their reliabilities by Cronbach alpha. Reliability coefficients and factor loads of the
scales and sub-dimensions are provided in Table 3.
Table 3 Reliability Coefficients and Factor Loads of the Scales Scale Item
Number Reliability (Cronbach
α) Ranges for factor load values
Negative Behavior
21 0.95 0.54-0.86
Organizational Commitment
27 0.95 0.48-0.85
Job Satisfaction 20 0.92 0.47-0.78
As seen in Table 3, the reliability coefficients were between 0.92 and 0.95. When we
examine the table, the factor load values of the sub-dimensions ranged between 0.47
and 0.86.
Data Analysis
Kolmogorov-Smirnov test was used to determine the normal distribution. It was
determined after the analyzes that the variables had normal distribution at all levels
(p>0.05). For this reason, we used independent sampling t test for the comparison of
two groups in the gap analyzes conducted in relation to the views of teachers, and one-
way analysis of variance for the comparison of more than two groups. After the
analysis of variance, among the multiple comparison tests, we used Tukey test to
determine which groups were different from each other. We examined the assumption
of homogeneity of variance with Levene test. Path analyzes based on correlation
coefficients were performed in the study in order to demonstrate the relationship
structures. Linear regression analysis was used to demonstrate the predictions
between the variables. In the study, the upper limit for the level of significance in the
results obtained for the analyzes was taken as .05. SPSS and LISREL packaged software
were used for data analysis.
Results
When presenting the findings of the research, we primarily presented the levels of
mobbing the music teachers experience, their organizational commitment and job

Ayda ARAS Eurasian Journal of Educational Research 84 (2019) 29-56
37
satisfaction. Afterwards, gap analyzes in relation to the relevant structures were
included. Finally, we examined the effect of the levels of mobbing music teachers
experience on organizational commitment and job satisfaction. Accordingly,
arithmetic mean and standard deviation values in relation to the levels of mobbing
experienced by, and organizational commitment and job satisfaction of the music
teachers are provided in Table 1.
Table 4
Arithmetic Mean and Standard Deviation Values of the Levels of Mobbing Experienced by
Music Teachers, Their Organizational Commitment and Job Satisfaction. Scale Sub-Dimensions X S
Mobbing 1.30 .447
Organizational
Commitment
Compliance 4.08 .774
Identification 3.23 1.16
Internalization 3.33 .997
Total 3.52 .812
Job Satisfaction
Internal 3.85 .718
External 3.59 .865
Total 3.75 .744
When we examine Table 4, we see that the level of mobbing experienced by music
teachers was low (X=1.30). We may suggest that the music teachers’ perception of the
sub-dimensions of identification (X= 3.23), internalization (X= 3.33) and compliance
(X= 3.33) of organizational commitment was rather high. Therefore, we may suggest
that music teachers internalized the institution they work at and established
identification with the institution they work at. When we examine Table 4 in relation
to the views of music teachers about job satisfaction, we see that music teachers were
generally satisfied with their jobs (X= 3.75). The job satisfaction levels of music
teachers were rather high in both internal (X= 3.85) and external (X= 3.59) sub-
dimensions. Table 5 exhibited the gap analysis results of the levels of mobbing
experienced by music teachers according to demographic variables.
Table 5
Comparison of the Levels of Mobbing Experienced by Music Teachers According to
Demographic Variables
Variable Level N X S Test§ p
Gender Female 136 1.28 0.45 -0.67 0.50
Male 112 1.32 0.44
Age 22-30 36 1.29 0.41
0.68 0.51 31-39 121 1.27 0.43
40 years and above 91 1.35 0.48
Marital status Married 137 1.30 .41
0.47 0.63 Single 78 1.29 .44
Divorced 25 1.39 .68

38 Ayda ARAS Eurasian Journal of Educational Research 84 (2019) 29-56
Table 5 continue
Variable Level N X S Test§ p
Seniority (years) 1-5 50 1.28 0.37
0.94 0.44
6-10 44 1.32 0.39
11-15 60 1.37 0.45
16-20 66 1.30 0.58
21 and above 28 1.17 0.22
Educational status Undergraduate 219 1.28 0.40 -2.48 0.14
Postgraduate 29 1.50 0.70 § shows the values of t statistic for gender and educational status and F statistic for other
variables.
According to Table 5, it can be suggested that the levels of mobbing experienced
by music teachers working at primary schools did not demonstrate a statistically
significant variance in terms of gender [t(246)=–0.67; p>0.05], age [F(2,245)=0.68; p>0.05],
marital status [F(2,245)=0.47; p>0.05], seniority [F(4,243)=0.94; p>0.05] and educational
status [t(246)=–2.48; p>0.05]. Table 6 exhibited the gap analyses of the organizational
commitment levels of music teachers according to demographic variables.
As seen from the Table 6, when the results of organizational commitment levels
were examined, it might be suggested that the levels of compliance [F(2, 243)=3.97,
p<0.05] and identification [F(2, 241)=4.16, p<0.05] of music teachers demonstrated
variance. In order to determine between which groups the variance occured, Tukey
test was performed among Post Hoc tests and it was determined that the teachers in
the age group of 22-30 had significantly higher levels of both compliance and
identification compared to the teachers in other age groups. We see that there was a
significant decrease in these levels of teachers in the older ages. In the comparisons
made based on marital status, it was found that there was significant variance in the
levels of compliance [F(2, 235)=5.46, p<0.05] and identification [F(2, 233)=4.24, p<0.05].
According to the results of Tukey test conducted in order to determine the source of
the variance, it was determined that divorced teachers had significantly lower
compliance levels compared to both married and single teachers, whereas in the
dimension of identification, divorced teachers had significantly lower levels of
identification compared to single teachers, and single teachers had significantly lower
levels of identification compared to married teachers. In the examination made based
on the seniority of the teachers, we observed significant variance between the views of
teachers in the internalization sub-dimension [F(4, 239)=2.53, p<0.05]. Accordingly,
Tukey test was used to determine between which groups the variance occured and the
internalization dimension levels of teachers with seniority of 16 years and above was
determined to be significantly higher compared to the teachers with seniority of 1-5
years, 6-10 years and 11-15 years. Similarly, it was determined that the internalization
levels of teachers with seniority of 21 years and above were significantly higher
compared to the teachers with seniority of 1-5 years, 6-10 years and 11-15 years. In the
remaining comparisons, there was no significant variance in the dimensions of
organizational commitment.

Ayda ARAS Eurasian Journal of Educational Research 84 (2019) 29-56
39
Table 6
Comparison of Organizational Commitment Levels of Music Teachers According to
Demographic Variables
Variable Dimension Level N Xŧ S Test§ p Significant Difference
Gender
Compliance 1.Female 136 4.14 0.75
1.44 0.15 - 2.Male 112 4.00 0.80
Identification 1.Female 136 3.28 1.10
0.83 0.41 - 2.Male 112 3.16 1.24
Internalization 1.Female 136 3.41 0.93
1.56 0.12 - 2.Male 112 3.22 1.06
Age
Compliance 1. 22-30 years 36 4.40a 0.70
3.97* 0.02 1-2, 1-3 2.31-39 years 121 4.06b 0.79
3.40 years above 91 3.98b 0.76
Identification 1.22-30 36 3.61a 1.15
4.16* 0.02 1-2, 1-3, 2-
3 2.31-39 121 3.30b 1.18
3.40 years above 91 2.98c 1.10
Internalization 1.22-30 36 3.37 0.87
0.15 0.86 - 2.31-39 121 3.35 1.10
3.40 years above 91 3.28 0.91
Marital status
Compliance 1.Married 137 4.12a 0.72
5.46* 0.01 1-3, 2-3 2.Single 78 4.13a 0.78
3.Divorced 25 3.58b 0.90
Identification 1.Married 137 3.13a 1.13
4.24* 0.02 1-2, 2-3 2.Single 78 3.49b 1.19
3.Divorced 25 2.80c 1.01
Internalization 1.Married 137 3.27 1.07
0.35 0.70 - 2.Single 78 3.38 0.90
3.Divorced 25 3.39 0.95
Seniority (years)
Compliance
1.1-5 years 50 4.18 0.73
0.60 0.67 -
2.6-10 years 44 4.10 0.82
3.11-15 years 60 3.96 0.74
4.16-20 years 66 4.10 0.81
5.21 years above 28 4.05 0.76
Identification
1.1-5 years 50 3.54 1.19
1.54 0.19 -
2.6-10 years 44 3.13 1.32
3.11-15 years 60 3.10 1.08
4.16-20 years 66 3.29 1.13
5.21 years above 28 2.97 1.03
Internalization
1.1-5 50 3.20a 1.01
2.53* 0.04 1-4, 2-4, 3-4, 1-5, 2-5,
3-5
2.6-10 44 3.12a 1.10
3.11-15 60 3.08a 0.98
4.16-20 66 3.54b 0.90
5.21 years above 28 3.54b 0.96
Educational status
Compliance 1.Undergraduate 219 4.09 0.78
0.53 0.60 - 2.Postgraduate 29 4.00 0.71
Identification 1.Undergraduate 219 3.23 1.14
0.21 0.83 - 2.Postgraduate 29 3.18 1.32
Internalization 1.Undergraduate 219 3.36 0.99
1.38 0.17 - 2.Postgraduate 29 3.09 1.05
* p<0.05 ŧ Letters next to the mean indicate different groups. § shows the values of t statistic for gender and educational status and F statistic for other variables.
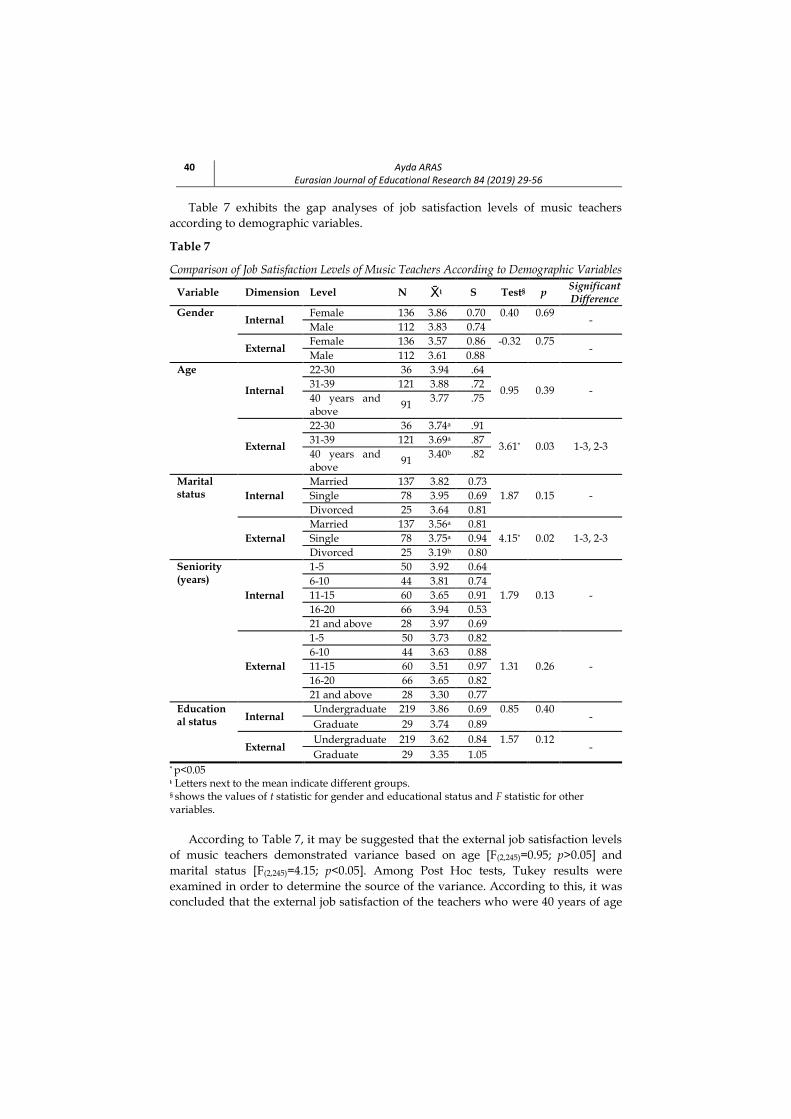
40 Ayda ARAS Eurasian Journal of Educational Research 84 (2019) 29-56
Table 7 exhibits the gap analyses of job satisfaction levels of music teachers
according to demographic variables.
Table 7
Comparison of Job Satisfaction Levels of Music Teachers According to Demographic Variables
Variable Dimension Level N Xŧ S Test§ p Significant Difference
Gender Internal
Female 136 3.86 0.70 0.40 0.69 -
Male 112 3.83 0.74
External Female 136 3.57 0.86 -0.32 0.75
- Male 112 3.61 0.88
Age
Internal
22-30 36 3.94 .64
0.95 0.39 - 31-39 121 3.88 .72
40 years and above
91 3.77 .75
External
22-30 36 3.74a .91
3.61* 0.03 1-3, 2-3 31-39 121 3.69a .87
40 years and above
91 3.40b .82
Marital status Internal
Married 137 3.82 0.73
1.87 0.15 - Single 78 3.95 0.69
Divorced 25 3.64 0.81
External
Married 137 3.56a 0.81
4.15* 0.02 1-3, 2-3 Single 78 3.75a 0.94
Divorced 25 3.19b 0.80
Seniority (years)
Internal
1-5 50 3.92 0.64
1.79 0.13 -
6-10 44 3.81 0.74
11-15 60 3.65 0.91
16-20 66 3.94 0.53
21 and above 28 3.97 0.69
External
1-5 50 3.73 0.82
1.31 0.26 -
6-10 44 3.63 0.88
11-15 60 3.51 0.97
16-20 66 3.65 0.82
21 and above 28 3.30 0.77
Educational status Internal
Undergraduate 219 3.86 0.69 0.85 0.40 -
Graduate 29 3.74 0.89
External Undergraduate 219 3.62 0.84 1.57 0.12
- Graduate 29 3.35 1.05
* p<0.05 ŧ Letters next to the mean indicate different groups. § shows the values of t statistic for gender and educational status and F statistic for other variables.
According to Table 7, it may be suggested that the external job satisfaction levels
of music teachers demonstrated variance based on age [F(2,245)=0.95; p>0.05] and
marital status [F(2,245)=4.15; p<0.05]. Among Post Hoc tests, Tukey results were
examined in order to determine the source of the variance. According to this, it was
concluded that the external job satisfaction of the teachers who were 40 years of age
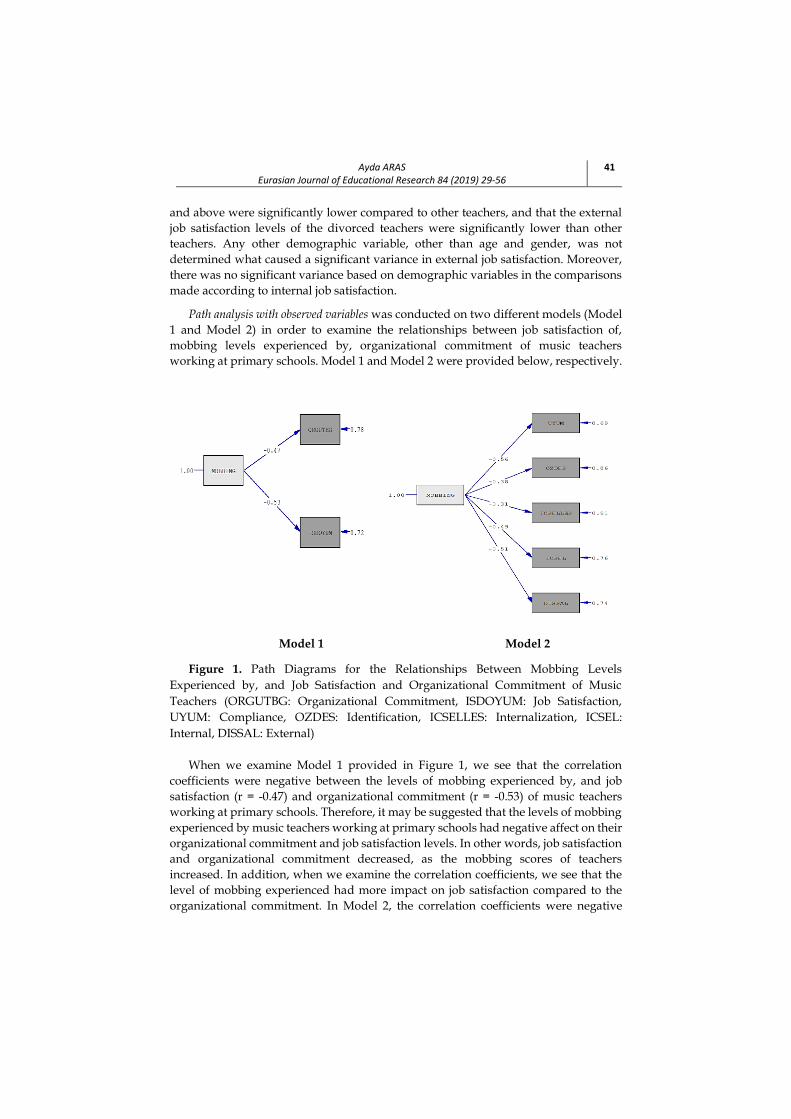
Ayda ARAS Eurasian Journal of Educational Research 84 (2019) 29-56
41
and above were significantly lower compared to other teachers, and that the external
job satisfaction levels of the divorced teachers were significantly lower than other
teachers. Any other demographic variable, other than age and gender, was not
determined what caused a significant variance in external job satisfaction. Moreover,
there was no significant variance based on demographic variables in the comparisons
made according to internal job satisfaction.
Path analysis with observed variables was conducted on two different models (Model
1 and Model 2) in order to examine the relationships between job satisfaction of,
mobbing levels experienced by, organizational commitment of music teachers
working at primary schools. Model 1 and Model 2 were provided below, respectively.
Model 1 Model 2
Figure 1. Path Diagrams for the Relationships Between Mobbing Levels
Experienced by, and Job Satisfaction and Organizational Commitment of Music
Teachers (ORGUTBG: Organizational Commitment, ISDOYUM: Job Satisfaction,
UYUM: Compliance, OZDES: Identification, ICSELLES: Internalization, ICSEL:
Internal, DISSAL: External)
When we examine Model 1 provided in Figure 1, we see that the correlation
coefficients were negative between the levels of mobbing experienced by, and job
satisfaction (r = -0.47) and organizational commitment (r = -0.53) of music teachers
working at primary schools. Therefore, it may be suggested that the levels of mobbing
experienced by music teachers working at primary schools had negative affect on their
organizational commitment and job satisfaction levels. In other words, job satisfaction
and organizational commitment decreased, as the mobbing scores of teachers
increased. In addition, when we examine the correlation coefficients, we see that the
level of mobbing experienced had more impact on job satisfaction compared to the
organizational commitment. In Model 2, the correlation coefficients were negative
42 Ayda ARAS Eurasian Journal of Educational Research 84 (2019) 29-56
between the levels of mobbing experienced, compliance, identification, internalization,
internal job satisfaction and external job satisfaction of the music teachers working at
primary schools. In other words, these sub-dimensions decreased, as mobbing
increased. When we examine the correlation coefficients, the sub-dimension that was
affected the most by the level of mobbing experienced was the compliance sub-
dimension. In other words, a variance that will occur in the levels of mobbing
experienced by music teachers significantly reduces the compliancecompliance sub-
dimension of organizational commitment. The regression results about the
significance of the path coefficients were provided in Table 6. When we examine the
results, we can suggest that all predictions were significant (p<0.05). The
compliancecompliance coefficients of the Models 1 and 2 were provided in Table 8.
Table 8
Results of Goodness of Fit Coefficient of Models
Models Goodness of Fit Coefficients
Chi-square/sd RMSEA GFI AGFI NFI CFI
Model 1 1.875 0.052 0.902 0.900 0.912 0.905 Model 2 2.025 0.048 0.913 0.905 0.927 0.922
According to Table 8, chi-square/sd ratio was obtained as 1.875 and 2.025. It
indicates good fit if this value is less than 2, and acceptable fit if it is between 2 and 3.
According to Brown (2006), TLI (Tucker-Lewis Index) and CFI (Comparative Fit Index)
values demonstrate model fit if they are 0.90 or higher. GFI (goodness of fit index)
between 0.90 and 0.95 indicates acceptable fit, and GFI that is greater than 0.95
indicates good fit (Hooper, Coughlan and Mullan, 2008; Miles and Shevlin 2007).
Values greater than 0.85 are acceptable for AGFI (adjusted goodness of fit index)
(Raykov, 2006; Schermelleh, 2003). Similar ranges also apply for NFI (normed fit index)
(Hu and Bentler, 1999). According to Browne and Cudeck (1993), the RMSEA value
that is below 0.08 is another indicator for model fit. The regression analysis results of
the relationships between the levels of mobbing experienced by, the organizational
commitment and job satisfaction of music teachers were provided in Table 9.
Table 9
Regression Outputs of Relationships Between Levels of Mobbing Experienced by, and
Organizational Commitment and Job Satisfaction of Music Teachers
Dependent variable
Regression Coefficient
Standard Error
t p
Model 1 Organizational Commitment
-0.854 0.102 -8.34 0.01
Job Satisfaction -0.869 0.090 -9.68 0.01
Model 2 Compliance -0.961 0.091 -10.50 0.01
Identification -0.990 0.153 -6.46 0.02
Internalization -0.680 0.135 -5.03 0.02
Internal -0.796 0.090 -8.86 0.01
External -0.985 0.082 -9.21 0.01

Ayda ARAS Eurasian Journal of Educational Research 84 (2019) 29-56
43
When we examine Table 9, we see that compliance [t(246)=10.50; p<0.05],
identification [t(246)=-6.46; p<0.05], internalization [t(246)=-5.02; p<0.05], internal job
satisfaction [t(246)=-8.86; p<0.05] and external job satisfaction [t(246)=-9.21; p<0.05]
significantly predicted the mobbing level. Additionally, according to Table 9, a 1-point
increase in the mobbing level resulted in a 0.854-point decrease in the organizational
commitment score in general and a 0.869-point decrease in the job satisfaction score in
general. In spite of the 1-point increase in the mobbing level, the regression coefficient,
which was 0.961 between the compliance sub-dimension of the organizational
commitment and mobbing, demonstrated that there was a 0.961-point decrease in the
compliance sub-dimension of the organizational commitment. Likewise, in spite of a
1-point increase in the mobbing level, a 0.99-point decrease in the identification sub-
dimension of the organizational commitment occurred. The predictions between the
internalization sub-dimension of organizational commitment and mobbing were seen
to be lower than the predictions with the other sub-dimensions. A 1-point increase in
mobbing level resulted in a 0.68-point decrease in the internalization sub-dimension
of the organizational commitment. Lastly, we see that a 1-point increase in the
mobbing level resulted in a 0.796-point decrease in internal job satisfaction.
Discussion, Conclusion, and Recommendations
This study aimed to determine the relationship between mobbing levels
experienced by, and organizational commitment and job satisfaction of music teachers
working at primary schools and was conducted with relational screening model. In
this research, the views of the music teachers working at primary schools in Ankara
city center, which are affiliated to the Ministry of National Education, were used.
According to the findings of the study, almost one-fourth of the music teachers (%24,6)
were exposed to mobbing behaviors. Furthermore, music teachers encountered
mobbing in schools mostly in issues related to their occupations. This finding is
supported by a study conducted by Yilmaz (2017). Similarly, it was found in the study
conducted with teachers working at primary, secondary and high schools that teachers
are most exposed to occupational mobbing behaviors and then to mobbing behaviors
towards their personalities.
It was determined that the levels of mobbing experienced by the teachers did not
demonstrate a significant variance in the comparisons made based on gender, age,
marital status, seniority, and educational status. According to these results, it may be
suggested that music teachers’ exposure to mobbing is experienced equally in all ages,
seniorities and educational statuses regardless of gender and marital status. In
addition, Leyman (1996) determined that mobbing does not vary significantly in terms
of gender and age. It is determined in the studies conducted by Atar (2017), Besogul
(2014), Erdemir (2013), Gokce (2006) and Sonmezisik (2011) that exposure to mobbing
behaviors does not demonstrate a significant variance in terms of gender. Similar to
the findings of this study, it is revealed in the studies conducted by Otrar and Ozen
(2009) and Zorlu (2017) that the variable of marital status does not demonstrate a
significant variance. However, it is possible to encounter different results in the
44 Ayda ARAS Eurasian Journal of Educational Research 84 (2019) 29-56
literature from the findings of this study. In a study conducted by Erturk (2005) with
primary school teachers and school administrators, it is determined that mobbing
exposure levels of the participants vary in terms of gender, position and age.
According to the results of these variables, it is concluded that males are exposed to
mobbing more than females, school administrators are exposed to mobbing more than
teachers and the age group of 53 years and above, which is the highest age group in
the scope of the research, is exposed to mobbing more than the other age groups. In
his study conducted with secondary school teachers, Urasoglu Bulut (2007)
demonstrated that male teachers and employees under the age of 25 are more exposed
to mobbing at school. However, in some studies (Cogenli, Asunakutlu & Turegun,
2017; Karabacak Asir & Akin, 2014; Otrar & Ozen, 2009; Ozdemir, 2015), it is concluded
that female teachers are exposed more to mobbing behaviors. Serin (2018)
demonstrated that primary school teachers' exposure to mobbing behaviors do not
demonstrate a significant variance according to variables of marital status, age,
occupational seniority, educational status and branch; but that male teachers and
teachers who have been working at the school for 1-5 years are exposed to mobbing
behaviors more. As is seen, different results have been obtained in the literature about
the variation of the levels of mobbing experienced by teachers in terms of demographic
variables.
It is concluded that music teachers’ perceptions of organizational commitment,
compliance, identification and internalization sub-dimensions were quite high.
Similarly, Coban (2015) also demonstrated that teachers had high organizational
commitment. Aslan and Agiroglu Bakir (2014) determined in their studies, in which
they examined the organizational commitment of teachers, that teachers have positive
feelings about the institution they work at. The study conducted by Kocabiyik (2017)
determined that the organizational commitment levels of teachers are at a moderate
level. However, Karacaoglu and Guney (2010); Ugrasoglu and Caganaga (2017); Goren
and Sarpkaya (2014) also concluded in their studies that teachers have low
organizational commitment and do not feel sufficiently attached to their institutions.
It is determined that the levels of organizational commitment of music teachers do not
demonstrate significant variance in the comparison based on gender and educational
status. In the studies conducted by Karacaoglu and Guney (2010) and Nartgun and
Menep (2010), it is determined that there is no variance between the organizational
commitment of teachers based on gender. However, studies in the literature are also
found where male teachers have higher organizational commitment (Aslan &
Agiroglu Bakir, 2014; Coban, 2015; Kursunoglu, Bakay & Tanriogen, 2010). Different
from this study, Aslan and Bakir (2014) concluded in terms of educational status
variables that the perceptions of organizational commitment of teachers with associate
degrees are higher than those with undergraduate degrees.
In this study, it was revealed that the organizational commitment levels of music
teachers demonstrated significant variance according to age, marital status and
seniority variables. In the comparison of organizational commitment levels according
to age groups, it was determined that there was significant variance in the sub-
dimensions of compliance and identification, and variance between the young
Ayda ARAS Eurasian Journal of Educational Research 84 (2019) 29-56
45
teachers in the age group of 22-30, the middle-aged teachers in the age group of 31-39,
and the teachers in the age group of 40 and above, and that young music teachers had
more difficulty in compliance compared to their older colleagues. In terms of age
variable, different results were achieved in the organizational commitment.
Kursunoglu, Bakay and Tanriogen (2010) demonstrated that the emotional
commitment of teachers who are 46 years old and above is higher than that of teachers
who are 35 years old and under; and Coban (2015) demonstrated that the
organizational commitment scores of teachers in the age group of 36-50 are higher than
those of teachers in the age group of 20-35. However, Karacaoglu and Guney (2010)
determined that the organizational commitment of teachers does not differ based on
age.
In the comparison of levels of organizational commitment of music teachers
according to marital status, it was concluded that there was a significant variance in
the sub-dimensions of compliance and identification; that in the sub-dimension of
compliance, divorced music teachers had less compliance compared to their single or
married colleagues, whereas in the sub-dimension of identification, married music
teachers had less identification compared to the single music teachers; and that single
music teachers had more identification than their divorced colleagues. Kursunoglu,
Bakay and Tanriogen (2010) demonstrated that the normative commitment of married
teachers is higher compared to the normative commitment of single teachers.
Similarly, Goren and Yengin Sarpkaya (2014) revealed that married teachers have a
higher level of affective commitment compared to single teachers. Moreover, there are
studies concluding that there are no variances between the organizational
commitment of teachers in terms of marital status variable (Karacaoglu & Guney, 2010;
Nartgun & Menep, 2010).
It is determined in the comparison of the levels of organizational commitment
based on seniority year that music teachers who had a seniority of 1-15 years had lower
organizational commitment in the internalization sub-dimension than their colleagues
who had seniority of 16 years and above. In other words, it was concluded that
teachers who had seniority of 15 years or less demonstrated less internalization
towards their organizations. Nartgun and Menep (2010) determined that the
perception levels of emotional commitment of teachers who have occupational
seniority of 1-5 years are lower than those of teachers who have occupational seniority
of 6-10 years. On the other hand, Aslan and Bakir (2014) revealed that the perceptions
of organizational commitment of teachers who have seniority of 6-10 years and 16-20
years are significantly lower than the perceptions of organizational commitment of
their colleagues who have seniority of over 21 years. Kursunoglu, Bakay and
Tanriogen (2010), however, determined that there is no variance in the organizational
commitment of the teachers according to the seniority variable, but the emotional
commitment of the teachers who have been working at that school for 5 years and less
is lower than that of teachers working at the school they were working for 6-10 years
and 11 years and more.
It is concluded that music teachers were generally satisfied with their jobs
according to the sub-dimensions of both internal and external job satisfaction. In other
46 Ayda ARAS Eurasian Journal of Educational Research 84 (2019) 29-56
words, the job satisfaction of the music teachers participating in the study was at a
good level. Similarly, in many studies (Altinkurt & Yilmaz, 2014; Gencturk & Memis,
2010; Kumas & Deniz, 2010; Sahin, 2013; Yilmaz, 2017), it is determined that the job
satisfaction of teachers is at a moderate level. It was determined in this study that job
satisfaction did not vary in terms of gender and seniority and that age and marital
status demonstrated a significant variance in job satisfaction levels. Accordingly, in the
sub-dimension of external job satisfaction, it was observed that music teachers who
were 39 years old and under demonstrated more external job satisfaction compared to
their colleagues who were 40 years old and above, and that, accordingly, there was a
decrease in the external job satisfaction as the music teachers working at primary
schools exceeded the age of 40, and that the external job satisfaction in divorced
teachers was found to be lower compared to married or single teachers. Even though
it is concluded in many studies (Altinkurt &Yilmaz, 2014; Arkci, 2014; Deregozu, 2016;
Gencturk & Memis, 2010; Kilic, 2013; Olcum, 2015; Yilmaz, 2017) that the job
satisfaction levels of teachers do not vary based on gender variable, there are also
studies that demonstrate higher levels of job satisfaction of female teachers (Kumas &
Deniz, 2010) or higher levels of job satisfaction of male teachers (Umay, 2015).
Although there are studies, similar to the present study, indicating that the job
satisfaction of teachers is not varied based on seniority (Altinkurt & Yilmaz, 2014;
Arkci, 2014; Yilmaz, 2017), it is possible to come across studies (Gencturk & Memis,
2010; Kilic, 2013; Kumas & Deniz, 2010) that determine significant variances in terms
of seniority. It is possible to encounter different results in the literature based on age
variable. Similar to the findings of the present study, it is determined in a study
conducted by Yilmaz (2017) that teachers in the age group of 31-39 have higher job
satisfaction levels compared to the teachers in the age group of 40-49. Deregozu (2016)
also determined that the job satisfaction score of teachers in the age group of 30-40 is
lower. Kumas and Deniz (2010) determined that job satisfaction levels of young
teachers (in the age group of 20-25) are higher compared to those of higher age groups;
and Filiz (2014), Olcum (2015) and Sahin (2013) determined that age is a variable that
does not have an impact on job satisfaction. In terms of marital status variable, there
are different results in the literature. It is observed in some studies that single teachers
have more job satisfaction compared to married teachers (Deregozu, 2016; Sahin,
2013); and in some other studies, it is observed that the job satisfaction of teachers do
not differ based on marital status variables (Filiz, 2014; Yilmaz, 2017).
It was concluded that the level of mobbing experienced had an adverse impact on
the levels of organizational commitment and job satisfaction, that job satisfaction and
organizational commitment scores of teachers decreased as their mobbing scores
increased, and that the level of mobbing experienced had more impact on job
satisfaction compared to organizational commitment. It was determined that the level
of mobbing experienced had the most impact on the compliance sub-dimension of
organizational commitment, then followed by the sub-dimensions of external job
satisfaction and internal job satisfaction. Moreover, according to the regression results
concerning the relationship between level of mobbing experienced by, and the
organizational commitment and job satisfaction of music teachers, it was determined
Ayda ARAS Eurasian Journal of Educational Research 84 (2019) 29-56
47
that level of mobbing significantly predicted organizational commitment and job
satisfaction. A negative relationship is determined between mobbing and job
satisfaction in the studies conducted with nurses by Ozdemir (2014) and Talas (2016).
It is also seen in a study conducted with the instructors that there is a significant
negative relationship between the two structures (Civilidag, 2011). Similarly, in a
study conducted by Vural Ozkan (2011) with participants working in different fields,
a negative relationship between mobbing and job satisfaction is determined. However,
a significant negative relationship is found between the two structures in studies
examining the relationship between mobbing behaviors and organizational
commitment (Aktas Kutukcu, 2015; Hickorkmaz, 2016; Zorlu, 2017). However, there
are also studies in literature, which reveal the absence of a significant relationship
between mobbing and organizational commitment (Tuncel, 2009; Cetin, 2015).
In conclusion, one of the important findings of this study was to reveal that there
was a negative and significant relationship between the levels of mobbing experienced
by, and the organizational commitment and job satisfaction of teachers, and that these
two structures significantly predicted mobbing behaviors. Therefore, a requirement of
increasing the organizational commitment and job satisfaction of music teachers is to
ensure that they are not exposed to mobbing behaviors. When taking into
consideration that music teachers experience mobbing in schools, especially in relation
to their occupations, and mobbing behaviors they are most exposed to, creating their
role/position definitions at the level of their competences, taking into account their
ideas and views and their requests when they ask to use their rights (sick leave, holiday
entitlement) will help increase their organizational commitment and job satisfaction.
Therefore, it is obvious that school administrators have important responsibilities in
this regard. In this regard, knowing that the organizational commitment of the
employees, whose job satisfaction is increased, will increase and the negative effects
of mobbing will, in any case, be eliminated, will guide the administrators in
determining the strategies about their employees. On the other hand, this research will
offer important insight into scientists working and/or conducting research on
mobbing. In future studies, new research designs may be formed with a number of
different variables on, for example, how to increase job satisfaction and organizational
commitment or on how to reduce mobbing.
References
Aksoy, F. (2008). Psikolojik şiddet’in (mobbing) sağlık çalışanlarına etkisi (Yayımlanmamış doktora tezi). Marmara Üniversitesi Sağlık Bilimleri Enstitüsü, İstanbul.
Aktas Kutukcu, B. (2015). Mobbing (yıldırma) ve örgütsel bağlılıkla ilişkisi: Bir kamu kurumu örneğinde (Yayımlanmamış yüksek lisans tezi). Gazi Üniversitesi, Sosyal Bilimler Enstitüsü.
Altinkurt, Y., & Yilmaz, K. (2014). Ogretmenlerin mesleki profesyonelliği ile iş doyumları arasındaki ilişki. Sakarya Üniversitesi Eğitim Fakültesi Dergisi, 4(2), 57-71.
48 Ayda ARAS Eurasian Journal of Educational Research 84 (2019) 29-56
Arkçı, M. (2014). Ilkogretim okulu mudurlerinin liderlik stillerinin ogretmenlerin iş doyumuna etkisi: Gölbaşı ilçesi örneği (Yayımlanmamış yüksek lisans tezi). Türk Hava Kurumu Üniversitesi, Sosyal Bilimler Enstitüsü.
Aslan, M., & Ağıroğlu Bakır, A. (2014). Öğretmenlerin okullarındaki örgütsel bağlılığa ilişkin görüşleri. International Journal of Social Science, (25), 189-206. Doi number: http://dx.doi.org/10.9761/JASSS2249.
Atar, B. (2017). Sınıf öğretmenlerinin örgütsel adalet algıları ile psikolojik şiddet algıları
arasındaki ilişki (Yayımlanmamış yüksek lisans tezi). Akdeniz Üniversitesi, Eğitim Bilimleri Enstitüsü.
Bahce, C. (2007). Mobbing oluşumunda örgüt kültürünün rolü: bir örnek uygulama (Yayımlanmamış yüksek lisans tezi). Gazi Üniversitesi Sosyal Bilimler Enstitüsü, Ankara
Balay, R. (2000). Özel ve resmi liselerde yönetici ve öğretmenlerin örgütsel bağlılığı: Ankara ili örneği (Yayımlanmamış doktora tezi). Ankara Üniversitesi Sosyal Bilimler Enstitüsü, Ankara.
Basaran, İ.E. (2008). Örgütsel davranış insanın üretim gücü. Ankara: Ekinoks Eğitim Danışmanlık.
Besogul, C. (2014). Öğretmenlerin mobbinge maruz kalma düzeyleri ile örgütsel bağlılıkları arasındaki ilişki Kocaeli ili Gölcül ilçesi örneği (Yayınlanmamış yüksek lisans tezi). Kocaeli Üniversitesi, Sosyal Bilimler Enstitüsü, Kocaeli.
Brown, T. A. (2006). Confirmatory factor analysis: For applied research. NY: Guilford Press.
Browne, M. W., & Cudeck, R. (1993). Alternativeways of assessing model fit. K.A. Bollen & J.S. Long (Ed.), Testing structural models. Newbury Park: Sage.
Cemaloglu, N. (2007). The relationship between organizational health and bullying that teachers experience in primariy schools in Turkey. Educational Research Quarterly, 31(2), 3-29.
Cetin, A. (2015). İş hayatında yıldırma’nın (mobbing) çalışanların örgütsel bağlılık düzeylerine etkisi: Bir kamu kurumuna yönelik araştırma (Yayınlanmamış yüksek lisans tezi). Türk Hava Kurumu Üniversitesi, Sosyal Bilimler Enstitüsü.
Civilidag, A. (2011). Üniversitelerdeki öğretim elemanlarının psikolojik taciz (mobbing), iş doyumu ve algılanan sosyal destek düzeyleri (Doktora tezi). Selçuk Üniversitesi, Eğitim Bilimleri Enstitüsü.
Coban, T. (2015). Okul kültürünün öğretmenlerin örgütsel bağlılıkları üzerindeki etkilerinin incelenmesi (Yayınlanmamış yüksek lisans tezi). Türk Hava Kurumu Üniversitesi, Sosyal Bilimler Enstitüsü.
Cogenli, M.Z., Asunakutlu, T., & Türegün, Z.N. (2017). Gender and mobbing: The case of Turkey. İşletme Araştırmaları Dergisi, 9(3), 109-121.
Davenport, N., Schwartz, R. D., & Elliot, G.P. (2003). Mobbing iş yerinde duygusal taciz (Translate Önertoy, O.C.). Sistem Yayıncılık No 349. (eserin orjinali 1999’da yayımlanmıştır).

Ayda ARAS Eurasian Journal of Educational Research 84 (2019) 29-56
49
Demir, C. (1998). Ortaöğretim kurumlarında görev yapan rehber öğretmenlerin iş doyumu
(Yayınlanmamış yüksek lisans tezi). Ankara Üniversitesi Sosyal Bilimler Enstitüsü, Ankara.
Deregözü, A. (2016). Kamu ve özel sektörde çalışan öğretmenlerin iş doyumu ve benlik saygısının incelenmesi (Yayınlanmamış yüksek lisans tezi). Beykent Üniversitesi, Sosyal Bilimler Enstitüsü.
Durna, U., & Eren, V. (2005). Üç bağlılık unsuru ekseninde örgütsel bağlılık. Doğuş Üniversitesi Dergisi, 6(2), 210-219.
Ercetin, S.S., Hamedoglu, M.A., & Çelik, S. (2008). Mobbing in primary schools: A case study for Hendek County. World Applied Sciences Journal, 3(6), 945-955
Erdemir, S. (2013). İlköğretim öğretmenlerinin duygusal zeka düzeyleri ile yaşadıkları psikolojik yıldırma (mobbing) arasındaki ilişki üzerine bir araştırma (Yayımlanmamış yüksek lisans tezi). Gaziantep Üniversitesi, Eğitim Bilimleri Enstitüsü, Gaziantep.
Ergener, B. (2008). İlköğretim okullarında görev yapan öğretmenlerin yıldırma (mobbing) yaşamaları ile örgütsel bağlılıkları arasındaki ilişki (Yayımlanmamış yüksek lisans tezi). Gazi Üniversitesi Eğitim Bilimleri Enstitüsü, Ankara.
Erturk, A. (2005). Öğretmen ve okul yöneticilerinin okul ortamında maruz kaldıkları yıldırma eylemleri (Yayımlanmamış yüksek lisans tezi). Gazi Üniversitesi Eğitim Bilimleri Enstitüsü, Ankara.
Filiz, Z. (2014). Öğretmenlerin iş doyumu ve tükenmişlik düzeylerinin incelenmesi. Uluslararası Yönetim İktisat ve İşletme Dergisi, 10(23), 157- 171.
Genctürk, A., & Memiş, A. (2010). İlköğretim okulu öğretmenlerinin öz-yeterlik algıları ve iş doyumlarının demografik faktörler açısından incelenmesi. Elementary Education Online, 9(3), 1037-1054.
Gokce, A. T. (2006). İşyerinde yıldırma: Özel ve resmi ilköğretim okulu öğretmen ve yöneticileri üzerine yapılan bir araştırma (Yayımlanmamış doktora tezi). Ankara Üniversitesi, Eğitim Bilimleri Enstitüsü, Ankara.
Goren, T., & Yengin Sarpkaya, P. (2014). İlköğretim kurumlarında görev yapan öğretmenlerin örgütsel bağlılık düzeyleri (Aydın ili örneği). Eğitim Bilimleri Dergisi, 40, 69-87.
Gunay, A. (2006). Öğretmenlerin lisans eğitimlerinden ve çalışma ortamlarından kaynaklanan sorunları. Kastamonu Eğitim Dergisi, 14 (2), 647-652.
Hackman, J.R., & Oldham, G.R. (1975). Development of the job diagnostic survey. Journal of Applied Psychology, 60(2), 159-170.
Hickorkmaz, S. (2016). Mobbing algısının örgütsel bağlılık düzeyi üzerindeki etkisi (İzmit ilçesi kamu çalışanları örneği) (Yayımlanmamış yüksek lisans tezi). Nişantaşı Üniversitesi, Sosyal Bilimler Enstitüsü.

50 Ayda ARAS Eurasian Journal of Educational Research 84 (2019) 29-56
Hooper, D., Coughlan, J., & ve Mullen, M. (2008). Structural equation modelling: Guidelines for determining model fit. Electronic Journal of Business Research Methods, 6(1), 53–60.
Hu, L. T., & Bentler, P. M. (1999). Cut off criteria for fit indexes in covariance structure analysis: Conventional criteria versus new alternatives. Structural Equation Modelling, 6(1), 1–55.
Izgar, H. (2008). Okul yöneticilerinde iş doyumu ve örgütsel bağlılık. Ahmet Keleşoğlu
Eğitim Fakültesi Dergisi, 25, 317-334.
Karabacak Asir, S., & Akın, G. (2014). Mobbing in primary schools in the context of gender perspective. International Journal of Human Sciences, 11(1), 584-602.
Karacaoğlu, K., & Güney, Y.S. (2010). Öğretmenlerin örgütsel bağlılıklarının, örgütsel vatandaşlık davranışları üzerindeki etkisi: Nevşehir ili örneği. Öneri Dergisi, 9(34), 137-153.
Karacaoglu, K., & Reyhanoglu, M. (2006). ‘Kıbrıs Türkü’ ve ‘Türkiyeli’ ayrımı bağlamında işyerinde yıldırma. Ankara Üniversitesi Sosyal Bilimler Fakültesi Dergisi, 61(4), 145-176.
Karasar, N. (2009). Bilimsel araştırma yöntemi. (19. Baskı). Ankara: Nobel Yayın Dağıtım.
Karyagdı, A. (2007). Örgütlerde yıldırma (mobbing) ve bir araştırma (Yayımlanmamış yüksek lisans tezi). İnönü Üniversitesi Sosyal Bilimler Enstitüsü, Malatya.
Kilic, M. (2013). İlköğretim okullarında görevli öğretmenlerin örgütsel sinizm düzeyleri ile iş doyumları arasındaki ilişkinin incelenmesi (Yayımlanmamış yüksek lisans tezi). Gaziantep Üniversitesi, Eğitim Bilimleri Enstitüsü.
Kocabiyik, M. (2017). Öğretmenlerin örgütsel bağlılıklarının yordanmasında, okul yöneticilerinin kullandıkları güç mesafesi ve örgütsel adaletin etkisi (Yayımlanmamış yüksek lisans tezi). İstanbul Sabahattin Zaim Üniversitesi, Sosyal Bilimler Enstitüsü.
Kocaoglu, M. (2007). Mobbing (iş yerinde psikolojik taciz, yıldırma) uygulamaları ve motivasyon arasındaki ilişkinin incelenmesine yönelik bir araştırma (Yayımlanmamış yüksek lisans tezi). Yıldız Teknik Üniversitesi Sosyal Bilimler Enstitüsü, İstanbul.
Kumas, V., & Deniz, L. (2010). Öğretmenlerin iş doyum düzeylerinin incelenmesi. Marmara Üniversitesi Eğitim Fakültesi Eğitim Bilimleri Dergisi, 32(2), 123-139.
Kursunoglu, A., Bakay, E., & Tanrıöğen, A. (2010). İlköğretim okulu öğretmenlerinin örgütsel bağlılık düzeyleri. Pamukkale Üniversitesi Eğitim Fakültesi Dergisi, (28), 101-115.
Leymann, H. (1993). Mobbing. Hamburg, Rowohlt.
Leymann, H. (1996). The content and development of mobbing at work. European Journal of Work and Organizational Psychology, 5(2), 165-184.
Matthiesen, S.B. (2006). Bullying at work: Antecedents and outcomes (Doktoral dissertation). University of Bergensis, Norveç.
Ayda ARAS Eurasian Journal of Educational Research 84 (2019) 29-56
51
Matthiesen, S.B., & S. Einersen. (2004). Psychiatric distress and symptoms of PTSD
among victims of bullying at work. British Journal of Guidance & Councelling, 32(3), 335-356.
Meyer, J.P, & Allen, N.J. (1997). Commitment in the workplace, theory, research and application. California: Sage Publications.
Miles, J., & Shevlin, M. (2007). A time and a place for incremental fit indices. Personality and Individual Differences, 42(5), 869–874.
Minibas-Pousard, J., & Idig-Camuroglu, M. (2009). Psikolojik taciz iş yerindeki kabus. Ankara: Nobel Yayın.
Nartgun, S.S., & Menep, I. (2010). İlköğretim okullarında görev yapan öğretmenlerin örgütsel bağlılığa ilişkin algı düzeylerinin incelenmesi: Şırnak/İdil örneği. Uluslararası İnsan Bilimleri Dergisi, 7(1), 288-316.
O’Reilly, C., & Chatman, J. (1986). Organizational commitment and psychological attachment: The effects of compliance, ıdentification and ınternalization on prosocial behavior. Journal of Applied Psychology, 71(3), 492-499.
Olcum, D. (2015). Okul yöneticilerinin karar verme stillerinin öğretmenlerin iş doyumuna etkisi (Sakarya ili örneği) (Yayınlanmamış yüksek lisans tezi). Sakarya Üniversitesi, Eğitim Bilimleri Enstitüsü.
Otrar, M., & Özen, B. (2009) Rehber öğretmenlerin okul ortamında algıladıkları yıldırma davranışları. İş Ahlakı Dergisi, 2(3), 97-120.
Ozdemir A. (2015). Öğretmenlerin psikolojik şiddet (mobbing) algıları İstanbul İli Anadolu Yakasındaki imamhatip ortaokullarında bir tarama (Yayınlanmamış yüksek lisans tezi). Maltepe Üniversitesi, İstanbul.
Ozdemir, S. (2014). Mobbing ve iş doyumu ilişkisi (Hemşireler üzerine bir araştırma) (Yayınlanmamış yüksek lisans tezi). Atılım Üniversitesi, Sosyal Bilimler Enstitüsü.
Ozdevecioglu, M. (2003). Algılanan örgütsel destek ile örgütsel bağlılık arasındaki ilişkilerin belirlenmesine yönelik bir araştırma. Dokuz Eylül Üniversitesi İktisadi İdari Bilimler Fakültesi Dergisi, 18(2), 113-130.
Ozkaya, M. O., Yakin, V., Ekinci, T. (2008). “Stres Düzeylerinin Çalışanların İş
Doyumu Üzerine Etkisi”, Celal Bayar Üniversitesi Çalışanları Üzerine Ampirik
Bir Araştırma”, Yönetim ve Ekonomi, 15 (1), ss. 163-179
Saari, L.M., & Judge, T.A. (2004). Employee attitudes and job satisfaction. Human Resource Management, 43(4), 395–407.
Sahin, I. (2013). Öğretmenlerin iş doyumu düzeyleri. YYÜ Eğitim Fakültesi Dergisi, 10(1), 142-167.
Sahin, N. (2006). Duygusal taciz (mobbing) ve organizasyonel sonuçlar üzerindeki etkisi: Bankacılık sektöründe bir uygulama (Yayımlanmamış yüksek lisans tezi). İstanbul Üniversitesi Sosyal Bilimler Enstitüsü, İstanbul.
52 Ayda ARAS Eurasian Journal of Educational Research 84 (2019) 29-56
Sevimli, F., & İşcan, Ö.F. (2005). Bireysel ve iş ortamına ait etkenler açısından iş doyumu. Ege Akademik Bakış Dergisi, 5(1-2), 55-64.
Sezerel, H. (2007). Örgütlerde mobbing etkileri ve Tülomsaş–Türkiye Lokomotif ve Motor Sanayi A.Ş’de bir uygulama (Yayımlanmamış yüksek lisans tezi). Anadolu Üniversitesi Sosyal Bilimler Enstitüsü, Eskişehir.
Sonmezisik, S. (2011). Anadolu lisesi öğretmenlerinin psikolojik yıldırmaya ilişkin algıları (Yayımlanmamış yüksek lisans tezi). Dokuz Eylül Üniversitesi, Eğitim Bilimleri Enstitüsü, İzmir.
Subramaniam N., McManus L., & Mia L. (2002). Enhancing hotel managers’ organisational commitment: An ınvestigation of the impact of structure, need for achievement and participative budgeting. Hospitality Management, 21, 303– 320.
Talas, Ş. (2016). Hemşirelere uygulanan mobbing ile iş doyumu arasındaki ilişkinin incelenmesi (Yayımlanmamış yüksek lisans tezi). İstanbul Gelişim Üniversitesi, Sosyal Bilimler Enstitüsü.
Teddlie,C., & Yu, F. (2007). Mixed methods sampling a typology with examples. Journal of Mixed Methods Research, 1(1), 77-100.
Tinaz, P. (2008). İş yerinde psikolojik taciz (mobbing) (2. baskı) İstanbul: Beta Basım Yayım.
Toker Gökçe, A. (2008). Mobbing: İş yerinde yıldırma nedenleri ve başa çıkma yöntemleri. Ankara: Pegem Akademi Yayıncılık.
Tuncel, Ö. (2009). Kişilik ve örgüt kültürü bağlamında yıldırma davranışının örgütsel bağlılık üzerine etkisi: Ampirik bir çalışma (Yayımlanmamış yüksek lisans tezi). Muğla Üniversitesi, Sosyal Bilimler Enstitüsü.
Tutar, H. (2007). Erzurum’da devlet ve özel hastanelerde çalışan sağlık personelinin işlem adaleti, iş tatmini ve duygusal bağlılık durumlarının incelenmesi. Süleyman Demirel Üniversitesi İktisadi ve İdari Bilimler Fakültesi, 12(3), 97-120.
Uğrasoğlu, I.K., & Çaganaga, C.K. (2017). Öğretmenlerin örgüte bağlılık düzeylerinin farklı değişkenler açısından incelenmesi. International Journal of New Trends in Arts, Sports & Science Education, 6(4), 10-38.
Umay, G. (2015). Psikolojik danışman ve rehberlik öğretmenlerinin iş doyumu ve tükenmişlik düzeylerinin ilişkisi (Yayımlanmamış yüksek lisans tezi). Yeditepe Üniversitesi, Eğitim Bilimleri Enstitüsü, İstanbul.
Urasogulu Bulut, H. (2007). Ortaöğretim öğretmenlerinde psikolojik şiddet düzeyi (mobbing), (Yayımlanmamış yüksek lisans tezi). Niğde Üniversitesi, Sosyal Bilimler Enstitüsü, Niğde.
Varlık, T. (2000). Devlet ve özel ilköğretim okullarında çalışan öğretmenlerin iş doyumu (Ankara ili örneği) (Yayınlanmamış yüksek lisans tezi). Hacettepe Üniversitesi Sosyal Bilimler Enstitüsü, Ankara.
Ayda ARAS Eurasian Journal of Educational Research 84 (2019) 29-56
53
Vural Özkan, G. (2011). İşyerinde yıldırma (mobbing) ve iş doyumu ilişkisi
(Yayımlanmamış yüksek lisans tezi). Dokuz Eylül Üniversitesi, Sosyal Bilimler Enstitüsü.
Yiılmaz, İ. (2017). Öğretmenlerin maruz kaldıkları psikolojik yıldırma (mobbing) davranışları ile iş doyumu arasındaki ilişki (Yayınlanmamış yüksek lisans tezi). Muğla Sıtkı Koçman Üniversitesi, Eğitim Bilimleri Enstitüsü.
Yildirim, S. (2007). Motivasyon ve çalışma yaşamında motivasyonun önemi (Yayımlanmamış yüksek lisans tezi). Kahraman Maraş Sütçü İmam Üniversitesi Sosyal Bilimler Enstitüsü, Kahramanmaraş.
Yildiz, G. (2004, 7-10 Nisan). Müzik öğretmenlerinin iş doyumu. 1924-2004 Musiki Muallim Mektebinden Günümüze Müzik Öğretmeni Yetiştirme Sempozyumunda sunulan bildiri, Isparta.
Zapf, D., & Einarsen, S. (2001). Bullying in the workplace: Recent trends in research and practice an introduction. European Journal of Work and Organizational Psychology, 10(4), 369-373.
Zorlu, Z.C. (2017). Mobbingin örgütsel bağlılık üzerindeki etkisi: eğitim sektörü çalışanlarına yönelik ampirik bir çalışma (Yayınlanmamış yüksek lisans tezi). Bahçeşehir Üniversitesi, Sosyal Bilimler Enstitüsü.
Müzik Öğretmenlerinin Mobbing Yaşama Düzeylerinin Örgütsel Bağlılık
ve İş Doyumlarına Etkisi
Atıf: Aras, A. (2019). The effect of mobbing levels experienced by music teachers on
organizational commitment and job satisfaction. Eurasian Journal of Educational Research, 84, 29-56, DOI: 10.14689/ejer.2019.84.2
Özet
Problem Durumu: Eğitim, bireylerin; kendisine, çevresine, ülkesine ve insanlığa yararlı
olabilmesine olanak tanıyan önemli bir süreç olarak ifade edilebilir. Sanat eğitimi
eğitimin, müzik eğitimi ise sanat eğitiminin önemli bir bileşenidir. Müzik eğitimi,
bireyin davranışlarında bilişsel, duyuşsal ve psikomotor değişiklikler oluşturan bir
öğrenme öğretme sürecidir. Bu süreçte en önemli öğelerden birisi müzik öğretmenidir.
Müzik öğretmenlerinin iş ortamındaki yaşantıları verilen eğitimin de kalitesini
etkilemektedir. Dolayısıyla müzik öğretmenlerinin iş doyumlarının ve örgütsel
bağlılıklarının etkili müzik eğitiminin etmenlerinden biri olduğu söylenebilir. Ancak
müzik öğretmenlerinin iş doyumları ve örgütsel bağlılıkları üzerinde birçok etmenin
de rol oynaması muhtemeldir. Bu çalışmada bu etmenlerden birisi olduğu düşünülen
mobbingin müzik öğretmenlerinin örgütsel bağlılık ve iş doyumlarını üzerine etkisi
incelenmiştir.
54 Ayda ARAS Eurasian Journal of Educational Research 84 (2019) 29-56
Araştırmanın Amacı: Bu araştırmada ilköğretim okullarında görev yapan müzik
öğretmenlerinin mobbing yaşama düzeyleri, örgütsel bağlılıkları ve iş doyumları
arasındaki ilişkinin belirlenmesi amaçlanmıştır. Bu genel amaç çerçevesinde aşağıdaki
sorulara cevap aranmıştır:
İlköğretim okullarında görev yapan müzik öğretmenlerinin,
1. Mobbing yaşama, örgütsel bağlılık ve iş doyumu düzeyleri nasıldır?
2. Mobbing yaşama düzeyleri, örgütsel bağlılıkları ve iş doyumu düzeyleri
eğitim durumu, çalışma yılı, medeni durum, yaş ve cinsiyet
değişkenlerine göre anlamlı bir farklılık göstermekte midir?
3. Mobbing yaşama düzeyi, örgütsel bağlılık ve iş doyumları arasında
anlamlı bir ilişki var mıdır?
Araştırma Yöntemi: Bu çalışma ilişkisel tarama modeli ile gerçekleştirilmiştir.
Araştırmanın evrenini Ankara ili ilköğretim okullarında görev yapan müzik
öğretmenleri oluşturmaktadır. Tabakalı örnekleme yöntemi yardımıyla toplam 248
müzik öğretmeni örnekleme alınmıştır. Araştırma verileri Olumsuz Davranış Ölçeği,
Örgütsel Bağlılık Ölçeği ve İş Doyum Ölçeği aracılığılar toplanmıştır. Veri analizi için
SPSS ve LISREL paket programlarından yararlanılmıştır. Öğretmen görüşlerine ilişkin
olarak yapılan fark analizlerinde iki grubun karşılaştırılmasında bağımsız örneklem t
testi, ikiden çok grubun karşılaştırılmasında ise tek yönlü varyans analizi
kullanılmıştır. Varyans analizi sonrası hangi grupların birbirinden farklı olduğunun
tespiti için çoklu karşılaştırma (multiplecomparisons) testlerinden Tukey testi
uygulanmıştır. Araştırmada ilişki yapılarının ortaya konulabilmesi için gözlenen
değişkenlerle yol analizleri yapılmıştır. Araştırmada ilişki yapılarının ortaya
konulabilmesi için korelasyon katsayılarına dayalı path analizleri yapılmıştır.
Değişkenler arasındaki yordamaların ortaya çıkartılmasında ise regresyon
analizinden yararlanılmıştır.
Araştırma Bulguları: Araştırmanın bulgularına göre müzik öğretmenlerinin neredeyse
dörtte biri (%24,6) mobbing davranışlarına maruz kalmaktadır. Ayrıca müzik
öğretmenleri okullarda en fazla mesleklerine ilişkin konularda mobbing
yaşamaktadırlar. Müzik öğretmenlerinin örgütsel bağlılığın, uyum, özdeşleşme ve
içselleştirme alt boyutlarına ilişkin algılarının oldukça yüksek olduğu sonucuna
ulaşılmıştır. Müzik öğretmenlerinin iş doyumunun hem içsel hem de dışsal alt
boyutuna göre, genellikle işlerinden memnun olduğu sonucuna ulaşılmıştır.
Araştırmada öğretmenlerin mobbing yaşama düzeyleri, örgütsel bağlılıkları ve iş
doyumları demografik değişkenler açısından da incelenmiştir. Öğretmenlerin;
mobbing yaşama düzeylerinin cinsiyet, yaş, medeni durum, kıdem ve eğitim
durumlarına göre yapılan karşılaştırmalarda anlamlı bir farklılık göstermediği tespit
edilmiştir. Müzik öğretmenlerinin örgütsel bağlılık düzeylerinin yaş, medeni durum
ve kıdem yılı değişkenine anlamlı farklılık olduğu bu çalışma ile ortaya konulmuştur.
Örgütsel bağlılık düzeylerinin yaş gruplarına göre karşılaştırılmasında; uyum ve
özdeşleşme alt boyutlarında anlamlı bir farklılık gösterdiği, uyum alt boyutunda 22-
30 yaş aralığındaki genç öğretmenler ile 31-39 yaş aralığındaki orta yaşa sahip
Ayda ARAS Eurasian Journal of Educational Research 84 (2019) 29-56
55
öğretmenler ile 40 yaş ve üzerindeki öğretmenler arasında farklılık bulunduğu, genç
müzik öğretmenlerinin kendilerine göre yaşça büyük olan meslektaşlarına göre uyum
konusunda zorlandıkları tespit edilmiştir. Müzik öğretmenlerinin örgütsel bağlılık
düzeylerinin medeni duruma göre yapılan karşılaştırmada, uyum ve özdeşleşme alt
boyutlarında anlamlı bir farklılık gösterdiği, uyum alt boyutunda boşanmış müzik
öğretmenlerinin bekar veya evli meslektaşlarına oranla daha az uyumlu oldukları,
özdeşleşme alt boyutunda ise evli müzik öğretmenlerinin bekar müzik öğretmenlerine
göre daha az özdeşleşme gösterdikleri, bekar müzik öğretmenlerinin de boşanmış
meslektaşlarından daha fazla özdeşleşme gösterdikleri sonucuna ulaşılmıştır.
Örgütsel bağlılık düzeylerinin kıdem yılına göre yapılan karşılaştırmada 1-15 yıl
kıdeme sahip müzik öğretmenlerinin, 16 yıl ve üzerindeki meslektaşlarına göre
içselleştirme alt boyutunda örgütsel bağlılıklarının daha düşük olduğu tespit
edilmiştir. Diğer bir ifadeyle 15 yıl ve daha az kıdeme sahip öğretmenlerin örgütlerine
daha az oranda içselleştirme gösterdikleri sonucuna ulaşılmıştır. İş doyumunun
cinsiyet açısından ve kıdem açısından farklılaşmadığı bu çalışmada, yaş ve medeni
durumun iş doyumu düzeylerinde anlamlı düzeyde fark yarattığı tespit edilmiştir.
Buna göre dışsal iş doyumu alt boyutunda 39 yaş ve altı müzik öğretmenlerinin 40 yaş
ve üstü meslektaşlarına göre daha fazla dışsal iş doyumu gösterdikleri, buna göre
ilköğretim okullarında görev yapan müzik öğretmenlerinin 40 yaşını geçtikçe dışsal iş
doyumunda azalma olduğu ve boşanmış öğretmenlerde dışsal iş doyumunun evli
veya bekar öğretmenlere göre daha düşük olduğu tespit edilmiştir.
Araştırma sonuçlarına göre müzik öğretmenlerinin mobbing yaşama düzeyi ile iş
doyumu ve örgütsel bağlılık düzeyleri arasındaki negatif yönde ve anlamlı ilişki
bulunmuştur. Korelasyon katsayılarına göre mobbing yaşama düzeyinin iş
doyumunu örgütsel bağlılığa göre daha fazla etkilediği sonucuna ulaşılmıştır.
Korelasyon katsayılarına göre mobbing yaşama düzeyinin en fazla örgütsel bağlılığın
uyum alt boyutunu etkilediği, bunu iş doyumunun dışsal iş doyumu ve içsel iş
doyumu alt boyutlarının takip ettiği saptanmıştır. Ayrıca müzik öğretmenlerinin
mobbing yaşama düzeyinin örgütsel bağlılık ve iş doyumu arasındaki ilişkilere
yönelik regresyon sonuçlarına göre, mobbing düzeyinin örgütsel bağlılık ve iş
doyumunu anlamlı derecede yordadığı tespit edilmiştir.
Araştırma Sonuçları ve Önerileri: Müzik öğretmenlerinin okullarda özellikle
mesleklerine ilişkin konularda mobbing yaşadığı ve en fazla maruz kaldıkları
mobbing davranışları göz önüne alındığında, öğretmenlerin rol/görev tanımlarının
yeterlilikleri seviyesinde oluşturulması, fikir ve görüşlerinin dikkate alınması,
haklarını (hastalık izni, tatil hakkı gibi) kullanmayı talep ettiklerinde isteklerinin
dikkate alınması örgütsel bağlılıklarının ve iş doyumlarının artırılmasına yardımcı
olacaktır. İleride yapılacak araştırmalarda, iş doyumunun, örgütsel bağlılığın ve
mobbingin farklı değişkenlerle ilişkileri araştırılarak, bu yapılar için yeni araştırma
modelleri oluşturulabilir.
Anahtar Kavramlar: Mobbing, yıldırma, iş doyumu, örgütsel bağlılık, müzik
öğretmenleri.

Euras ian Journal of Educational Research 84 (2019) 57-70 Eurasian Journal of Educational Research
www.ejer.com.tr
Rasch-Based Objective Standard Setting for University Placement Test Ado Abdu BICHI1, Rohaya TALIB2, Rahimah EMBONG3, Hasnah Binti MOHAMED4, Mohd Sani ISMAIL5, Abdallah IBRAHIM6
A R T I C L E I N F O A B S T R A C T
Article History: Purpose: University placement test is an important
admission policy priority in Nigeria, because it serves
as a university-based selection criterion for placement of students into undergraduate programs in Nigeria. Although recently attention have been
shifted on the call to develop a standard content and standardize the test, yet attention has not been paid on the development of standard setting in which the decisions to select or reject the applicants are made.
This study; therefore, investigated the application Rasch-based Objective Standard Setting (OSS) to establish the standards in a university placement test.
Received: 1 Jul. 2019
Received in revised form: 19 Sept. 2019
Accepted: 22 Sept. 2019 DOI: 10.14689/ejer.2019.84.3
Keywords
rasch measurement, placement test, cut-scores, objective standard setting
Methods: To demonstrate the application of OSS, 9 judges were employed for the conduct of
standard ratings; the data used for Rasch calibration with WINSTEP were the responses of 600 students on the 60 items validated Economics Placement Test (EPT). Findings: The experts’ ratings and Rasch generated logits (item difficulties) were used in
quantifying the set of essential items selected. Results of OSS produced the cut-scores of <-
0.62 into Basic, -0.62 logits into Proficient and 0.02 logits for Advanced performance levels. The examinees in these categories were, 39% at Basic, 32% at Proficient and 29% at Advanced performance levels. Implications for Research and Practice: The results of this OSS provide performance levels
with a clear content related description to informed decision on students’ mastery of the content in EPT. It is recommended that, results from the OSS should be compared with other existing IRT-based methods in similar study to ascertain its external validity.
© 2019 Ani Publishing Ltd. All rights reserved
1 Corresponding Author, School of Education, Universiti Teknologi Malaysia, Johor Bahru, MALAYSIA, e-mail.
[email protected], ORCID: https://orcid.org/0000-0003-2897-5136 2 School of Education, Universiti Teknologi Malaysia, Johor Bahru, e-mail: [email protected] , MALAYSIA,
ORCID: https://orcid.org/0000-0002-3937-7193 3 Faculty of Contemporary Islamic studies, Universiti Sultan Zainal Abidi n, MALAYSIA, email: [email protected] , ORCID: http://orcid.org/0000-0003-0636-8044 4 School of Education, Universiti Teknologi Malaysia, Johor Bahru, MALAYSIA, ORCID: https://orcid.org/0000-0001-5119-6742 5 Faculty of Contemporary Islamic studies, Universiti Sultan Zainal Abidin, M ALAYSIA, ORCID:
https://orcid.org/0000-0003-4608-5639 6 Centre for Fundamental Studies, Universiti Sultan Zainal Abidin, MALAYSIA, ORCID:
https://orcid.org/0000-0003-1698-1192
58 Ado Abdu BICHI, Rohaya TALIB, Rahimah EMBONG, Hasnah Binti MOHAMED, Mohd Sani ISMAIL, Abdallah IBRAHIM/ Eurasian Journal of Educational Research 84 (2019) 57 -70
Introduction
University placement test serves the purposes of placement of prospective
undergraduate into appropriate programmes of universities; therefore, its results or
feedback must have important consequences in taking decisions on students’ qualification to be placed in any of the university programme (Bichi, Talib, Atan,
Ibrahim & Yusof, 2019). The university placement test is conducted to screen students
into undergraduate or graduate programmes; therefore, the test has important consequences such as influencing the future achievement of the students. In
developing the tests, educational experts should ensure that admission tests are valid and reliable which should be able to predict students’ future academic success (Tas &
Minaz, 2019; Atkinson, 2001).
All assessment systems are built upon validity, whether the assessment tools (tests) are locally-designed and administered or a standardized test is designed which aims
to use a test that produces results to support valid inferences and actions (Atkinson,
2001). Moreover, in educational and psychological testing, the quality of inference generated from the assessment results must be sound and well-structured in principles
and empirically verified to withstand systematic criticism (Bichi, et. al, 2019). To
produce tests in educational measurement, established criteria and guidelines of valid and reliable test development should be adequately followed. This implies
professionalism in both the construction and the use of the test (Sanz & Fernández,
2005).
In Nigeria context, test development remains one of the most tedious aspects in
research; there remains less validity and reliability evidence of the university
placement test called Post-UTME in Nigeria universities because the Post UTME are developed usually by groups of teachers/lecturers and members of administrative
staff of tertiary institutions who incidentally lack the requisites, skills and professional
competency to developed and validate placement test of any nature (Akanwa & Nkwocha, 2015; Bichi, 2015; Ikoghode, 2015; Uhunmwuangho & Ogunbadeniyi, 2014)
since these tests are constructed for the placement of prospective undergraduate into
the Bachelor degree programmes. Similarly, only one study in the literature described the psychometric properties of the Post-UTME Economics i.e Hafiz et al. (2016) and no
study described the development and validation of Post-UTME items in Nigeria.
Moreover, there is a growing concern over the issue of inappropriate procedure in reporting the students’ performances or scores in the test and that is a great mismatch
in the appropriateness of the decision taken on students to place them in a particular
programme of the university.
In developing standardized tests, especially university placement test, the
reliability and validity of the test and reporting of students’ performances is essential
and inevitable. Thus, in validating test items certain qualities to be considered include item difficulty, item discrimination, quality of the distractors as well as reliability
(Barlow, 2014). An evaluation system and assessment programs such as university
placement test, reporting student performances is an important concern because a pass-fail decision is taken on students before finally placing prospective
Ado Abdu BICHI, Rohaya TALIB, Rahimah EMBONG, Hasnah Binti MOHAMED, Mohd Sani ISMAIL, Abdallah IBRAHIM/ Eurasian Journal of Educational Research 84 (2019) 57-70
59
undergraduates in a particular program. Therefore, standards or performance
standard is a crucial validity principle and essentially, in high stake assessment methods where the performance standards are used to take critical decision of pass-
fail affects especially prospective undergraduate students (Stone et al., 2011).
Objective of the study
This study presented the application of Rasch-Based (IRT) Objective Standard Setting Method to establish cut-scores by categorising examinees into Basic, Proficient
and Advanced performance levels in a developed university placement test in Nigeria.
Standard Setting
Standard setting was used to classify students into different performance standards. Standard setting can be described as a method of generating single cut
score, (for example, pass-fail) or multiple cut scores (for example dimension of attainment, excellent, moderate and weak) based on the test requirements or
conditions. This cut score work as division of at least two classifications which are
necessary for the test (Cizek & Bunch, 2007). Apart from determining the level of students’ mastery or achievement, standard setting is a technique applied to obtain cut
score which can categorise the examinees into below basic to higher level of
performance (Bejar, 2008). As indicated by the report, standard setting is a vital part of test development stages which should include test development professionals,
measurement experts and policy makers to ensure that, valid and reliable results are
obtained (Bejar, 2008).
There are two classifications of standard setting; norm-referenced (relative) and
criterion-referenced (absolute). In norm-referenced classification, standards are
determined on the basis of the collective or aggregate performance of the entire group of examinees. Performances are observed between examinee scores as a measure of the
whole examinee group and more often used in low-stakes test while criterion
referenced standards feature the segment of the test. The standardization depends upon the learning materials and use in high-stakes testing, for example, graduation or
final examination.
Basically, there are two popular techniques common among psychometricians and policy makers used in establishing performance standards in a standardized test by
classifying the performance levels into (advanced, proficient and basic or below
proficient), these are norm-referenced and criterion-referenced standard setting approaches.
Norm-Referenced Standard Setting (NRS)
According to Carey and Manwaring (2011) in a norm referenced standard setting procedure, four (4) growth models are applied in determining the examinees’ relative
performance level, the models include; trajectory, students’ growth percentile (SGP),
the transition table and projection. Trajectory is the most common among the growth models, because the model requires the identification of the gap between the
examinee’ current performance level and the already established standard or
60 Ado Abdu BICHI, Rohaya TALIB, Rahimah EMBONG, Hasnah Binti MOHAMED, Mohd Sani ISMAIL, Abdallah IBRAHIM/ Eurasian Journal of Educational Research 84 (2019) 57 -70
proficiency level (Carey & Manwaring, 2011). The second strategy is the student
growth model (SGP), this strategy employs norms across particular periods usually years. This model compares the performances of students in similar groups across
years to identify whether some level of growth is demonstrated in the current class.
The third, which is the transition table, positions or places the examinees into any of the three classifications when their performances are below the proficient level (i.e
high minimal, low minimal and weak). Examinees are anticipated to progress to at
least to the category higher than their current standing to achieve their annual growth goal (Khatimin, Aziz, Zaharim & Yasin, 2013).
The last and also the most complex model in norm-reference is the projection
strategy. This model comprises of two segments. The first is performance standards which is a product of the combination of norm-reference and criterion-reference
techniques. It is clear that the standards are certainly not based on content, but
alternately is cluttered by referencing to relative or norms. Secondly, it attempts and proposes the prediction of examinees academic progress based on the past record or
achievement (Carey & Manwaring, 2011; Silber & Foshay, 2010). The projection model
uses advanced level statistics to compare the current examinees with a relatively larger group of similar examinees in the previous years and from different environments to
project or predict their success and possibility of attaining the required proficiency.
Conclusively, this model considers past performances to predict future success which is believed to be unattainable and unacceptable in the area of high-stake examinations.
Criterion-Referenced Standard Setting (CRS)
The Criterion-Referenced Standard Setting can broadly be categorized as traditional and modern. The traditional Criterion-Referenced Standard Setting
includes examinees performances and content definition. The examinee performance
technique can be seen as an assessment of the content through a generated or quantifiable examinee performance. This method is symbolized in Angoff (1971)
which is a popularized model; it can also be seen in other models such as the one
offered by Nedelsky (1954), Ebel (1979) and Jaeger (1982). These models require that, an expert or judges in the standard setting exercise evaluate the content given to them
in a set of test items and predict the examinee success. Explicitly, the experts or judges
are expected to predict the proportion of the examinees who can competently and minimally answer the particular question or item correctly in a given test. At the end
of the exercise, a sum or average of their predictions becomes the established
performance standard which is commonly come up with after several and consistent iterative sessions where the judges deliberate and reach agreement on the minimally
acceptable standard. The Angoff model is considered to be the most popular in this
category because it is considered more “sensible, valuable, adequate, and much of the time ideal to different models.
In Modern Criterion-Referenced Standard Setting, Modern Item Response Theory
(IRT) techniques such as Rasch approach are popularly been used especially in high-stake testing programmes in the modern assessment setting, this is because the models
provide a great avenue and ability in tracking the criterion-referenced performance

Ado Abdu BICHI, Rohaya TALIB, Rahimah EMBONG, Hasnah Binti MOHAMED, Mohd Sani ISMAIL, Abdallah IBRAHIM/ Eurasian Journal of Educational Research 84 (2019) 57-70
61
growth. When the goal of testing programme is to define the content and apparently
a criterion-referenced is content based standard setting method, then defining or describing content through examinees performances using test scores is completely
inadequate (Stone et al., 2011; Stone 2009) for the reason that content is only laterally
associated to the defined examinee performance and that should not be the basis for its definition. In an effort to solve these critical issues of validity concerns in traditional
models, improved modern techniques of establishing standard settings were
developed among which are Bookmark Model (Lewis, 1996) and the Objective Standard Setting (OSS) Approach (Stone, 1996). The OSS as modern criterion
referenced standard setting model will be the focus in this study.
Objective Standard Setting Model (OSS)
Objective standard setting (OSS) defines standards through content directly and not through expectations or likelihood of success (Stone, 2001). A panel of experts or
judges are used in the process of setting the standards similar to the traditional
approach of standard setting. Conversely, in this technique panels of judges are asked to appraise the contents based on its presentation through the items and determine
whether the content is well represented to be considered essential for an examinee to
have mastered the content and not the prediction of the likely proportion of successful examinees. Though the entire content is expected to be relatively essential not all
content in an assessment or testing program is essential (i.e highly central, core and
critical).
Objective standard setting procedure can only be successful with the application
of Rasch measurement model. Through Rasch measurement model, raw, deterministic or ordinal test scores are transformed into probabilistic linear-scale identical to ruler
with measurement units termed as logits. This transformation holds and improves the
full content definition that is necessary in the testing program while creating standard interval level measure. The test scores (crude) failed to address the innate connection
among items and its body or with its difficulty level. A raw score of say 75 for instance,
may represent 75 correct answers (scores) when applying conventional scoring strategies. Interestingly the Rasch measurement approach tends to address this issue
by creating construct ruler that gathers the individual items and individual person
parameters along with specific single or more rulers. The test items are arranged in one side and the persons are displayed in another side with easy items and less abled
person with less ability at the bottom while most difficult items with high abled
persons are placed at the highest point of the ruler (Khatimin, Aziz, Zaharim & Yasin, 2013).
The item measures (logits) represent the construct quantitatively and offer its
qualitative expression. Using the logits (item measures) test items are assembled from the less difficult or easiest to the most difficult items on the construct ruler. On the
basis of these progresses, this standard setting model has been effectively and
constantly utilized in establishing standards setting or performance levels on dichotomously scored tests (MacDougall & Stone, 2015). The ability to apply Rasch
measurement models ruler in setting standards lead to the creation of construct within
62 Ado Abdu BICHI, Rohaya TALIB, Rahimah EMBONG, Hasnah Binti MOHAMED, Mohd Sani ISMAIL, Abdallah IBRAHIM/ Eurasian Journal of Educational Research 84 (2019) 57 -70
the OSS, it provides theoretical possibilities to develop multilevel performance
standards using the same method. This could make it possible to create two standards or performance levels (advanced and proficient) and apply those levels to a construct
ruler.
The OSS was adopted in this study because the need to classify learners into achievement is a frequent and long-standing occurrence internationally (Stone, 1996).
The current trends revealed that the development measures are solidly situated in
normative gatherings, without reference to explicit substance and eventually utilize normative information which are not criterion referenced. Such self-assertive and
norm-referenced standard setting conditions are unsatisfactory and incomprehensible
in the realm of high-stakes testing where choices should be legitimately solid and authority of explicit substance is required (Silber & Foshay, 2010). In that capacity,
most psychological studies where high-stakes testing is actualized have received
modern criterion referencing techniques for standard setting in which OSS approach appears to be more recent, objective and content balanced standard setting technique.
Method
Research Design
This study intended to establish the standards in a university placement test and to provide evidence of adequacy of the Rasch-based Objective Standard Setting (OSS) in setting standard performance or cut score. Due to the fact that setting cut score in this study was related to the determination and identification of valid and justifiable standard, this was a descriptive survey research (Karasar, 2016).
Instrumentation
The Economics Placement Test (EPT) was a developed 60 items multiple choice test (Bichi, et. al, 2019). The distribution of the 60 items reflects the five (5) Economics sub-dimensions as contained in the National Economics Curriculum of Nigeria (NERDC, 2016) and spread across five domains of Bloom ’s Taxonomy of Cognitive Objective (revised). The EPT proved to be appropriate to be used with prospective university students as the test possessed adequate content validity (CVR=0.91) with corresponding modified Kappa of 0.864. Equally, the EPT has an excellent person, item as well as adequate internal consistency reliability of 0.87, 0.99 and KR-20 = 0.86 (Linacre, 2019). Similarly, the item measure (infit and outfit) parameters were suitable for all the 60 test items (Bichi, et. al, 2019; Khatimin, et. al., 2013).
Sampling and Data Collection Procedure
To complete the performance standard setting exercise in this study, nine experts were employed to form the panel of judges. All the nine members are experts in Economics Education, assessment and testing because they each taught and participated in the development and administration of the university placement test at universities and colleges in Nigeria. All of the members in the panel hold higher degree (Master and PhD). Nine experts are considered adequate because at least six experts are required to conduct standard setting in OSS (Sondergeld, Stone & Kruse, 2018).

Ado Abdu BICHI, Rohaya TALIB, Rahimah EMBONG, Hasnah Binti MOHAMED, Mohd Sani ISMAIL, Abdallah IBRAHIM/ Eurasian Journal of Educational Research 84 (2019) 57-70
63
Therefore, on agreement and consent of the experts to participate in this
exercise, an OSS item and content description that, contained items and topics, objective for ‘item mapping’ and performance level descriptions were developed and distributed to each of them. The Judges were asked to review content-balanced item and classify the items as either (i) necessary to demonstrate minimal proficiency (ii) necessary to demonstrate advanced competency and (iii) not necessary to demonstrate competency (Sondergeld, et al., 2018). At the end of the exercise, experts
provided their rating on each item individually.
Similarly, to generate item logits for the analysis, the 60 items EPT was administered to 600 prospective university students in Nigeria. The students were through their 3 years senior secondary school and passed through all the Economics contents as spelt in the curriculum, and they were preparing for their final and University entrance examinations that year. Their responses were scored and analysed using Rasch measurement procedures and the item measures; data fit, item and person measures generated were used for selection of essential items.
Data Analysis
Experts provided their individual final rating and classification of the items into (i) necessary to demonstrate minimal proficiency (ii) necessary to demonstrate advanced competency and (iii) not necessary to demonstrate competency. Similarly, data
from the administration of the EPT was coded and entered in appropriate data sheet for analysis using WINSTEP 3.7.1 (Linacre, 2019) to determine the item measures; data fit, item and person measures as well as item map.
Rasch generated item measures (logits) or item difficulties were used in quantifying the essential items selected. The mean of i tem measure (logits) linked to each content expert’s designated vital or essential test items became the cut score for that expert. The aggregate average score across the experts was used as a cut-score for the test (Sondergeld et. al., 2018). Lastly, considering the fact that all measurement processes were not free from errors, this OSS method took care of it. A sample of content balanced test items below and above criterion within or up to two standard errors of measurements were chosen to produce a standard Rasch construct ruler to determine the ability at basic, proficient and advanced cut scores.
Results
After the expert judges complete reviews and ratings, the panels of judges classified the items into “essential” for content mastery, ‘minimal’ proficiency and not necessary to demonstrate competency. The practice of OSS began with the selection of
essential items identified by the experts within the test.
As required by OSS the previously Rasch calibrated result (measures) was used to quantify the selected items in the two categories. The results in Table 1 showed the mean rating (quantified criterion) associated with each of the panellist’s decision on essentials items in logits which became the measure or cut score for that expert judge. An overall average across panel of experts became the final cut score.
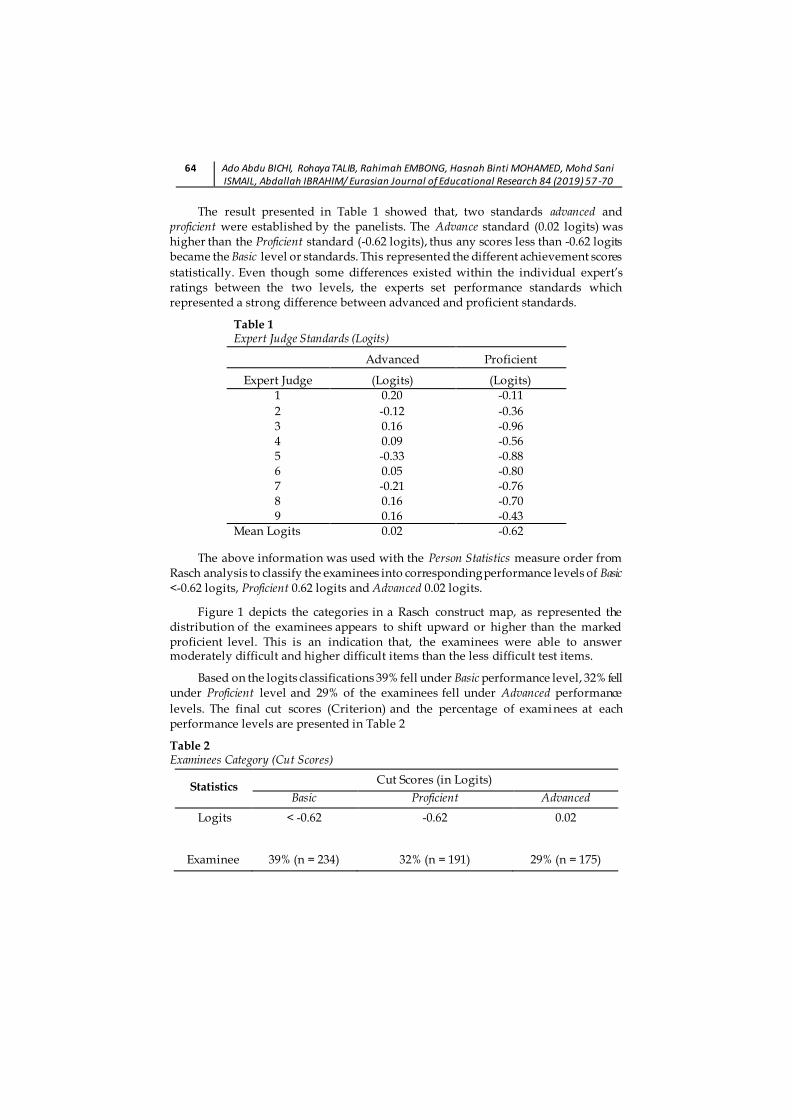
64 Ado Abdu BICHI, Rohaya TALIB, Rahimah EMBONG, Hasnah Binti MOHAMED, Mohd Sani ISMAIL, Abdallah IBRAHIM/ Eurasian Journal of Educational Research 84 (2019) 57 -70
The result presented in Table 1 showed that, two standards advanced and
proficient were established by the panelists. The Advance standard (0.02 logits) was higher than the Proficient standard (-0.62 logits), thus any scores less than -0.62 logits became the Basic level or standards. This represented the different achievement scores
statistically. Even though some differences existed within the individual expert’s ratings between the two levels, the experts set performance standards which represented a strong difference between advanced and proficient standards.
Table 1 Expert Judge Standards (Logits)
Advanced Proficient
Expert Judge (Logits) (Logits) 1 0.20 -0.11
2 -0.12 -0.36 3 0.16 -0.96 4 0.09 -0.56 5 -0.33 -0.88 6 0.05 -0.80 7 -0.21 -0.76 8 0.16 -0.70 9 0.16 -0.43
Mean Logits 0.02 -0.62
The above information was used with the Person Statistics measure order from Rasch analysis to classify the examinees into corresponding performance levels of Basic <-0.62 logits, Proficient 0.62 logits and Advanced 0.02 logits.
Figure 1 depicts the categories in a Rasch construct map, as represented the distribution of the examinees appears to shift upward or higher than the marked proficient level. This is an indication that, the examinees were able to answer moderately difficult and higher difficult items than the less difficult test items.
Based on the logits classifications 39% fell under Basic performance level, 32% fell under Proficient level and 29% of the examinees fell under Advanced performance
levels. The final cut scores (Criterion) and the percentage of examinees at each performance levels are presented in Table 2
Table 2 Examinees Category (Cut Scores)
Statistics Cut Scores (in Logits)
Basic Proficient Advanced
Logits < -0.62 -0.62 0.02
Examinee 39% (n = 234) 32% (n = 191) 29% (n = 175)
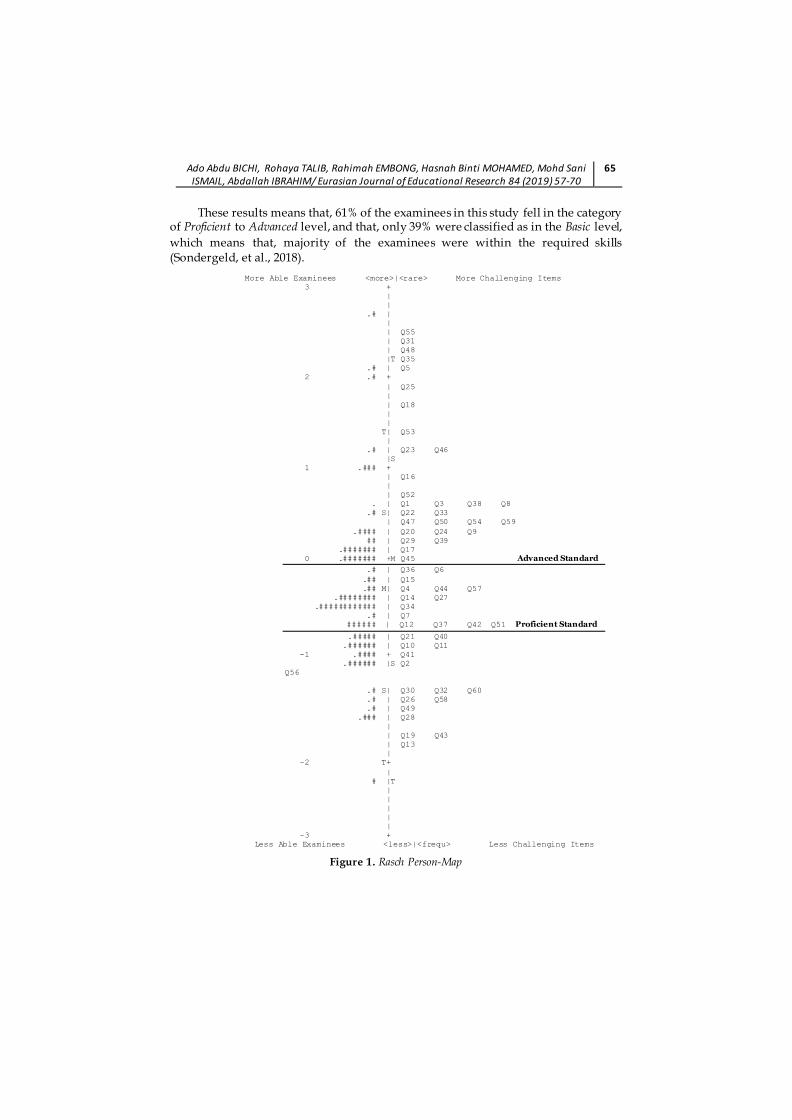
Ado Abdu BICHI, Rohaya TALIB, Rahimah EMBONG, Hasnah Binti MOHAMED, Mohd Sani ISMAIL, Abdallah IBRAHIM/ Eurasian Journal of Educational Research 84 (2019) 57-70
65
These results means that, 61% of the examinees in this study fell in the category
of Proficient to Advanced level, and that, only 39% were classified as in the Basic level,
which means that, majority of the examinees were within the required skills (Sondergeld, et al., 2018).
More Able Examinees <more>|<rare> More Challenging Items
3 +
|
|
.# |
|
| Q55
| Q31
| Q48
|T Q35
.# | Q5
2 .# +
| Q25
|
| Q18
|
|
T| Q53
|
.# | Q23 Q46
|S
1 .### +
| Q16
|
| Q52
. | Q1 Q3 Q38 Q8
.# S| Q22 Q33
| Q47 Q50 Q54 Q59
.#### | Q20 Q24 Q9
## | Q29 Q39
.####### | Q17
0 .####### +M Q45 Advanced Standard
.# | Q36 Q6
.## | Q15
.## M| Q4 Q44 Q57
.######## | Q14 Q27
.############ | Q34
.# | Q7
###### | Q12 Q37 Q42 Q51 Proficient Standard
.##### | Q21 Q40
.###### | Q10 Q11
-1 .#### + Q41
.###### |S Q2
Q56
.# S| Q30 Q32 Q60
.# | Q26 Q58
.# | Q49
.### | Q28
|
| Q19 Q43
| Q13
|
-2 T+
|
# |T
|
|
|
|
|
-3 +
Less Able Examinees <less>|<frequ> Less Challenging Items
Figure 1. Rasch Person-Map
66 Ado Abdu BICHI, Rohaya TALIB, Rahimah EMBONG, Hasnah Binti MOHAMED, Mohd Sani ISMAIL, Abdallah IBRAHIM/ Eurasian Journal of Educational Research 84 (2019) 57 -70
Discussions, Conclusion and Recommendation
This study was conducted to establish cut-scores using IRT-based (Objective Standard Setting) method in a university placement test by categorising examinees into
Basic, Proficient and Advanced performance levels.
Findings after the rounds of reviews, ratings and discussion regarding the nature of minimal competency revealed that, three standards Advanced, Proficient and Basic
were established by the panelists. The Advance standard (0.02 logits) was higher than the Proficient standard (-0.62 logits), thus any scores less than -0.62 logits became the Basic level or standards. The examinees were classified into corresponding performance levels of Basic (<-0.62 logits), Proficient (0.62 logits) and Advanced (0.02 logits). Based on the logits classifications 39% fell under Basic performance level, 32% fell under Proficient level and 29% of the examinees fell under Advanced performance
levels. This final cut scores (Criterion) means that, 61% of the examinees in this study fell in the category of Proficient to Advanced level, and that, only 39% were classified as in the Basic level, which means that, majority of the examinees were within the
required skills (Sondergeld, et al., 2018).
Based on the finding of this study, Majority of the test takers appeared to be within required levels, with moderately and higher-level ability. The examinee classification showed that, they were able to get the items with moderate and higher difficulty levels right. These findings are consistent with that of (Sondergeld, et al., 2018) while some examines fell within the basic levels, finally, there were test takers in the proficient and advanced levels (n=88.5%, 85%). The largest was the test takers in the advanced classification with n=75 (78.1%). Also, the finding of Khatimin, et. al., (2013) whose findings using OSS revealed that over sixty percent (64%) of the examinees were at the mastery level of the linear algebra and recommended that, academic institutions can decide to adjust the scores to accommodate more students by applying the standard errors (SE).
Similarly, in line with the findings of Stone, Koskey and Sondergeld (2011) whose study included five-year successive investigation by using examination data, examinees were at good performance with a favourable standing, where students who participated in the exercises fell within advanced and proficient standing. In contrary to the finding of this study, Khatimin, Zaharim and Aziz (2014) however, found that, after identifying the mastery levels of -0.08 logits, 74% of the examinees were categorized into performance levels below basic and that, only 26% of the students attained the acceptable mastery levels. This means that, the students in their study did not reach the mastery levels to answer the questions correctly.
Considering the place of standard setting as an important validity principle and more important in high-stakes testing environments, the result of this OSS provided performance level with a clear content related description to informed decisions on students’ mastery of the content in a placement test, hence demonstrated effectiveness in designing construct relevant standard and its superiority on establishing standard setting. In a university placement test, reporting students’ performance is an important concern because a pass-fail decision is taken on students before finally placed in particular programmes. The cut score proposed in this study can be used in ranking

Ado Abdu BICHI, Rohaya TALIB, Rahimah EMBONG, Hasnah Binti MOHAMED, Mohd Sani ISMAIL, Abdallah IBRAHIM/ Eurasian Journal of Educational Research 84 (2019) 57-70
67
and selecting the qualified candidates objectively. Therefore, by practitioners utilizing the proposed cut off score in this study, the subjectivity in the selection and placement of prospective undergraduates in Nigerian universities may be reduced or completely eliminated to make the placement of students a transparent process using standardized procedure. It is therefore recommended that to establish more meaningful criterion-referenced standards across the curriculum content being measured, further studies should consider involving or employing more panelists in order to provide more evidence of rating consistency among the panelists. Similarly, result from the Rasch-based Objective Standard Setting (OSS) procedure need to be compared with other existing IRT-based methods in order to ascertain its external validity.
References
Akanwa, U. N. & Nkwocha, P. C. (2015). Prediction of South Eastern Nigerian students under graduate scores with their UME and Post-UME Scores. IOSR Journal of Research & Method in Education, 5(5), PP 36-39
Angoff, W. (1971). Scales, norms and equivalent scores. In R. L. Thorndike (Ed.), Educational measurement (pp 506-600). Washington, DC: American Council on Education.
Atkinson, R. C., & Geiser, S. (2009). Reflections on a century of college admissions tests. Educational Researcher, 38(9), 665-676.
Barlow, P. B. (2014). Development of the Biostatistics and clinical epidemiology skills assessment for medical residents. Doctoral thesis, University of Tennessee
Bejar, I. I. (2008). Standard setting: What is it? Why is it important. R& D Connections, 7,1-6.
Bichi, A. A. (2015). Analysis of UTME and Post-UTME scores of education students at Northwest University Kano-Nigeria. In 1st International Conference on Education. Held on 9th-10th April 2015 at Novotel Beijing Xinqiao, Beijing
China
Bichi, A. A., Talib, R., Atan, N. A., Ibrahim, H. & Yusof, S. M. (2019). Validation of a developed university placement test using classical test theory and Rasch measurement approach. International Journal of Advanced and Applied Sciences,
Volume-6, Issue-6, Pp: 22-29
Bichi, A. A., Talib, R., Mohamed, H., Ahamad, J. & Khairuddin, N. (2019). Exploratory sequential design to develop and validate Economics placement test for Nigerian universities. International Journal of Recent Technology and Engineering (IJRTE), Volume-7, Issue-6S5, Pp: 769-772
Carey, K., & Manwaring, R. (2011). Growth Models and Accountability: A recipe for remaking ESEA. Education Sector Reports. Education Sector.
Cizek, G. J., & Bunch, M. B. (2007). Standard setting: A guide to establishing and evaluating performance standards on tests. SAGE Publications Ltd.
68 Ado Abdu BICHI, Rohaya TALIB, Rahimah EMBONG, Hasnah Binti MOHAMED, Mohd Sani ISMAIL, Abdallah IBRAHIM/ Eurasian Journal of Educational Research 84 (2019) 57 -70
Ebel, R. L. (1979). Essentials of educational measurement, Prentice-Hall. Englewood
Cliffs, NJ.
Ikoghode, A. (2015). Post-UTME screening in Nigerian universities: How relevant today?. International Journal of Education and Research, 3(8), 101-116.
Karasar, N. (2016). Scientific research method. Ankara: Nobel Akademik Yayincilik
Khatimin, N., Aziz, A. A., Zaharim, A., & Yasin, S. H. M. (2013). Development of objective standard setting using Rasch measurement model in Malaysian institution of higher learning. International Education Studies, 6(6), 151-160.
Khatimin, N., Zaharim, A., & Aziz, A. A. (2014, December). Standard setting in students’ assessment of higher education institution in Malaysia. In 2014 IEEE International Conference on Teaching, Assessment and Learning for Engineering (TALE) (pp. 499-504). IEEE.
Lewis, D. M. (1996). Standard setting: A bookmark approach. In IRT-based standard setting procedures utilizing behavioural anchoring, DR Green (Chair), Symposium conducted at the Council of Chief State School Officers National Conference on Large-Scale Assessment, Phoenix, AZ, 1996.
Linacre, J. M. (2019). A User’s Guide to WINSTEPS MINISTEP: Rasch-Model Computer Programme. Online http://www.winsteps.com/winsteps.htm
MacDougall, M., & Stone, G. E. (2015). Fortune-tellers or content specialists: Challenging the standard setting paradigm in medical education programmes. J Contemp Med Edu, 3(3), 135.
Nedelsky, L. (1954). Absolute grading standards for objective tests. Educational and Psychological Measurement, 14(1), 3-19.
Sanz, I & Fernández, M. (2005). The university entrance exam in Spain: Present situation and possible solutions. Presented as a poster in the 2005 EALTA Conference
Silber, K. H., & Foshay, W. R. (Eds.). (2010). Handbook of improving performance in the workplace (I). San Francisco, CA: Pfeiffer.
Sondergeld, T. A., Stone, G. E., & Kruse, L. M. (2018). Objective standard setting in educational assessment and decision making. Educational Policy,
0895904818802115.
Stone, G. E. (1996). The construction of meaning: Replicating objectively derived criterion-referenced standards. In annual meeting of the American Educational Research Association. New York, NY.
Stone, G. E. (2001). Objective standard setting (or truth in advertising). Journal of applied measurement, 2(2), 187-201.
Stone, G. E., Koskey, K. L., & Sondergeld, T. A. (2011). Comparing construct definition in the Angoff and Objective Standard Setting models: Playing in a house of cards without a full deck. Educational and psychological measurement, 71(6), 942-
962.

Ado Abdu BICHI, Rohaya TALIB, Rahimah EMBONG, Hasnah Binti MOHAMED, Mohd Sani ISMAIL, Abdallah IBRAHIM/ Eurasian Journal of Educational Research 84 (2019) 57-70
69
Tas, H., & Minaz, M. B. (2019). An investigation into examination-type preferences of
primary school students in relation to various variables. Eurasian Journal of Educational Research (EJER), (81).
Uhunmwuangho, S. O., & Ogunbadeniyi, O. (2014). The university matriculation examination as a predictor of performance in post university matriculation examination: A model for educational development in the 21st century. African Research Review, 8(1), 99-111.

Euras ian Journal of Educational Research 84 (2019) 71-92 Eurasian Journal of Educational Research
www.ejer.com.tr
Foundation University Students’ Consumer Orientation and Learner Identity Levels and Their Correlations with Academic Performance* Betul ISCAN1 , Aydin BALYER2
A R T I C L E I N F O A B S T R A C T
Article History: Purpose: The purpose of this research was to
determine the level of foundation university students’ consumer orientation and learner identity; and their correlations with students’ academic performance. Research Methods: The study was conducted with a
correlational survey model. The sample was 376 students from two foundation universities in Istanbul in 2017-2018 academic year. In order to collect the data, “The Extent of Students’ Consumer Orientation
and Learner Identity Scale” was used. The data were analyzed with SPSS 21 packet program. Findings: Results showed that the level of consumer
orientation was at 'Disagree' level, and the learner
identity was at “Agree” level. A negative correlation was found between academic performance and students’ consumer orientation levels. There was also a low and positive correlation between academic
performance and the level of learner identity.
Received: 30 June 2018
Received in revised form: 14 Nov. 2018
Accepted: 22 Sep. 2019 DOI: 10.14689/ejer.2019.84.4
Keywords
Academic performance, consumer identity, foundation university,
learner identity, neoliberalism
Implications for Research and Practice: It might be said that decision-makers in higher
education field should take measures to maintain and increase quality towards changing social demands, behaviors and opinions of students in marketising and marketised universities.
© 2019 Ani Publishing Ltd. All rights reserved
*This study was presented at the 5 th International Eurasian Educational Research Congress in Antalya, 02
May – 05 May, 2018 1 Yildiz Technical University, TURKEY ORCID: https://orcid.org/0000-0002-8844-5906 2 Yildiz Technical University, TURKEY, ORCID: https://orcid.org/0000-0003-1784-2522

72 Betul ISCAN – Aydin BALYER Eurasian Journal of Educational Research 84 (2019) 71-92
Introduction
Nowadays, as a result of neo-liberal movements, there is a tendency to marketize
higher education field all over the world as well as in Turkey. In this regard, students are considered as consumers of marketised universities, which is considered
to cause consumer orientation in students (Naidoo & Jamieson, 2005; Nixon, Scullion
& Hearn, 2016; Tomlinson, 2016). Consumer-oriented students see higher education as a process to acquire vocational qualification (Wellen, 2005). Thus, students aim to
gain only required knowledge and skills which are demanded by the business sector
(Molesworth, Nixon & Scullion, 2009; Nordensvärd, 2010; Williams, 2010). In this direction, for students the target is not being a real learner, but getting only diploma
(Brown, 2011; Brown & Carasso, 2013; Molesworth et al., 2009; Nixon et al, 2016;
Nordensvärd, 2010; Pathan, Mahesar & Shah, 2017; Saunders, 2015; Tomlinson, 2014; 2016).
Playing active role in learning and intellectual development contradicts with
consumer-oriented learners’ tendency for passive learning (Nixon et al, 2016; Tomlinson, 2016). Consumer-oriented learners aim to have well-paid jobs and
increase employability, which reveals beneficiary perspectives towards higher
education (Bunce, Baird & Jones, 2017; Nixon et al, 2016; Saunders, 2015; Tomlinson, 2014; 2016; Williams, 2013). Namely, these kinds of students are career focused
students (Pathan et al., 2017). They even separate courses as necessary or
unnecessary for their future career. In this context, they do not want to take unnecessary courses, and they enjoy doing practical work (Haywood, Jenkins &
Molesworth, 2011; Nixon et al., 2016). Also, they tend to decrease theoretical parts of
lessons to the lowest level (Nixon et al., 2016; Nixon, Scullion & Molesworth, 2010).
These consumer-oriented students consider learning as process of getting brief,
pre-packaged knowledge, which impairs acquisition of upper-level skills and
development of autonomous and lifelong learning habits (Naidoo et al., 2005; Naidoo, Shankar & Veer, 2011). In addition, the higher the tuition fee is, the higher
the level of consumer orientation increases (Tomlinson, 2016; Wellen, 2005; Williams,
2013). With increasing importance of employment, students consider higher education as an investment for their future career (Williams, 2013). Research reveal
that at market-driven universities students consider learning as commercial process
and they consider themselves as passive learners (Naidoo et al., 2011).
Learner identity is also of great importance. Students with high level of learner
identity identify themselves as learners first, while those with low ones identify
themselves with different roles (Lawson,2014). It means that a student with high learner identity participates in lectures regularly, reads about the field, strives for
learning, defines themselves as learner, enjoys learning, and minds university process (Bunce et al., 2017; Lawson, 2014).
The other element is students’ academic performance. Academic performance is
regarded as the most important factor presenting quality of education (Johansen, 2014). It is used to evaluate achievement and generally evaluated by grade point
average (GPA) (Strenze, 2007). In addition, while it is thought that consumer
Betul ISCAN – Aydin BALYER Eurasian Journal of Educational Research 84 (2019) 71-92
73
orientation negatively affects academic achievement, there are not few studies
conducted on it (Mark, 2013). Therefore, it is important to understand the correlation between academic performance and the level of consumer orientation and learner
identity.
The number of foundation universities has increased in Turkey recently. It is claimed that they are sometimes established without having enough academic and
physical infrastructure, and the student acceptance scores are believed to be below
average. Therefore, it is a question of matter whether these universities function well or not. To this end, the results of this research may help understand the situation
better. Thus, this study aimed to determine whether there was a correlation between
the level of consumer orientation and learner identity behaviors of students with their academic performance. For this general aim, the answers of the following
questions were researched:
1. What is the level of consumer orientation and learner identity behaviors of foundation university students?
2. Is there a significant difference in the level of consumer orientation and learner
identity behaviors of foundation university students regarding the participants’ age, gender, grade level, scholarship ratio, department and goal GPA for graduation?
3. Is there a significant correlation between the level of foundation university
students’ consumer orientation and academic performance?
4. Is there a significant correlation between the level of foundation university
students’ learner identity and academic performance?
Method
Research Design
The study was conducted with a correlational survey model which searched
correlation between two or more different variables (Creswell, 2014). The variables
were the levels of consumer orientation and learner identity behaviors of foundation university students and their academic performance.
Research Sample
The population comprised of 376 students in two foundation universities in Istanbul in 2017-2018 academic year. These two universities were chosen as
population, because they were rich in departmental diversity. There are 35 bachelor’s
degree and 27 associate degree programs in Fatih Sultan Mehmet Foundation University. There are 111 bachelor’s degree and 188 associate degree programs in
Istanbul Medipol University. The sample size required for the population was 24.670
(Higher Education Council (YOK), 2018) at 95% confidence level was calculated as 376 (Cochran, 1962. as cited in Balci, 2015). The students were selected with random
sampling method (Buyukozturk, Kilic Cakmak, Akgun, Karadeniz & Demirel, 2012).
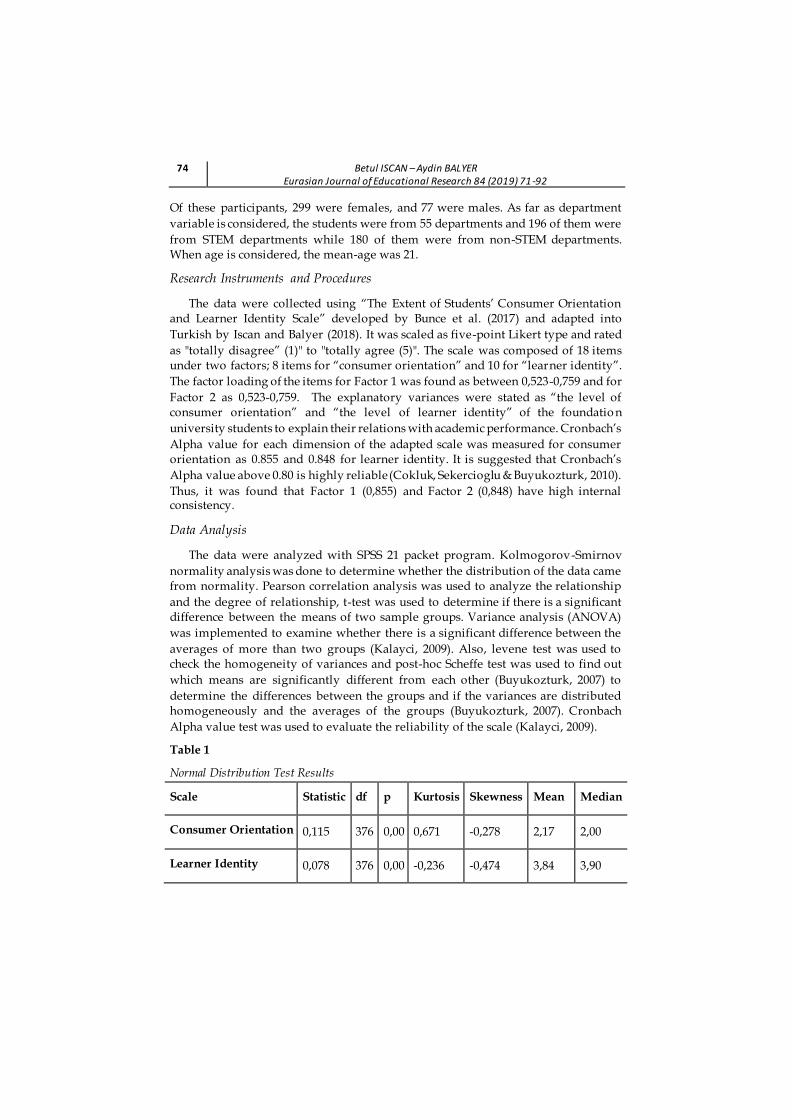
74 Betul ISCAN – Aydin BALYER Eurasian Journal of Educational Research 84 (2019) 71-92
Of these participants, 299 were females, and 77 were males. As far as department
variable is considered, the students were from 55 departments and 196 of them were
from STEM departments while 180 of them were from non-STEM departments. When age is considered, the mean-age was 21.
Research Instruments and Procedures
The data were collected using “The Extent of Students’ Consumer Orientation and Learner Identity Scale” developed by Bunce et al. (2017) and adapted into
Turkish by Iscan and Balyer (2018). It was scaled as five-point Likert type and rated
as "totally disagree” (1)" to "totally agree (5)". The scale was composed of 18 items under two factors; 8 items for “consumer orientation” and 10 for “learner identity”.
The factor loading of the items for Factor 1 was found as between 0,523-0,759 and for
Factor 2 as 0,523-0,759. The explanatory variances were stated as “the level of consumer orientation” and “the level of learner identity” of the foundatio n
university students to explain their relations with academic performance. Cronbach’s
Alpha value for each dimension of the adapted scale was measured for consumer orientation as 0.855 and 0.848 for learner identity. It is suggested that Cronbach’s
Alpha value above 0.80 is highly reliable (Cokluk, Sekercioglu & Buyukozturk, 2010).
Thus, it was found that Factor 1 (0,855) and Factor 2 (0,848) have high internal consistency.
Data Analysis
The data were analyzed with SPSS 21 packet program. Kolmogorov-Smirnov
normality analysis was done to determine whether the distribution of the data came from normality. Pearson correlation analysis was used to analyze the relationship
and the degree of relationship, t-test was used to determine if there is a significant difference between the means of two sample groups. Variance analysis (ANOVA)
was implemented to examine whether there is a significant difference between the
averages of more than two groups (Kalayci, 2009). Also, levene test was used to check the homogeneity of variances and post-hoc Scheffe test was used to find out
which means are significantly different from each other (Buyukozturk, 2007) to
determine the differences between the groups and if the variances are distributed homogeneously and the averages of the groups (Buyukozturk, 2007). Cronbach
Alpha value test was used to evaluate the reliability of the scale (Kalayci, 2009).
Table 1
Normal Distribution Test Results
Scale Statistic df p Kurtosis Skewness Mean Median
Consumer Orientation 0,115 376 0,00 0,671 -0,278 2,17 2,00
Learner Identity 0,078 376 0,00 -0,236 -0,474 3,84 3,90
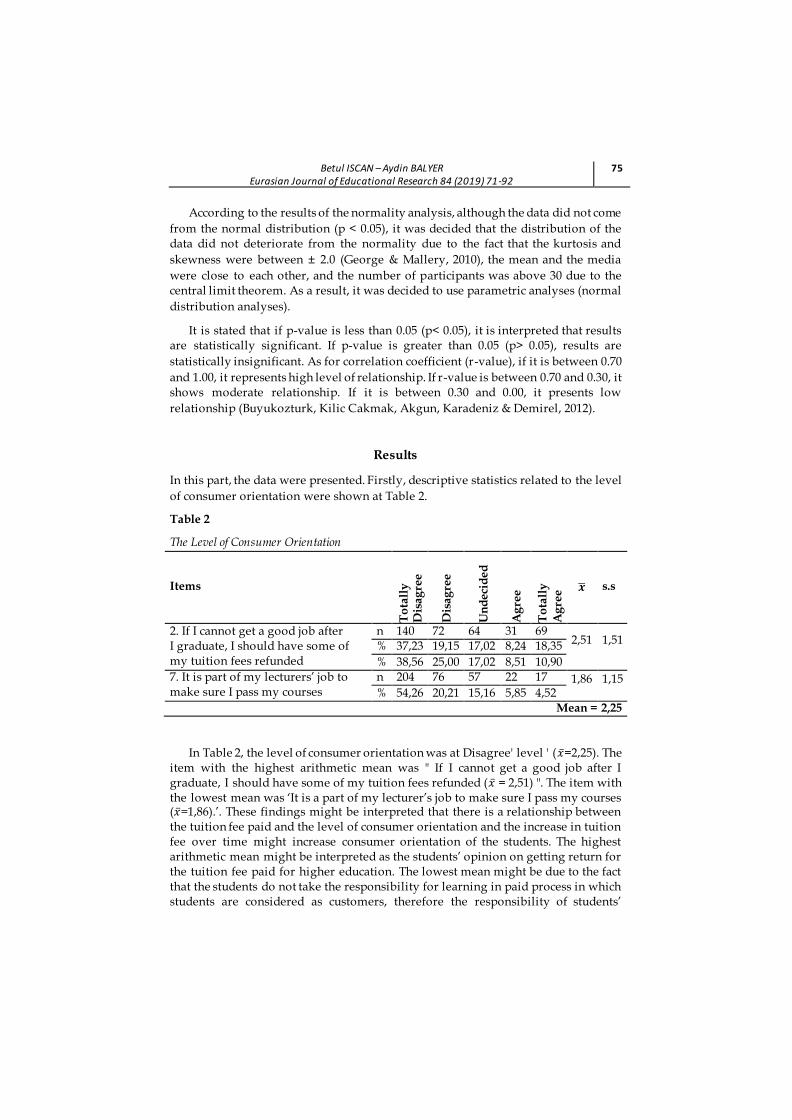
Betul ISCAN – Aydin BALYER Eurasian Journal of Educational Research 84 (2019) 71-92
75
According to the results of the normality analysis, although the data did not come
from the normal distribution (p < 0.05), it was decided that the distribution of the data did not deteriorate from the normality due to the fact that the kurtosis and
skewness were between ± 2.0 (George & Mallery, 2010), the mean and the media
were close to each other, and the number of participants was above 30 due to the central limit theorem. As a result, it was decided to use parametric analyses (normal
distribution analyses).
It is stated that if p-value is less than 0.05 (p< 0.05), it is interpreted that results are statistically significant. If p-value is greater than 0.05 (p> 0.05), results are
statistically insignificant. As for correlation coefficient (r-value), if it is between 0.70
and 1.00, it represents high level of relationship. If r-value is between 0.70 and 0.30, it shows moderate relationship. If it is between 0.30 and 0.00, it presents low
relationship (Buyukozturk, Kilic Cakmak, Akgun, Karadeniz & Demirel, 2012).
Results
In this part, the data were presented. Firstly, descriptive statistics related to the level
of consumer orientation were shown at Table 2.
Table 2
The Level of Consumer Orientation
Items
To
tall
y
Dis
ag
ree
Dis
ag
ree
Un
deci
ded
Ag
ree
To
tall
y
Ag
ree
�� s.s
2. If I cannot get a good job after I graduate, I should have some of my tuition fees refunded
n 140 72 64 31 69 2,51 1,51 % 37,23 19,15 17,02 8,24 18,35
% 38,56 25,00 17,02 8,51 10,90 7. It is part of my lecturers’ job to make sure I pass my courses
n 204 76 57 22 17 1,86 1,15 % 54,26 20,21 15,16 5,85 4,52
Mean = 2,25
In Table 2, the level of consumer orientation was at Disagree' level ' (��=2,25). The item with the highest arithmetic mean was " If I cannot get a good job after I graduate, I should have some of my tuition fees refunded (�� = 2,51) ". The item with the lowest mean was ‘It is a part of my lecturer’s job to make sure I pass my courses (��=1,86).’. These findings might be interpreted that there is a relationship between the tuition fee paid and the level of consumer orientation and the increase in tuition fee over time might increase consumer orientation of the students. The highest arithmetic mean might be interpreted as the students’ opinion on getting return for the tuition fee paid for higher education. The lowest mean might be due to the fact that the students do not take the responsibility for learning in paid process in which students are considered as customers, therefore the responsibility of students’
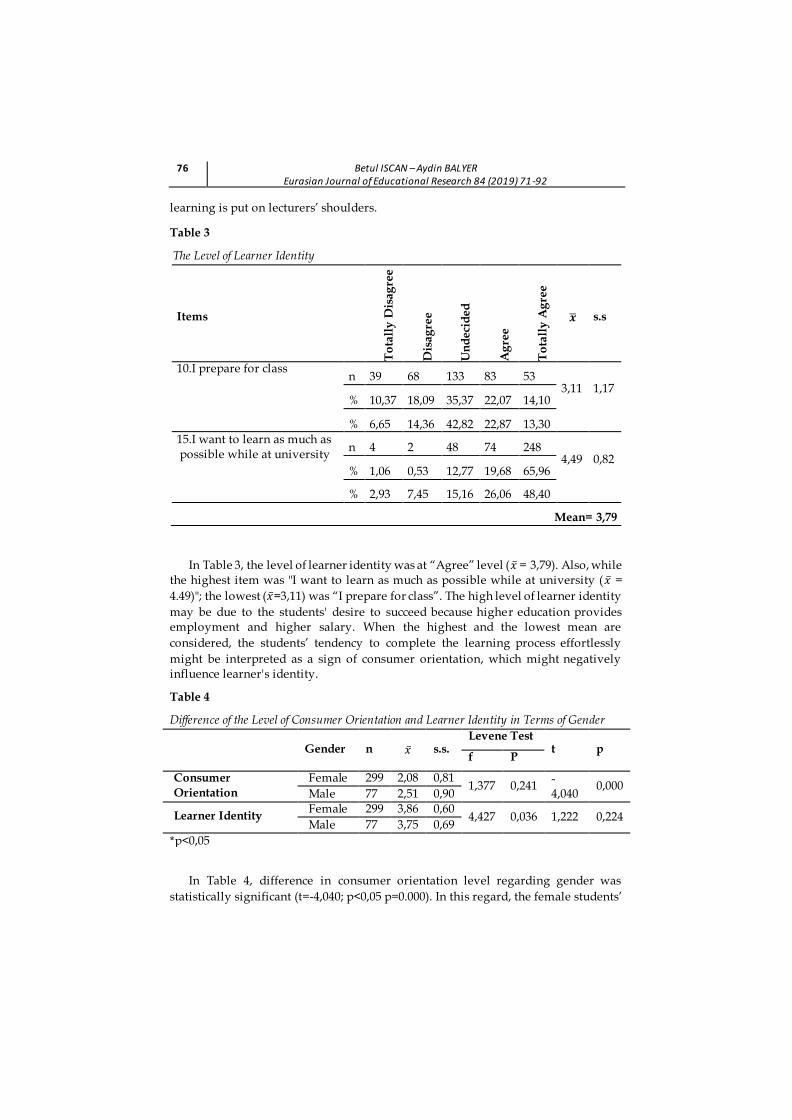
76 Betul ISCAN – Aydin BALYER Eurasian Journal of Educational Research 84 (2019) 71-92
learning is put on lecturers’ shoulders.
Table 3
The Level of Learner Identity
Items
To
tall
y D
isag
ree
Dis
ag
ree
Un
deci
ded
Ag
ree
To
tall
y A
gre
e
�� s.s
10.I prepare for class n 39 68 133 83 53
3,11 1,17 % 10,37 18,09 35,37 22,07 14,10
% 6,65 14,36 42,82 22,87 13,30 15.I want to learn as much as possible while at university
n 4 2 48 74 248 4,49 0,82
% 1,06 0,53 12,77 19,68 65,96
% 2,93 7,45 15,16 26,06 48,40
Mean= 3,79
In Table 3, the level of learner identity was at “Agree” level (�� = 3,79). Also, while the highest item was "I want to learn as much as possible while at university ( �� =
4.49)"; the lowest (��=3,11) was “I prepare for class”. The high level of learner identity
may be due to the students' desire to succeed because higher education provides employment and higher salary. When the highest and the lowest mean are
considered, the students’ tendency to complete the learning process effortlessly
might be interpreted as a sign of consumer orientation, which might negatively influence learner's identity.
Table 4
Difference of the Level of Consumer Orientation and Learner Identity in Terms of Gender
Gender n �� s.s. Levene Test
t p f P
Consumer
Orientation
Female 299 2,08 0,81 1,377 0,241
-4,040
0,000 Male 77 2,51 0,90
Learner Identity Female 299 3,86 0,60
4,427 0,036 1,222 0,224 Male 77 3,75 0,69
*p<0,05
In Table 4, difference in consumer orientation level regarding gender was
statistically significant (t=-4,040; p<0,05 p=0.000). In this regard, the female students’
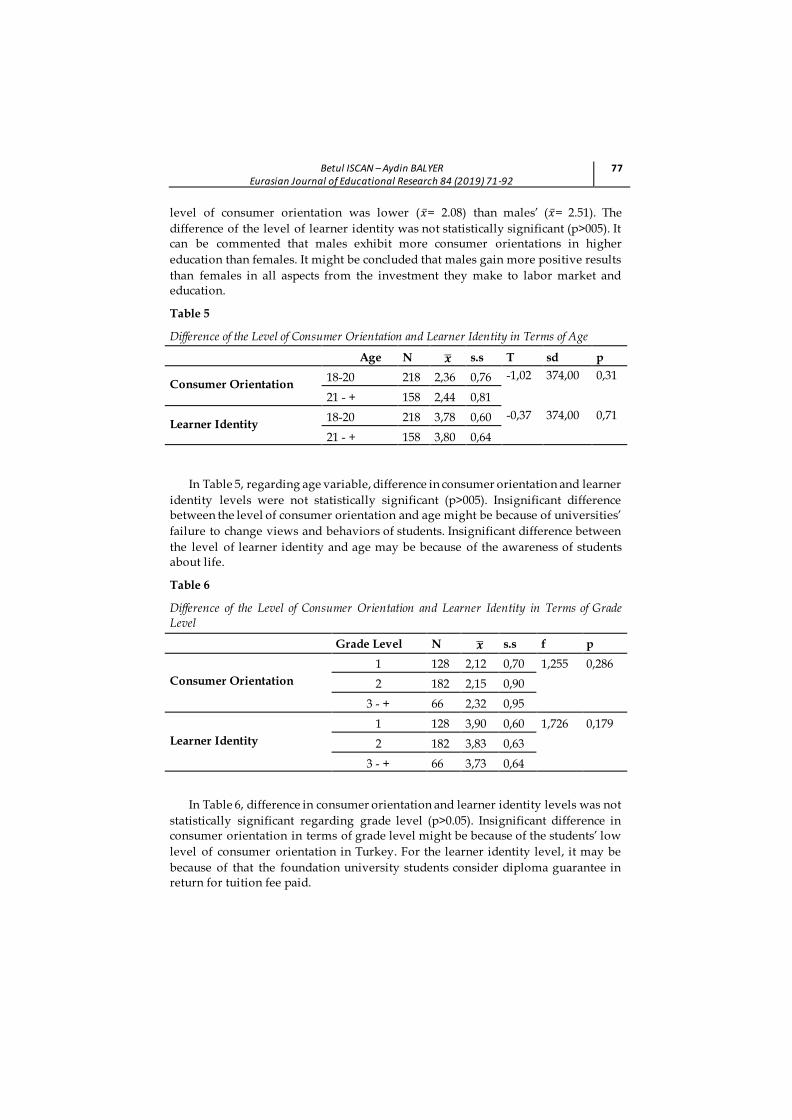
Betul ISCAN – Aydin BALYER Eurasian Journal of Educational Research 84 (2019) 71-92
77
level of consumer orientation was lower (��= 2.08) than males’ (��= 2.51). The
difference of the level of learner identity was not statistically significant (p>005). It can be commented that males exhibit more consumer orientations in higher
education than females. It might be concluded that males gain more positive results
than females in all aspects from the investment they make to labor market and education.
Table 5
Difference of the Level of Consumer Orientation and Learner Identity in Terms of Age
Age N �� s.s T sd p
Consumer Orientation 18-20 218 2,36 0,76 -1,02 374,00 0,31
21 - + 158 2,44 0,81
Learner Identity 18-20 218 3,78 0,60 -0,37 374,00 0,71
21 - + 158 3,80 0,64
In Table 5, regarding age variable, difference in consumer orientation and learner
identity levels were not statistically significant (p>005). Insignificant difference between the level of consumer orientation and age might be because of universities’
failure to change views and behaviors of students. Insignificant difference between
the level of learner identity and age may be because of the awareness of students about life.
Table 6
Difference of the Level of Consumer Orientation and Learner Identity in Terms of Grade Level
Grade Level N �� s.s f p
Consumer Orientation
1 128 2,12 0,70 1,255 0,286
2 182 2,15 0,90
3 - + 66 2,32 0,95
Learner Identity
1 128 3,90 0,60 1,726 0,179
2 182 3,83 0,63
3 - + 66 3,73 0,64
In Table 6, difference in consumer orientation and learner identity levels was not
statistically significant regarding grade level (p>0.05). Insignificant difference in consumer orientation in terms of grade level might be because of the students’ low
level of consumer orientation in Turkey. For the learner identity level, it may be
because of that the foundation university students consider diploma guarantee in return for tuition fee paid.
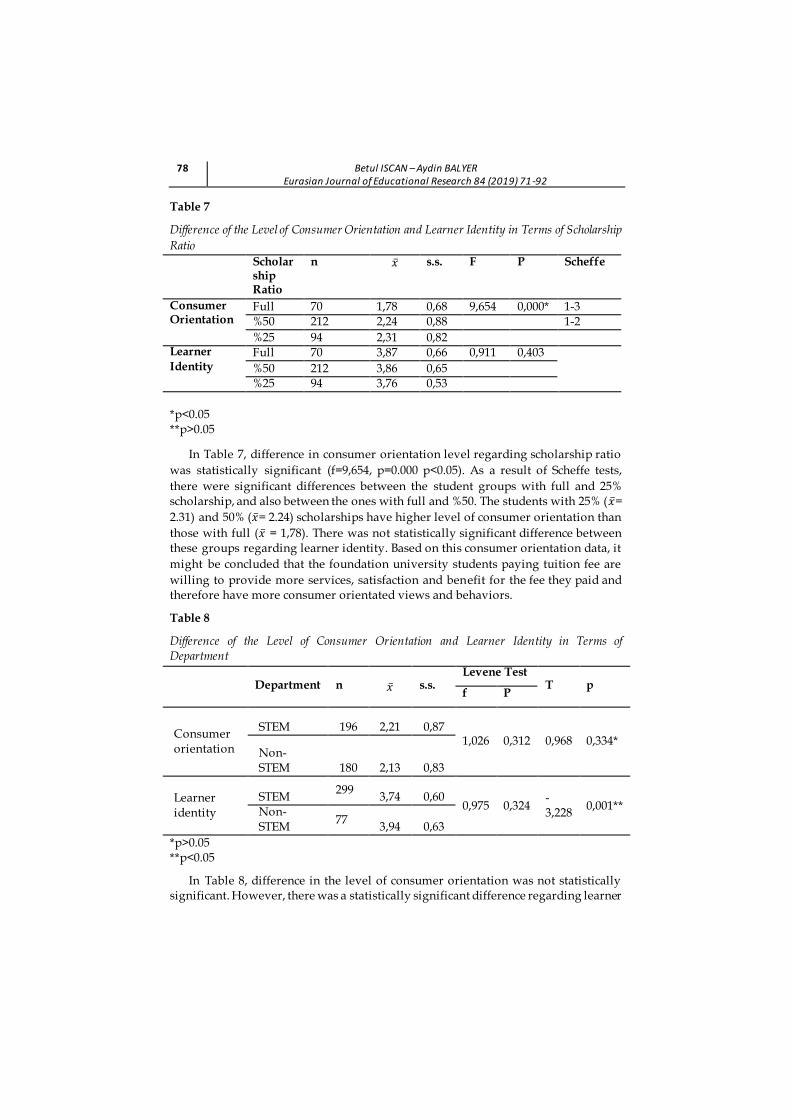
78 Betul ISCAN – Aydin BALYER Eurasian Journal of Educational Research 84 (2019) 71-92
Table 7
Difference of the Level of Consumer Orientation and Learner Identity in Terms of Scholarship
Ratio
*p<0.05 **p>0.05
In Table 7, difference in consumer orientation level regarding scholarship ratio
was statistically significant (f=9,654, p=0.000 p<0.05). As a result of Scheffe tests,
there were significant differences between the student groups with full and 25% scholarship, and also between the ones with full and %50. The students with 25% (��=
2.31) and 50% (��= 2.24) scholarships have higher level of consumer orientation than
those with full (�� = 1,78). There was not statistically significant difference between these groups regarding learner identity. Based on this consumer orientation data, it
might be concluded that the foundation university students paying tuition fee are
willing to provide more services, satisfaction and benefit for the fee they paid and therefore have more consumer orientated views and behaviors.
Table 8
Difference of the Level of Consumer Orientation and Learner Identity in Terms of Department
Department n �� s.s. Levene Test
T p f P
Consumer orientation
STEM 196 2,21 0,87 1,026 0,312 0,968 0,334*
Non-STEM 180 2,13 0,83
Learner identity
STEM 299
3,74 0,60 0,975 0,324
-3,228
0,001** Non-STEM
77 3,94 0,63
*p>0.05 **p<0.05
In Table 8, difference in the level of consumer orientation was not statistically significant. However, there was a statistically significant difference regarding learner
Scholarship Ratio
n �� s.s. F P Scheffe
Consumer Orientation
Full 70 1,78 0,68 9,654 0,000* 1-3 %50 212 2,24 0,88 1-2
%25 94 2,31 0,82 Learner
Identity Full 70 3,87 0,66 0,911 0,403
%50 212 3,86 0,65 %25 94 3,76 0,53

Betul ISCAN – Aydin BALYER Eurasian Journal of Educational Research 84 (2019) 71-92
79
identity (t=-3,228; p<0,05 p=0.000). The level of learner identity was lower for those
studying at STEM departments (��=3,74) than those at non-STEM departments (��=3,94). This may be because that foundation university students choose one of the
STEM departments to get a job with higher salary instead of the departments they
are interested in. Furthermore, the student, seeing diploma as a right in return for tuition fee, might only aim to pass courses with minimum effort.
Table 9
Difference of the Level of Consumer Orientation and Learner Identity in terms of Goal GPA for Graduation
Goal GPA
for graduation
N �� s.s. F P Schef
fe
Consumer Orientation
(-) – 3.00 102 2,60 0,96
21,654 0,000*
1-3 3.00 – 3.50 165 2,07 0,76
3.50 – 4.00 109 1,91 0,70 Learner Identity
(-) – 3.00 102 3,55 0,65 32,084
0,000*
1-2 1-3 3.00 – 3.50 165 3,78 0,57
3.50 –4.00 109 4,18 0,51
*p<0.05
In Table 9, difference of consumer orientation level regarding goal GPA for
graduation was statistically significant (f =21,654, p = 0.000, p <0.05). According to
Scheffe test results, there was a significant difference between students with (-)-3,00 and 3,50-4,00 goal GPA. The level of consumer orientation was higher for those with
(-)-3.00 goal GPA (��= 2,60) than those with 3,50-4,00 (��= 1,91). The low level of goal
GPA for graduation of the students with high level of consumer orientation might be due to the tendency of students to focus on diploma as their right and thus to
complete the higher education process with minimum effort.
Difference of the level of learner identity was statistically significant (f=32,084, p=0.000 p<0.05). According to Scheffe test result, the significant differences were
between the students with (-)-3.00 goal GPA and those with 3,00-3,50 goal GPA, and
between the ones with (-)-3,00 and 3,50-4,00. The level of learner identity for those with (-)-3,00 GPA goal (��=3,55) was lower than those with 3,00-3,50 goal GPA
(��=3,78), and than those with 3,50-4,00 goal GPA (��=4,18). The low level of learner
identity of the students with low goal GPA might be due to their low motivation towards higher education and therefore their adoption of superficial learning
approach.
80 Betul ISCAN – Aydin BALYER Eurasian Journal of Educational Research 84 (2019) 71-92
Table 10
Correlation Between Academic Performance (GPA) and the Level of Consumer Orientation
Consumer Orientation GPA
Consumer Orientation r 1 -0,284
p 0,000*
GPA r
1
p *p<0.05
In Table 10, there was a low and negative correlation between academic
performance and the level of consumer orientation (r = -0,284 p = 0.001, p = 0, 000).
This may be due to the fact that university students with consumer-oriented views and behaviors want to complete higher education process with minimum effort by
regarding diploma as guarantee. Thus, the tendency to ignore the responsibilities
required by higher education might be interpreted as the reason of low AGNO, which is the indicator of the academic performance of the students.
Table 11
Correlation between Academic Performance (GPA) and the Level of Learner Identity
Learner Identity GPA
Learner Identity r 1 0,322
p 0,000*
GPA r
1
p *p<0.05
In Table 11, there was a low and positive correlation between academic
performance and the level of learner identity (r = 0.322 p = 0.000, p = 0.000). Intellectual engagement, deep learning approach, students’ introducing themselves
as learners, regular attendance to lessons increase both academic performance and
the level of learner identity so they might be interpreted as the causes of this positive correlation.
Discussion, Conclusion and Recommendations
In this study, the students’ consumer orientation level was found at ‘Disagree'
level. In this regard, while Bunce et al. (2017) found similar results; Delucchi and Korgen (2002), Nixon, Scullion and Hearn (2016), Obermiller, Fleenor and Raven
(2005), Universities UK (2017), and Ikeda, Campomar and Veludo-de-Oliveira (2009)
Betul ISCAN – Aydin BALYER Eurasian Journal of Educational Research 84 (2019) 71-92
81
observed contrasting findings. They found that students consider themselves as
consumers in higher education. The consumer orientation level of students in Turkey is close to Bunce et al.’s result (2017). Financial support of higher education in the UK
is almost totally students’ responsibility (Geven, 2015) as in Turkey where 90% of
tuition fee is provided by students (Buyukuslu, 2010) Thus, in these two countries, similar ratio of tuition fee and proximity of students' consumer orientation might
indicate that there may be positive relationship between ratio of tuition fee and
students’ consumer orientation level.
In this research, the item with the highest mean was "If I cannot get a good job
after I graduate, I should have some of my tuition fees refunded." which might mean
that students want to get their tuition fee’s worth. This result was supported by Barnett (2011), Brown (2011), Clark (2009), Jones-Devitt and Smith (2007), Naidoo
and Williams (2015), Paricio (2017) and Tomlinson’ research results (2016). The item
with the lowest mean is that “It is part of my lecturers’ job to make sure I pass my courses.”; which contradicts with Koris and Nokelainen’s findings (2015) that
students in marketised universities think that learning, graduating and getting a
diploma are their responsibilities, rather than lecturers’ and universities’. Another result showed that the level of learner identity is at 'Agree' level; which might mean
that students want to be successful, because success provides employment and a
well-paid job, therefore; their learner identity level is high. Similar results were found out by Abouserie (1995) and Ekinci (2008).
It was also found that females’ consumer orientation level is lower than males’.
Increase in females’ education level is important for employment (Yildiz, 2013). Therefore, it is necessary for women to keep education level high and to improve at
the highest level (Mulligan & Rubinstein, 2008). Yildiz (2013) observed that there is
gender discrimination and low female employment in Turkey. Therefore, women have to be highly skilled; which might be reason for women’s low consumer
orientation. However, Bunce et al. (2017) found that consumer orientation does not
differ regarding gender; and Douglas, Douglas and Barnes (2006) discovered that both male and female students describe themselves as consumers.
Regarding age variable, there was no statistically significant difference. However,
Bunce et al. (2017) found that there is a negative relationship between age and consumer orientation level. This result is not consistent with study results of Douglas
et al. (2005) that students between 25-29 and 30-34 ages consider themselves more as
consumers than the other age groups. This may stem from conditions in Turkey. In Turkey, it is alleged that foundation universities do not provide necessary academic,
intellectual, personal and social development for students, which is similar with the results of Balaban and Cakmak’s (2016) study.
In this study, difference of the level of learner identity regarding age is not
statistically significant. However, lifelong learning skills (Adams, 2007; Koc, 2007) and factors determining the level of learner identity are similar. Yildiz (2014)
observed that participants' perception of lifelong learning increases as age increases,

82 Betul ISCAN – Aydin BALYER Eurasian Journal of Educational Research 84 (2019) 71-92
which might lead to an increase in learner identity. But the result of this study does
not support Yildiz’s (2014) findings.
The consumer orientation level differs concerning scholarship rates. Students with 25% and 50% scholarships have higher consumer orientation than those with
100% scholarship; which are similar with the results of Bunce et al. (2017), Koris et al.
(2015), Tomlinson (2016), Wellen (2005) and Williams (2013). They reveal that consumer orientation level increases as tuition fee increases. Kaynas (2012) states that
consumers choose products or services to get more benefits; which might be
interpreted that as students want to receive tuition fee back as high quality service, benefit and satisfaction so they show consumer orientation, which is similar with
Barnett’s (2011) and Jones-Devitt et al.’ results (2007).
Moreover, results of this research showed that the learner identity level was
found lower at STEM departments than those at non-STEM departments. Similarly,
Entwistle and Tait (1995) state that at STEM departments, students have more superficial learning approaches, because STEM departments lead learners to adopt
superficial learning approach, and superficial learning approach is related to low
level of learner identity (Platow, Mavor & Grace, 2013).
As for students’ goal GPA for graduation, there is a significant difference in
students’ consumer orientation level. In this context, as goal GPA decreases, the level
of consumer orientation increases; which might be because students see diploma as a right in return for tuition fee (Naidoo et al., 2005). Students may also have a tendency
to complete higher education with minimum effort (Brown, 2011; Calyson & Haley,
2005), to focus only on diploma rather than learning (Brown, 2011; Brown et al., 2013; Clark, 2009; Molesworth et al., 2009; Naidoo et al., 2005; Newson, 2004; Nixon et al.,
2016; Nordensvärd, 2010; Pathan et al., 2017; Saunders, 2015; Tomlinson, 2014; 2016;
Wellen, 2005; Williams, 2010). This finding is not consistent with the findings of Bunce et al. (2017), Tomlinson (2014) and Saunders (2015). It was seen in the study
that as goal GPA for graduation decreases, the level of learner identity decreases
which might be because of low motivation towards higher education and therefore; students have superficial learning approach. Gorard, Smith, May, Thomas, Adnett
and Slack (2006) support this finding.
The results also showed that there is a negative and weak correlation between academic performance (GPA) and the level of consumer orientation, which is similar
with the result of Bunce et al. (2017). In Alkis (2015) and O'Connor and Paunonen’s
(2007) studies; there is a positive correlation between students’ responsibility and success. Consumer-oriented students view higher education as service they get in
exchange of tuition fee so students tend to avoid responsibilities (Barnett, 2011;
Jones-Devitt et al., 2007; Naidoo et al., 2005; Naidoo et al., 2011; Nixon et al., 2016; Williams, 2010); which might cause decrease in academic performance. Alkis (2015)
observed that students are more interested in lectures which they consider
beneficiary. Brackney and Karabenick (1995) also state that there is positive correlation between students' exam grades and importance they give to lectures.
Thus, while it is expected that consumer oriented students give importance to
Betul ISCAN – Aydin BALYER Eurasian Journal of Educational Research 84 (2019) 71-92
83
lectures because of employment and high salary opportunity, it is found that there is
a negative correlation between the level of consumer orientation and academic performance. Therefore, the research result contradicts with the findings of Alkis
(2015) and Brackney et al. (1995).
There is also a positive and low correlation between academic performance (GPA) and the level of learner identity. Alkis (2015), Brewer and Burgess (2005),
Bunce et al. (2017) and Lawson (2014) assert that regular attendance to lectures
provides higher grades. Lawson (2014) also observes that students with high learner identity regularly participate in all lectures, seminars and presentations. Thus, the
fact that participation in lecture increases both the level of student's learner identity
and academic performance might be interpreted as the reason for positive correlation between the level of learner identity and academic performance. Krause (2005) and
Bunce et al. (2017) states that intellectual engagement is positively related to
academic performance so to the level of learner identity. Thus, intellectual engagement may be interpreted as the reason. Boyle, Duffy and Dunleavy (2003),
Chan (2003), Ramsden (2000) and Smyth, Mavor, Platow, Grace and Reynolds (2015)
found that students with deep learning approach have internal motivation to learn and to use learning strategies such as critical thinking and higher-level cognitive
activities. Chan (2003) also states that students with superficial learning approach do
not have motivation towards learning. Bunce et al. (2017) and Platow et al. (2013) state that people with higher learner identity show deep learning approach. Thus, it
is observed that having deep learning approach affects both the level of learner
identity and academic performance of the students positively. As result, this finding might be resulted from students’ deep learning approach.
A number of conclusions were drawn in this study. First, it was observed that the
level of students’ consumer orientation is at “Disagree” level, and the level of learner identity was at 'Agree' level. Another result showed that the females’ consumer
orientation level was lower than males’. As for variables, there was no significant
difference between age, and consumer orientation and learner identity levels. Students with 25% and 50% scholarships had higher level of consumer orientation
than those with 100%. While there was no significant difference in the level of
consumer orientation, the level of learner identity studying at STEM departments was lower than those studying at non-STEM departments. The level of consumer
orientation of students whose goal GPA for graduation was between (-) -3,00 was
higher than those between 3,50-4,00. The learner identity level of students whose goal GPA for graduation was between (-) -3,00 was lower than those between 3,00-
3,50, and than those between 3,50-4,00. Negative and low correlation was found between consumer orientation level and academic performance. A positive and low
correlation was found between learner identity level and academic performance.
Decision-makers for higher education might make arrangements to increase academic performance by considering the negative correlation between the level of
consumer orientation and academic performance, and positive correlation between
the level of learner identity and academic performance. The decrease in academic performance might be investigated. There found positive correlation between the
84 Betul ISCAN – Aydin BALYER Eurasian Journal of Educational Research 84 (2019) 71-92
learner identity level and academic performance. A research might be conducted to
determine ways to increase the learner identity level and to decrease consumer
orientation. A mixed study might be carried out to compare findings. A similar research can be conducted at public and foundation universities in different regions
and provinces, with graduate and post-graduate students with various samples. The
level of males’ consumer orientation was found to be higher than females’. The reasons behind it might be examined with another mixed research.
References
Abouserie, R. (1995). Self esteem and achievement motivation as determinants of students approaches to studying. Studies in Higher Education, 20(1), 19-27.
Adams, D. (2007). Lifelong learning skills and attributes: The perceptions of Australian secondary school teachers. Issues in Educational Research, 17(2), 149.
Alkis, N. (2015). The influence of personality traits, motivation and persuasion principles on
academic performance (master’s thesis). The Middle East Technical University,
Ankara,Turkey.
Balaban, O., & Cakmak, D. (2016). Examination of university students' perception of
personal development training. The Sakarya Journal of Economics, 5 (1), 1-17.
Balci, A. (2015). Research in social sciences (11st edition). Ankara: Pegem A Publication.
Barnett, R. (2011). The marketised university: Defending the indefensible. In M.
Molesworth, R. Scullion, & E. Nixon (Eds), The marketisation of higher
education and the student as consumer (pp. 39-51). London: Routledge.
Boyle, E. A., Duffy, T., & Dunleavy, K. (2003). Learning styles and academic outcome:
The validity and utility of Vermunt's inventory of learning styles in a British higher education setting. British Journal of Educational Psychology, 73, 267-290.
doi:10.1348/00070990360626976
Brackney, B. E., & Karabenick, S. A. (1995). Psychopathology and academic
performance: the role of motivation and learning strategies. Journal of
Counseling Psychology, 42(4), 456-465.
Brewer, E. W., & Burgess, D. N. (2005). Professor's role in motivating students to attend class. Journal of Industrial Teacher Education, 42(3), 23-47.
Brown, R. (2011). Higher education and the market. New York and London: Routledge.
Brown, R., & Carasso, H. (2013). Everything for sale? The marketisation of UK higher
education. London: Routledge, Taylor and Francis Group.
Bunce,L., Baird, A., & Jones, S.E. (2017). The student-as-consumer approach in higher
Betul ISCAN – Aydin BALYER Eurasian Journal of Educational Research 84 (2019) 71-92
85
education and its effects on academic performance, Studies in Higher Education,
42,11. doi:10.1080/03075079.2015.1127908
Buyukozturk, S. (2007). Data analysis handbook for social sciences (8th ed.). Ankara:
Pegem Yayincilik.
Buyukozturk, S., Kilic Cakmak, E., Akgun, E.A., Karadeniz S., & Demirel, F. (2012).
Scientific Research Methods (11th edition). Ankara: Pegem Publication.
Buyukuslu, A.R. (2010). The rise of academic capitalism and global universities.
İstanbul: Derin Publication.
Chan, K. (2003). Hong Kong teacher education students’ epistemological beliefs and
approaches to learning. Research in Education, 69, 36-50.
Clark, L. (2009). Average students debts will hit more than £10,000 by the end of the decade, The Daily Mail (21 April).
Clayson, D.E.,& Haley, D.A. (2005). Marketing models in education: Students as customers, products, or partners, Marketing Education Review, 15,1, 1-10.
doi:10.1080/10528008.2005.11488884
Douglas, A., Douglas, J., & Barnes, B. (2006). The student as customer? Proceedings of
the 9th Toulon-Verona Conference University of Paisley, 7th-8th September 2006.
Creswell, J. W. (2014). Research design: qualitative, quantitative, and mixed methods
approaches. Sage Publications.
Cokluk, O., Sekercioglu, G., & Buyukozturk, S. (2010). Multivariate statistics for social
sciences: spss and lisrel applications. Ankara: Pegem A.
Delucchi, M., & Korgen, K. (2002). We’re the customer – we way the tuition’: student consumerism among undergraduate sociology majors. Teaching Sociology,
30(1), 100–107.
Ekinci, N. (2008). Undergraduate students’ approaches to learning and their relationships with the variables of teaching-learning process (Ph.D. dissertation), Hacettepe
University Social Sciences Institute, Department of Educational Sciences,
Ankara.
Entwistle, N., & Tait.,H. (1995). Approaches to studying and perceptions of the learning environment across disciplines. New Directions for Teaching and
Learning, 64, 93–103.
Fatih Sultan Mehmet Foundation University. (2018). Departments. Retrieved
November 5, 2018, from http://www.fatihsultan.edu.tr/
George, D., Mallery, P. (2010). SPSS for windows step by step: a simple guide and reference
86 Betul ISCAN – Aydin BALYER Eurasian Journal of Educational Research 84 (2019) 71-92
17.0 update, 10. Boston: Pearson.
Geven, K. (2015). "How did the latest increase in fees in england affect student enrolment and inequality?", The European Higher Education Area, 479–500.
Haywood, H., Jenkins, E., & Molesworth, M. (2011). A degree will make all your dreams
come true: Higher education as the management of consumer desires. In
N.Molesworth, R. Scullion, & E. Nixon (Eds.), The marketization of higher education and the student as consumer. Abingdon: Routledge
Higher Education Council (YOK). (2018). The number of students in 2017-2018
education year. Retrieved from https://istatistik.yok.gov.tr/
Ikeda, A. A., Veludo-de-Oliveira, T.M., & Campomar, M.C. (2009). “Business students’
perspective on customer in education”, paper presented at the BALAS Annual
Conference, ITESM, 1 April 2009, Guadalajara, Mexico, available at
http://citation.allacademic.com/meta/p_mla_apa_research_citation/2/9/6/
1/4/pages296144/p296144-1.php (accessed April 2013).
Iscan, B., & Balyer, A. (2018). Adaptation of the scale of the extent of students’ consumer orientation and learner identity into Turkish. YILDIZ Journal of
Educational Research, 3(1), 1-26.
Istanbul Medipol University. (2018). Departments. Retrieved November 5, 2018, from
http://www.medipol.edu.tr/Default.aspx
Johansen, V. (2014). Entrepreneurship education and academic performance, Scandinavian Journal of Educational Research, 58,3, 300-314.
doi:10.1080/00313831.2012.726642
Jones-Devitt, S., & Smith, L. (2007). Critical thinking in health and social care. London,
Thousand Oaks, New Delhi and Singapore: Sage Publishers.
Kalayci, S. (2009). SPSS applied multivariate statistical techniques. Ankara: Dinamik
Akademi.
Kaynas, M. (2012). Consumers irrational behaviours and their economic outcomes
(master’s thesis). T.C. Istanbul Kultur University Social Sciences Institute,
Department of Economics, Economics of Management Program. Istanbul
Koc, G. (2007). Lifelong learning. O. Demirel (Ed.), New Directions in Education (209-
222) Ankara: Pegem A Publication.
Koris, R., & Nokelainen, P. (2015). The student-customer orientation questionnaire (SCOQ). application of customer metaphor to higher education. International
Journal of Educational Management, 29(10), 115–138.
Krause, K.-L. (2005). Understanding and promoting student engagement in university
Betul ISCAN – Aydin BALYER Eurasian Journal of Educational Research 84 (2019) 71-92
87
Learning communities. Paper presented at the Sharing Scholarship in Learning
and Teaching: Engaging Students, James Cook University, Townsville
Lawson, A. (2014). Learner identities in the context of undergraduates: a case study,
Educational Research, 56, 3, 343-356. doi: 10.1080/00131881.2014.934557
Mark, E. (2013). Students are not products. They are customers. College Student Journal, 47(3), 489–493.
Molesworth, M., Nixon, E.,& Scullion, R. (2009). Having, being and higher education:
the marketisation of the university and the transformation of the student into consumer. Teaching in Higher Education, 14 (3), 277–87.
Mulligan, C. B., & Rubinstein, Y. (2008). Selection, investment, and women’s relative
wages over time, Quarterly Journal of Economics, 122 (3), 1061-1110.
Naidoo, R., & Jamieson, I. (2005). Empowering participants or corroding learning:
towards a research agenda on the impact of student consumerism in higher education. Journal of Education Policy, 20 (3): 267–281.
Naidoo, R., Shankar, A., & Veer, E. (2011). The consumerist turn in higher education: Policy aspirations and outcomes, Journal of Marketing Management, 27, 11-12,
1142-1162. doi:10.1080/0267257X.2011.609135
Naidoo, R., & Williams, J. (2015). The neoliberal regime in English higher education:
charters, consumers and the erosion of the public good. Critical Studies in
Education, 56 (2): 208–223.
Newson, J. (2004). Disrupting the ‘student as consumer’ model: the new emancipatory project. International Relations. 18(2), 227-239.
Nixon,E., Scullion, R., & Hearn, R. (2016). Her majesty the student: marketised
higher education and the narcissistic (dis)satisfactions of the student
consumer, Studies in Higher Education. doi: 10.1080/03075079.2016.1196353
Nixon, E., Scullion, R., & Molesworth, M. (2010). How choice in higher education can
create conservative learners. In M. Molesworth, Scullion, R., & Nixon, E. Nixon
(Eds.), The marketisation of higher education and the student as consumer
(pp. 196–208). London:Routledge.
Nixon,E., Scullion, R., & Hearn, R. (2016). Her majesty the student: marketised higher
education and the narcissistic (dis)satisfactions of the student consumer, Studies in Higher Education.
Nordensvärd, J.(2010). The consumer metaphor versus the citizen. In M. Molesworth, E.
Nixon and R. Scullions (editors). The Marketisation of Higher Education: The
Student as Consumer, Routledge.

88 Betul ISCAN – Aydin BALYER Eurasian Journal of Educational Research 84 (2019) 71-92
Obermiller, C., Fleenor, P., & Raven, P. (2005). Students as customers or products:
perceptions and preferences of faculty and students, Marketing Education
Review, 15(2), 27-36.
O’Connor, M. C., & Paunonen, S. V. (2007). Big five personality predictors of post- secondary academic performance. Personality and Individual Differences, 43(5),
971- 990.
Paricio, J. (2017). Students as customers: a paradigm shift in higher education. Debats. Journal on Culture, Power and Society, 131(3), 137-149.
Pathan, S. K., Mahesar, H. A., & Shah, S. (2017). The impact of student consumerism metaphor on higher education students: a critical review of literature. Grassroots, 50(3).
Platow, M. J., Mavor, K. I., & Grace, D. M. (2013). On the role of discipline-related
self- concept in deep and surface approaches to learning among university students. Instructional Science, 41 (2), 271–85.
Ramsden, P. (2000). Learning to teaching in higher education. London: Newyork
Routhladge Falmer.
Saunders, D. B. (2015). They do not buy it: exploring the extent to which entering first-year students view themselves as customers, Journal of Marketing for
Higher Education, 25,1, 5-28. doi: 10.1080/08841241.2014.969798
Smyth, L., Mavor, K. I., Platow, M. J., Grace, D.M & Reynolds, K.J. (2015). Discipline social identification, study norms and learning approach in university students, Educational Psychology, 35, 1, 53-72. doi: 10.1080/01443410.2013.82
Strenze, T. (2007). Intelligence and socioeconomic success: A meta analytic review of longitudinal research. Intelligence, 35, Stock, J., & Cervone, D. (1999). Proximal
Goal Setting Cognitive Therapy and Research, 14 (5).
Tomlinson, M. (2014). Exploring the impacts of policy changes on student approaches and attitudes to learning in contemporary higher education: implications for student learning engagement. Higher Education Academy.
Retrieved from http://www.heacademy.ac.uk/resources/detail/Research/policy_change_stu
dent_attitudes.
Tomlinson, M. (2016). Student perceptions of themselves as ‘consumers’ of higher education, British Journal of Sociology of Education, 38,4, 450-467. doi:
10.1080/01425692.2015.1113856
Universities UK. (2017). Education, consumer rights and maintaining trust: what students want from their university. Retrieved from
http://www.universitiesuk.ac.uk/policy-and
analysis/reports/Documents/2017/education-consumer-rights-maintaining-trust-web.pdf
Betul ISCAN – Aydin BALYER Eurasian Journal of Educational Research 84 (2019) 71-92
89
Wellen, R. (2005). The university student in a reflexive society: consequences of
consumerism and competition, Higher Education Perspectives, 1(2).
Williams, J. (2010). Constructing consumption: what media representations reveal about
today’s students. In the marketisation of higher education, edited by M.
Molesworth, R. Scullion, and E. Nixon, 170–82. Oxon: Routledge.
Williams, J. (2013). Consuming HE why learning can’t be bought. London: Bloomsbury.
Yildiz, O. (2013). Women employment in Turkey from the view of employer: A field survey. Dokuz Eylul University Literature Faculty Journal, 2(3), 95-110.
Yildiz, S. (2014). What do universities promise? A content analysis of print ads of the universities in Turkey. Anadolu University Journal of Social Sciences, 14(2), 157
160.
Vakıf Üniversitesi Öğrencilerinin Tüketici Yönelim ve Öğrenen Kimlik
Düzeyi ile Akademik Performansı Arasındaki İlişki
Atıf:
Iscan, B., & Balyer, A. (2019). Foundation university students’ consumer orientation and learner identity levels and their correlations with academic performance. Eurasian Journal of Educational Sciences, 84, 71-92, DOI: 10.14689/ejer.2019.84.4
Özet
Problem Durumu: Son yıllarda yükseköğretimin piyasaya açılması ile üniversitelerde
tüketici yönelimli öğrencilerden daha fazla söz edilmektedir. Piyasalaşan
üniversitelerde öğrencilerin tüketici yönelimli öğrenci davranış ve tutumları üzerine araştırmaların artmasına rağmen, öğrencilerin kendini tüketici olarak görme düzeyi
üzerine hala yeterli sayıda araştırma bulunmamaktadır. Dolayısıyla öğrencilerin
tüketici yönelimi araştırma yapılması gereken bir konu olarak gündeme gelmiştir.
Yükseköğretimde piyasalaşmanın aynı zamanda öğrencilerin öğrenen kimliği
üzerinde ve dolayısıyla öğrenci kavramı üzerinde farklılıklara yol açtığı
düşünülmektedir. Dolayısıyla yapılan bu araştırma ile Türkiye’de piyasaya katılan vakıf üniversitesi öğrencilerinin öğrenen kimlik düzeylerinin ortaya çıkarılması
hedeflenmektedir. Bu konuda farklı ülkelerde araştırmalar bulunmasına rağmen
Türkiye’de alanyazında yeterince araştırma bulunmamaktadır. Aynı zamanda piyasalaşmanın akademik performans ile öğrencilerin tüketici yönelim ve öğrenen
kimlik düzeyi ile ilişkisini incelemek yükseköğretimin kalitesini artırmak için önemli
görülmektedir. Dolayısıyla hem alan yazındaki eksiklikleri tamamlamak hem de konuyu Türkiye bağlamında çalışmak için bu araştırmanın yapılması hedeflenmiştir.

90 Betul ISCAN – Aydin BALYER Eurasian Journal of Educational Research 84 (2019) 71-92
Araştırmanın Amacı: Bu çalışma, farklı değişkenlere göre vakıf üniversitesi
öğrencilerinin tüketici yönelim ve öğrenen kimlik düzeyini ve bunların akademik
performans ile arasında bir ilişkinin bulunup bulunmadığını belirlemeyi amaçlamaktadır.
Araştırmanın Yöntemi: Çalışma nicel ilişkisel tarama modeline dayalı yürütülmüştür.
Araştırmada incelenen değişkenler, vakıf üniversite öğrencilerinin tüketici yönelim ve öğrenen kimlik düzeyi ve akademik performanstır. Araştırmanın evrenini, 2017-
2018 eğitim-öğretim yılında İstanbul'daki iki vakıf üniversitesinde öğrenim gören 376
öğrenci oluşturmaktadır. Öğrenciler basit seçkisiz örnekleme yöntemiyle seçilmiştir. Araştırmada veriler, Bunce, Baird ve Jones (2017) tarafından geliştirilen ve İşcan ve
Balyer (2018) tarafından Türkçeye uyarlanan “Öğrenci Tüketici Yönelim ve Öğrenen Kimlik Düzeyini Belirleme Ölçeği” kullanılarak toplanmıştır. Ölçek beşli likert tipi
bir ölçektir. Veriler, SPSS 21 istatistik programı kullanılarak analiz edilmiştir.
Araştırmanın Bulguları: Araştırmada elde edilen sonuçlara göre katılımcıların tüketici
yönelimi ‘katılmıyorum’ düzeyinde bulunmuştur (��=2,25). Öğrencilerin tüketici yönelim düzeyini gösteren en yüksek madde (��=2,51) ortalamayla “Mezun olduktan
sonra iyi bir işe giremezsem, okul yapmış olduğum ödemelerin bir kısmını geri ödemelidir.” olarak bulunurken, en düşük madde ise (��=1,86) ortalamayla “Hocalarımın işinin bir
parçası da beni derslerimden geçirmektir.” olarak bulunmuştur. Yine diğer bir sonuca
göre öğrencilerin öğrenen kimlik düzeyi (��=3,79), ‘katılıyorum’ düzeyindedir. Öğrenen kimlik düzeyine ait en yüksek madde (��=4,49) ortalamayla “Üniversitede
mümkün olduğu kadar çok şey öğrenmek isterim.” maddesi iken, en düşük madde, (��=3,11) ortalamayla “Derslere hazırlık yaparım.” maddesidir. Kadınların tüketici
yönelim düzeyi (��=2,08), erkeklere göre (��=2,51) daha düşük bulunmuştur. Öğrenen
kimlik düzeyinin cinsiyete göre farklılığı istatistiksel olarak anlamlı değildir (p>0.05). Öğrencilerin tüketici yönelim ve öğrenen kimlik düzeyi yaşa göre istati stiksel
anlamda bir farklılık göstermemiştir (p>0.05). Katılımcıların tüketici yönelim
düzeyinin ve öğrenen kimlik düzeyinin sınıf düzeyine göre farklılığı istatistiksel olarak anlamlı değildir (p>0.05). Bursluluk durumu değerlendirildiğinde, %25 burslu
(��=2,31) ve 50% burslu (��=2,24) olanların tüketici yönelim düzeyi, tam burslu
olanların düzeyine (��=1,78) göre daha yüksek bulunmuştur. Öğrencilerin öğrenen kimlik düzeyinin bursluluk oranlarına göre farklılığı istatistiksel olarak anlamlı
değildir (p>0.05). Katılımcıların tüketici yönelim düzeyinin bölümlerine göre
farklılığı istatistiksel olarak anlamlı değildir (p > 0.05). STEM bölümündeki öğrencilerin öğrenen kimlik düzeyi (��=3,74), STEM bölümünde olmayan öğrencilere
(��=3,94) göre daha düşük bulunmuştur. Hedeflenen mezuniyet AGNO’su (-)-3,00 katılımcıların tüketici yönelim düzeyi (��=2,60), hedeflenen mezuniyet AGNO’su
3,50-4,00 olanlara (��=1,91) göre daha yüksek bulunmuştur. Hedeflenen mezuniyet
AGNO’su (-)-3,00 (��=3,55) olan katılımcıların öğrenen kimlik düzeyi, hedeflenen mezuniyet AGNO’su 3,00-3,50 (��=3,78) ve 3,50-4,00 (��=4,18) olanlara göre daha
düşüktür. Akademik performans ile tüketici yönelim düzeyi arasında negatif yönde
düşük kuvvetli bir ilişki bulunmuştur (r=-0,284 p=0.001, p=0,000). Akademik performans ile öğrenen kimlik düzeyi arasında pozitif yönde düşük kuvvetli bir
ilişki tespit edilmiştir (r= 0,322 p=0.000, p=0,000).
Betul ISCAN – Aydin BALYER Eurasian Journal of Educational Research 84 (2019) 71-92
91
Araştırma Sonuçları ve Öneriler: Araştırmada elde edilen sonuçlara göre, öğrencilerin
tüketici yönelimleri ‘katılmıyorum’; öğrenen kimlik düzeyi ise ‘katılıyorum’ düzeyindedir. Kadınların tüketici yönelim düzeyi, erkeklerin tüketici yönelim
düzeyine göre daha düşük iken; öğrenen kimlik düzeyi cinsiyete göre anlamlı
farklılık göstermemektedir. Tüketici yönelim ve öğrenen kimlik düzeyi, yaşa göre anlamlı bir farklılık sergilememektedir. Tüketici yönelim düzeyi ve öğrenen kimlik
düzeyi öğrencilerin bulunduğu sınıf düzeyine göre anlamlı farklılık
göstermemektedir. %25 ve 50% burslu olanların tüketici yönelim düzeyi, tam burslu olanların tüketici yönelim düzeyine göre daha yüksek iken; öğrenen kimlik düzeyi
bursluluk oranına göre anlamlı farklılık göstermemektedir. Tüketici yönelim düzeyi
bölüme göre anlamlı farklılık göstermezken, STEM bölümündeki öğrencilerin öğrenen kimlik düzeyi, STEM bölümünde olmayan öğrencilerin öğrenen kimlik
düzeyine göre daha düşüktür. Hedeflenen mezuniyet AGNO’su (-)-3,00 olan
öğrencilerin tüketici yönelim düzeyi, hedeflenen mezuniyet AGNO’su 3,50-4,00 olan öğrencilerin tüketici yönelim düzeyine göre daha yüksektir. Hedeflenen mezuniyet
AGNO’su (-)-3,00 olan öğrencilerin öğrenen kimlik düzeyi, hedeflenen mezuniyet
AGNO’su 3,00-3,50 ve 3,50-4,00 olan öğrencilerin öğrenen kimlik düzeyine göre daha düşüktür. Tüketici yönelim düzeyi ile akademik performans arasında negatif yönde
düşük bir ilişki var iken, öğrenen kimlik düzeyi ile akademik performansı arasında
pozitif yönde düşük bir ilişki vardır.
Yükseköğrenim alanında politika geliştirenler, vakıf üniversitelerinin tüketici
yönelim düzeyi ile akademik performans arasındaki negatif ilişki ve öğrenen kimlik
düzeyi ile akademik performans arasındaki pozitif ilişkiyi dikkate alarak akademik performansı artırmaya yönelik düzenlemeler yapabilirler. Böylece tüketici yönelim
düzeyi arttıkça, akademik performanstaki düşüşün nedenleri araştırılabilir. Ayrıca,
öğrenen kimlik düzeyi ile akademik performans arasındaki pozitif ilişkiye dayanarak, öğrenen kimlik düzeyini artırmak için ne yapılması gerektiği konusu
yürütülecek olan karma bir araştırma yöntemiyle karşılaştırılabilir. Yine benzer bir
araştırma devlet üniversitelerinde, farklı bölgelerdeki ve illerdeki vakıf üniversitelerinde de yapılabilir. Benzer bir araştırma lisans, lisansüstü ve doktora
düzeylerine yürütülebilir ve lisans öğrencileriyle karşılaştırılabilir.
Anahtar Kelimeler: Akademik performans, neoliberalizm, öğrenen kimlik, tüketici
kimliği, vakıf üniversitesi.
This study was produced from Betul ISCAN's thesis “Investigation of The
Correlation Between The Extent of Consumer Orientation and Learner Identity,
and Academic Performance of University Students: Foundation University Case”
and supported by the Scientific Research Projects Unit of Yildiz Technical
University. Project Number: 3342.

Eurasian Journal of Educational Research 84 (2019) 93-114 Eurasian Journal of Educational Research
www.ejer.com.tr
Early Childhood Preservice Teachers’ Experiences with Reflective Journal Writing Figen SAHIN1, Muge SEN2, Caglayan DINCER3
A R T I C L E I N F O A B S T R A C T
Article History: Purpose: Reflective journal writing is considered as a form of reflective practice. The research studies suggested that journal writing allowed the teacher to reflect on their practices, improved their self-awareness and supported their professional development. Even though the research showed that journal writing as an effective tool for reflective practice, the need exists for the studies conducted in the area of early childhood teacher education. Thus, this qualitative study aims to gain a more in-depth understanding of early childhood preservice teachers’ experiences with reflective journal writing. Research Methods: This study is a qualitative study focusing on the experiences of Turkish preservice
Received: 07 Nov. 2018
Received in revised form: 22 Aug. 2019
Accepted: 23 Nov. 2019 DOI: 10.14689/ejer.2019.84.5
Keywords reflective journals, reflective practice, early childhood, teacher education
teachers. The participants were ten preservice teachers attending an early childhood teacher education program. A demographic information form, semi-structured interviews, and reflective journals were used to collect data. Findings: The findings of this study were reported on the basis of two focal points: the role of reflective journals and the content of reflective journals. For the role of reflective journals, three themes derived from data were as follows: (i) gaining insight, (ii) detailed evaluation, and (iii) developing strategies for the future. At the analysis of the content of reflection, meeting the real classroom environment and positive experiences gained from the field were the two themes that emerged from the data. Implications for Research and Practice: This study showed that writing a reflective journal can be considered an important tool for self-evaluation and professional growth. In future studies, the role of reflective writing in teacher’s professional development, especially a variety of differing types of reflective strategies, can be addressed.
© 2019 Ani Publishing Ltd. All rights reserved
1 Corresponding Author. Gazi University, Faculty of Education, Department of Primary Education, Division
of Preschool Education, Ankara-TURKEY, e-mail: [email protected] ORCID: https://orcid.org/0000-0001-5614-6883 2 Ankara University, Faculty of Educational Sciences, Department of Elementary Education, Division of
Preschool Education, Ankara-TURKEY, e-mail: [email protected] ORCID: https://orcid.org/0000-0003-4854-6531 3 Hasan Kalyoncu University, Faculty of Education, Division of Preschool Education-Gaziantep-TURKEY, e-
mail: [email protected], ORCID: https://orcid.org/0000-0001-5468-9155
Figen SAHIN - Muge SEN - Caglayan DINCER Eurasian Journal of Educational Research 84 (2019) 93-114
94
Introduction
Over the past two decades, there has been a movement around the world
towards the use of reflective practice and reflective journals (e.g. Bain, Mills,
Ballantyne, & Packer, 2002; Isikoglu, 2007). Research studies in teacher education
have focused on both the importance of reflective thinking, as well as ways of
increasing reflective practices (Pavlovich, 2007; Russell, 2005). In parallel with these
practices, there are many professional standards that have reported that reflection is
an important part of quality teaching National Association for the Education of
Young Children [NAEYC], 2009; National Council for Accreditation of Teacher
Education [NCATE], 2008). Developing reflection in teacher education, as Pedro
(2005) asserted, is a “worthwhile effort” (p. 63).
According to Zeichner and Liston (1996), the interest in reflection can be
considered “a reaction against the view of teachers as technicians who narrowly
construe the nature of the problems confronting them and merely carry out what
others, removed from the classroom, want them to do” (p. 4). Emphasizing the
training of teachers as reflective practitioners supports the idea that preservice
teachers should be trained from the perspective of “learning facilitator” or “social
mediator” (Larrivee, 2008). Reflection in teacher education provides teachers with
reason abilities to evaluate and improve their teaching practices (Jay & Johnson,
2002), supports their professional development (Körkkö, Kyrö-Ämmälä, & Turunen,
2016), and acts “as a compass” for better determining their current situation and
contemplating their future direction (Farrell, 2012, p. 7).
Although an increasing amount of literature has addressed the definition of
reflection and strategies for improving reflection, there continues to be a debate over
the meaning of reflection. The term reflection is seen as ill-defined (Hatton & Smith,
1995) and represented as complicated (Clarà, 2015; Griffiths, 2000; Jay & Johnson,
2002; LaBoskey, 1993; Russell, 2005). The roots of the term reflection originated with
Dewey (1933) who defined the reflective action as an “active, persistent and careful
consideration of any belief, or supposed form of knowledge in the light of the
grounds that support it and the further conclusions to which it tends” (p. 9). Hatton
and Smith (1995) basically defined reflection as the “deliberate thinking about action
with a view to its improvement” (p. 40). The elements of reflection are considered
from various frameworks, “reflection is situated in practice, is cyclic in nature, and
makes use of multiple perspectives” (Ward & McCotter, 2004, p. 245). Schön (1987)
suggested the reflection in action and reflection on action. In Schön’s framework,
reflection in action implies “conscious thinking and modification while on the job”
(Hatton & Smith, 1995, p. 34). Reflection on action occurs before and after the
experience while planning and thinking about the lesson or while evaluating what
happened (Zeichner & Liston, 1996).
Reflective teachers are active in asking questions and evaluating their beliefs and
assumptions about what they do in practice (Cruickshank, Jenkins, & Metcalf, 2006;
Larrivee, 2008; Lee, 2008). Zeichner and Liston (1996) stated that acknowledging
teachers as reflective practitioners is to accept teachers as active individuals with
Figen SAHIN - Muge SEN - Caglayan DINCER Eurasian Journal of Educational Research 84 (2019) 93-114
95
ideas, beliefs, and theories related to their work, as well as both problem posers and
solvers in the educational context rather than regarding them as merely the
implementers of pre-planned programs.
Reflective thinking and practice take into account different trends in the research
literature. For example, while one vein of research focuses on the improvement of
reflective thinking (Pavlovich, 2007; Russell, 2005), another group of research is
interested in describing the levels or classification of reflective thinking (Cengiz,
Karatas, & Yadigaroglu, 2014; Collier, 1999; Hatton & Smith, 1995; Jay & Johnson,
2002; Larrivee, 2008; Valli, 1997; Ward & McCotter, 2004). The striking finding of
these research trends was that descriptive reflection tended to be the most common
preference among preservice teachers (Cengiz et al., 2014; Hatton & Smith, 1995). On
the other hand, based on their review, Dyment and O’Connell (2011) stated that
preservice teachers could write higher quality journals if consideration was made
regarding the limiting and supporting factors which influence their writing.
One of the most important points to be considered in supporting reflective
practitioners is to provide preservice teachers with “mediation structures” to aid
them in systematically focusing on their experiences, as well as to take action
(Larrivee, 2008). To help teachers become more reflective teachers different types of
strategies are beneficial, such as portfolios (Kaasila & Lauriala, 2012), e-portfolios
(Oakley, Pegrum, & Johnston, 2014), video journaling (Parikh, Janson, & Singleton,
2012), video analysis (Tripp & Rich, 2012), action research (Vaughn, Parsons, Kologi,
& Saul, 2014; Yost, Sentner, & Forlenza-Bailey, 2000), and narratives (Larrivee,
2008). Also, it is important to use multiple systematic aids, not limit preservice
teachers to one approach, and to use several strategies (Lee, 2005).
Journal writing is characterized as a form of reflective practice (Al-karasneh, 2014;
Bain et al., 2002; Farrell, 2013; Lee, 2008; Pavlovich, 2007; Pedro, 2005; O’Connell &
Dyment, 2011; Uline, Wilson, & Cordry, 2004; Valli, 1997; Yost et al., 2000). In other
words, it is seen as a “device for working with events and experiences to extract
meaning from them” (Boud, 2001, p. 9). Journal writing is a vehicle for reflection that
fits the ‘reflection on action’ category of Schön. Journal writing is not only a place for
writers to record their experiences and events but also a forum in which these events
and experiences can be restructured (Boud, 2001). Collier (1999) stated that reflective
writing allows students to become “aware of the sound and the character of their
own voices” as well as to learn “how they think and how they convey what they
think to others through their words and actions” (p. 179). Journal writing entries also
create personal space for students to reflect upon their knowledge, feelings,
experiences and the reasoning behind their choices (Valli, 1997).
Several studies which addressed the role of writing reflective journals revealed
that journal writing supported teachers’ ability to reflect on their teaching practices,
increased their understanding regarding the complex nature of teaching (Tadesse
Degago, 2007), and also improved their self-awareness and professional
development (Al-Hassan, Al-Barakat, & Al-Hassan, 2012; Francis, 1995; Larrivee,
2008). In addition, reflective journaling is considered as a tool for preservice teachers
Figen SAHIN - Muge SEN - Caglayan DINCER Eurasian Journal of Educational Research 84 (2019) 93-114
96
to foster dispositional development (LaBelle & Belknap, 2016). Around the world, the
studies conducted with preservice and in-service teachers in early childhood area
(Beavers, Orange, & Kirkwood, 2017; Cherrington & Loveridge, 2014; Durand, Hopf,
& Nunnenmacher, 2016; Foong, Binti, & Nolan, 2018; Kahles, 2015; Riojas-Cortez,
Alanís, & Flores, 2013) have addressed on different aspects of reflection and
reflective thinking. In Turkey, a few studies have focused on reflective journal
writing of preservice teachers in different areas of education, computer and
instruction technology (Akkoyunlu, Telli, Cetin, & Daghan, 2016), science (Cengiz et
al., 2014) primary education (Ekiz, 2006; Koc & Yildiz, 2012), and child development
and early childhood education (Isikoglu, 2007; Kucukoglu, Ozan, & Tasgin, 2016;
Sahin, 2009). Although a wealth of research literature has considered journal writing
as an effective tool, there continues to be a need for conducting further research in
this area with early childhood preservice teachers. Reflective teaching is more
important than ever, especially for early childhood teachers who are working in
diverse classrooms (Thomas & Packer, 2013). As a result, this qualitative study aims
to gain a more in-depth understanding of early childhood preservice teachers’ first
experiences with reflective journal writing. Based on this aim, the research questions
for this study were as follows: (1) What are the perceptions of pre-service teachers
regarding the role of reflective journal writing? (2) What is the content of the pre-
service teachers’ reflective journals?
Method
Research Design
This study utilized the methods of qualitative research, which aims to better
understand the experiences and ideas of the participants (Lincoln & Guba, 1985;
Merriam, 1998) and basically involves “an interpretive and naturalistic approach to
the world” (Denzin & Lincoln, 2000, p. 3). This study was conducted to gain a deeper
understanding of the perceptions of preservice teachers concerning their experiences
and the role reflective journal writing played. Regarding the qualitative research
tradition, to increase the trustworthiness of this study, the strategies, including
prolonged engagement and triangulation, suggested by researchers (Creswell, 2013;
Lincoln & Guba, 1985; Merriam, 1998) were utilized. Throughout this study,
observing the participants while they implemented their activities, as well as holding
pre and post-conferences with them, allowed the researchers to become more
familiar with and better understand the participants. The experiences of the
participants were provided in detail, along with rich descriptive accounts. To
provide triangulation, three researchers worked together in each stage of this study,
and this provided the opportunity to enhance the quality of this study by providing
multiple perspectives. Furthermore, the journals and interviews were used together
in understanding the perspectives of the participants regarding journal writing.
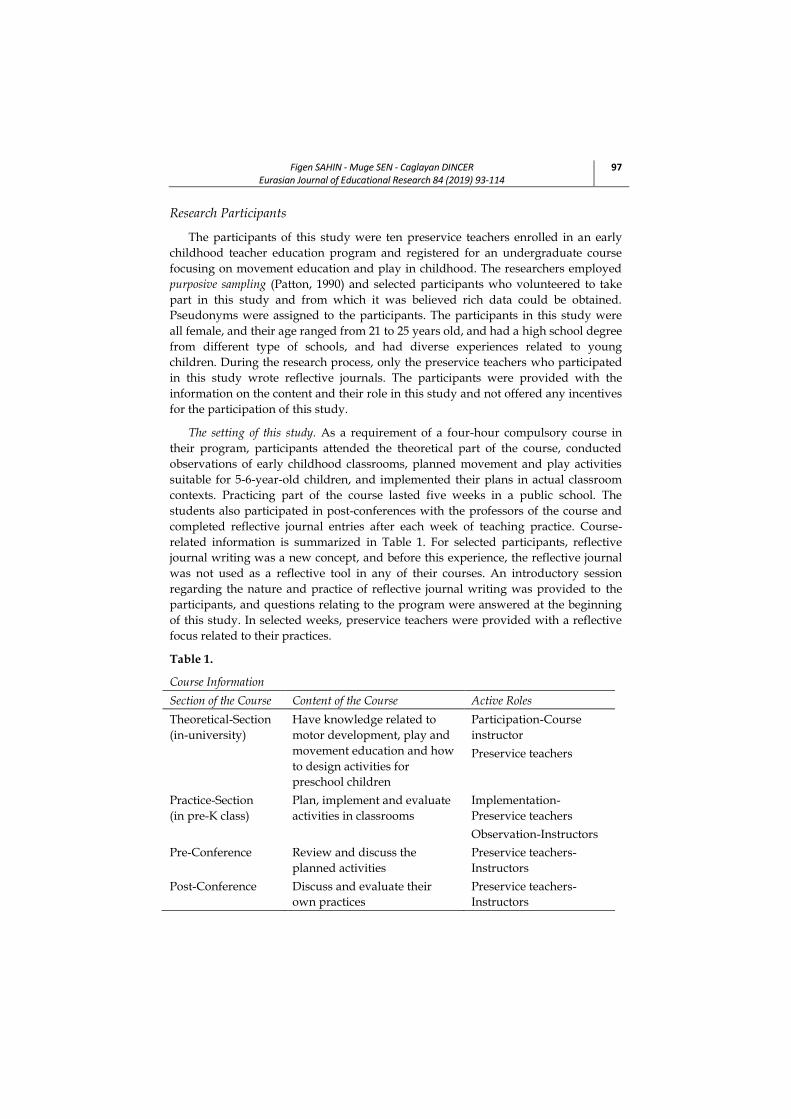
Figen SAHIN - Muge SEN - Caglayan DINCER Eurasian Journal of Educational Research 84 (2019) 93-114
97
Research Participants
The participants of this study were ten preservice teachers enrolled in an early
childhood teacher education program and registered for an undergraduate course
focusing on movement education and play in childhood. The researchers employed
purposive sampling (Patton, 1990) and selected participants who volunteered to take
part in this study and from which it was believed rich data could be obtained.
Pseudonyms were assigned to the participants. The participants in this study were
all female, and their age ranged from 21 to 25 years old, and had a high school degree
from different type of schools, and had diverse experiences related to young
children. During the research process, only the preservice teachers who participated
in this study wrote reflective journals. The participants were provided with the
information on the content and their role in this study and not offered any incentives
for the participation of this study.
The setting of this study. As a requirement of a four-hour compulsory course in
their program, participants attended the theoretical part of the course, conducted
observations of early childhood classrooms, planned movement and play activities
suitable for 5-6-year-old children, and implemented their plans in actual classroom
contexts. Practicing part of the course lasted five weeks in a public school. The
students also participated in post-conferences with the professors of the course and
completed reflective journal entries after each week of teaching practice. Course-
related information is summarized in Table 1. For selected participants, reflective
journal writing was a new concept, and before this experience, the reflective journal
was not used as a reflective tool in any of their courses. An introductory session
regarding the nature and practice of reflective journal writing was provided to the
participants, and questions relating to the program were answered at the beginning
of this study. In selected weeks, preservice teachers were provided with a reflective
focus related to their practices.
Table 1.
Course Information
Section of the Course Content of the Course Active Roles
Theoretical-Section
(in-university)
Have knowledge related to
motor development, play and
movement education and how
to design activities for
preschool children
Participation-Course
instructor
Preservice teachers
Practice-Section
(in pre-K class)
Plan, implement and evaluate
activities in classrooms
Implementation-
Preservice teachers
Observation-Instructors
Pre-Conference Review and discuss the
planned activities
Preservice teachers-
Instructors
Post-Conference Discuss and evaluate their
own practices
Preservice teachers-
Instructors
Figen SAHIN - Muge SEN - Caglayan DINCER Eurasian Journal of Educational Research 84 (2019) 93-114
98
Research Instruments and Procedures
In this study, a demographic information form, semi-structured interviews, and
other related documents were utilized as data collection tools. A demographic
information form was completed by each participant. The form consisted of
participants’ demographic information, as well as the participants’ previous
experiences with children. The primary data collection tool for this study was face-to-
face semi-structured interviews. The questions, which sought to address the thoughts
and feelings of the participants regarding their practices throughout the course, as
well as their thoughts and feelings regarding journal writing, were prepared by the
researchers in light of the literature. Participant interviews were conducted at the
office of one of the researchers who was not the instructor of the course following the
completion of the course and after the collection of the student journals. Each
participant interview lasted approximately 25-40 minutes, was recorded, and later
transcribed verbatim. Semi-structured interviews allowed the researchers, “to
respond to the situation at hand” (Merriam, 1998, p. 74) and to integrate additional
questions into the interview when deemed necessary for gaining further
understanding. Another data collection tool was the analysis of weekly reflective
journals and the review of weekly activity plans, which included a section for
assessment. In the creation of their reflective journals, participants were asked to use
freestyle writing and to focus on important events that had happened that day, as
well as on specific incidents that they faced in their practice.
Data Analysis
In this study, data were analyzed using a constant comparison method (Strauss &
Corbin, 1990). To prepare data for analysis, a total of 50 reflective journals and 50
activity plans were organized chronologically for each participant. Data analysis was
conducted in two stages. The first stage was to analyse interview data and journals
regarding the first research question. The second stage was to examine data from
journals for the second research question. Overall, in this study, rather than using
preconceived categories for analysing the data, the analysis was instead data-driven,
which “involves constructing a category system from the evidence that has been
collected” (Edwards, 2001, p. 132). The analysis of the data was inductive; therefore,
in the first phase of data analysis, the researchers reviewed the data multiple times to
determine recurring issues and then coded them manually. The process was iterative,
with the primary aim of identifying emerging codes. After determining emergent
codes, the three researchers collaborated on the recoding and revising of the codes
and also on determining the categories derived from the data.
Results
The reflective journal contents and the writing styles of participants varied and
were individualistic based on their context. In this study, findings from the reflective
journals and semi-structured interviews of the preservice teacher participants were
Figen SAHIN - Muge SEN - Caglayan DINCER Eurasian Journal of Educational Research 84 (2019) 93-114
99
reported on the basis of two focal points. The first of these focal points was the role of
reflective journals, and the second focal point was the content of reflective journals.
The Role of Reflective Journals
In general, in this study, the findings showed that reflective journal writing for
preservice teachers served as a tool for professional awareness and evaluation. In
particular, reflective journal writing supported preservice teachers’ ability to gain
greater confidence and to be objective when making personal evaluations. In
addition, a majority of the participant preservice teachers expressed that reflective
journal writing had become a new and important part of their professional life. In
this context, a preservice teacher stated, "It was important to write, it made a big
difference in reflective journaling, and I realized that I needed to use it not only in the field of
education, preschool education but also in my other daily life. I realized that it was a need for
me” (Elif, Interview).
The reflective journals of the participant preservice teachers had both similarities
and differences, with each research participants’ journal possessing both a common
theme, as well as differing perspectives based on their own context. For example, a
participant expressed her views regarding reflective journals, which she described as,
"pouring and embodying experiences on paper", by stating, "I think the reflective journal is
effective in every respect, even when I entered into my professional life, I also like to make a
notebook like this one every day and write everything there” (Aylin, Interview). Aylin
shared her view relating to the benefits of writing reflective journals during teaching
practice through her journal entry:
The reflective journals that we wrote after the implementation process were
obviously very useful to me. I can see where I made a mistake when writing my
reflective journal. I think what I must do and find solutions. I saw my deficiencies
in my reflective journal. It is also nice to express my thoughts and emotions after
the implementation on a blank page. I think in your reflective journal, you have the
opportunity to share everything like I'm talking to myself (Aylin, Journal-Week
5).
Another participant journaled that, "Reflective journal writing allowed me to
recognize my mistakes and the good things I did. I think it is more effective and useful than
the evaluation that we normally write" (Gizem, Journal-Week 5). As a result of the
analysis, three salient themes defining the role of reflective journals were determined
as follows: Gaining insight, detailed evaluation and developing strategies for the
future.
Gaining insight. Preservice teachers in the study group indicated that reflective
journaling helped in developing a better awareness of their mistakes from the
implementation process during teaching and also raised awareness of their strengths
and weaknesses more than external evaluation. Melis expressed her views on this
topic by stating, "I think it was very helpful for me to see the negatives because realizing my
own mistakes benefitted me more than someone else telling me" (Interview), and Oyku
emphasized that the reflective journal is helpful for “realizing mistakes easily” and
Figen SAHIN - Muge SEN - Caglayan DINCER Eurasian Journal of Educational Research 84 (2019) 93-114
100
“noticing good things more easily” (Interview). Another example of evaluating the
reflective journal as an instrument utilized for gaining insight was provided by
Aylin, stating, "It was like a human talking to herself. In a reflective journal, people actually
admit things that they cannot admit to themselves” (Interview).
Preservice teachers also pointed out that keeping journals makes it compulsory
for the person to be objective on self-evaluation in addition to their gaining increased
and renewed insight. Excerpts from the preservice teachers' opinions are as follows:
I think [keeping a journal] allowed me to see myself from the outside. It helped me to
see myself not with my own eyes, but with someone else’s. It allowed me to see more
detail about my mistakes or what I did correctly or maybe to be more objective.
Otherwise, I might feel like I was successful even if I was not, but it did not make
me feel like it when I got into the reflective journal work (Yesim, Interview).
It is a bit difficult for people to put their negative side on the paper. Let's say a
person cannot criticize himself. Every time you must criticize from any aspect. If
you are not at peace with yourself, it is difficult to write a reflective journal (Oyku,
Interview).
Detailed evaluation. At the beginning of this study, preservice teachers reported
similarities between the reflective journaling and the three-dimensional assessment
(program, teacher and children). At the end of this study, though, the preservice
teachers who had gained reflective journaling experience through their weekly
practice, instead stated that the reflective journaling process provided a much more
comprehensive and detailed (e.g., holistic) evaluation and added more to three-
dimensional assessment. In this regard, Gizem stated:
Because while you actually mean to write a little review and leave the scene, you
find a good opportunity to think about the one-hour period you have experienced,
and you find a lot to think about. Well, it may not have much effect on the material,
but it is effective for evaluating the program (Gizem, Interview).
The participant Aylin, who also believes that keeping a reflective journal can
help one to consider, recognize, and note in a more detailed way, “the missing and
ignored ideas” (Interview). Yasemin’s view concurred, stating that, “Because reflective
journaling is much broader, it enabled us to see everything from a wider perspective. It
enabled us to see everything in detail. We evaluated things in a more detailed way rather than
only negative comments. It provided a great contribution to us” (Interview). Moreover, Elif
commented that writing a reflective journal helped her to open up opportunities to
“analyze, consider deeply and give some ideas for further activities”, as well as directed
participants to think in a more “multidimensional” way (Elif, Interview). Another
participant, Beril, shared the belief that reflective journal writing requires certain
contributions because the process involves emotions, as well as calls upon a three-
dimensional assessment:
With the evaluations, we realized that we usually ignored our emotions. This can be
a daily plan or a single activity. Also, we observed all of our behaviors, positive or
negative, children’s behaviors and attitudes. A detailed evaluation is something
Figen SAHIN - Muge SEN - Caglayan DINCER Eurasian Journal of Educational Research 84 (2019) 93-114
101
positive. I think we can see where we make mistakes much more easily in this way
(Beril, Interview).
While the participant, Yesim, stated similar beliefs that reflective journaling
provides both a space for detailing and also for expressing emotions:
In planning, I was able to do this, when I wrote the reflective journal, I made the
effort to do more detailed planning, perhaps because I wrote the mistakes along with
my own feelings. I figured I could not do things when they were implicit. I realized
this through the reflective journal, but I may not have thought about it when I left
the activity, how I felt that is, why did I feel this way? I would not have thought of
them (Yesim, Interview).
Developing strategies for the future. A majority of the participants found that
reflective journals acted as a sort of facilitator for defining practice strategies and also
for evaluating these strategies. Some preservice teachers expressed this in their
interviews, while other preservice teachers instead utilized their journal to reflect
these sentiments:
I tried not to do something that I said, ‘I did it because I did that’ in my previous
practice. Or I tried to use a situation that children liked in the next implementation,
too. When I do this thing, I cannot attract their attention, I must not do that, I must
make changes by doing this (Interview).
I will continue to keep a reflective journal for myself during my upcoming
implementations. During this period, keeping that journal affected my behaviour
before, during, and after the event. I'm getting more detailed and trying to plan the
next step (Elif, Journal-Week 5).
Melis expressed her belief that writing a reflective journal is an effective way for
"taking action" in implementations she will plan and use in the upcoming weeks in
the following statement:
It made me see the mistakes I had made. Maybe it prevented me from making those
mistakes in the next week. Of course, it contributed to the plans. Then, I changed
my approach to the children, thanks to reflective journals. I used to have the wrong
attitude. There were words I had used in the wrong way. When I wrote them down,
I mean, confessed my mistakes to myself, I internalized it. Then, I can say I
proceeded with more confidence in the correct way (Melis, Interview).
In determining their future strategies, participants addressed that they most
utilized the "reminder" function of reflective journaling. In her interview, Ceren also
explained that it was important to reflect upon any planned process which could not
previously be performed because the journaling acted as a data source for preparing
later implementations. Another participant, Elif stated:
If I hadn’t written a reflective journal, I would have only remembered the most
apparent or the worst or the most interesting or the best memories. I would not have
remembered more from the remaining experiences. Thus, I felt like the process had
been done (Elif, Interview).

Figen SAHIN - Muge SEN - Caglayan DINCER Eurasian Journal of Educational Research 84 (2019) 93-114
102
The Content of the Reflective Journals
Along with attempting to understand the participant preservice teachers’
perceptions regarding the role of reflective journal writing, it was also a part of this
research to dissect the content of the participant teachers’ reflective journals. For
example, what experiences the teacher candidates emphasized in their reflective
journals. Through analysis of their reflective journal entries, two themes emerged as
follows: meeting the real classroom environment and positive experiences gained
from the field.
Meeting the real classroom environment. When the contents of the reflective
journals were examined, subcategories from contact with the real classroom
environment were identified. The subcategories that were established from the
findings were as follows: (1) the difficulties experienced in the real classroom
environment and (2) concerns regarding the transfer of theoretical knowledge into
practice. The challenging experiences that the preservice teachers experienced were
most prominently witnessed in their classroom management practices. For example,
Yesim emphasized the impacts of external factors on her experiences by stating:
I could not manage the classroom. Although it is because I am inexperienced, the
overwhelming number of students was also a factor. It was really hard for me to
respond to all the needs of 20 different children with different problems and needs as
a single teacher. While I was trying to control some of the children, I could not
manage the others (Yesim, Journal-Week 2).
Aylin expressed her experiences regarding this issue with the following words; “I
had difficulty in classroom management during my practices […] Disorganized children
made the practice difficult” (Journal-Week 5). Moreover, Betul exemplified her concerns
regarding classroom management by stating, “I had many concerns about organizing
children when their attention was distracted from time to time. However, when all children
joined in all activities, it helped this concern pass quickly” (Journal-Week 2). Gizem
expressed her perceptions regarding classroom management in her journal from the
second week in the following words: “I don’t think I will have more difficulties if I gain
the ability to manage the classroom. Because, if I manage the classroom, I will feel less anxiety
as I confide in myself more, and I will feel more comfortable”.
Another subcategory of experiencing the real classroom environment is the
concern of transferring theoretical knowledge into classroom practice. In their
reflective journals, the preservice teachers often stated that they had difficulty in
transforming the information they had gained in their undergraduate coursework
into their real-world classroom practice. Among the participants, Gizem and Sibel,
both noted in their journals their negative feelings towards putting their theoretical
knowledge into practice.
While Gizem stated, “I tried to use the pitch and intonation of my voice as our lecturer
constantly told us, I tried to act as if I was one of them when I was with the children, but I feel that this actually caused them to ignore me because they were not used to such things”
(Journal-Week 2), Sibel wrote the following, “I realized that it was not applicable to a
Figen SAHIN - Muge SEN - Caglayan DINCER Eurasian Journal of Educational Research 84 (2019) 93-114
103
group that did not recognize you, as we learned in school, that we could draw children's
attention with a song” (Journal-Week 5). On the other hand, some participants stated
that they had problems in transferring the knowledge they had learned because of
their general "lack of practical experience". For example, Elif expressed her concerns
regarding this situation in the following way, “I think it is important to know the
personality and developmental characteristics of the child as well as his name to have effective
group work” (Journal-Week 3).
Positive experiences gained from the environment. When the reflective journals
were analyzed, the second theme was the positive experiences preservice teachers
had during the implementation process. In their reflective journals, preservice
teachers included positive experiences from their field experiences, as well as the
personal lessons they felt they gained working with particular age groups during the
implementation of planned activities. Gizem’s journal entries regarding her
experiences over time were:
I had too much difficulty preparing activities for the first week. It took me a week to
do the materials, but when I looked back at the last week, I recognized that I got
more used to and gained practice. With all of this, I can now control myself easier.
I'm not overly panicked like I was in the first week. The closer I got to the last week,
the less panicked I was (Journal-Week 5).
Oyku also emphasized her positive experiences, stating, “Even when I said a
sentence, I learned how careful I needed to be. Because I saw what can happen if you do not
provide a clear directive. At the same time, I realized that using sound tones is an effective
tool to attract children’s attention to a game” (Journal-Week 5). On the other hand, Melis
stated that she integrated the information obtained from the field during practice
with her acquired theoretical knowledge:
Before attending the practicum sessions as a requirement of movement education
class, I did not fully understand the purpose of having the children carry out
movement activities. In practice, though, I recognized that the children were
constantly doing desk activities and could never fully use their energy […] Thanks
to these (movement) activities, children were able to use their energy in a positive
way. From this point of view, when I become a teacher in the future, instead of saying 'don’t run, don’t hit your friend', I figured that I need to include what the
child wants to do by planning movement activities like this (Journal-Week 5).
Discussion, Conclusion and Recommendations
This qualitative study aimed to understand the perspectives of early childhood
preservice teachers who were not accustomed to using the journals regarding
reflective journal writing process and analysis of the content of the reflective
journals. To summarize, the results suggested that for the participants of this study,
journal writing acted as a tool for “gaining insight”, “making detailed evaluation”, and
“developing strategies for the future”. “encountering real classroom life” and “positive
experiences they had” were the primary focus of their journals.
Figen SAHIN - Muge SEN - Caglayan DINCER Eurasian Journal of Educational Research 84 (2019) 93-114
104
One of the main results of this study was that the participants’ reflective journal
writing served as “a useful tool for self-evaluation”. Results from this research study
corroborated with the previous research literature suggested that reflective journal
writing is a crucial practice for one’s professional development (Al-Hassan et al.,
2012; Jay & Johnson, 2002), as a self-awareness tool (Farrell, 2013; Francis, 1995), and
a meaningful activity (Brown, Cheddie, Horry, & Monk, 2017). In this study, the
primary contribution of reflective journal writing for participant preservice teachers
was the ability for them to utilize journaling for not only recognizing their successes
but also their failures. As a result, participants understand that they have a concrete
tool that can be used to evaluate better and understand their classroom experiences.
As Thomas and Packer (2013) stated, “Reflection leads to a greater self-awareness-the
first step toward positive change and both personal and professional growth” (p. 12).
Since preservice teachers should be active stakeholders in the daily process of the
classroom, reflective journal writing can serve as an objective facilitator in their self-
evaluation process, as suggested by the results of this study. In addition to ensuring
preservice teachers understand not only aspects that do need improvement but
reflective journal writing also allows them to query themselves about, “Why did I
make this mistake, how did I do it, what should I do? As a result, reflective journal
writing supports teachers in reviewing the complexities of teaching, both the
successes and failures, in the pursuit of self-development (Tadesse Degago, 2007).
Another important finding of this study was that writing a reflective journal is
not only about preservice teachers reliving the practice but it is also about
considering what they can do in their future teaching. A very fitting metaphor was
used by Farrell (2012), compared reflective journaling to orienteering with a compass
by describing reflective practices as, "stop, look, and discover where they are at that
moment and then decide where they want to go (professionally) in the future" (p. 7).
In this study, reviewing and revisiting their classroom practices through their
reflective journals acted as a reminder, which enabled them to be more cautious in
the future, as well as revealed clues regarding the important aspects of the teaching
life. Sahin’s (2009) study with child development preservice teachers showed that
participants determine goals for future practices in their journal. In a study, Lee
(2008) showed that journals provide opportunities for preservice teachers to develop
features that will support their future careers. The present study also pointed out
that the teacher can review and evaluate the important factors which influenced the
teaching process through reflective journals.
This study showed that one of the most important and effective roles of writing a
reflective journal for participant preservice teachers is the addition of the emotional
dimension to the multidimensional structure of evaluation. Reflective journal writing
assists participants of the study by providing detailed depth to their practice
experience, as well as facilitating the opportunity to view extenuating factors of the
process. Similarly, Lee’s (2008) study of preservice teachers revealed that reflective
journals functioned as a tool that allowed teachers to be more introspective regarding
their own thoughts and feelings. The use of reflective journals did support the

Figen SAHIN - Muge SEN - Caglayan DINCER Eurasian Journal of Educational Research 84 (2019) 93-114
105
participants in providing more detailed and in-depth assessments along with their
own self-evaluation.
In this study, when the participants’ reflective journals were examined regarding
content, it was recognized that the preservice teachers' problems were primarily
related to aspects of classroom management. Likewise, in related studies, classroom
management was seen as the problem most frequently addressed by teachers (Al
Hassan et al., 2012; Veenman, 1984). In this vein, Ozturk, Gangal, and Besken Ergisi
(2014) stated that prospective preschool teachers did not benefit from the classroom
management courses they had received during their undergraduate education and
that these teachers also did not associate the experiences they had learned in the
classroom to problematic behaviors. Uline et al., (2004) also reported that classroom
management was the most frequently stated concern in teachers’ reflective journals.
Similarly, classroom management was the central part of journals for the participants
of the present study.
Another important aspect derived from reflective journal writing in this study, as
Al-Hassan et al., (2012) also pointed out in their study, is the "difficulty in converting
the theoretical learned knowledge into practice". The difficulty in bridging the gap
between theory and practice was emphasized by Unver and Kursunlu (2014), who
stated that the sequencing of the undergraduate teacher training curriculum lessons
regarding theory and for applying that theory into practice was occurring at different
times. As a result, preservice teachers were not gaining sufficient opportunities for
learning and applying that learning into real-world practice within an actionable
time frame.
The use of reflective journaling provided the participant preservice teachers a
safe space in which they could express themselves through writing, as well as record
their assessment information. The participants were more accustomed to completing
verbal assessments through post-interviews, yet at the beginning of this study, they
pointed out that writing reflective journals seemed compelling. With the completion
of this research, the participants now stated they recognized the importance of
implementing reflective journal writing into their daily lives and also realized how
necessary reflective journaling was as a pedagogic tool. Similarly, Tadesse Degago
(2007) noted that preservice teachers should use reflective journals as an instrument
for expressing their concerns regarding their education, as well as addressing specific
concerns and/or problems. Another study, Francis (1995), reported that some of the
teacher candidates showed resistance to voluntary journaling in daily life due to
overwhelming course loads. Moreover, McGarr and Moody (2010) also stated that
asking students to write journals frequently could lead to a focus on quantity rather
than quality. At the beginning of this study, there were some concerns among the
participating preservice teachers. Their opinions remained positive even though they
had expressed difficulty in understanding how to write reflective journals. The
findings of Lee (2008) paralleled these findings, reporting that as preservice teachers
gained experience in journal writing, they also gained knowledge and were more
likely to favour journaling for their day-to-day writing.
Figen SAHIN - Muge SEN - Caglayan DINCER Eurasian Journal of Educational Research 84 (2019) 93-114
106
Writing a reflective journal can be considered an important tool utilized by
preservice teachers for self-evaluation during their burgeoning professional careers.
It has also been suggested that turning reflective journal writing into a habit in one’s
professional life can be important for supporting overall professional growth (Jay &
Johnson, 2002; Koc & Yildiz, 2012) and can be seen as a long-term investment in
teacher education. Preservice teachers often receive support through written and
verbal feedback from their instructors as feedback relates to the pertinent processes
of teaching (e.g., observation, planning, implementation, and evaluation), and
especially in the application of their preservice training within the classroom. One
can anticipate that in the future, journal writing should better enable preservice
teachers to develop their reflective thinking skills, and as a result, better carry out
more in-depth and critical self-assessments of their professional practices.
As discussed, reflective journal writing has been seen as a tool for stimulating
reflective thinking, and in this study, reflective journal writing was utilized in an
attempt to reveal participant preservice teachers’ thoughts and feelings regarding
their in-class practicum experiences. The use of different opportunities and different
reflective strategies (e.g., microteaching, portfolios, and video analysis), as posited by
Lee (2005), is expected to contribute to the overall improvement of awareness
through self-assessment. Moreover, collective reflection as a method for having
deeper reflection suggested by the current studies (e.g. Foong et al., 2018) also could
be utilized in this area.
This study provided an opportunity for participants during their undergraduate
studies to gain valuable information, knowledge, and experience regarding the use of
reflective journal writing. Since the reflection has become a central part of teacher
education in the countries, such as Australia, USA, and New Zealand (Han, Blank, &
Berson, 2017; Lemon & Garvis, 2014; Myers, Smith, & Tesar, 2017), preservice early
childhood teacher education programs in Turkey could more integrate reflective
activities into their courses.
This small-scale study was part of a 14 week-course, which focuses on movement
education and play, lasted one term of the academic year and reflected the
experiences of the ten preservice teachers who participated in this study. Experience
of journal writing can be extended to other courses and teaching practicum of the
students to see how preservice teachers could benefit from journal writing. In future
studies, the focus could turn to the examination of a variety of differing types of
reflective strategies. In addition to this, the studies can be conducted by more diverse
preservice teachers, such as male participants and different grade levels. Moreover,
future research studies should also address whether or not preservice teachers’ use of
reflective journal writing during their professional lives does in any way influence
their teaching development and/or does it influence how they ultimately reflect
upon their overall professional development.
Figen SAHIN - Muge SEN - Caglayan DINCER Eurasian Journal of Educational Research 84 (2019) 93-114
107
References
Akkoyunlu, B., Telli, E., Cetin, N. M.,& Daghan, G. (2016). Ogretmen egitiminde
yansitici gunluklere iliskin ogretmen adaylarinin gorusleri [Views of
prospective teachers about reflective journals on teacher education]. Turkish
Online Journal of Qualitative Inquiry, 7(4), 312-330.
Al-Hassan, O., Al-Barakat, A. , & Al-Hassan, Y. (2012). Pre-service teachers’
reflections during field experience. Journal of Education for Teaching:
International Research and Pedagogy, 38(4), 419-434. doi:
10.1080/02607476.2012.707918
Al-Karasneh, S. M. (2014). Reflective journal writing as a tool to teach aspects of
social studies. European Journal of Education, 49(3), 395-408. doi:
10.1111/ejed.12084
Bain, J. D., Mills, C., Ballantyne, R., & Packer, J. (2002). Developing reflection on
practice through journal writing: Impacts of variations in the focus and level
of feedback. Teachers and Teaching, 8(2), 171-196. doi:10.1080/13540600220127368
Beavers, E., Orange, A., & Kirkwood, D. (2017). Fostering critical and reflective
thinking in an authentic learning situation. Journal of Early Childhood Teacher
Education, 38(1), 3-18. doi: 10.1080/10901027.2016.1274693
Boud, D. (2001). Using journal writing to enhance reflective practice. New Directions
for Adult and Continuing Education, 2001(90), 9-18.
Brown, C. S., Cheddie, T. N., Horry, L. F., & Monk, J. E. (2017). Training to be an
early childhood professional: Teacher candidates’ perceptions about their
education and Training. Journal of Education and Training Studies, 5(6), 177-186.
doi: 10.11114/jets.v5i6.2308
Cengiz, C., Karatas, F. O., & Yadigaroglu, M. (2014). The investigation of pre-service
science teachers’ reflective journals. Procedia-Social and Behavioral Sciences, 116,
3297-3302. doi: 10.1016/j.sbspro.2014.01.751
Cherrington, S., & Loveridge, J. (2014). Using video to promote early childhood
teachers' thinking and reflection. Teaching and Teacher Education, 41, 42-51. doi: 10.1016/j.tate.2014.03.004
Clarà, M. (2015). What is reflection? Looking for clarity in an ambiguous notion.
Journal of Teacher Education, 66(3), 261-271. doi: 10.1177/0022487114552028
Collier, S. T. (1999). Characteristics of reflective thought during the student teaching
experience. Journal of Teacher Education, 50 (3), 173-181. doi:
10.1177/002248719905000303
Creswell, J. W. (2013). Gecerlik ve degerlendirme standartları (O. Birgin, Cev). M. Bütün,
& S. B. Demir (Eds.). Nitel arastırma yöntemleri: Beş yaklaşıma göre nitel araştırma
Figen SAHIN - Muge SEN - Caglayan DINCER Eurasian Journal of Educational Research 84 (2019) 93-114
108
ve araştırma deseni [Qualitative inquiry & research design] (ss. 243-268). Ankara:
Siyasal Kitabevi.
Cruickshank, D. R., Jenkins, D. B., & Metcalf, K. K. (2006). The act of teaching.
NewYork: McGraw-Hill Companies.
Denzin, N. K., & Lincoln, Y.S. (2000). Introduction: The discipline and practice of
qualitative research. In N.K. Denzin & Y.S. Lincoln (Eds, 2nd). Handbook of
qualitative research (pp.1-28). Thousand Oaks, CA: Sage Publications, Inc.
Dewey, J. (1933). How we think: A restatement of the relation of reflective thinking to the
educative process. Boston, MA: DC Heath & Company.
Durand, J., Hopf, M., & Nunnenmacher, S. (2016). Potentials and challenges of video-
based self-reflection for the professionalisation of early childhood education
and care professionals. Early Child Development and Care, 186(1), 23-41. doi:
10.1080/03004430.2015.1031124
Dyment, J. E., & O'Connell, T. S. (2011). Assessing the quality of reflection in student
journals: A review of the research. Teaching in Higher Education, 16(1), 81-97. doi: 10.1080/13562517.2010.507308
Edwards, A. (2001). Qualitative design and analysis. In G. M. Naughton, S. A. Rolfe,
& I. Siraj-Blatchford (Eds). Doing early childhood research: International
perspectives on theory and practice (pp. 117-135). Philadelphia, PA: Open
University Press.
Ekiz, D. (2006). Kendini ve baskalarini izleme: Sinif ogretmeni adaylarinin yansitici
gunlukleri [Self-observation and peer-observation: Reflective diaries of
primary student-teachers]. Ilkogretim Online, 5(1), 45-57.
Farrell, T. S. (2012). Reflecting on reflective practice: (Re)visiting Dewey and Schön.
TESOL Journal, 3(1), 7-16. doi: 10.1002/tesj.10
Farrell, T. S. (2013). Teacher self-awareness through journal writing. Reflective
Practice: International and Multidisciplinary Perspectives, 14(4), 465-471. doi:
10.1080/14623943.2013.806300
Foong, L., Binti, M., & Nolan, A. (2018). Individual and collective reflection:
Deepening early childhood pre-service teachers’ reflective thinking during
practicum. Australasian Journal of Early Childhood, 43(1), 43-51. doi:
10.23965/AJEC.43.1.05
Francis, D. (1995). The reflective journal: A window to preservice teachers' practical
knowledge. Teaching and Teacher Education, 11(3), 229-241. doi: 10.1016/0742-
051X(94)00031-Z
Griffiths, V. (2000). The reflective dimension in teacher education. International
Journal of Educational Research, 33(5), 539-555. doi: 10.1016/S0883-
0355(00)00033-1
Figen SAHIN - Muge SEN - Caglayan DINCER Eurasian Journal of Educational Research 84 (2019) 93-114
109
Han, S., Blank, J., & Berson, I. R. (2017). To transform or to reproduce: Critical
examination of teacher inquiry within early childhood teacher preparation.
Journal of Early Childhood Teacher Education, 38(4), 308-325. doi:
10.1080/10901027.2017.1393643
Hatton, N., & Smith, D. (1995). Reflection in teacher education: Towards definition
and implementation. Teaching and Teacher Education, 11(1), 33-49. doi:
10.1016/0742-051X(94)00012-U
Isikoglu, N. (2007). Okul oncesi ogretmen adaylarinin profesyonel gelisiminde yansitici
gunluklerin rolu [The role of reflective journals in early childhood pre-service
teachers' professional development]. Kuram ve Uygulamada Egitim Bilimleri,
7(2), 819-825.
Jay, J. K., & Johnson, K. L. (2002). Capturing complexity: A typology of reflective
practice for teacher education. Teaching and Teacher Education, 18(1), 73-85. doi: 10.1016/S0742-051X(01)00051-8
Kaasila, R., & Lauriala, A. (2012). How do pre-service teachers’ reflective processes
differ in relation to different contexts?. European Journal of Teacher Education,
35(1), 77-89. doi: 10.1080/02619768.2011.633992
Kahles, B. (2015). The power of reflective writing for early childhood teachers in
Palestine. World Journal of Education, 5(1), 94-101. doi: 10.5430/wje.v5n1p94
Koc, C., & Yildiz, H. (2012). Ogretmenlik uygulamasinin yansiticilari: Gunlukler [The
reflectors of teaching experience: Diaries]. Egitim ve Bilim, 37(164), 223-236.
Körkkö, M., Kyrö-Ämmälä, O., & Turunen, T. (2016). Professional development
through reflection in teacher education. Teaching and Teacher Education, 55,
198-206. doi: 10.1016/j.tate.2016.01.014
Kucukoglu, A., Ozan, C., & Tasgin, A. (2016). Topluma hizmet uygulamalari
dersinde yansitici gunlukler.[Examining community service-learning process
through reflective journals]. Ilkogretim Online, 15(3), 787-803. doi:
10.17051/io.2016.97012
LaBelle, J. T., & Belknap, G. (2016). Reflective journaling: fostering dispositional
development in preservice teachers. Reflective Practice, 17(2), 125-142. doi:
10.1080/14623943.2015.1134473
LaBoskey, V. K. (1993). Why reflection in teacher education?. Teacher Education
Quarterly, 20(1), 9-12.
Larrivee, B. (2008). Meeting the challenge of preparing reflective practitioners. The
New Educator, 4(2), 87-106. doi: 10.1080/15476880802014132
Lee, H. J. (2005). Understanding and assessing preservice teachers’ reflective
thinking. Teaching and Teacher Education, 21(6), 699-715. doi:
10.1016/j.tate.2005.05.007
Figen SAHIN - Muge SEN - Caglayan DINCER Eurasian Journal of Educational Research 84 (2019) 93-114
110
Lee, I. (2008). Fostering preservice reflection through response journals. Teacher
Education Quarterly, 35(1), 117-139.
Lemon, N., & Garvis, S. (2014). Encouraging reflective practice with future early
childhood teachers to support the national standards: An Australian case
study [Online]. Australasian Journal of Early Childhood, 39 (4), 89-94.
Lincoln, Y. & Guba, E. G. (1985). Naturalistic inquiry. Beverly Hills, CA: SAGE
McGarr, O., & Moody, J. (2010). Scaffolding or stifling? The influence of journal
requirements on students’ engagement in reflective practice. Reflective Practice,
11(5), 579-591. doi: 10.1080/14623943.2010.516968
Merriam, S.B. (1998). Qualitative research and case study applications in education. San
Francisco, CA: Jossey-Bass Publishers.
Myers, C. Y., Smith, K. A., & Tesar, M. (2017). Diffracting mandates for reflective
practices in teacher education and development: Multiple readings from
Australia, New Zealand, and the United States. Journal of Early Childhood
Teacher Education, 38(4), 279-292. doi: 10.1080/10901027.2017.1389788
National Association for the Education of Young Children. (2009). NAEYC Standards for Early Childhood Professional Preparation Programs. Retrieved from
https://www.naeyc.org/sites/default/files/globallyshared/downloads/PDFs/resources/p
osition-statements/2009%20Professional%20Prep%20stdsRevised%204_12.pdf
National Council for Accreditation of Teacher Education. (2008). Professional standards
for the accreditation of teacher preparation institutions. Washington, DC: National
Council for Accreditation of Teacher Education. Retrieved from
http://www.ncate.org/~/media/Files/caep/accreditation-resources/ncate-
standards-2008.pdf
O'Connell, T., & Dyment, J. (2011). Health and physical education pre-service teacher
perceptions of journals as a reflective tool in experience-based learning.
European Physical Education Review, 17(2), 135-151. doi:
10.1177/1356336X11413181
Oakley, G., Pegrum, M., & Johnston, S. (2014). Introducing e-portfolios to pre-service
teachers as tools for reflection and growth: Lessons learnt. Asia-Pacific Journal
of Teacher Education, 42(1), 36-50. doi: 10.1080/1359866X.2013.854860
Ozturk, Y., Gangal, M, & Besken Ergisi, M, (2014). Okul oncesi ogretmen adaylarinin
egitimlerinin sinif yonetimi ve stratejileri uzerindeki etkisine iliskin
goruslerinin incelenmesi [The impact of teaching education program on pre-
service teachers’ classroom management views and classroom management
strategies]. Erzincan Universitesi Egitim Fakültesi Dergisi, 16(1), 224-238.
Parikh, S. B., Janson, C., & Singleton, T. (2012). Video journaling as a method of
reflective practice. Counselor Education and Supervision, 51(1), 33-49. doi:
10.1002/j.1556-6978.2012.00003.x
Figen SAHIN - Muge SEN - Caglayan DINCER Eurasian Journal of Educational Research 84 (2019) 93-114
111
Patton, M. Q. (1990) Qualitative evaluation and research methods (2nd ed.). Newbury
Park, CA: Sage.
Pavlovich, K. (2007). The development of reflective practice through student journals.
Higher Education Research & Development, 26 (3), 281-295. doi:
10.1080/07294360701494302
Pedro, J. Y. (2005). Reflection in teacher education: exploring pre-service teachers’
meanings of reflective practice. Reflective Practice, 6(1), 49-66. doi:
10.1080/1462394042000326860
Riojas-Cortez, M., Alanís, I., & Flores, B. B. (2013). Early childhood teachers
reconstruct beliefs and practices through reflexive action. Journal of Early
Childhood Teacher Education, 34(1), 36-45. doi: 10.1080/10901027.2013.758536
Russell, T. (2005). Can reflective practice be taught?. Reflective Practice, 6(2), 199-204. doi: 10.1080/14623940500105833
Sahin, F. (2009). The importance of reflective thinking and reflective journals: A
qualitative study of experiences of teacher candidates in early childhood
classrooms. In H. Asutay & E. Bayir (Eds.), 5th International Balkan Education
and Science Congress: Vol. 2. Education in Balkans Today (pp. 669-671). Edirne:
Trakya University Rectorship.
Schön, D. A. (1987). Educating the reflective practitioner: Toward a new design for teaching
and learning in the professions. San Fransisco, CA: Jossey-Bass.
Strauss, A., & Corbin. J. (1990). Basics of qualitative research: Grounded theory
procedures and techniques. London: Sage.
Tadesse Degago, A. (2007). Using reflective journals to enhance impoverished
practicum placements: A case in teacher education in Ethiopia. Teaching
Education, 18(4), 343-356. doi: 10.1080/10476210701687633
Thomas, S., & Packer, D. S. (2013). A reflective teaching road map for pre-service and
novice early childhood educators. International Journal of Early Childhood
Special Education, 5(1), 1-14. Retrieved from
https://www.intjecse.net/index.php/ijecse/article/view/69
Tripp, T., & Rich, P. (2012). Using video to analyze one's own teaching. British Journal
of Educational Technology, 43(4), 678-704. doi: 10.1111/j.1467-8535.2011.01234.x
Uline, C., Wilson, J. D., & Cordry, S. (2004). Reflective journals: A valuable tool for
teacher preparation. Education, 124(3), 456-461.
Unver, G., & Kursunlu, E. (2014). Okul oncesi ogretmen egitiminde kuram uygulama
baglantısı [Connecting the theory and practice in preschool teacher
education]. Uluslararası Egitim Programları ve Ogretim Calismalari Dergisi, 4(7),
39-54. Retrieved from
http://www.ijocis.com/index.php/ijocis/article/view/13

Figen SAHIN - Muge SEN - Caglayan DINCER Eurasian Journal of Educational Research 84 (2019) 93-114
112
Valli, L. (1997). Listening to other voices: A description of teacher reflection in the
United States. Peabody Journal of Education, 72(1), 67-88.
Vaughn, M., Parsons, S. A., Kologi, S., & Saul, M. (2014). Action research as a
reflective tool: A multiple case study of eight rural educators’ understandings
of instructional practice. Reflective Practice, 15(5), 634-650. doi:
10.1080/14623943.2014.900030
Veenman, S. (1984). Perceived problems of beginning teachers. Review of Educational
Research, 54(2), 143-178.
Ward, J. R., & McCotter, S. S. (2004). Reflection as a visible outcome for preservice
teachers. Teaching and Teacher Education, 20(3), 243-257. doi:
10.1016/j.tate.2004.02.004
Yost, D. S., Sentner, S. M., & Forlenza-Bailey, A. (2000). An examination of the
construct of critical reflection: Implications for teacher education
programming in the 21st century. Journal of Teacher Education, 51(1), 39-49. doi: 10.1177/002248710005100105
Zeichner, K. M., & Liston, D. P. (1996). Reflective teaching: An introduction. Mahwah,
NJ: L.Erlbaum.
Okul Öncesi Öğretmen Adaylarının Yansıtıcı Günlük Yazma Deneyimleri
Atıf:
Sahin, F., Sen, M., & Dincer, C. (2019). Early childhood preservice teachers’
experiences with reflective journal writing. Eurasian Journal of Educational
Research, 84, 93-114, DOI: 10.14689/ejer.2019.84.5
Özet
Problem Durumu: Yansıtıcı günlük yazma son zamanlarda öğretmen eğitiminde ele
alınan konular arasında yer almakta ve öğretmen adaylarının uygulamalarında bir
yansıtma aracı olarak kullanılmaktadır. Yansıtmanın karmaşık bir terim olduğu ve
alan yazında çeşitli şekillerde kavramsallaştırıldığı görülmektedir. Yansıtıcı
öğretmenlerin sadece önceden planlanan uygulamaları gerçekleştiren değil,
uygulamalar üzerinde düşünen, problem çözen, etkin bireyler oldukları
belirtilmektedir. Yapılan çalışmalar özellikle yansıtmanın rolü, sınıflandırması ve
yansıtıcı düşünmeyi geliştiren stratejilere odaklanmaktadır. Yansıtıcı düşünme
becerilerinin gelişimine katkı sağlayacak uygulamalar arasında yansıtıcı günlük
yazma, video kaydı alma, portfolyo/e-portfolyo, eylem araştırması vb. stratejiler
gösterilmektedir. İlgili araştırmalar yansıtıcı günlük yazmanın öğretmenlerin kendi
uygulamaları konusunda yansıtma yapmalarını, öğrenme ve öğretmenin karmaşık

Figen SAHIN - Muge SEN - Caglayan DINCER Eurasian Journal of Educational Research 84 (2019) 93-114
113
yapısını anlamalarına ve öz-farkındalık ve profesyonel gelişime katkılarını
göstermektedir. Her ne kadar yansıtıcı günlük yazma ile ilgili alan yazında
çalışmalar yer almasına rağmen, özellikle okul öncesi öğretmen adayları ile ilgili
yapılan çalışmalar sınırlı sayıdadır.
Araştırmanın Amacı: Bu çalışmanın amacı; okul öncesi öğretmen adaylarının yansıtıcı
günlük yazma deneyimlerini daha derinlemesine anlamaktır. Bu doğrultuda
öğretmen adaylarının yansıtıcı günlükler konusundaki duygu ve düşünceleri ile
yansıtıcı günlüklerinin içeriğinin incelenmesi amaçlanmıştır.
Araştırmanın Yöntemi: Bu çalışmada nitel araştırma yöntemlerinden yararlanılmıştır.
Çalışmaya amaçsal örneklem yöntemiyle seçilen, dört yıllık okul öncesi öğretmenliği
lisans programına devam eden, gönüllülük ilkesi ile araştırmaya katılım gösteren ve
süreçte “Beden Eğitimi ve Oyun Öğretimi” dersini alan, yaşları 21 ile 25 arasında
değişen on kadın öğretmen adayı dahil edilmiştir. Çalışmada veri toplamak için;
demografik bilgi formu, yarı yapılandırılmış görüşmeler, haftalık olarak
gerçekleştirilen uygulamalara yönelik etkinlik planları ve yazılan yansıtıcı
günlüklerden yararlanılmıştır. Veri analizinde tümevarımsal bir yaklaşım
benimsenmiştir. Nitel araştırma geleneğine bağlı olarak alanyazında önerilen
çalışmanın güvenirliğini arttırmak amacıyla detaylı betimleme ve uzun süreli katılım
ve çeşitleme stratejileri kullanılmıştır. Katılımcıların yansıtıcı günlüklerle ilgili
deneyimlerini içeren ayrıntılı betimlemelere yer verilmiştir. Çeşitlemeyi sağlamada
çoklu araştırmacı ve çoklu yöntemler kullanılmıştır. Çalışma, çoklu araştırmacı
açısından erken çocukluk eğitimi alanında deneyimli üç öğretim elemanı tarafından
yürütülmüştür. Çoklu yöntemler açısından ise; yarı yapılandırılmış görüşmeler ve
doküman analizi yoluyla sağlanmıştır.
Araştırmanın Bulguları: Araştırma bulguları araştırma sorularının da temelini
oluşturan iki odak noktasında sunulmuştur. Bunların ilki yansıtıcı günlüklerin rolü,
ikincisi ise yansıtıcı günlüklerin içeriğidir.Yansıtıcı günlüğün rolü analiz edildiğinde;
içgörü elde etmek, detaylı değerlendirme ve geleceğe yönelik strateji geliştirme
temalarının ortaya çıktığı görülmüştür. Bu çalışmanın katılımcıları olan öğretmen
adayları günlük yazmanın onların uygulamalar sırasında yaptığı hataları
farketmelerine ve güçlü ve zayıf yanlarını değerlendirmeleri için içgörü
kazanmalarına destek olduğunu belirtmişlerdir. Yansıtıcı günlük yazma alanyazında
önerildiği gibi, öğretmen adayları için bir farkındalık aracı olarak işlev görmüştür.
Katılımcılar ayrıca yansıtıcı günlüklerin normalde yaptıkları üç boyutlu
değerlendirmeye duygu boyutunu da eklediğini belirtmişlerdir. Son olarak,
katılımcılar yansıtıcı günlük yazmanın uygulanacak öğretim stratejilerin
belirlenmesinde ve değerlendirmesinde önemli bir rol oynadığını ve özellikle
hatırlatma işlevi gördüğünü vurgulamışlardır. Yansıtıcı günlüklere odaklanan bazı
araştırmalarda, günlük yazmanın gelecek öğretmenlik deneyimlerini şekillendirecek
yönde desteklediğini göstermektedir. Yansıtıcı günlüklerin içeriği analiz edildiğinde
ise bulguların; gerçek sınıf ortamı ile karşılaşma ve alandan olumlu deneyimler
edinme şeklinde iki tema olarak belirdiğini ortaya koymaktadır. Çalışmanın
katılımcıları günlüklerinde gerçek sınıf ortamı ile karşılaşma ile ilgili durumlara yer
vermiştir. Özellikle gerçek sınıf ortamında yaşadıkları sınıf yönetimi ile ilgili
Figen SAHIN - Muge SEN - Caglayan DINCER Eurasian Journal of Educational Research 84 (2019) 93-114
114
zorluklar ve kuramsal bilgiyi uygulamaya aktaramama ile ilgili endişeleri ele
almışlardır. Alanyazındaki araştırmalarda sınıf yönetiminin en çok belirtilen problem
olmasının yanısıra yansıtıcı günlüklerde de en sık yansıtılan endişe olduğu
bulunmuştur. Öğretmen adaylarının kuramsal bilgiyi uygulamaya aktarma sorunları
olduğu da belirtilmektedir. İçerik açısından incelemede yansıtıcı günlüklerinde
öğretmen adayların elde ettikleri olumlu deneyimlere de yer verdikleri saptanmıştır.
Araştırmanın Sonuçları ve Önerileri: Bu çalışma göstermektedir ki yansıtıcı günlük
yazma, okul öncesi öğretmen adayları için özdeğerlendirme ve profesyonel gelişimde
önemli bir araç olarak ele alınabilir. Bundan sonra yapılacak çalışmalarda öğretmenin
profesyonel gelişiminde yansıtıcı günlük yazmanın rolüne ve özellikle farklı yansıtıcı
stratejilerin öğretmen eğitiminde önemine odaklanabilir.
Anahtar Kelimeler: Yansıtıcı Günlükler, Yansıtıcı Uygulamalar, Okul Öncesi,
Öğretmen Eğitimi

Eurasian Journal of Educational Research 84 (2019) 115-134 Eurasian Journal of Educational Research
www.ejer.com.tr Comparison of Results Obtained from Logistic Regression, CHAID Analysis and Decision Tree Methods* Gokhan AKSU1, Cigdem REYHANLIOGLU KECEOGLU2
A R T I C L E I N F O A B S T R A C T
Article History: Purpose: In this study, Logistic Regression (LR), CHAID (Chi-squared Automatic Interaction Detection) analysis and data mining methods are used to investigate the variables that predict the mathematics success of the students. Research Methods: In this study, a quantitative research design was employed during the data collection and the analysis phases. Findings: The findings obtained in this study showed that the variables, which had significant effects on the mathematical success of the students in each method, differ from each other. Although the independent variables with a significant effect on the dependent variable were different according to different methods, the findings indicated that the importance order of the variables did not change according to the method used. In this study, the correct classification ratios obtained by the class concerning PISA mathematics literacy differed by different methods.
Received: 31 Jul. 2018 Received in revised form: 01 May 2019 Accepted: 20 Aug. 2019 DOI: 10.14689/ejer.2019.84.6
Keywords CHAID Analysis, Logistic Regression Analysis, Data Mining, PISA
Implications for Research and Practice: CHAID analysis and REPTree algorithm may be an alternative for one another in the studies that aimed to classify individuals concerning their success. However, LR analysis should not be considered as an alternative method since it will provide significantly different results compared to the other two methods.
© 2019 Ani Publishing Ltd. All rights reserved
*This study was partly presented at the 5th International Eurasian Educational Research Congress in Antalya, 2 – 5 May, 2018 1 Aydın Adnan Menderes University, TURKEY, ORCID: 0000-0003-2563-6112 2 Gaziantep College Foundation Private Schools, TURKEY, ORCID: 0000-0002-6168-6662
116 Gokhan AKSU – Cigdem REYHANLIOGLU KECEOGLUEurasian Journal of Educational Research 84 (2019) 115-134
Introduction
Many contexts are considered to direct the education policies of the countries. Policymakers around the world use the results of international practices to compare the knowledge and skill levels of the pupils in their own countries with the knowledge and skill levels of the pupils in other countries to set standards to raise the level of education (such as average scores achieved by countries, countries' educational outcomes and their capacity to achieve equality in education opportunities at the highest level) and to determine the strengths and weaknesses of education systems (International Student Assessment Program [PISA], 2015). The data obtained from international examinations, such as the International Student Assessment Program (PISA) applied by the Organization for Economic Co-operation and Development (OECD) to the 15-year-old students, and the International Mathematics and Science Trends Survey (TIMSS) applied to students at the fourth and eighth grade by the International Education Achievement Assessment Organization (IEA), are extremely important for the direction of the education policies of the countries (International Mathematics and Science Trends Survey [TIMSS], 2015). In these applications, which are realized with the participation of different countries, achievement tests, and various questionnaires, are used to gather information about students' performances in science and mathematics, education systems, curriculum, student characteristics, characteristics of teachers and schools (TIMSS, 2015). Thanks to this information, countries are able to evaluate their educational processes according to an international perspective.
The findings obtained from international examinations, which play an important role in shaping the countries' educational policies, are derived from a large-scale database where variables in different areas are measured. Very large-scale data and large-scale databases in different areas can be considered as a data mine, including valuable data. From this data mine, which has a complex structure, to generate meaningful information that is not known beforehand, process management with different operations is required. This process management takes place with data mining. Data mining performs this process using a computer, machine learning, database or data warehouse management, mathematical algorithms and statistical techniques (Albayrak & Koltan-Yılmaz, 2009). Data mining is basically defined as the use of software techniques for accessing useful information through the relationships or patterns within the large data sets (Can, Özdiland Yılmaz, 2018). Thanks to data mining software and techniques, large scale data can be decomposed, and useful information can be revealed.
There are many processing steps that must be performed in the data mining process. Larose and Larose (2014) emphasize that the data mining process takes place in five stages as follows: definition of the task, recognition of data, preparation of data, modelling and evaluation. The most troublesome of these stages are the stages of recognition and preparation of the data (Özkekeş, 2003). The data obtained from international applications, such as PISA, can be considered as data that are complex, and therefore, suitable for arrangement and modeling with data mining stages. Using data mining methods, maximum information can be obtained about the independent variables predicting the dependent variable on the complex data obtained from the applications that direct the educational policies of the countries.
Gokhan AKSU – Cigdem REYHANLIOGLU KECEOGLUEurasian Journal of Educational Research 84 (2019) 115-134
117
Determining independent (predictive) variables that influence the dependent
variable is one of the main focuses of scientific research. In these studies conducted for this purpose, various methods are used to determine predictor variables that have relationships with the dependent variable. The common feature of these methods is to test the significance of the effects of independent variables on the dependent variable. The methods used have different characteristics, as well as their common characteristics. The most important of these are the assumptions required by the methods.
The methods are generally divided into parametric and non-parametric methods concerning assumptions that must be met to be applied. In cases where parametric conditions do not occur (such as quantitative variables come from a multivariate normal distribution assumption is not established, homogeneity of variance/covariance matrices is not established), it has been a great convenience for researchers to develop and use nonparametric methods, which can be used for the same purpose with a parametric method (Baştürk, 2016). However, if the need to make a choice among these alternative nonparametric methods arises, it is necessary to compare the methods to decide which method to be used concerning the accuracy of the results. The comparison studies performed for this purpose are important concerning ensuring the validity of the decision. Thus, it has great importance to determine the method which is based on regression analysis is used for estimating the dependent variable with the help of independent variables. In this way, researchers will contribute to science using the method that produces the most accurate and most consistent results.
Another feature that separates the methods used is the type of data that the method can be applied to. Some of the statistical methods can only be applied to continuous data, while some can also be applied to categorical data. Categorical data analysis is a method commonly used in educational applications (Azen & Walker, 2011). Although the results of the measurement are obtained as continuous scores by accepting measurement tools used to determine the academic achievement of the students as equal intervals on the scale level, the success scores in the decision-making process are converted into categorical data in the form successful/unsuccessful according to a certain criterion score (Baştürk, 2016). Thus, the students are classified as successful/unsuccessful according to their achievement score.
Although a criterion score is often used in determining student achievement, there are many factors affecting student achievement. At this point, statistics is concerned with identifying those who have a significant impact on these factors, and these factors need to be considered in the process of assessing student achievement.
Statistical methods can be classified as descriptive and predictive methods according to the intended purpose (Tütek & Gümüşoğlu, 2008). In general, predictive methods are used to determine the factors affecting success score methods (Zuckerman & Albrecht, 2001). One of these methods is the logistic regression analysis. Logistic regression analysis can be considered as a special case of regression analysis methods (Peng, Lee & Ingersoll, 2002). The regression analysis is a strong statistical method which aims to explain the relationship between two variables, one of the two

118 Gokhan AKSU – Cigdem REYHANLIOGLU KECEOGLUEurasian Journal of Educational Research 84 (2019) 115-134
or more variables are taken as dependent and the other as independent variables using a mathematical equation (Çokluk, 2012).
The strong assumptions of linear regression analysis do not allow to be implemented when its parametric conditions are not available. In such cases, regression-based, non-parametric multivariate statistical methods are used. One of the methods that can be used in cases where the dependent variable is categorical or classified and an assumption is not required for the distribution of independent variables is Logistic Regression analysis (Mertler & Vannatta, 2005; Tabachnick & Fidell, 2001). Logistic regression analysis has an important place in categorical data analysis concerning requiring fewer assumptions than methods that have regression logic and used to determine predictive variables (Kılıç, 2000). In the application phase of the method, users important have advantages because it requires fewer assumptions (Park, 2013). Besides, the results of the model can be interpreted easily. One of the methods that can give similar results with regression analysis and do not take into account the assumptions of regression analysis is the CHAID analysis method. The method can use algorithms, user-defined rules, criteria specified via an interactive graphical user interface, or a combination of these methods. This enables users to try various predictors and splitting criteria in combination with almost all the functions of automatic tree building (Nisbet, Miner & Yale, 2017). Thanks to the tree diagrams, the independent variables predicting the dependent variable and the importance levels of these variables can be seen (DíazPérez & Bethencourt-Cejas, 2016).
As a result, the results of two methods, which are nonparametric, logistic regression analysis and CHAID analysis methods, can be used to determine the factors that have a significant effect on student achievement as a dependent variable. The common feature of all three methods is to focus on determining the independent variables that have a significant effect on the dependent variable. However, the most basic feature that separates these three methods is the learning algorithm that runs in the background. The CHAID algorithm, proposed by Kaas in 1980, was formed by combining the predictive variable in the category pairs with no significant difference (SPSS, 1999). REPTree algorithm is used in data mining. In data mining, there is the C4.5 algorithm, which is called the statistical classifier (Witten and Fransk, 2005). An extension of the C4.5 algorithm is REPTree algorithm) is used to construct a decision tree (Quinlan, 1993). This study aims to determine the independent variables which are thought to have a significant effect on mathematics achievement and to reveal the order of importance of these variables. Moreover, another focus of the study is that whether the order of importance of variables differs according to the methods used. In this study, it was also investigated how the students were categorized according to variables of their interest, attitude, motivation, perception, self-efficacy, anxiety and working discipline towards mathematics course. In this way, it is thought that researchers working in national and international fields will obtain more precise and more consistent measurement results by working with the best data analysis method they need in the analysis stage. It is of great importance to determine how similar or different results logistic regression analysis, which is frequently used in estimating the categorical dependent variable, and CHAID analysis and data mining methods, which have been used more recently, will show from the same data set. There are studies comparing these methods in the literature (Antipov & Pokryshevskaya, 2009; Şata & Çakan, 2018; Rudd &
Gokhan AKSU – Cigdem REYHANLIOGLU KECEOGLUEurasian Journal of Educational Research 84 (2019) 115-134
119
Priestley, 2017). Some researchers have proposed CHAID as an aid for better specifying and interpreting a logit model. In this study, the CHAID, data mining approach and logistic regression were used for finding whether independent variables significantly have a lower or higher effect on the dependent variable according to the used analysis method. This approach is employed for diagnostic purposes, as well as for improving the initial model. We demonstrated that the proposed method could be used for splitting the dataset into several segments, followed by building separate models for each segment, which led to a significant increase in classification accuracy both on training and test datasets and, therefore, enhanced logistic regression.
The problem statement of the research within the framework of specified purposes is as follows: "Does statistical significance of the features, such as the students’ interest, attitude, motivation, perception, self-efficacy, anxiety and work discipline differ according to the method used?" In accordance with the determined basic problem statement, the following questions were raised within the scope of this research:
1. Do the significance levels of the independent variables differ according to the method used?
2. Do the accurate classification rates of independent variables differ according to the method used?
3. Is the order of importance of the independent variables in classifying the students concerning mathematics achievement differ according to the method used?
Method
Research Design
In this study, logistic regression (LR), CHAID analysis and data mining methods were used to investigate the predictors of student achievement. This study aimed that the relationship between two or more variables is examined in any way without any interference from these variables. Due to examining the relationship between variables, this study is correlational research (Büyüköztürk, Çakmak, Akgün, Karadeniz and Demirel, 2016).
Research Sample
The data used in this study were obtained with the help of the responses, which were about the subscales of interests, attitudes, self-efficacy, perception, motivation, anxiety and study discipline of students who took part in the PISA 2012 Student Questionnaire. The data file used in the study was obtained from the official OECD website, http://www.oecd.org/pisa/pisaproducts/pisa2012database-downloadabledata.htm. The data file in the format of the text document was converted to the appropriate format for analysis in SPSS program using the syntax.
The universe of the study consisted of 4818 students participating in PISA 2012 student survey and was determined by a stratified random sampling method. However, it was decided that the missing data should be excluded from the analysis because the loss data rate was high for the seven different affective features used in this study and the missing data were not randomly distributed, which may lead to bias in the statistical analysis results (Garson, 2015; Groves, 2006; Tabachnick & Fidell,
120 Gokhan AKSU – Cigdem REYHANLIOGLU KECEOGLUEurasian Journal of Educational Research 84 (2019) 115-134
2014). After the missing data analysis, the results of this study were obtained from the data collected from 1000 participants using systematic sampling from the universe. In the study, a systematic sampling method was used, which is one of the probabilistic sampling methods given that the boundaries of the universe are certain and the universe is relatively large (Cohen, Manion & Morrison, 2007). The population can be represented with a high degree by a systematic sampling method (Koç Başaran, 2017).
Data Analysis
The independent variables of this study consisted of the variables which are investigated whether they have a significant effect on mathematics achievement. In the variable selection stage, the findings of the study conducted by Aksu and Güzeller (2016) were used. In the study, it was stated that PISA 2012 dataset consisted of seven different sub-scales to determine the affective qualities of the students. These are the variables of the students' interest in mathematics, mathematics motivation, attitude towards mathematics, self-efficacy in mathematics, math anxiety, mathematics study discipline and student's math perception. The mathematical achievement in which the effects of independent variables are investigated is the dependent variable of the study.
For the analysis of the data, dependent and independent variables were first analyzed according to Binary LR analysis, and consequently, the correct classification ratio was determined according to the mathematics achievement of the students with independent variables, which had a significant effect on mathematics achievement. However, in the first stage, the assumptions, which are required for LR analysis, were tested. According to Tabacknick and Fidell (2001), there are four assumptions that are to be tested for LR analysis. First, binary logistic regression requires the dependent variable to be binary, and ordinal logistic regression requires the dependent variable to be ordinal. In this study, dependent variables had an ordinal scale. Second, logistic regression requires observations to be independent of each other. In other words, the observations should not come from repeated measurements or matched data. In this study, the observations, which come from repeated measurements or matched data, were not determined. Third, logistic regression requires there to be little or no multicollinearity among the independent variables, which means that the independent variables should not be too highly correlated with each other. In this study, the Pearson Correlation between independent variables was under the critic level (<0,70) and was not statistically significant. Fourth, logistic regression assumes the linearity of independent variables and log odds. Although this analysis does not require the dependent and independent variables to be related linearly, in this study, the linear relationship between independent variables was specified clearly via a scatter chart. Finally, logistic regression typically requires a large sample size. A general guideline is that you need a minimum of 10 cases with the least frequent outcome for each independent variable in your model (Bush, 2015). In this study, more than 10 cases were used for each independent variable. After the assumptions were tested, dependent and independent variables were analyzed according to Binary LR analysis.
In the second stage, the same variables and the correct classification ratio were analyzed using CHAID analysis. As a result of CHAID analysis, a decision tree was
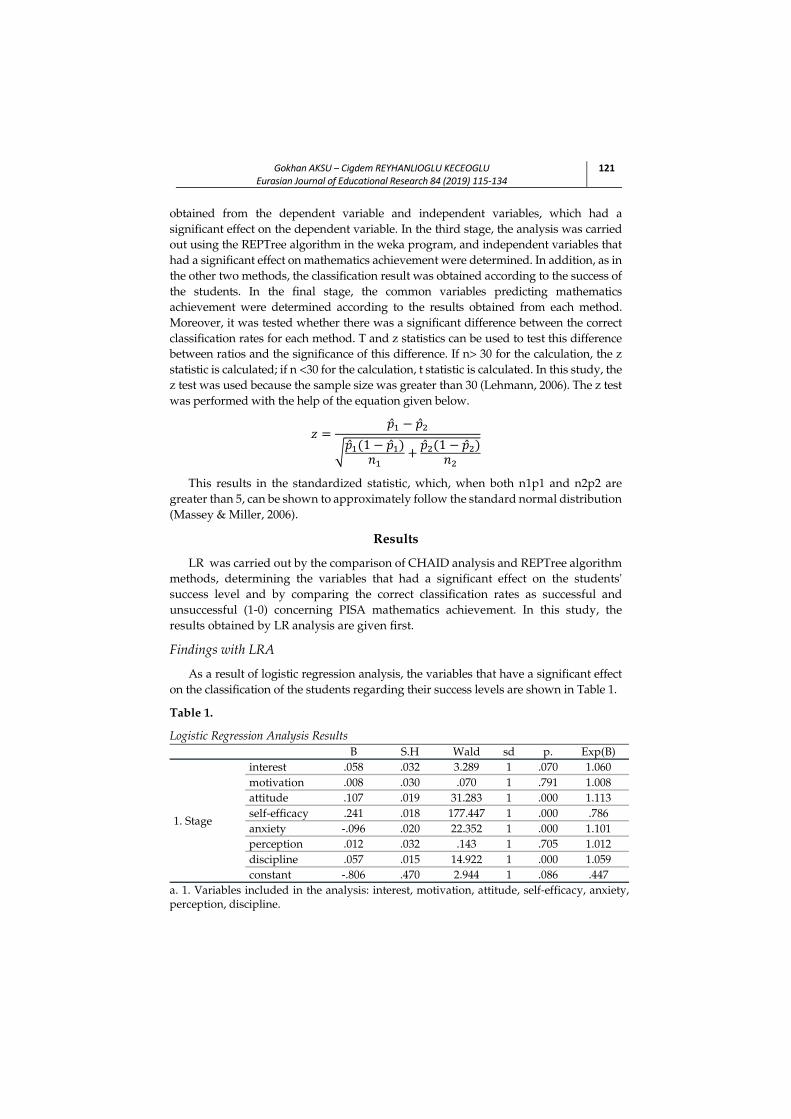
Gokhan AKSU – Cigdem REYHANLIOGLU KECEOGLUEurasian Journal of Educational Research 84 (2019) 115-134
121
obtained from the dependent variable and independent variables, which had a significant effect on the dependent variable. In the third stage, the analysis was carried out using the REPTree algorithm in the weka program, and independent variables that had a significant effect on mathematics achievement were determined. In addition, as in the other two methods, the classification result was obtained according to the success of the students. In the final stage, the common variables predicting mathematics achievement were determined according to the results obtained from each method. Moreover, it was tested whether there was a significant difference between the correct classification rates for each method. T and z statistics can be used to test this difference between ratios and the significance of this difference. If n> 30 for the calculation, the z statistic is calculated; if n <30 for the calculation, t statistic is calculated. In this study, the z test was used because the sample size was greater than 30 (Lehmann, 2006). The z test was performed with the help of the equation given below. 𝑧 = �� − ���� (1 − �� )𝑛 + �� (1 − �� )𝑛
This results in the standardized statistic, which, when both n1p1 and n2p2 are greater than 5, can be shown to approximately follow the standard normal distribution (Massey & Miller, 2006).
Results
LR was carried out by the comparison of CHAID analysis and REPTree algorithm methods, determining the variables that had a significant effect on the students' success level and by comparing the correct classification rates as successful and unsuccessful (1-0) concerning PISA mathematics achievement. In this study, the results obtained by LR analysis are given first.
Findings with LRA
As a result of logistic regression analysis, the variables that have a significant effect on the classification of the students regarding their success levels are shown in Table 1.
Table 1.
Logistic Regression Analysis Results B S.H Wald sd p. Exp(B)
1. Stage
interest .058 .032 3.289 1 .070 1.060 motivation .008 .030 .070 1 .791 1.008 attitude .107 .019 31.283 1 .000 1.113 self-efficacy .241 .018 177.447 1 .000 .786 anxiety -.096 .020 22.352 1 .000 1.101 perception .012 .032 .143 1 .705 1.012 discipline .057 .015 14.922 1 .000 1.059 constant -.806 .470 2.944 1 .086 .447
a. 1. Variables included in the analysis: interest, motivation, attitude, self-efficacy, anxiety, perception, discipline.
122 Gokhan AKSU – Cigdem REYHANLIOGLU KECEOGLUEurasian Journal of Educational Research 84 (2019) 115-134
In the evaluation of students remained left or pass an average of the obtained success
scores was taken (��=449.00), and this value was determined as the cutting value. The students over the average were categorized as 1, while those below the average were categorized as 0. When the Table 1 is examined, it is observed that the variables of attitude (β = 0,107, p <.01), self-efficacy (β = -0,241, p <.01), anxiety (β = 0,096, p <.01) and study discipline (β = 0.057, p <.01) had a significant effect in the classifying student performance as successful and unsuccessful concerning total scores. β values given in the table are the values to be used in an equation where the probability of taking a sample in a given category is calculated. According to this, if students have high self-efficacy, attitudes and discipline scores, they would be more likely to be successful. According to the Exp (β), also known as Odds Ratio, self-efficacy (0.79), attitude (1.11), anxiety (1.10) and working discipline (1.06) show the values that are likely to be successful concerning science literacy in PISA. The significance levels of the independent variables on the dependent variables were self-efficacy (177,44), attitude (31,28), anxiety (22,35) and working discipline (14,92), respectively.
In the logistic regression analysis, while the SPSS package program classifies individuals as passed/failed as a result of an achievement test, it creates a classification percentage for a predicted variable by accepting all students as 'passed' or 'failed' in the initial model. Then, the predictive variables are added to the initial model, and the actual classification percentage is obtained concerning the success of the individuals. According to this, while the correct classification rate of the students was 53,50% in the initial model, this ratio was determined as 71,20% by including the variables in the model. Regarding the total variance explained of the model, Cox & Snell R2 value was calculated as..20, and Nagelkerke R2 was calculated as .,27. Accordingly, 27% of the variability in mathematics literacy is explained by the variables added to the model. As a result of the Omnibus test, it was determined that the first model obtained by the inclusion of both the initial model and the variables in the model was statistically significant (χ2=31028, sd=7, p<.01).
Findings by CHAID Analysis
As a result of logistic regression analysis, the results which were dependent on important statistics for independent variables that had a significant effect on the dependent variable were obtained. In CHAID analysis, the predictive variables that are significant can be seen through the nodes in the decision tree branching process. The variables that appear in the nodes of the tree from top to bottom provide information about the order of importance of the variable, respectively. Accordingly, the decision tree obtained by CHAID analysis is shown in Figure 1.
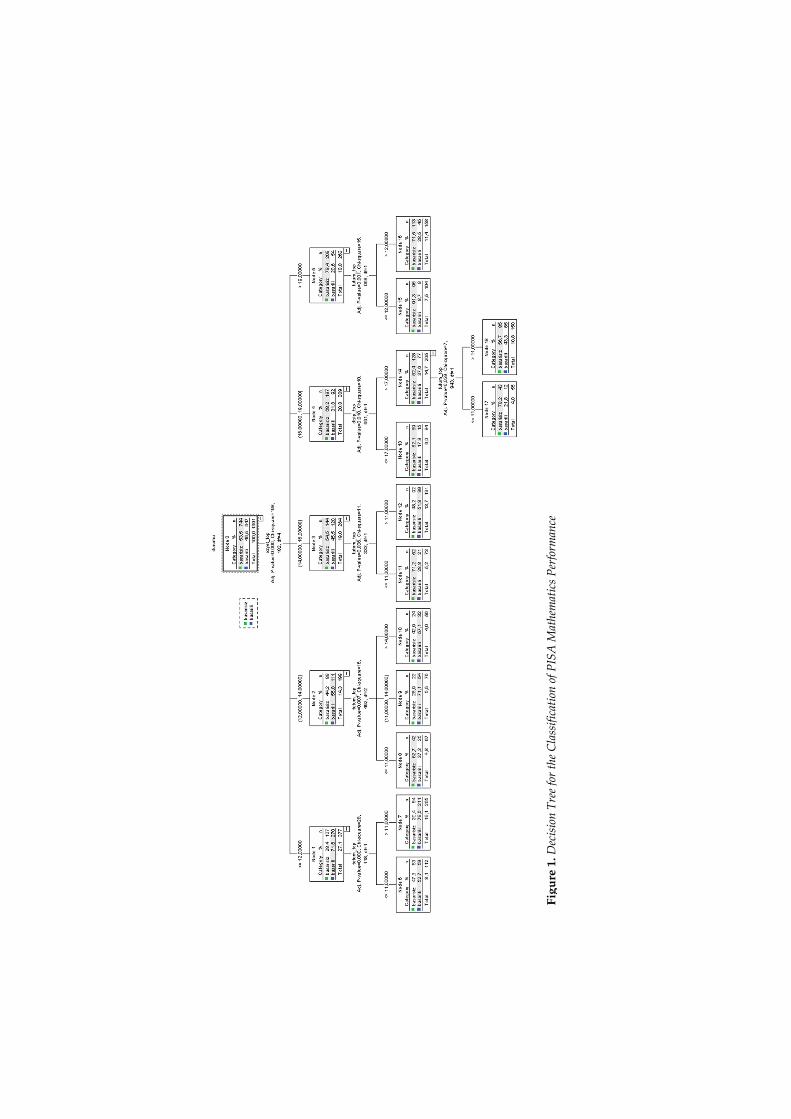
Figu
re 1
. Dec
isio
n T
ree
for
the
Cla
ssifi
cati
on o
f PIS
A M
athe
mat
ics
Per
form
ance
124 Gokhan AKSU – Cigdem REYHANLIOGLU KECEOGLUEurasian Journal of Educational Research 84 (2019) 115-134
When Figure 1 is examined, the findings showed that mathematics self-efficacy
was the best predictor of PISA literacy (χ2=198.00, df=4; p<.01). The most effective variable in a sub-branch of the tree was the attitude for 4 nodes while the most effective variable for the remaining node number 4 was the study discipline (χ2=10.00, df=1; p<.05). On the branching obtained in the third stage of the decision tree, the most effective variable was the attitude (χ2=7.00, df=1; p<.05). In addition to this, the amount of information gain (gain) in each node is shown in Table 2.
Table 2.
Knowledge Gain Quantities on Nodes in CHAID Analysis
Node Node Amount of Gain Response
ratio (%) Indices
(%) N Percentage N Percentage
7 265 19,10 211 32,60 79,60 171,20
9 76 5,50 54 8,30 71,10 152,80
10 56 4,00 32 4,90 57,10 122,90
6 112 8,10 59 9,10 52,70 113,30
12 191 13,70 99 15,30 51,80 111,40
18 150 10,80 65 10,00 43,30 93,20
8 67 4,80 25 3,90 37,30 80,20
11 73 5,20 21 3,20 28,80 61,80
16 158 11,40 45 7,00 28,50 61,20
17 55 4,00 12 1,90 21,80 46,90
13 84 6,00 15 2,30 17,90 38,40
15 104 7,50 9 1,40 8,70 18,60
When Table 2 is examined, it was seen that most information was obtained from node 7. In this node where 211 students were successful, and 54 of them were classified as unsuccessful, while the correct classification rate was 7960%, the overall success rate was determined as 19,0%. Based on these values, the amount of information gain obtained from node 7 was calculated as 32,60%, and it was observed that self-efficacy and attitude variables are effective in making classification, respectively. It was seen that the second node that provided the most information was the node number 12, which had the correct classification rate of 51,80%, by classifying 99 of 191 students correctly. Plus, the self-efficacy and attitude variables were respectively effective in the classification of this node, which had an information gain of 15.30% throughout the tree. The third most common node was nodes number 18, which had a correct classification rate of 43.30% by classifying 65 of the 150 students as successful. While
Gokhan AKSU – Cigdem REYHANLIOGLU KECEOGLUEurasian Journal of Educational Research 84 (2019) 115-134
125
the categorization of this node with an information gain amount of 10.00% throughout the tree, it was observed that self-efficacy, work discipline and attitude variables were effective. It was seen that the fourth node giving the most information is node 6 with the correct classification rate by classifying 59 of 112 students as successful, and it had a 52,70% correct classification rate. Throughout the tree, it was seen that during classification, the variables of self-efficacy and attitude were effective in the tree, respectively. While the categorization of this node with 9.10% knowledge gain, when the results obtained by CHAID analysis were evaluated as a whole, the severity of the variables predicting success is respectively self-efficacy, attitude and study discipline. Accordingly, it was determined that the anxiety variable, which had a significant effect on logistic regression, had no significant effect on the three-level decision tree.
While the accurate classification rate of classifying the real successful students as successful was 70.30%, the rate of real failure students as failure was determined as 67.10%. Accordingly, the correct classification rate for all students in the decision tree obtained by CHAID analysis was determined as 68.60% with 0,314 risk value and with 0,012 standard error. The risk ratio shows that 31.40% of the classification can be misclassified. This rate was determined as 71.20% in LR.
Findings Obtained by REPTree Algorithm
The decision tree obtained with the aim of determining the variables which had a significant effect on classification as successful and unsuccessful in mathematics literacy with the help of REPTree classification algorithm from data mining methods is shown in Figure 2.
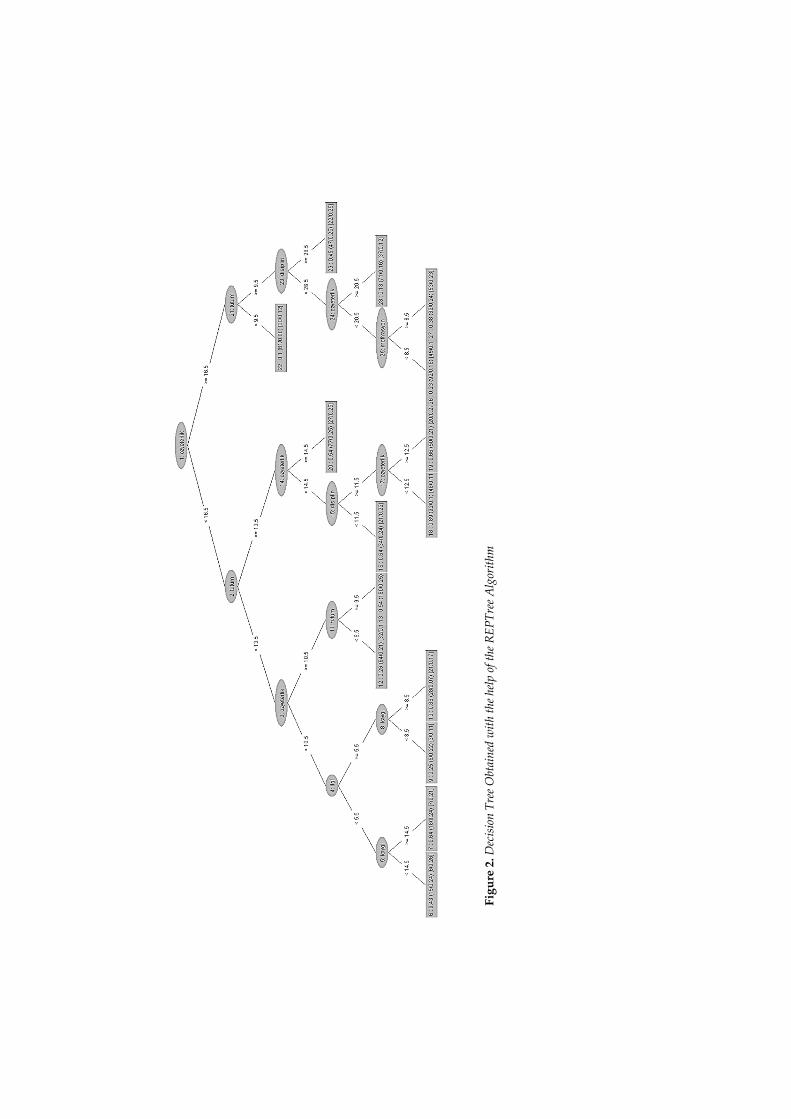
Figu
re 2
. Dec
isio
n T
ree
Obt
aine
d w
ith
the
help
of t
he R
EP
Tre
e A
lgor
ithm
Gokhan AKSU – Cigdem REYHANLIOGLU KECEOGLUEurasian Journal of Educational Research 84 (2019) 115-134
127
When Figure 2 is examined, it was determined that the best predictor of PISA literacy
was mathematics self-efficacy. In the decision tree obtained by the REPTree algorithm, the cut-off point concerning the self-efficacy level was determined as 16.50. This cut-off value was obtained due to the default settings of the program. If you change the properties of tree-like maximum tree dept or batch size the cut values, there will be minor changes in the cut point. It was determined that the best predictor variable was the self-efficacy for the students who scored equal to the cut-off point and who scored below/above this value. It was seen that regarding mathematics literacy, the most effective variable in tree branching at the third level was perception for 2 nodes, study discipline for 2 nodes and anxiety and motivation variables for the remaining nodes. It was also seen that in the fourth step of the decision tree, the most effective variables were anxiety for 2 nodes, interest for 2 nodes, motivation for 2 nodes, and attitude, self-efficacy and motivation for the remaining nodes. When the results obtained with the help of the REPTree algorithm were evaluated as a whole, the order of importance of independent variables was obtained in the following order: self-efficacy, attitude, working discipline, interest, motivation, and anxiety. According to the results obtained by the REPTree algorithm, the first three variables that affected the success were self-efficacy, attitude and working discipline, respectively.
When the confusion matrix of the classification process is examined by the REPTree algorithm, it was seen that the number of the correctly classified students was determined as 372 students were successful, and 523 students failed. The model made a mistake by classifying 275 students as successful who were unsuccessful in reality; and 221 students as unsuccessful who were successful in reality. According to this, 895 of 1391 students were assigned to the right classes, and the correct classification rate of the REPTree algorithm was determined as 64.34%. The mean square root of the errors was 0,513, and the kappa statistic was 0,279. There are no standard assessment criteria for the level of estimation of each learning method in data mining (Sokolova &Lapalme, 2009). In the analysis, the desired error and kappa statistics are as low as possible. In addition, one of the validity criteria obtained in data mining is the area under the ROC curve. When this value is close to 1, it is stated that an excellent classification is made. According to the results of the analysis, it was determined that the area under the ROC curve was .63, and the sensitivity value of the model was .642.
As a result of the analysis, the order of importance of independent variables of LR, CHAID analysis and REPTree algorithm and classification results related to all three methods according to the student success were obtained. When deciding which method to choose, the classification results obtained from the methods can be considered. After determining whether there was a significant difference between the classification results obtained, it can be decided which method to choose according to the size of the correct classification ratio. As a result of the analysis, the difference between the classification rates obtained from the three methods was tested in binary groups. In other words, the classification ratios obtained from LR and CHAID analysis were compared first and then the results of the LR and REPTree algorithm and finally, the classification results obtained from CHAID analysis and REPTree algorithm were compared.
The Z-statistic calculated for the comparison of the correct classification rates obtained as a result of the LR and CHAID analysis was smaller than the critical value of the Z-statistic
128 Gokhan AKSU – Cigdem REYHANLIOGLU KECEOGLUEurasian Journal of Educational Research 84 (2019) 115-134
at the significance level of 0.05 (Zd calculated = 1.26 <Zcritical = 1.96). From this point of view, it was revealed that the difference between the two sizes was statistically significant. Considering the magnitude of the classification rates obtained from both methods, it can be concluded that this difference is in favor of LR analysis. In other words, LR analysis was more accurate than CHAID analysis. According to this, it is concluded that LR analysis gives a more accurate result than CHAID analysis in determining the independent variables that have a significant effect on the dependent variable.
Another comparison of the obtained classification ratios was made between LR analysis and REPTree algorithm. The Z statistic calculated for the comparison of the correct classification ratios obtained from LR analysis and REPTree algorithm was greater than the critical value of the Z-statistic at the level of 0.05 (Z calculated = 3.29> Zcritical= 1.96). According to this result, there was no statistically significant difference between LR analysis and correct classification rates obtained from the REPTree algorithm. Therefore, considering the correct classification results, it can be thought that both methods are the alternatives of each other. However, it should be kept in mind that the independent variables that have a significant effect on the dependent variable differ according to the two methods.
Finally, the Z statistic calculated for the correct classification ratios obtained according to the CHAID analysis and REPTree algorithm was higher than the critical value of the Z-statistic at the level of 0.05 (Zcalculated = 2.02> Zcritical = 1.96). As in the LR analysis, there was no statistically significant difference between the correct classification ratios obtained from the CHAID analysis and the REPTree algorithm. This shows that the comments made upon the LR and REPTree algorithm can be made for the CHAID analysis and REPTree algorithm, too. In other words, any of the two methods may be preferred according to the correct classification results. However, two methods had different results in determining independent variables, which have a significant effect on the dependent variable.
Discussion, Conclusion and Recommendations
In this study, Logistic Regression, CHAID and data mining methods are used to determine the variables that predict the students’ mathematics success in PISA. This study also aimed to investigate whether the significance level and order of importance of the independent variables in classifying the students concerning mathematics achievement differ according to the method used. As a result of this study, in accordance with the findings related to the first subproblem, it was concluded that the significance of the independent variables of interest, attitude, motivation, perception, self-efficacy, anxiety and study discipline on mathematics achievement differed according to the method used. According to LR analysis, while independent variables having a significant effect on the dependent variable are listed as self-efficacy, attitude, anxiety and working discipline, whereas predictive variables having a significant effect on the dependent variable according to CHAID analysis and importance of these variables are self-efficacy, attitude and study discipline. The predictive variables determined according to the REPTree algorithm used in data mining and the order of importance of these variables were determined as self-efficacy, attitude and anxiety.
Gokhan AKSU – Cigdem REYHANLIOGLU KECEOGLUEurasian Journal of Educational Research 84 (2019) 115-134
129
According to the findings obtained from the analysis of the second sub-problem,
classification rate results concerning mathematics achievement according to the independent variables of interest, attitude, motivation, perception, self-efficacy, anxiety and study discipline related to the mathematics course differed in size according to the method used. The highest correct classification rate belongs to the LR analysis, the second is CHAID analysis and the smallest classification result belongs to the REPTree algorithm. This result is different from the findings of the study conducted by Abessi and Yazdi (2015). Similarly, in the study conducted by Baran-Kılıçalan (2018), it was observed that there were very close correct classification ratios like the C5.0 method was 75.90%, the CHAID analysis was 75.40%, and the LR analysis was 75.10%. In the relevant studies, the success sequence concerning correct classification rates is in the form of a learning method based on data mining, CHAID analysis and LR analysis.
It is thought that the use of C4.5 and C5.0 algorithms, which are considered to be the previous version of the REPTree algorithm, is the cause of this difference. There are studies about different results obtained by different algorithms in the literature. However, the findings of the study conducted by the researchers in the relevant literature showed that the most successful method was LR and then CHAID analysis, and this is similar to by Şata and Çakan’s (2018) study. When the results of similar studies in the literature are evaluated as a whole, it is seen that the logistic regression analysis has a better classification rate compared to CHAID analysis (Duran, Pamukçu and Bozkurt, 2014; Heckerd and Gondolf 2005; Kurt, Türe and Kurum, 2008).
However, it is thought to be one of the reasons for the low rate of classification obtained by the REPTree algorithm is that the decision tree is not limited to three levels as in the CHAID analysis in the SPSS program, and the release of the number of levels to be obtained for the tree. It was determined that the classification rate obtained by the REPTree method was lower as more precise classification was performed by increasing the number of levels. In this respect, the findings suggest that the sensitivity of the measurement results obtained has increased in a sense. This difference between the classification results obtained for LR and CHAID analysis was statistically significant, while there was no statistically significant difference between LR analysis and REPTree algorithm and CHAID analysis and REPTree algorithm. However, this result differs from the McCarty and Hastak’s (2007) findings. They found that CHAID tends to be superior to RFM (recency, frequency, and monetary value) and logistic regression. The difference between the classification rates obtained from CHAID analysis and LR analysis in each of four different sample sizes is not significant.
In a similar study, Güldal and Çakıcı (2017) compared 70 students with Naive Bayes, Decision Tree (C4.5) and k-nearest neighbor method for k = 1, 3 and 5 according to different evaluation criteria. In their study, the highest accuracy rates were obtained by the nearest neighbor for k=3, J48, k01 and the nearest neighborhood for k=5, respectively and Naive Bayes methods. The accuracy values of the classification algorithms discussed in the classification of students as successful and unsuccessful with the help of different algorithms varied between 55.7% and 64.3%. In a similar study conducted by Mehdiyev, Enke, Fettke and Loos (2016), the findings showed that the most accurate predictions were performed by artificial neural networks, Random forest, Logistic regression, Radial based
130 Gokhan AKSU – Cigdem REYHANLIOGLU KECEOGLUEurasian Journal of Educational Research 84 (2019) 115-134
networks and C4.5 methods, respectively. Accordingly, it can be said that the findings of the research are similar to the studies conducted in the field (Almuniri & Said, 2017).
Finally, in line with the findings obtained for the solution of the third sub-problem, the importance of independent variables in classifying students concerning mathematics achievement showed similarity depending on the method used. According to the obtained results, although the independent variables having a significant effect on the dependent variable are different according to the different methods, the order of importance of the variables did not change according to the method used. The self-efficacy variable, regardless of the method used in the study, is the variable that describes the dependent variable best. Similarly, no matter which method is used, the attitude variable is the variable with the best predictive power after the self-efficacy variable. Anxiety variable was not determined as a significant predictor variable in CHAID analysis, but according to the results of the LR analysis and REPTree algorithm, the predictive power ranking was followed by the attitude variable. Finally, the study discipline variable, which is not significant according to the REPTree algorithm, is the last predictor among the significant variables. This result is similar to the findings of Vale (2012). In this study, it is seen that the variables that have a significant effect on both methods, according to both methods, are the same in estimating the rates of automobile insurance using the CHAID analysis and Logistics model.
Based on the findings of this study, it is recommended that because of the CHAID, LR analysis and the REPTree algorithm give different results in determining the independent variables, which have a significant effect on the dependent variable; it is recommended that the studies which aim to determine the predictor variable should not be limited to one method. Combining findings from different methods serving the same purpose may be stronger evidence for research results. In addition, in studies where it is aimed to reveal the importance of the independent variables that have a significant effect on the dependent variable, LR and CHAID analysis and any of the REPTree algorithm may be preferred. This study is limited to Turkey’s sample with 1000 students. Similar studies can be carried out on the data sets of different countries to provide new insights. This study is limited to REPTree, one of the data mining classification methods. In addition to this, it is suggested that comparative studies should be conducted to determine the level of similarity between CHAID and LR rather than a single data mining method.
References Abessi, M., & Yazdi, E. H. (2015). Marketing data mining classifiers: Criteria selection issues in
customer segmentation. International Journal of Computer Applications, 106(10), 5-10.
Almuniri, I., & Said, A. M. (2017). School's performance evaluation based on data mining. International Journal of Engineering and Information Systems, 1(9), 56-62.
Albayrak, A.S., & Koltan-Yılmaz, Ş. (2009). Veri madenciliği: Karar ağacı algoritmaları ve imkb verileri üzerine bir uygulama. Süleyman Demirel Üniversitesi İktisadi ve İdari Bilimler Fakültesi Dergisi, 14(1), 31-52.
Antipov, E., & Pokryshevskaya, E. (2010). Applying CHAID for logistic regression diagnostics and classification accuracy improvement, Journal of Targeting, Measurement and Analysis for Marketing, 18(2), 109 – 117. doi: 10.1057/jt.2010.3
Gokhan AKSU – Cigdem REYHANLIOGLU KECEOGLUEurasian Journal of Educational Research 84 (2019) 115-134
131
Azen, R., &, Walker, C.M. (2011). Categorical data analysis for the behavioral and social sciences (1st Ed.),
New York: Routledge.
Baran-Kılıçalan, M. (2018). Hanehalkı işgücü araştirma verileri ile veri madenciliği yöntemlerinin uygulanmasi ve modellerin karşilaştirilmasi. Yayımlanmamış Yüksek Lisans Tezi. Hacettepe Üniversitesi İstatistik Ana bilim Dalı, Ankara.
Baştürk, R. (2016). Bütün yönleriyle SPSS örnekli nonparametrik yöntemler (3. Baskı). Ankara: Anı Yayıncılık.
Bush S. (2015). Sample size determination for logistic regression: A simulation study. Communications in Statistics - Simulation and Computation, 44, 360–373.
Büyüköztürk, Ş., Kılıç Çakmak, E., Akgün, Ö.E., Karadeniz, Ş., & Demirel, F. (2016). Bilimsel araştırma yöntemleri (20. Baskı). Ankara: Pegem Akademi.
Can, Ş., Özdil, T., & Yılmaz, C. (2018). Üniversite öğrencilerinin ders başarısını etkileyen faktörlerin lojistik regresyon analizi ile tahminlenmesi. International Review of Economics and Menagement, 6(1), 28-49.
Cohen, L., Manion, L., & Morrison, K. (2007). Research methods in education (6. Baskı). London: Routledge.
Çokluk Ö., Sekercioglu G., & Büyüköztürk S. (2012). Sosyal bilimler için çok degiskenli istatistik SPSS ve LISREL uygulamaları. Pegem yayınları, Ankara.
Díaz-Pérez, F. M., & Bethencourt-Cejas, M. (2016). CHAID algorithm as an appropriate analytical method for tourism market segmentation. Journal of Destination Marketing & Management, 5, 275-282. Doi: http://dx.doi.org/10.1016/j.jdmm.2016.01.006
Duran, A. E., Pamukçu, A., & Bozkurt, H. (2014). Comparison og data mining techniques for direct marketing campaings. Sigma, 32, 142-152.
Garson, D. (2015). Missing values analysis and imputation methods. USA: Statistical Publishing Associates.
Guldal, H., & Çakıcı, Y. (2017) Ders yönetim sistemi yazılımı kullanıcı etkileşimlerinin sınıflandırma algoritmaları ile analizi. Atatürk Üniversitesi Sosyal Bilimler Enstitüsü Dergisi, 21(4),1355-1367.
Groves, R. M. (2006). Nonresponse rates and nonresponse bias in house hold surveys. Public Opinion Quartely, 7(5), 646-675
Heckert, A., & Gondolf, E. (2004). Battered women's perceptions of risk versus risk factors and instruments in predicting repeat reassault. Journal of Interpersonal Violence, 19, 778−800.
Kilic, S. (2000). Lojistik regresyon analizi ve pazarlama araştırmalarında bir uygulama. Yayınlanmamış Yüksek Lisans Tezi. İstanbul Teknik Üniversitesi, Fen Bilimleri Enstitüsü, İstanbul.
Koc Basaran Y. (2017) Sosyal bilimlerde Örnekleme Kuramı, Akademik Sosyal Araştırmalar Dergisi, 5(47), 480-495.
Kurt, I., Ture, M., & Kurum, A. T. (2008). Comparing performances of logistic regression, classification and regression tree, and neural networks for predicting coronary artery disease. Expert Systems xith Applications, 34, 366-374.
Lehmann, E. L. (2006). On likelihood ratio tests, In IMS Lecture Notes- 2nd Lehmann Symposium, 49, 1–8.
Larose, D. T., & Larose, C. D. (2014). Discovering Knowledge in Data: An Introduction to Data Mining. 2nd Edition. NewJersey, USA: John and Wiley Sons Incorporated,.
Massey, A., & Miller, S. J. (2006). Tests of hypotheses using statistics. Mathematics Department, Brown University, Providence, RI, 2912.
132 Gokhan AKSU – Cigdem REYHANLIOGLU KECEOGLUEurasian Journal of Educational Research 84 (2019) 115-134
McCarty, J. A., & Hastak, M. (2007). Segmentation approaches in data-mining: A comparison of
RFM, CHAID, and logistic Regression. Journal of Business Research, 60, 656–662.
Mertler, C.A., & Vannatta, R. A. (2005). Advanced and multivariate statistical methods: Practical application and interpretation (3rd Edition). Glendale, CA: Pyrczak Publishing.
Nisbet, R., Miner, G., & Yale, K. (2017). Handbook of statistical analysis and data mining applications (2nd Edition). Elsevier Science Inc., ISBN: 0124166326,9780124166325
Ozekes, S. (2003). Veri madenciliği modelleri ve uygulama alanları. İstanbul Ticaret Üniversitesi Fen Bilimleri Dergisi, 2(3), 65-82.
Park, H. (2013). An introduction to logistic regression: From basic concepts to interpretation with particular attention to nursing domain. Journal of Korean Academy of Nursing, 43(2), 154–164.
Peng, C.Y.J., Lee, K.L., & Ingersoll, G.M. (2002). An introduction to logistic regression analysis. The Journal of Educational Research, 96 (1), 3-14.
Rudd, J. M., & Priestley, J. L. (2017). A Comparison of Decision Tree with Logistic Regression Model for Prediction of Worst Nonfinancial Payment Status in Commercial Credit, Grey Literature from PhD Candidates. 5. http://digitalcommons.kennesaw.edu/dataphdgreylit/5
Sokolova, M., & Lapalme, G. (2009). A systematic analysis of performance measures for classification tasks, Information Processing and Management, 45, 427-437.
SPSS White Paper Inc. (1999). Answer tree algorithm summary. ATALGWP-0599, USA.
Sata, M., & Cakan, M. (2018). Comparison of results of CHAID analysis and logistic regression analysis. Dicle University Journal of Ziya Gökalp Faculty of Education, 33, 48-56.
Tabachnick, B. G., & Fidell, L. S. (2001). Using multivariate statistics (4th ed.). Needham Heights, MA: Allyn& Bacon.
Tabachnick, B. G., & Fidell, L. S. (2014). Using multivariate statistics. USA: Pearson Education Limited.
Tutek, H., & Gumusoglu, Ş. (2008). İşletme istatistiği, İstanbul: Beta Basım Yayım Dağıtım A.Ş.
Mehdiyev, N., Enke, D., Fettke, P., & Loos, P. (2016). Evaluating forecasting methods by considering different accuracy measures. Procedia Computer Science, 95, 264 – 271.
Milli Eğitim Bakanlığı-Ölçme, Değerlendirme ve Sınav Hizmetleri Genel Müdürlüğü, (2015). Uluslararası Öğrenci Değerlendirme Programı PISA 2015 Ulusal Raporu, Ankara.
Milli Eğitim Bakanlığı-Ölçme, Değerlendirme ve Sınav Hizmetleri Genel Müdürlüğü, (2016). Uluslararası Matematik ve Fen Eğilimleri Araştırması (TIMSS) 2015 Ulusal Matematik Ve Fen Ön Raporu. Ankara.
Vale, J. B. (2012). Using Data mining to predict automobile insurance fraud. Dissertation of the degree of MSc in Business Administration. Universidade Católica Portuguesa.
Zuckerman, I., & Albrecht, D.W. (2001). Predictive statistical models for user modeling. User Modeling and User Adapted Interaction, 11(1-2), 5-18.
Yordayıcı Değişkenlerin Belirlenmesinde Kullanılan Yöntemler: Lojistik Regresyon, Veri Madenciliği Yöntemleri ve CHAID Analizi
Atıf:
Aksu, G., & Reyhanlioglu Keceoglu, C. (2019). Comparison of results obtained from logistic regression, chaid analysis and decision tree methods. Eurasian Journal of Educational Research, 84, 115-134, DOI: 10.14689/ejer.2019.84.6
Gokhan AKSU – Cigdem REYHANLIOGLU KECEOGLUEurasian Journal of Educational Research 84 (2019) 115-134
133
Özet
Problem Durumu: Ülkelerin eğitim politikalarına yön vermek amacıyla göz önünde bulundurulan birçok durum vardır. Dünya genelinde politika belirleyicileri, kendi ülkelerindeki öğrencilerin bilgi ve beceri düzeylerini araştırmaya katılan diğer ülkelerdeki öğrencilerin bilgi ve beceri düzeyleriyle karşılaştırmak, eğitim düzeyinin yükseltilmesi amacıyla standartlar oluşturmak ve eğitim sistemlerinin güçlü ve zayıf yönlerini belirlemek amacıyla uygulanan uluslararası uygulamaların sonuçlarından yararlanılmaktadır. Ülkeler bu bilgiler sayesinde eğitim süreçlerini uluslararası bir perspektife göre değerlendirebilmektedir. Ülkelerin eğitim politikalarının şekillendirilmesinde önemli rol oynayan uluslararası sınavlardan elde edilen bulgular, farklı alanlarda değişkenlerin ölçüldüğü büyük ölçekli bir veri tabanından elde edilmektedir. Çok büyük ölçekli veriler, farklı alanlardaki büyük ölçekli veri tabanları içinde değerli verileri bulunduran bir veri madeni gibi düşünülebilir. Veri madenciliği yöntemleri sayesinde ülkelerin eğitim politikalarına yön veren uygulamalardan elde edilen karmaşık veriler üzerinden bağımlı değişkeni yordayan bağımsız değişkenlere dair maksimum bilgi elde edilebilir. Bağımlı (yordanan) değişkenin üzerinde etkili olan bağımsız (yordayıcı) değişkenlerin belirlenmesi bilimsel araştırmaların temel odağında yer alan konulardan bir tanesidir. Bu amaçla gerçekleştirilmiş çalışmalarda yordayıcı değişkenlerin belirlenmesinde çeşitli yöntemlerden yararlanılır. Bu yöntemlerin ortak özelliği bağımsız değişkenlerin bağımlı değişkenler üzerindeki etkilerinin anlamlılığını test etmesidir. Kullanılan yöntemlerin ortak özellikleri kadar birbirinden farklılaşan özellikleri de bulunmaktadır. Kullanılan yöntemleri birbirinden ayıran temel özelliklerden biri uygulanabildiği veri türüdür. İstatistiksel yöntemlerin bazıları sadece sürekli verilere uygulanabilirken, bazıları kategorik verilere de uygulanabilmektedir. Kategorik veri analizi eğitim uygulamalarında sıklıkla kullanılan bir yöntemdir. Her ne kadar öğrencilerin akademik başarılarını belirlemek için kullanılan ölçme araçları eşit aralık ölçek düzeyinde kabul edilerek, ölçme sonuçları sürekli puanlar olarak elde edilse de, öğrenciler hakkında karar verme sürecinde başarı puanları belli bir ölçüt puana göre başarılı/başarısız şeklinde kategorik verilere dönüştürülmektedir. Sonuç olarak bir bağımlı değişken olarak öğrenci başarıları üzerinde anlamlı etkiye sahip olan faktörlerin belirlenmesi için veri madenciliği ile parametrik olmayan iki yöntem olan Lojistik Regresyon analizi ve CHAID analizi yöntemlerinin sonuçlarından yararlanılabilir. Her üç yöntemin de ortak özelliği bağımlı değişken üzerinde anlamlı etkiye sahip olan bağımsız değişkenleri belirlemeyi hedeflemesidir. Bununla birlikte üç yöntemi birbirinden ayıran en temel özellik arka planda çalıştırdığı öğrenme algoritmasıdır. Tüm bunlara bağlı olarak başarı üzerinde anlamlı bir etkiye sahip olduğu düşünülen bağımsız değişkenlerin belirlenmesi ve bu değişkenlerin önem sırasının ortaya konulması birçok bilimsel çalışmanın ortak amaçlarından biridir. Ayrıca değişkenlerin önem sırasının kullanılan yöntemlere göre değişmesi çalışmalarda hangi yöntemin kullanılması gerektiği konusunda karışıklık yaratacaktır.
Araştırmanın Amacı: Çalışma kapsamında ele alınan üç farklı yönteme göre bağımsız değişken olarak kabul edilen matematik dersine ilişkin ilgi, tutum, motivasyon, algı, öz yeterlik, kaygı ve çalışma disiplini değişkenlerine göre öğrencilerin başarı durumları bakımından nasıl sınıflandıkları araştırılmıştır. Bu çalışmada öğrencilerin matematik

134 Gokhan AKSU – Cigdem REYHANLIOGLU KECEOGLUEurasian Journal of Educational Research 84 (2019) 115-134
başarısını yordayan değişkenlerin belirlenmesi amacıyla Lojistik Regresyon (LR) ve CHAID analizi ile veri madenciliği yöntemlerinden yararlanılmaktadır. Mevcut bir durumun sonuçlarının belirlenmesi sebebiyle çalışma ilişskisel (korelasyonel) bir araştırma niteliğindedir. Çalışmada kullanılan veriler PISA 2012 öğrenci anketinde yer alan ve uygulamaya katılan öğrencilerin ilgi, tutum, özyeterlik, algı, motivasyon, kaygı ve çalışma disiplini alt ölçeklerine verdikleri yanıtlar yardımıyla elde edilmiştir. Çalışmanın evreni PISA 2012 öğrenci anketine katılan ve tabakalı seçkisiz örnekleme yöntemiyle belirlenen 4818 öğrenciden oluşmaktadır. Ancak analizler sistematik örnekleme yöntemi ile seçilmiş 1000 öğrenci üzerinden gerçekleştirilmiştir. Verilerin analizi LR ve CHAID analizi ile veri madenciliği yöntemlerinden REPTree algoritmasına göre gerçekleştirilmiştir. Böylece her üç yönteme göre öğrencilerin matematik başarısı üzerinde anlamlı etkisi olan bağımsız değişkenler belirlenmiştir. LR, CHAID analizi ve REPTree algoritması yöntemlerinin karşılaştırılması öğrencilerin başarı durumuna göre anlamlı etkisi olan değişkenlerin ve her bir yönteme ilişkin öğrencilerin matematik başarılarına göre doğru sınıflandırma oranlarının belirlenmesi ile gerçekleştirilmiştir.
Araştırmanın Bulguları: Elde edilen sonuçlara göre her bir yönteme ilişkin öğrencilerin matematik başarısı üzerinde anlamlı etkisi olan değişkenler birbirinden farklı çıkmıştır. Bunun yanı sıra her ne kadar farklı yöntemlere göre bağımlı değişken üzerinde anlamlı etkiye sahip olan bağımsız değişkenler farklı olsa da, değişkenlerin önem sırasının kullanılan yönteme göre değişmediği belirlenmiştir. Çalışmada ayrıca farklı yöntemler tarafından öğrencileri PISA matematik okuryazarlığı bakımından sınıflamada elde edilen doğru sınıflama oranlarının farklılık gösterdiği belirlenmiştir.
Araştırmanın Sonuçları ve Öneriler: LR analizine göre bağımlı değişken üzerinde anlamlı etkiye sahip olan bağımsız değişkenler özyeterlik, tutum, kaygı ve çalışma disiplini şeklinde sıralanırken, CHAID analizine göre bağımlı değişken üzerinde anlamlı etkisi olan yordayıcı değişkenler ve bu değişkenlerin önem sırası özyeterlik, tutum ve çalışma disiplini şeklindedir. Veri madenciliğinde kullanılan REPTree algortimasına göre belirlenen yordayıcı değişkenler ve bu değişkenlerin önem sırası ise özyeterlik, tutum ve kaygı şeklinde belirlenmiştir. En büyük sınıflandırma oranı LR analizi, ikinci olarak CHAID analizi ve en küçük sınıflandırma sonucu ise REPTree algoritmasına aittir. REPTree algoritması ile elde edilen sınıflama oranının düşük çıkma sebeplerinden bir tanesi karar ağacının SPSS programında gerçekleşen CHAID analizinde olduğu gibi 3 düzeyle sınırlandırmayarak ağaç için elde edilecek düzey sayısının serbest bırakılmasından kaynaklanabileceği düşünülmektedir. Çalışmada matematik başarısı bakımından öğrencileri sınıflandırmada bağımsız değişkenlerin önem sırası kullanılan yönteme göre benzerlik göstermiştir. Bağımlı değişken üzerinde anlamlı etkiye sahip olan bağımsız değişkenlerin önem sırasının ortaya konmasının amaçlandığı çalışmalarda LR ve CHAID analizi ile REPTree algoritmasından herhangi biri tercih edilebilir. Bireylerin başarı durumları açısından sınıflandırılmasının amaçlandığı çalışmalarda CHAID analizi ile REPTree algoritması birbirinin alternatifi olabilir. Ancak LR analizi diğer iki yönteme göre anlamlı derecede farklı sonuçlar vereceği için alternatif bir yöntem olarak düşünülmemelidir.
Anahtar Kelimeler: CHAID Analizi, Lojistik Regresyon Analizi, Veri Madenciliği, PISA
Euras ian Journal of Educational Research 84 (2019) 135-158 Eurasian Journal of Educational Research
www.ejer.com.tr
The Mediator Roles of Mothers in Father-Child Communications and Family Relationships* Hilal CELIK1
A R T I C L E I N F O A B S T R A C T
Article History: Purpose: In many middle-class families in Turkey,
mothers typically occupy a mediator role in father-
child communications, meaning that messages between fathers and children (particularly regarding an important subject) are sent through mothers. This phenomenological study investigates Turkish father-
child communication dynamics, the roles of mothers in this relationship, and the effects of mothers acting as mediators in communications between father and child. Research Methods: This study used Interpretative
Phenomenological Analyses to reveal the essence of the relationship of participants with their fathers and their shared experiences regarding the reflection of
the mother’s role in the father-child relationship and common meanings that have been established. Employing a homogeneous sampling method, we
Received: 03 Jul. 2019
Received in revised form: 28 Oct. 2019
Accepted: 13 Nov. 2019 DOI: 10.14689/ejer.2019.84.7
Keywords
father-child relationship, mother-child relationship, communication, family-interactions, Turkish families.
conducted semi-structured interviews with 15 middle-class undergraduate students (nine
female and six male students) aged 19-24 (x=21.33) in Istanbul, Turkey. Findings: Our analyses revealed the following three overarching themes that define the
experiences of the participants: (i) an unsatisfactory father-child relationship, (ii) the mother: relational fulcrum of the father-child communications, and (iii) problematic emotional
reactions to family-interactions. Implications for Research and Practice: This study represents a critical step towards
understanding the experiences of youths raised in families wherein mothers occupy a
mediator role in father-child communications. It revealed that the father-child relationship does not represent a satisfactory relationship and that this relationship is associated with a sense of deprivation by the children. A comparative evaluation of the experiences of the fathers, mothers, and children would enrich the interpretations and help to obtain a more complicated view of these family relationships.
© 2019 Ani Publishing Ltd. All rights reserved
1 Marmara University, Department of Educational Sciences, Psychological Counseling and Guidance, Ataturk Education Faculty, Kadikoy, Istanbul TURKEY, e-mail: [email protected], [email protected], ORCID: https://orcid.org/0000-0001-5923-4248

136 Hilal CELIK Eurasian Journal of Educational Research 84 (2019) 135-158
Introduction
As a crucial aspect of family relationships, communication (Noller & Callan, 1990)
plays a key role in increasing the quality of relationships among the members, in maintaining the healthy functioning of the family as a whole, and in providing insights
into the main underlying dynamics of family relationships (Olson, 2000). Affectionate
communication patterns within the family help the members to feel a sense of belonging, love and being loved, appreciated, and accepted. Research studies report
that members of families with strong communications can develop a positive sense of
self, and be emotionally closer and affectionate towards each other (Barnes & Olson, 1985: Noller & Callan, 1990). They also can deal with familial conflicts more effectively.
Family members may communicate with each other in different ways. In general,
the communication skills of female members are more advanced than those of male members, and fathers are perceived as more judgmental, authoritarian, and less
willing to be involved in important discussions of feelings and problems (Morman &
Floyd, 2002; Noller & Callan 1990). This type of inter-family communication pattern exists in several cultures and often can be found in Turkish families as well. A growing
body of literature reports that in Turkey mother-child communications are stronger
than father-child communications; adolescents communicate more with their mothers (Hortacsu, 1989); fathers are perceived as less affectionate and more authoritarian
compared to mothers (Ataca, 2009; Boratav, Fisek & Ziya, 2017; Sunar & Fisek 2005);
and mothers hold a primary position in areas concerning the child, while fathers hold an inferior or subordinate position (Anne Cocuk Egitim Vakfı [ACEV], 2017, Bozok,
2018).
In Turkey, it is common in middle-class families that mothers occupy a mediator role, meaning that children send their messages to their fathers through mothers. It is
frequently observed in Turkish families that adolescents explain their situation to their
mother first and ask the mother to convey these messages to the father instead of directly talking to him about ordinary or important issues, such as spending the night
at a friend’s house, asking for permission to go out, explaining a desire to change one’s
school/department, or announcing the existence of a boyfriend/girlfriend. This study investigates Turkish father-child relationship dynamics, the roles of mothers in this
relationship, and perceptions regarding family relationships wherein mothers play a
mediator role in communications between the father and child/ren.
Father-Child Relationships
In the 21st century, social transformations have led to a reconstruction of the
identity of fatherhood. This development, in turn, has triggered new, in-depth
scholarly investigations into family relationships. Numerous factors, such as the participation of women in the labor force, increased awareness of fathers regarding
the well-being of their children, changes in the traditional family structure, and a trend
to rearrange gender roles in a more egalitarian manner have altered fatherhood roles, and consequently, the perceived identity of fathers. Also, during the last five decades,
academics interested in father-child relationships have helped to redefine fatherhood
Hilal CELIK Eurasian Journal of Educational Research 84 (2019) 135-158
137
by discussing themes, such as “nurturing” (Lamb, 2000, 2010) and “co -parenting”
(Pleck & Pleck, 1997).
This new fatherhood identity has created the expectation that today’s fathers
should be more nurturing, affectionate, and involved in raising children compared to
fathers in previous generations. Today, fatherhood is characterized by the parenting attributes, such as assuming an active role in child care, expressing love to the wife
and child, providing emotional and social support, availability, responsibility, being a
role model, offering affectionate communication, providing financial support, and showing authoritarianism. Whether a father is “good” or not is determined by
assessing to what extent he presents these characteristics (Lamb, 2010; Morman &
Floyd, 2006).
Acknowledged as one of the indicators of good fatherhood by both fathers and
children, communication determines the quality of the father-child relationship today
(Floyd & Morman, 2003, 2005; Morman & Floyd, 2006). Studies report that the father-child relationship and communications have changed compared to earlier generations;
today’s fathers have become more affectionate and open to communication (Borotav
et al., 2017; Floyd & Morman, 2005; Sunar, 2009). However, studies also report that sometimes the new methods do not exactly meet the expectations of the children
(Floyd & Morman, 2005; Morman & Floyd 2002). This can be explained by the concepts
of a culture of fatherhood and the conduct of fathering. A culture of fatherhood is built upon shared norms, values, and beliefs concerning fatherhood. Conduct of fathering
means what a father actually does as a parent. Studies note that fathers often
experience difficulty displaying the characteristics of idealized fatherhood in real life; i.e., there is a gap between the culture of fatherhood and the conduct of fathering
(Barutcu & Hidir, 2016; Brown, Callahan, Strega, Walmsleys, & Dominelli, 2008; Sunar,
2002).
Consequently, recent studies continue to report that mother-child communications
are still stronger, closer, and more affectionate compared to father-child
communications. Also, both sons and daughters feel closer to their mothers (Nielson, 2001; Noller & Callan, 1990), spend more time with their mothers, and feel that they
know each other better than the child knows the father (Jacobs & Kelley, 2006; Mathew,
Derlaga & Morrow, 2006). Vogel, Bradley, Raikes and Boller (2011) underscored that this pattern reflects the loss of relationship balance and that mothers are perceived as
essential actors within the family, while fathers hold an inferior position.
This pattern can be clearly observed in middle-class Turkish families. It is also common in middle-class Turkish families to see that mothers assume an active role in
father-child communications, and even hold a central position in it. Despite recent changes in family relations, fathers still are perceived as being less affectionate, more
authoritarian, and more controlling compared to mothers in Turkey (Ataca, 2009;
Borotav et al., 2017; Sunar, 2009). This study explored how youths, who raised in families wherein mothers occupy a mediator role in father-child communications,
perceive:
(1) the father-child relationship,
138 Hilal CELIK Eurasian Journal of Educational Research 84 (2019) 135-158
(2) which roles are assumed by mothers in father-child communications, and
(3) the effects of the mother’s mediator role within the family.
Method
Research Design
This study used Interpretative Phenomenological Analyses (IPA) to explore the
relationships of youths with their fathers, their perceptions of the mother’s role in their
father-child relationship, and the effects of the mother’s mediating communication role (Smith & Osborn, 2003). IPA was selected due to its emphasis on the double
hermeneutic process, which refers to the two-ordered meaning-making process
between the data, the participants, and the researcher.
Setting and Recruitment
The data were collected in accordance with the approval and permission received
from the Ataturk Education Faculty at Marmara University in Turkey. The researcher made an announcement concerning the study during her lectures and offered general
information about its purpose. Fifteen volunteer participants met the inclusion criteria
as follows: (i) having biological parents, (ii) having lived with these parents during childhood or still living with them, (iii) having married parents, (iv) having a mother
that plays a mediator role in father-child communications, and (v) having a family
with medium SES. These participants were interviewed. The in-depth interviews were carried out by three doctoral students, who were supervised by the researcher during
the entire process. This was done to ensure maintenance of the ethical boundaries
between the lecturer and the students and also to ensure that the participants expressed themselves sincerely. All of the interviewers were well -trained in qualitative
research methods at the postgraduate level and had conducted prior phenomenology
studies.
Participants
A homogeneous sample was employed to focus on a particular context and specific
time period. Similarities and differences in the participants’ experiences were thoroughly examined with this sampling method. We conducted semi-structured
interviews with 15 middle-class undergraduate students (nine females, six males) aged
19-24 (M=21.33) in Istanbul, Turkey. The demographic variables of the sample are illustrated in Table 1.
Interviews
After receiving each participant's informed consent, a demographic questionnaire
was administered to each participant. Then, semi-structured interviews were conducted, which lasted approximately 1.5 hours. In these, grand tour questions were
utilized (to ask about the phenomenon or cultural scene), as were follow-up questions
(to ask for further details about an act, event, or category). The guiding research
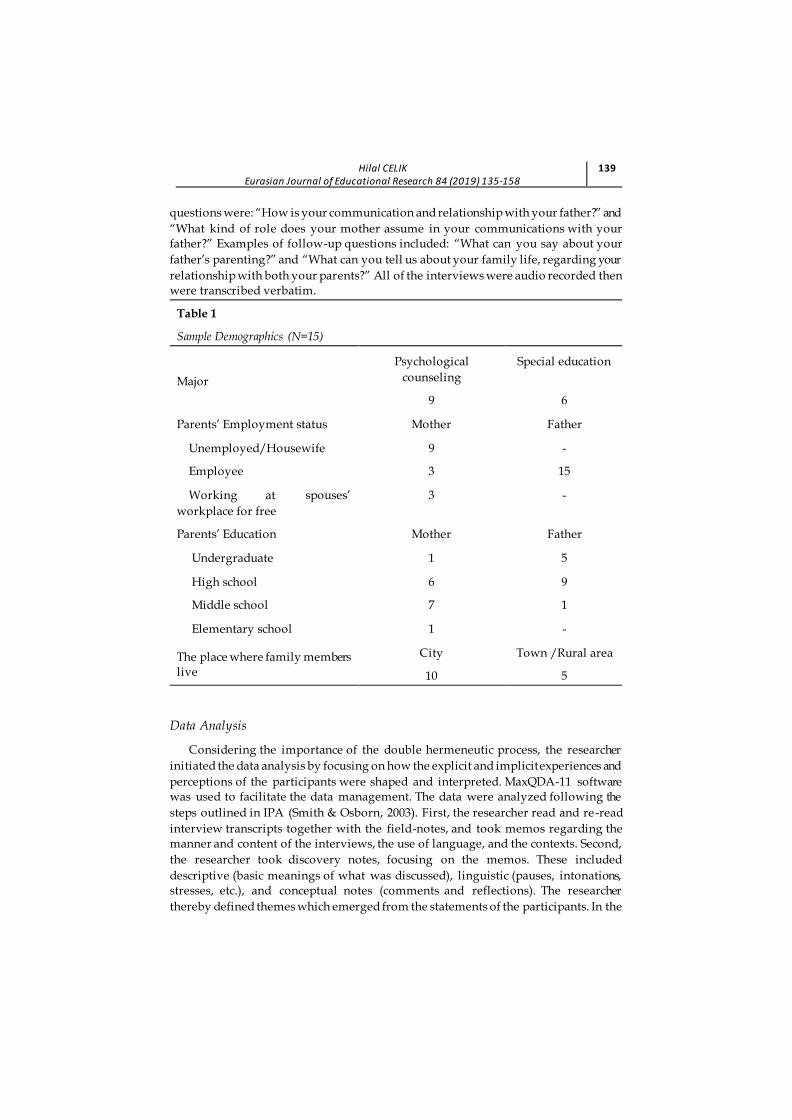
Hilal CELIK Eurasian Journal of Educational Research 84 (2019) 135-158
139
questions were: “How is your communication and relationship with your father?” and
“What kind of role does your mother assume in your communications with your father?” Examples of follow-up questions included: “What can you say about your
father’s parenting?” and “What can you tell us about your family life, regarding your
relationship with both your parents?” All of the interviews were audio recorded then were transcribed verbatim.
Table 1
Sample Demographics (N=15)
Major
Psychological
counseling
Special education
9 6
Parents’ Employment status Mother Father
Unemployed/Housewife 9 -
Employee 3 15
Working at spouses’
workplace for free
3 -
Parents’ Education Mother Father
Undergraduate 1 5
High school 6 9
Middle school 7 1
Elementary school 1 -
The place where family members live
City Town /Rural area
10 5
Data Analysis
Considering the importance of the double hermeneutic process, the researcher
initiated the data analysis by focusing on how the explicit and implicit experiences and
perceptions of the participants were shaped and interpreted. MaxQDA-11 software was used to facilitate the data management. The data were analyzed following the
steps outlined in IPA (Smith & Osborn, 2003). First, the researcher read and re-read
interview transcripts together with the field-notes, and took memos regarding the manner and content of the interviews, the use of language, and the contexts. Second,
the researcher took discovery notes, focusing on the memos. These included
descriptive (basic meanings of what was discussed), linguistic (pauses, intonations, stresses, etc.), and conceptual notes (comments and reflections). The researcher
thereby defined themes which emerged from the statements of the participants. In the
140 Hilal CELIK Eurasian Journal of Educational Research 84 (2019) 135-158
third step, the researcher established connections between these themes and then
grouped them according to conceptual similarities. In the fourth step, each theme was
supported with samples from the participants’ statements and the researcher’s own analytic comments.
Trustworthiness
Various steps were taken to enhance the trustworthiness of the data. First, significant attention was paid to the data collection, analysis, and interpretation
processes. Also, the interviews were transcribed verbatim by the researcher, with a
sincere effort to accurately reflect the audio recordings. To enhance credibility and conformability, the researcher employed reflexive memoing to document her personal
reflections on the research process. This process included the incorporation of direct
quotations that reflect the feelings and opinions of the participants (thick description), as well as purposive sampling to support transferability. Finally, the researcher
interviewed three participants face-to-face and received their confirmation that the
themes reflected their real experiences (member checking) (Lincoln & Guba, 1985).
The Researcher’s Role
Phenomenology researchers are always aware of the critical importance of the
emic/etic position of the researcher in obtaining in-depth information concerning the
studied phenomenon. Therefore, using a double hermeneutic process, the researcher presented an emphatic position to reflect the perceptions of people experiencing the
phenomenon with the viewpoint of an insider, while taking a questioning stance as an
outsider/stranger to examine the phenomenon from different angles. Being also a member of a couple and family therapist, the researcher possesses a comprehensive
agenda, including attention to themes relating to family relationships, the father-child relationship, and ambiguous loss. In addition to the researcher’s clinical and academic
background, she also is the child of a middle-class family, and was born and raised in
Turkey. This circumstance allowed her to be both an insider and an outsider while evaluating the experiences of the participants.
Results
This study obtained three overarching themes as folows: (i) an unsatisfactory
father-child relationship, (ii) the mother: relational fulcrum of the father-child communication, and (iii) problematic emotional reactions to family-interactions. While
each youth expressed a unique experience regarding his/her father-child
relationship/communication pattern and role/s that the mother assumed in this communication, the findings showed that all of the participants had similar
experiences.
Unsatisfactory father-child relationship
All participants stated that their relationship experiences with their fathers did not
satisfy their emotional needs or expectations. Their narratives reflect that their father-
Hilal CELIK Eurasian Journal of Educational Research 84 (2019) 135-158
141
child relationships were relatively problematic, and far from a desired father -child
relationship. The participants’ answers to the question “how is your relationship with your father?” centered on the following terms: problematic, undefinable, distant/cold,
and detached. One male participant living in a city presented a clear example of his
unsatisfactory relationship with his father:
When I want to talk about something with my family, or when I have a problem, or I
want something, I go to my sister or my mother. I never go to my father because we do not have such a relationship with him. I do not know how to describe our relationship, detached maybe. We barely talk or share something. We talk sometimes but only about daily stuff. We do not have a father-son relationship, as shown in the TV series.
The participants’ narratives demonstrate that this unsatisfactory father-child relationship is characterized by three main parenting attributes of the fathers: (i)
distance, (ii) an uninvolved parenting style, and (iii) authoritativeness.
Distance
The participants’ narratives demonstrate that the father-child relationship is
defined by hierarchy, and that hierarchy is symbolized with distance. The participants
emphasized that their relationship with their father was more formal and superficial. Eleven of the participants stated that they had a closer relationship with their fathers
when they were a child; but after a certain age (especially after adolescence), their relationship changed and became distant. One participant said: “My father used to pay a lot of attention to us when we were kids. We used to play together. As we grew up, he started
to put distance between us.” The participants’ narratives show that their distant father-
child relationships were characterized by two basic features: (i) lack of communication,
and (ii) lack of emotional and physical engagement.
Lack of communication was indicated in all of the participants’ narratives. They noted that this was mainly caused by the behaviors of their fathers (e.g., not talking,
not listening, criticizing, judging, etc.), and that this led to their reluctance to
communicate with their fathers. One participant raised in a city by dual-earner parents said:
Even if I argue with my mother, I know that my mother takes me seriously and cares about me. But my father fails to do that. Sometimes, his voice, attitude, or behaviors tell me ‘I can’t deal with you anymore.’ It feels as if he is actually trying not to listen to what I am trying to say. Probably he regrets in the end. But his
attitude brings me to the point of thinking ‘my father never listens to me.
Seven participants stated that communication with their fathers was limited due to respect, and that mostly this arose from the behaviors of their father. One participant
noted that respecting elders was a norm in their culture and added:
I cannot talk to my father. We should not get too close. That is the reason why I go to my mom first. My father does not listen a lot, relying on the experience he gained

142 Hilal CELIK Eurasian Journal of Educational Research 84 (2019) 135-158
due to his age. This has nothing to do with me. There is an unwritten rule in our society saying that one should not tell everything to the father.
In addition, the participants revealed that their father-child relationships were superficial and that communication was generally focused upon household chores,
academic achievement, giving and receiving pocket money, and controlling the child
(especially the girls). Eleven of the participants, all of whom had moved out of their home to attend high school or university, stated that given that they lived far from
their family did not lead to any change in their communication with their fathers. They
did not call each other except in obligatory circumstances (to ask for pocket money, or for the father, to check on how the child is doing). Further, eight of the participants
reported that their fathers did not call them very often though they lived apart from
family, and that a call generally came only in a crisis (disease, death, etc.). The account of a female participant who lived with her family but could not go home due to her
busy schedule stood out in this respect:
I could not go home due to my busy schedule. My father called. I was very surprised. Because if he is calling, this means that something happened: Either someone died or something else happened... I would feel uneasy if my father always called me because I am not used to this... For example, when I call my mother, my father picks up the phone if my mother is not there: He says, ‘your mother is not here’ and hangs up, so this is my relationship with my father.
Many of the participants stated that their communications with their father did not make them feel special or valuable. Their narratives also show that verbal messages
with emotional content, such as missing each other, love, and valuing the child, were
conveyed between the child and the father implicitly. One participant said:
Ten years ago, my father and I used to communicate and talk to each other... We can also talk now, but this is never happening. Maybe due to pride or arrogance.
But I wish I could have a heart-to-heart talk with my father and tell him that I love him. But this is just a dream. We usually keep silent.
The emotional distance of fathers and the lack of a satisfactory emotional bond in
the father-child relationship was the second common theme. Thirteen participants stated that they had not experienced emotional sharing, including physical contact,
such as kissing and hugging, sufficiently enough since their childhood in their
relationships with their fathers. Similarly, 12 participants said that they believed their fathers loved them, but they did not hear this very often verbally from them. The
emotional distance between these fathers and children is an issue that arouses a feeling
of deprivation among the participants. Ten of the participants expressed this deprivation with a feeling of longing:
My father does not display his love. He never kissed me or hugged me when I was a kid. I do not remember. I would remember if he did, I guess. I think I always miss this.
We also observed that lack of emotional and physical engagement with the father was excused by some of the participants due to various reasons (busy working
Hilal CELIK Eurasian Journal of Educational Research 84 (2019) 135-158
143
schedule or bad childhood experiences of the father himself): “My father loves his
children. We know this. But he can’t express his love. Of course, it would be better if he could. Maybe I would not feel so distanced from him then... Probably that was his experience with his father. There was a lot of respect between them, but love was invisible. Our relationship looks like theirs.”
Eight of the participants stated that they could establish a temporary, closer emotional relationship with their father during a crisis (sickness, accident, loss of a
family member, etc.) or successful achievement (getting into a university, ranking well
in a competition, etc.), but that they would revert to their former relationship when the impact of the crisis or success faded:
I would normally see my father as a robot. I would never think he would get upset because he never showed his feelings. When my grandfather died, I saw my father crying. At that moment, I realized that my father had emotions. He always hides them. Of course, he loves us. We know it. But when it comes to feeling it, I cannot
say I feel it.”
Uninvolved parenting
That the father did not assume an active role in child-care and the mother was the primary caring figure was also determined to be a common theme. Many of the
participants stated that they found it normal that their fathers held a secondary
position and their mothers assumed the main caregiver role, since they were women. The uninvolved parenting of the fathers was characterized by (i) providing only for
material needs, (ii) being passive in housework and child care in the presence of the
mother, and (iii) lack of interest. However, the participants also indicated that these behaviors inhibited father-child interaction and made it more problematic:
He never asks about my wellbeing. The common conversation we have is money. He takes care of me when he has to, I mean when my mother is sick or absent. I was surprised when I saw he took my sister to the hospital when she got sick because
this is not something I would expect from my father. My father generally tells my mother, ‘your daughter is sick, let’s take her to the hospital’... He says, ‘your daughter’ instead of ‘my daughter.’ He always talks to my mom like ‘your daughter is arguing with me, say something to her’. I cannot help but feel some kind of coldness between us when this is the case.
The uninvolved parenting described using the term disinterest, in particular, was
indicated as one of the obstacles that prevents the participants from getting
emotionally closer to their fathers. They stated that their mothers were responsible for everything that mattered to them, and therefore, they developed a closer relationship
with their mothers:
I do not want to call him disinterested, but he has never shown any interest in anything so far... My father only brings money and gives it to my mother. She takes care of very complicated stuff. He does not take on responsibilities sufficiently. Because he is disinterested, I cannot help but get closer to my mother and share
everything with her. But I still feel I lack something.
144 Hilal CELIK Eurasian Journal of Educational Research 84 (2019) 135-158
Authoritativeness
Developing in parallel with the hierarchy between parent and child in the family,
the authoritarian father attitude was found to be another common attribute of the father in an unsatisfactory father-child relationship. The behaviors that the father (i) is
stricter and more nervous, (ii) recognizes the family members in a limited manner, (iii)
assigns particular importance to his own opinions when making decisions, and (iv) restricts communication compared to the mother were described as parenting
characteristics that characterize authoritativeness:
You have to adapt to his idea of a child. This idea includes a do’s and dont’s list. And he wants us to follow this list. He does not give strong reactions, or yell or beat us. But he is very clear when he says no. My mother also says ‘no’ sometimes, but she changes her idea. If my father says ‘no,’ there is no way to convince him.
Mothers: The relational fulcrum of the father-child communications
The participants’ narratives demonstrate that motherhood and the mother-child
relationship were defined by these youths using the themes of love and emotional
closeness. All of the participants stated that their relationship with their mother was never broken off, although they occasionally had conflicts, and the first person they
went to when they had a problem or something to tell was their mother, followed by
their siblings, friends, and cousins. Their narratives show that the parenting characteristics of the mothers, such as (i) close emotional and physical engagement, (i)
a tendency to engage in open communication, (iii) understanding, and (iv)
unconditional love/acceptance, were among the reasons that the mothers were preferred as the first person to communicate with in the family: “We are more close with
my mother; we can speak more comfortably.... She is usually calm. I feel she loves me... She clearly expresses her feelings and calls me ‘my son.’”
The participants revealed that their mothers served as a relational fulcrum of the
father-child communications in three ways: (i) functioning as a bridge, (ii) ensuring
the sustainability of communication, and (iii) making the father more open to communication.
Functioning as a Bridge
Common phenomenon experienced by all of the participants were that their open
and comfortable communication with the mother could not be established with the father, and they felt a need for the mother to act as a bridge for them to convey
messages easily to the father. Thirteen participants stated that when they needed to communicate with their father about something (asking for permission to go
somewhere, discussing academic issues, talking about the presence of a
girlfriend/boyfriend, etc.), they tended to talk to their mothers first, so that she could convey the message to the father instead of them directly talking to him. The
participants’ accounts show that (i) cultural issues, such as an intimate relationship
with the mother and a formal relationship with the father, (ii) the emotional distance of the father, (iii) not being listened to by the father, and the youths’ concern about
Hilal CELIK Eurasian Journal of Educational Research 84 (2019) 135-158
145
being criticized were the reasons for lack of direct communication between father and
child:
I think it is because it is a preconception in the society: They say, ‘one shouldn’t
talk to his father; you should go to your mother first.’ I have a boyfriend now. They both know about him. I told my mother, and she told my father. When I want to talk to my father, I usually ask my mother to mediate. We are not on bad terms, but I tend to ask my mother to mediate.”
Seven participants also stated that their fathers tended to communicate with them by asking their mothers to help, instead of directly communicating with them: “I tell
to my mother what I want to say to my father. As far as I have observed, this is the case in most families. Because it feels so difficult to go and talk directly to my father and ask something from him... I have tried a few times to consult him. He generally told me, ‘ask your mother’.... My mother is the bridge between us...”
Ensuring the sustainability of communication
Eleven of the participants stated that their mother assumed the roles of maintaining
communications and improving their relationship with their fathers. The mothers thus
contributed to the sustainability of father-child communications, especially in times of tension and emotional distance with the father:
My mother always says: ‘You love your father, and he loves you back.’ But sometimes our relationship can get really tense... because I sometimes happen to say something to him or give him hard feelings. My mother makes me sit and talks to
me. When there is a problem, my mother prevents it from growing. We experienced this several times. She acts in a remedial manner.
Making the father more open to communication
Eleven of the participants stated that they preferred to communicate with their fathers through their mothers in order to minimize the possibility of not being listened
to and rejected by them when they wanted to ask for permission or demand
something. The participants said that their fathers became softer and more open to communication in this way:
My mother tells this to my father in an appropriate way. My father reacts to my mother, and that reaction rebounds from my mother to us… when I need to ask for permission to go somewhere, I do not talk about it with my father. I would rather
go to my mother and say: ‘I will go out.’ If she wants me to go out, she says, ‘OK, go out; I will talk to your father,’ and she says it in a roundabout way... That is, my mother does not have a certain role. She adapts to each situation. She calms down my father if it is necessary. She softens him up.
Four participants emphasized that the mediator role of mothers in father-child
communications might be a dynamic that limits the father-child relationship in some
cases. They also stated that an obligatory communication might start between father and child when the mother did not act as a mediator. The same participants said that
they were confused about this issue, and they were concerned that their father-child
146 Hilal CELIK Eurasian Journal of Educational Research 84 (2019) 135-158
communications might not be deep enough, and so could remain superficial without the mother acting as a mediator: “Well, I communicate with my father in this atmosphere
of arguing, and our communication improves in this way. We open our hearts towards each other during our arguments, even if indirectly. He expresses his anger, and so do I. But on the other side, I could have a more superficial relationship with my father if it wasn’t for my mother. I don’t know.”
Problematic emotional reactions to family-interactions
Many of the participants emphasized that their fathers were unable to be totally
involved in the family system in an emotional sense, and therefore, they could not
define their family as a real family:
We eat dinner all together. I do not remember a time when we ate it separately, but our conversation is limited. If you happen to ask, ‘Do you have a solid family
structure?’ I would say no. It feels as if there is a separate family, including my mother, my sibling, and me. I feel attached to them in a different way. As I have said before, I do not count my father in the concept of our family as he is not really involved. But of course, he is my father.
The participants’ accounts indicate that this perception is common: “It is actually very
inconsistent. Sometimes I feel like I am not a real member of the family. And at other times, I feel like I am really ‘inside this family.’ There are times when I feel like they do not see or hear me at all. But in general, I feel like yes, I am from within this family. I know I am making
contradictory statements, but I don’t know the reason.”
Moreover, the participants' narratives indicate there is a common perception that a change in the emotional closeness and communications between father and child
might lead to a positive change in their sense of family belonging:
If I had a different relationship with my father, I think my relationship with my family would also be different. I would feel more committed. I would most likely look forward to spending time with them.
Discussion, Conclusion and Recommendations
Several important points were shared by the study participants, which have clinical and research implications for professionals working with families. Firstly, the
participants’ narratives demonstrate that these father-child relationships were not satisfactory from the viewpoint of the children when they communicated with their
father through their mother. They perceived their fathers as distant, authoritarian, and
less responsible in terms of household chores and childcare compared to their mothers, and these characteristics of the fathers led to the current unsatisfactory father-child
relationship.
Our analysis shows that the most significant factor in these unsatisfactory father-child relationships is the perceived distance from one another within the relationship.
This is characterized by lack of communication, and lack of emotional and physical
engagement. The statements of participants demonstrate that the father-child
Hilal CELIK Eurasian Journal of Educational Research 84 (2019) 135-158
147
communications became distant after the participants turned a certain age
(adolescence). The participants reported a communication gap and a lack of affectionate communication between father and child. These accounts reveal that lack
of emotional and physical engagement represents a significant aspect of the distant
father-child relationship. These findings indicate that these kinds of experiences between father and child are perceived as emotional wounds associated with a sense
of deprivation. This is a strong indicator of the dissatisfaction felt by these youths
regarding their relationship with their fathers.
Several researchers and theoreticians report that father-child (especially son)
communications change with the onset of adolescence for the child; the time spent
together declines, and less communication is maintained (Hosley & Montemayor, 1997; Kagitcibasi, 2010). Floy and Morman (2003) claimed that this is the result of
pressure that arose from the masculine gender roles on the father and his son. On the
other hand, Kagitcibasi (2010) argued that having relatively less communication with the father compared to the mother is one of the typical characteristics of Turkish
families. The father, who is affectionate towards small children and plays with them,
changes as the child grows up. Eventually, the father-child relationship starts to be characterized by authority and respect. A more distant relationship is established,
which inhibits the father from communication communicating with the child as it is
thought that compassion and intimacy may cause the child to become spoiled and disrespectful (Ataca, Kagitcibasi & Diri, 2007; Sunar & Fisek, 2005). Recently,
researchers have reported that adolescents and young adults from cities have engage
in less communication with their fathers compared to their mothers (Hortaçsu, 1989), and fathers usually do not talk to their young adult children; this leads to a two-way
lack of communication (Boratav et al., 2017). Barutcu and Hidir (2016) concluded in
their study that fathers could not be close to their own fathers, and they were always distant towards them. However, the quality of communication between father and
child is more valuable than its quantity (Punyanunt-Carter, 2007), meaning that the
quality of communication the child is having with the father defines the quality of the father-child relationship (Lamb, 2010; Pleck, 2010). The expression of verbal or non-
verbal affection contributes to the strength of the emotional closeness between father
and child, just like in any other relationship (Floyd, 2006). Floyd and Morman (2003) and Morman and Floyd (1999) found that affectionate communication (verbal,
nonverbal, and supportive) was positively correlated with both fathers’ and sons’ self-
disclosure, closeness, and relationship satisfaction. Boratav et al. (2017) found that the fathers had an intimacy problem with their own fathers, and they perceived this
problem as resulting from their own father’s inability to express their feelings, to not spending time with them, and to lack of communication and their fathers’ disinterest.
They also found that closeness with fathers is based on sharing activities rather than
emotions; many of their participants experienced a sense of deprivation resulting from a lack of emotional closeness in their fraternal relationship.
This study showed the uninvolved parenting attitudes of the fathers as another
important determinant of the unsatisfactory father-child relationship. The participants revealed that the main parenting tasks of the fathers were limited to providing for their

148 Hilal CELIK Eurasian Journal of Educational Research 84 (2019) 135-158
material needs, and that mothers were responsible for everything else (e.g., nurturing,
caring, supervising school life, etc.).
A number of recent studies report that although the roles and identities of fathers have recently changed, mothers continue to be the main caring figure for children,
while fathers hold a secondary position (Jacobs & Kelley, 2006; Mathew et al., 2006;
Vogel et al., 2011). Recent family research in Turkey (ACEV, 2017; Ataca, 2009; Boratav et al., 2017; Sunar, 2002) demonstrates that the roles of males and females, thus of
fathers and mothers, still are not equally balanced, despite a decline in gender
hierarchy within modern urban families. The comprehensive Turkey report of ACEV (2017) reported that the majority of fathers do not assume responsibility in childcare,
and that one of their main parenting responsibilities is maintaining the family [materially]. Ataca (2009) and Sunar and Fisek (2005) concluded that the expressive
and childcare roles of mothers are greater than for the fathers and that the financial
role of fathers is more significant than is the case for mothers despite recent changes in family relations in Turkey. However, neither mothers nor fathers have superiority
in terms of childcare. Both parents engage in childcare activities so that they can get to
know their children better, recognize their needs and problems, and become more sensitive towards them. When a parent takes an active role in childcare, the bond
between the child and the parent gets stronger. This is because the process of childcare
helps both the child and the parent get to know each other, recognize each other’s limits, and learn balance to apply in their relationship (Lamb, 2010). The emotional
bond between father and child may become problematic when the fathers assume a
limited role in childcare compared to mothers, and do not get involved adequately in the lives of their children.
The authority of fathers is another important determinant in the unsatisfactory
father-child relationship. The participants indicated that their fathers are stricter and more nervous, recognize the family members only in a limited manner, assign
particular importance to their own opinions, and restrict communication compared to
the mothers. These narratives also show that the fathers’ authoritarian parenting attitudes make the emotional distance between them and their children bigger and
cause their children to yearn for closeness.
Authoritarian parents usually attempt to arrange family relationships and responsibilities in a specific way: child care comes first, but is arranged according to
gender roles (Lamb, 2010; Pleck & Masciadrelli, 2004); the parents barely express
emotions and expect their statements to be accepted and followed without question by the child instead of resorting to negotiation and the parents keep a distance from
the child and spend little time with him/her to maintain parental authority (Bulanda,
2004; Gaertner, Spinrad, Eisenberg & Greving, 2007).
Compared to Western cultures, it is reported in Turkey that male and female roles
are clearly separate: mothers take the primary role in child care, while fathers
financially maintain the family, represent it, and take an authoritarian and disciplinary role in which they do not establish any physical and emotional closeness (Fisek, 2018;
Sunar & Fisek, 2005). Notably, Sancar (2011) stated that the “new fatherhood” in
Hilal CELIK Eurasian Journal of Educational Research 84 (2019) 135-158
149
Turkey represents a hybrid masculinity, including a mixture of the traditional and
modern rather than an antithesis of conservative/traditional masculinity. After that study appeared, some researchers reported that fathers today are less authoritarian
than the previous generation (Boratav et al., 2017; Barutcu & Hidir, 2016). However,
fathers’ roles are arranged according to patriarchal masculine codes even today, and fathers continue to maintain their authoritarian identities (ACEV, 2017; Bozok, 2018).
The second important result obtained in this study is related to the role of mothers
in father-child communications. The participants’ stated that their mothers were perceived as the family mediators in father-child communications. The mothers
assumed roles such as functioning as a bridge, ensuring the sustainability of father-
child communications, and making the father more open to communication. Our findings also show that motherhood was defined by these participants using the
themes of love and emotional sharing, and that mother-child communications were
never interrupted, despite conflicts. These findings are consistent with recent national and international research findings. Family research studies report that despite recent
changes in family structure and functions, mothers hold a central position in family
relations in several cultures, and in families today, mothers often assume a primary role in household chores and child care, while fathers occupy an
inferior/subordinate/peripheral position (Paquette & Bigras, 2010; Vogel et al., 2011).
Further, mothers assume a facilitating or inhibiting role in the father-child relationship (Puhman & Pasley, 2013). Some studies also report that mother-child communications
are much stronger than father-child communications, and that the mother and child
relationship is emotionally closer compared to that of father-child/ren (Jacobs & Kelley, 2006; Nielson, 2001; Mathew et al., 2006).
Recent family studies in Turkey indicate that the roles of males and females, thus
of fathers and mothers, still are not equally balanced, despite a decline in gender hierarchy within modern urban families (ACEV, 2017; Kagitcibasi, 2010; Sunar &
Fisek, 2005). Following an in-depth analysis of familial relationships, Fisek (1995)
argued that mothers and fathers are different concerning closeness towards their children in Turkish culture. Fisek (1995) found that mothers’ closeness towards their
children was more expressive (childcare, kissing, touching, etc.), whereas fathers’
closeness was instrumental (financial support, helping in decision-making etc.) also, there is a highly close boundary relation between mother and child. Boratov et al.
(2017) reported that open communication exists between mothers and sons, and that
they can express their love towards one another since there is no hierarchy between mothers and children. Boratov et al. (2017) also found that mothers occupy a mediator
role in father-child communications, and that this is significant in maintaining that communication.
The final important result obtained in this study is that in a family environment
wherein the mother occupies a mediator role in father-child communications, on an emotional level fathers are not perceived by their children as a real part of the family
system, which brings about a problem regarding the sense of family belonging for the
participants. This finding can be evaluated concerning the system theory and theoretical predictions of Kagitcibasi. According to the system theory, the family
150 Hilal CELIK Eurasian Journal of Educational Research 84 (2019) 135-158
system involving the father is a psychological system as well as a physical unit. The
communications and relationship patterns among family members allow the family to
be a psychological unit. Family members connect through verbal, nonverbal, and emotional exchanges and thereby become special individuals for each other. The
psychological and physical adaptation level of the family is set by information about
who is “present” and who is “absent” in the system. If it is not clear who is psychologically or physically absent or present in the system, the family system
becomes unbalanced (Boss, 2006). Morman and Floyd (1999) reported that fathers who
are technically "present” but functionally “absent” concerning parenting style (fathers who are physically present at home but do not get involved in the lives of their sons,
or do not psychologically support them) cannot establish close relationships with their children.
In the Turkey sample, the uncertainty regarding the psychological or physical
presence or absence of a family member may lead to a challenging situation in the family. This is because the modern Turkish family follows a family model that is built
upon a combination of “individualism and group (family) loyalty” and is
characterized by the emotional dependency of the members towards each other (Kagitcibasi, 2010). It is out of the question in Turkish culture to think an individual
may create an identity independent of his/her family (Nauck & Klaus, 2005).
Commitment to family is a significant value in Turkish culture (Kagitcibasi, 2010). In the family model as it is defined today in Turkey, distance based on power is reduced,
while distance arose from respect and attention is maintained, and emotional closeness
is high. In this model, family values are still more important than individual values, and the emotional bond between parent and child (mother and child in particular) is
emphasized (Sunar & Fisek 2005). However, Fisek (1995) underscored that boundary
relations in the Turkish family are multi-dimensional; there is a strong togetherness/mutuality between mother and child, which refers to an intense
emotional exchange, love, support, loyalty, and closeness, while there is also a
separation between father and child due to their relative distance within the structural hierarchy. Recent studies report that the emotional closeness between father and child
is less compared to the mother, and that mothers are perceived as more affectionate
compared to fathers (Ataca, 2009; Sunar 2002, 2009). Boratav et al. (2017) stated that the emotional closeness between father and child was not equivalent to the intimacy
observed between mother and child. Additionally, Hortacsu (1989) reported that less
communication was conducted between fathers and children. Given that the emotional closeness and level of communication between father and child are different
than for mother and child, and that fathers are perceived as relatively distant, render
the observed inconsistency in the sense of family belonging expressed by the participants in this study understandable.
This study is significant for its revelations that the father-child relationship in a
family environment wherein mothers occupy a mediator role in father-child communications does not represent a satisfactory relationship for the child, and that
this relationship is associated with a sense of deprivation by the children. The study is
also important because it shows that the mother-child relationship is defined by the
Hilal CELIK Eurasian Journal of Educational Research 84 (2019) 135-158
151
children using the themes of love and emotional sharing, that mothers are seen as
mediators in father-child communications, and this relationship with the parents leads to inconsistencies in perceptions of family belonging. These study findings can be
taken as indicators that the reported characteristics of fathers are similar to
“traditional” Turkish fatherhood characteristics, and thus the generational hierarchy between the father and child remains.
Another significant contribution of this study is that it reveals an inconsistency
between the culture of fatherhood and the conduct of fathering. Recent studies report that the father identity in Turkey has changed from that of the previous generation;
fathers are now allegedly more affectionate and caring. The majority of these studies
are based on the self-evaluations of fathers. On the other hand, this study includes an evaluation of fathers’ behaviors from the viewpoints of their children. Our findings
show that fathers are still perceived as distant by the children, despite changes in the
fatherhood identity in Turkey.
It is important to the father-child relationship that the themes of love and
communication mentioned by the children are truly incorporated in the relationship,
and that the fathers’ parenting practices reach a more egalitarian level with those of the mothers. Recent observations about a developing dominance of authoritarian and
oppressive behaviors in Anatolian cities, which inhibit individualism (Toprak, 2009),
make this requirement more important. Meeting these requirements will contribute to the reduction of inconsistencies between the culture and conduct of fathers. The
findings of this study can contribute to the evaluation of father-child and family
relationships in the collectivist culture.
References
Anne Cocuk Egitim Vakfi [ACEV] (2017). The involved fatherhood and its determinants in
Turkey: Executive summary Istanbul. Retrieved from
http://www.en.acev.org/wp-content/uploads/2018/01/1_involved-
fatherhood-and-its-determinants- in-turkey.pdf
Ataca, B. (2009). Turkish family structure and functioning. In S. Bekman & A. Aksu-Koc (Eds.), Perspectives on human development, family and culture (pp. 108-125).
Cambridge: Cambridge University Press.
Ataca, B., Kagitcibasi, C., & Diri, A. (2005). Turkish family and the value of children:
Trends over time. In G. Trommsdorff & B. Nauck (Eds.), The value of children
in cross-cultural perspective (pp. 91-119). Lengerich, Germany: Pabst.
Barnes, H. L., & Olson, D. H. (1985). Parent-adolescent communication and the Circumplex Model. Special Issue: Family Child Development, 56(2), 438-447.
152 Hilal CELIK Eurasian Journal of Educational Research 84 (2019) 135-158
Barutcu, A., & Hidir, N. (2016). Turkiye’de babaligin degişen rolleri: (Pro)feminist
babalar [The changing role of fatherhood in Turkey: (Pro)feminist fathers]. Feminist Elestiri 8(2), 27-45.
Boratav-Bolak, H., Fisek, G. O., & Ziya, H. E. (2017). Erkekligin Turkiye halleri [Turkish
forms of masculinity]. Istanbul, Turkey: Bilgi University Press.
Boss, P. (2006). Loss, trauma, and resilience: Therapeutic work with ambiguous loss. New
York: Norton.
Bozok, M. (2018). Ebeveynlik, erkeklik ve çalisma hayati arasinda Turkiye’de Babalik. Tırkiye’de Babalıgı anlamak Serisi II [Fatherhood in Turkey amongst parenting,
masculinity, and working life: To understand the paternity series in Turkey II]
Istanbul, Turkey: ACEV Press.
Brown, L., Callahan, M., Strega, S., Walmsley, C., & Dominelli, L. (2008).
Manufacturing ghost fathers: The paradox of father presence and absence in child welfare. Child and Family Social Work, 14, 25-34.
Bulanda, R. E. (2004). Paternal involvement with children: The influence of gender ideologies. Journal of Marriage and Family, 66(1), 40-45.
Fisek, G. O. (2018) Iliski icinde ben: Kultur, aile, bireysellesme ve psikanalitik arayıslar [“I”
into the relationship: Culture, family, individuation and psychoanalytic
searches]. Istanbul, Turkey: Bilgi Unversity Press.
Fisek, G. O. (1995). Gender hierarchy: Is it useful concept in describing family culture? In J. van Lawick &M. Sanders (Eds.), Family, gender and beyond (pp. 63-72).
Heemstede, Netherlands: LS Books.
Floyd, K., & Morman, M. T. (2003). Human affection exchange: II. Affectionate communication in father–son relationships. Journal of Social Psychology, 143(5),
599–612.
Floyd, K., & Morman, M. T. (2005). Fathers' and sons' reports of fathers' affectionate communication: Implications of a naïve theory of affection. Journal of Social and
Personal Relationships, 22, 99-109.
Gaertner, B. M., Spinrad, T., Eisenberg, N., & Greving, K. A. (2007). Parental childrearing attitudes as correlates of father involvement during infancy. Journal of Marriage and Family, 69(4), 962-976.
Hosley, C. A., & Montemayor, R. (1997). Fathers and adolescents. In M. E. Lamb (Ed.), The role of the father in child development (pp. 162-178). Hoboken, NJ, US:
John Wiley & Sons Inc.
Hortacsu, N. (1989). Targets of communication during adolescence. Journal of Adolescence, 12, 253-263.
Jacobs, J. N., & Kelley, M. L. (2006). Predictors of paternal involvement in childcare in dual-earner families with young children. Fathering, 4(1), 23-47.
Hilal CELIK Eurasian Journal of Educational Research 84 (2019) 135-158
153
Kagitcibasi, C. (2010). Benlik, aile ve insan gelisimi kulturel psikoloji [Family, self, and
human development across cultures: Theory and applications]. Istanbul, Turkey: Koç University Press.
Lamb, M. (2000). The history of research on father involvement: An overview. Marriage
and Family Review, 29, 23–42.
Lamb, M. E. (2010). How do fathers influence children’s development? Let me count the ways. In M. E. Lamb (Ed.). The role of the father in child development (5th ed.,
pp. 1–26). New Jersey: John Willey & Sons.
Lincoln, Y. S. & Guba, E. G. (1985) Naturalistic Inquiry. Newbury Park, CA: SAGE
Publications Inc.
Matthews, A., Derlega, V. J., & Morrow, J. (2006). What is highly personal information and how is it related to self-disclosure decision making? The perspective of college students. Communication Research Reports, 23, 85-92.
Morman, M. T., & Floyd, K. (1999). Affectionate communication between fathers and young adult sons: Individual- and relational-level correlates. Communication
Studies, 50, 294-309.
Morman, M. T., & Floyd, K. (2002). A ‘changing culture of fatherhood’: Effects on affectionate communication, closeness, and satisfaction in men’s relationships with their fathers and their sons. Western Journal of Communication, 66(4), 395–
411.
Morman, M. T., & Floyd, K. (2006). Good fathering: Father and son perceptions of what it means to be a good father. Fathering, 4(2), 113-136.
Nauck, B. & Klaus, D. (2005). Families in Turkey. In B. N. Adams and J. Trost (Eds.) Handbook of World Families, (pp. 364-88). Thousand Oaks, CA: Sage.
Nielsen, L. (2001). Fathers and daughters: Why a course for college students? College
Student Journal, 35, 280-312.
Noller, P., & Callan, V.J. (1990). Adolescents’ perceptions of the nature of their communication with parents. Journal of Youth and Adolescence, 19, 349-362.
Olson, D. H. (2000). Circumplex model of marital and family systems. Journal of Family Therapy, 22, 144-167.
Paquette, D. & Bigras, M. (2010). The risky situation: A procedure for assessing the fatherchild activation relationship. Early Child Development and Care, 180(1-2),
33-50.
Pleck, E., & Pleck, J. H. (1997). Fatherhood ideals in the United States: Historical dimensions. In M. E. Lamb (Ed.), The role of the father in child development 3rd ed.
(pp. 33–48). New York: Wiley.
154 Hilal CELIK Eurasian Journal of Educational Research 84 (2019) 135-158
Pleck, J. H. (2010). Paternal involvement: Revised conceptualization and theoretical linkages with child outcomes. In M.E. Lamb (Ed.). The role of the father in child
development (5th ed., pp. 58–93). New York: John Wiley & Sons, Inc.
Pleck, J. H., & Masciadrelli, B.P. (2004). Paternal involvement by U.S. residential fathers: Levels, sources and consequences. In M.E. Lamb (Ed.), The role of the
father in child development (4th ed., pp. 222-271). Hoboken, NJ: Wiley.
Puhlman, D. J., & Pasley, K. (2013). Rethinking maternal gatekeeping. Journal of Family
Theory & Review, 5(3), 176-193.
Punyanunt-Carter, N. M. (2007). Using attachment theory to study satisfaction in father-daughter relationships. Human Communication, 10(2), 103 – 120.
Sancar, S. (2011). Erkeklik: Imkânsiz iktidar: Ailede, piyasada ve sokakta erkekler
[Masculinity: Impossible potency, men in the family, on the marketplace and
the street]. Istanbul, Turkey: Metis Press.
Smith, J. A., & Osborn, M. (2003). Interpretative phenomenological analysis. In J. A. Smith (Ed.), Qualitative psychology: A practical guide to research methods (pp. 51-
80). Thousand Oaks, CA, US: Sage Publications, Inc.
Sunar, D. (2002). Change and continuity in the Turkish middle class family. In E. Ozdalga & R. Liljestrom (Eds.), Autonomy and dependence in family: Turkey and
Sweden in critical perspective (pp. 217-238). Istanbul: Swedish Research Institute.
Sunar, D. (2009). Mothers' and fathers' child-rearing practices and self-esteem in three generations of urban Turkish families. In S. Bekman & A. Aksu-Koc (Eds.), Perspectives on human development, family and culture (pp. 126-139). Cambridge:
Cambridge University Press.
Sunar, D., & Fisek, G. (2005). Contemporary Turkish families. In U. Gielen & J. Roopnarine (Eds.), Families in global perspective (pp. 169-183). Boston, MA: Allyn
& Bacon.
Vogel, C. A., Bradley, R. H., Raikes, H. H., Boller, K., & Shears, J. K. (2006). Relation between father connectedness and child outcomes. Parenting: Science and
Practice, 6(2-3), 189-209.
Hilal CELIK Eurasian Journal of Educational Research 84 (2019) 135-158
155
Baba-Çocuk İletişiminde Annenin Aracılık Rolü ve Aile İlişkileri
Atıf:
Celik, H. (2019). The mediator roles of mothers in father-child communications and family relationships. Eurasian Journal of Educational Research, 84, 135-158, DOI:
10.14689/ejer.2019.84.7
Özet
Problem Durumu: Üyeler arasındaki iletişim tarzı ve iletişim kalitesi aile ilişkilerin en
önemli belirleyicilerinden biridir. Aile iletişimi üyelerin birbirlerine bağlanmasının ve ailenin sağlıklı bir şekilde işlevlerini getirmesinin ön koşullarından biri olarak işaret
edilir. Ancak ailedeki her üyenin birbiriyle aynı şekilde iletişim kurmadığını gerek
ebeveynlerin çocuklarıyla, gerekse çocukların da ebeveynleriyle iletişim kurma tarzları açısından belirgin farklılıkların olduğunu gözlemlenmektedir. Gözlemler
özellikle ailedeki kadın üyelerinin iletişim becerilerinin erkek üyelerinin iletişim
becerilerinden daha güçlü ve dolayısıyla anne-çocuk iletişiminin baba-çocuk iletişimine nazaran daha kaliteli ve doyum sağlayıcı olduğunu işaret eder. Gözlemler
aynı zamanda baba-çocuk iletişim örüntülerinin 21. yüzyıldaki yeni babalık kimliğine
göre yeniden şekillendiğini ve günümüz babalarının bir önceki kuşak babalara nazaran daha sevecen ve iletişime daha açık olduklarını göstermektedir. Ne var ki
Türkiye’de anne-çocuk iletişimin baba-çocuk iletişiminden daha güçlü, babayla
iletişiminin görece daha sınırlı olduğu ve çocukla ilgili konularda annelerin birincil, babaların ise daha daha ikincil konumda kaldığı gözlemlenmeye devam etmektedir.
Aile ilişkilerinde ciddi değişimler gözlemlenmesine rağmen günümüz Türkiye’sinde
orta sınıfa mensup birçok ailede baba-çocuk iletişiminde annenin aracılık görevi görmesi yani evladın babasına göndermek istediği mesajı annesi aracılığıyla babasına
iletmesi ise sıklıkla rastlanan bir olgudur.
Amaç: Bu çalışmada baba-çocuk iletişiminde annelerin aracı olduğu aile ortamında
büyüyen gençlerin (1)baba-çocuk ilişkisi nasıl algıladıklarını (2) baba-çocuk iletişimde
annelerin hangi rolleri üstlendiklerini (3) baba-çocuk iletişiminde annelerin aracı
olduğu bir aile ortamında büyümenin aile yaşamlarına nasıl yansıdığının özününün ortaya çıkarılması amaçlanmıştır.
Yöntem: Bu araştırmada katılımcıların babalarıyla olan iletişimlerinin ve bu
iletişimdeki anne rolünün baba-çocuk ilişkisi ve aile yaşamı üzerindeki yansımalarına
ilişkin ortak deneyimlerinin ve inşa edilen ortak anlamların özünü yakalamak
amacıyla yorumlayıcı fenomonoloji deseninden (Interpretive Phenomenological Analyses- IPA) yararlanılmıştır. Homojen örnekleme yöntemi kullanıldığı çalışmanın
örneklemini Marmara Üniversitesinde Psikolojik Danışmanlık ve Özel Eğitim
Öğretmenliği bölümünde öğrenim gören 19-24 yaş aralığındaki (x = 21.33) 9 kadın, 6 erkek lisans öğrencisi oluşturmuştur. Veriler, derinlemesine görüşme yöntemiyle
toplanmış ve görüşmelerde yarı-yapılandırılmış görüşme soruları kullanılmıştır.
156 Hilal CELIK Eurasian Journal of Educational Research 84 (2019) 135-158
Verilerin analizinde MaxQDA programı kullanılmış olup Smith ve Osburn’un (2003)
dört aşamalı verilerin analiz adımları takip edilmiştir.
Bulgular: Bu çalışmada üç ana temaya ulaşılmıştır: (1) tatmin edici olmayan baba-çocuk ilişkisi, (2) anneler: baba-çocuk iletişiminin ilişkisel dayanak noktası, (3) aile etkileşimlerinde sorunlu duygusal tepkiler. Analiz sonuçları, tatmin edici olmayan baba-çocuk ilişkisinin
babaların üç temel ebeveynlik özelliğiyle karakterize olduğunu göstermiştir: (i) mesafe,
(ii) sınırlı ebeveynlik rolü ve (iii) otoriterlik. Katılımcı öyküleri baba-çocuk iletişiminin
ilişkisel dayanak noktası olarak algılanan anneliğin ise sevgi ve duygusal paylaşım
temalarıyla tanımlandığını ve baba-çocuk iletişimine annelerin üç açıdan hizmet ettiğini ortaya koymuştur: (i) köprü görevi, (ii) iletişimin sürdürülebilirliğini sağlama, (iii) babayı iletişime açık hale getirme. Son olarak analizler aile etkileşimlerinde algılanan
sorunlu duygusal tepkilerin babaların duygusal açıdan aile sitemine tam olarak dâhil
olamamalarıyla ilişkili olduğunu göstermiştir.
Sonuç ve Öneriler: Bu çalışma baba-çocuk iletişiminde annelerin aracı rol üstlendiği bir
aile ortamındaki baba-çocuk ilişkisinin evladın gözünde doyum sağlayıcı bir ilişki
olarak algılanmadığını ve deneyimlenen bu ilişkinin onlarda yoksunluk hissi yaratan bir tür ilişkisel yara olarak algılandığını ortaya çıkarması bakımından önemlidir.
Katılımcı öyküleri babaların mesafeli, otoriter ve ev-çocuk bakımında anneye kıyasla
daha az sorumluluk alan ebeveyn olarak algılandıklarını ve babaların bu özelliklerinin tatmin edici olmayan baba-çocuk ilişkisinin oluşumuna hizmet ettiğini işaret etmiştir.
Çalışma anne-çocuk ilişkisinin sevgi ve duygusal paylaşım temaları üzerinden
tanımlandığını açığa çıkarması ve annelerin baba-çocuk iletişimin temel ilişkisel dayanağı olarak algılandığını göstermesi bakımından ayrıca önemlidir. Bu çalışma
annelerin baba-çocuk iletişiminde köprü görevi görme, baba-çocuk iletişimin
sürdürülebilirliğini sağlama, babayı iletişime açık hale getirme gibi roller üstlendiklerini göstermiştir. Bu çalışma baba-çocuk iletişiminde annenin aracılık rolü
üstlendiği aile ortamında babaların duygusal açıdan aile sistemin tam olarak bir
parçası olarak algılanmadığını göstermesi ve ebeveynlerle olan ilişkilerin aile aidiyet duygusunda tutarsızlıklara yol açtığını göstermesi bakımından ayrıca önemlidir.
Çalışma bulguları babaların sahip olduğu babalık özelliklerinin geleneksel babalık
özellikleriyle ilişkili olabileceğini dolayısıyla baba-çocuk arasında kuşak hiyerarşisinin devam ettiğini göstergesi olarak değerlendirilebilir. Çalışma babalık kültürü ve
babalık icrası arasında bir tutarsızlığa işaret etmesi bakımından önemlidir. Son dönem
araştırmaları Türkiye’de babalık kimliğinin bir önceki kuşaktaki babalık kimliğine göre değiştiğini ve babaların daha sevecen ve daha ilgili olduklarını bildirmektedir.
Ne varki ilgili çalışmaların çoğu babaların kendi babalık davranışlarını değerlendirmelerine dayanır. Bu çalışma ise evladın gözünden babalık davranışlarını
değerlendirmesi içermektedir. Çalışma bulguları babalık kimliğinin değişime rağmen
evladın gözünden hala daha uzak ve mesafeli ebeveyn olarak algılanmaya devam ettiğini işaret etmektedir.
Bu çalışma baba-çocuk ikili ilişkisinin, baba-çocuk özelinde gerçekleşmesine,
ilişkideki sevgi ve iletişim temalarının çocuğun ihtiyaçlarına ve beklentilerine göre yeniden tanımlanmasına, ebeveynlik pratiklerinin daha eşitlikçi bir seviye taşınmasına
duyulan ihtiyacı ortaya çıkarması bakımından önemlidir. Günümüzde Anadolu
Hilal CELIK Eurasian Journal of Educational Research 84 (2019) 135-158
157
kentlerinde bireyselliğe izin vermeyen yetkeci ve baskıcı bir kültürün egemen olmaya
başladığına dair gözlemler bu ihtiyacı daha da önemli kılar. Bu ihtiyaçların karşılanması babalık kültürü ve babalık icrası arasındaki tutarsızlıklarında azalmasına
katkı sağlayacaktır. Bu çalışmanın bulguları kollektivist kültürdeki baba-çocuk ve aile
ilişkilerini değerlendirme katkı sağlayabilecek niteliktedir.
Bu yorumlayıcı fenomenoloji araştırması baba-çocuk iletişiminde annelerin aracı
olduğu aile ortamındaki baba-çocuk ilişki dinamiğini ve bunun aile yaşamına olan
yansımalarını anlaşılmasını sağlamak için tasarlanmıştır. Örneklemin büyüklüğü ve homojenliği yorumlayıcı fenomenoloji araştırmalarının belirli bir gurup insanın belli
bir olay karşısında verdiği tepkilerin ayrıntılı bir şekilde açıklanmasını yapabilme
vaadini karşılamaktadır. Elde edilen bulgular genelleme amacı taşımamaktadır. Bu çalışma orta sınıfa mensup ailelerde büyüyen gençlerin deneyimlerini anlamada
önemli bir adımdır. Ancak araştırma yalnızca evlatların deneyimlerini yansıtmaktadır.
Hem babaların, hem annelerin hem de evlatların deneyimlerinin karşılaştırmalı olarak değerlendirmesinin yapılması alan yorumların daha zenginleşmesini ve aile
ilişkilerine yönelik daha bütünlükçü bir resmin elde edilmesine katkı sağlayacaktır.
Anahtar Kelimeler: Baba-çocuk ilişkisi, anne-çocuk ilişkisi, iletişim, aile etkileşimi, Türk
aileleri.

Euras ian Journal of Educational Research 84 (2019) 159-176 Eurasian Journal of Educational Research
www.ejer.com.tr
Narcissism, Life Satisfaction, and Harmony: The Mediating Role of Self-Esteem and Self-Compassion
Ibrahim DEMIRCI1, Halil EKSI2, Fusun EKSI3
A R T I C L E I N F O A B S T R A C T
Article History: Purpose: The present study aims to investigate the
relationships between the two distinct faces of
narcissism (admiration and rivalry), the two faces of self-perception (self-esteem and self-compassion) and the two faces of one’s evaluation of life (life satisfaction and harmony in life). Research Methods: The sample of this study consists
of university students (N = 381). In this study, Narcissistic Admiration and Rivalry Questionnaire, Self-compassion Scale, Self-esteem Scale, Satisfaction
with Life Scale, Life Harmony in Life Scale was employed as data collection tools. The relationship between variables was investigated using Structural Equation Modeling. Results: The structural equation modeling used in this
study revealed that self-esteem mediated the relationship between narcissistic admiration, harmony in life, and life satisfaction whereas self-compassion
Received: 28 Nov. 2018
Received in revised form: 12 Jun. 2019
Accepted: 18 Jul. 2019 DOI: 10.14689/ejer.2019.84.8
Keywords
Narcissistic admiration and rivalry, self-esteem, self-compassion, life satisfaction, harmony in life, positive psychology
mediated the link between narcissistic rivalry, harmony in life, and life satisfaction. Implications for Research and Practice: Based on the results of this research, it is suggested
that additional empirical and longitudinal studies should be conducted. as In this context,
individual and group counseling practices aimed at developing self-compassion and self-esteem, increasing life harmony and life satisfaction can be organized. Conclusion: In light of the results obtained in this study, we argue that high levels of
narcissistic admiration accompanied by self-esteem may lead to increased harmony in life and
life satisfaction. As narcissistic rivalry increases, self-compassion, harmony in life, and life satisfaction decrease. Lower self-compassion may explain the tendency of people higher in narcissistic rivalry to report less harmony in their life and lower life satisfaction.
© 2019 Ani Publishing Ltd. All rights reserved
1 Sinop University, Turkey, e-mail: [email protected] ORCID: https://orcid.org/0000-0002-4143-3916 2 Marmara University, Turkey, e-mail: [email protected] ORCID: https://orcid.org/0000-0001-7520-4559
3 İstanbul Medeniyet University, Turkey, e-mail: [email protected] ORCID: https://orcid.org/0000-0001-
5741-2725
160 Ibrahim DEMIRCI – Halil EKSI – Fusun EKSI Eurasian Journal of Educational Research 84 (2019) 159-176
Introduction
One of the most important focal points of the efforts to understand human beings
is self-concept. Self-concept can be described as the way that one perceives himself
and one’s beliefs about himself. Self-concept can simply be framed as mental schemes. Self-evaluation is expressed as the answer to the question: “What do I feel
about who I am?” (Campbell & Lavallee, 2013). Answers to this question exhibit an
enormous range of feelings, including glorious, confident, and compassionate. The grandiose representation of the self is called narcissism. Because of the individual
and social consequences of narcissism, narcissism can often be perceived as an insult.
However, it is emphasized that narcissism has short-term positive results (Back et al., 2013; Miller & Campbell, 2011). There is no single way of perceiving the self, and
narcissism has no single aspect. It may be useful to investigate how the positive
consequences of narcissism occur. At this point, self-esteem may be playing a key role. On the other hand, narcissism has an evil face (Lange, Crusius & Hagemeyer,
2015). How narcissism negatively affects psychological well-being is another subject
of the study. Lack of self-compassion may also play an important role in this regard. This study aims to investigate the relationship between (i) narcissism, self-
compassion, and self-esteem, all of which manifest different ways of self-perception,
and (ii) harmony in life and life satisfaction, which are different manifestations of one’s perception of life.
Different Ways of Self-perceptions: Self-esteem, Narcissism, and Self-compassion
While one’s knowledge about himself forms an individual’s self-concept, how one feels about himself constitutes an expression of self-esteem. In this context, self-
esteem emerges as a result of one’s self-evaluation (Campbell & Lavallee, 2013).
One’s experiences and his way of evaluating these experiences are what shapes this perception (Myers & Myers, 1992; Shavelson, Hubner & Stanton, 1976). In the
literature, emotional evaluations about one’s self are generally defined as self-esteem
(Coopersmith, 1967; Rosenberg, 1965). High self-esteem is an individual’s positive evaluation of himself, whereas this evaluation is either vague or negative in low self-
esteem. People follow various strategies to achieve and maintain the desired level of
high self-esteem (Zeigler-Hill, 2013).
People with high self-esteem and high narcissism share positive perceptions of
their self, which include loving and admiring themselves. Narcissists can be said to
have an extremely positive or inflated self-concept (Campbell, Rudich, & Sedikides, 2002). Associated with high self-esteem, narcissism is generally expressed as an
excessive perception of the self and hypersensitivity to feedback received from others
(Barry, Loflin & Doucette, 2015). Narcissism is not always pathological, and the features of normal and non-pathological narcissism may be connected to self-esteem
(Miller & Campbell, 2011). In studies investigating the link between narcissism and
self-esteem, two studies that are found to be positively related (see Bosson et al., 2008; Bosson & Weaver, 2011).
Research shows that it can be more useful to evaluate narcissism as a two-
component model. One of the common two-component conceptualization is the
Ibrahim DEMIRCI – Halil EKSI – Fusun EKSI Eurasian Journal of Educational Research 84 (2019) 159-176
161
Grandiose and Vulnerable Narcissism model (Back, 2018; Back et al., 2013; Bosson &
Weaver, 2011). Grandiose narcissism includes greatness, arrogance, aggression, dominance, exhibitionism, extraversion, and high self-confidence, whereas
vulnerable narcissism reflects the characteristics of introversion, hostility, and low
self-esteem (Miller & Campbell, 2011; Wink, 1991). The Narcissistic Admiration and Rivalry Model deployed in this study describes two different positively-related
dimensions of grandiose narcissism. Narcissists use two different social strategies to
protect their main objective, that is, the glorified self. One strategy is to make themselves known to ensure social admiration, whereas the other is to defend
themselves to prevent social failure. The self-regulating processes of grandiose
narcissism may be explained by admiration (narcissism’s assertive aspect), which directs through one’s desire for self-enhancement, and by rivalry (narcissism’s
antagonistic aspect), which is based in narcissistic self-protection. Although these
two strategies follow different emotional-motivational, cognitive, and behavioral paths, both are positively related to each other, as they contribute to maintaining the
primary goal, namely the glorified self. In this context, narcissistic admiration is the
bright face of narcissism, whereas narcissistic rivalry represents its dark face (Back, 2018; Back et al., 2013; Leckelt et al., 2018).
There is no single way of perceiving the self positively. In contrast to self-esteem
and narcissism, self-compassion offers an alternative way of perceiving the self and derives its origin from Buddhist psychology. Self-compassion is defined as self-
judgment against self-consciousness following a person's encounter with pain, as the
feeling of loneliness against a common shared feeling that all people live after experiencing a pain, by the interaction of extreme dilemmas of identity with each
other, against the conscious awareness of what is happening (Neff, Whittaker & Karl,
2017). Self-compassion, similar to self-esteem, is an approach that involves self-acceptance rather than self-evaluation (Neff 2003, 2016). Studies show that not only is
self-compassion more stable than self-esteem it is also more strongly related to
psychological health. In this context, although self-compassion and self-esteem are interrelated, they are, in fact, different concepts entirely (Neff, 2011). In this regard,
narcissistic rivalry employing self-defence as a self-regulatory mechanism of
narcissism (Alicke & Sedikides, 2011; Back, 2018; Back et al., 2013) may exhibit a negative relationship with self-compassion. Moreover, narcissistic admiration
employing self-enhancement as a self-regulatory mechanism of narcissism (Alicke &
Sedikides, 2011; Back, 2018; Back et al., 2013) may exhibit a positive relationship with self-esteem.
Different Ways of Well-being: Life Satisfaction and Harmony in Life
Studies in psychology generally describe happiness as subjective well -being. According to the cognitive component of this approach, life satisfaction is inclusive
of a person’s positive evaluation of his life (Diener, 1984; Diener, Suh, Lucas & Smith,
1999). On the other hand, since intercultural studies indicate that the meaning of happiness may differ from culture to culture, the cognitive component of happiness
may not always equate to life satisfaction. In Western cultures, a high level of
162 Ibrahim DEMIRCI – Halil EKSI – Fusun EKSI Eurasian Journal of Educational Research 84 (2019) 159-176
happiness, self-esteem, and autonomy are sought, whereas in Eastern cultures,
dialectical happiness where good and evil coexist, social harmony, and being
connected with others are regarded as important (Uchida & Ogihara, 2012).
Although several studies show that people are in a relationship with others and
nature, evaluating the cognitive component of happiness solely on the individual
level is, from time to time, deemed as incomplete (Kjell, 2011). On that note, harmony in life, which can be expressed as an alternative to life satisfaction, includes the sense
of internally felt self-acceptance, inner peace, and balance. Harmony in life includes
one’s perception of harmony and balance in his life and a sense of being in harmony with the greater world. Harmony in life is regarded as an indicator of sustainable
well-being (Kjell, Daukantaitė, Hefferon & Sikström, 2016).
The Present Study
Regarding the subject matter of the present student, various studies found that
while narcissistic admiration was positively related to self-esteem, narcissistic rivalry
showed a negative relationship with self-esteem (Back, 2018; Back et al., 2013; Leckelt et al., 2018). However, there are studies in which narcissistic rivalry does not
correlate with self-esteem also exist (Geukes et al., 2017). In one study, the narcissistic
rivalry was found to be unassociated with optimal self-esteem, whereas narcissistic admiration was a positive predictor of optimal self-esteem (Rogoza, Żemojtel-
Piotrowska, Kwiatkowska, & Kwiatkowska, 2018). Based on these studies,
narcissistic admiration may be positively related to self-esteem, and that narcissistic rivalry may be entirely unrelated to self-esteem.
Studies investigating the relationship between self-compassion and psychological
health have consistently emphasized that self-compassion increases such characteristics as life satisfaction and happiness while reducing depression and
anxiety (Neff, 2016; Neff et al., 2007; Deniz & Sümer, 2010; Deniz, Arslan, Ozyesil &
Izmirli, 2012; Zessin, Dickhauser & Garbade, 2015). While narcissism is generally positively related to self-esteem, it is often found to be unrelated to self-compassion
(Neff, 2011; Neff & Vonk, 2009). While self-compassion is unrelated to grandiose
narcissism, it can show negative relationships with vulnerable narcissism (Barry et al., 2015) and pathological narcissism (Barnett & Flores, 2016). Self-compassion is
positively related to self-esteem and life satisfaction (Deniz, Kesici & Sümer, 2008).
Based on these studies, narcissistic rivalry may be negatively associated with self -compassion and that narcissistic-admiration may be unrelated to self-compassion.
Narcissistic admiration was negatively correlated with emotional instability and
positively correlated with extroversion, openness to experience, and self-esteem. On the other hand, narcissistic rivalry was negatively associated with extraversion,
mildness, responsibility, self-esteem, empathy, forgiveness, and gratitude and, on the other, positively correlated with emotional instability, revenge, interpersonal
insecurity, impulsivity, and anger (Back et al., 2013; Leckelt et al., 2018). These
studies reveal that admiration is an adaptive and that rivalry a maladaptive aspect of narcissism. In the previous studies, overt narcissism, which bears similarity to
narcissistic admiration, was found to be positively associated with life satisfaction.
Ibrahim DEMIRCI – Halil EKSI – Fusun EKSI Eurasian Journal of Educational Research 84 (2019) 159-176
163
Covert narcissism, similar to the narcissistic rivalry, is negatively related to life
satisfaction. Overt and covert narcissism have been shown to predict life satisfaction through self-esteem (Rose, 2002). Similarly, Sedikides, Rudich, Gregg, Kumashiro
and Rusbult (2004) have revealed that narcissism is positively related to well-being
and negatively related to depression and anxiety. In addition, the relation between narcissism and well-being is fully mediated by self-esteem. Also, Grove, Smith,
Girard and Wright (2018) have found that life satisfaction, psychological well-being,
and positive affect are positively correlated with narcissistic admiration and negatively correlated with narcissistic rivalry. In this regard, two hypotheses have
been established: (1) Self-esteem plays a mediating role in the relationship between
narcissistic admiration and harmony in life and life satisfaction. (2) Self-compassion plays a mediating role in the relationship between narcissistic rivalry and harmony
in life and life satisfaction.
Understanding the self is one of the most fundamental topics of psychology research. Explaining how different ways of the self is effect well-being can provide
useful information to researchers and practitioners. Examining these relationships
can provide us with vital information to understand these personality dynamics.
Method
Research Design
In this study, the relational descriptive model was used to investigate the
relationship between narcissism, self-compassion, and self-esteem, life satisfaction and harmony in life. The relationships were examined using structural equation
modeling.
Research Sample
The sample of this research consisted of 381 voluntary university students in
Istanbul, Turkey. Of the total, 310 (77.9%) were female and 71 (17.8%) male students.
The study group was reached by convenience sampling. Participants’ ages ranged from 21 to 24, with their average age being 23.1 (SD = 1.01). The participants were
attending from the Faculty of Education. Of the total, 28 (7.3%) of them were juniors,
196 (51.4%) of them were seniors and 145 (38.1%) of them were graduate students. Of the total, 148 (39.3%) of them were first child, 117 (31%) of them were middle child,
and 112 (29.7%) of them were the last child.
Research Instruments and Procedures
Narcissistic Admiration and Rivalry Questionnaire: The questionnaire was
developed by Back et al. (2013). The questionnaire measures grandiose narcissism through the dimensions of admiration and rivalry. The scale consists of 18 items (e.g., I deserve to be seen as a great personality). Having a two-dimensional structure, the scale is scored using a 6-point Likert type (1= not agree at all to 6 = agree completely). Possible scores of the scale ranged from 9 to 54 for admiration and
164 Ibrahim DEMIRCI – Halil EKSI – Fusun EKSI Eurasian Journal of Educational Research 84 (2019) 159-176
rivalry subscales. The questionnaire adapted to Turkish by Demirci and Eksi (2017). The factor structure of the questionnaire was found to be at an acceptable fit as a result of the confirmatory factor analysis. The internal consistency coefficient of the scale was found to be .83 for admiration and .82 for rivalry.
Self-compassion Scale: The scale developed by Neff (2003) consists of six subscales
and 26 items. Raes, Pommier, Neff, and Van Gucht (2011) developed a Short Self-Compassion Scale consisting of 12 items (e.g., When I fail at something important to me, I become consumed by feelings of inadequacy). The scale is scored using a 5-point Likert type (1= almost never to 5 = almost always) that could be used as a total score. The possible score of the scale ranged from 12 to 60. The scale was adapted to Turkish by Akca (2014). The test-retest correlation coefficient of the scale was found .75.
Self-esteem Scale: The scale was developed by Rosenberg (1965) and adapted to
Turkish by Cuhadaroglu (1986). Having a one-dimensional structure, the scale consisted of 10 items (e.g., I take a positive attitude toward myself). The scale is scored using a 4-point Likert type (1 = very true to 4 = so wrong). The possible score of the scale ranged from 4 to 40. The scale was adapted to Turkish by Cuhadaroglu (1986). The test-retest correlation coefficient of the scale was found .75.
Satisfaction with Life Scale: The scale was developed by Diener, Emmons, Larsen
and Griffin (1985). The scale consists of five items (e.g., In most ways, my life is close to my ideal). The scale has a one-dimensional structure and consists of five 7-point Likert type (1 = strongly disagree to 7 = strongly agree). The possible score of the scale ranged from 5 to 35. The scale was adapted to Turkish by Durak, Senol-Durak, and Gencoz (2010). In the confirmatory factor analysis of the Turkish versions of the scale, the one-dimensional structure was found to be an acceptable fit. The item-total test correlations for the items of the measure were found to vary between 55 and 63. Internal consistency of the scale was found .81.
Harmony in Life Scale: The scale composed of five 7-point Likert type items and one
dimension, the Harmony in Life Scale was developed by Kjell et al. (2016). The scale has a one-dimensional structure and consists of five items (e.g., Most aspects of my life are in balance). The scale is scored using a 7-point Likert type (1 = strongly disagree to 7 = strongly agree). The possible score of the scale ranged from 5 to 35. The scale adapted to Turkish by Satici and Tekin (2017). The confirmatory factor analysis revealed that the one-dimensional structure of the scale gave an acceptable fit. Internal consistency of the scale was found .78, and test-retest reliability was found .89.
Data Analysis
The data obtained in the study were collected in a classroom environment at the university. Before the practice began, the purpose of this research and the importance of both privacy and sincere answers were explained to the participants. The application of the measuring tools took approximately 15-20 minutes. In our application of structural equation modeling, we established a measurement model in which all variables are included before developing the model describing the relationship between variables. When the measurement model showed a good fit, we tested the structural equation model. We then used item parceling to decrease the number of observed variables and to control for measurement errors (Little,
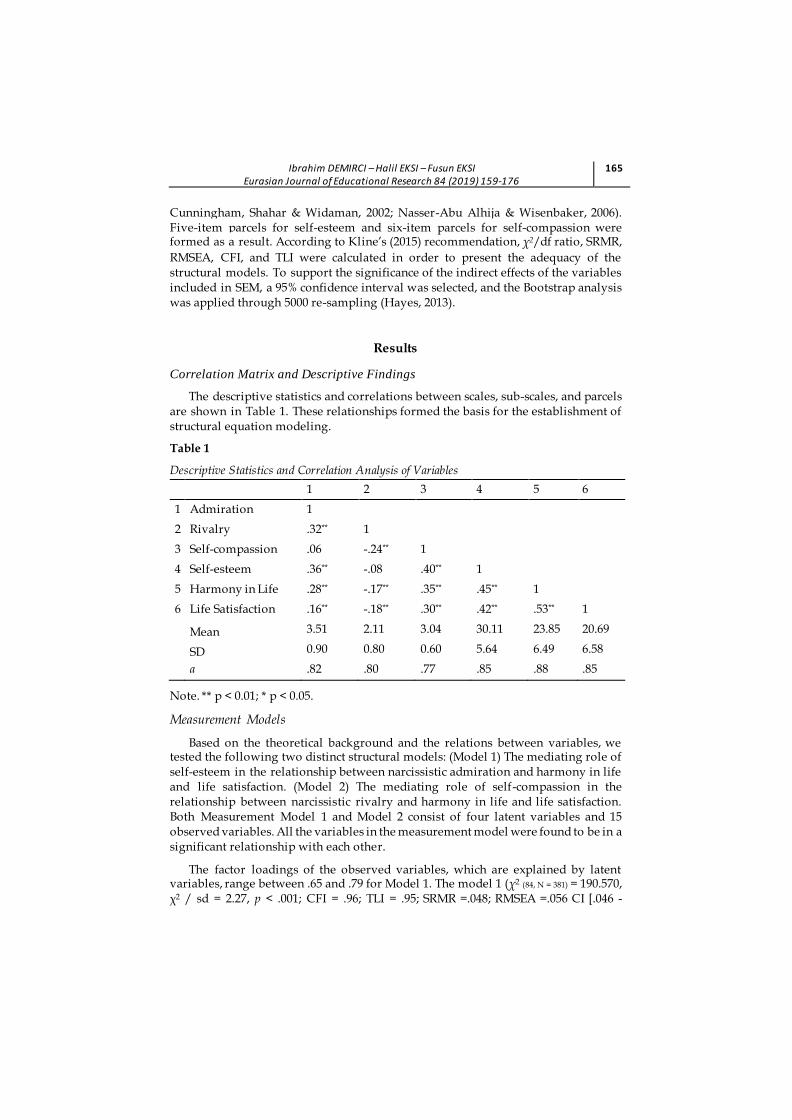
Ibrahim DEMIRCI – Halil EKSI – Fusun EKSI Eurasian Journal of Educational Research 84 (2019) 159-176
165
Cunningham, Shahar & Widaman, 2002; Nasser-Abu Alhija & Wisenbaker, 2006). Five-item parcels for self-esteem and six-item parcels for self-compassion were formed as a result. According to Kline’s (2015) recommendation, χ2/df ratio, SRMR,
RMSEA, CFI, and TLI were calculated in order to present the adequacy of the structural models. To support the significance of the indirect effects of the variables included in SEM, a 95% confidence interval was selected, and the Bootstrap analysis was applied through 5000 re-sampling (Hayes, 2013).
Results
Correlation Matrix and Descriptive Findings
The descriptive statistics and correlations between scales, sub-scales, and parcels are shown in Table 1. These relationships formed the basis for the establishment of structural equation modeling.
Table 1
Descriptive Statistics and Correlation Analysis of Variables
1 2 3 4 5 6
1 Admiration 1
2 Rivalry .32** 1
3 Self-compassion .06 -.24** 1
4 Self-esteem .36** -.08 .40** 1
5 Harmony in Life .28** -.17** .35** .45** 1
6 Life Satisfaction .16** -.18** .30** .42** .53** 1
Mean 3.51 2.11 3.04 30.11 23.85 20.69
SD 0.90 0.80 0.60 5.64 6.49 6.58
a .82 .80 .77 .85 .88 .85
Note. ** p < 0.01; * p < 0.05.
Measurement Models
Based on the theoretical background and the relations between variables, we tested the following two distinct structural models: (Model 1) The mediating role of self-esteem in the relationship between narcissistic admiration and harmony in life and life satisfaction. (Model 2) The mediating role of self-compassion in the relationship between narcissistic rivalry and harmony in life and life satisfaction. Both Measurement Model 1 and Model 2 consist of four latent variables and 15 observed variables. All the variables in the measurement model were found to be in a significant relationship with each other.
The factor loadings of the observed variables, which are explained by latent variables, range between .65 and .79 for Model 1. The model 1 (χ2 (84, N = 381) = 190.570, χ2 / sd = 2.27, p < .001; CFI = .96; TLI = .95; SRMR =.048; RMSEA =.056 CI [.046 -
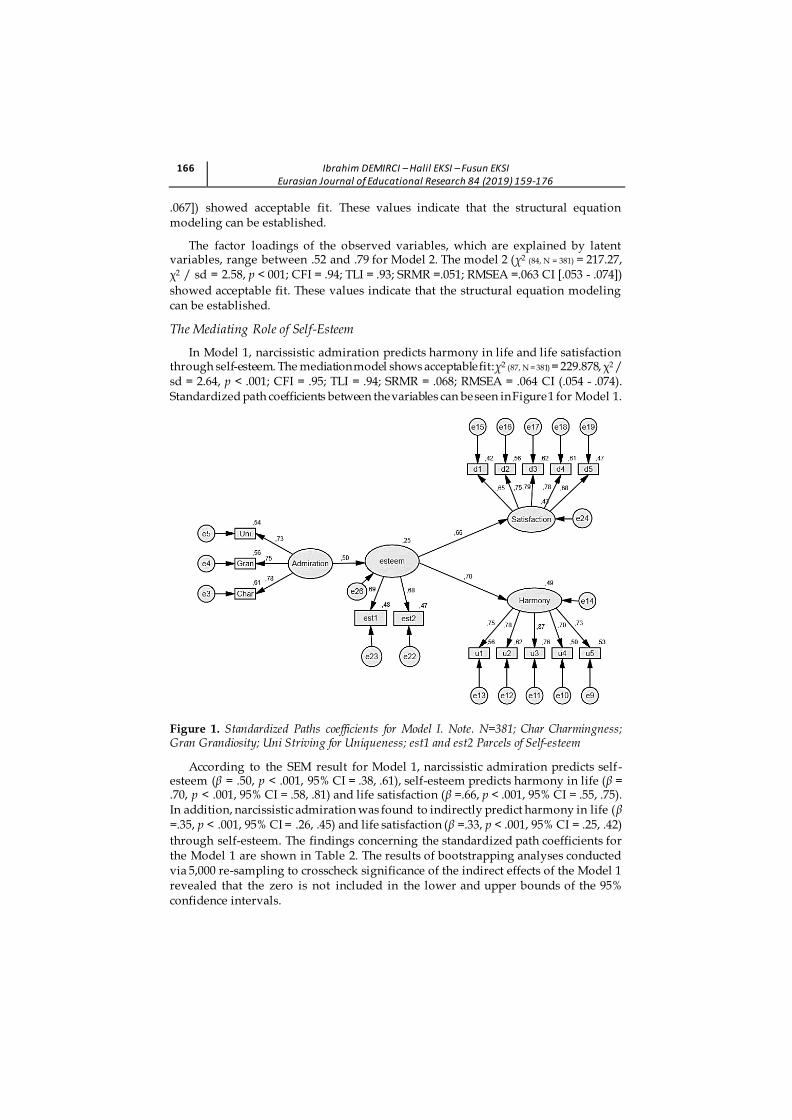
166 Ibrahim DEMIRCI – Halil EKSI – Fusun EKSI Eurasian Journal of Educational Research 84 (2019) 159-176
.067]) showed acceptable fit. These values indicate that the structural equation modeling can be established.
The factor loadings of the observed variables, which are explained by latent variables, range between .52 and .79 for Model 2. The model 2 (χ2 (84, N = 381) = 217.27, χ2 / sd = 2.58, p < 001; CFI = .94; TLI = .93; SRMR =.051; RMSEA =.063 CI [.053 - .074])
showed acceptable fit. These values indicate that the structural equation modeling can be established.
The Mediating Role of Self-Esteem
In Model 1, narcissistic admiration predicts harmony in life and life satisfaction through self-esteem. The mediation model shows acceptable fit: χ2 (87, N = 381) = 229.878, χ2 / sd = 2.64, p < .001; CFI = .95; TLI = .94; SRMR = .068; RMSEA = .064 CI (.054 - .074). Standardized path coefficients between the variables can be seen in Figure 1 for Model 1.
Figure 1. Standardized Paths coefficients for Model I. Note. N=381; Char Charmingness; Gran Grandiosity; Uni Striving for Uniqueness; est1 and est2 Parcels of Self-esteem
According to the SEM result for Model 1, narcissistic admiration predicts self-esteem (β = .50, p < .001, 95% CI = .38, .61), self-esteem predicts harmony in life (β = .70, p < .001, 95% CI = .58, .81) and life satisfaction (β =.66, p < .001, 95% CI = .55, .75). In addition, narcissistic admiration was found to indirectly predict harmony in life (β =.35, p < .001, 95% CI = .26, .45) and life satisfaction (β =.33, p < .001, 95% CI = .25, .42)
through self-esteem. The findings concerning the standardized path coefficients for the Model 1 are shown in Table 2. The results of bootstrapping analyses conducted via 5,000 re-sampling to crosscheck significance of the indirect effects of the Model 1 revealed that the zero is not included in the lower and upper bounds of the 95% confidence intervals.
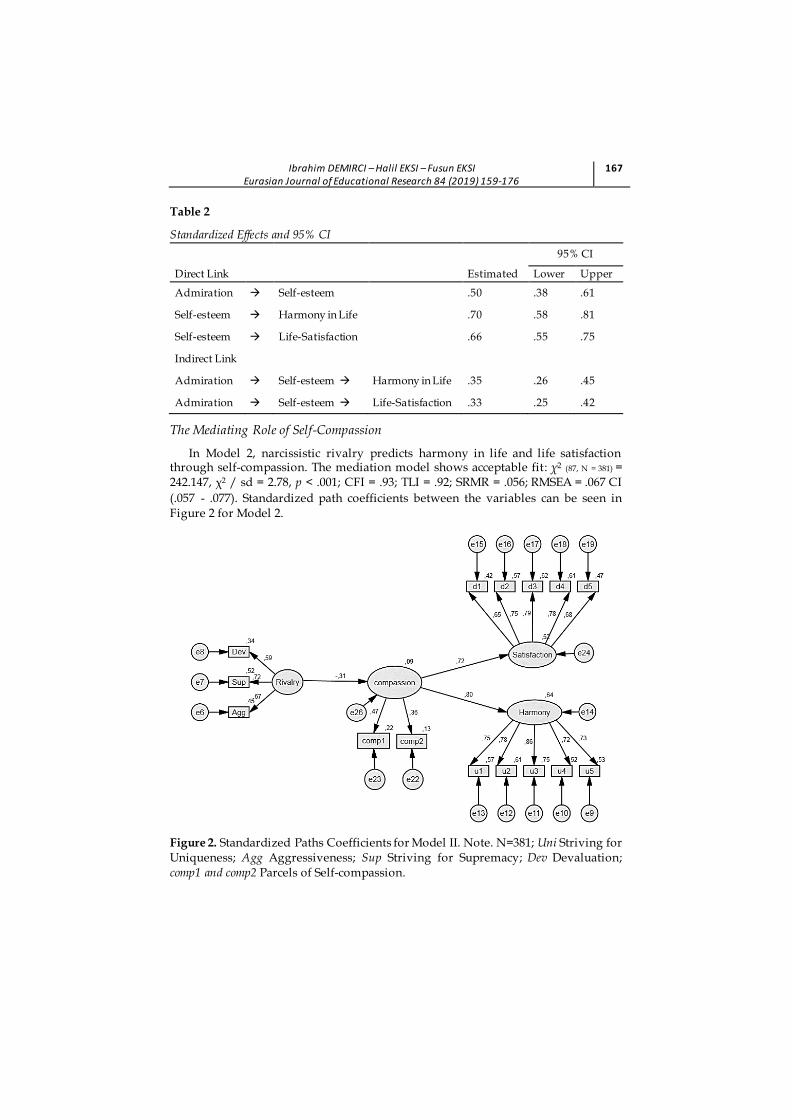
Ibrahim DEMIRCI – Halil EKSI – Fusun EKSI Eurasian Journal of Educational Research 84 (2019) 159-176
167
Table 2
Standardized Effects and 95% CI
95% CI
Direct Link Estimated Lower Upper
Admiration Self-esteem .50 .38 .61
Self-esteem Harmony in Life .70 .58 .81
Self-esteem Life-Satisfaction .66 .55 .75
Indirect Link
Admiration Self-esteem Harmony in Life .35 .26 .45
Admiration Self-esteem Life-Satisfaction .33 .25 .42
The Mediating Role of Self-Compassion
In Model 2, narcissistic rivalry predicts harmony in life and life satisfaction through self-compassion. The mediation model shows acceptable fit: χ2 (87, N = 381) = 242.147, χ2 / sd = 2.78, p < .001; CFI = .93; TLI = .92; SRMR = .056; RMSEA = .067 CI
(.057 - .077). Standardized path coefficients between the variables can be seen in Figure 2 for Model 2.
Figure 2. Standardized Paths Coefficients for Model II. Note. N=381; Uni Striving for Uniqueness; Agg Aggressiveness; Sup Striving for Supremacy; Dev Devaluation; comp1 and comp2 Parcels of Self-compassion.
168 Ibrahim DEMIRCI – Halil EKSI – Fusun EKSI Eurasian Journal of Educational Research 84 (2019) 159-176
Model 2 illustrates that narcissistic rivalry negatively predicted self-compassion (β = -.31, p < .001, 95% CI = -.45, -.15) and that self-compassion predicts harmony in life (β = .80, p < .001, 95% CI = .69, .91) and life satisfaction (β =.72, p < .001, 95% CI = .61, .82). Furthermore, narcissistic rivalry indirectly predict harmony in life (β =-.24, p < .001, 95% CI = -.35, -.13) and life satisfaction (β =-.22, p < .001, 95% CI = -.33, -10)
through self-compassion. The findings concerning the standardized path coefficients for Model 2 are shown in Table 3. The results of bootstrapping analyses conducted via 5,000 re-sampling to crosscheck significance of the indirect effects of the Model 1 revealed that the zero is not included in the lower and upper bounds of the 95% confidence intervals.
Table 3
Standardized Effects and 95% CI
95% CI
Direct Link Estimated Lower Upper
Rivalry Self-compassion -.31 -.45 -.15
Self-compassion
Harmony in Life .80 .69 .91
Self-compassion
Life-Satisfaction .72 .61 .82
Indirect Link
Rivalry Self-compassion Harmony in Life -.24 -.35, -.13
Rivalry Self-compassion Life-Satisfaction -.22 -.33, -.10
Discussion, Conclusion and Recommendations
In this study, positive relationships were, not surprisingly, found in the relationships between narcissistic admiration, self-esteem, harmony in life, and life satisfaction. Additionally, the relationships between narcissistic rivalry and self-compassion, harmony in life, and life satisfaction were found to have negative correlations. Significant positive correlations were found between self-compassion and harmony in life and life satisfaction. In the structural equation modeling, the two hypotheses [i.e., (1) Self-esteem plays a mediating role in the relationship between admiration and harmony and satisfaction. (2) Self-compassion played a mediating role in the relationship between rivalry and harmony and satisfaction hypotheses] were confirmed. The increase in narcissistic admiration increased self-esteem. As self-esteem increased, harmony in life and life satisfaction also showed an increase. Higher self-esteem statistically explains the tendency of people higher in narcissistic admiration to report more harmony in life and life satisfaction. Moreover, as narcissistic rivalry increases, harmony in life and life satisfaction decreased, while self-compassion reduced the adverse effects of narcissistic rivalry in this relationship. Lower self-compassion statistically explains the tendency of people higher in narcissistic rivalry to report less harmony in their life and lower life satisfaction.
Previous studies have also investigated the role of self-esteem in the relationship between narcissism and well-being. In this study, narcissism was measured using the
Ibrahim DEMIRCI – Halil EKSI – Fusun EKSI Eurasian Journal of Educational Research 84 (2019) 159-176
169
narcissistic admiration model. In addition to life satisfaction, harmony in life is also included while measuring well-being. In previous studies, self-esteem plays a fully mediating role between non-pathological narcissism and well-being (Rose, 2002; Sedikides et al., 2004; Zuckerman & O'Loughlin, 2009). Moreover, life satisfaction, psychological well-being, and positive affect positively correlated with narcissistic admiration and negatively correlated with narcissistic rivalry (Grove et al., 2018). Also, Demirci and Ekşi (2017) found that admiration positively predicted happiness and that rivalry negatively predicted happiness. Narcissistic admiration provides personal and social adjustment/advantage while narcissistic rivalry leads to personal and social maladjustment/conflict (Back, 2018; Back et al., 2013; Leckelt et al., 2018). Basing our conclusions on the self-concordance model (Sheldon & Elliot 1999), we assert that narcissism may increase life satisfaction and happiness as it allows people not only to choose goals consistent with their own self but also to perceive themselves as successful in achieving their goals (Rose & Campbell, 2004). It can be said that a person’s positive perception of his self leads him to obtain satisfaction from life and increases his functionality in different contexts (Diener & Diener, 2009).
Self-enhancement (i.e., an increase in positive self-esteem) and self-protection (i.e., a protective measure against negative self-perception) are considered basic assumptions in personality research (Alicke & Sedikides, 2011; Back et al., 2013). Narcissistic admiration contributes to the success of social relationships using striving for uniqueness, grandiose fantasies and charmingness to achieve self-enhancement. These processes provide positive social results, such as social status, success, praise, being elected as a leader, obtaining social resources, attracting charm, and social interest (Back, 2018; Back et al., 2013). This contributes to an increase in self-esteem and, therefore, to life satisfaction and harmony in life.
The mediating role of self-compassion in the link between rivalry and life satisfaction/harmony in life has yet to be investigated in the literature. The narcissistic rivalry may culminate in social conflict as a result of an individual’s use of self-protection, his struggle for superiority, his devaluation of others, and acts of aggression. These processes lead to such negative social results as rejection, violation of relations, unpopularity, criticism, and untrustworthiness (Back, 2018; Back et al., 2013), causing the person not to be satisfied with his life and to feel a lack of harmony with those around him. Self-compassion comes into play at this point and reduces the negative effects of narcissistic rivalry on both harmony in life and life satisfaction. In other words, people feeding narcissistic rivalries are less satisfied with life and experience less harmony in life because of their lower self-compassion. Concerning self-compassion and harmony in life, in accordance with social mentality theory (Gilbert, 2005), whereas narcissistic rivalry activates the Threat and Protection system, self-compassion activates the Satisfaction, Calmness and Trust system by neutralizing the Threat and Protection system. Self-compassion thus contributes to an individual’s ability to lead a harmonious life.
Our research reveals that narcissistic admiration is positively related to self-esteem and not related to self-compassion. Contrary to this, the literature does support the notion that narcissistic rivalry is negatively related to self-compassion and not related to self-esteem. While narcissistic admiration is a predictor of high and stable self-esteem, the narcissistic rivalry is a predictor of vulnerable and
170 Ibrahim DEMIRCI – Halil EKSI – Fusun EKSI Eurasian Journal of Educational Research 84 (2019) 159-176
variable self-esteem (Geukes et al., 2017). It is emphasized that self-compassion is a protective factor against the negative effects of low self-esteem (Marshall et al., 2015). While self-compassion assumes a protective role against anxiety in a situation when the self of an individual is threatened, self-esteem does not assume this role (Neff et al., 2017). In addition, self-compassion is more strongly related to psychological health than to self-esteem (Neff 2003; Neff, 2011; Neff & Vonk, 2009). The psychopathologic characteristics of rivalry may explain the mediating role of self -compassion between rivalry and well-being.
This research has several limitations. Since the study group is composed of university students, these relationships can be tested in different samples in subsequent studies to generalize the results. Another limitation is that the data were collected solely through self-report measurement tools. Regarding the current study’s variables, further studies on and observations of peer and family assessments may contribute to reaching more objective findings. Finally, conducting empirical and longitudinal studies on the variables used in this study, instead of cross-sectional patterns, may provide causal evidence.
Based on the results of this research, it is suggested that future researchers conduct studies seeking to increase self-compassion to reduce the adverse effects of narcissistic rivalry on life satisfaction and harmony in life. To balance the positive impacts of narcissistic admiration on harmony in life and life satisfaction, it is recommended that self-esteem development studies should be conducted. In this context, individual and group counseling practices aimed to develop self-compassion and self-esteem, reducing adverse effects of narcissism, and increasing life harmony and life satisfaction can be organized using the findings of the present study as a basis. We anticipate that the results of this and other such research will contribute to the literature of personality psychology and positive psychology.
References
Akca, E. (2014). Personality and cultural predictors of the Quiet Ego: Comparing Turkey and the United States (Unpublished Master's Thesis). Middle East Technical
University, Ankara. Retrieved from http://etd.lib.metu.edu.tr/upload/12618059/index.pdf
Alicke, M. D., & Sedikides, C. (Eds.). (2011). Handbook of self-enhancement and self-protection. New York, NY: Guilford Press.
Back, M. D. (2018). The Narcissistic Admiration and Rivalry Concept. In Hermann A., Brunell A., Foster J. (eds) Handbook of Trait Narcissism (pp. 57-67).
Springer, Cham. https://doi.org/10.1007/978-3-319-92171-6_6
Back, M. D., Küfner, A. C., Dufner, M., Gerlach, T. M., Rauthmann, J. F., & Denissen, J. J. (2013). Narcissistic admiration and rivalry: Disentangling the bright and dark sides of narcissism. Journal of Personality and Social Psychology, 105(6),
1013. http://dx.doi.org/10.1037/a0034431
Barnett, M. D., & Flores, J. (2016). Narcissus, exhausted: Self-compassion mediates the relationship between narcissism and school burnout. Personality and
Ibrahim DEMIRCI – Halil EKSI – Fusun EKSI Eurasian Journal of Educational Research 84 (2019) 159-176
171
Individual Differences, 97, 102-108.
http://dx.doi.org/10.1016/j.paid.2016.03.026
Barry, C. T., Loflin, D. C., & Doucette, H. (2015). Adolescent self-compassion: Associations with narcissism, self-esteem, aggression, and internalizing symptoms in at-risk males. Personality and Individual Differences, 77, 118-123.
http://dx.doi.org/10.1016/j.paid.2014.12.036
Bosson, J. K., & Weaver, J. R. (2011). "I love me some me": Examining the links between narcissism and self-esteem. In W. K. Campbell & J. D. Miller (Eds.), The handbook of narcissism and narcissistic personality disorder: Theoretical approaches, empirical findings, and treatments (pp. 261-271). Hoboken, NJ, US: John Wiley & Sons.
Bosson, J. K., Lakey, C. E., Campbell, W. K., Zeigler-Hill, V., Jordan, C. H., & Kernis, M. H. (2008). Untangling the links between narcissism and self-esteem: A theoretical and empirical review. Social and Personality Psychology Compass, 2, 1415–1439. https://doi.org/10.1111/j.1751-9004.2008.00089.x
Campbell, J. D., & Lavallee, L. F. (2013). Who am I? The role of self-concept confusion in understanding the behavior of people with low self-esteem. Baumeister, R. F. (Ed.). In Self-esteem (pp. 3-20). Springer Science & Business Media.
Campbell, W. K., Rudich, E., & Sedikides, C. (2002). Narcissism, self-esteem, and the positivity of self-views: Two portraits of self-love. Personality and Social Psychology Bulletin, 28, 358–368. https://doi.org/10.1177/0146167202286007
Coopersmith, S. (1967). The antecedents of self-esteem. San Francisco, CA: Freeman.
Cuhadaroglu, F. (1986). Self-esteem in adolescence. Unpublished doctoral dissertation, Hacettepe University, Ankara.
Demirci, İ., & Eksi, F. (2017). Büyüklenmeci narsisizmin iki farklı yüzü: Narsistik hayranlık ve rekabetin mutlulukla ilişkisi [Two different faces of grandiose narcissism: Relationship among narcissistic admiration and rivalry, and happiness]. Marmara Üniversitesi Atatürk Eğitim Fakültesi Eğitim Bilimleri Dergisi, 46, 37-58. https://doi.org/10.15285/maruaebd.330008
Deniz, M., Kesici, Ş., & Sümer, A. S. (2008). The validity and reliabili ty of the Turkish version of the Self-Compassion Scale. Social Behavior and Personality: an international journal, 36(9), 1151-1160.
https://doi.org/10.2224/sbp.2008.36.9.1151
Deniz, M. E., & Sümer, A. S. (2010). The evaluation of depression, anxiety and stress in university students with different self-compassion levels. Egitim ve Bilim, 35(158), 115.
Deniz, M. E., Arslan, C., Ozyesil, Z., & Izmirli, M. (2012). Öz-anlayış, yaşam doyumu, negatif ve pozitif duygu: türk ve diğer ülke üniversite öğrencileri arasında bir karşılaştırma [Self-compassion, life satisfaction, negative and positive affect: A comparison between turkey and other different countries’ university students]. Mehmet Akif Ersoy Üniversitesi Eğitim Fakültesi Dergisi, 1(23), 428-446.
Diener, E. (1984). Subjective well-being. Psychological Bulletin, 95, 542-575. http://dx.doi.org/10.1037/0033-2909.95.3.542

172 Ibrahim DEMIRCI – Halil EKSI – Fusun EKSI Eurasian Journal of Educational Research 84 (2019) 159-176
Diener, E., & Diener, M. (2009). Cross-cultural correlates of life satisfaction and self-esteem. In E. Diener (Ed.) Culture and well-being (pp. 71-91). New York, NY,
US: Springer Science. http://dx.doi.org/10.1007/978-90-481-2352-0_4
Diener, E., Emmons, R. A., Larsen, R. J., & Griffin, S. (1985). The satisfaction with life scale. Journal of Personality Assessment, 49, 71-75.
http://dx.doi.org/10.1207/s15327752jpa4901_13
Diener, E., Suh, E. M., Lucas, R. E., & Smith, H. L. (1999). Subjective well-being: Three decades of progress. Psychological Bulletin, 125, 276-302.
http://dx.doi.org/10.1037/0033-2909.125.2.276
Durak, M., Senol-Durak, E., & Gencoz, T. (2010). Psychometric properties of the Satisfaction with Life Scale among Turkish university students, correctional officers, and elderly adults. Social Indicators Research, 99(3), 413-429.
http://dx.doi.org/10.1007/s11205-010-9589-4
Geukes, K., Nestler, S., Hutteman, R., Dufner, M., Küfner, A. C., Egloff, B., ... & Back, M. D. (2017). Puffed-up but shaky selves: State self-esteem level and variability in narcissists. Journal of personality and social psychology, 112(5), 769.
http://dx.doi.org/10.1037/pspp0000093
Gilbert, P. (2005). Compassion and cruelty: A biopsychosocial approach. In P. Gilbert (Ed.), Compassion: Conceptualisations, research and use in psychotherapy (pp. 9–
74). London: Routledge.
Grove, J. L., Smith, T. W., Girard, J. M., & Wright, A. G. (2018, January 31). Narcissistic admiration and rivalry: An interpersonal approach to construct validation. https://doi.org/10.31219/osf.io/erxy7
Hayes, A. F. (2013). Introduction to mediation, moderation, and conditional process analysis: A regression-based approach. New York, NY, US: Guilford Press.
Kjell, O. N. E (2011). Sustainable well-being: A potential synergy between sustainability and well-being research. Review of General Psychology, 15(3), 255.
http://dx.doi.org/10.1037/a0024603
Kjell, O., N., E., Daukantaitė, D., Hefferon, K., & Sikström, S. (2016). The harmony in life scale complements the satisfaction with life scale: expanding the conceptualization of the cognitive component of subjective well -being. Social Indicators Research, 126(2), 893-919. http://dx.doi.org/10.1007/s11205-015-0903-z
Lange, J., Crusius, J., & Hagemeyer, B. (2016). The evil queen's dilemma: Linking narcissistic admiration and rivalry to benign and malicious envy. European Journal of Personality, 30(2), 168-188. https://doi.org/10.1002/per.2047
Leckelt, M., Wetzel, E., Gerlach, T. M., Ackerman, R. A., Miller, J. D., Chopik, W. J., ... & Richter, D. (2018). Validation of the Narcissistic Admiration and Rivalry Questionnaire short scale (NARQ-S) in convenience and representative samples. Psychological Assessment, 30(1), 86-96. http://dx.doi.org/10.1037/pas0000433
Ibrahim DEMIRCI – Halil EKSI – Fusun EKSI Eurasian Journal of Educational Research 84 (2019) 159-176
173
Little, T. D., Cunningham, W. A., Shahar, G., & Widaman, K. F. (2002). To parcel or
not to parcel: exploring the question, weighing the merits. Structural Equation Modeling, 9(2), 151-173. http://dx.doi.org/10.1207/S15328007SEM0902_1
Marshall, S. L., Parker, P. D., Ciarrochi, J., Sahdra, B., Jackson, C. J., & Heaven, P. C. (2015). Self-compassion protects against the negative effects of low self-esteem: A longitudinal study in a large adolescent sample. Personality and Individual Differences, 74, 116-121. 10.1016/j.paid.2014.09.013
Miller, J. D., & Campbell, W. K. (2011). Addressing criticisms of the narcissistic personality inventory (NPI). In W. K. Campbell & J. D. Miller (Eds.), The Handbook of Narcissism and Narcissistic Personality Disorder, Theoretical Approaches, Empirical Findings, and Treatments (pp. 146–152). Hoboken, NJ:
John Wiley & Sons, Inc.
Myers, G. J., & Myers, M. T. (1992). The Dynamics of Human Communication: A laboratory approach. New York: McGraw Hill, Inc.
Nasser-Abu Alhija, F., & Wisenbaker, J. (2006). A Monte Carlo study investigating the impact of item parceling strategies on parameter estimates and their standard errors in CFA. Structural Equation Modeling, 13(2), 204-228.
https://doi.org/10.1207/s15328007sem1302_3
Neff, K. D. (2003). The development and validation of a scale to measure Self-Compassion. Self and Identity, 2(3), 223-250.
https://doi.org/10.1080/15298860309027
Neff, K. D. (2011). Self-compassion, self-esteem, and well-being. Social and personality psychology compass, 5(1), 1-12. http://dx.doi.org/10.1111/j.1751-
9004.2010.00330.x
Neff, K. D. (2016). The Self-Compassion Scale is a valid and theoretically coherent measure of self-compassion. Mindfulness, 7, 264–274.
http://dx.doi.org/10.1007/s12671-015-0479-3
Neff, K. D., & Vonk, R. (2009). Self-compassion versus global self-esteem: Two different ways of relating to oneself. Journal of personality, 77(1), 23-50.
http://dx.doi.org/10.1111/j.1467-6494.2008.00537.x
Neff, K. D., Whittaker, T. A., & Karl, A. (2017). Examining the factor structure of the Self-Compassion Scale in four distinct populations: Is the use of a total scale score justified?. Journal of Personality Assessment, 99(6), 596-607.
http://dx.doi.org/10.1080/00223891.2016.1269334
Raes, F., Pommier, E., Neff, K. D., & Van Gucht, D. (2011). Construction and factorial validation of a short form of the Self-Compassion Scale. Clinical Psychology and Psychotherapy, 18, 250-255. https://doi.org/10.1002/cpp.702
Rose, P. (2002). The happy and unhappy faces of narcissism. Personality and individual differences, 33(3), 379-391. https://doi.org/10.1016/S01918869(01)00162-3
Rose, P., & Campbell, W. K. (2004). Greatness feels good: A telic model of narcissism and subjective well-being. In S. P. Shohov (Ed.), Advances in psychology research, Vol. 31, pp. 3-26). Hauppauge, NY, US: Nova Science Publishers.
174 Ibrahim DEMIRCI – Halil EKSI – Fusun EKSI Eurasian Journal of Educational Research 84 (2019) 159-176
Rogoza, R., Żemojtel-Piotrowska, M., Kwiatkowska, M. M., & Kwiatkowska, K. (2018). The bright, the dark and the blue face of narcissism: The spectrum of narcissism in its relations to the metatraits of personality, self-esteem, and the nomological network of shyness, loneliness and empathy. Frontiers in Psychology, 9, 343. https://doi.org/10.3389/fpsyg.2018.00343
Rosenberg, M. (1965). Society and the adolescent self-image. Princeton, NJ: Princeton University Press.
Satici, S. A., & Tekin, E. G. (2017). Harmony in Life Scale-Turkish version: Studies of validity and reliability. Psicologia: Reflexão e Crítica, 30: 18.
https://doi.org/10.1186/s41155-017-0073-9
Sedikides, C., Rudich, E. A., Gregg, A. P., Kumashiro, M., & Rusbult, C. (2004). Are normal narcissists psychologically healthy?: Self-Esteem matters. Journal of Personality and Social Psychology, 87, 400–416. https://doi.org/10.1037/0022-
3514.87.3.400
Sheldon, K. M., & Elliot, A. J. (1999). Goal striving, need satisfaction, and longitudinal well-being: The self-concordance model. Journal of Personality and Social Psychology, 76(3), 482–497. http://dx.doi.org/10.1037/0022-3514.76.3.482
Shavelson, R. J., Hubner, J. J., &Stanton, G. C. (1976). Self-Concept: Validation of Construct Interpratation. Rewiew of Aducational Research, 46(3), 407-441.
http://dx.doi.org/10.2307/1170010
Uchida, Y., & Ogihara, Y. (2012). Personal or interpersonal construal of happiness: A cultural psychological perspective. International Journal of Wellbeing, 2(4), 354-
369. https://doi.org/10.5502/ijw.v2.i4.5
Wink, P. (1991). Two faces of narcissism. Journal of personality and social psychology, 61(4), 590-597
Zeigler-Hill, V. (2013). Self-esteem. Psychology Press.
Zessin, U., Dickhauser, O., & Garbade, S. (2015). The relationship between self-compassion and well-being: A meta-analysis. Applied Psychology: Health and Well-Being, 7, 340–364. https://doi.org/10.1111/aphw.12051
Zuckerman, M., & O'Loughlin, R. E. (2009). Narcissism and well -being: A longitudinal perspective. European Journal of Social Psychology, 39(6), 957-972.
https://doi.org/10.1002/ejsp.594
Narsisizm, Yaşam Doyumu ve Yaşam Uyumu: Öz-saygı ve Öz-anlayışın
Aracı Rolü
Atıf:
Demirci, I., Eksi, H., & Eksi, F. (2019). Narcissism, life satisfaction, and harmony: The mediating role of self-esteem and self-compassion. Eurasian Journal of Educational Research, 84, 159-176, DOI: 10.14689/ejer.2019.84.8

Ibrahim DEMIRCI – Halil EKSI – Fusun EKSI Eurasian Journal of Educational Research 84 (2019) 159-176
175
Özet
Problem Durumu: İnsanı anlama çabalarının en önemli odak noktalarından biri benlik
kavramıdır. Kişinin kendisi hakkındaki bilgisi benlik kavramını oluştururken kişinin kendisi hakkında ne hissettiği öz-saygıyı ifade etmektedir. Ancak benliği olumlu algılamanın tek bir yolu yoktur. Literatürde kişinin kendisi hakkındaki duygusal değerlendirmeleri genellikle öz-saygı olarak tanımlanmaktadır. Yüksek öz-saygı ve narsisizm özelliklerine sahip insanlar kendilerini beğenmeleri ve sevmeleri gibi benlikleriyle ilgili olumlu algıları paylaşmaktadırlar. Narsistlerin son derece olumlu veya şişirilmiş bir benlik kavramına sahip olduğu söylenebilir. Bu araştırmada kullanılan narsistik hayranlık ve rekabet modeli büyüklenmeci narsisizmin birbiriyle pozitif ilişkili ancak birbirinden iki farklı boyutu açıklamaktadır. Benlik kavramıyla ilişkili olan bir diğer kavram ise öz-saygının alternatifi ve narsisizmin antidotu olarak ifade edilebilecek öz-anlayış kavramıdır. Öz-anlayış, öz-saygıda olduğu gibi benliğin değerlendirmesi yerine benliğin kendi içinde kabul edilmesi içeren bir yaklaşımdır. Öz-anlayış kendini kabul ve farkındalık içeren bir bakış açısını yansıtmaktadır. İyi oluşun ise insanın ulaşmak istediği en temel hedeflerden biri olduğu söylenebilir. Psikoloji araştırmalarında mutluluk genel olarak öznel iyi oluş kavramıyla ifade edilmektedir. Öznel iyi oluşun bilişsel boyutu olan yaşam doyumu kavramı kişinin yaşamdaki beklentilerin ne derece karşılandığını ifade etmektedir. Öte yandan mutluluğun bilişsel bileşeni her zaman yaşam doyumunu ifade etmeyebilir. Çünkü kültürlerarası çalışmalar mutluluğun anlamının kültürden kültüre farklılık gösterebileceğini ifade etmektedir. Bu bağlamda yaşam doyumu kavramının alternatifi olarak ifade edilebilecek olan yaşam uyumu kavramı içsel olarak hissedilen kendini kabul, iç barış ve denge hissini içermektedir. Araştırmalar benlik algılamanın ve iyi oluşun farklı yolları olduğunu göstermiştir. Araştırmada bu farklı yollar arasındaki ilişkilerin belirlenmesi kişilik dinamiklerinin anlaşılması açısından önemli bilgiler sağlayabilir.
Araştırmanın Amacı: Bu araştırmada benliğin farklı algılanma biçimleri olarak ifade
edilebilecek olan narsisizm, öz-anlayış ve öz-saygı kavramları ile yaşamı farklı algılama biçimleri olarak ifade edilebilecek olan yaşam uyumu ve yaşam doyumu kavramları arasındaki ilişkilerin incelenmesi amaçlanmıştır. Narsistik hayranlığın öz-saygı, yaşam uyumu ve yaşam doyumu ile pozitif ilişkili olacağı, narsistik rekabetin ise öz-anlayış, yaşam uyumu ve yaşam doyumu ile negatif ilişkili olacağı beklenmektedir. Bu araştırmanın amacı narsistik hayranlık ve narsistik rekabet ile yaşam uyumu ve yaşam doyumu arasındaki ilişkide öz-saygı ve öz-anlayışın aracı rolünü incelemektedir.
Araştırmanın Yöntemi: Araştırmanın örneklemi 381 katılımcıdan oluşmaktadır.
Katılımcıların 310’u (%77,9) kadın, 71’i (%17,8) erkektir. Katılımcıların yaş ortalamaları 23,1 olarak hesaplanmıştır. Araştırmada veri toplama araçları olarak Narsistik Hayranlık ve Rekabet Ölçeği (Narcissistic Admiration and Rivalry Questionnaire), Öz-anlayış Ölçeği (Self-compassion Scale), Benlik Saygısı Ölçeği (Self-esteem Scale), Yaşam Doyumu Ölçeği (Satisfaction with Life Scale), Yaşam Uyumu Ölçeği (Harmony in Life Scale) kullanılmıştır. Narsisizm, öz-anlayış ve öz-saygı ile yaşam doyumu ve yaşam uyumu arasındaki ilişkiler yapısal eşitlik modeli (structural equation modeling) ile incelenmiştir. Yapısal eşitlik modelinde değişkenler arasındaki ilişkileri açıklayan model kurulmadan önce bütün

176 Ibrahim DEMIRCI – Halil EKSI – Fusun EKSI Eurasian Journal of Educational Research 84 (2019) 159-176
değişkenlerin içinde olduğu ölçme modeli kurulmuştur. Ölçme modelinin iyi uyum verdiği görüldüğünde yapısal eşitlik modelinin test edilmesine geçilmiştir. YEM’de yer alan değişkenlere ait dolaylı etkilerin anlamlılığına desteklemek amacıyla %95 güven aralığı seçilerek 5000 yeniden örnekleme yoluyla Bootstrap Analizi uygulanmıştır.
Araştırmanın Bulguları: Yapısal eşitlik modeli narsistik hayranlık ile yaşam uyumu ve
yaşam doyumu arasındaki ilişkiye öz-saygının ve narsistik rekabet ile yaşam uyumu ve yaşam doyumu arasındaki ilişkiye öz-anlayışın aracılık ettiğini göstermiştir. Bu çalışmada narsistik hayranlık ile yaşam uyumu ve yaşam doyumu arasındaki ilişkide öz-saygının aracı rolü; narsistik rekabet ile yaşam uyumu ve yaşam doyumu arasındaki ilişkide öz-anlayışın aracı rolü incelenmiştir. Analiz sonuçlarına göre beklendiği gibi narsistik hayranlık, öz-saygı, yaşam uyumu ve yaşam doyumu arasındaki ilişkilerde anlamlı düzeyde pozitif ilişkiler bulunmuştur. Ayrıca narsistik rekabet ile öz-anlayış, yaşam uyumu ve yaşam doyumu arasında negatif yönde; öz-anlayış, yaşam uyumu ve yaşam doyumu arasındaki ilişkilerde pozitif yönde anlamlı ilişkiler bulunmuştur. Kurulan yapısal eşitlik modelinde narsistik hayranlık ile yaşam uyumu ve yaşam doyumu arasındaki ilişkide öz-saygı; narsistik rekabet ile yaşam uyumu ve yaşam doyumu arasındaki ilişkide öz-anlayış aracı rol üstlenmektedir. Daha önceki çalışmalarda araştırma bulgularını destekleyecek bulgulara rastlanmıştır.
Araştırmanın Sonuçları ve Önerileri: Araştırma bulguları kişilik psikolojisi ve pozitif psikoloji bulguları bağlamında tartışılmıştır. Sonuçların narsisizmin, olumlu benlik algısının ve yaşamı algılama biçimlerinin ikişer yüzlü doğasının anlaşılmasına katkı sağlayacağı düşünülmektedir. Bu araştırmanın sonuçlarından hareketle narsistik rekabetin yaşam uyumunu ve yaşam doyumunu üzerindeki olumsuz etkilerini azaltmak için öz-anlayış düzeylerini arttıracak çalışmaların yapılması önerilmektedir. Narsistik hayranlığın yaşam uyumu ve yaşam doyumu üzerindeki olumlu etkisini dengelemek için ise öz-saygıyı geliştirici çalışmaların yapılması önerilmektedir. Bu bağlamda bulgulardan yola çıkarak narsisizmin olumsuz etkilerini azaltabilmeyi ve yaşam uyumu ve yaşam doyumunu arttırabilmeyi hedefleyen öz-anlayış ve öz-saygı özelliklerini geliştirmeye dayalı bireysel ve grupla psikolojik danışma uygulamaları düzenlenebilir. Araştırmanın sonuçlarının kişilik psikolojisi ve pozitif psikoloji literatürüne katkı sağlayacağı öngörülmektedir.
Anahtar Kelimeler: Narsistik hayranlık ve rekabet, öz-saygı, öz-anlayış, yaşam
doyumu, yaşam uyumu, pozitif psikoloji
Eurasian Journal of Educational Research 84 (2019) 177-212 Eurasian Journal of Educational Research
www.ejer.com.tr Problem-Posing Skills for Mathematical Literacy: The Sample of Teachers and Pre-Service Teachers* Kemal OZGEN1
A R T I C L E I N F O A B S T R A C T
Article History: Purpose: The present study aims to examine the mathematics teachers’ and the pre-service teachers’ problem-posing skills for mathematical literacy (ML). Research Methods: This research was carried out using the case study model. The study group consisted of 13 pre-service mathematics teachers and five middle school mathematics teachers who took ML courses in undergraduate and graduate education. In this context, three free problem-posing activities were asked to pose problems for ML from the participants. The problems posed by the participants were examined through descriptive analysis. The theoretical basis in the PISA study was accepted as the framework in data analysis.
Received: 06 Feb. 2019 Received in revised form: 29 Jul. 2019 Accepted: 15 Nov. 2019 DOI: 10.14689/ejer.2019.84.9
Keywords mathematical literacy, pre-service teachers, problem-posing, teachers
Findings: Analyzes showed that the problems posed by the participants were mostly open-ended problems. According to the context of the posed problems, occupational and personal context problems were found to be dominant. The findings showed that the posed problems were more about change-relationships and space-shape concerning mathematical content. Regarding mathematical processes, the average score of employing skills was higher than formulating and interpreting skills scores. The findings suggest that the teachers are more successful than pre-service teachers in problem-posing activities for ML. Implications for Research and Practice: It was understood that there was a need for theoretical and practical courses that clarify the application of ML in different problem types. Challenges to pose unstructured problems for ML should be removed. The situations and content of mathematics used in ML problems should be made more effective and diversified.
© 2019 Ani Publishing Ltd. All rights reserved
*This study was partly presented at the International Conference on Education in Mathematics, Science & Technology (ICEMST) in Kusadasi, 18-21 May 2017 1 Corresponding author, Dicle University, Ziya Gokalp Faculty of Education, Department of Mathematics and Science Education, TURKEY, e-mail: [email protected] ORCID: https://orcid.org/0000-0002-7015-6452
178 Kemal OZGENEurasian Journal of Educational Research 84 (2019) 177-212
Introduction
In recent years, the concept of literacy is one of the important topics discussed and researched in the field of education. It is possible to say that there are also changes in the meaning of the concept of literacy from the past to the present day. In the Programme for International Student Assessment [PISA] study conducted by the Organization for Economic Co-operation and Development [OECD], the concept of literacy is expressed as follows: “the ability to use, analyze, make logical conclusions, and communicate effectively when describing, interpreting, and solving problems that students encounter in various situations in key subject areas” (Ministry of National Education [MoNE], 2016, p. 1). There are different approaches to literacy, such as current and traditional approaches (Ozgen & Kutluca, 2013). The traditional literacy approach involves skills, such as reading, writing, and performing simple calculations, which require four operations. However, in current literacy approaches, field-specific competencies and skills are seen as the forefront. In particular, the concept of mathematical literacy (ML) is closely related to many other concepts discussed in mathematics education (Stacey, 2010). In the context of ML, the content of mathematics, process-based skills and the contexts in which it is used are handled.
The PISA 2000 report explained that the term literacy was used to clarify the mathematical knowledge and the ability to deliver functional use rather than merely mastering a school curriculum (OECD, 2000). According to Evans (2017), being literate involves using mathematical knowledge meaningfully in different contexts, allowing us to be better in our daily lives and being functional in a technology-rich learning environment. Addressing literacy in all disciplines of the curriculum from the first years of teaching is the key to lifelong learning and quality of life (Evans, 2017). In mathematics education, it is possible to see the importance and validity of ML in direct or indirect approaches, in mathematics curricula (MoNE, 2017) or in standards explained by institutions for school mathematics (National Council of Teachers of Mathematics [NCTM], 2000). In this respect, De Lange (2003) states that pure mathematics is important but insufficient to do mathematics in real life.
Mathematical problem-solving can be seen as a key feature and focus of ML's process skills. In this context, it is understood that the measurement of ML in PISA studies takes place using problem-solving (OECD, 2013). In the field of mathematics education, it is seen that there has been an increasing interest in problem-posing in recent years because problem-posing is accepted as the last step of the problem-solving process (Gonzales, 1998). In addition, problem-solving requires high-level cognitive skills (English & Sriraman, 2010; Silver, 1987) and is reported to be closely related to problem-posing skills (Cai, 1998; Kilpatrick, 1987). In this study, ML and problem-posing concepts will be emphasized because problem-posing and problem-solving skills can be seen as complementary elements. Moreover, while ML and problem-solving relationships have been examined in many studies (Memnun, Akkaya & Hacıomeroglu, 2012; Sumen & Calisici, 2012), there are limited studies on ML and problem-posing relationships (Ozgen, Ozer & Arslan, 2019; Sahin & Basgul, 2018). Various problem-posing studies have been conducted with pre-service teachers, but there are limited studies on problem-posing in the context of mathematics literacy.
Kemal OZGENEurasian Journal of Educational Research 84 (2019) 177-212
179
Mathematics teachers have an important role and responsibility in ML, which is a
framework for the mathematics learning-teaching process because mathematics teachers should be able to imagine many pedagogical practices to improve students' ML skills or competencies (Machaba, 2018). Teachers' awareness of the importance of strategies for ML positively reflected the development of mathematics teaching (McMillen, Del Prado Hill & Friedland, 2010). This study focuses on the teachers’ mathematical literacy in problem-posing context since it is an important factor in improving students’ competencies in ML. Thus, it is necessary to understand teachers’ competencies in ML help to design effective ML development trajectories and to close the gap between in-service and pre-service teachers’ problem-posing skills.
It was reported that Turkish students attending the PISA exams had a low achievement level in ML and tended to decline in the recent PISA (MoNE, 2012; 2016). Furthermore, it was reported that the teacher factor is an important component in these low results in PISA exams for ML. In line with these results, various reform steps have been taken by the MoNE to improve goals about ML. Actions, such as changes in instructional programs and teacher education, developing and renewing books, resources and materials, and simulating the types of questions in the transition exams to high school exams, were carried out. In mathematics education, the concepts of problem-solving and problem-posing are discussed with these changes made for ML. In addition, the ML courses were added as a compulsory course to teacher education programs at universities. In this study, mathematics teachers and pre-service teachers' problem-posing skills are presented after they have taken an ML course in their teacher education program at undergraduate and graduate levels.
In light of the literature, it is expected that in-service teachers and educated pre-service teachers should design or pose mathematical problems for ML and use them in their classes. This study focuses on mathematics teachers and pre-service teachers who have received ML education (undergraduate and graduate level) to pose problem activities for ML. For the purpose of the present research, the following problems were sought:
1. How are the mathematics teachers’ and pre-service teachers’ skills to pose problems for ML? What is the type of difficulty level, context, content and process skills of the problems posed by the participants?
2. Do mathematics teachers and pre-service teachers’ problem-posing skills for ML differ concerning PISA process skills?
The present study aims to examine the mathematics teachers and pre-service teachers’ problem-posing skills for ML. The problems posed by teachers and pre-service teachers for ML are examined concerning problem type, level of difficulty, context, mathematical content, topics and processes. In addition, the problems posed by the participants for ML are compared concerning defined criteria.
180 Kemal OZGENEurasian Journal of Educational Research 84 (2019) 177-212
Theoretical Framework
Mathematical Literacy (ML)
ML is not only composed of pure mathematical knowledge, but it has complex structures and components (De Lange, 2001; Matteson, 2006; OECD, 2003). In one of the ML approach, Goos (2007) identified five components (context, mathematical knowledge, disposition, critical orientation and tools) for ML (cited in Bennison, 2015). In Pugalee’s (1999) ML model, ML processes are described as representing, manipulating, mathematical reasoning and, problem-solving. In addition, facilitators for ML in the model are specified as communication, technology and values. In the PISA study, the measurement and evaluation of mathematics are shaped around the concept of ML. In the PISA 2012 study, ML is defined as follows:
Mathematical literacy is an individual’s capacity to formulate, employ, and interpret mathematics in a variety of contexts. It includes reasoning mathematically and using mathematical concepts, procedures, facts, and tools to describe, explain, and predict phenomena. It assists individuals to recognize the role that mathematics plays in the world and to make the well-founded judgments and decisions needed by constructive, engaged and reflective citizens (OECD 2013, p. 25).
As a consequence of this definition, PISA mathematics units start with a description of a situation that can be encountered in real-life (e.g. a map for a trip, original tables of data, plans for a house, a formula for calculating something practical). A series of questions require students to use this knowledge, calculate the quantities and interpret the results (Stacey, 2010).
There are some approaches to what skills and competencies should be in an individual with ML. Kilpatric (2001) states that mathematical ability includes conceptual understanding, operational fluency, strategic capabilities, adaptive reasoning and productive disposition. NCTM (2000) emphasized the importance of ML. There were five basic skills in learning mathematics: ability to solve mathematical problems, mathematical reasoning ability, mathematical relationship ability, mathematical communication ability and mathematical representation. It is stated here that ML means the complex ability required for students (NCTM, 2000).
Three mathematical processes were defined in the context of assessment and evaluation of ML in PISA 2012 (OECD, 2013, pp. 28-30): (1) mathematically formulating situations, (2) employing mathematical concepts, phenomena, processes and reasoning and (3) interpreting application and evaluation of mathematical output.
Mathematical sciences are interested in describing and analyzing quantities, space-shapes, change-relationships, and at the same time, uncertainty (Diaz, 2017). Steen (1990) suggested inspiration in the developmental power of five deep mathematical thinkers, such as dimensions, quantity, uncertainty, shape and change. Mathematical content knowledge is one of the important sub-dimensions that constitute the framework of measuring and evaluating in ML. In PISA, mathematical content and subject areas refer to subjects or parts that regulate the field of mathematics.
Kemal OZGENEurasian Journal of Educational Research 84 (2019) 177-212
181
Accordingly, at PISA 2012, there are four subject parts or sections that form the mathematical content of ML (OECD, 2013, pp. 33-35): change-relationships, space-shape, quantity and uncertainty-data.
One of the important sub-dimensions that constitutes the framework for assessment and evaluation of ML in PISA is the context. Mathematical contexts, such as personal, occupational, societal and scientific contexts, are defined in PISA. Thus, the problem context is defined as follows: “Context is the information that is contained and, at the same time, surrounds the statement of a mathematical problem that needs to be mathematized. The context and surrounding information might be necessary or unnecessary for the mathematization of the problem but is independent of the problem’s syntax and stimulus” (Salgado, 2016, p.111). To effectively transfer information from one application to another, students must have experience in solving problems in many different situations and contexts (De Lange, 1987). Steen (2001) categorized the context sub-dimension as personal life, school life, work and leisure and the local community.
In the PISA 2012 mathematics test, three types of items formations were used for the paper-pencil test as follows: (i) open-ended or unstructured items, (ii) structured items and (iii) multiple-choice items. In mathematics and science, test items are grouped into units that start by identifying the real-world situation or problem, which includes text, images, graphics, or information on the charts. Then, a few items are relevant to this situation (Stacey, 2010).
Problem Posing
Mathematical problem-solving plays an important role in many theoretical approaches for ML (Goos, 2007; Pugalee, 1999) and in the framework for assessment and evaluation in the PISA studies. Problems involving the modeling process, particularly the problems that require the use of the model, have a wide range in the PISA studies applied in recent years. Stacey (2015) reported that mathematical modeling was the key to ML, but most people rarely participated in the entire modeling cycle. Brown and Schafer (2006) used a modeling approach in teacher education for ML. Modeling approach used as a tool for ML teaching, formulating, analyzing the model to answer the mathematical questions formulated, interpreting and validating mathematical results concerning context, and finally, consolidation elements. ML focuses on students’ ability to effectively analyze, validate, communicate, formulate, solve and interpret ideas in different forms and situations of problems (Lailiyah, 2017). Teachers should integrate content and/or skills to solve problems (Machaba, 2018). Activities developed by PISA provide problem-solving skills, that is, efforts to provide mathematical understanding and development of the student. It also needs to relate contextual problems to mathematical situations in the problem that the student solves with mathematical knowledge.
Problem-posing and problem-solving are of great importance for mathematics and mathematical thinking (Silver, 1987) because it can be said that problem-posing and problem-solving are considered as closely related and complementary process skills

182 Kemal OZGENEurasian Journal of Educational Research 84 (2019) 177-212
and even basic problem-posing activities have positive effects on students (Silver & Cai, 1996). In addition, problem-posing activities help students to develop their problem-solving skills (English, 1997). In addition, it is stated that problem-posing activities positively affect students’ problem-solving skills (Lowrie, 2002). The necessity of using problem-posing activities both as a goal and a tool in mathematics education emerges (Kilpatrick, 1987).
Stoyanova and Ellerton (1996) classify problem-posing activities as free, semi-structured and structured problem-posing situations. In this classification, it is important to what extent the problem maker is limited. In this study, free problem-posing will be emphasized because it can be said that free problem-posing is a suitable type of activity for individuals with a lack of knowledge and experience in problem posing. There is no limitation in free problem-posing activities. The problem-maker can pose a problem of his/her own choosing from a real or fictional situation. A problem condition is not given. It may be desirable to establish a problem on any subject. Limitations are as small as possible. “Pose a problem with patterns” or “Pose a problem for 6th-grade students” activities are examples of free problem posing.
Relationship between ML and Problem Posing
The use of ML and mathematical knowledge gives learners the ability to better understand the content of different curriculum content in many contexts. As a result, teachers need to have mathematics, pedagogical and curriculum knowledge to have a rich personal understanding of literacy, and to believe that teaching is an integral part of the subject (Bennison, 2015, p. 572).
In related literature, Malasari, Herman and Jupri (2017) stated that high school students should have ML skills in formulating, implementing and interpreting mathematics to solve real-world problems. It has been emphasized that teaching these students with ordinary mathematics problems is not enough and that teachers should create ML problems in the teaching of these students. In this context, it is expected that the awareness of mathematics teachers towards ML is high and problem activities are developed. In the related literature, various studies with teachers and pre-service teachers were found about ML concept. In a study by Lestari, Juniati and Suwarsono (2017), the views of high school teachers towards ML, their habits in mathematics teaching, and their beliefs in integrating ML's mathematics into learning-teaching were examined. In the study conducted by Pettersen and Nortvedt (2018), teachers’ and pre-service teachers’ competence needs in the activities were determined using an item analysis tool. Concerning competencies (communication, devising strategies, mathematization, representation, symbols and formalism, reasoning and argumentation), each of the teachers and pre-service teachers used a tool about mathematical efficiency and efficiency requirements of activities. Saenz (2009) examined the difficulties of Spanish pre-service teachers in solving PISA questions. In a study conducted by Colwell and Enderson (2016), perceptions of pre-service teachers about literacy in mathematics were examined. Pre-service teachers perceived communication, practice and language as literacy in mathematics.
Kemal OZGENEurasian Journal of Educational Research 84 (2019) 177-212
183
In recent years, intense interest in the ML concept also appears in a variety of
studies in Turkey. In particular, studies with mathematics teachers and pre-service teachers are also observed. The ML self-efficacy beliefs of the pre-service teachers were examined using the ML self-efficacy scale developed by Ozgen and Bindak (2008) in a large part of the studies (Memnun, Akkaya & Hacıomeroglu, 2012; Ozgen, 2015; Sumen & Calisici, 2016). ML performance of the pre-service teachers (Gurbuz, 2014; Kabael & Barak, 2016; Tekin & Tekin, 2004), their views and perceptions towards ML (Ozgen & Kutluca, 2013, Pilten, Divrik, Pilten & Ebret, 2016, Sefik & Dost, 2016) were examined. Also, Gurbuz (2014) determined that pre-service mathematics teachers were successful at selecting and categorizing questions similar to the PISA questions at the end of ML education, but failed to achieve the desired result in question writing.
In addition to intensive and comprehensive ML studies with pre-service teachers, it is seen that there are a limited number of studies with teachers in Turkey. Altun and Akkaya (2014) revealed the reasons for failure of Turkish students in PISA with the views of teachers. Genc and Erbas (2017) examined the views of high school mathematics teachers about the mathematics curriculum emphasizing on ML.
In recent years, there have been many studies with teachers, pre-service teachers and students about problem-posing. In one of these studies, Ulusoy and Kepceoglu (2018) investigated pre-service middle school mathematics teachers’ problems posed in a semi-structured problem-posing context concerning contextual and cognitive structures. The results showed that most of the pre-service teachers used all quantitative data given in the semi-structured problem-posing task. Unlu and Sarpkaya-Aktas (2017) investigated the problems posed by the participants about equations and algebraic expressions in their study with the pre-service mathematics teachers. In their study, pre-service teachers were successful in posing problems for algebraic expressions and equations. Pre-service teachers generally posed verbal problems and frequently used daily language in their problems.
In the relevant literature, there are a limited number of studies dealing with ML and problem-posing together. In the study conducted by Ozgen et al. (2019), mathematics literacy and self-efficacy towards problem-posing were examined. The study was conducted with the participation of the mathematics teachers, it was observed that the mathematics literacy and problem-posing self-efficacy of the participants did not differ significantly according to variables, such as gender, graduation status, faculty graduated, and professional experience. The researchers stated that there was a significant relationship between mathematics teachers' mathematics literacy and self-efficacy towards problem posing. In another study, Sahin and Basgul (2018) investigated mathematics pre-service teachers’ problem-posing skills appropriateness to the nature of PISA. Their findings showed that many of the problems that pre-service teachers posed are appropriate to the nature of PISA. In addition, it was seen that the pre-service teachers generally posed open-ended problems, but they less prefer to pose multiple-choice and short-answer problems. When pre-service teachers’ problems are examined concerning the content, context and process skills, pre-service teachers’ most posed problems were in the content of quantity, in the personal and occupational context and generative skill-oriented. To
184 Kemal OZGENEurasian Journal of Educational Research 84 (2019) 177-212
our knowledge, there are no studies examining the problem-posing skills of teachers and pre-service teachers, together with ML.
It is understood that the teachers need training for knowledge and application skills for ML. In some studies (Gurbuz, 2014; Yenilmez & Ata, 2013), the development of problem activities for ML was not thoroughly examined, although ML performance, self-efficacy beliefs or views of mathematics teachers and pre-service teachers were examined within ML course or education. In most of the studies conducted, the activities in past PISA exams which were examined within the scope of the problem activities were applied and investigated. In this study, it is thought that the examination of problem-posing skills for ML after mathematics teachers and pre-service teachers’ ML education is given important information for mathematics education.
One of the most important aims of mathematics education in schools is to improve students’ ML competences. In this context, it is expected that mathematics teachers and pre-service teachers have knowledge, skills and experiences towards ML. The problems that are used in the learning-teaching process of developing students’ ML are important. In this direction, mathematics educators need to pose mathematical problem situations to develop and measure ML.
Method
Research Design
This research was carried out using the case study. The multiple case (holistic) design was adopted in this study. This study contains more than a single case. Thus, this study used a multiple case study design (Yin, 2003, p. 46). In this study, problem-posing situations of teachers and pre-service teachers were accepted as multiple cases. This model is used because the present study aims to investigate the mathematics teachers and pre-service teachers’ problem-posing skills for ML extensively.
It is understood that problem-solving and problem-posing are important factors in developing ML skills and experiences of students in their mathematics courses. In this respect, mathematics teachers should have theoretical knowledge about problem-solving for ML and should be able to reflect on practice. In the relevant literature, various quantitative studies have been conducted on the ML skills, awareness and beliefs of pre-service mathematics teachers and students. In this study, the problem-posing skills of mathematics teachers and pre-service teachers are discussed with a qualitative approach. Examining the mathematics teachers and pre-service teachers’ problem-posing skills together and making comparisons reveal the important and original dimensions of this study.
Research Sample
This research was carried out under the ML course, which was an elective course in mathematics education undergraduate and graduate level programs. The study group consisted of 13 pre-service mathematics teachers and five middle school
Kemal OZGENEurasian Journal of Educational Research 84 (2019) 177-212
185
mathematics teachers who took ML courses in undergraduate and graduate education. Pre-service teachers continued their education in the Faculty of Education. The mathematics teachers were graduated from the Faculty of Education. It is compulsory to take mathematics, mathematics education and general culture courses in teacher education in Turkey. Courses, such as teaching methods, material development, measurement and evaluation, teaching practice, history and philosophy of mathematics, are considered as mathematics education courses and graduates should be successful in these courses. Before this study, pre-service teachers had taken mathematics courses and general educational sciences courses related to the learning and teaching approach. Pre-service teachers did not take a course on mathematics education. In addition, mathematics teachers and pre-service teachers in this study did not take any course for mathematical problem-solving and problem-posing before this study. Since all participants needed to have an ML course history, the purposeful sampling method was applied. In the study, participants participated in the problem-posing process individually after the ML course. Participants did not receive any training or courses for ML before research. Thus, it is assumed that the participants have limited knowledge, skills and experience of ML.
Data Collection
Within the scope of the relevant ML course, theoretical foundations for ML were given and applied studies were carried out. In this context, participants were asked to pose three problems for ML. The data collection tool of this research was the mathematical problems that mathematics teachers and pre-service teachers individually posed for ML. To determine the level of knowledge, skills and experiences of teachers and pre-service teachers for ML, a free problem-solving activity was applied. Because of the lack of knowledge and experience of the participants in this study and their lack of training, it was preferred to apply free problem-posing activities to develop their problem-posing skills. Each participant was asked to pose three problems for ML. Problems posed by teachers and pre-service teachers were not subject to any mathematical concept or subject restriction. Participants were asked to pose mathematical problem situations for ML. Mathematics teachers and pre-service teachers were asked to develop problem-posing activities at the end of the ML course. The application with the teachers and pre-service teachers was made in the classroom environment. In practice, the participants were given sufficient time. It was also said that they could use resources, such as the internet, computer and books in problem posing.
Data Analysis
The problems that participants posed for ML were analyzed by descriptive analysis technique in the scope of qualitative analysis. The data obtained from participants were summarized and interpreted according to the predefined theme and, findings were arranged by a direct citation of the problems (Yildirim & Simsek, 2005). The themes used as the theoretical framework in the analysis of the problems were determined by examining the PISA 2012 study (OECD, 2012).
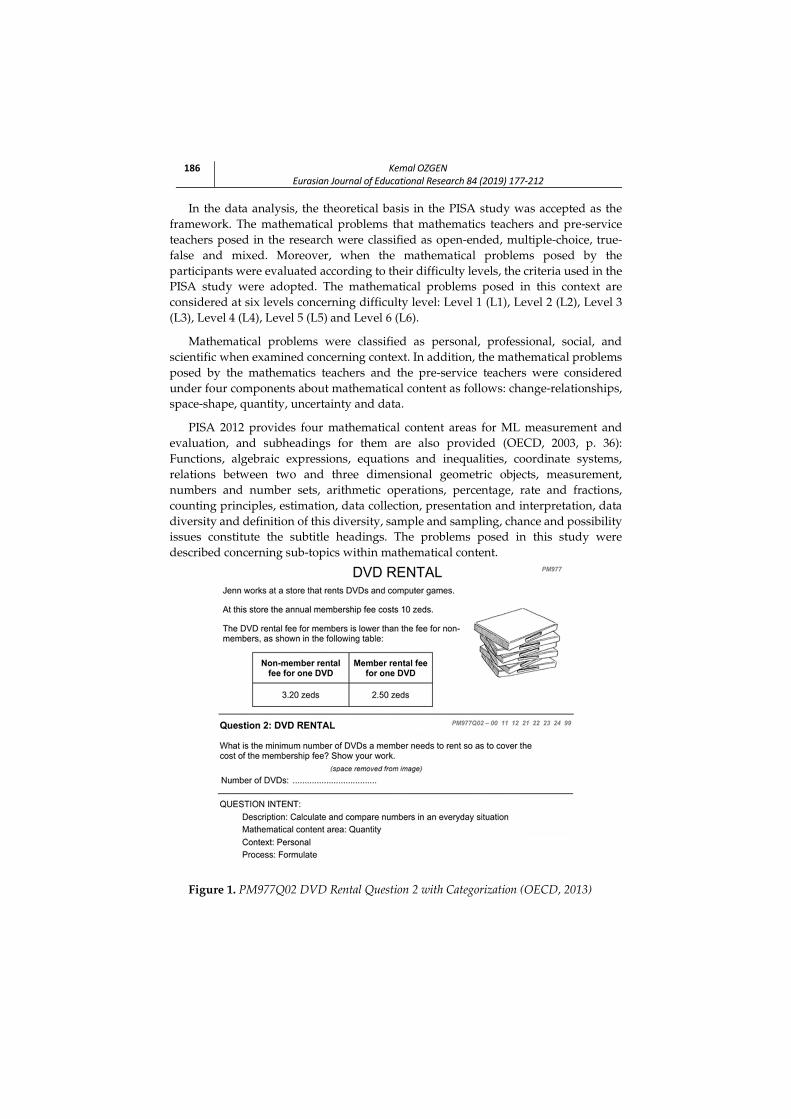
186 Kemal OZGENEurasian Journal of Educational Research 84 (2019) 177-212
In the data analysis, the theoretical basis in the PISA study was accepted as the
framework. The mathematical problems that mathematics teachers and pre-service teachers posed in the research were classified as open-ended, multiple-choice, true-false and mixed. Moreover, when the mathematical problems posed by the participants were evaluated according to their difficulty levels, the criteria used in the PISA study were adopted. The mathematical problems posed in this context are considered at six levels concerning difficulty level: Level 1 (L1), Level 2 (L2), Level 3 (L3), Level 4 (L4), Level 5 (L5) and Level 6 (L6).
Mathematical problems were classified as personal, professional, social, and scientific when examined concerning context. In addition, the mathematical problems posed by the mathematics teachers and the pre-service teachers were considered under four components about mathematical content as follows: change-relationships, space-shape, quantity, uncertainty and data.
PISA 2012 provides four mathematical content areas for ML measurement and evaluation, and subheadings for them are also provided (OECD, 2003, p. 36): Functions, algebraic expressions, equations and inequalities, coordinate systems, relations between two and three dimensional geometric objects, measurement, numbers and number sets, arithmetic operations, percentage, rate and fractions, counting principles, estimation, data collection, presentation and interpretation, data diversity and definition of this diversity, sample and sampling, chance and possibility issues constitute the subtitle headings. The problems posed in this study were described concerning sub-topics within mathematical content.
Figure 1. PM977Q02 DVD Rental Question 2 with Categorization (OECD, 2013)
Kemal OZGENEurasian Journal of Educational Research 84 (2019) 177-212
187
Problems were investigated under three components concerning using
mathematical processes: (i) formulating situations mathematically, (ii) employing mathematical concepts, facts, procedures, and reasoning employing mathematical concepts, facts, processes and reasoning, and (iii) interpreting, applying and evaluating mathematical outcomes.
There is an example of one item in the PISA framework in Figure 1. PM977 DVD rental was a three item-unit, which was used in the PISA 2012 field trial then released (OECD 2013). Figure 1 shows the stimulus, Question 2, and the categorization of this question. The item was of above-average difficulty.
In the analysis of the posed problems, descriptive statistics were used. It is possible to have more than one mathematical process skill in a mathematical problem. In other words, one or more of the skills of formulating, employing and interpreting can be found at different levels. Thus, the following points were applied to the problems when the posed problems were examined concerning process skills (formulating, employing and interpreting). A scoring framework to measure participants’ formulating, employing and interpreting process skills are reflected in the problems posed by the participants is presented below. This scoring approach was adapted from PISA studies. As in the PISA study, it was accepted that each problem posed had a dominant process skill. In addition, this dominant process skill was scored according to the degree of reflection of that skill to the posed problem, as in the following rubric.
2 point: Related process skill at the appropriate level
1 point: Related process skill at partially seen
0 point: Empty or no related process skill at all
Participants’ process skills (formulating, employing and interpreting) were examined and compared with the Mann-Whitney U test. Evidence is provided for the themes and categories indicated by the approach of direct citation from the problems of teachers and pre-service teachers. Codes, such as “T1, T2 ...” were given to mathematics teachers and “S1, S2 ...” to pre-service teachers. The data obtained from the posed problems were investigated by the researchers at different times and the reliability of the analysis of the data tried to be provided. Particularly to further refine the categories in the descriptive analysis, participants were directly quoted from the problems they had designed, and comments were presented.
Procedure
This research was conducted in ML courses that participants enrolled as a part of their undergraduate and graduate programs. Teachers and pre-service teachers did not have any interaction with each other. Course processes were conducted at different times and environments. The course practice was conducted by the researcher in a classroom setting and during a semester of three hours a week.
During ML courses, theoretical information was given firstly and then they were asked to make various applications both inside and outside the classroom. Sample
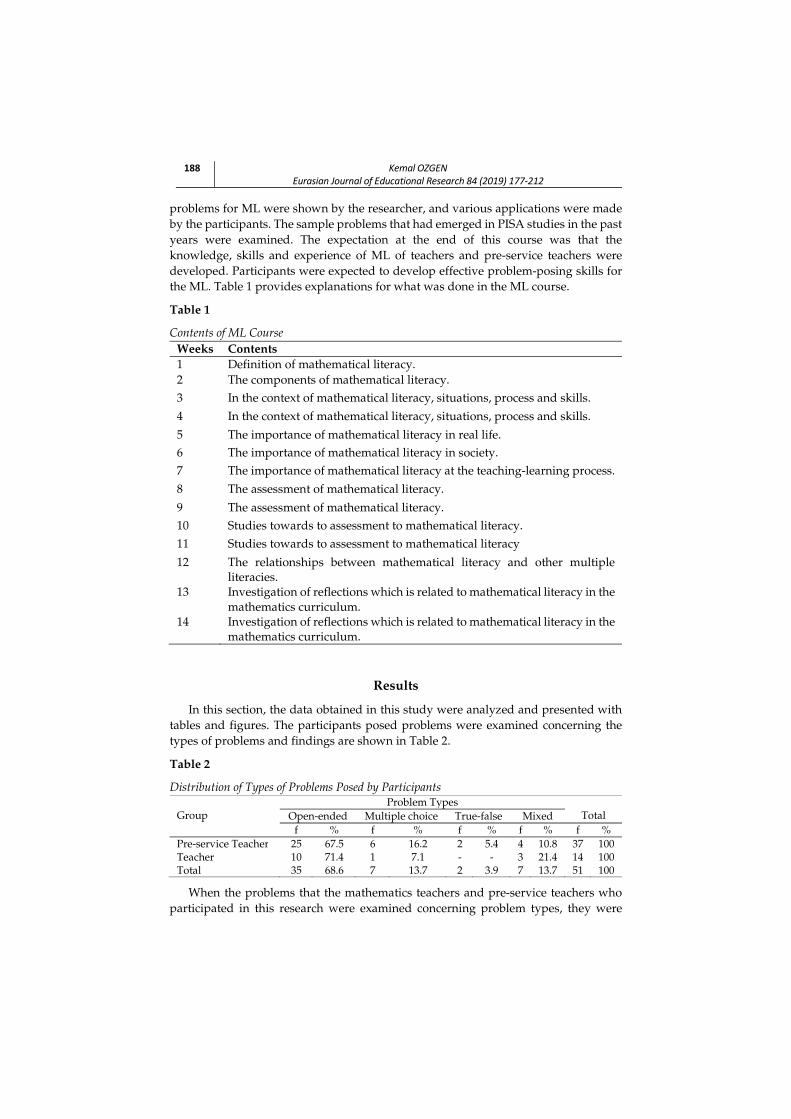
188 Kemal OZGENEurasian Journal of Educational Research 84 (2019) 177-212
problems for ML were shown by the researcher, and various applications were made by the participants. The sample problems that had emerged in PISA studies in the past years were examined. The expectation at the end of this course was that the knowledge, skills and experience of ML of teachers and pre-service teachers were developed. Participants were expected to develop effective problem-posing skills for the ML. Table 1 provides explanations for what was done in the ML course.
Table 1
Contents of ML Course Weeks Contents 1 Definition of mathematical literacy. 2 The components of mathematical literacy. 3 In the context of mathematical literacy, situations, process and skills.
4 In the context of mathematical literacy, situations, process and skills.
5 The importance of mathematical literacy in real life. 6 The importance of mathematical literacy in society. 7 The importance of mathematical literacy at the teaching-learning process.
8 The assessment of mathematical literacy.
9 The assessment of mathematical literacy. 10 Studies towards to assessment to mathematical literacy.
11 Studies towards to assessment to mathematical literacy
12 The relationships between mathematical literacy and other multiple literacies.
13 Investigation of reflections which is related to mathematical literacy in the mathematics curriculum.
14 Investigation of reflections which is related to mathematical literacy in the mathematics curriculum.
Results
In this section, the data obtained in this study were analyzed and presented with tables and figures. The participants posed problems were examined concerning the types of problems and findings are shown in Table 2.
Table 2
Distribution of Types of Problems Posed by Participants Group
Problem Types Total Open-ended Multiple choice True-false Mixed
f % f % f % f % f % Pre-service Teacher 25 67.5 6 16.2 2 5.4 4 10.8 37 100 Teacher 10 71.4 1 7.1 - - 3 21.4 14 100 Total 35 68.6 7 13.7 2 3.9 7 13.7 51 100
When the problems that the mathematics teachers and pre-service teachers who participated in this research were examined concerning problem types, they were
Kemal OZGENEurasian Journal of Educational Research 84 (2019) 177-212
189
mostly open-ended problems and the least posed problem type was true-false problems were posed. This finding was found to be valid for both mathematics teachers and pre-service teachers. In the case of mixed problems, two or three problems presented depending on a given situation can cover open-ended, multiple-choice, or true-false types. The multiple-choice problem named “Restaurant”, which the T1-coded teacher posed, is given below. This problem was considered to be mixed in structure because the participant developed both multiple-choice and open-ended problem examples depending on the situation given here.
Restaurant
A fish restaurant manager is looking for a place suitable for this job. He decides to rent one of the places he looks at. The empty area that he finds is 260 m2. The manager, who wants to fill the empty area as much as possible, has added as many tables as possible to the area. The dining tables are for four people and have dimensions of 90 cm and 120 cm.
Problem-1: Which of the following can be the number of customers on a day when the restaurant is full?
A) 80 B) 480 C) 2800 D) 4000
Problem-2: The restaurant has 12 kinds of fish, three kinds of salads and five kinds of appetizers. How many different options do customers have if they choose one portion from fish, salads and appetizers?
The example of the open-ended problem named “Discount”, which the S10 pre-service teacher posed for ML, is shown below.
Discount
Suit dress price range: 50 – 500 TL
Jacket price range: 100 - 300 TL
Trousers price range: 30 – 100 TL
A clothing store plans to give a special discount on Christmas. The store team has planned different discounts on suit dress dresses, jacket and trousers. 30% discount on the suit dress, 50% discount on the jacket, and “Buy 3 pay for 2” campaigns on the trousers. Which type of dress has the highest discount rate?
In this study, the participants preferred to pose open-ended problems concerning the type of problems they posed for ML. This finding can be interpreted as a result of the positive effects of the course participants' course on ML. Because of the ML course, it can be said that they have developed a positive perception about the nature, structure, development and measurement of the problem type suitable for ML.
Findings for the analysis of the participants' difficulty level of the problems that they posed for the ML are presented in Table 3.
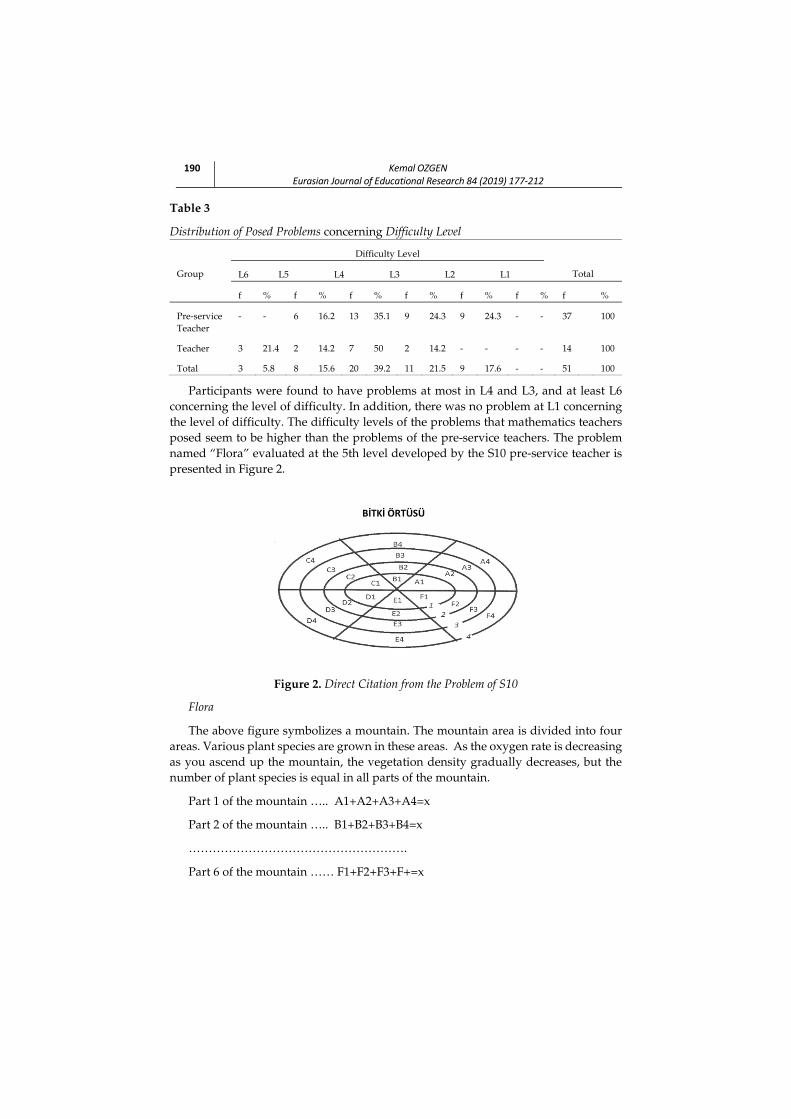
190 Kemal OZGENEurasian Journal of Educational Research 84 (2019) 177-212
Table 3
Distribution of Posed Problems concerning Difficulty Level
Group
Difficulty Level
Total L6 L5 L4 L3 L2 L1
f % f % f % f % f % f % f %
Pre-service Teacher
- - 6 16.2 13 35.1 9 24.3 9 24.3 - - 37 100
Teacher 3 21.4 2 14.2 7 50 2 14.2 - - - - 14 100
Total 3 5.8 8 15.6 20 39.2 11 21.5 9 17.6 - - 51 100
Participants were found to have problems at most in L4 and L3, and at least L6 concerning the level of difficulty. In addition, there was no problem at L1 concerning the level of difficulty. The difficulty levels of the problems that mathematics teachers posed seem to be higher than the problems of the pre-service teachers. The problem named “Flora” evaluated at the 5th level developed by the S10 pre-service teacher is presented in Figure 2.
Figure 2. Direct Citation from the Problem of S10
Flora
The above figure symbolizes a mountain. The mountain area is divided into four areas. Various plant species are grown in these areas. As the oxygen rate is decreasing as you ascend up the mountain, the vegetation density gradually decreases, but the number of plant species is equal in all parts of the mountain.
Part 1 of the mountain ….. A1+A2+A3+A4=x
Part 2 of the mountain ….. B1+B2+B3+B4=x
……………………………………………….
Part 6 of the mountain …… F1+F2+F3+F+=x
BİTKİ ÖRTÜSÜ

Kemal OZGENEurasian Journal of Educational Research 84 (2019) 177-212
191
In addition, region 2 has more than 10 plant species in zone 1. Zone 3 has more than 30 plant species in zone 2 and zone 4 has more than 60 plants in zone 3. Accordingly, what is the minimum number of x?
S10’s problem is related to the content of change-relationships and mathematical issues, such as algebraic expressions. In this problem, it can be said that the student must construct a model, think different mathematical concepts together and use different notations. In addition to making algebraic operations with the model that the learner will take the interpretation of the results, he finds as important points. This problem also aims to interpret the findings of the learners. If all these cognitive processes mentioned in this problem are taken into consideration, it can be said that the problem mentioned is a problem that is in accordance with L5 in terms of difficulty level because students at the 5th level can develop and employ models for complex situations. Students can also choose, compare and evaluate appropriate problem-solving strategies. They can communicate between their own interpretations and their conclusions based on their reasoning (OECD, 2013, p. 41).
The problem named “Sales”, in which the S2 pre-service teacher posed was assessed in L2, is shown in Figure 3.
Figure 3. Direct Citation from the Problem of S2
Within one week, 1000 books were sold in a store. The percentage of books sold is shown in the chart above.
Problem: How many more physics books need to be sold so that the number of physics books sold equals the number of mathematics books sold in a week?
S2’s Sales problem includes a graphical representation. In this context, the graph shows the percentage of sales of textbooks in one week. In the problem, it is stated that 1000 books are sold in one week, and according to this, the number of books in all courses can be found by reading the graph. Later, a relationship between the number of physics and mathematics books was questioned. In this case, students have the opportunity to reason about simple relationships in a given situation and to interpret the results in a limited way. Since this problem is not reflected in the upper-level cognitive process skills. It is thought that the problem is an L2 problem concerning the level of difficulty because the students in the second level can apply basic algorithms,
Sales
Mathematic Books Physic Books Science Books Biology
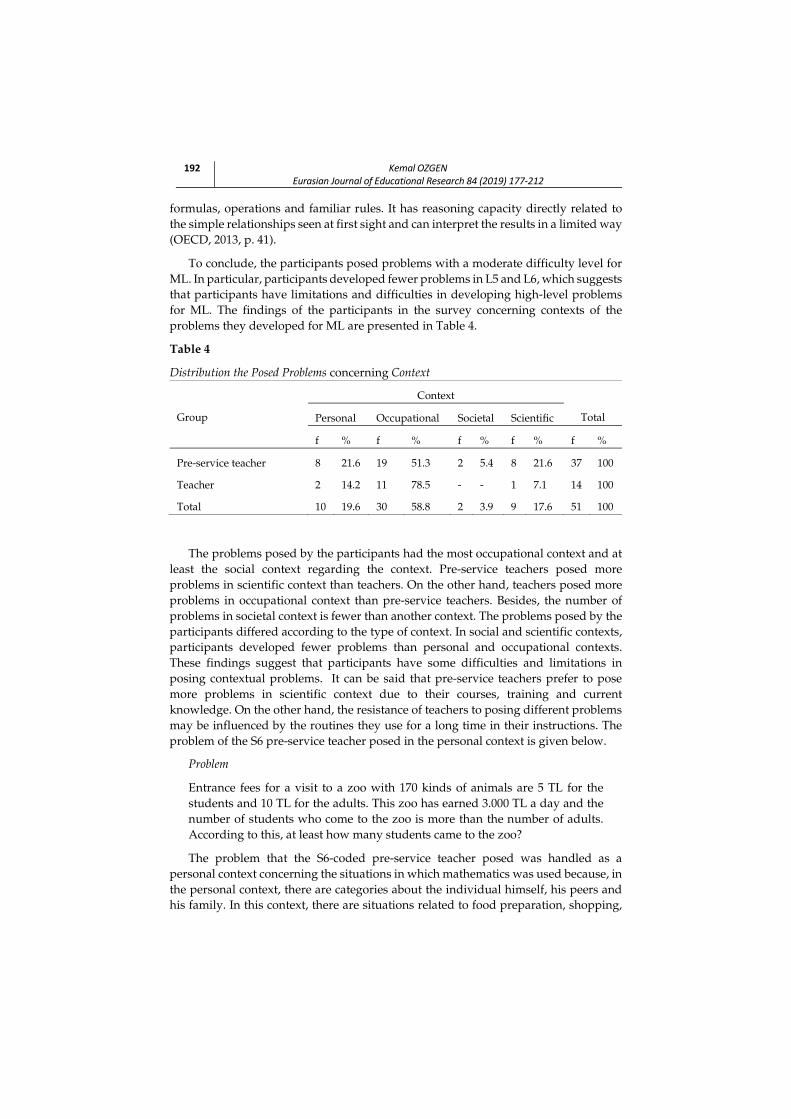
192 Kemal OZGENEurasian Journal of Educational Research 84 (2019) 177-212
formulas, operations and familiar rules. It has reasoning capacity directly related to the simple relationships seen at first sight and can interpret the results in a limited way (OECD, 2013, p. 41).
To conclude, the participants posed problems with a moderate difficulty level for ML. In particular, participants developed fewer problems in L5 and L6, which suggests that participants have limitations and difficulties in developing high-level problems for ML. The findings of the participants in the survey concerning contexts of the problems they developed for ML are presented in Table 4.
Table 4
Distribution the Posed Problems concerning Context
Group
Context
Total Personal Occupational Societal Scientific
f % f % f % f % f %
Pre-service teacher 8 21.6 19 51.3 2 5.4 8 21.6 37 100
Teacher 2 14.2 11 78.5 - - 1 7.1 14 100
Total 10 19.6 30 58.8 2 3.9 9 17.6 51 100
The problems posed by the participants had the most occupational context and at least the social context regarding the context. Pre-service teachers posed more problems in scientific context than teachers. On the other hand, teachers posed more problems in occupational context than pre-service teachers. Besides, the number of problems in societal context is fewer than another context. The problems posed by the participants differed according to the type of context. In social and scientific contexts, participants developed fewer problems than personal and occupational contexts. These findings suggest that participants have some difficulties and limitations in posing contextual problems. It can be said that pre-service teachers prefer to pose more problems in scientific context due to their courses, training and current knowledge. On the other hand, the resistance of teachers to posing different problems may be influenced by the routines they use for a long time in their instructions. The problem of the S6 pre-service teacher posed in the personal context is given below.
Problem
Entrance fees for a visit to a zoo with 170 kinds of animals are 5 TL for the students and 10 TL for the adults. This zoo has earned 3.000 TL a day and the number of students who come to the zoo is more than the number of adults. According to this, at least how many students came to the zoo?
The problem that the S6-coded pre-service teacher posed was handled as a personal context concerning the situations in which mathematics was used because, in the personal context, there are categories about the individual himself, his peers and his family. In this context, there are situations related to food preparation, shopping,
Kemal OZGENEurasian Journal of Educational Research 84 (2019) 177-212
193
play, personal health, travel, personal budget and time management (MoNE, 2012). In this problem, there is an action or behavior in the routine life of the person concerned with the situations related to entrance fees to the zoo. For these reasons, the posed problem is considered as a personal context. The occupational context problem of the T3-coded teacher is given below.
Field
The farmer Mehmet has a field of 200 m and 100 m edge length in the form of a rectangle. Mehmet wants to plant wheat in this this field. The amount of seeds proposed by the agricultural engineers for the 1-acre field is a minimum of 20 kg and a maximum of 25 kg.
Problem -1: How many kilograms of seed will be used for Mehmet's wheat cultivation?
Problem-2: Mehmet plows the field with a 4 m long cultivator parallel to the long edge of the field. The second version runs parallel to the short edge.
Select “True” or “False” for the following proposals.
- The cultivator has made fewer round trips in the 1st round of farming
-In the 2nd version of the farm, the cultivator spent less fuel.
- The number of round trips in the 2nd version of the cultivator farm is half of the 1st crop.
There are a real dutiful occupation and related situations in T3’s “Field” problem. This problem is particularly related to the professional situation of farmers and the use of mathematics. Because of this context, there are often situations that are related to a profession or business life. Topics, such as measurement, cost, ordering for buildings, accounting, quality control, time management, design/architecture, business-based decisions, are evaluated within the professional context (MoNE, 2012). In this problem, it can be said that the situations in the farming profession and the topics, such as length, area and measurement from traditional mathematics subjects, are related. It is considered that this problem developed due to these reasons is in the occupational context.
Some of the contexts were less involved in the problems posed by participants in this study for ML. This finding may be an indication of the participants' limited knowledge and beliefs about the use of mathematics. The participants in the research were more successful in writing problems in professional contexts. Pre-service teachers were able to establish problems in different contexts, while teachers were not able to establish problems in all contexts. Different experiences are needed to develop contextual problems for ML.
Mathematics teachers and pre-service teachers’ problems that they posed for ML are analyzed in terms of mathematical content and the findings obtained are shown in Table 5.

194 Kemal OZGENEurasian Journal of Educational Research 84 (2019) 177-212
Table 5
Distribution of Posed Problems concerning Mathematical Content Group
Mathematical content Total
Change- relationships
Space-shape
Quantity Uncertainty-data
f % f % f % f % f % Pre-service teacher
21 56.7 6 16.2 3 8.1 7 18.9 37 100
Teacher 4 28.5 5 35.7 3 21.4 2 14.2 14 100 Total 25 49 11 21.5 6 11.7 9 17.6 51 100
Analysis of the participants' problems in terms of mathematical content, it was revealed that the content of the change-relationships was most frequently used, while the content of the quantity was the least frequently used. It can be said that teachers’ and pre-service teachers’ problems did not show similarity in terms of the problem content. In particular, it is seen that teachers place the most space-shape in their problems and at least the uncertainty-data content. The problem named “Desktop Computer Set”, which S12-code pre-service teacher posed in the context of change-relationships, is given below.
Desktop Computer Set
Furkan wants to buy a desktop computer set, and, going to a store selling computers and parts. This store has a sales campaign. In this campaign, a monitor a case, a keyboard, a mouse, and two speakers can all be taken together with a more appropriate price tag. The prices of this store are given in Table 6.
Table 6
The Prices of Stores Product Price (TL) Campaign products 1700 or 2100 Monitor 500, 645 or 900 Case 750 Keyboard and mouse 320 or 450 1 speaker 65 or 110
Problem-1: Furkan wants to buy these products separately or use the campaign. What is the lowest and highest price for this?
Problem-2: The store offers three different monitors, two different keyboards and a mouse, two different speakers. There is only one option for the case. How many different desktop computers can Furkan create?
Problem-3: Since Furkan can spend 1975 TL, he wants to buy the most expensive desktop computer set he can get with his money. So how can this selection be picked up?
Kemal OZGENEurasian Journal of Educational Research 84 (2019) 177-212
195
In the problem named “Desktop computer set” posed by the pre-service teacher
with S12 code, there are various computer parts and alternative prices for them. Here, if the student gets a desktop computer, the minimum or maximum wage account is asked. In addition, how many different combinations can be made is asked. This problem is directed at examining the changes and relationships within a situation that students may encounter in the real world because this problem emphasizes the changes and relationships between both the real world and the edited event, phenomenon, or situations. The contents of change-relationships include functions of algebraic expressions, equations, inequalities, table and graphical representations and algebraic topics from traditional mathematical subjects (OECD, 2013, pp. 33-35). In this direction, it can be said that the students are able to recognize the change-relationships in the given situation and transform them into a mathematical world, where the mathematical process skills are to be employed on and the interpretation of the findings obtained later is possible. This problem can be considered in the change and relationships in terms of mathematical content. The problem titled “Article” which S7 code pre-service teacher posed in space-shape content is given below.
Article
The teacher wants students to write an article on rectangular paper with a short edge of 16 cm and a long edge of 35 cm. The teacher wants a space of 2 cm from the top, a space of 3 cm below, and a space of 1.5 cm from the right and left edges to be left blank. Considering these precautions, how many square centimeters are the areas of the smallest rectangular area to enclose the article to be written?
It is required to write an article under certain conditions on a paper with a rectangular shape given the length of the problem named “Article” posed by the S7 code pre-service teacher. In addition, the area of the smallest rectangle that can contain this article is questioned. In this problem, the smooth geometric shape deals with the situation of reflection in the real world. Since the problem is related to geometry, it can be said that this problem is related to the space-shape content in terms of mathematical content. This is because space-shape content deals with phenomena that appear frequently and are frequently encountered in the physical world. Phenomena, such as patterns, properties, locations and centers, representations, coding and recoding of visible information, directions of real shapes and dynamic interactions, are in the space-shape content. The space-shape content generally falls into the field of geometry. Space-shape content includes actions, such as perspective drawings, map drawings, drawing and transforming shapes, three-dimensional views, representation of shapes (OECD, 2013, pp. 33-35).
The problems posed by the participants in this study did not have a balanced distribution concerning mathematical content. Particularly, the participants did not mostly prefer to develop problems in terms of quantity and uncertainty-data content. This finding may be due to the difficulty of the nature of the mathematical concepts in these contents or the beliefs of the participants about these contents. It was understood that the participants in the research found and posed real-life problems more easily in
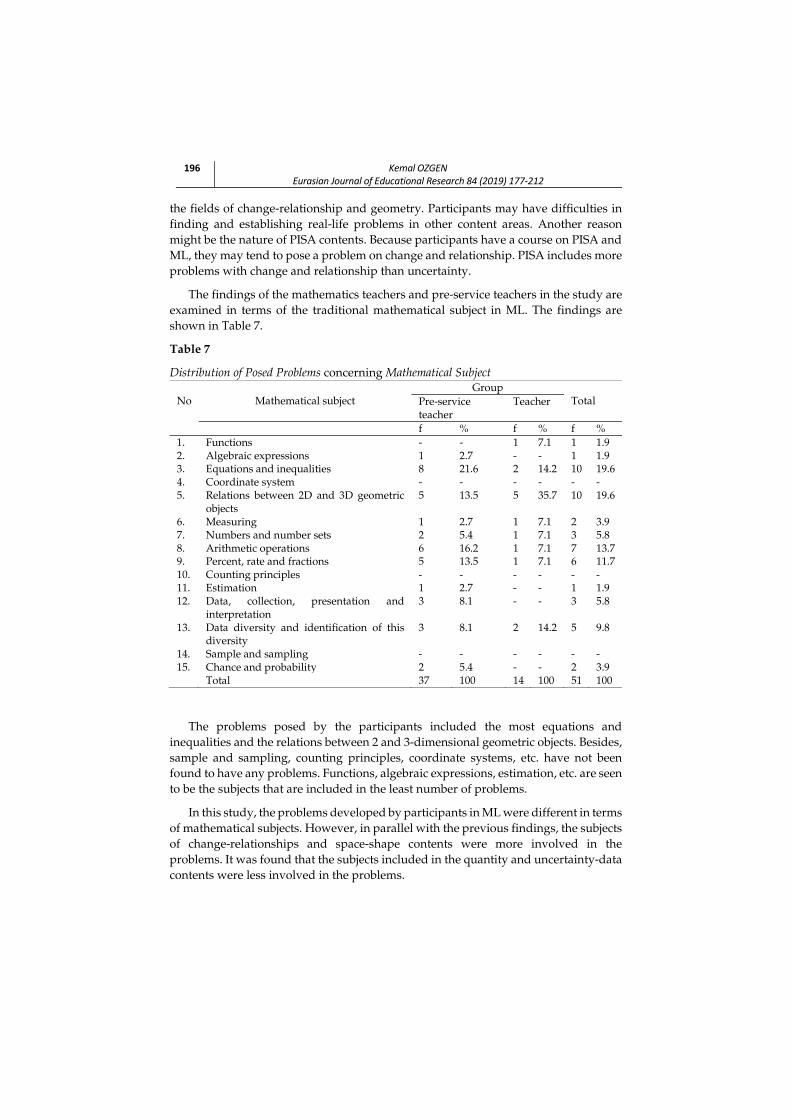
196 Kemal OZGENEurasian Journal of Educational Research 84 (2019) 177-212
the fields of change-relationship and geometry. Participants may have difficulties in finding and establishing real-life problems in other content areas. Another reason might be the nature of PISA contents. Because participants have a course on PISA and ML, they may tend to pose a problem on change and relationship. PISA includes more problems with change and relationship than uncertainty.
The findings of the mathematics teachers and pre-service teachers in the study are examined in terms of the traditional mathematical subject in ML. The findings are shown in Table 7.
Table 7
Distribution of Posed Problems concerning Mathematical Subject No
Mathematical subject
Group Total Pre-service
teacher Teacher
f % f % f % 1. Functions - - 1 7.1 1 1.9 2. Algebraic expressions 1 2.7 - - 1 1.9 3. Equations and inequalities 8 21.6 2 14.2 10 19.6 4. Coordinate system - - - - - - 5. Relations between 2D and 3D geometric
objects 5 13.5 5 35.7 10 19.6
6. Measuring 1 2.7 1 7.1 2 3.9 7. Numbers and number sets 2 5.4 1 7.1 3 5.8 8. Arithmetic operations 6 16.2 1 7.1 7 13.7 9. Percent, rate and fractions 5 13.5 1 7.1 6 11.7 10. Counting principles - - - - - - 11. Estimation 1 2.7 - - 1 1.9 12. Data, collection, presentation and
interpretation 3 8.1 - - 3 5.8
13. Data diversity and identification of this diversity
3 8.1 2 14.2 5 9.8
14. Sample and sampling - - - - - - 15. Chance and probability 2 5.4 - - 2 3.9 Total 37 100 14 100 51 100
The problems posed by the participants included the most equations and inequalities and the relations between 2 and 3-dimensional geometric objects. Besides, sample and sampling, counting principles, coordinate systems, etc. have not been found to have any problems. Functions, algebraic expressions, estimation, etc. are seen to be the subjects that are included in the least number of problems.
In this study, the problems developed by participants in ML were different in terms of mathematical subjects. However, in parallel with the previous findings, the subjects of change-relationships and space-shape contents were more involved in the problems. It was found that the subjects included in the quantity and uncertainty-data contents were less involved in the problems.
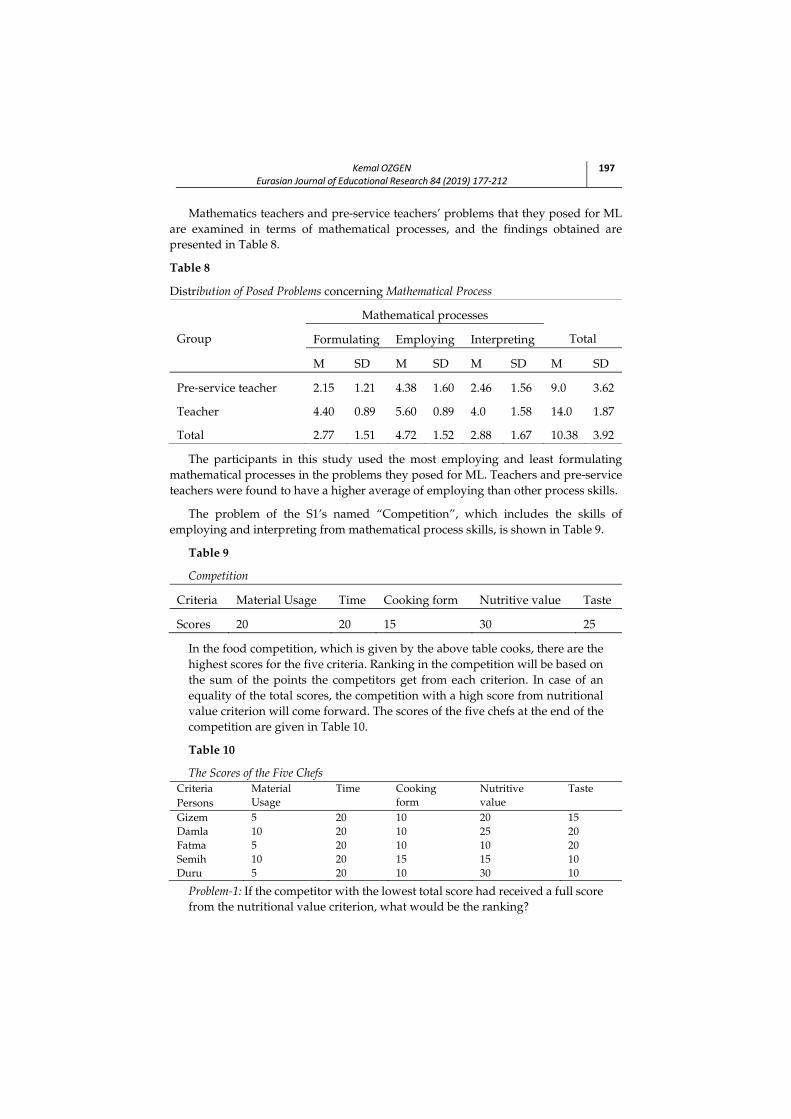
Kemal OZGENEurasian Journal of Educational Research 84 (2019) 177-212
197
Mathematics teachers and pre-service teachers’ problems that they posed for ML
are examined in terms of mathematical processes, and the findings obtained are presented in Table 8.
Table 8
Distribution of Posed Problems concerning Mathematical Process
Group
Mathematical processes
Total Formulating Employing Interpreting
M SD M SD M SD M SD
Pre-service teacher 2.15 1.21 4.38 1.60 2.46 1.56 9.0 3.62
Teacher 4.40 0.89 5.60 0.89 4.0 1.58 14.0 1.87
Total 2.77 1.51 4.72 1.52 2.88 1.67 10.38 3.92
The participants in this study used the most employing and least formulating mathematical processes in the problems they posed for ML. Teachers and pre-service teachers were found to have a higher average of employing than other process skills.
The problem of the S1’s named “Competition”, which includes the skills of employing and interpreting from mathematical process skills, is shown in Table 9.
Table 9
Competition
Criteria Material Usage Time Cooking form Nutritive value Taste
Scores 20 20 15 30 25
In the food competition, which is given by the above table cooks, there are the highest scores for the five criteria. Ranking in the competition will be based on the sum of the points the competitors get from each criterion. In case of an equality of the total scores, the competition with a high score from nutritional value criterion will come forward. The scores of the five chefs at the end of the competition are given in Table 10.
Table 10
The Scores of the Five Chefs Criteria Material
Usage Time Cooking
form Nutritive value
Taste Persons Gizem 5 20 10 20 15 Damla 10 20 10 25 20 Fatma 5 20 10 10 20 Semih 10 20 15 15 10 Duru 5 20 10 30 10
Problem-1: If the competitor with the lowest total score had received a full score from the nutritional value criterion, what would be the ranking?
198 Kemal OZGENEurasian Journal of Educational Research 84 (2019) 177-212
Problem-2: When we rank scores from highest to lowest, what happens to Semih in the competition?
Problem-3: Indicate “True” or “False” for each of the following statements.
a.) If Gizem received full marks from the criteria for material use, it would have passed the Damla.
b.) If Fatma took 5 points more than the nutritional value criterion, it would be in the same order as Semih.
c.) It would be in the same order as Semih if the score Gizem received from the taste criteria, and the score it received from the nutritional value were replaced.
It can be said that in the problem named “Competition” posed by the pre-service teacher with S1 code, the skills of employing and interpreting take place in terms of mathematical processes. In this problem, mathematical operations, such as arithmetic summing and table reading, are required, and these operations describe the mathematical ability to employ. Because employing describes the use of mathematical concepts, facts, processes, and reasoning of individuals to solve mathematically formulated problems to obtain a set of mathematical decisions (OECD, 2013, pp. 29-30). Moreover, it can be said that the results or decisions obtained as a result of the employing process reflect the interpreting skills in the context of the real-life i.e., the problem. Interpreting is defined as the capacity of individuals to interpret them in a real-life problem by showing mathematical solutions, conclusions, or decisions. This mathematical process can also be defined as an evaluation process (OECD, 2013, pp. 29-30). The “Gold Mine” problem, which is posed by the T2 code mathematics teacher and includes the skills of formulating, employing and interpreting, is given below.
Gold Mine
A company that tries to find a gold mine collects samples by making excavations. The depths in which the four collected samples are taken are given in Table 11.
Table 11
The Depths in Which the Four Collected Samples Sample Depth K 120 m L 50 m M 98 m N 80 m
Problem-1: How many meters do the average of the depths of gold samples taken according to the table?
Problem-2: The miners could go down to 90m deep in the first week of their work. According to which gold samples they reached?
A) K-L B) L-M C) M-N D) L-N
Problem-3: How many meters in depth could a miner who reached the M gold sample but could not reach the K sample?
A) 121 B) 119 C) 97 D) 90
Kemal OZGENEurasian Journal of Educational Research 84 (2019) 177-212
199
It can be said that in the problem named “Gold Mine” posed by the teacher with
T2 code, the skills of formulating, employing and interpreting take place in terms of mathematical processes. Students need to establish and formulate a mathematical structure to solve this problem. This is because formulating means that individuals can recognize situations in which they can use mathematical knowledge and skills and, after their definition, can make mathematical constructs for a problem presented or presented in the theoretical context. Formulation demonstrates the ability of individuals to analyze, construct and solve a problem and to reveal basic mathematical knowledge and skills (OECD, 2003, p. 28). Later, mathematical manipulation within the mathematical structure established by the students is considered as the ability to employ. Because mathematical concepts, facts, processes, and reasoning in problem-solving carry out many mathematical operations that require individuals to get results and find solutions in the process of employing. For example, arithmetic addition, equation solving, reduction based on mathematical assumptions, table and graph reading, data analysis can be seen as such mathematical operations (OECD, 2013, p. 29). The ability of the students to evaluate the results and decisions they have made for the given problem reflects the interpretation process. Assessment requires that certain results or solutions be produced. In the context of PISA ML, the interpretation process refers to the interpretation of these results or solutions as they are transferred to a real-life situation (OECD, 2013, pp. 29-30).
In this study, employing skills are given more concerning mathematical process skills of the problems developed by participants in ML. Formulation and interpretation skills are also very important for ML, but they have been less involved in developed problems. This finding may be interpreted as a result of the operational oriented viewpoints and beliefs of the participants in mathematics and mathematics education. Findings for comparison of mathematical process skill mean scores for the problems that teachers and pre-service teachers have developed are shown in Table 12.
Table 12
Mann Whitney-U Test Results of Mathematical Process Scores of Participants
Group n Mean Rank Sum of Ranks U p
Formulating Pre-service teacher 13 7.15 93.0 2.00 .002*
Teacher 5 15.60 78.0
Employing Pre-service teacher 13 8.35 108.50 17.50 .113
Teacher 5 12.50 62.50
Interpreting Pre-service teacher 13 8.19 106.50 15.50 .086
Teacher 5 12.90 64.50
Total Pre-service teacher 13 7.46 97.0 6.00 .009*
Teacher 5 14.80 74.0
*p<.05

200 Kemal OZGENEurasian Journal of Educational Research 84 (2019) 177-212
It was found that there was a statistically significant difference in the total scores
of the mathematical process skills (U = 6.00; p <.05) and the formulating scores (U = 2.00; p <.05) for the teachers and pre-service teachers. It seems that this difference in formulating and total points is in favor of the teachers. According to this finding, it can be said that teachers reflect mathematical process skills better in problems. Moreover, there was no significant difference between employing (U = 17.50; p> .05) and interpreting scores (U = 15.50; p> .05) of teachers and pre-service teachers from mathematical process skills. Thus, it can be said that teacher and pre-service teachers reflect the skills of employing and interpreting from mathematical process skills at similar levels in problems. Teachers were ahead of formulating skills and overall total process skills scores compared to pre-service teachers. An underlying reason for this finding may be explained that teachers are more experienced in formulating skills.
Discussion, Conclusion and Recommendations
In this study, the problem-posing skills of mathematics teachers and pre-service teachers who took the ML course were examined. The problems that participants posed for the ML were examined within the scope of the ML measurement and evaluation criteria of the PISA.
In the analysis of the obtained data, it was seen that the problems posed in general were open-ended problems according to problem type. The vast majority of the problems that mathematics teachers and pre-service teachers develop were open-ended problems. After open-ended problems, multiple-choice problems were developed more in number. There were very few problems in the true-false type. This is demonstrated by the participants that open-ended problems are important in the measurement and development of ML. This is because the process, content and context skills that are targeted within the ML are dependent on the nature of the problems and problems being addressed. Sahin and Basgul (2018) found that mathematics pre-service teachers usually posed open-ended problems, but they less preferred to pose multiple-choice and short answer problems after the ML training. Moreover, this result of this study can be seen as the positive reflections of the course that the participants take for ML because of the nature and assessment of ML are compatible with open-ended problems. It is also seen in the findings of this study that it would not be appropriate to use predominantly multiple-choice or true-false problems to develop or measure ML skills. In another study in related literature, factor analysis was carried out concerning the structural features of the ML questions in the study conducted by Altun and Bozkurt (2017). The six-factor structure of the question has been put forward in the form of algorithmic processing, the dominance of rich mathematical content, mathematical inference, mathematical proposal development and/or improved proposal interpretation, comprehension of vital state in mathematical language, the understanding mathematical language in life. It can be argued that the goals of the open-ended structure of the problems that are developed in the teaching, or measurement within the ML are one of the facilitating indicators.
Kemal OZGENEurasian Journal of Educational Research 84 (2019) 177-212
201
In this study, the problems developed by the participants were mostly
concentrated at L4 about the level of difficulty. It was understood that the problems posed by the participants were at the level of L4 and later on the L3. At the highest levels, L6 and L5, a limited number of problems posed by both teachers and pre-service teachers. However, it can be said that mathematics teachers are one step ahead of developing difficult problems concerning difficulty level. More structured problems were posed for ML by the participants. On the contrary, unstructured problems are also known to be needed. In other studies carried out in Turkey, the situation is seen similar to the results observed in this study. Ulusoy and Kepceoglu (2018) found that only 8% of the problems posed by pre-service middle school mathematics teachers at reasoning level. Pre-service teachers produce procedural questions at the application level that could be solved mostly by multi-step processes rather than by reasoning. The results of this study revealed that the pre-service teachers thought that as the operational load of problems increases, the difficulty and cognitive levels of problems also increase. In another study, Iskenderoglu and Baki (2011) classified the questions in one of the 8th-grade textbooks according to the PISA mathematics proficiency scale. According to the results of this classification, it was found that there were no questions at all levels in the 8th-grade textbook. In the book examined, questions, problems, exercises and examples were found to be at Levels 1, 2, 3 and 4. Questions are mostly at Level 2 in this study. Also, Iskenderoglu, Erkan and Serbest (2013) categorized and examined the mathematics questions used in transition to high school exams implemented in Turkey according to the PISA proficiency scale. The mathematics questions in the examinations in the study did not seem to be appropriate for all levels. The questions were generally taken on levels 2, 3 and 4. There was 1 question at the 5th level, which was the highest level and no problem in the 6th level. The results obtained in this study and the corresponding levels on similar results in the literature are similar to ML results of the PISA study in Turkey. The average of the ML scores of the Turkish students in the PISA 2012-2015 exams was in the range of 2 and 3 level (MoNE, 2012, 2016). When these results are considered together, the mathematics education in Turkey has manifestly failed to reach the top levels 5 and 6 in the PISA exams. In addition, it can be said that the mathematics education does not exactly coincide with the content, process and contexts targeted at these levels. The change in the beliefs of teachers and pre-service teachers in mathematics and mathematics education can be effective in developing problems that are appropriate to ML in high-level difficulty.
According to the contexts used, occupational and personal problems were more dominantly posed by the participants in this study. Problems involving scientific and social contexts were determined to be fewer in number. It can be said that the mathematics teachers and pre-service teachers participating in the study have not similar problems concerning the context. In a study by Sahin and Basgul (2018), it was found that pre-service mathematics teachers preferred to develop more mathematical problems in personal and occupational contexts. Concerning context, it is understood that the results in the relevant literature overlap with the results of this research. In addition, it can be said that they have difficulties in developing problems in scientific and social contexts. In the related literature, there are conclusions that pre-service
202 Kemal OZGENEurasian Journal of Educational Research 84 (2019) 177-212
teachers have difficulty in developing contextual problems. In a related study, Ulusoy and Kepceoglu (2018) found the pre-service teachers mostly preferred limited number contexts that are familiar, such as money, diet and test-solving in their problems. In another study, Bennison (2015) emphasizes the importance of context for teachers' development of the ML. The ML should not be taught in the absence of everyday context, and teachers draw from the context which is familiar and unfamiliar to learners (Machaba, 2018). The positive aspects of the ML education given to participants in this study came from the use of various contexts in the problems. However, despite the training provided, it can be said that the contexts in the posed problems are not as effective and qualified as the problems in the PISA study. This can be attributed to that the given training is within a certain period and the participants do not have sufficient knowledge and experience about the context in which they are used. We should provide experience and training to teachers and pre-service teachers in developing different contextual problems. In mathematics teaching and method courses, pre-service teachers can be given theoretical and practical information about contextual learning and context types in which mathematics is used. Activities, such as in-service training, seminars, workshops, are provided to the in-service mathematics teachers about contextual learning.
The problems posed by the participants were found to be more in change-relationships and space-shape concerning mathematical content, but less in the uncertainty-data and quantity content. Teachers posed problems in the most space-figure content, at least in the uncertainty-data content. Pre-service teachers posed more problems in the content of change-relationships, at least in quantity content. It can be said that participants have difficulty in developing problems in uncertainty-data and quantity content. The difficulties of the participants may also arise from the nature of some mathematical concepts. Participants seem to feel more comfortable with developing problems in change-relationships and space-shape content. Sahin and Basgul (2018) showed that the results of this research conducted with pre-service mathematics teachers and the results of this research differ according to the content dimension of the problems. Also, quantity and uncertainty-data contents were more dominant in the problems posed by pre-service mathematics teachers (Sahin & Basgul, 2018). The different results in the studies may be the results of different sample groups and training for ML. A mathematically literate individual can predict, interpret, solve daily life problems, reason in numerical, graphical and geometric situations, and communicate using mathematics (Ojose, 2011). In this context, the interpretation and creation of information with mathematical content in ML should be among the qualifications aimed to be developed in mathematics teaching. In addition, competencies should be aimed to interpret and represent words, forms, symbols, numbers and materials, and mathematical explanations, processes and results (Alsina, 2015; cited in Diaz, 2017). Teachers should integrate their content and/or skills to solve problems and use basic mathematical content for ML (Machaba, 2018). In this study, participants were found to pose more comfortable and effective problems in some mathematics content after ML education. However, in mathematical content, such as uncertainty-data and quantity, fewer and less effective problems posed. This may be due to the beliefs and perceptions of the participants towards ML. It can also be based
Kemal OZGENEurasian Journal of Educational Research 84 (2019) 177-212
203
on reasons, such as the difficulty and refusal of the participants to experience mathematical content. Mathematics teachers need to develop their skills in problem-posing for ML in different mathematical contents. Mathematics teachers can keep up-to-date and improve their mathematical content knowledge with the help of current journals, books and other related publications.
The problems posed by the participants in this study were higher than the average scores of the skills of employing concerning mathematical processes rather than formulating and interpreting. Mathematics teachers and pre-service teachers have been determined to have a similar situation. Participants seem to have limitations or difficulties in establishing situations involving formulating and interpreting process skills at developing problems. This result may have been influenced by the approach and understanding of problem-based learning and the teaching process in mathematics education. In the related literature, it was found that the problems developed by pre-service mathematics teachers had more productive skills and associative, especially reflective skills, were very low (Sahin & Basgul, 2018). This result can be seen as a direct reflection of the participants' beliefs about mathematics education because they perceive mathematics as more dominant in the operational dimension.
There were limitations and difficulties in the studies conducted with teachers and pre-service teachers within the scope of ML. In the study conducted by Kabael and Barak (2016), the development of ML of secondary school pre-service mathematics teachers was examined through some PISA questions. Participants were found to be at a disadvantage in mathematization, especially in creating relationships between variables in the problem and in graphical interpretation, while ML was not at the expected level. Lestari et al. (2017) found that many high school mathematics teachers did not have enough knowledge of what ML was and that the exercises included in books for specific topics were in the form of procedural solutions. In addition, many teachers had pessimistic considerations in integrating ML into learning-teaching mathematics. Gurbuz (2014) stated that pre-service teachers were more successful in classifying PISA questions than writing. Moreover, in the study, most of the pre-service teachers reported that they were not aware of the concepts of PISA and ML before teaching. Based on these and similar studies, it is understood that teachers and pre-service teachers have various difficulties concerning theoretical knowledge and application dimensions for ML.
In many countries, the aim of mathematics education is to improve the mathematical competencies of students beyond the operational and conceptual knowledge. Students need to engage in a wide variety of activities, such as reasoning, communicating, connecting, modelling and problem-solving. Teachers should be able to identify their competence needs in activities they want to use in teaching or measuring in mathematical activities (Pettersen & Nortvedt, 2018). In this context, the targeted process skills must be reflected in an effective approach to the problem activities used for the development or measurement of ML. For example, Brown and Schafer (2006) adopted the modeling approaches used as ML tools in their work: formulating, analyzing the model in answering mathematical questions, interpreting

204 Kemal OZGENEurasian Journal of Educational Research 84 (2019) 177-212
and validating mathematical results concerning context, and reinforcing modeling approach. It was determined that there was a statistically significant difference in the comparison of the mathematical process scores of teachers and pre-service teachers in this research in favor of teachers in the formulation and total scores. It was found that the teachers had higher scores than the pre-service teachers in the total score of process skills. This can be interpreted as that the teachers are one step ahead of the pre-service teachers in reflecting the process skills with problem posing. Although the same ML course is taken, it can be said that this result is due to the richer life experiences of the teachers concerning knowledge, skills and experience than the pre-service teachers.
Ozgen and Kutluca (2013) examined the views of primary school pre-service mathematics teachers on the definition, importance and development of ML. Pre-service teachers had also identified a traditional literacy approach to the definition of ML. Some studies found that pre-service mathematics teachers had limited and incomplete knowledge of the concept of ML (Sefik & Dost, 2016; Yenilmez & Ata, 2013). In the study conducted by Genc and Erbas (2017), high school mathematics teachers stated that the necessity of mathematics education program emphasizing mathematical literacy, content categories, aimed to learn objectives should be defined more clearly. Moreover, in the study conducted by Altun and Akkaya (2014), teachers expressed the reasons for poor achievement in PISA mathematics examinations as a teaching system, examinations, program, teacher and physical environment. Steps should be taken to eliminate these reasons with mathematics educators.
The participants in this study had positive reflections on the problem-posing for ML after the course even though they did not have knowledge, skills and experiences for ML and problem-posing before the ML course. In their study, Sahin and Basgul (2018) stated that most of the problems posed by pre-service mathematics teachers after the training for ML were appropriate to the nature of the PISA study. In this respect, it can be said that the courses or training given to mathematics teachers and pre-service teachers improve their problem-posing skills positively. It can be said that it is especially difficult to develop ML activities based on mathematical problem-solving. Stacey (2005) argued that the important goal of mathematical problem-solving teaching was to understand the problem-solving processes of students, to design excellent tasks and to effective classroom practices. In this context, mathematics teachers' problem-posing activities for ML and using these problems in their classrooms can be seen as an important goal for mathematics education.
Recommendations
It can be said that the teachers in this study are one step ahead of that they are more successful than the pre-service teachers in posing ML problems. In related studies, it was known that teacher and pre-service teachers had various difficulties or limitations towards ML. Teachers and pre-service teachers' knowledge, skills and experiences for ML should be provided effectively and adequately. Targeted development can be achieved in training, courses, publications, projects, research and effective learning tools and materials for teachers and pre-service teachers. ML should be seen as a general framework or umbrella in mathematics education. With this approach,
Kemal OZGENEurasian Journal of Educational Research 84 (2019) 177-212
205
increasing awareness about ML will highly likely to facilitate the targeted development more easily.
It was understood that there was a need for theoretical and practical training that demonstrate the application of ML in different problem types. Challenges to pose unstructured problems for ML should be removed. The situations and content of mathematics used in ML problems should be made more effective and diversified. The importance of teachers’ skills to design different contextual problems should be emphasized. Difficulties in reflecting mathematical processes to ML problems should be eliminated. The importance, necessity and benefits of the ML course have been revealed once again with the results of this study. There were positive reflections on the relationship between ML and the mathematical problem and problem-solving.
This research has limitations in some aspects, such as the lack of pre-assessment, interviews, and reflective thinking writings. In addition, the number of participants in this study and the number of problems posed by the participants can be seen as a limitation. Considering these limitations, more comprehensive studies can be conducted in future studies.
References
Altun, M., & Akkaya, R. (2014). Mathematics teachers’ comments on PISA math questions and our country’s students’ low achievement levels. Hacettepe University Journal of Education, 29(1), 19-34.
Altun, M., & Bozkurt, I. (2017). A new classification proposal for mathematical literacy problems. Education and Science, 42(190), 171-188.
Bennison, A. (2015). Developing an analytic lens for investigating identity as an embedder of numeracy. Mathematics Education Research Journal, 27(1), 1–19.
Brown, B., & Schäfer, M. (2006). Teacher education for mathematical literacy: A modelling approach. Pythagoras, 64, 45-51.
Cai, J. (1998). An investigation of US and Chinese students' mathematical problem posing and problem solving. Mathematics Education Research Journal, 10(1), 37-50.
Colwell, J., & Enderson, M.C. (2016). When I hear literacy: Using pre-service teachers’ perceptions of mathematical literacy to inform program changes in teacher education. Teaching and Teacher Education, 53, 63–74.
De Lange, J. (1987). Mathematics, insight, and meaning: Teaching, learning, and testing of mathematics for the life and social sciences. Unpublished doctoral dissertation, Rijksuniversiteit Utrecht, The Netherlands.
De Lange, J. (2001). Mathematics for literacy. Paper Presented at the 2001 National Forum on Qualitative Literacy, National Academy of Sciences. Washington D.C. Retrieved 18 February, 2018 from
206 Kemal OZGENEurasian Journal of Educational Research 84 (2019) 177-212
https://pdfs.semanticscholar.org/987f/4158fbe08bab5a0cc68cd51849f8bd05a612.pdf.
De Lange, J. (2003). Mathematics for literacy. In B. Madison & L. Steen (Eds.), Quantitative literacy: Why numeracy matters for schools and colleges (pp. 75–89). New Jersey: The National Council on Education and the Disciplines.
Diaz, L. D. E. (2017). The teaching and learning process of mathematics in the primary education stage: A constructivist proposal within the framework of key competences. IEJME - Mathematics Education, 12(7), 709-713.
English, L. D. (1997). The development of fifth-grade children’s problem-posing abilities. Educational Studies in Mathematics, 34(3), 183-217.
English, L., & Sriraman, B. (2010). Problem solving for the 21st century. In Sriraman B., English L. (Eds.) Theories of mathematics education (pp. 263-290). Berlin: Springer.
Evans, D. (2017). Examining the literacy within numeracy to provide access to the curriculum for all. International Perspectives on Inclusive Education, 11, 35-51.
Genc, M., & Erbas, A.K. (2017). Lise matematik ogretmenlerinin matematik okuryazarligi baglaminda matematik ogretim programina iliskin gorusleri [High school mathematics teachers' views on the mathematics curriculum in the context of mathematics literacy]. Turkish Computer and Mathematics Education Symposium - 3, 17-19 May 2017, Afyon, pp. 547-551.
Gonzales, N. A. (1998). A blueprint for problem posing. School Science and Mathematics, 98(8), 448-456.
Gurbuz, M.Ç. (2014). PISA matematik okuryazarlik ogretiminin PISA sorusu yazma ve matematik okuryazarlik duzeyleri uzerine etkisi [The effect of PISA mathematical literacy teaching on writing PISA questions and mathematical literacy]. (Unpublished Master's Thesis). Uludag University, Institute of Educational Sciences, Bursa.
Iskenderoglu, T.A., & Baki, A. (2011). Ilkogretim 8. sinif matematik ders kitabindaki sorularin PISA matematik yeterlik duzeylerine gore siniflandirilmasi [Classification of the questions in an 8th grade mathematics textbook with respect to the competency levels of PISA]. Education and Science, 36(161), 287-301.
Iskenderoglu, T.A., Erkan, I., & Serbest, A. (2013). 2008-2013 Yillari arasindaki SBS matematik sorularinin PISA matematik yeterlik duzeylerine göre siniflandirilmasi [Classification of SBS mathematics questions between 2008-2013 years with respect to PISA competency levels]. Turkish Journal of Computer and Mathematics Education, 4(2), 147-168.
Kabael, T., & Barak, B. (2016). Ortaokul matematik ogretmeni adaylarinin matematik okuryazarlik becerilerinin PISA sorulari uzerinden incelenmesi [Research of middle school pre-service mathematics teachers’ mathematical literacy on PISA items]. Turkish Journal of Computer and Mathematics Education, 7(2), 321-349.
Kemal OZGENEurasian Journal of Educational Research 84 (2019) 177-212
207
Kilpatrick, J. (2001). Understanding mathematical literacy: The contribution of
research. Educational Studies in Mathematics, 47(1), 101–116.
Kilpatrick, J. (1987). Problem formulating: Where do good problems come from? In A. H. Schoenfeld (Ed.), Cognitive science and mathematics education (pp. 123-147). New Jersey, Lawrence Erlbaum Associates, Inc.
Lailiyah, S. (2017). Mathematical literacy skills of students’ in term of gender differences. The 4th International Conference on Research, Implementation, and Education of Mathematics and Science (4th ICRIEMS), doi: 10.1063/1.4995146.
Lestari, N.D.S., Juniati, D., & Suwarsono, S. (2017). Preliminary study: Mathematics’ teacher conception in supporting the ıntegration of mathematics’ literacy and mathematics teaching and learning. International Conference on Mathematics: Education, Theory, and Application (ICMETA), Proceeding ICMETA: Vol. 1/2017, June 27th 2017, pp.76-83.
Lowrie, T. (2002). Designing a framework for problem posing: Young children generating open-ended tasks. Contemporary Issues in Early Childhood, 3(3), 354-364.
Machaba, F.M. (2018). Pedagogical demands in mathematics and mathematical literacy: A case of mathematics and mathematical literacy teachers and facilitators. EURASIA Journal of Mathematics, Science and Technology Education, 14(1), 95-108.
Malasari, P.N., Herman, T., & Jupri, A. (2017). The construction of mathematical literacy problems for geometry. International Conference on Mathematics and Science Education (ICMScE), pp.1-7. doi :10.1088/1742-6596/895/1/012071
Matteson, S. M. (2006). Mathematical literacy and standardized mathematical assessments. Reading Psychology, 27(2), 205-233.
McMillen, S. E., del Prado Hill, P.; & Friedland, E. S. (2010). Literacy strategies in mathematics instruction: A look at New York State classrooms. New York State Mathematics Teachers Journal, 60(3), 101–110.
Memnun, D.S., Akkaya, R., & Hacıomeroglu, G. (2012). The effect of prospective teachers’ problem solving beliefs on self-efficacy beliefs about mathematical literacy. Journal of College Teaching & Learning, 9(4), 289- 298.
Ministry of National Education [MoNE]. (2012). PISA Türkiye [PISA Turkey]. Ankara: EARGED Yayinlari.
Ministry of National Education [MoNE]. (2016). Uluslararasi ogrenci degerlendirme programi - PISA 2015 ulusal raporu [International student assessment program. PISA 2015 national report]. Ankara: EARGED Yayinlari.
Ministry of National Education [MoNE]. (2017). Mathematics curriculum and guidance (grades 9-12). Ankara: Author.
National Council of Teachers of Mathematics [NCTM]. (2000). Principles and standards for school mathematics. Reston, VA: Author.
208 Kemal OZGENEurasian Journal of Educational Research 84 (2019) 177-212
Ojose, B. (2011). Mathematics literacy: Are we able to put the mathematics we learn
into everyday use? Journal of Mathematics Education, 4(1), 89-100.
Organization for Economic Co-operation and Development (OECD). (2000). Measuring student knowledge and skills: The PISA 2000 assessment of reading, mathematical and scientific literacy. Paris: PISA, OECD Publishing. Doi:10.1787/9789264181564-en.
Organization for Economic Co-Operation and Development [OECD]. (2003). The PISA 2003 assessment framework – mathematics, reading, science and problem solving knowledge and skills. Paris: Author.
Organization for Economic Co-Operation and Development [OECD]. (2013). PISA 2012 assessment and analytical framework: Mathematics, reading, science, problem solving and financial literacy. Paris: OECD Publishing. Doi: 10.1787/9789264190511-en.
Ozgen, K., & Bindak, R. (2008). Matematik okuryazarligi oz-yeterlik olceginin gelistirilmesi [The development of self-efficacy scale for mathematics literacy]. Kastamonu Education Journal, 16(2), 517-528.
Ozgen, K., & Kutluca, T. (2013). Ilkogretim matematik ogretmen adaylarinin matematik okuryazarligina yonelik goruslerinin incelenmesi [An investigation of primary mathematics pre-service teachers’ views towards mathematical literacy]. Dicle University Social Sciences Institute Journal, 5(10), 1-21.
Ozgen, K. (2015). Ilkogretim matematik ogretmen adaylarinin matematik okuryazarligina yonelik oz yeterlik inancları [Primary prospective mathematics teachers’ self-efficacy beliefs towards mathematical literacy]. Electronic Journal of Education Sciences, 4(7), 1-12.
Ozgen, K., Ozer, Y., & Arslan, E. (2019). Ogretmenlerin matematik okuryazarligi ve problem kurma oz yeterlik inançlarinin incelenmesi [Investigation of teachers’ mathematical literacy and problem posing self-efficacy beliefs]. Journal of Kırsehir Education Faculty, 20(1), 33-51.
Pettersen, A., & Nortvedt, G.A. (2018). Identifying competency demands in mathematical tasks: Recognizing what matters. International Journal of Science and Mathematics Education, 16(5), 949-965.
Pilten, P., Divrik, R., Pilten, G., & Ebret, A. (2017). Sınıf ogretmeni adaylarinin matematiksel okuryazarlik kavramina iliskin metaforik algilari [Prospective primary teachers' metaphorical perceptions about the concept of mathematical literacy]. Trakya University Journal of Education, Special Issue, 47-67.
Pugalee, D. K. (1999). Constructing a model of mathematical literacy. The Clearing House, 73(1), 19-22.
Saenz, C. (2009). The role of contextual, conceptual and procedural knowledge in activating mathematical competencies (PISA). Educational Studies in Mathematics, 71(2), 123–143
Kemal OZGENEurasian Journal of Educational Research 84 (2019) 177-212
209
Salgado, F.A. (2016). Developing a theoretical framework for classifying levels of
context use for mathematical problems. In White, B., Chinnappan, M. & Trenholm, S. (Eds.). Opening up mathematics education research (Proceedings of the 39th annual conference of the Mathematics Education Research Group of Australasia), pp. 110–117. Adelaide: MERGA.
Silver, E. A. (1987). Foundations of cognitive theory and research for mathematics problem- solving instruction. In Cognitive Science and Mathematics Education (Ed. Schoenfeld H. A.). New Jersey: Routledge.
Silver, E. A., & Cai, J. (1996). An analysis of arithmetic problem posing by middle school. Journal for Research in Mathematics Education, 27(5), 521-539.
Stacey, K. (2005). The place of problem solving in contemporary mathematics curriculum documents. Journal of Mathematical Behavior, 24(3-4), 341-350.
Stacey, K. (2010). Mathematical and scientific literacy around the world. Journal of Science and Mathematics Education in Southeast Asia, 33(1), 1-16.
Stacey, K. (2015). The real world and the mathematical world. In K. Stacey & R. Turner (Eds.), Assessing mathematical literacy: The PISA experience (pp. 57-84). Cham, Switzerland: Springer International Publishing.
Stoyanova, E., & Ellerton, N. F. (1996). A framework for research into students’ problem posing in school mathematics. In P. Clarkson (Ed.), Technology in mathematics education (pp.518–525), Melbourne: Mathematics Education Research Group of Australasia.
Steen, L.A. (1990). On the shoulders of giants. New approaches to numeracy. Washington, DC: National Academy Press.
Steen, L.A. (2001). Mathematics and democracy: The case for quantitative literacy. Princeton, NJ: National Council on Education and the Disciplines.
Sumen, O.O., & Calisici, H. (2016). The relationships between teachers’ mathematical literacy self-efficacy beliefs, metacognitive awareness and problem solving skills. Participatory Educational Research, Special Issue 2016-II, 11-19.
Sahin, O., & Basgul, M. (2018). Matematik ogretmeni adaylarinin PISA problemi kurma becerilerinin incelenmesi [Investigation of PISA problem posing skills of mathematics teacher candidates]. International Journal of Field Education, 4(2), 128-148.
Sefik, O., & Dost, Ş. (2016). Ortaogretim matematik ogretmen adaylarinin matematik okuryazarligi hakkındaki gorusleri [Secondary preservice mathematics teachers' views on mathematical literacy]. Necatibey Faculty of Education Electronic Journal of Science and Mathematics Education, 10(2), 320-338.
Tekin, B., & Tekin, S. (2004). Matematik ogretmen adaylarinin matematiksel okuryazarlik duzeyleri uzerine bir arastirma [A research on mathematical literacy levels of preservice mathematics teachers]. MATDER, Retrieved 18 February, 2018 from http://www.matder.org.tr/Default.asp?id=85.
210 Kemal OZGENEurasian Journal of Educational Research 84 (2019) 177-212
Ulusoy, F., & Kepceoglu, İ. (2018). The contextual and cognitive structure of
prospective middle school mathematics teachers' problems in semi-structured problem-posing context. Journal of Kırsehir Education Faculty, 19(3), 1937-1963.
Unlu, M., & Sarpkaya-Aktas, G. (2017). Ortaokul matematik ogretmeni adaylarinin cebirsel ifade ve denklemlere yonelik kurduklari problemlerin incelenmesi. [Examination of pre-service elementary mathematics teachers’ problems posed about algebraic expressions and equations]. Turkish Journal of Computer and Mathematics Education, 8(1), 161-187.
Yenilmez, K., & Ata, A. (2013). Matematik okuryazarligi dersinin ogretmen adaylarinin matematik okuryazarligi ozyeterligine etkisi [Effects of mathematical literacy course on pre-service mathematics teachers’ self-efficacy levels of mathematical literacy]. The Journal of Academic Social Science Studies, 6(2), 1803-1816.
Yildirim, A., & Simsek, H. (2005). Sosyal bilimlerde nitel arastirma yontemleri [Qualitative research methods in the social sciences]. Ankara: Seckin Yayincilik.
Yin, R. (2003). Case study research: Design and methods. Thousand Oaks, California: Sage Publication.
Matematik Okuryazarlığına Yönelik Problem Kurma Becerileri: Öğretmen ve Öğretmen Adayları Örneği
Atıf:
Ozgen, K. (2019). Problem posing skills for mathematical literacy: The sample of teachers and pre-service. Eurasian Journal of Educational Sciences, 84, 179-212, DOI: 10.14689/ejer.2019.84.9
Özet
Problem Durumu: Okullarda verilen matematik eğitiminin en önemli amaçlarından biri de öğrencilerin matematik okuryazarlığı becerilerini geliştirmektir. Bu çalışmada, öğrencilerin matematik okuryazarlığı becerilerini geliştirmede önemli faktörlerden birisi olan öğretmen faktörü üzerinde durulacaktır. Bu bağlamda, matematik öğretmen ve öğretmeni adaylarının matematik okuryazarlığına yönelik bilgi, beceri, deneyim ve pedagojik yaklaşımlara sahip olması gerekir. Bunun için meslekteki öğretmenler ve yetiştirilen öğretmen adaylarının matematik okuryazarlığına yönelik problem etkinlikleri tasarlamaları ve sınıflarında uygulamaları beklenmektedir. Bu çalışmada, Matematik Okuryazarlığı eğitimi (lisans ve lisansüstü düzeyde dersi almış olmak) almış olan matematik öğretmen ve öğretmeni adaylarının matematik okuryazarlığına yönelik problem etkinliği tasarlama becerileri üzerinde odaklanılacaktır.
Kemal OZGENEurasian Journal of Educational Research 84 (2019) 177-212
211
Araştırmanın Amacı: Bu araştırmanın amacı, matematik öğretmeni ve öğretmen adaylarının matematik okuryazarlığına yönelik problem geliştirme becerilerini incelemektir. Araştırmada öğretmen ve öğretmen adaylarının matematik okuryazarlığına yönelik geliştirdikleri problemlerin türü, zorluk düzeyi, matematiğin kullanıldığı durumlar (bağlam), matematiksel içerik, konular ve süreçler açısından incelenecektir. Ayrıca öğretmen ve öğretmen adaylarının matematik okuryazarlığına yönelik geliştirdikleri problemlerin belirlenen kriterler açısından karşılaştırılması yapılacaktır.
Araştırmanın Yöntemi: Bu araştırma, özel durum çalışması modeli ile gerçekleştirilmiştir. Araştırmanın çalışma grubu, lisans ve lisansüstü eğitimde matematik okuryazarlığı dersini alan 13 matematik öğretmeni adayı ve 5 ortaokul matematik öğretmeninden oluşmaktadır. Katılımcıların belirlenmesinde matematik okuryazarlığı dersini almış olmaları kriter olarak seçildiğinden amaçlı örnekleme yöntemine başvurulmuştur. Çalışmada katılımcılar ders sürecinden sonra bireysel olarak problem geliştirme sürecinde bulunmuşlardır. Matematik okuryazarlığı dersi kapsamında öncelikle kuramsal bilgiler verilmiş ve daha sonra onlardan sınıf içi ve dışında çeşitli uygulamalar yapmaları istenmiştir. Matematik okuryazarlığına yönelik somut örnek problemler araştırmacı tarafından gösterilmiştir ve katılımcılar tarafından da çeşitli uygulamalar yapılmıştır. PISA çalışmalarında geçmiş yıllarda çıkmış örnek problemler incelenmiştir. Bu ders sonunda beklenti öğretmen ve öğretmen adaylarının matematik okuryazarlığına yönelik bilgi, beceri ve deneyimlerinin gelişmiş olması yönündedir. Bu bağlamda etkili problemler geliştirme becerilerinin gelişmiş olması beklenen bir durumdur. Bu kapsamda katılımcılardan matematik okuryazarlığını ölçmeye yönelik üç adet problem geliştirmeleri istenmiştir. Öğretmen ve öğretmen adaylarının geliştirdikleri problemlerde herhangi bir matematiksel kavram ya da konu kısıtlamasına gidilmemiştir. Bu bağlamda matematik okuryazarlığına yönelik matematiksel problem durumları tasarlamaları sorgulanmıştır. Katılımcıların geliştirdikleri problemler betimsel analiz yöntemi ile incelenmiştir. Veri analizinde PISA çalışmasında geçen kuramsal temeller çerçeve olarak kabul edilmiştir. Buna göre geliştirilen problemler; tür, zorluk düzeyi, bağlam, matematiksel süreç ve içerik açısından ele alınmıştır.
Araştırmanın Bulguları: Elde edilen verilerin analizinde geliştirilen problemlerin tür açısından genelde açık-uçlu problemler olduğu görülmüştür. Matematik okuryazarlığı kapsamında yapılan öğretim ya da ölçmelerde geliştirilen problemlerin açık-uçlu yapıda olması hedeflerin bir bakıma kolaylaştırıcı belirteçlerden biri olduğu söylenebilir. Problemler zorluk düzeyi açısından ise genelde 4. düzeyde yoğunlaştığı görülmüştür. En üst düzey olan 6. ve 5. düzeylerinde ise hem öğretmen hem de öğretmen adayları tarafından sınırlı sayıda problem geliştirilmiştir. Ancak öğretmenler zorluk düzeyi açısından zor problemler geliştirmede bir adım daha önde oldukları söylenebilir. Matematik okuryazarlığına yönelik daha çok yapılandırılmış problemler geliştirildiği görülmüştür. Aksine yapılandırılmamış problemlere de ihtiyaç duyulduğu bilinmektedir. Matematiğin kullanıldığı durumlara göre ise mesleki ve kişisel soruların daha baskın olduğu belirlenmiştir. Bilimsel ve toplumsal bağlamları içeren problemler ise sayıca daha az olduğu görülmüştür. Bu durum
212 Kemal OZGENEurasian Journal of Educational Research 84 (2019) 177-212
matematik öğretmeni ve öğretmen adaylarında farklılaştığı söylenebilir. Katılımcıların almış oldukları matematik okuryazarlığı dersinin etkilerinden bu bağlamların ortaya çıktığı söylenebilir. Ayrıca bilimsel ve toplumsal bağlamlarda problem geliştirebilmenin güçlüklerini yaşadıkları söylenebilir. Katılımcılar tarafından geliştirilen problemler matematiksel içerik açısından değişim-ilişkiler ile uzay-şekil alanlarında daha fazla iken belirsizlik-veri ve nicelik alanlarında sayıca daha az olduğu görülmüştür. Öğretmenler en fazla uzay-şekil alanında en az ise belirsizlik-veri alanında problem geliştirmişlerdir. Öğretmen adayları ise en fazla değişim-ilişkiler alanında en az ise çokluk alanında problem geliştirmişlerdir. Katılımcıların belirsizlik-veri ve çokluk alanlarında problem geliştirmede güçlükleri olduğu söylenebilir. Değişim-ilişkiler ve uzay-şekil alanlarında problem geliştirmede kendilerini daha rahat hissettikleri görülmektedir. Matematiksel süreçler açısından işe koşma (yürütme) becerilerinin puan ortalamasının formülleştirme ve yorumlamadan daha yüksek olduğu bulunmuştur. Ayrıca öğretmen ve öğretmen adaylarının matematiksel süreç puanlarının karşılaştırılmasında formülleştirme ve toplam puanlarda öğretmenlerin lehine istatistiksel olarak anlamlı farklılık olduğu belirlenmiştir. Öğretmenlerin matematik okuryazarlığına yönelik problem geliştirmede öğretmen adaylarına göre daha başarılı oldukları söylenebilir. Katılımcıların problem geliştirmede formülleştirme ve yorumlama süreç becerilerini içeren durumları ortaya koymada sınırlılıklarının ya da güçlüklerinin olduğu görülmektedir. Bu durum probleme, problem odaklı öğrenme-öğretme sürecine ve matematik eğitimine yönelik yaklaşım ve kavrayışlarından etkilenmiş olabilir.
Araştırmanın Sonuçları ve Önerileri: Öğretmenlerin matematik okuryazarlığına yönelik problem geliştirmede öğretmen adaylarına göre daha başarılı oldukları yani bir adım daha önde oldukları söylenebilir. Matematik okuryazarlığı dersinin hem öğretmen hem de öğretmen adaylarında da ürün boyutu açısından olumlu sonuçlar verdiği görülmüştür. Bunlar matematik okuryazarlığına yönelik bilgi, beceri, deneyim ve en önemlisi farkındalık olduğu anlaşılmaktadır. Matematik okuryazarlığının farklı problem türlerinde uygulamalarını gösteren teorik ve uygulamalı eğitime ihtiyaç duyulduğu anlaşılmaktadır. Matematik okuryazarlığına yönelik yapılandırılmamış problem geliştirmeye yönelik güçlükler ortadan kaldırılmalıdır. Matematik okuryazarlığı problemlerinde matematiğin kullanıldığı durumların ve içeriğin çeşitliliği ve niteliği daha etkin hale getirilmelidir. Matematik okuryazarlığı problemlerine matematiksel süreçleri yansıtmadaki güçlükler giderilmelidir. Matematik okuryazarlığı dersinin önemi, gerekliliği ve faydaları bu çalışmanın sonuçları ile bir kez daha ortaya çıkmıştır. Matematik okuryazarlığının matematiksel problem ve problem çözme ile olan ilişkisine yönelik olumlu yansımalar ortaya çıkmıştır. Eğitim fakültesinde yetiştirilen öğretmen adaylarına ve okullarda görevde bulunan öğretmenlere matematik okuryazarlığına yönelik kapsamlı ve etkili eğitim verilmesinin faydaları, gereği ve önemi de ortaya çıkmıştır.
Anahtar Sözcükler: Matematik okuryazarlığı, Öğretmen, Öğretmen adayları, Problem Kurma.
Euras ian Journal of Educational Research 84 (2019) 213-236 Eurasian Journal of Educational Research
www.ejer.com.tr
The Impacts of a University’s Organizational Reputation and Organizational Attraction on Students’ Intention to Pursue
Soner POLAT1, Gizem GUNCAVDI2, Yaser ARSLAN3
A R T I C L E I N F O A B S T R A C T
Article History: Purpose: This study aims to identify the impacts of a
university’s organizational reputation and
organizational attraction on international students’ intention to pursue post-graduate education in the university they study their bachelor’s degree. Research Methods: This study is in the model of
descriptive quantitative research method. The sample of this study included 231 students from 67 countries who enrolled in Kocaeli University in the 2015-2016 academic year. The data were gathered using a
questionnaire that included the scale of intention to pursue and the scale of organizational attraction developed by Highhouse et al. (2003); and the scale of
Received: 26 Dec. 2018 Received in revised form: 24 Aug. 2019 Accepted: 11 Oct. 2019 DOI: 10.14689/ejer.2019.84.10
Keywords
university reputation, organizational attraction, intention to pursue, international students
organizational reputation developed by Alessandri, Yang and Kinsey (2006). Findings: The findings revealed that there were positive relationships between perceptions of
international students towards the organizational reputation of the university, intention to pursue university and organizational attraction. Their perception of organizational reputation of university seemed to affect perceptions of intention to pursue university and organizational
attraction directly. Also, the results showed that organizational attraction mediated the relationship between the organizational reputation and intention to pursue. Implications for Research and Practice: The results show that the organizational reputation of
university affects international students’ intention to pursue post-graduate e education, and organizational attraction is a mediating variable. Thus, university administrators are suggested to be sensitive to increase the university’s organizational reputation to increase the perceptions towards attraction. In addition, other researchers can conduct this study with international
students at other universities to reach a more comprehensive result.
© 2019 Ani Publishing Ltd. All rights reserved
1 Kocaeli University, Faculty of Education, Department of Educational Sciences,
[email protected] , TURKEY, ORCID: 0000-0003-2407-6491 2 Kocaeli University, Faculty of Education, Department of Educational Sciences, [email protected] , TURKEY, ORCID: 0000-0002-7340-145X 3 Kocaeli University, Faculty of Education, Department of Educational Sciences, [email protected], TURKEY, ORCID: 000-0001-6625-6066
214 Soner POLAT - Gizem GUNCAVDI - Yaser ARSLAN Eurasian Journal of Educational Research 84 (2019) 213-236
Introduction
For organizations, it is vitally important to impress applicants who have many
desired qualities and performance to maintain organizational success (Jiang & Iles,
2011). In today’s competitive conditions, an organization’s ability to survive depends on attracting highly qualified applicants, motivating them and making them
continue working for the organization. Thus, organizations should attract qualified
individuals among target groups and try to keep them. Through the process of doing this, organizational reputation and attraction are important factors. Thus, this study
aims to define the impacts of organizational reputation and organizational attraction
on students’ intention to pursue university.
Intention to Pursue
The concept of intention to pursue or job pursuit intentions has become to be
studied frequently in recent years in the field of business. The intention to pursue a
job can be identified as “a person’s desire to submit an application, to attend a site visit or second interview, a willingness to stay in the applicant pool without
committing to a job choice” (Chapman et al., 2005, p. 929). In other words, the intention to pursue focuses on applicants’ behavioural intentions and their interest in
the organization (Dural, Aslan, Alince & Araza, 2014). The studies have shown that
there are some factors that affect an individual’s intention to pursue a job (Casper & Buffardi, 2004; Chapman et al., 2005; Rynes, Bretz & Gerhart, 1991). Type of work,
the organizations’ image, the organizations’ familiarity to the applicant, the
recruiter’s sincerity, person-organization fit, dependent care assistance, such as health insurance or childcare facilities, work schedule flexibility, and salary , which
are some of the factors that affect job pursuit intentions of employees (Casper &
Buffardi, 2004; Chapman et al., 2005). Thus, it is possible to say that the factors that affect job pursuit intentions are related to the organizational and personal needs of
employees.
The concept of intention to pursue has often been studied in business; however, it is also a concept which has been studied in educational organizations (To, Lai, Lung
& Lai, 2014; To, Lung, Lai & Lai, 2014; Veloutsu, Lewis & Paton, 2004). Researchers
conducted studies mostly about the factors that affected students’ choice to pursue postgraduate education at a university (Lawley & Blight, 1997; Mazzarol & Soutar,
2002; To, Lai, Lung & Lai, 2014; Veloutsu, Lewis & Paton, 2004). The studies have put
forward that university reputation, program reputation, program qualification, administrative aspects, characteristics of the country or the city where the university
is located, environment, information availability, and their career plan are some of
the factors that affect students’ choice about where to pursue postgraduate education (Mazzarol & Soutar, 2002; To, Lai, Lung & Lai, 2014). In addition to these, a study on
factors affecting international students’ choices postgraduate education conducted by
Kaur and Sidhu (2009) put forward that one of the reasons which affect international students’ intention to pursue postgraduate education is having took an
undergraduate degree in the same university. Thus, it can be suggested that
Soner POLAT - Gizem GUNCAVDI - Yaser ARSLAN Eurasian Journal of Educational Research 84 (2019) 213-236
215
understanding whether international students would like to continue postgraduate education in the same university they took undergraduate education or not, which is
the aim of this study, will contribute to the literature.
Organizational Reputation
There are different explanations about organizational reputation in the literature. Fombrun and Van Riel (2003) defined this concept as different partners’ judgments
about the organization’s potential in terms of accomplishing its expectations.
Bromley’s (1993, 2000, 2002) definition of organizational reputation was that it is a system and this is made up of personal assumptions that belong to members of a
social group. The organizational reputation can also be described as shared beliefs
about an organization’s identity and prominence (Rao, 1994; Rindova & Kotha, 2001), an organization’s visibility and popularity on media (Deephouse, 2000), and mutual
understanding about an organization in the minds of different communities (Grunig
& Hung, 2002; Yang & Grunig, 2005). To sum up, the concept of organizational reputation refers to the impressions of an organization that members of a social
group have, concerning the organization’s potential to accomplish its expectations,
visibility and popularity on media, and the organization’s identity.
University Reputation
The concept of organizational reputation is generally studied in business;
however, this concept can also be studied in educational organizations and universities are one of them. A university’s reputation has been defined as aspects of
a university’s collective representations over time, and these aspects can be both
internal and external ones, such as media (Alessandri, Yang & Kinsey, 2006). Various researchers that studied the concept of a university’s reputation (Bromley, 1993, 2000;
Caruana, 1997; Fombrun & Shanley, 1990; Gotsi & Wilson, 2001; Grunig & Hung,
2002) have claimed that the reputation of a university can be grounded on direct or indirect experiences, and information gained from symbols, such as logos and
architecture, and lastly information gained from different channels of
communication. Thus, it is possible to say that a university’s reputation is mostly connected to the visual identity of the university.
In addition to the factors mentioned above, Ayoubi and Massoud (2012)
highlighted the factors which are entry standards, research opportunities, job opportunities after graduation, staff/student ratio, utilities of library and information
technologies as important variables that affect students’ choice for a university
regarding its reputation. Isik, Cicek and Almali (2016), on the other hand, stated that emotional attraction, ability to manage, being strategic, distinctiveness and social
accountability as some of the main factors that determine a university’s reputation.
Apaydin and Seckin-Kapucu (2017) added the quality of education and social events to the factors that affect a university’s reputation according to students’ views.
216 Soner POLAT - Gizem GUNCAVDI - Yaser ARSLAN Eurasian Journal of Educational Research 84 (2019) 213-236
Organizational Attraction
An organization’s being evaluated as an attractive place to work by its
prospective employees is described with the concept of organizational attraction.
This concept is accepted as an important factor which affects individuals’ choice for their workplace and their decision-making process on whether to apply for a job or
not (Akcay, 2014). The concept of organizational attraction was firstly studied in
terms of the characteristics of the job or of the organization (Ateg, Andersson, & Rosén, 2009; Cable & Graham, 2000; Carless & Wintle, 2007; Lievens et al., 2001;
Rynes & Barber, 1990). Then, the studies about the organizational attraction started
to include individual-organization harmony (Cable & Judge, 1996; Turban & Keon, 1993), organizational image and recognizability (Aiman-Smith et al., 2001; Turban &
Greening, 1997).
As it was mentioned above, the concept of organizational attraction is an important aspect that affects an organization’s prospective employees’ decision–
making process. Lievens and Highhouse (2003) claimed that prospective employees
evaluate an organization concerning its instrumental and symbolic attributes before they apply for a job in that organization. While instrumental attributes include
concrete benefits, such as salary and career opportunities offered by employers,
symbolic attributes consist of inferences about an organization’s being innovator, prestigious and sincere (Akcay, 2014). Lievens and Highhouse (2003) found out that
these instrumental and symbolic attributions are closely related to an organization’s
attraction.
There are many individuals in the organizations’ target group, and there are
many organizations that can satisfy the needs of these individuals. The individuals
make their choices among these organizations. In this process, many different variables affect the organization’s target group’s choices. One of these variables that
affect individuals is the organizational attraction because individuals are thought to
tend to choose organizations that they see as attractive (Turban & Keon, 1993). The organizational attraction is accepted as an important factor that affects individuals’
choices and decision-making processes for deciding whether they interact with the organization or not (Akcay, 2014).
University Attraction
The concept of organizational attraction is a subject to be studied in educational
organizations since this concept is effective for students to choose which university to go to and to pursue their postgraduate education. There are some studies
conducted on university attraction (Drewes & Michael, 2006; Llewellyn-Smith &
McCabe, 2008). Llewellyn-Smith and McCabe (2008) claimed that students choose the university they will attend by looking at the aspects, such as academic reputation,
facilities, campus atmosphere, quality and availability of programs, social activities,
sporting clubs, and accommodation which are close to university campus easily and campus attractiveness (Anderson, 1999; Arambewela & Hall, 2006; Lawley, 1998;
Mazzarol & Soutar, 2002; Price, Matzdorf, Smith & Agahi, 2003; Soutar & Turner,
Soner POLAT - Gizem GUNCAVDI - Yaser ARSLAN Eurasian Journal of Educational Research 84 (2019) 213-236
217
2002; Townsend & Lee, 2004; cited in Llewelyn-Smith et al., 2008). Students also preferred universities with low compulsory fees and high scholarships (Drewes &
Michael, 2006).
In the literature, there have been some studies conducted in Turkey about
universities’ attraction for international students. For example, Kondakci (2011)
conducted a study with international students to understand what attracts them to come to universities in Turkey. The results showed geographical proximity,
academic quality, desire for learning, or experiencing a different culture; liking
Turkish culture and Turkish people were important aspects that affected international students’ decisions. In the light of these results, it can be said that
students from neighbor countries or Turkic republics are more likely to come to
Turkey, which is the case for Kocaeli University where this study was conducted. In addition, Gunduzyeli (2015) found that the reasons lying behind the choice of
international students to choose universities in Turkey are tuition, living conditions,
job opportunities, campus, the university’s prestige and location, students’ information about the university which they received from web sites related to
Turkey, universities’ websites, printed and visual media, and scholarship. The results
of this study put forward that the international students find universities more attractive if tuition is low, job opportunities and university’s prestige are high,
getting a scholarship is easy, and they have an idea about all of these attraction
factors with the help of information they receive through media.
The Relationship among Intention to Pursue, Reputation and Attraction
The relationship among organizational reputation, organizational attraction and
intention to pursue the organization can be explained with “action theory” (Fishbein
& Ajzen, 1975). Logical action theory claims that one of the determinants that define one’s behavioral intention is the ideas of people about an object, organization , or
behavior, and these constitute one’s subjective norm about that object, organization ,
or behavior. Concerning this theory, it would not be wrong to say that organizational reputation and organizational attraction form subjective norms. The organizational
reputation, a concept that defined all stakeholders’ perceptions about an organization’s performance (Fombrun, Gardberg & Sever, 2000), and organizational
attraction define the social reference about an organization. If the reputation and
recognition of an organization come to people’s minds when they hear that organization’s name, that organization can be considered as a prestigious one. Thus,
organizational reputation reflects the consensus of society about an organization’s
qualities’ being approved as positive or negative (Highhouse et al., 2003). This social reference may affect individuals’ attitudes, beliefs, intentions and behaviors about an
organization positively or negatively (Fishbein & Ajzen, 1975). In the light of this,
students’ perception of a university’s reputation and attraction may affect their intention to pursue.
It has been claimed that the perceptions of potential applicants of an organization
about that organization’s instrumental and symbolic features affect their perception about an organization’s attraction. While the concrete benefits that potential
218 Soner POLAT - Gizem GUNCAVDI - Yaser ARSLAN Eurasian Journal of Educational Research 84 (2019) 213-236
organizations can offer to applicants, such as wage and career opportunities, are seen as instrumental features, the personality implications of an organization, such as
being innovator, prestigious, and sincere, are evaluated as symbolic features (Lievens & Highhouse, 2003). As can be seen, one of the factors affecting organizational
attraction is organizational reputation.
It was determined that if a prospective employee evaluated an organization’s organizational reputation positively, her/his intention to apply to that organization
was higher (Turban & Cable, 2003). Organizational reputation increases job
satisfaction, improves organizational citizenship behavior, decreases intention to leave the job and quitting the job; as a result of this, an organization’s productivity
and performance increase (Carmeli & Freund, 2002; Freund, 2006; Herrbach &
Mignonac, 2004; Sabuncuoglu, 1998). Organizational reputation is directly related to satisfying an organization’s stakeholders’ expectations. When their expectations are
not satisfied, the organization’s attraction decreases for stakeholders. Also , the inner
stakeholders of the organization want to leave the organization. All of these conditions result in the organization’s losing its social capital (Fombrun & Gardberg,
2000). It was found out that the number of qualified employees was higher, and these
employees’ rate of leaving the job was lower in the organizations with high level of perception of organizational reputation (Winkleman, 1999) since organizational
reputation has the positive effect of attracting target group to the organization
(Shamma, 2012).
There are many studies that analyze the relationship between organizational
attraction and organizational reputation (Cable & Graham, 2000; Caligiuri et al., 2010;
Turban & Cable, 2003; Williamson, King, Lepak & Sarma, 2010). When it is managed successfully, organizational reputation helps the organizations’ familiarity increase
for the target group and closeness to the organization increases. In this way, the
individuals of the target group prefer organizations with a higher reputation (Brook et al., 2003). Similarly, it was emphasized that familiarity was one of the important
premises of the level of organizational attraction, in the studies about the relationship
between organizational familiarity and attraction (Gatewood, Gowan & Lautenschlager, 1993; Stevens, Dragoni & Collins, 2001; Turban & Greening, 1997;
Turban et al., 2001).
Organizational reputation includes stakeholders’ beliefs about the organizations’ activities in the past and in the future, and it shapes what kind of interaction the
stakeholders will have with the organization (Ponzi, Fombrun & Gardberg, 2011).
Thus, it is believed that organizational reputation will be effective on organizational attraction and intention to pursue. In the light of these, this study aims to identify the
impacts of a university’s organizational reputation and organizational attraction on
international students’ intention to pursue post-graduate education in the university they study their bachelor’s degree. Accordingly, the hypotheses of this study are
formed as below:
Hypothesis 1: A university’s reputation has a significant impact on students’
perception of a university’s attraction.
Soner POLAT - Gizem GUNCAVDI - Yaser ARSLAN Eurasian Journal of Educational Research 84 (2019) 213-236
219
Hypothesis 2: Students’ perception of a university’s reputation has a significant impact on students’ intention to pursue post-graduate education in the university
they study their bachelor’s degree.
Hypothesis 3: Students’ perception of a university’s attraction has a significant
impact on students’ intention to pursue post-graduate education in the university
they study their bachelor’s degree.
Hypothesis 4: Organizational attraction of a university has a mediator role on the
impacts of a university’s reputation on students’ intention to pursue post-graduate
education in the university they study their bachelor’s degree.
Method
Research Design
This study aims to identify the relationship between a university’s organizational
reputation, organizational attraction and students’ intention to pursue that university. The present study was designed in the descriptive quantitative research
method. With the descriptive quantitative research method, this study aimed to
examine and define an existing situation (Buyukozturk, Akgun, Demirel, Karadeniz & Cakmak, 2015). Through the use of this method in this study, researchers aimed to
analyze average scores of each variable and identify any existent relationship
between and among a university’s reputation, organizational attraction and students’ intention to pursue that university.
Population and Sample of this Study
This study was conducted at Kocaeli University. This university is located in
Kocaeli, which is a city in the Marmara Region. The Marmara Region is the most industrialized and, as a result of this, a crowded region in Turkey. Istanbul is located
in this region, and it is the most crowded city in Turkey, with almost 15,5 million
people (TÜİK, 2018). Kocaeli is one of the neighboring cities to Istanbul. It is one of the metropolitan cities of Turkey. Thus, Kocaeli has many job opportunities. All of
these factors are believed to affect international students’ choice of university. Kocaeli University is also one of the most crowded universities with more than
81.000 students and 2000 academic staff. According to 2018 universities’ ranking
determined depending on the number of articles and citations of academic staff, the number of total scientific documents, the number of graduated students from PhD
programs, and PhD students’ ratio; Kocaeli University was the 30th university
among 102 public universities (URAP, 2018). Also, Kocaeli University has Erasmus Mobility agreements with 168 universities from 24 countries. As a result of this
agreement and scholarship supported by the Higher Education Council (YÖK) for
international students, there were 1476 international students in 2015-2016 academic years at Kocaeli University, and 285 of them were postgraduate students. Most of the
international students come from Turkic Republics, such as Turkmenistan,
Azerbaijan, Kazakhstan, Kirghizstan, Tajikistan, Uzbekistan, and these countries are
220 Soner POLAT - Gizem GUNCAVDI - Yaser ARSLAN Eurasian Journal of Educational Research 84 (2019) 213-236
followed by European (i.e.: Bulgaria, Montenegro, Greece, Macedonia, Kosovo, Russia and Germany) and African (i.e.: Djibouti, Niger, Uganda, Tunisia, Mauretania
and Zambia) countries.
The population of this study included international students at Kocaeli
University who enrolled and started their bachelor’s degree in the 2015-2016
academic years. The sample of this study was determined through the use of a convenience sampling method, and it included 231 students from 67 countries who
enrolled in Kocaeli University in the 2015-2016 academic years. Among 231
international students, 85 (36,8%) of them were female, 146 (63,2%) of them were male. One hundred thirty-four (58%) of them were bachelor’s degrees, 71 (30,7%) of
them were master’s degree, and 26 (11,3%) of them were PhD degree students.
Research Instruments and Procedures
The Scale of Intention to Pursue University. To analyze international students’
intention to pursue university, the scale which was developed by Highhouse et al.
(2003) that included 5-Likert typed 15 items was used. In this scale, there are three
sub-scales, and each sub-scale includes five items. In this study, the subscale of intention to pursue, which included five items, was used.
The scale measures students’ intention to pursue with one-factor structure. An
example item of the scale was “If this university invited me for a postgraduate (Ma, PhD, Post-Doc) interview, I would go to be a postgraduate student at this
university”. The participants were asked to evaluate the items by scoring them from
“Strongly disagree” (1) to “Strongly agree” (5). When the scores from the scale increase, the students’ intentions to pursue increase , as well. The Cronbach’s Alpha
reliability value of the original scale was α=0.82 (Highhouse et al., 2003: 995).
The confirmatory factor analysis (CFA) was conducted to verify the construct validity of the scale for this study’s sample. The results of the analysis showed that
Chi-square test was significant (p=.00), and other indexes (χ²/sd= 3.33; RMSEA=
0.108; CFI= 0.98; GFI= 0.7 AGFI= 0.90) also met the criteria of good fit (Meydan & Sesen, 2011: 37). In the light of these results, the scale was found to be structurally
valid. Cronbach’s Alpha reliability test result was α=0.89, and the scale was evaluated as a reliable scale.
The Scale of Organizational Attraction. To analyze international students’
perception of a university’s organizational attraction, the scale which was developed by Highhouse et al. (2003) that included 5-Likert typed 15 items, was used. In this
study, the subscale of General Attractiveness that included five items was used.
The scale measures organizational attraction with a one-factor structure. An example item of the scale was “Being a student at this university is very appealing to
me”. The participants were asked to evaluate the items by scoring them from
“Strongly disagree” (1) to “Strongly agree” (5). When the scores from the scale increase, the organization’s attraction increases as well. The Cronbach’s Alpha
reliability value of the original scale was α=0.88 (Highhouse et al., 2003: 995).
Soner POLAT - Gizem GUNCAVDI - Yaser ARSLAN Eurasian Journal of Educational Research 84 (2019) 213-236
221
The CFA was conducted to verify the construct validity of the scale for this
study’s sample. The results of the analysis showed that Chi -square test was
significant (p=.00), and other indexes (χ²/sd= 4.8; RMSEA= 0.138; CFI= 0.94; GFI= 0.95; AGFI= 0.86) met the criteria of acceptable fit (Meydan & Sesen, 2011: 37). In the
light of these results, the scale was found to be structurally valid. Cronbach’s Alpha
reliability test result was α=0.79, and the scale was evaluated as a reliable scale.
The Scale of Organizational Reputation. To measure the international students’
perception of the university’s reputation, the scale with Likert typed 10 items and
developed by Alessandri, Yang, and Kinsey (2006) was used. This scale is made up of three dimensions, which are “quality of academic performance” (5 items), “quality of
external performance” (3 items), and “emotional engagement” (2 items). Cronbach’s
Alpha reliability values of subscales were 0.78, 0.67, and 0.44, respectively. The levels of reliability value of “quality of academic performance” and “quality of external
performance” were moderate, but the level of reliability value of “emotional
engagement” was weak.
An example item of the scale was “The university offers highly qualified
education”. The participants were asked to evaluate the items by scoring them from
“Strongly disagree” (1) to “Strongly agree” (5). When the scores from the scale increase, the organization’s reputation increases as well.
The CFA was conducted to verify construct validity of the scale fo r this study’s
sample. The results of the analysis showed that Chi-square test was significant (p=.00), and other indexes (χ²/sd= 6.66; RMSEA= 0,167; CFI= 0,91; GFI= 0,79; AGFI=
0,65) also met the criteria of good fit (Meydan & Sesen, 2011: 37). In the light of these
results, the scale was found to be structurally valid. Cronbach’s Alpha reliability test result was α=0.90, and the scale was evaluated as a reliable scale.
Data Analysis
The names and emails of international students were asked from Kocaeli
University’s International Relations Units. An invitation to attend this study was sent to international students through emails. Together with the invitation letters, a link
for the online form of the questionnaire was sent, as well. Three hundred forty-eight international students were sent invitations, 258 international students filled in the
online questionnaires. However, the data from 27 of these 258 international students
were not analyzed due to missing items or reckless filling. As a result of this, data from 231 international students were used in this study. The means and standard
deviation values were analyzed. Also, path analysis was conducted to identify the
impacts of independent variables on dependent variables and their mediator roles.
Results
To test the hypotheses of this study, interrelations between variables were first
examined. Mean scores and correlation coefficients between variables are presented in Table 1. These scores include university students’ perception levels regarding
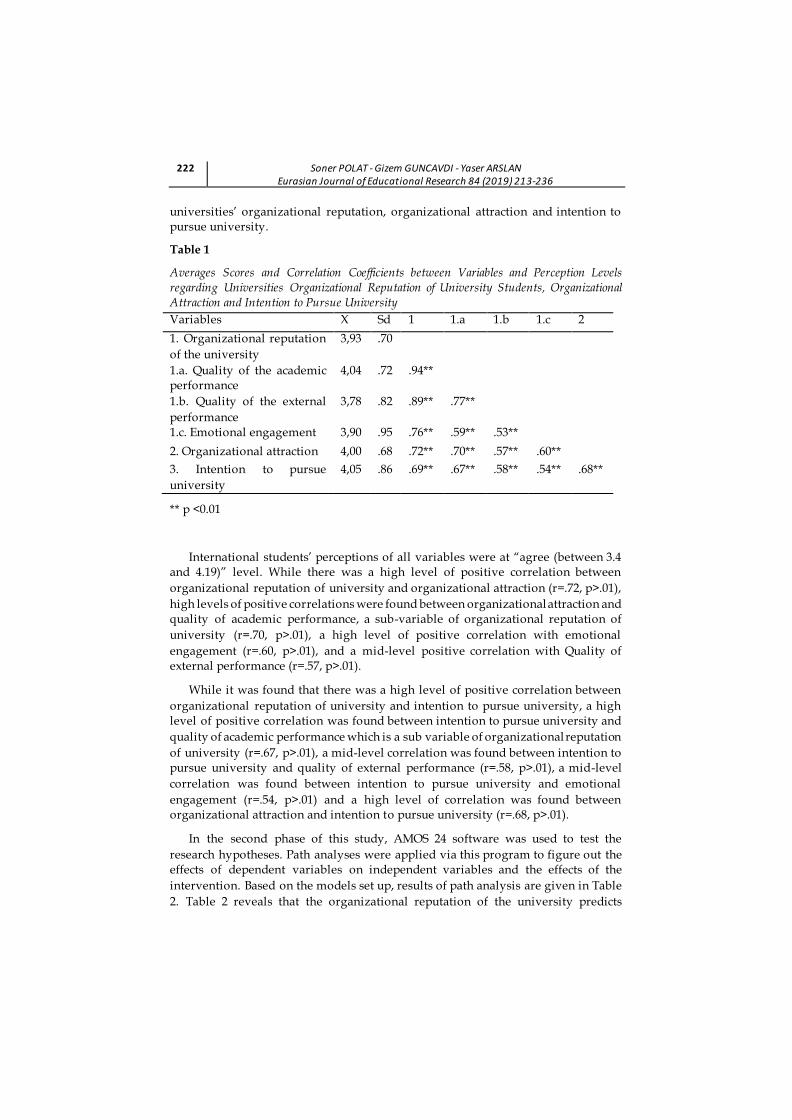
222 Soner POLAT - Gizem GUNCAVDI - Yaser ARSLAN Eurasian Journal of Educational Research 84 (2019) 213-236
universities’ organizational reputation, organizational attraction and intention to pursue university.
Table 1
Averages Scores and Correlation Coefficients between Variables and Perception Levels regarding Universities Organizational Reputation of University Students, Organizational Attraction and Intention to Pursue University
Variables X Sd 1 1.a 1.b 1.c 2
1. Organizational reputation
of the university
3,93 .70
1.a. Quality of the academic performance
4,04 .72 .94**
1.b. Quality of the external
performance
3,78 .82 .89** .77**
1.c. Emotional engagement 3,90 .95 .76** .59** .53**
2. Organizational attraction 4,00 .68 .72** .70** .57** .60**
3. Intention to pursue
university
4,05 .86 .69** .67** .58** .54** .68**
** p <0.01
International students’ perceptions of all variables were at “agree (between 3.4 and 4.19)” level. While there was a high level of positive correlation between
organizational reputation of university and organizational attraction (r=.72, p>.01),
high levels of positive correlations were found between organizational attraction and quality of academic performance, a sub-variable of organizational reputation of
university (r=.70, p>.01), a high level of positive correlation with emotional
engagement (r=.60, p>.01), and a mid-level positive correlation with Quality of external performance (r=.57, p>.01).
While it was found that there was a high level of positive correlation between
organizational reputation of university and intention to pursue university, a high level of positive correlation was found between intention to pursue university and
quality of academic performance which is a sub variable of organizational reputation
of university (r=.67, p>.01), a mid-level correlation was found between intention to pursue university and quality of external performance (r=.58, p>.01), a mid-level
correlation was found between intention to pursue university and emotional
engagement (r=.54, p>.01) and a high level of correlation was found between organizational attraction and intention to pursue university (r=.68, p>.01).
In the second phase of this study, AMOS 24 software was used to test the
research hypotheses. Path analyses were applied via this program to figure out the effects of dependent variables on independent variables and the effects of the
intervention. Based on the models set up, results of path analysis are given in Table
2. Table 2 reveals that the organizational reputation of the university predicts
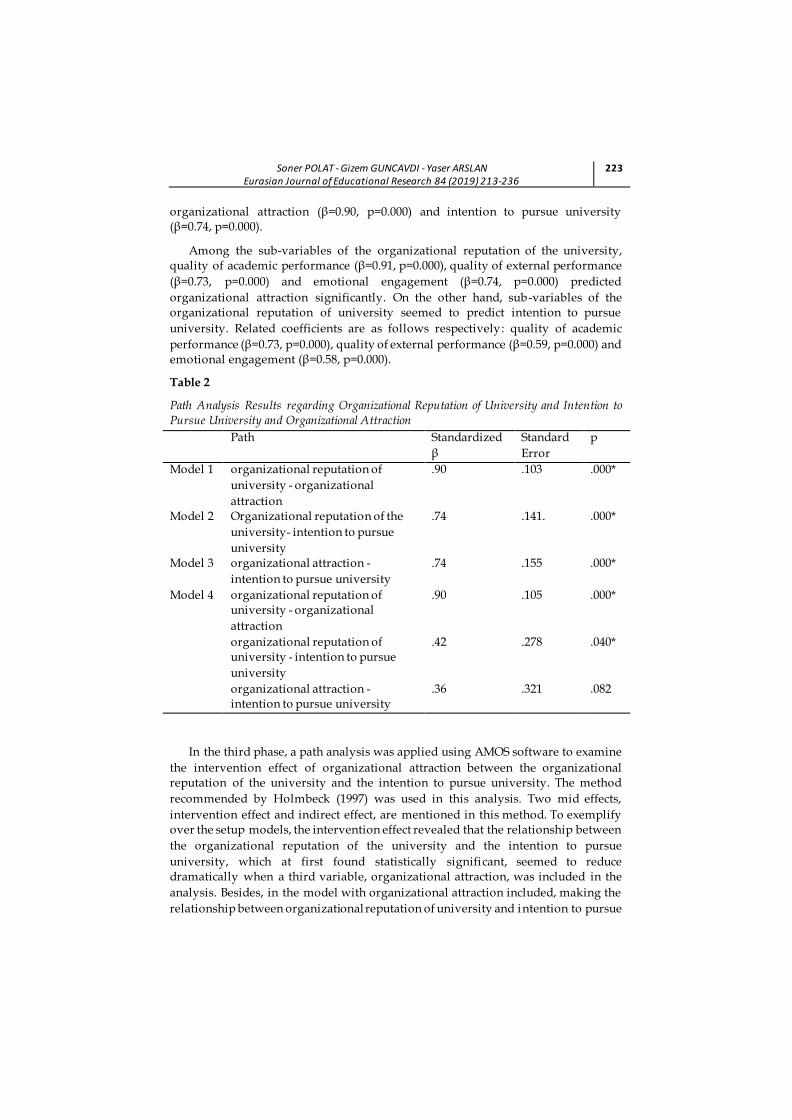
Soner POLAT - Gizem GUNCAVDI - Yaser ARSLAN Eurasian Journal of Educational Research 84 (2019) 213-236
223
organizational attraction (β=0.90, p=0.000) and intention to pursue university (β=0.74, p=0.000).
Among the sub-variables of the organizational reputation of the university, quality of academic performance (β=0.91, p=0.000), quality of external performance
(β=0.73, p=0.000) and emotional engagement (β=0.74, p=0.000) predicted
organizational attraction significantly. On the other hand, sub-variables of the organizational reputation of university seemed to predict intention to pursue
university. Related coefficients are as follows respectively: quality of academic
performance (β=0.73, p=0.000), quality of external performance (β=0.59, p=0.000) and emotional engagement (β=0.58, p=0.000).
Table 2
Path Analysis Results regarding Organizational Reputation of University and Intention to Pursue University and Organizational Attraction
Path Standardized
β
Standard
Error
p
Model 1 organizational reputation of
university - organizational
attraction
.90 .103 .000*
Model 2 Organizational reputation of the
university- intention to pursue
university
.74 .141. .000*
Model 3 organizational attraction -
intention to pursue university
.74 .155 .000*
Model 4 organizational reputation of university - organizational
attraction
.90 .105 .000*
organizational reputation of university - intention to pursue
university
.42 .278 .040*
organizational attraction - intention to pursue university
.36 .321 .082
In the third phase, a path analysis was applied using AMOS software to examine
the intervention effect of organizational attraction between the organizational reputation of the university and the intention to pursue university. The method
recommended by Holmbeck (1997) was used in this analysis. Two mid effects,
intervention effect and indirect effect, are mentioned in this method. To exemplify over the setup models, the intervention effect revealed that the relationship between
the organizational reputation of the university and the intention to pursue
university, which at first found statistically significant, seemed to reduce dramatically when a third variable, organizational attraction, was included in the
analysis. Besides, in the model with organizational attraction included, making the
relationship between organizational reputation of university and intention to pursue
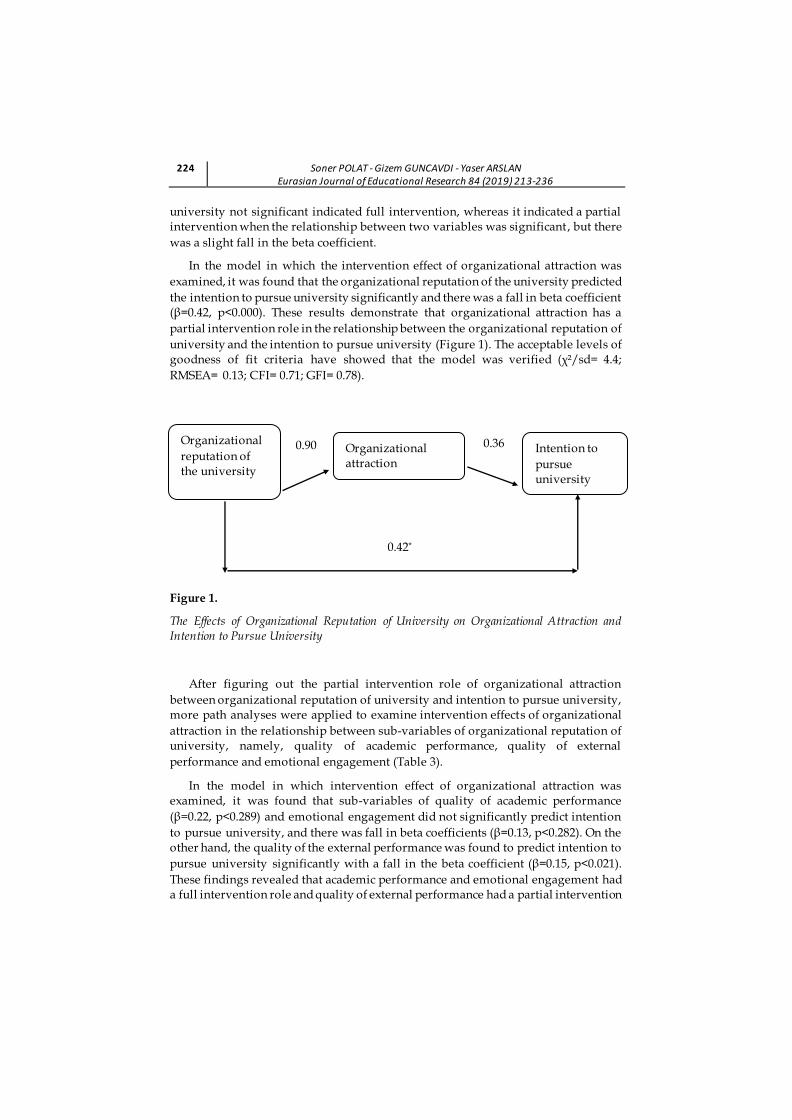
224 Soner POLAT - Gizem GUNCAVDI - Yaser ARSLAN Eurasian Journal of Educational Research 84 (2019) 213-236
university not significant indicated full intervention, whereas it indicated a partial intervention when the relationship between two variables was significant, but there
was a slight fall in the beta coefficient.
In the model in which the intervention effect of organizational attraction was
examined, it was found that the organizational reputation of the university predicted
the intention to pursue university significantly and there was a fall in beta coefficient (β=0.42, p<0.000). These results demonstrate that organizational attraction has a
partial intervention role in the relationship between the organizational reputation of
university and the intention to pursue university (Figure 1). The acceptable levels of goodness of fit criteria have showed that the model was verified (χ²/sd= 4.4;
RMSEA= 0.13; CFI= 0.71; GFI= 0.78).
Figure 1.
The Effects of Organizational Reputation of University on Organizational Attraction and Intention to Pursue University
After figuring out the partial intervention role of organizational attraction
between organizational reputation of university and intention to pursue university, more path analyses were applied to examine intervention effects of organizational
attraction in the relationship between sub-variables of organizational reputation of university, namely, quality of academic performance, quality of external
performance and emotional engagement (Table 3).
In the model in which intervention effect of organizational attraction was examined, it was found that sub-variables of quality of academic performance
(β=0.22, p<0.289) and emotional engagement did not significantly predict intention
to pursue university, and there was fall in beta coefficients (β=0.13, p<0.282). On the other hand, the quality of the external performance was found to predict intention to
pursue university significantly with a fall in the beta coefficient (β=0.15, p<0.021).
These findings revealed that academic performance and emotional engagement had a full intervention role and quality of external performance had a partial intervention
Organizational
reputation of the university
Organizational attraction
Intention to
pursue university
0.90*
0.36
0.42*
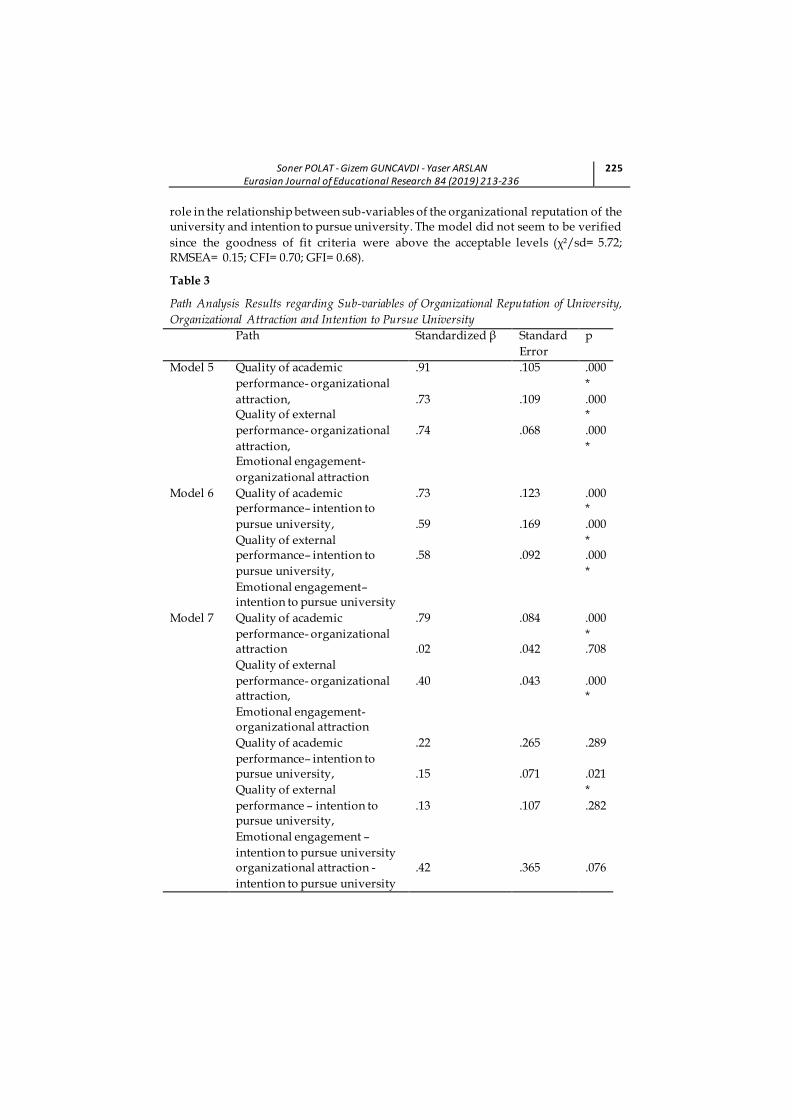
Soner POLAT - Gizem GUNCAVDI - Yaser ARSLAN Eurasian Journal of Educational Research 84 (2019) 213-236
225
role in the relationship between sub-variables of the organizational reputation of the university and intention to pursue university. The model did not seem to be verified
since the goodness of fit criteria were above the acceptable levels (χ²/sd= 5.72; RMSEA= 0.15; CFI= 0.70; GFI= 0.68).
Table 3
Path Analysis Results regarding Sub-variables of Organizational Reputation of University,
Organizational Attraction and Intention to Pursue University
Path Standardized β Standard
Error
p
Model 5 Quality of academic
performance- organizational
attraction, Quality of external
performance- organizational
attraction, Emotional engagement-
organizational attraction
.91
.73
.74
.105
.109
.068
.000
*
.000*
.000
*
Model 6 Quality of academic performance– intention to
pursue university,
Quality of external performance– intention to
pursue university,
Emotional engagement– intention to pursue university
.73
.59
.58
.123
.169
.092
.000*
.000
* .000
*
Model 7 Quality of academic
performance- organizational attraction
Quality of external
performance- organizational attraction,
Emotional engagement- organizational attraction
.79
.02
.40
.084
.042
.043
.000
* .708
.000*
Quality of academic
performance– intention to pursue university,
Quality of external
performance – intention to pursue university,
Emotional engagement –
intention to pursue university
.22
.15
.13
.265
.071
.107
.289
.021
*
.282
organizational attraction -
intention to pursue university
.42 .365 .076
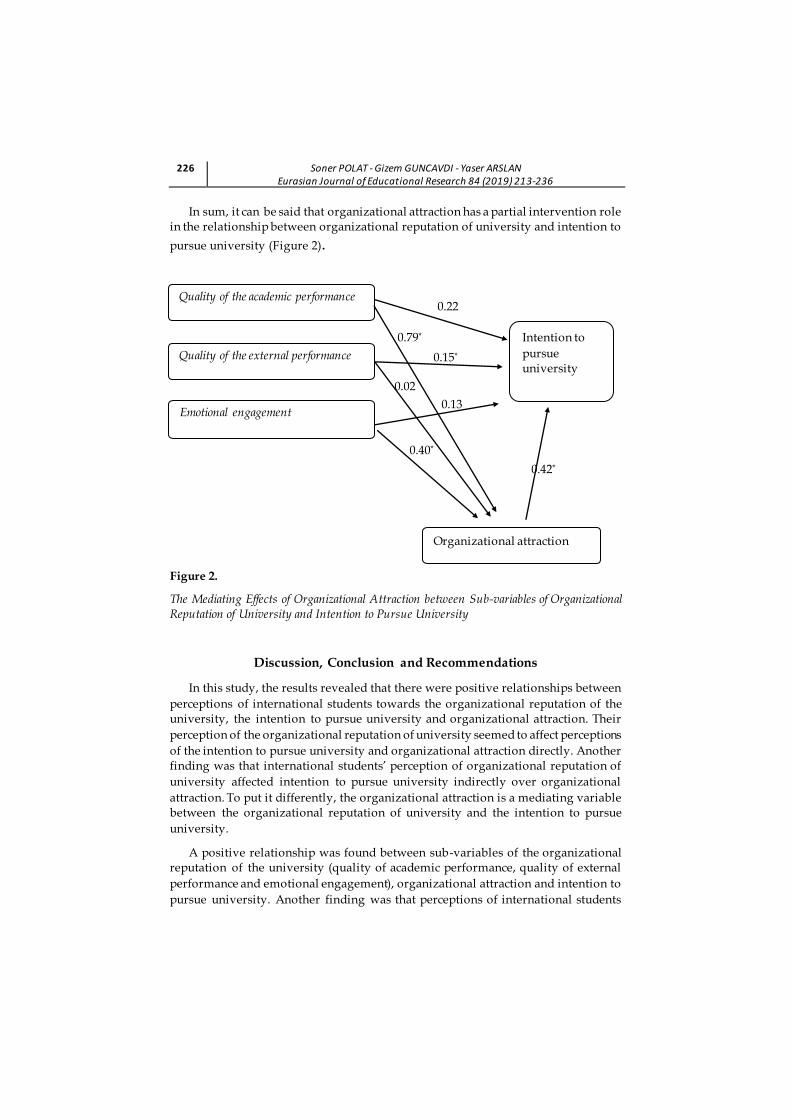
226 Soner POLAT - Gizem GUNCAVDI - Yaser ARSLAN Eurasian Journal of Educational Research 84 (2019) 213-236
In sum, it can be said that organizational attraction has a partial intervention role
in the relationship between organizational reputation of university and intention to
pursue university (Figure 2).
Figure 2.
The Mediating Effects of Organizational Attraction between Sub-variables of Organizational Reputation of University and Intention to Pursue University
Discussion, Conclusion and Recommendations
In this study, the results revealed that there were positive relationships between
perceptions of international students towards the organizational reputation of the university, the intention to pursue university and organizational attraction. Their
perception of the organizational reputation of university seemed to affect perceptions
of the intention to pursue university and organizational attraction directly. Another finding was that international students’ perception of organizational reputation of
university affected intention to pursue university indirectly over organizational
attraction. To put it differently, the organizational attraction is a mediating variable between the organizational reputation of university and the intention to pursue
university.
A positive relationship was found between sub-variables of the organizational reputation of the university (quality of academic performance, quality of external
performance and emotional engagement), organizational attraction and intention to
pursue university. Another finding was that perceptions of international students
Quality of the academic performance
Quality of the external performance
Emotional engagement
Organizational attraction
Intention to
pursue university
0.22
0.15*
0.42*
0.79*
0.40*
0.13
0.02
Soner POLAT - Gizem GUNCAVDI - Yaser ARSLAN Eurasian Journal of Educational Research 84 (2019) 213-236
227
towards sub-variables of the organizational reputation of the university (quality of academic performance, quality of external performance and emotional engagement)
affected organizational attraction and intention to pursue university variables directly. At the same time, sub-variables of organizational reputation of university
(quality of academic performance, quality of external performance and emotional
engagement) indirectly affected intention to pursue university over organizational attraction.
According to the results of this study, the quality of the academic performance
was the most effective sub-variable of the sub-variables of the organizational reputation of university, affecting organizational attraction and intention to pursue
university. This finding is consistent with the findings of Akar’s study (2012).
According to Akar (2012), academic respectability is the most important factor which university students consider when they choose their universities.
The results in this study yielded that students who perceived the organizational
reputation of university high were the ones who found the organization attractive. This finding is consistent with the findings of theoretical and applied studies. An
organization with a high reputation outperforms its rivals and seems more attractive
in the eyes of stakeholders (Croucher, Zeng & Kassing, 2019; Fombrun & Shanley, 1990). In other words, a strong reputation towards an organization makes it more
preferable by making it more attractive (Chauvin & Guthrie, 1994; Mohammed,
2019). Organizational reputation directly affects preferences target audience , especially individuals who are in search (Gatewood et al., 1993).
Another finding was that the perception of organizational attraction increased the
perception of intention to pursue university. This finding also seems compatible with the expectations because high level of organizational reputation meets the
expectations of individuals and increases the attractiveness of the organization, and
therefore reduces the rate of quitting work (Carmeli & Freund, 2002; Fombrun et al. 2000; Freund, 2006; Herrbach & Mignonac, 2004). Hence, it increases the intention to
pursue an organization. Organizational reputation seems to have a pivotal role in
attracting qualified individuals to organization and keeping them in. The development of the social capital capacity of the organization depends on increasing
organizational reputation, organizational attraction and perception of intention to
pursue an organization (Djurdjevic, Rosen, Conroy, Rawski & Sosna, 2019). Another finding was that organizational reputation of university affected students to pursue
universities positively. This finding also shows compliance with expectations
because it was found that there was a rise in the number of qualified individuals in the organization with a high reputation and a fall in their behaviors of quitting work
(Bohlmann, Krumbholz & Zacher, 2018; Winkleman, 1999).
In conclusion, the results show that the organizational reputation of university affects international students’ intention to pursue post-graduate education, and
organizational attraction is a mediating variable. This result suggests that university administrators should be sensitive to increase the university’s organizational
reputation to increase the perceptions towards attraction. It can be suggested that by
228 Soner POLAT - Gizem GUNCAVDI - Yaser ARSLAN Eurasian Journal of Educational Research 84 (2019) 213-236
doing this, administrators could attract international students to choose their university and could increase the level of international students’ intention to pursue
their post-graduate education at the same university.
Recommendations
As any other studies, this research has some limitations. Firstly, this study was conducted with the international students that enrolled at Kocaeli University in the
2015-2016 academic years. Another research can be conducted with the same
students through their 2nd, 3rd, or 4th years to understand whether their perceptions change or not. Also, this study was conducted in only one university , which limits
the generalizability of the findings. Thus, it can be suggested that other researchers
can conduct a similar study with international students at other universities to reach a more comprehensive result.
In addition to the recommendations for researchers mentioned above, there can
be some others for practitioners. This study suggests that organizational reputation of a university affects international students’ intention to pursue post-graduate study
at that university, and organizational attraction is a mediating variable. These results
may shed light to rectors’, deans’, or other administrators’ ways to make their university more attractive for international students. Rectors may organize some
events to present their university at international education fairs; they may appoint
some academicians and professional staff for the human relations department to publicize their university concerning both academic opportunities and other
facilities. When it comes to deans, they may show the same efforts to present their
faculty and programs to attract international students by providing the necessary information. Also, all administrators should try to make their university more
attractive by improving the conditions related to transportation, accommodation, and opportunities to reach information, dining hall and job opportunities for
international students.
References
Aiman-Smith, L., Bauer, T. N., & Cable, D. M. (2001). Are you attracted? Do you intend to pursue? A recruiting policy-capturing study. Journal of Business and
Psychology, 16(2), 219-237.
Akar, C. (2012). Universite secimini etkileyen faktorler: Iktisadi ve idari bilimler öğrencileri üzerine bir calisma. Eskisehir Osmangazi Universitesi IIBF Dergisi, 7(1), 97-120.
Akcay, A. D. (2014). Orgutsel cekicilik baglamında otel isletmelerini rakiplerinden ayiran ozellikler. Anadolu Universitesi Sosyal Bilimler Dergisi, 14(1), 475-185.
Alessandri, S. W., Yang, S. U., & Kinsey, D. F. (2006). An integrative approach to university visual identity and reputation. Corporate Reputation Review, 9(4),
258-270.
Anderson, P. (1999). Perspective: Complexity theory and organization science. Organization Science, 10(3), 216-232.
Soner POLAT - Gizem GUNCAVDI - Yaser ARSLAN Eurasian Journal of Educational Research 84 (2019) 213-236
229
Apaydin, C., & Seckin-Kapucu, M. (2017). Universiteyi tercih etme, akademik itibar
ve sosyal etkinlik arasındaki iliski: Akdeniz ve Eskisehir Osmangazi Universitesi lisans ögrencileri örnegi. Kuram ve Uygulamada Egitim Yonetimi, 23(2), 199-222.
Arambewela R. & Hall J. (2006). A comparative analysis of international education satisfaction using SERVQUAL. Journal of Service Research, 6, 63-141
Ateg, M., Andersson, I. M., & Rosén, G. (2009). Change processes for attractive work in small manufacturing companies. Human Factors and Ergonomics in
Manufacturing, 19(1), 35-63.
Ayoubi, R. M., & Massoud, H. K. (2012). Student aspiration factors, university reputation and the entry standards to UK universities. European Journal of
Social Sciences, 34(4), 609-621.
Bohlmann, C., Krumbholz, L., & Zacher, H. (2018). The triple bottom line and
organizational attractiveness ratings: The role of pro ‐environmental attitude. Corporate Social Responsibility and Environmental Management, 25(5),
912-919.
Bromley, D. (2002). Comparing corporate reputations: League tables, quotients, benchmarks, or case studies?. Corporate Reputation Review, 5(1), 35-50.
Bromley, D. B. (1993). Reputation, image and impression management. John Wiley &
Sons.
Bromley, R. (2000). Narratives for a new belonging: Diasporic cultural fictions. Edinburgh
University Press.
Brooks, M. E., Highhouse, S., Russell, S. S., & Mohr, D. C. (2003). Familiarity, ambivalence, and firm reputation: Is corporate fame a double-edged sword? Journal of Applied Psychology, 88, 904–914.
Buyukozturk, S., Akgun, Ö. E., Demirel, F., Karadeniz, S., & Cakmak, E. K. (2015). Bilimsel arastirma yontemleri. Pegem Akademi.
Cable, D. M., & Graham, M. E. (2000). The determinants of job seekers' reputation perceptions. Journal of Organizational Behavior, 21(8), 929-947.
Cable, D. M., & Judge, T. A. (1996). Person–organization fit, job choice decisions, and organizational entry. Organizational Behavior and Human Decision Processes, 67(3), 294-311.
Caligiuri, P., Colakoglu, S., Cerdin, J. L., & Kim, M. S. (2010). Examining cross-cultural and individual differences in predicting employer reputation as a driver of employer attraction. International Journal of Cross Cultural
Management, 10(2), 137-151.
Carless, S. A., & Wintle, J. (2007). Applicant attraction: The role of recruiter function, work–life balance policies and career salience. International Journal of Selection and Assessment, 15(4), 394-404.
Carmeli, A., & Freund, A. (2002). The relationship between work and workplace attitudes and perceived external prestige. Corporate Reputation Review, 5(1),
51-68.
230 Soner POLAT - Gizem GUNCAVDI - Yaser ARSLAN Eurasian Journal of Educational Research 84 (2019) 213-236
Caruana, A. (1997). Corporate reputation: concept and measurement. Journal of
Product & Brand Management, 6(2), 109-118.
Casper, W. J., & Buffardi, L. C. (2004). Work-life benefits and job pursuit intentions: The role of anticipated organizational support. Journal of Vocational
Behavior, 65(3), 391-410.
Chapman, D. S., Uggerslev, K. L., Carroll, S. A., Piasentin, K. A., & Jones, D. A.
(2005). Applicant attraction to organizations and job choice: a meta-analytic review of the correlates of recruiting outcomes. Journal of Applied Psychology,
90(5), 928-944.
Chauvin, K. W., & Guthrie, J. P. (1994). Labor market reputation and the value of the firm. Managerial and Decision Economics, 15(6), 543-552.
Croucher, S. M., Zeng, C., & Kassing, J. (2019). Learning to contradict and standing up for the company: An exploration of the relationship between
organizational dissent, organizational assimilation, and organizational reputation. International Journal of Business Communication, 56(3), 349-367.
Deephouse, D. L. (2000). Media reputation as a strategic resource: An integration of mass communication and resource-based theories. Journal of
management, 26(6), 1091-1112.
Djurdjevic, E., Rosen, C. C., Conroy, S. A., Rawski, S. L., & Sosna, K. U. (2019). The influence of political climate on job pursuit intentions and the moderating effect of Machiavellianism. International Journal of Selection and Assessment, 27(2), 180-192.
Drewes, T., & Michael, C. (2006). How do students choose a university? An analysis of applications to universities in Ontario, Canada. Research in Higher
Education, 47(7), 781-800.
Dural, S., Aslan, G., Alince, M., & Araza, A. (2014). Orgütsel cekicilik: Bir olcek uyarlama calismasi. Dogus Universitesi Dergisi, 15(2), 141-154.
Fishbein, M. & Ajzen, I. (1975). Belief, Attitude, Intentions, and Behavior: An Introduction to Theory and Research. Boston, MA: Addison Wesley.
Fombrun, C. J., & Van Riel, C. B. M. (2003). Fame & Fortune: How the World's Top Companies Develop Winning Reputations. Pearson Education.
Fombrun, C. J., Gardberg, N. A., & Sever, J. M. (2000). The Reputation QuotientSM: A multi-stakeholder measure of corporate reputation. Journal of Brand
Management, 7(4), 241-255.
Fombrun, C., & Shanley, M. (1990). What's in a name? Reputation building and corporate strategy. Academy of management Journal, 33(2), 233-258.
Freund, A. (2006). Work and workplace attitudes on social workers: Do they predict organizational reputation?. Business and Society Review, 111(1), 67-87.
Gatewood, R. D., Gowan, M. A., & Lautenschlager, G. J. (1993). Corporate image, recruitment image and initial job choice decisions. Academy of Management journal, 36(2), 414-427.
Gotsi, M., & Wilson, A. M. (2001). Corporate reputation: seeking a definition. Corporate Communications: An International Journal, 6(1), 24-30.
Soner POLAT - Gizem GUNCAVDI - Yaser ARSLAN Eurasian Journal of Educational Research 84 (2019) 213-236
231
Grunig, J. E., & Hung, C. J. F. (2002). The effect of relationships on reputation and
reputation on relationships: A cognitive, behavioral study. In PRSA
Educator’s Academy 5th Annual International, Interdisciplinary Public Relations Research Conference, Miami, Florida (pp. 8-10).
Gunduzyeli, B. (2015). Kuresel egitim pazarlama stratejileri ve yabanci uyruklu ogrencilerin universite secim faktorleri uzerine bir arastirma (Unpublished
master thesis), Beykent University, Istanbul.
Herrbach, O., & Mignonac, K. (2004). How organisational image affects employee attitudes. Human Resource Management Journal, 14(4), 76-88.
Highhouse, S., Lievens, F., & Sinar, E. F. (2003). Measuring attraction to organizations. Educational and Psychological Measurement, 63(6), 986-1001.
Holmbeck, G. N. (1997). Toward terminological, conceptual, and statistical clarity in
the study of mediators and moderators: Examples from the child-clinical and pediatric psychology literatures. Journal of Consulting and Clinical
Psychology, 65, 599-610.
Isik, M., Cicek, B. & Almali, V. (2016). Universitelerin ic paydaşlarının kurumsal itibar algısını olcmeye yonelik bir arastirma. Journal of Bitlis Eren University
Institute of Social Sciences, 5, 163-180.
Jiang, T., Iles, P. (2011). Employer-brand equity, organizational attractiveness and talent management in the Zhejiang private sector, China. Journal of Technology Management in China, 6(1), 97-110.
Kaur, S., & Sidhu, G. K. (2009). A qualitative study of postgraduate students’ learning experiences in Malaysia. International Education Studies, 2(3), 47-56.
Kondakci, Y. (2011). Student mobility reviewed: Attraction and satisfaction of international students in Turkey. Higher Education, 62(5), 573-592.
Lawley, M. (1998). Thai and Malaysian students’ perceptions of overseas study destinations: an exploratory study (Unpublished doctoral dissertation), University of
Southern Queensland.
Lawley, M., & Blight, D. (1997). International students: Reasons for choice of an overseas
study destination. Research paper presented at the 11th Australian
International Education Conference. Melbourne, IDP Australia, Canberra.
Lievens, F., & Highhouse, S. (2003). The relation of instrumental and symbolic attributes to a company's attractiveness as an employer. Personnel
psychology, 56(1), 75-102.
Lievens, F., Decaesteker, C., Coetsier, P., & Geirnaert, J. (2001). Organizational attractiveness for prospective applicants: A person–organisation fit perspective. Applied Psychology, 50(1), 30-51.
Llewellyn‐Smith, C., & McCABE, V. S. (2008). What is the attraction for exchange
students: The host destination or host university? Empirical evidence from a study of an Australian university. International Journal of Tourism
Research, 10(6), 593-607.

232 Soner POLAT - Gizem GUNCAVDI - Yaser ARSLAN Eurasian Journal of Educational Research 84 (2019) 213-236
Mazzarol, T., & Soutar, G. (2002). Push-pull factors influencing international
students’ destination choice. International Journal of Educational Management,
16(2), 82-90.
Meydan, C. H., & Sesen, H. (2011). Yapisal esitlik modellemesi AMOS uygulamalari.
Detay Yayıncılık.
Mohammed, S. D. (2019). The impact of recruitment sources on brand image perceptions
and organizational attraction: Leveraging organizational brand image perceptions to enhance recruitment attraction. Retrieved from ProQuest Digital
Dissertations (13861086).
Ponzi, L. J., Fombrun, C. J., & Gardberg, N. A. (2011). RepTrak™ pulse:
Conceptualizing and validating a short-form measure of corporate reputation. Corporate Reputation Review, 14(1), 15-35.
Price, I. F., Matzdorf, F., Smith, L., & Agahi, H. (2003). The impact of facilities on student choice of university. Facilities, 21(10), 212-222.
Rao, H. (1994). The social construction of reputation: Certification contests, legitimation, and the survival of organizations in the American automobi le industry: 1895–1912. Strategic Management Journal, 15(S1), 29-44.
Rindova, V. P., & Kotha, S. (2001). Continuous “morphing”: Competing through dynamic capabilities, form, and function. Academy of Management Journal,
44(6), 1263-1280.
Rynes, S. L., & Barber, A. E. (1990). Applicant attraction strategies: An organizational perspective. Academy of Management Review, 15(2), 286-310.
Rynes, S. L., Bretz, R. D., & Gerhart, B. (1991). The importance of recruitment in job choice: A different way of looking. Personnel Psychology, 44(3), 487-521.
Sabuncuoglu, Z., & Tuz, M. V. (1998). Orgutsel psikoloji. Alfa Basim Yayim Dagitim.
Shamma, H. M. (2012). Toward a comprehensive understanding of corporate reputation: Concept, measurement and implications. International Journal of Business and Management, 7(16), 151.
Soutar, G. N., & Turner, J. P. (2002). Students' preferences for university: a conjoint analysis. International Journal of Educational Management, 16(1), 40-45.
Stevens, C. K., Dragoni, L., & Collins, C. J. (2001). Familiarity, organizational images, and perceived fit as antecedents to the application decisions of new graduates. In Annual Meeting of the Society for Industrial Organizational
Psychology, San Diego, CA.
To, W. M., Lai, L. S., Lung, J. W., & Lai, T. M. (2014). Intent to pursue further studies among Chinese Students. Educational Studies, 40(3), 292-309.
To, W. M., Lung, J. W., Lai, L. S., & Lai, T. M. (2014). Destination choice of cross-border Chinese students: an importance-performance analysis. Educational Studies, 40(1), 63-80.
Turban, D. B., & Cable, D. M. (2003). Firm reputation and applicant pool characteristics. Journal of Organizational Behavior: The International Journal of
Industrial, Occupational and Organizational Psychology and Behavior , 24(6), 733-
751.
Soner POLAT - Gizem GUNCAVDI - Yaser ARSLAN Eurasian Journal of Educational Research 84 (2019) 213-236
233
Turban, D. B., & Greening, D. W. (1997). Corporate social performance and
organizational attractiveness to prospective employees. Academy of
Management Journal, 40(3), 658-672.
Turban, D. B., & Keon, T. L. (1993). Organizational attractiveness: An interactionist perspective. Journal of Applied Psychology, 78(2), 184.
Turban, D. B., Lau, C. M., Ngo, H. Y., Chow, I. H., & Si, S. X. (2001). Organizational
attractiveness of firms in the People's Republic of China: A person–organization fit perspective. Journal of Applied Psychology, 86(2), 194.
TUIK. (2018). Adrese Dayalı Nüfus Kayıt Sistemi Sonucları, 2017, available at:
http://www.tuik.gov.tr/HbGetirHTML.do?id=27587 (28 February 2018)
URAP. (2018). 2017-2018 Türkiye Genel Sıralamaları, available at:
http://tr.urapcenter.org/2017/2017_t5.php (28 February 2018)
Veloutsou, C., Lewis, J. W., & Paton, R. A. (2004). University selection: Information requirements and importance. International Journal of Educational
Management, 18(3), 160-171.
Williamson, I. O., King, J. E., Lepak, D., & Sarma, A. (2010). Firm reputation, recruitment web sites, and attracting applicants. Human Resource
Management, 49(4), 669-687.
Winkleman, M. (1999). The right stuff: survey on corporate reputation. Chief Executive
(US), 143, 80-81.
Yang, S.-U., & Grunig, J. E. (2005). The effects of organization-public relationships
outcomes on cognitive representations of organizations and overall evaluations of organizational performance. Journal of Communication
Management, 9, 305–326.
Üniversitenin Örgütsel İtibar ve Örgütsel Çekiciliğinin Öğrencilerin
Devam Niyeti Üzerine Etkisi
Atıf:
Polat, S., Guncavdi, G., & Arslan, Y. (2019). The impacts of a university’s
organizational reputation and organizational attraction on students’ intention to pursue. Eurasian Journal of Educational Research, 84, 213-236. DOI:
10.14689/ejer.2019.84.10
Özet
Problem Durumu: Devam niyeti bireyin bir yere başvurma, çalıştığı ya da
bulunduğu kurumda çalışmaya istekli olma durumu olarak tanımlanmaktadır
(Chapman vd., 2005). Örgütsel ün kavramı ise bir örgütün kimliği ve önemi ile ilgili bireylerin sahip olduğu ortak görüşlerdir (Rao, 1994; Rindova & Kotha,

234 Soner POLAT - Gizem GUNCAVDI - Yaser ARSLAN Eurasian Journal of Educational Research 84 (2019) 213-236
2001), örgütün medyadaki görünürlüğü ve popülerliği (Deephouse, 2000) ve farklı topluluklardaki bireylerin zihinlerinde örgütler ile ilgili varolan anlayış
(Grunig & Hung, 2002; Yang & Grunig, 2005) olarak tanımlanmaktadır. Çalışma kapsamındaki kavramlardan bir diğeri ise örgütsel çekicilik kavramıdır. Bir
kurumun, gelecekteki işgörenler tarafından çekici bir iş yer i olarak
değerlendirilmesi olarak tanımlanan örgütsel çekicilik kavramı, bireylerin çalışacakları yere, o yerde çalışmak için başvurup başvurmama konusundaki
karar verme süreçlerini etkileyen önemli bir faktör olarak ele alınmaktadır
(Akçay, 2014).
Örgütsel çekicilik ile örgütsel ün arasındaki ilişkiyi inceleyen bir dizi çalışma
vardır (Cable & Graham, 2000; Turban ve Cable, 2003; Caligiuri ve diğerleri, 2010;
Williamson, King, Lepak & Sarma, 2010). Başarılı bir şekilde yönetildiğinde örgütün itibarı, kurumun hedef grup için tanınırlığının artışına ve örgüte
yakınlığın artmasına yardımcı olur. Bu sayede hedef grubun bireyleri daha yüksek
itibarı olan kuruluşları tercih etmektedir (Brook ve ark. 2003). Benzer şekilde, örgütsel çekicilik ve tanınırlık arasındaki ilişkiyi konu alan çalışmalarda, örgütsel
çekicilik düzeyinin önemli öncüllerinden biri olduğu vurgulanmıştır (Gatewood,
Gowan & Lautenschlager, 1993; Turban ve Greening, 1997; Stevens, Dragoni &. Collins, 2001; Turban ve arkadaşları, 2001).
Örgütsel itibar, örgütsel çekicilik ve devam etme niyeti arasındaki ilişki “eylem
teorisi” ile açıklanabilir (Fishbein ve Ajzen, 1975). Mantıksal eylem teorisi, kişinin davranışsal niyetini tanımlayan belirleyicilerinden birinin bir nesneye,
organizasyona veya davranışa dair insanların fikirleri olduğunu öne sürmektedir. Bu
fikirler bir nesne, örgüt veya davranış hakkında öznel bir norm oluştururlar. Bu teori açısından örgütsel itibarın ve örgütsel çekiciliğin öznel normlar oluşturduğunu
söylemek yanlış olmaz.
Araştırmanın Amacı: Bu çalışmanın amacı, bir üniversitenin kurumsal itibarının ve
örgütsel çekiciliğin uluslararası öğrencilerin lisans eğitimini aldıkları üniversitede
lisansüstü eğitime devam etme niyetine olan etkisini tespit etmektir. Buna göre, bu
çalışmanın hipotezleri aşağıdaki gibi oluşturulmuştur:
Hipotez 1: Üniversitenin itibarı öğrencilerin üniversitenin çekiciliğine ilişkin
algılarını etkiler. Hipotez 2: Öğrencilerin üniversitenin itibarına ilişkin algılarının,
öğrencilerin lisans eğitimini aldıkları üniversitede lisansüstü eğitimine devam etme niyetleri üzerinde anlamlı etkisi vardır. Hipotez 3: Öğrencilerin üniversitenin
çekiciliğine ilişkin algılarının, öğrencilerin lisans eğitimini aldıkları üniversitede
lisansüstü eğitimine devam etme niyetleri üzerinde anlamlı etkisi vardır.
Hipotez 4: Üniversitenin örgütsel çekiciliği, örgütsel itibarının öğrencilerin lisans
eğitimine devam ettikleri üniversitede lisansüstü eğitime devam etme niyetleri
üzerindeki etkisinde aracı rolü vardır.
Araştırmanın Bulguları: Çalışma Kocaeli Üniversitesinde yapılmıştır. Üniversite
Marmara Bölgesi’nde yer alan Kocaeli ilinde yer almaktadır. Marmara Bölgesi Türkiye’nin en çok sanayileşmiş bölgesi olduğundan ve İstanbul’un yer aldığı
Soner POLAT - Gizem GUNCAVDI - Yaser ARSLAN Eurasian Journal of Educational Research 84 (2019) 213-236
235
bölge olmasından dolayı uluslararası öğrenciler tarafından oldukça fazla şekilde tercih edilen bir bölgedir. Kocaeli de İstanbul’un komşu illerinden biri olduğu ve
büyükşehir olduğundan dolayı birçok iş imkanına ve sosyal imkanlara sahiptir. Tüm bu etkenlerin uluslararası öğrencilerin üniversite tercihlerini etkilediklerine
inanılmaktadır. Ayrıca Kocaeli Üniversitesi 81000 öğrencisi ve 2000’den fazla
akademik personeli ile Türkiye’nin en kalabalık üniversitelerinden biridir. 2018 yılı verilerine göre, Kocaeli Üniversitesi Türkiye’deki üniversiteler arasında akademik
çalışmalar, doktora programlarından mezun olan öğrenciler gibi kriterlere göre
değerlendirildiğinde 30. sırada yer almaktadır (URAP, 2018).
Araştırmanın örneklemini 2015-2016 eğitim öğretim yılında Kocaeli
Üniversitesi’nde eğitim gören 1476 uluslararası öğrenciden o yıl eğitime başlayan 231
öğrenci oluşturmaktadır. Öğrencilerin çoğu Türkmenistan, Azerbaycan, Kazakistan, Kırgizistan, Tacikistan ve Özbekistan gibi Türkî Cumhuriyetlerinden gelmektedir.
Bu öğrencileri Avrupa’dan ve Afrika ülkelerinden gelen öğrenciler takip etmektedir.
Öğrencilerin 85’i (%36,8) kadın, 146’sı (%63,2) erkektir. 134’ü (%58) lisans öğrencisi, 71’i (%30,7) yüksek lisans ve 26’sı (%11,3) doktora öğrencisidir.
Araştırma sonucunda üniversitenin örgütsel itibarının örgütsel çekiciliği
(β=0.90, p=0.000) ve devam niyetini (β=0.74, p=0.000) yordadığı bulunmuştur. Bu sonuçlar, örgütsel çekiciliğin, üniversitenin örgütsel itibarı ile öğrencilerin lisans
eğitimini aldıkları üniversitede lisansüstü eğitimine devam etme niyetleri
arasındaki ilişkide kısmi bir aracı rolüne sahip olduğunu göstermektedir. Araştırmanın sonuçları, uluslararası öğrencilerin üniversitenin örgütsel itibarı,
öğrencilerin lisans eğitimini aldıkları üniversitede lisansüstü eğitimine devam
etme niyetleri ve örgütsel çekiciliğe ilişkin algıları arasında olumlu ilişkiler olduğunu ortaya koymuştur. Üniversitenin örgütsel itibarı hakkındaki algılarının
ve örgütsel çekiciliğin, aynı üniversitede lisansüstü eğitime devam niyetlerini
etkilediği görülmektedir. Araştırmanın bir başka bulgusu, uluslararası öğrencilerin üniversitenin örgütsel itibarına ilişkin algısının, üniversitenin örgütsel çekiciliğe
ilişkin algıları üzerinden aynı üniversitede lisansüstü eğitime devam etme niyetini
etkilemiş olmasıdır. Başka bir ifadeyle, üniversitenin örgütsel çekiciliğinin, üniversitenin örgütsel itibarı ile öğrencilerin lisans eğitimini aldıkları üniversitede
lisansüstü eğitimine devam etme niyetleri arasında aracılık yapan bir değişken
olduğu bulunmuştur. Araştırma kapsamında elde edilen bir diğer bulgu ise üniversitenin örgütsel itibarının alt boyutları olan akademik performansın kalitesi,
dış performansın kalitesi ve duygusal özdeşleşme boyutları ile üniversitenin
örgütsel çekiciliği ve öğrencilerin lisans eğitimini aldıkları üni versitede lisansüstü eğitimine devam etme niyetleri arasında pozitif yönde bir ilişki olmasıdır. Bunun
yanı sıra, öğrencilerin üniversitenin örgütsel itibarının alt boyutlarına ilişkin
algıları, örgütsel çekicilik ve üniversitede lisansüstü eğitime devam e tme niyetlerini doğrudan etkilemektedir. Araştırmanın sonucunda örgütsel itibarın alt
boyutlarından akademik performansın kalitesi, üniversitenin örgütsel çekiciliği ve üniversitede lisansüstü eğitime devam etme niyetini en çok etkileyen alt boyutu
olduğu bulunmuştur.
236 Soner POLAT - Gizem GUNCAVDI - Yaser ARSLAN Eurasian Journal of Educational Research 84 (2019) 213-236
Araştırmanın Sonuçları ve Önerileri: Araştırmanın sonuçları, uluslararası
öğrencilerin üniversitenin örgütsel itibarı, aynı üniversitede lisansüstü eğitime
devam etme niyeti ve örgütsel çekicilik algıları arasında olumlu ilişkiler olduğunu ortaya koymuştur. Üniversitenin örgütsel itibarı hakkındaki algıları, üniversite ve
örgütsel çekiciliğin devam etme niyetlerini doğrudan etkilediği görülmektedir.
Ayrıca, sonuçlar örgütsel çekiciliğin örgütsel itibar ve devam etme niyeti arasındaki ilişkiye aracılık ettiğini göstermiştir.
Diğer çalışmalarda olduğu gibi, bu araştırmanın bazı sınırlılıkları vardır. İlk
olarak, bu çalışma 2015-2016 akademik yıllarında Kocaeli Üniversitesine kayıtlı uluslararası öğrencilere yapılmıştır. Algılarının değişip değişmediğini anlamak için
aynı öğrencilerle 2., 3. veya 4. yıllarında başka bir araştırma yapılması önerilebilir.
Ayrıca bu çalışma yalnızca bir üniversitedeki uluslararası öğrenciler ile gerçekleştirilmiştir. Bu durumun, çalışmanın genellenebilirliğini sınırlandırdığını
söylemek mümkündür. Bu nedenle, diğer araştırmacıların daha kapsamlı bir sonuca
ulaşmak için bu araştırmayı diğer üniversitelerdeki uluslararası öğrencilerle yapmaları önerilebilir. Bu sayede çalışmanın genellenebilirliği arttırılabilecek, daha
kapsamlı veriler elde edilebilecektir.
Anahtar Kelimeler: Örgütsel itibar, örgütsel çekicilik, devam niyeti, uluslararası
öğrenciler.
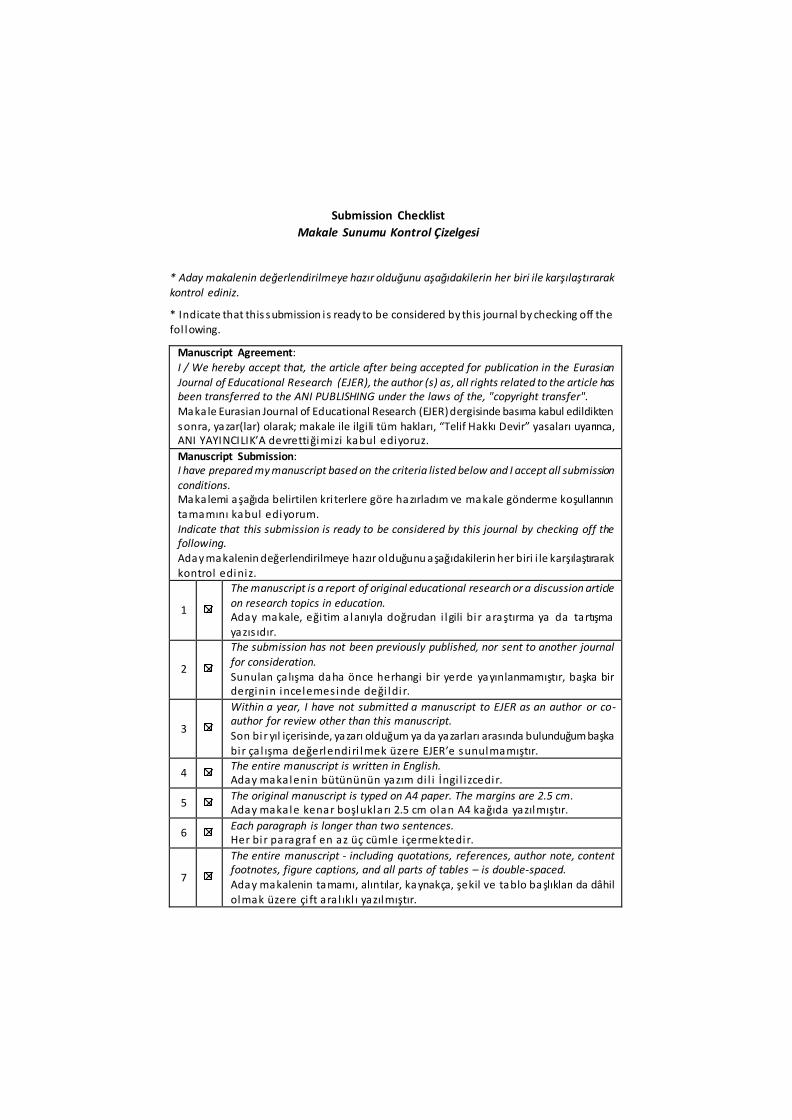
Submission Checklist
Makale Sunumu Kontrol Çizelgesi
* Aday makalenin değerlendirilmeye hazır olduğunu aşağıdakilerin her biri ile karşılaştırarak kontrol ediniz.
* Indicate that this submission is ready to be considered by this journal by checking off the fol lowing.
Manuscript Agreement: I / We hereby accept that, the article after being accepted for publication in the Eurasian Journal of Educational Research (EJER), the author (s) as, all rights related to the article has been transferred to the ANI PUBLISHING under the laws of the, "copyright transfer". Makale Eurasian Journal of Educational Research (EJER) dergisinde basıma kabul edildikten
sonra, yazar(lar) olarak; makale ile ilgili tüm hakları, “Telif Hakkı Devir” yasaları uyarınca, ANI YAYINCILIK’A devrettiğimizi kabul ediyoruz.
Manuscript Submission: I have prepared my manuscript based on the criteria listed below and I accept all submission conditions. Makalemi aşağıda belirtilen kri terlere göre hazırladım ve makale gönderme koşullarının tamamını kabul ediyorum. Indicate that this submission is ready to be considered by this journal by checking off the following. Aday makalenin değerlendirilmeye hazır olduğunu aşağıdakilerin her biri i le karşılaştırarak kontrol ediniz.
1
The manuscript is a report of original educational research or a discussion article on research topics in education. Aday makale, eği tim a lanıyla doğrudan i lgili bi r araştırma ya da tartışma yazıs ıdır.
2
The submission has not been previously published, nor sent to another journal
for consideration. Sunulan ça lışma daha önce herhangi bir yerde yayınlanmamıştır, başka bir derginin incelemes inde deği ldi r.
3
Within a year, I have not submitted a manuscript to EJER as an author or co-author for review other than this manuscript.
Son bir yıl içerisinde, yazarı olduğum ya da yazarları arasında bulunduğum başka bir ça l ışma değerlendiri lmek üzere EJER’e sunulmamıştır.
4 The entire manuscript is written in English. Aday makalenin bütününün yazım di l i İngi l i zcedir.
5 The original manuscript is typed on A4 paper. The margins are 2.5 cm. Aday makale kenar boşlukları 2.5 cm olan A4 kağıda yazılmıştır.
6 Each paragraph is longer than two sentences. Her bir paragraf en az üç cümle içermektedir.
7
The entire manuscript - including quotations, references, author note, content footnotes, figure captions, and all parts of tables – is double-spaced.
Aday makalenin tamamı, alıntılar, kaynakça, şekil ve tablo başlıkları da dâhil olmak üzere çi ft ara l ıkl ı yazılmıştır.

238 Submission Checklist
8
The submission file is in Microsoft Word document file format. 12-point Times New Roman font is used in entire manuscript.
Aday makale, tamamında 12 punto Times New Roman yazı tipi kullanılarak hazırlanmış bi r Microsoft Word dokümanıdır.
9
The text has had the authors' names removed. If an author is cited, "Author" and year are used in the bibliography and footnotes, instead of author's name, paper title, etc. The author's name has also been removed from the attached
document. Aday makale, yazar adları çıkarılarak sunulmuştur. Eğer yazar kendisine atıfta bulunduysa yazarın adına ve ça l ışma başlığına yer veri lmeyecek, sadece “Author” yazılarak ça l ışmanın yıl ı belirtilecektir. Eklenen dosyada yazar adı bel i rti lmeyecekti r.
10 The title is 10 to 12 words. Aday makalenin başl ığı 10-12 sözcük uzunluğundadır.
11
The maximum length of the manuscript-including structured abstract in English,
tables, and references is 6000 words. This limitation does not include Turkish extended abstract (750-1000 words) which is placed after the references section. Aday makale, İngilizce abstract, tablolar ve kaynakça vb. tüm ögeler dâhil olmak üzere en fazla 6000 sözcüktür. Kaynakça’nın ardından yer verilen uzun Türkçe özet (750-1000 sözcük) bu sayıya dâhi l deği ldi r.
12
The article is preceded by English Structured Abstract of not more than 250 words and not less than 200 using five required headings: Purpose: State the problem in field. Then explain the purpose of the study. Method: Specify the research design, sample, and research instrument and data analysis in brief. Findings: Highlight the significant, interesting or surprising results . Implications for Research and Practice. (These headings may need some adaptation in the case of discussion papers: Background, Purpose of Study, Sources of Evidence, Main Argument, and Conclusions) . More information
ava ilable from http://www.tandf.co.uk/journals/authors/rereabstracts.asp Yapılandırılmış İngilizce öz 200-250 sözcük uzunluğunda olup, aday makalenin başında yer almakta ve Purpose (İlk önce alanda karşılaşılan sorunu belirtelim. Daha sonra araştırmanın amacını bir cümle ile veriniz ), Method (Araştırma deseni, örneklem, very taoplama aracı ve verilerin analizinini kısaca açıklayınız), Findings (En önemli ve çarpıcı araştırma bulgularını verelim) Implications for Research and Practice, (Uygulama ve ileriye dönük
araştırmalar için olası çıkarımlarınız ) başl ıklarını içermektedir. Bu başlıklar tartışma yazıları için: Çalışmanın Temeli, Çalışmanın Amacı, Kanıt Kaynakları, Ana Tartışma ve Sonuçlar şekl inde olabilir. Daha fazla bilgi i çin;
http://www.tandf.co.uk/journals/authors/rereabstracts.asp adresine başvurunuz.
13
Following the structured abstract in English four to six keywords are included. They should represent the content of your manuscript and be specific to your field or sub-field. Avoid using keywords form the title of the paper.
Yapılandırılmış İngilizce özden sonra 4-6 anahtar sözcüğe yer verilmiştir. Anahtar kel imeler ça lışmanızı temsil etmeli ve kendi a lanınıza ya da a lt a lanlara özgü
olmalıdır. Makale adındaki kavramları anahtar kelime olarak seçmekten kaçınınız.
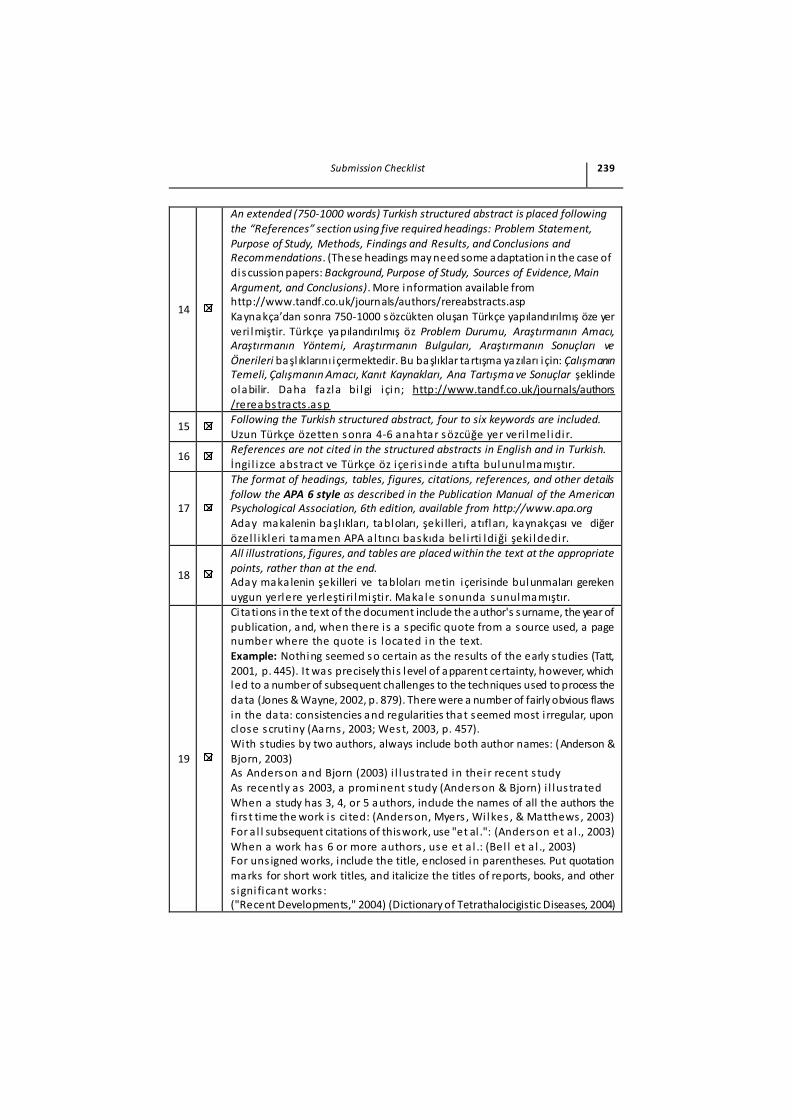
Submission Checklist 239
14
An extended (750-1000 words) Turkish structured abstract is placed following the “References” section using five required headings: Problem Statement,
Purpose of Study, Methods, Findings and Results, and Conclusions and Recommendations. (These headings may need some adaptation in the case of discussion papers: Background, Purpose of Study, Sources of Evidence, Main
Argument, and Conclusions). More information available from http://www.tandf.co.uk/journals/authors/rereabstracts.asp
Kaynakça’dan sonra 750-1000 sözcükten oluşan Türkçe yapılandırılmış öze yer veri lmiştir. Türkçe yapılandırılmış öz Problem Durumu, Araştırmanın Amacı, Araştırmanın Yöntemi, Araştırmanın Bulguları, Araştırmanın Sonuçları ve
Önerileri başl ıklarını i çermektedir. Bu başlıklar tartışma yazıları i çin: Çalışmanın Temeli, Çalışmanın Amacı, Kanıt Kaynakları, Ana Tartışma ve Sonuçlar şeklinde
olabilir. Daha fazla bi lgi i çin; http://www.tandf.co.uk/journals/authors /rereabstracts .asp
15 Following the Turkish structured abstract, four to six keywords are included.
Uzun Türkçe özetten sonra 4-6 anahtar sözcüğe yer veri lmel idi r.
16 References are not cited in the structured abstracts in English and in Turkish.
İngi l i zce abstract ve Türkçe öz içeris inde atıfta bulunulmamıştır.
17
The format of headings, tables, figures, citations, references, and other details follow the APA 6 style as described in the Publication Manual of the American Psychological Association, 6th edition, available from http://www.apa.org Aday makalenin başl ıkları, tabloları, şeki lleri, atıfları, kaynakçası ve diğer
özel l ikleri tamamen APA a l tıncı baskıda bel i rti ldiği şeki ldedir.
18
All illustrations, figures, and tables are placed within the text at the appropriate points, rather than at the end. Aday makalenin şekilleri ve tabloları metin içerisinde bulunmaları gereken uygun yerlere yerleşti ri lmişti r. Makale sonunda sunulmamıştır.
19
Ci tations in the text of the document include the author's surname, the year of publication, and, when there i s a specific quote from a source used, a page number where the quote i s located in the text.
Example: Nothing seemed so certain as the results of the early s tudies (Tatt, 2001, p. 445). It was precisely this level of apparent certainty, however, which led to a number of subsequent challenges to the techniques used to process the
data (Jones & Wayne, 2002, p. 879). There were a number of fairly obvious flaws in the data: consistencies and regularities that seemed most i rregular, upon close scrutiny (Aarns , 2003; West, 2003, p. 457). With s tudies by two authors, always include both author names: (Anderson & Bjorn, 2003) As Anderson and Bjorn (2003) i l lustrated in their recent s tudy As recently as 2003, a prominent s tudy (Anderson & Bjorn) i l lustrated
When a study has 3, 4, or 5 authors, include the names of all the authors the fi rs t time the work i s ci ted: (Anderson, Myers , Wi lkes , & Matthews, 2003) For a l l subsequent citations of this work, use "et al .": (Anderson et a l ., 2003)
When a work has 6 or more authors , use et a l .: (Bel l et a l ., 2003) For uns igned works, include the title, enclosed in parentheses. Put quotation
marks for short work titles, and italicize the titles of reports, books, and other s igni ficant works : ("Recent Developments," 2004) (Dictionary of Tetrathalocigistic Diseases, 2004)
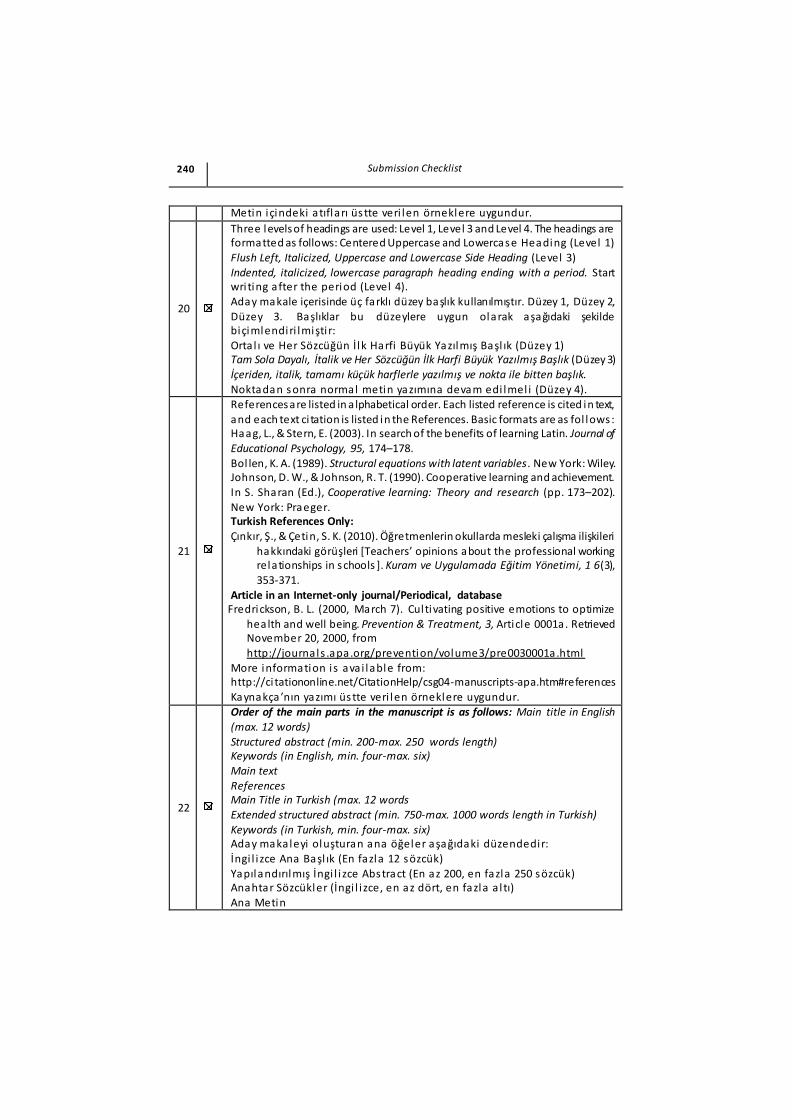
240 Submission Checklist
Metin içindeki atıfları üstte veri len örneklere uygundur.
20
Three levels of headings are used: Level 1, Level 3 and Level 4. The headings are formatted as follows: Centered Uppercase and Lowercase Heading (Level 1) Flush Left, Italicized, Uppercase and Lowercase Side Heading (Level 3) Indented, italicized, lowercase paragraph heading ending with a period. Start wri ting after the period (Level 4). Aday makale içerisinde üç farklı düzey başlık kullanılmıştır. Düzey 1, Düzey 2,
Düzey 3. Başlıklar bu düzeylere uygun olarak aşağıdaki şekilde biçimlendiri lmişti r: Orta l ı ve Her Sözcüğün İlk Harfi Büyük Yazılmış Başl ık (Düzey 1) Tam Sola Dayalı, İtalik ve Her Sözcüğün İlk Harfi Büyük Yazılmış Başlık (Düzey 3) İçeriden, italik, tamamı küçük harflerle yazılmış ve nokta ile bitten başlık.
Noktadan sonra normal metin yazımına devam edi lmel i (Düzey 4).
21
References are listed in a lphabetical order. Each listed reference is cited in text, and each text ci tation is listed in the References. Basic formats are as fol lows: Haag, L., & Stern, E. (2003). In search of the benefits of learning Latin. Journal of Educational Psychology, 95, 174–178.
Bol len, K. A. (1989). Structural equations with latent variables. New York: Wiley. Johnson, D. W., & Johnson, R. T. (1990). Cooperative learning and achievement. In S. Sharan (Ed.), Cooperative learning: Theory and research (pp. 173–202).
New York: Praeger. Turkish References Only: Çınkır, Ş., & Çetin, S. K. (2010). Öğretmenlerin okullarda mesleki çalışma ilişkileri
hakkındaki görüşleri [Teachers’ opinions about the professional working relationships in schools ]. Kuram ve Uygulamada Eğitim Yönetimi, 1 6(3),
353-371. Article in an Internet-only journal/Periodical, database
Fredrickson, B. L. (2000, March 7). Cultivating positive emotions to optimize
health and well being. Prevention & Treatment, 3, Article 0001a. Retrieved November 20, 2000, from
http://journals .apa.org/prevention/volume3/pre0030001a.html More information is ava i lable from: http://ci tationonline.net/CitationHelp/csg04-manuscripts-apa.htm#references
Kaynakça ’nın yazımı üstte veri len örneklere uygundur.
22
Order of the main parts in the manuscript is as follows: Main title in English
(max. 12 words) Structured abstract (min. 200-max. 250 words length) Keywords (in English, min. four-max. six)
Main text References Main Title in Turkish (max. 12 words Extended structured abstract (min. 750-max. 1000 words length in Turkish) Keywords (in Turkish, min. four-max. six) Aday makaleyi oluşturan ana öğeler aşağıdaki düzendedir: İngi l i zce Ana Başl ık (En fazla 12 sözcük)
Yapılandırılmış İngi l i zce Abstract (En az 200, en fazla 250 sözcük) Anahtar Sözcükler (İngi l i zce, en az dört, en fazla a l tı) Ana Metin
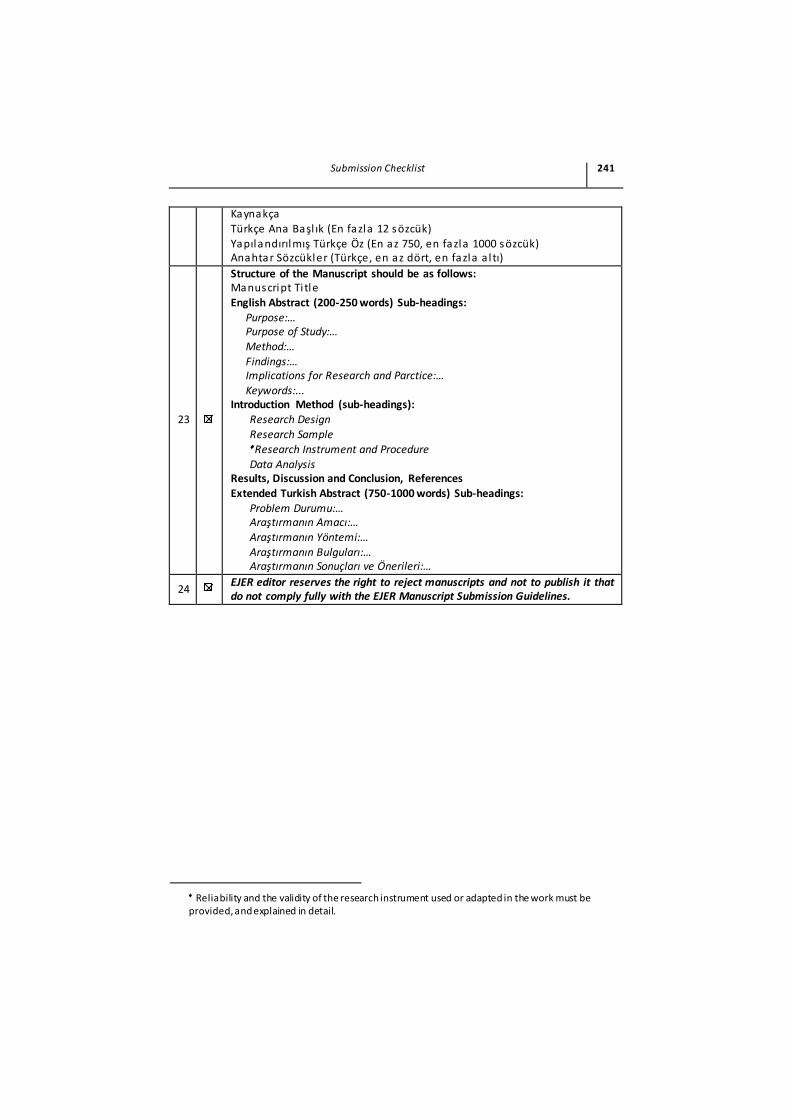
Submission Checklist 241
Kaynakça Türkçe Ana Başl ık (En fazla 12 sözcük)
Yapılandırılmış Türkçe Öz (En az 750, en fazla 1000 sözcük) Anahtar Sözcükler (Türkçe, en az dört, en fazla a l tı)
23
Structure of the Manuscript should be as follows: Manuscript Ti tle English Abstract (200-250 words) Sub-headings:
Purpose:… Purpose of Study:… Method:…
Findings:… Implications for Research and Parctice:…
Keywords:... Introduction Method (sub-headings):
Research Design
Research Sample Research Instrument and Procedure
Data Analysis Results, Discussion and Conclusion, References Extended Turkish Abstract (750-1000 words) Sub-headings:
Problem Durumu:… Araştırmanın Amacı:…
Araştırmanın Yöntemi:… Araştırmanın Bulguları:… Araştırmanın Sonuçları ve Önerileri:…
24 EJER editor reserves the right to reject manuscripts and not to publish it that do not comply fully with the EJER Manuscript Submission Guidelines.
Reliability and the validity of the research instrument used or adapted in the work must be provided, and explained in detail.
242 Submission Checklist
SUBSCRIPTION/ABONELİK
Annually / Yıllık
Individual / Kişi Aboneliği ....................................................... : 200 TL
Institution / Kurum Aboneliği .................................................. : 600 TL
Abroad / Yurtdışı Aboneliği: .................................................... : 300 $ Student / Öğrenci Aboneliği: ................................................... : 150 TL
For single issue / Tek sayılar için
Individual / Kişiler ................................................................. : 40 TL
Institution / Kurumlar ............................................................ : 140 TL
Payment / Ödeme
Dollar ($) Account / Dolar Hesabı
Account Information for Payment Account Name: Anı Yay. Rek. Dan. Eğit. Ltd. Şti.
Bank Name: Is Bank
IBAN Number: TR82 0006 4000 0024 2141 3300 29 SWIFT CODE: ISBKTRISXXX
TURKEY
Turkish Lira (TL) Account / Türk Lirası Hesabı
Banka: İşbank
Hesap Adı: Anı Yay. Rek. Dan. Eğit. Ltd. Şti. Şube Kodu: 4214
Hesap No: 962561
IBAN: TR14 0006 4000 0014 2140 9625 61


Related Documents