Euler Diagram-based Notations John Howse, Richard Bosworth, Andrew Fish, Gem Stapleton, John Taylor Visual Modelling Group, University of Brighton, Brighton, UK http://www.cmis.brighton.ac.uk/research/vmg/ [email protected], [email protected], [email protected], [email protected], [email protected] Peter Rodgers, Simon Thompson Computing Laboratory, University of Kent, Canterbury, UK http://www.cs.kent.ac.uk/projects/rwd/ [email protected], [email protected] Abstract. Euler diagrams have been used for centuries as a means for conveying logical statements in a simple, intuitive way. They form the basis of many diagrammatic notations used to represent set-theoretic relationships in a wide range of contexts including software modelling, logical reasoning systems, statistical data representation, database search queries and file system management. In this paper we survey notations based on Euler diagrams with particular emphasis on formalization and the development of software tool support. Keywords Visual formalisms, diagrammatic reasoning, automated rea- soning, software specification, information visualization 1 Introduction Euler diagrams [7] are a simple and familiar visual language for expressing logical or set-theoretic statements. They exploit topological properties of enclosure, exclusion and intersection to represent subset, disjoint sets and set intersection respectively. For example, the Euler diagram d 1 in figure 1 asserts that C is a subset of A and that B and C are disjoint. An Euler diagram consists of a collection of contours (closed curves, usually considered to be simple). A zone (sometimes called a minimal region ) is a set of points in the plane that can be described by a two-way partition of the contour set. For example, in d 1 in figure 1, the set of points in the plane inside A and C but outside B is a zone. Zones in Euler diagrams represent sets and the union of all the sets represented by the zones in a diagram is the universal set. A “missing” zone represents the empty set. For example, in d 1 in figure 1 the zone that is inside B and C but outside A is missing and hence no element is in B and C but not in A. Some semantic interpretations of Euler diagrams specify that each zone in a diagram represents a non-empty set [44], whereas others do

Welcome message from author
This document is posted to help you gain knowledge. Please leave a comment to let me know what you think about it! Share it to your friends and learn new things together.
Transcript

Euler Diagram-based Notations
John Howse, Richard Bosworth, Andrew Fish, Gem Stapleton, John Taylor
Visual Modelling Group, University of Brighton, Brighton, UKhttp://www.cmis.brighton.ac.uk/research/vmg/
[email protected], [email protected],
[email protected], [email protected],
Peter Rodgers, Simon Thompson
Computing Laboratory, University of Kent, Canterbury, UKhttp://www.cs.kent.ac.uk/projects/rwd/ [email protected],
Abstract. Euler diagrams have been used for centuries as a means forconveying logical statements in a simple, intuitive way. They form thebasis of many diagrammatic notations used to represent set-theoreticrelationships in a wide range of contexts including software modelling,logical reasoning systems, statistical data representation, database searchqueries and file system management. In this paper we survey notationsbased on Euler diagrams with particular emphasis on formalization andthe development of software tool support.
Keywords Visual formalisms, diagrammatic reasoning, automated rea-soning, software specification, information visualization
1 Introduction
Euler diagrams [7] are a simple and familiar visual language for expressing logicalor set-theoretic statements. They exploit topological properties of enclosure,exclusion and intersection to represent subset, disjoint sets and set intersectionrespectively. For example, the Euler diagram d1 in figure 1 asserts that C is asubset of A and that B and C are disjoint.An Euler diagram consists of a collection of contours (closed curves, usually
considered to be simple). A zone (sometimes called a minimal region) is a set ofpoints in the plane that can be described by a two-way partition of the contourset. For example, in d1 in figure 1, the set of points in the plane inside A and C
but outside B is a zone. Zones in Euler diagrams represent sets and the unionof all the sets represented by the zones in a diagram is the universal set. A“missing” zone represents the empty set. For example, in d1 in figure 1 the zonethat is inside B and C but outside A is missing and hence no element is in B
and C but not in A. Some semantic interpretations of Euler diagrams specifythat each zone in a diagram represents a non-empty set [44], whereas others do

2
A B
C
A B
C
d 1 d 2
Fig. 1. Euler and Venn diagrams
not impose this restriction [27]. A discussion of the semantics of Euler diagramscan be found in [28].
Venn diagrams [73] are a special case of Euler diagrams. However, instead ofusing missing zones to express that a set is empty, shading is used. All possibleset intersections are represented in Venn diagrams. The Venn diagram d2 infigure 1 represents the same information as the Euler diagram d1 in figure 1. Asurvey of work on Venn diagrams can be found at [53].
Given certain well-formedness conditions on Euler diagrams (such as contoursmust be simple), there are statements involving set intersections that Euler dia-grams cannot express, identified in [43, 75], because there is no drawable diagramwith a specified zone set. Venn proposed a constructive method for drawing anyVenn diagram on n contours [74] which More proved to be valid [45].
Work on reasoning about diagrams expressing logical or set-theoretical prop-erties has a long history, which has been reinvigorated in the last decade. In sem-inal work, Shin [57] demonstrated that diagrammatic reasoning systems could beprovided with the logical status of sentential systems. Many other diagrammaticreasoning systems have since been developed and in section 2 we discuss someof them.
Euler diagrams form the basis of many diagrammatic notations used to rep-resent set-theoretic relationships in a wide range of contexts including softwaremodelling, logical reasoning systems, statistical data representation, databasesearch queries, file system management and representing ontologies. In section 3we discuss some of these applications. For formal diagrammatic modelling andreasoning to be taken up in industry, good tool support is essential. In section 4we review the state of the art in software tool support.
2 Notations
In this section, we consider some of the notations developed from Euler andVenn diagrams. Reasoning systems have been developed for many of these sys-tems and in some cases expressiveness results have been obtained. A survey ofreasoning systems based on Euler diagrams can be found at [58].

3
Basic Euler diagrams A simple sound, complete and decidable reasoning sys-tem based on Euler diagrams is given by Hammer in [27]. The system has justthree reasoning rules: the rule of erasure (of a contour), the rule of introduction
of a new contour and the rule of weakening (which introduces a zone).Projections Further syntax, in the form of dashed contours called projections,can be added to Euler diagrams (or notations based on Euler diagrams) thatenables them to make statements more concisely in a less cluttered manner [23–25]. A reasoning system with projections has been developed [38]. A measureof clutter in Euler diagrams is suggested in [39], in which a clutter reducingalgorithm is presented.
Extensions of Venn diagrams Venn diagrams cannot assert the existence ofelements nor express disjunctive information. To overcome this, Peirce modifiedVenn diagrams by introducing the symbol x into the system to represent theexistence of an element in a set and o to represent emptiness instead of shad-ing [49]. Peirce also uses lines to connect x’s and o’s, to represent disjunctiveinformation.Shin [57] adapted Venn-Peirce diagrams by reverting back to Venn’s shading
to represent the emptiness of a set rather than using o-sequences, making herVenn-I language less expressive than the Venn-Peirce language. The Venn-I dia-gram d1 in figure 2 asserts that there is an element that is a student or a teacherbut not both, and the set of Teachers is empty. Shin defines six sound reason-ing rules for Venn-I and proves completeness. Venn-I cannot express statementsof the form A ⊆ B ∨ A * C, so Shin extends it to a more expressive system,called Venn-II, by allowing Venn-I diagrams to be connected by straight linesto represent disjunction. Shin defines ten reasoning rules for Venn-II and showsthat they form a sound and complete set. The Venn-II system is equivalent tomonadic first order logic (without equality) [57]. Recently the Venn-II systemhas been extended to include constants [1].
S t u d e n t s T e a c h e r s
d 1
S t u d e n t s T e a c h e r s
d 2
b o b b o b
S t u d e n t s T e a c h e r s
d 3
Fig. 2. Venn-I, Euler/Venn and spider diagrams
Euler/Venn Diagrams Euler/Venn diagrams [66] are similar to Venn-I dia-grams but are based on Euler diagrams rather than Venn diagrams, and constant
sequences are used instead of ⊗-sequences. The Euler/Venn diagram d2 in fig-ure 2 asserts that bob is a student or a teacher but not both and that there are
4
no teachers. In [66], Swoboda gives a set of sound reasoning rules for Euler/Venndiagrams. These rules are extensions of those given by Shin and Hammer [27,57]. In [69] Swoboda and Allwein give an algorithm that determines if a givenEuler/Venn monadic first order formula is ‘observable’ from a given diagram[70].Information is observable from a diagram if it is explicitly represented in the di-agram. Observable formulae are consequence of the information contained in thediagram.
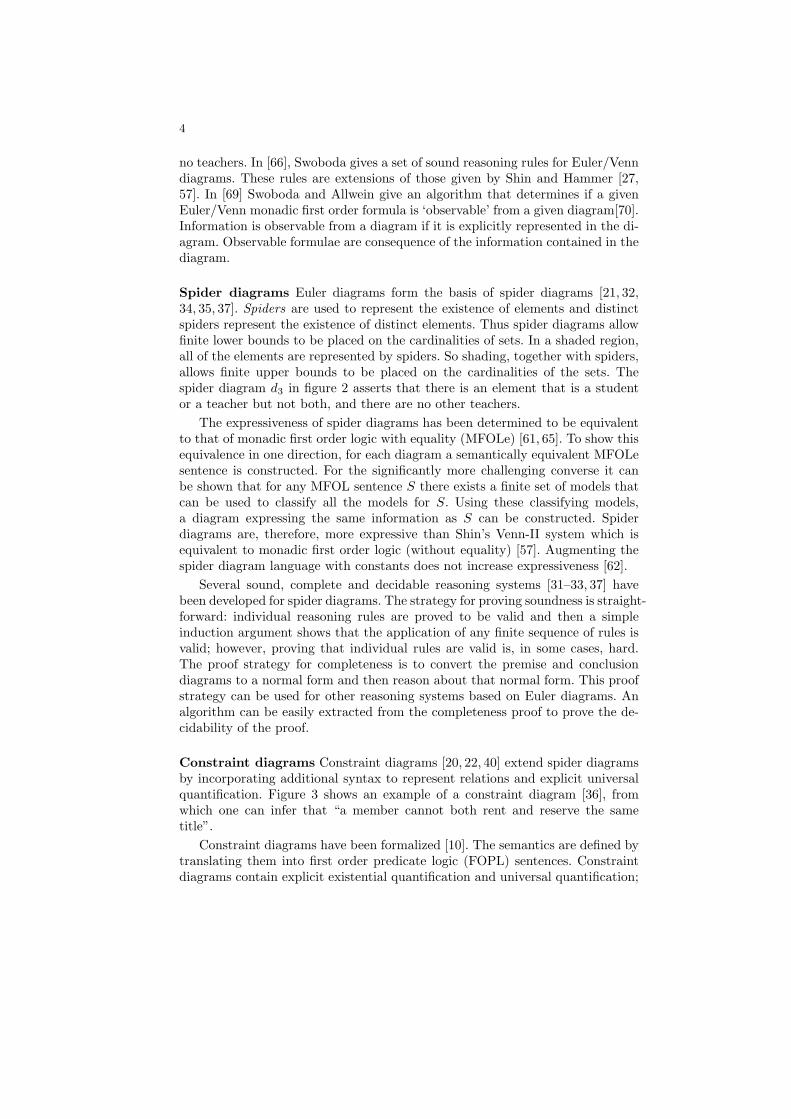
Spider diagrams Euler diagrams form the basis of spider diagrams [21, 32,34, 35, 37]. Spiders are used to represent the existence of elements and distinctspiders represent the existence of distinct elements. Thus spider diagrams allowfinite lower bounds to be placed on the cardinalities of sets. In a shaded region,all of the elements are represented by spiders. So shading, together with spiders,allows finite upper bounds to be placed on the cardinalities of the sets. Thespider diagram d3 in figure 2 asserts that there is an element that is a studentor a teacher but not both, and there are no other teachers.
The expressiveness of spider diagrams has been determined to be equivalentto that of monadic first order logic with equality (MFOLe) [61, 65]. To show thisequivalence in one direction, for each diagram a semantically equivalent MFOLesentence is constructed. For the significantly more challenging converse it canbe shown that for any MFOL sentence S there exists a finite set of models thatcan be used to classify all the models for S. Using these classifying models,a diagram expressing the same information as S can be constructed. Spiderdiagrams are, therefore, more expressive than Shin’s Venn-II system which isequivalent to monadic first order logic (without equality) [57]. Augmenting thespider diagram language with constants does not increase expressiveness [62].
Several sound, complete and decidable reasoning systems [31–33, 37] havebeen developed for spider diagrams. The strategy for proving soundness is straight-forward: individual reasoning rules are proved to be valid and then a simpleinduction argument shows that the application of any finite sequence of rules isvalid; however, proving that individual rules are valid is, in some cases, hard.The proof strategy for completeness is to convert the premise and conclusiondiagrams to a normal form and then reason about that normal form. This proofstrategy can be used for other reasoning systems based on Euler diagrams. Analgorithm can be easily extracted from the completeness proof to prove the de-cidability of the proof.
Constraint diagrams Constraint diagrams [20, 22, 40] extend spider diagramsby incorporating additional syntax to represent relations and explicit universalquantification. Figure 3 shows an example of a constraint diagram [36], fromwhich one can infer that “a member cannot both rent and reserve the sametitle”.
Constraint diagrams have been formalized [10]. The semantics are defined bytranslating them into first order predicate logic (FOPL) sentences. Constraintdiagrams contain explicit existential quantification and universal quantification;

5
T i t l eM e m b e rR e n t a l
R e s e r v a t i o n
*
Fig. 3. Modelling with Constraint diagrams
it is not always possible to determine the order in which to read the quantifiers,sometimes rendering a diagram ambiguous. This ordering problem was solvedby augmenting the language with reading trees, essentially a partial order on thequantifiers, to disambiguate the diagrams [9, 10]. The tree provide additionalinformation that is essential for the construction of the FOPL sentence deter-mining where the brackets are placed and, in conjunction with the diagram, thescope of the quantifiers. Figure 4 shows two augmented diagrams with the twointerpretations: “For each teacher there is a student who attends only coursestaught by that teacher” and “There is a student who attends only courses taughtby all teachers”, respectively.
T e a c h e r s S t u d e n t sC o u r s e s
t e a c h e s a t t e n d s
*xs
T e a c h e r s S t u d e n t sC o u r s e s
t e a c h e s a t t e n d s
*xs
* xP T C s* x sP T C
Fig. 4. Augmented constraint diagrams
A constraint diagram may have many reading trees, which can be automati-cally generated [11]. A set of sound rules for constraint diagrams augmented withreading trees has been developed [8] and a default reading has been proposed [12]and tested [13].Two sound, complete and decidable fragments of the constraint diagram lan-
guage have been defined [59, 60]. The diagrams in these fragments do not requirereading trees, but still include arrows (representing two-place predicates) and oneof them includes explicit universal quantification [59]. Some of the reasoning rulesfor these two systems extend those defined for spider diagrams and additionalrules are also defined to give complete systems. The proofs of completeness forthese systems are complex.
Hybrid systems A hybrid language, called visual first order logic (VFOL),which mixes textual and diagrammatic notations, has been defined [64]. VFOL

6
modifies the constraint diagram language. A sound and complete reasoning sys-tem for VFOL has been developed and the language has been shown to beequivalent in expressive power to FOPL. There is an algorithmic method forconverting a statement made in VFOL into a statement made in FOPL andvice versa. This algorithm can be used to provide a sound and complete hybridsystem based on VFOL and FOPL.
Swoboda and Allwein have developed a heterogeneous Euler/Venn diagramand first order logic reasoning system [67, 68].
Abstract syntax In reasoning systems based on spider diagrams and constraintdiagrams a distinction is made between the concrete syntax (the drawn dia-grams) and the abstract syntax (a mathematical abstraction of concrete dia-grams) [30]; this distinction is not evident in purely textual logics. Reasoningtakes place at the abstract level; a motivation for this is that well-formednessconditions may cause problems with the applications of some of the rules at theconcrete level; see [56] for an example of this from Shin’s Venn II system. Usingan abstract syntax brings with it, importantly, a level of precision and rigourthat is not always present in diagrammatic systems.
3 Applications
In this section we discuss applications in the following areas: software modelling,visualizing genetic set relations, statistical data representation, database searchqueries, file system management, hardware specification and representing on-tologies.
Software modelling The standard notation for modelling software systems isthe Unified Modelling Language (UML) [47]. Diagrammatic notations pervadethe UML. Some of these notations are based on Euler diagrams such as Classdiagrams and State diagrams. The principal tool for the UML modeller to addconstraints to a model is the Object Constraint Language (OCL) [76]. How-ever, OCL is a fusion of navigation expressions and traditional logical notation,rendered in textual form. Constraint diagrams were designed to be a formal di-agrammatic alternative to the OCL and can also be used to specify softwaresystems independently of the UML. In [36] a case study is developed which usesa schema notation, developed from a Z -like notation [54, 55], to specify opera-tions. Constraint diagrams are used within this schema notation, showing thatthey can handle dynamic constraints. An event (a state-changing operation) isspecified in terms of a pre-condition (above the double line) and a post-condition(below the double line). The following schema specifies the addition of a newmember m with associated information i:

7
NewMember(m, i)
I
i;
M e m b
m
M
M e m b ' I n f o '
m i
The pre-condition ensures that argument i has type I, and that argument m
has type M and is not in Memb (is not already a member). The semi-colon isa separator; the two diagrams in the pre-condition are conjoined. In the post-condition, dashed names denote entities that are changed. The post-conditionensures that m is now in Memb and has associated information i.
Statistical data representation To enable the visualization of statistical data,area-proportional Venn or Euler diagrams [2, 3] may be used, where the area ofa region is proportional to the size of the set it represents. Figure 5 shows twoVenn diagrams representing weighted data sets, where the right hand diagramis area proportional.
Fig. 5. Statistical Data representations
Visualizing genetic set relations The diagram in figure 6 shows an Eulerdiagram with a large number of curves being used to visualize complex geneticset relations [41].
Database search queries figure 7 shows two Euler diagrams being used inlibrary environments [71]. The diagram on the left uses numbers to indicate thecardinality of each set, including 0 to represent emptiness. The diagram on theright uses “missing” zones to represent empty categories, and allows the curvesto be concurrent. This application is based on theoretical work in [75], where an

8
Fig. 6. Visualizing genetic set relations
Fig. 7. Traditional Library Environments
existence proof of the drawability of (a slight variant of) any Euler diagram rep-resenting less than nine sets is given; an example of an undrawable diagram onnine sets is also presented. This is an extension of work by Lemon and Pratt [44]and is based on Kuratowski’s theorem for planar graphs [42].
File system management Euler diagrams have been used to represent non-hierarchical directories, replacing the traditional hierarchical structure of file-systems with an Euler diagram based approach [5, 6]. An example from theVENNFS system may be seen in figure 8, where the dots placed within a regionof overlap of the contours represent files that are in more than one directory.
Hardware specification Spider diagrams have been used in the specification ofboiler systems [4]; an example related to the safety of power supply componentscan be seen in figure 9.

9
Fig. 8. VennFS2
Fig. 9. Safety critical boiler systems
Ontology representation Euler-based diagrams have been used to representontologies in semantic web applications [50, 29]. Figure 10 shows an examplerepresenting specified values in OWL, theWeb Ontology Language. This diagramis a variant of a constraint diagram. Another example can be seen in figure 11from a new environment COE, the Collaborative Ontology Environment, forcapturing and formally representing expert knowledge for use in the SemanticWeb [29].
4 Software Tools
An open source tool for drawing and manipulating Euler diagrams and theirextensions can be downloaded from SourceForge.net and at [51]. The editor pro-

10
Fig. 10. web ontology language example
Fig. 11. Collaborative Ontology Environment example
vides diagram drawing facilities such as editing, cut and paste, and zoomingfunctionality. Diagrams can be laid out automatically and stored in XML for-mat. Associated software tools produced include diagrammatic theorem provers,translators and automatic diagram generators.
Users can access the reasoning functionality from the editor. The interfaceprovides access to theorem provers and allows users to write their own proofs.Tableaux [48] give users a way of visualizing the meaning of a particular dia-gram, by showing the ways that a diagram can be satisfied. In particular tableaux

11
provide decision procedures for diagram satisfiability and validity. In order tosupport this varied functionality the software provides sophisticated support forrepresenting and modifying both abstract diagrams (without layout informa-tion) and concrete diagrams (with layout information). In addition, translationsbetween diagrammatic and textual representations have been implemented.
The layout of diagrams is of fundamental importance to diagrammatic rea-soning systems. Their automatic layout poses several non-trivial challenges. Forexample, the problem of automatically generating concrete Euler diagrams fromabstract descriptions is hard. Algorithm exist to generate concrete diagramssubject to some well-formedness conditions [14, 3]. The mechanisms have beenintegrated to produce an enhanced diagram generation framework [51, 72]. Thetheory developed on nested diagrams [15] has been integrated into this frame-work.
Automatically generated Euler diagrams are typically not very readable andcan be visually unattractive. A function has been implemented to make the dia-grams more usable by modifying their layout, whilst maintaining their abstractsyntax [18]. Further work introduced a force based method for laying out graphsin Euler diagrams [46], enabling the drawing of spider and constraint diagrams.Furthermore, a key application of the layout work is to visualize sequences ofdiagrams, such as proofs. For this application (and others), it is desirable tomake subsequent diagrams look as similar as possible to previous diagrams. Amechanism to achieve this has been implemented [52].
Gil and Sorkin have also developed an effective but slightly limited editor fordrawing and manipulating constraint diagrams [26].
Automated theorem proving An automated theorem prover has been im-plemented and evaluated that uses four different Euler diagram reasoning sys-tems [63]. It uses heuristics to guide it through the search space to find shortestproofs. The theorem prover has been empirically evaluated in terms of time takento find a shortest proof, using each of the four rule sets. The conclusion from thisevaluation is that in order to find a shortest proof most quickly, the rule set usedis dependent on the proof task [63]. This work on automated reasoning lays thefoundations for efficient proof searches to be conducted in many diagrammaticsystems.
For spider diagrams, a direct proof writing algorithm can be extracted fromthe completeness proof strategy given in [37]. An improved version of this algo-rithm includes functionality to produce counter examples whenever there is noproof [19]. The proofs produced by this algorithm can sometimes be unnecessar-ily long. In [17] the A∗ search algorithm is utilized to produce shortest proofs ina fragment of the spider diagram language and the work has been extended tothe full spider diagram language [16].
12
5 Conclusion
This paper has reviewed and discussed some of the notations based on Euler dia-grams that have been developed recently. Whilst we have not given an exhaustivereview, due to space constraints, we have presented an informative overview ofcurrent Euler diagrams research. We have concentrated on notations that havebeen formalized and tried to give a flavour of the applications of these notationswhich include data representation and database search queries. A growing appli-cation area which will become increasingly important is the application of Eulerdiagrams to visualize information in the context of the semantic web, includingOWL and description logic.Euler diagram based modelling notations have been developed that are suf-
ficiently expressive to be used in software specification on an industrial scale.The development of good software tools, some of which has been described inthis paper, is a major advance towards providing sufficient support for the useof these notations in industry.Research into Euler diagram based notations could be beneficial in other
areas. For example, the investigation of decidable fragments of the constraintdiagram notation may well deliver previously unknown decidable fragments offirst order predicate logic, because “natural” fragments of the diagrammatic no-tation may not coincide with “natural” fragments of traditional logic.
Acknowledgements Much of the authors’ work described in this paper wasdeveloped on the Reasoning with Diagrams project [51, 72] funded by the UKEPSRC under grants GR/R63509 and GR/R63516. Gem Stapleton is supportedby a Fellowship from the Leverhulme Trust. We would like to thank Marie-LuceViaud, Stirling Chow, Hans Kestler, Rosario De Chiara and Robin Clark forpermission to use figures from their work.
References
1. L. Choudhury and M. Chakraborty. On Extending Venn Diagrams by AugmentingNames of Individuals. Proc. Diagrams 2004, LNAI 2980, pp 142–146, 2004.
2. S. Chow and F. Ruskey. Drawing Area Proportional Venn and Euler Diagrams.Proceedings of Graph Drawing 2003. LNCS 2912, pp. 466-477, 2004.
3. S. Chow and F. Ruskey. Towards a General Solution to Drawing Area-ProportionalEuler Diagrams. Proceedings of Euler Diagrams 2004. Electronic Notes in Theo-retical Computer Science 134, pp. 3-18, 2005.
4. R.P. Clark. Failure mode modular de-composition using spider diagrams. Proc.Euler Diagrams 04, ENTCS 134 pp 19–31, 2005.
5. U. Erra, R. De Chiara and V. Scarano. VENNFS: A venn diagram file manager.Proc. Information Visualisation, pp 120–126. IEEE, 2003.
6. U. Erra, R. De Chiara and V. Scarano. A system for virtual directories using eulerdiagrams. Proc. Euler Diagrams 04, ENTCS 134, pp 33-53, 2005.
7. L. Euler. Lettres a une princesse dallemagne sur divers sujets de physique et dephilosophie. Letters, 2:102–108, Berne, Socit Typographique, 1775.

13
8. A. Fish and J. Flower. Investigating reasoning with constraint diagrams. In VisualLanguage and Formal Methods, ENTCS 127 pp 53–69, Elsevier, 2004.
9. A. Fish, J. Flower and J. Howse. A reading algorithm for constraint diagrams. Proc.Human Centric Computing Languages and Environments, pp 161–168. IEEE, 2003.
10. A. Fish, J. Flower and J. Howse. The semantics of augmented constraint diagrams.Journal of Visual Languages and Computing, 16:541–573, 2005.
11. A. Fish and J. Howse. Computing reading trees for constraint diagrams. Proc.AGTIVE ’03, Applications of Graph Transformations with Industrial Relevance,pp 260–274. Springer, 2003.
12. A. Fish and J. Howse. Towards a default reading for constraint diagrams. IProc.Diagrams 2004, LNAI 2980, pp 51–65. Springer, 2004.
13. A. Fish and J. Masthoff. An experimental study into the default reading of con-straint diagrams. Proc. Visual Languages and Human Centric Computing, pp287–289, 2005.
14. J. Flower and J. Howse. Generating Euler diagrams. Proc. Diagrams 2002, pp61–75. Springer 2002.
15. J. Flower, J. Howse and J. Taylor. Nesting in Euler diagrams: syntax, semanticsand construction. Journal of Software and Systems Modelling, 3:55–67, 2004.
16. J. Flower, J. Masthoff and G. Stapleton. Generating proofs with spider diagramsusing heuristics. Proc. Visual Languages and Computing, pp 279–285. KnowledgeSystems Institute, 2004.
17. J. Flower, J. Masthoff and G. Stapleton. Generating readable proofs: A heuristicapproach to theorem proving with spider diagrams. Proc. of Diagrams 2004, pp166–181. Springer, 2004.
18. J. Flower, P. Rodgers and P. Mutton. Layout metrics for Euler diagrams. Proc. 7thInternational Conference on Information Visualisation, pp 272–280. IEEE, 2003.
19. J. Flower and G. Stapleton. Automated theorem proving with spider diagrams.Proc. Computing: The Australasian Theory Symposium (CATS’04), ENTCS 91,pp 116–132. Science Direct, 2004.
20. Gil J, Howse J and Kent S. Constraint Diagrams: a step beyond UML, Proc.TOOLS USA 1999, IEEE, 453-463, 1999.
21. J. Gil, J. Howse and S. Kent. Formalising spider diagrams. Proc. Symposium onVisual Languages (VL99), pp 130–137. IEEE, 1999.
22. Gil J, Howse J and Kent S. Towards a Formalization of Constraint Diagrams, Proc.Human-Centric Computing (HCC 01), IEEE, 72-79, 2001.
23. J. Gil, J. Howse and S. Kent, and J. Taylor. Projections in Venn-Euler diagrams.Proc. Visual Languages 2000, pp 119–126. IEEE, 2000.
24. J. Gil J. Howse and E. Tulchinsky. Positive semantics of projections in Venn-Eulerdiagrams, Proc. Diagrams 2000, LNAI 1889, Springer, 7-25, 2000.
25. J. Gil, J. Howse, and E. Tulchinsky. Positive semantics of projections. Journal ofVisual Languages and Computing, 13(2):197–227, 2001.
26. J. Gil and Y. Sorkin. The constraint diagrams editor. Available atwww.cs.technion.ac.il/Labs/ssdl/research/cdeditor/.
27. E. Hammer. Logic and Visual Information, CSLI Publications, 1995.28. E. Hammer and S. J. Shin. Euler’s Visual Logic, History and Philosophy of Logic,
pp 1-29, 1998.29. P. Hayes, T. Eskridge, R. Saavedra, T. Reichherzer, M. Mehrotra and D. Bo-
brovnikoff. Collaborative Knowledge Capture in Ontologies. Proc. K-CAP05, 2005.30. J. Howse, F. Molina, S-J. Shin, and J. Taylor. On diagram tokens and types. Proc.
Diagrams 2002, pp 146–160. Springer, 2002.

14
31. Howse J, Molina F and Taylor J. A sound and complete diagrammatic rea-soning system, Proc. Artificial Intelligence and Soft Computing (ASC 2000),IASTED/ACTA Press 402-408, 2000.
32. J. Howse, F. Molina and J. Taylor. On the completeness and expressiveness ofspider diagram systems. Proc. Diagrams 2000, pp 26–41, 2000. Springer, 2000.
33. Howse J, Molina F and Taylor J. SD2: A sound and complete diagrammatic rea-soning system, Proc. Visual Languages (VL2000), IEEE, 127-136, 2000.
34. J. Howse, F. Molina, J. Taylor and S. Kent. Reasoning with spider diagrams. Proc.Visual Languages (VL99), pp 138–147, IEEE, 1999.
35. J. Howse, F. Molina, J. Taylor, S. Kent and J. Gil. Spider diagrams: A diagram-matic reasoning system. Journal of Visual Languages and Computing, 12(3):299–324, 2001.
36. J. Howse and S. Schuman. Precise visual modelling. Journal of Software andSystems Modeling, 4:310–325, 2005.
37. J. Howse, G. Stapleton, and J. Taylor. Spider diagrams. LMS J. Computation andMathematics, 8:145–194, 2005.
38. C. John. Reasoning with projected contours. Proc. Diagrams 2004, pp 147–150.Springer, 2004.
39. C. John. Projected contours in Euler diagrams. Proc. Euler Diagrams 2004,ENTCS 134, pp 103–126, 2005.
40. S. Kent. Constraint diagrams: Visualizing invariants in object oriented modelling.Proc. OOPSLA97, pp 327–341. ACM Press, 1997.
41. H. Kestler, A. Muller, T.M. Gress, M. Buchholz. Generalized Venn diagrams: anew method of visualizing complex genetic set relations. Journal of Bioinformatics21:8, pp. 1592-1595, 2005.
42. K. Kuratowski Sur le probleme des courbes gauches en topologie. FundamentaMathematicae, 15, pp. 271-283, 1930.
43. O. Lemon. Comparing the efficacy of visual languages. In D. Barker-Plummer,D. I. Beaver, J. van Benthem, and P. Scotto di Luzio, editors, Words, Proofs and
Diagrams, pp 47–69. CSLI Publications, 2002.44. O. Lemon and I. Pratt. Spatial logic and the complexity of diagrammatic reasoning.
Machine GRAPHICS and VISION, 6(1):89–108, 1997.45. T. More. On the Construction of Venn Diagrams. Journal of Symbolic Logic 23,
303–304, 1959.46. P. Mutton, P. Rodgers and J. Flower. Drawing graphs in Euler diagrams. Proc.
Diagrams 2004, LNAI 2980, pp 66–81. Springer, 2004.47. OMG UML Specification, Version 2.0, available from www.omg.org. 2005.48. O. Patrascoiu, S. Thompson and P. Rodgers. Tableaux for diagrammatic reasoning.
Proc. Visual Languages and Computing, pp 279–286. Knowledge Systems Institute,2005.
49. C. Peirce. Collected Papers Vol. 4, Harvard Univ. Press, 1933.50. A. Rector. Representing Specified Values in OWL: “value partitions” and “value
sets”. W3C Editors Draft 02 March 2005.51. Reasoning with Diagrams website. www.cs.kent.ac.uk/projects/rwd/, 2006.52. P. Rodgers, P. Mutton and J. Flower. Dynamic Euler diagram drawing. Proc.
Visual Languages and Human Centric Computing, pp 147–156. IEEE, 2004.53. F. Ruskey. A survey of Venn diagrams. Electronic Journal of Combinatorics,
www.combinatorics.org/Surveys/ds5/VennEJC.html, 2001.54. S. Schuman and D. Pitt. Object-oriented subsystem specification, in
L.G.L.T. Meertens (ed.) Program Specification and Transformation, Proc. IFIPWorking Conference, 313–341, North–Holland, 1987.

15
55. S. Schuman, D. Pitt and P. Byers. Object-oriented process specification, in Rat-tray (ed.) Specification and Verification of Concurrent Systems, Proc. BCS FACSWorkshop, 21–70, Springer, 1990.
56. P. Scotto di Luzio. Patching up a logic of Venn diagrams. Proc. 6th CSLI workshopon Logic, Language and Computation. CSLI Publications, 2000.
57. S.-J. Shin. The Logical Status of Diagrams. Cambridge University Press, 1994.58. G. Stapleton. A survey of reasoning systems based on Euler diagrams. Proc. Euler
Diagrams 2004, ENTCS 134, pp 127–151, 2004.59. G. Stapleton, J. Howse, and J. Taylor. A constraint diagram reasoning system.
Proc. Visual Languages and Computing, pp 263–270. Knowledge Systems Institute,2003.
60. G. Stapleton, J. Howse, and J. Taylor. A decidable constraint diagram reasoningsystem. Journal of Logic and Computation. 15(6) 975-1008, 2005.
61. G. Stapleton, J. Howse, J. Taylor, and S. Thompson. What can spider diagramssay? Proc. Diagrams 2004, pp 112–127. Springer, 2004.
62. G. Stapleton, J. Howse, J. Taylor, and S. Thompson. The expressiveness of spiderdiagrams augmented with constants. Proc. Visual Languages and Human CentricComputing, pp 91–98, 2004.
63. G. Stapleton, J. Masthoff, J. Flower, A. Fish, and J. Southern. Automated theoremproving in Euler diagrams systems. Submitted to Journal of Automated Reasoning,2006.
64. G. Stapleton, S. Thompson, A. Fish, J. Howse, and J. Taylor. A new languagefor the visualization of logic and reasoning. International Workshop on VisualLanguages and Computing, pp 263–270. Knowledge Systems Insitute, 2005.
65. G. Stapleton, S. Thompson, J. Howse, and J. Taylor. The expressiveness of spiderdiagrams. Journal of Logic and Computation, 14(6) pp 857–880, 2004.
66. N. Swoboda. Implementing Euler/Venn Reasoning Systems. In M. Anderson, B.Meyer and P. Olivier (eds), Diagrammatic Representation and Reasoning, pp371–386. Springer, 2001.
67. Swoboda, N. and Allwein, G. A case study of the design and implementation ofheterogeneous reasoning systems, In Logical and Computational Aspects of Model-Based Reasoning, Manani, L., and Nersessian, N.J., eds, Kluwer Academic. 2002.
68. Swoboda, N. and Allwein, G. Heterogeneous reasoning with Euler/Venn diagramscontaining named constants and FOL. Proc. Euler Diagrams 2004, ENTCS 134,pp 153–187, 2004.
69. N. Swoboda and G. Allwein. Using DAG transformations to verify Euler/Vennhomogeneous and Euler/Venn FOL heterogeneous rules of inference. Proc. GT-VMT, ENTCS, 2002.
70. N. Swoboda and J. Barwise. The information content of Euler/Venn diagrams.Proc. LICS workshop on Logic and Diagrammatic Information, 1998.
71. J. Thievre, M. Viaud and A. Verroust-Blondet. Using Euler Diagrams in Tradi-tional Library Environments. Proceedings of Euler Diagrams 2004. ENTCS 134,pp. 189-202, 2005.
72. Visual Modelling Group: www.cmis.bton.ac.uk/research/vmg, 2006.73. J. Venn. On the diagrammatic and mechanical representation of propositions
and reasonings. The London, Edinburgh and Dublin Philosophical Magazine and
Journal of Science, 9:1–18, 1880.74. J. Venn. Symbolic Logic. Burt Franklin, 1971.75. A. Verroust and M. Viaud. Ensuring the Drawability of Extended Euler Diagrams
for up to eight Sets. Proc. Diagrams 2004. LNAI 2980, pp.128-141, 2004.
16
76. Warmer J, Kleppe A. The Object Constraint Language: Precise Modeling withUML. Addison-Wesley, 1999.
Related Documents


![An Integration of UML Sequence Diagram with Formal ......observed from [13] in which integration of the Z notations into Use case Diagram, because use case diagrams are very common](https://static.cupdf.com/doc/110x72/5ea9f3871346527c8952be89/an-integration-of-uml-sequence-diagram-with-formal-observed-from-13-in.jpg)