EU US Roadmap Nanoinformatics 2030 Editors: Andrea Haase, German Federal Institute for Risk Assessment (BfR), Department of Chemical and Product Safety, Germany contact: [email protected], ORCID: 0000-0002-5288-7876 Frederick Klaessig, Pennsylvania Bio Nano Systems, LLC, USA, contact: [email protected], ORCID: 0000-0002-6062-8700 DOI: 10.5281/zenodo.1486012 Date of Release: 15.11.2018

Welcome message from author
This document is posted to help you gain knowledge. Please leave a comment to let me know what you think about it! Share it to your friends and learn new things together.
Transcript
EU US Roadmap Nanoinformatics 2030
Editors: Andrea Haase, German Federal Institute for Risk Assessment (BfR), Department of Chemical and Product Safety, Germany contact: [email protected], ORCID: 0000-0002-5288-7876 Frederick Klaessig, Pennsylvania Bio Nano Systems, LLC, USA, contact: [email protected], ORCID: 0000-0002-6062-8700 DOI: 10.5281/zenodo.1486012 Date of Release: 15.11.2018
EU US Roadmap Nanoinformatics
2
Disclaimer This roadmap has been jointly developed in trustful cooperation among scientists of the European Union, the United States of America and a few other countries. Scientists with different scientific backgrounds, working in the field of nanotechnology, have cooperated with the main objective to provide as broad an overview as possible about the young and rapidly evolving field of “nanoinformatics”. Thus, the main purpose of this roadmap is educational. By no means was the intention to provide all possible details. Instead, interested readers will find plenty of additional references mentioned in each of the chapters that will provide more detailed insights. The opinions expressed in this document are solely those of the authors. They do not necessarily represent the opinions of their respective organisations or reflect the views, and official policy of the respective Government such as the Department of Defence, the Department of the Army, the U.S. Army Medical Department or the U.S. Federal Government. Mention and use of product or trademark name(s) does not constitute endorsement but is intended only to assist the reader. The statements and opinions contained in the individual chapters are also not legally binding with respect to different regulatory frameworks. In particular it should be noted that some of the terms might be defined and used differently in the US versus the EU, also within different scientific disciplines and within different regulatory frameworks. Therefore, within the definitions sections we attempted to provide an overview, to explain the most important terms, and to highlight some that may have different meanings.
EU US Roadmap Nanoinformatics
3
Table of Contents Disclaimer ........................................................................................................................................................... 2 Table of Contents ............................................................................................................................................. 3 1. Executive Summary ................................................................................................................................... 5 2. Definitions in an Operational Context ............................................................................................. 10 3. Objectives .................................................................................................................................................... 12 4. Introduction ............................................................................................................................................... 15 5. Data Collection and Curation............................................................................................................... 17
5.1 Challenges: Material Representation ........................................................................................ 18 5.2 Challenges: Property Representation ....................................................................................... 20 5.3 Challenges: Data Management Plans ........................................................................................ 22 5.4 Data Curation ..................................................................................................................................... 22
5.4.1 Data Quality and Completeness .......................................................................................... 22 5.4.2 Data Curation Process ............................................................................................................ 23
5.5 Getting Data In – Data Sources and Data Entry .................................................................... 23 5.5.1 File Formats and Templates ................................................................................................ 23
5.6 Getting Data Out - Support for Data Analysis ........................................................................ 27 5.7 Metadata .............................................................................................................................................. 28 5.8 Ontologies ............................................................................................................................................ 29
5.8.1 NanoParticle Ontology ........................................................................................................... 30 5.8.2 eNanoMapper Ontology ......................................................................................................... 30 5.8.3 NanoDatabank Ontology ....................................................................................................... 31 5.8.4 CHEMINF Ontology .................................................................................................................. 31 5.8.5 BioAssay Ontology (BAO) ..................................................................................................... 31 5.8.6 Materials Modelling Ontology Activities ......................................................................... 32
5.9 Data Exchange ................................................................................................................................... 32 5.9.1 Data Sharing ............................................................................................................................... 32 5.9.2 Open Science .............................................................................................................................. 34
5.10 Sustainability ................................................................................................................................... 35 6. Nanochemoinformatics and Statistical Modelling ...................................................................... 37
6.1 Introduction ........................................................................................................................................ 37 6.2 Descriptors .......................................................................................................................................... 38
6.2.1 Statistical Assumptions Testing Techniques ................................................................. 42 6.2.2 Durbin-Watson Test for Data Linearity ........................................................................... 43 6.2.3 Shapiro-Wilks Test for Data Normality ........................................................................... 43 6.2.4 Normal Quantile-Quantile Plots (Q-Q plots) .................................................................. 43
6.3 Unsupervised Techniques for Similarity Analysis, Profiling, and Grouping ............. 44 6.3.1 Principal Components Analysis (PCA) ............................................................................. 44 6.3.2 Cluster Analysis ........................................................................................................................ 45 6.3.3 Self Organising Maps .............................................................................................................. 46
6.4 Supervised Techniques for Filling Data Gaps ........................................................................ 48 6.4.1 Quantitative Structure Activity Relationships (QSAR) .............................................. 48 6.4.2 Trend analysis ........................................................................................................................... 52 6.4.3 Read-across ................................................................................................................................ 53
EU US Roadmap Nanoinformatics
4
7. Modelling properties, interactions and fate of NMs ................................................................... 56 7.1 Introduction to Materials Modelling ......................................................................................... 56 7.2 Use of computational models to compute NM properties ................................................ 56
7.2.1 Intrinsic properties and descriptors ................................................................................ 57 7.2.2 Extrinsic properties and descriptors ................................................................................ 59
7.3 Use of material models for supporting risk assessment ................................................... 60 7.4 Challenge: Descriptors and Multiscale Modelling of the Bio-Nano Interface ........... 60 7.5 Challenge: Missing predictive models for some descriptors ........................................... 62 7.6 Challenge: Coupling and linking models for predicting biological events ................. 63
8. Nano-Bioinformatics .............................................................................................................................. 65 8.1 Transcriptomics – a case study in bioinformatics ............................................................... 71 8.2 Challenges moving forward.......................................................................................................... 72 8.3 Application of other ‘omics’ data to nanotoxicology .......................................................... 73 8.4 Omics data analysis methods ....................................................................................................... 73
9. The community: Overview of Stakeholders .................................................................................. 78 10. The Community: Impact on Stakeholders ................................................................................... 82
10.1 Impact on Academia ..................................................................................................................... 82 10.2 Impact on Industry ........................................................................................................................ 83 10.3 Impact on Regulatory Agencies ................................................................................................ 84
11. Overview of selected Databases and Projects ............................................................................ 87 11.1 Modelling Projects ......................................................................................................................... 91 11.2 NanoEHS projects generating large-scale datasets .......................................................... 92
12. Roadmap as Perspectives, Milestones and Pilot Projects ...................................................... 94 12.1 Introduction ..................................................................................................................................... 94 12.2 Perspectives for Toxicological Milestones ........................................................................... 95 12.3 Perspectives for Physico-chemical Milestones .................................................................. 97 12.4 Perspectives for Modelling Milestones.................................................................................. 99 12.5 Commentary on related EU activities ................................................................................. 100
13. References ............................................................................................................................................. 104 14. Acknowledgments ............................................................................................................................. 120 Appendix 1: Summary of Database Projects (2010-2017) ........................................................ 121
A1.1 eNanoMapper .......................................................................................................................... 121 A1.2 NanoDatabank ........................................................................................................................ 122 A1.3 NECID ......................................................................................................................................... 122 A1.4 SERENADE ................................................................................................................................ 123 A1.5 GuideNano ................................................................................................................................ 123 A1.6 SUN .............................................................................................................................................. 123 A1.7 MARINA ..................................................................................................................................... 124 A1.8 NANOSOLUTIONS .................................................................................................................. 124 A1.9 NanoMILE ................................................................................................................................. 124 A1.10 NanoInformatics Knowledge Commons (NIKC) ..................................................... 125 A1.11 QsarDB .................................................................................................................................... 126 A1.12 GRACIOUS .............................................................................................................................. 126 A1.13 References.............................................................................................................................. 127
EU US Roadmap Nanoinformatics
5
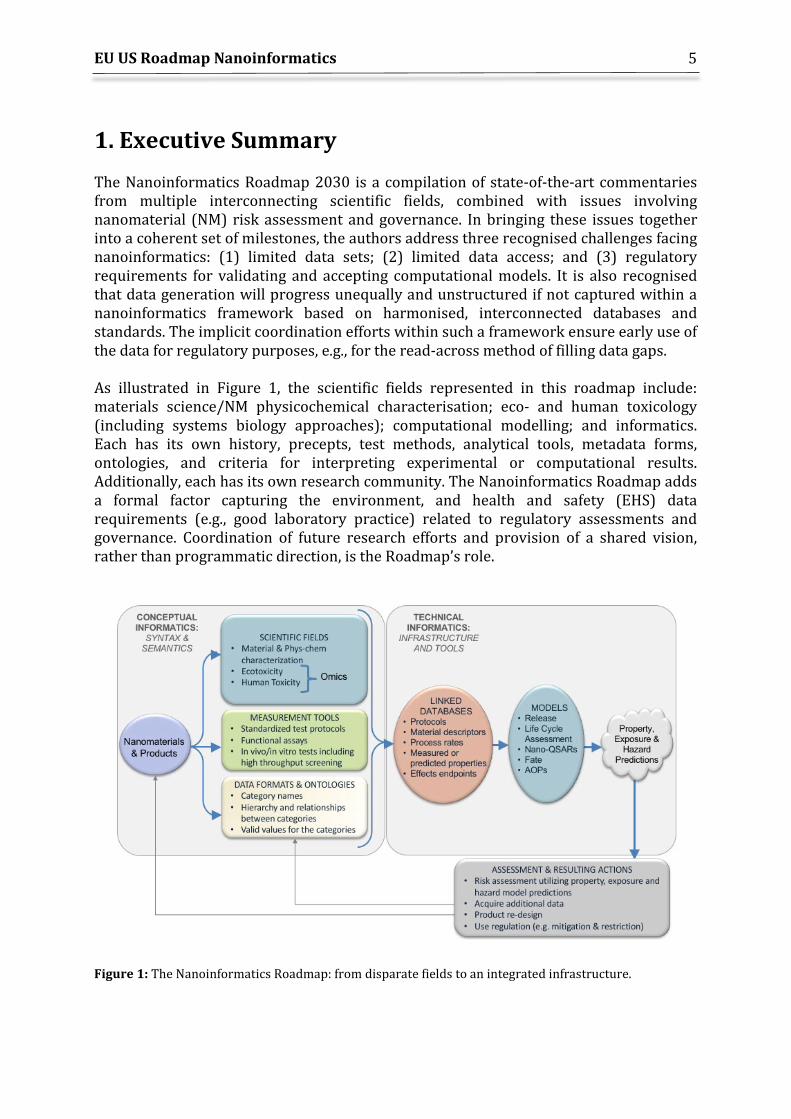
1. Executive Summary The Nanoinformatics Roadmap 2030 is a compilation of state-of-the-art commentaries from multiple interconnecting scientific fields, combined with issues involving nanomaterial (NM) risk assessment and governance. In bringing these issues together into a coherent set of milestones, the authors address three recognised challenges facing nanoinformatics: (1) limited data sets; (2) limited data access; and (3) regulatory requirements for validating and accepting computational models. It is also recognised that data generation will progress unequally and unstructured if not captured within a nanoinformatics framework based on harmonised, interconnected databases and standards. The implicit coordination efforts within such a framework ensure early use of the data for regulatory purposes, e.g., for the read-across method of filling data gaps. As illustrated in Figure 1, the scientific fields represented in this roadmap include: materials science/NM physicochemical characterisation; eco- and human toxicology (including systems biology approaches); computational modelling; and informatics. Each has its own history, precepts, test methods, analytical tools, metadata forms, ontologies, and criteria for interpreting experimental or computational results. Additionally, each has its own research community. The Nanoinformatics Roadmap adds a formal factor capturing the environment, and health and safety (EHS) data requirements (e.g., good laboratory practice) related to regulatory assessments and governance. Coordination of future research efforts and provision of a shared vision, rather than programmatic direction, is the Roadmap’s role.
Figure 1: The Nanoinformatics Roadmap: from disparate fields to an integrated infrastructure.
EU US Roadmap Nanoinformatics
6
The above-mentioned scientific fields are at different stages of development and have different information requirements, testing methods, terminologies, and protocols. Even the more established fields are re-examining testing protocols and accepted data formats to include NM transformations during the life cycle and dynamic NM properties that have strong impacts on exposure, dose and toxicity. Nevertheless, a shared informatics infrastructure can be identified. Technical data storage, data retrieval and theory development required to support computational modelling for regulatory guidance can be pursued through a modular growth of the datasets, ontologies and structures. Establishing a robust and sustainable nanoinformatics infrastructure will be critical to achieve important long-term scientific goals such as reliable integration of modern systems biology approaches into regulatory testing, or reduced reliance on animal testing. This roadmap provides the nanoEHS community with a framework for incremental growth, building on the structure and ontology developed in earlier projects. Methods can be developed and applied to systematically drive ontology development, and improved communication processes will foster increased maturity in protocols, language, testing requirements and integrated data formats for the interrelated scientific fields necessary to achieve roadmap goals. While each scientific field has its own direction, (eco)toxicology plays a central role in responsible development of NMs and provides a focus for aligning progress in relevant research fields with criteria used by regulators for registering chemicals, pesticides or drugs. We recognise that not every cellular effect caused by a NM will lead to an adverse outcome, nor will every physicochemical property that can be measured or predicted by computer models have a causal effect on toxicity. However, when they do align, there is an imperative that the results be useful to the regulator.
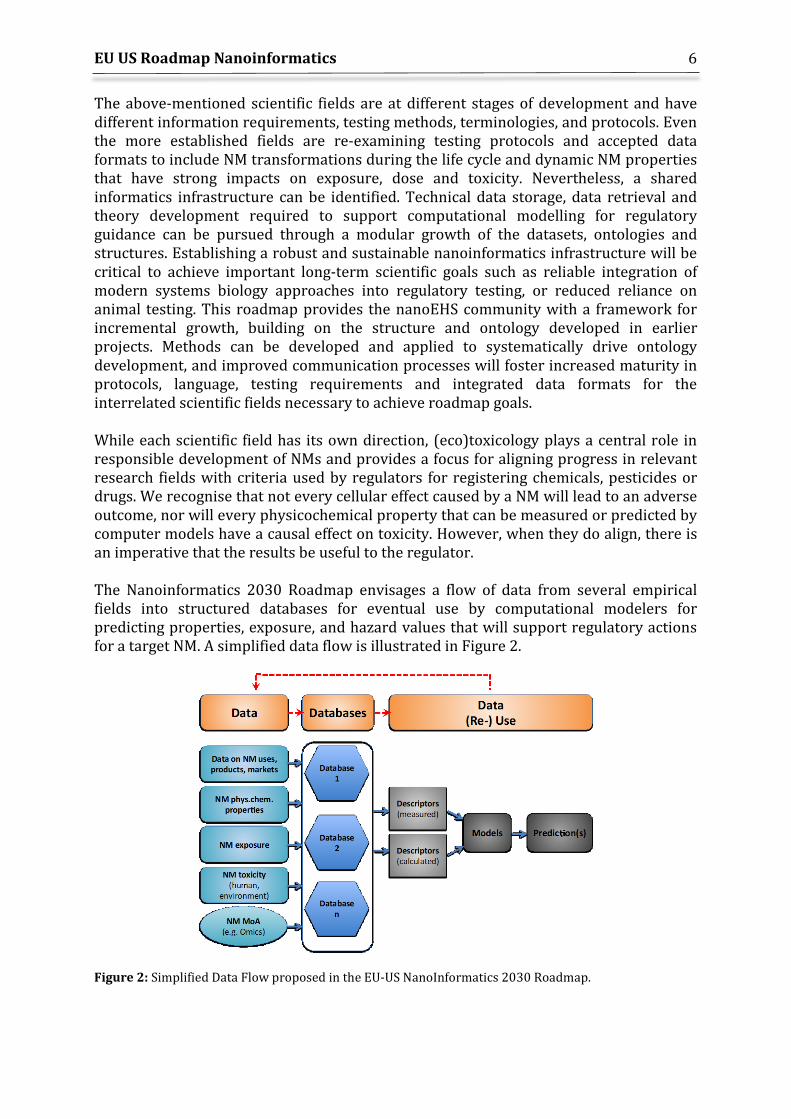
The Nanoinformatics 2030 Roadmap envisages a flow of data from several empirical fields into structured databases for eventual use by computational modelers for predicting properties, exposure, and hazard values that will support regulatory actions for a target NM. A simplified data flow is illustrated in Figure 2.
Figure 2: Simplified Data Flow proposed in the EU-US NanoInformatics 2030 Roadmap.
EU US Roadmap Nanoinformatics
7
It is expected that current interest in Integrated Approaches to Testing and Assessment (IATA), alternative test strategies that minimise whole animal testing, and the simple but fundamental desire to have a mechanistic understanding of NM (eco)toxicity will lead to greater reliance on computational modelling to predict properties, environmental fate, toxicokinetics and (eco-)toxicity for new materials. A growing knowledge base, supporting robust modelling capabilities that predict properties, exposure and hazard potentials of NMs, would also make possible safer-by-design approaches. NM attributes that drive both commercially-useful NM properties and possible undesirable EHS profiles could be explored during early stage research and development, and used later to design materials that maximise utility while minimising adverse biological effects. Given that the readers of this report will be experts in specialised fields interested in understanding developments in nanoinformatics, the authors have written the Sections to be understandable by a broad audience. The reader can either start with their own field, or with the milestones, or with the Sections outlining the nanoinformatics communities. The Roadmap consists of three sections: an administrative section (Executive Summary; Definitions and Context; Objectives); a technically oriented informatics section (informatics, materials modelling, statistical computation, omics bioinformatics) and a community of practice-oriented section (stakeholders, database projects, initiatives and milestones & pilot projects). Each Section is self-contained and, where appropriate, cross-cutting issues are identified. The Roadmap’s Sections do not follow either the complexity in Figure 1 or the simplified data flow in Figure 2. As a guide for the reader, we offer the following commentary connecting the several Sections, relying primarily on Figure 2. Empirical Fields:
● Toxicity and ecotoxicity are the subject of a separate Research Roadmap (Strategic Research Agenda). There is a short overview of toxicological testing from an informatics perspective in the Milestones (Section 12.2).
● The burgeoning field of omics is discussed in Section 8 with special emphasis on transcriptomics, the most advanced field from an informatics standpoint.
● Physico-chemical characterisation is interspersed as property representation (Section 5.2) and descriptors (Sections 6.2 and 7.2). As with toxicity, there is a short overview from an informatics perspective in the Milestones (Section 12.3).
Databases:
● Informatics involves structured datasets, where the structure is provided by the controlled vocabulary used and by the relationships among terms, the ontology (Section 5.8). Essentially, the database curator annotates experimental data to maximise its utility beyond that of the original field. In effect, the curator deconstructs the original experiment into components that reflect physicochemical properties of NMs to supplement the biological understanding found in bioinformatics ontologies.
EU US Roadmap Nanoinformatics
8
● From a strict dataflow standpoint: data collection (Section 5.5) leads to material (Section 5.1) and property representation (Section 5.2) that are curated (Section 5.4) and further described using metadata (Section 5.7) so that data can be retrieved (Section 5.6) and exchanged (Section 5.9). Data quality assurance and control (i.e., QA/QC) are critical when collecting data for incorporation into datasets and are discussed within data management plans (Section 5.3).
● It is unlikely that there will be only one authoritative database. This have driven development of data transfer formats such as ISA-TAB-nano (or upgrades to ISA-JSON) for exchanging data with other databases or modelling programs (Section 5.9.1). The reasons for the development of multiple databases include: issues of unpublished data; different foci; proprietary data; or even mundane issues like resources for database maintenance (Section 5.3 and 5.10). In the Roadmap, there is a preference for using extensions compatible with the publicly available ISA standard used in bioinformatics. However, advances will occur that allow processing of heterogeneous datasets that do not lend themselves readily to structured dataset representations.
Computational Modelling:
● Where informatics deconstructs the NM and properties, computational modelling re-constructs information by using those parameters as descriptors (Sections 6.2 and 7.2) viewed as most relevant to the physicochemical or biological property being predicted. The descriptors may be properties measured (for the same or for related materials) or computed from theoretical concepts.
● Collecting curated data (Section 5.4) of sufficient extent (size of dataset; replicates; dose-response) has led to development of several data-filling approaches (Section 6.4) used, for example, to support NM grouping (Section 6.3).
● Inherent to computational modelling is relating the material description and intrinsic/extrinsic physicochemical properties to the biological outcomes, especially if some descriptors are not readily measurable. This challenge leads to several approaches to selecting descriptors: for material representation (Section 5.1); for primarily measured properties (Section 6.2) when used in statistical models to predict properties (quantitative structure-property relationships, QSPR) or biological activity (quantitative structure-(bio)activity relationships, QSAR) (Section 6.4); for calculating descriptors otherwise difficult to measure using theory and computational models (Section 7.2) before coupling to biological testing (Section 7.6) to arrive at predictions on how NM might modulate important biological processes.
● It is essential to validate model predictions, either by splitting datasets into training and test subsets, or by measuring properties of material libraries for which predictions of their target property have been made. A modelling overview is given in the Milestones (Section 12.4).
EU US Roadmap Nanoinformatics
9
Validation:
● Validation is a critical step especially if predications obtained by computational models are to be used in regulatory context, e.g. for data-gap filling or for justification of waiving specific testing.
● The validation requirements, which are well established in computational sciences in general, still have to specified for NM models. We can expect that validation in a regulatory context will be more rigorous, e.g. for predicting biological outcomes compared to predicting NM properties that have little immediate relevance to toxicity. In toxicity, there is increasing emphasis on understanding the mechanisms of toxicity. Mechanistic insights are needed to describe these modes of action (MOA) and to construct adverse outcome pathways (AOPs) that are a subject of the Regulatory Research Roadmap. Here we give an overview from an informatics perspective in the Milestones (Section 12.2).
● In all cases, regulators will require that there be a proven relationship among the computational model’s algorithm and its domain of applicability (the range of NM properties for which the model makes valid predictions, grouping Section 6.3). There is also a higher likelihood of acceptance if the mechanism underlying the effect induced by the specific property is known. We expect that the regulatory requirements will be specified and communicated once a critical mass of high-quality data has been generated and computational models to predict NM properties become more widely available (Section 6.4).
Nanoinformatics Community: While there has been funding for data management on an individual project basis, the use of this information in a regulatory context has been a challenge for several reasons. In general, nanoinformatics has relied on communities of research, such as those outlined in Section 9. The Roadmap itself is an example of one such community of research. Though initiated in Europe, the Roadmap expands on an earlier U.S. document. The milestones are based on the results of several international workshops whose lead authors were approached during the review process (Section 4). Throughout the process, issues and draft Sections were discussed at European (EU NanoSafety Cluster WG4, now WG F) and U.S. (NIH NanoWG) teleconferences whose participants have met regularly for several years on nanoinformatics. Colleagues from Canada, China and Australia participated, as well as those active in ASTM International’s E56 and ISO’s TC-229. In addition, the EU-US Communities of Research 2016 and 2017 meetings were used for face-to-face discussions of this Roadmap. There are also broader issues that cannot be covered fully in this document. For example, it is not our intention to fully cover the differing perspectives among various stakeholders (Section 9 and 10) that would require a separate activity.
EU US Roadmap Nanoinformatics
10
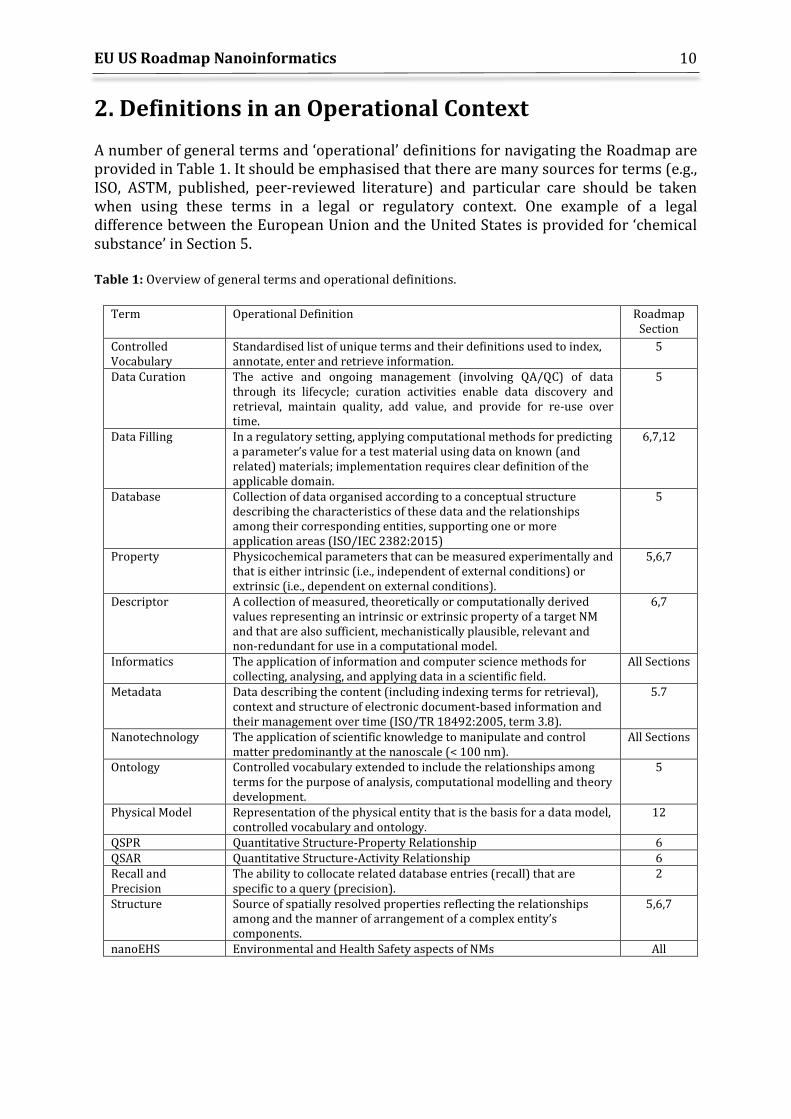
2. Definitions in an Operational Context A number of general terms and ‘operational’ definitions for navigating the Roadmap are provided in Table 1. It should be emphasised that there are many sources for terms (e.g., ISO, ASTM, published, peer-reviewed literature) and particular care should be taken when using these terms in a legal or regulatory context. One example of a legal difference between the European Union and the United States is provided for ‘chemical substance’ in Section 5. Table 1: Overview of general terms and operational definitions.
Term Operational Definition Roadmap Section
Controlled Vocabulary
Standardised list of unique terms and their definitions used to index, annotate, enter and retrieve information.
5
Data Curation The active and ongoing management (involving QA/QC) of data through its lifecycle; curation activities enable data discovery and retrieval, maintain quality, add value, and provide for re-use over time.
5
Data Filling In a regulatory setting, applying computational methods for predicting a parameter’s value for a test material using data on known (and related) materials; implementation requires clear definition of the applicable domain.
6,7,12
Database Collection of data organised according to a conceptual structure describing the characteristics of these data and the relationships among their corresponding entities, supporting one or more application areas (ISO/IEC 2382:2015)
5
Property Physicochemical parameters that can be measured experimentally and that is either intrinsic (i.e., independent of external conditions) or extrinsic (i.e., dependent on external conditions).
5,6,7
Descriptor A collection of measured, theoretically or computationally derived values representing an intrinsic or extrinsic property of a target NM and that are also sufficient, mechanistically plausible, relevant and non-redundant for use in a computational model.
6,7
Informatics The application of information and computer science methods for collecting, analysing, and applying data in a scientific field.
All Sections
Metadata Data describing the content (including indexing terms for retrieval), context and structure of electronic document-based information and their management over time (ISO/TR 18492:2005, term 3.8).
5.7
Nanotechnology The application of scientific knowledge to manipulate and control matter predominantly at the nanoscale (< 100 nm).
All Sections
Ontology Controlled vocabulary extended to include the relationships among terms for the purpose of analysis, computational modelling and theory development.
5
Physical Model Representation of the physical entity that is the basis for a data model, controlled vocabulary and ontology.
12
QSPR Quantitative Structure-Property Relationship 6 QSAR Quantitative Structure-Activity Relationship 6 Recall and Precision
The ability to collocate related database entries (recall) that are specific to a query (precision).
2
Structure Source of spatially resolved properties reflecting the relationships among and the manner of arrangement of a complex entity’s components.
5,6,7
nanoEHS Environmental and Health Safety aspects of NMs All
EU US Roadmap Nanoinformatics
11
It should be emphasised that nanotechnology covers a broad array of scientific disciplines, each with a specialised language and, occasionally, different definitions of terms. Informatics, on the other hand, involves the application of external organising principles onto the data generated within a scientific discipline. In such situations of countervailing interests, it becomes difficult to offer a coherent glossary of terms and definitions. For the purposes of this Roadmap, and recognising that readers might appreciate some explanation for those themes beyond their expertise, we instead offer a descriptive overview illustrating their use, i.e., operational definitions. Informatics is the application of information and computer science methods for collecting, analysing, and applying data in a scientific field, e.g., bioinformatics. Thus, nanoinformatics is a systematic methodology to collect, organise, validate, store, share, model, analyse, and apply data involving nanotechnology processes, materials, properties and commercial product implications; to confirm that appropriate decisions were made and that desired outcomes were achieved from the application of the data; and finally, to convey experience to the broader community, contribute to generalised knowledge, and update standards and training. The inclusion of product commercialisation expands the stakeholders (see Stakeholders in Section 9) to include regulators and the general public interested in NM environmental, health and safety (nanoEHS), as well as in responsible research and innovation. The Roadmap combines several aspects of nanoinformatics in a manner that provides operational definitions for a number of concepts (highlighted in bold): 1) Data from credible sources are being compiled into structured, electronic datasets, where the data may be publicly available (published) or not (unpublished laboratory data), may be from publicly funded research projects or from formal regulatory submissions on specific materials (likely to be confidential business information) and may be numerical or pictorial. We anticipate that there will be multiple databases administered independently, but with some level of interoperability desired. 2) A ‘collection of data organised according to a conceptual structure’ means that the database can be used to retrieve the original data. The term ‘organised’ refers to the use of controlled vocabularies, metadata, and ontologies during data entry in order to ensure reasonable recall and precision in collocating findings from related studies. We anticipate that there is a role for data curation in annotating metadata and commenting on data completeness and data quality (see Section 5). Some standardisation within the nanoinformatics field will be necessary if data are to be exchanged between databases. While there was an early preference for organising data into ‘structured’ datasets, it is recognised that datasets can also be in unstructured formats. Unstructured datasets contain data that are not or cannot be easily organised in a predefined manner (e.g., reside in fixed fields or records). 3) Computational techniques for analysis, modelling and theory development may also impose issues of standardisation in terms of data relevance, quantity, robustness, completeness and validity. These issues may differ across stakeholder interests, where
EU US Roadmap Nanoinformatics
12
the metadata for theory development may be less restrictive when remaining within a single scientific discipline. Metadata requirements for regulatory purposes may cross disciplines and emphasise the following proper test protocols, even where these are not yet formally validated for use with NMs. We view cross-disciplinary awareness and coordination of these issues as a central impetus to the Roadmap as they will continue to undergo development and refinement throughout the 2030 time-frame (Milestones, Section 12). 4) The size of currently available datasets is a particular challenge for computational modelling, raising as it does, issues of database access, data completeness among independent studies, and even model validation. Relative to other ‘big data’ fields, the number of independent studies, the range of NMs studied and the robustness of test protocols are more limited (see Sections 6, 7 and 8). We anticipate that these fields will advance independently with regulatory validation and acceptance first occurring during data-filling and grouping exercises, the preparation of registration dossiers, and the testing programs under the appropriate regulatory frameworks (e.g., REACH, BPR, U.S. EPA etc.) (see Sections 6, 7 and 9). 5) Computational techniques for modelling and theory development will eventually lead to predictive capabilities based on descriptive elements (descriptors, Sections 6 and 7) based on data already present in the ‘structured’ dataset or that are generated from innovative concepts (theory, metadata, mathematical expressions) that are validated by the data already present in the ‘structured’ dataset. We have provided one physical model of a NM (Milestones, Section 12.3) to serve as a common base for understanding data models incorporated into database ontologies or found as boundary conditions in simulations or computational models.
3. Objectives Nanotechnology is one of the key technologies of the 21st century. The global nanotechnology market already had a value of $39.2 billion in 2016 and is expected to reach $90.5 billion by 2021 [1]. In addition, public funding sources invested more than $67.5 billion globally during the last decade for research and development [2]. Nanotechnology already has many different applications and the global market is increasing steadily each year. Due to significant funding from both public and private sources, knowledge has increased significantly during the last decades. Several large collaborative projects investigating the environmental and health safety aspects of NMs (nanoEHS) have been completed, with several more ongoing or starting in 2018. In addition, there are experimental toxicology developments, such as high throughput and high content methods, which generate extensive data in a short time. Therefore, as in many other scientific disciplines, the amount of available data has increased dramatically in recent years. Nanotechnology requires integration of knowledge from diverse disciplines such as materials science, biology, chemistry, toxicology, medicine, and computational and decision sciences. In parallel, computational approaches are gaining increasing importance and popularity, especially those employing machine learning (ML) or deep learning (DL). Advances in nanoinformatics will be essential for
EU US Roadmap Nanoinformatics
13
extracting useful information from ‘data lakes’ for use development and application of sustainable nanotechnology. This roadmap addresses the following objectives: Objective 1: Foster community interactions and provide stakeholder support NanoEHS integrates knowledge from many different disciplines, each generating and using different types of data, and having different stakeholders, each with their own objectives and data storage and use requirements. This roadmap will foster the “self-assembly” of this heterogeneous community so that each stakeholder understands the specific needs and objectives of the others. This document also provides an overview of the nanoinformatics processes and tools available to support different stakeholders in achieving their specific objectives. The roadmap clearly describes the benefits of nanoinformatics at different phases of work within the context of nanoEHS for different stakeholder needs. Objective 2: Promote capture, preservation and dissemination of all publicly- available NM measurement data A considerable investment has already been made by public and commercial sources into nanotechnology development in general, and nanoEHS specifically. Future resources are limited so it is critical to make the maximum possible use of existing data, to avoid duplication of work and re-measurement, but also to plan new research needed to plug gaps in existing datasets and promote consistency in reporting results. It also ensures that results are secure and data can be accessed later by others. Therefore, knowledge can be increased by generation of new, more detailed data or by meta-analyses of existing data, which will be facilitated by an increasing number of in silico methods. This roadmap supports the creation and linkage of repositories to ensure that all publicly funded NM measurement and modelling results are deposited in accessible repositories, so that they can provide data to the evolving infrastructure of risk assessment and management decision support tools. Specifically, it aims to raise public awareness of the benefits of data-sharing principles in all levels of the research community. It describes a step-by-step process to achieve this overarching goal and it explains what kind of infrastructure is needed for this purpose. Objective 3: Facilitate the (re-)use of existing data To pursue optimal data usage, a system should comply with FAIR data principles and guidelines (Findable, Accessible, Interoperable and Reusable) for data and the algorithms, tools and workflows that operate on it [3]. For example, data sets should have sufficient metadata, it should be clear where the data can be downloaded or requested from, and ontologies should be used to allow easy integration and re-use with other data. Encouraging the scientific community/stakeholders to make use of existing data will facilitate:
EU US Roadmap Nanoinformatics
14
● a (better) understanding of experimental results through integration of currently disparate datasets;
● the development of different kinds of models of varying complexities and their validation using existing datasets, allowing for predictions of properties, performance and functionality of NMs;
● the correlation of specific biological effects with NM physicochemical properties; ● the direct use of existing data to fulfill data requirements for risk assessment and
regulatory obligations; ● information exchange between research communities and interested industry
partners, reducing extent of new experimental testing; ● capturing the breadth and extent of NM use; ● development of appropriate nanoEHS controls and benchmarks.
This enhanced knowledge will support:
● the implementation of Intelligent Testing Strategies for more cost-efficient risk assessment;
● the purposeful design of new NMs with lower human health or environmental impact;
● the establishment of NM grouping and read-across approaches; ● the establishment of Safe(r)-by-Design Principles; ● decision making regarding the risks of nano-enabled products and processes; ● regulation.
Objective 4: Identify specific milestones/pilot projects aligned to objectives 1-3 This roadmap identifies and describes the key challenges for nanoinformatics covering data storage, data use, dissemination and exploitation for safety assessments and risk management. It also identifies and describes specific pilot projects covering short (next 3-5 years), medium (next 5-10 years) and long-term (> 10 years) needs as key stepping stones/demonstrators needed to reach the first three objectives.

EU US Roadmap Nanoinformatics
15
4. Introduction This roadmap is a timely continuation of several previous efforts, namely of three workshops, one conference, a few workshop reports, and the US Nanoinformatics 2020 Roadmap. As this roadmap builds and extends those, they should be briefly mentioned here. The Nanoinformatics 2020 Roadmap [4] was based on a 2010 workshop involving ~73 participants, mainly from USA with some representatives of the EU’s Action Grid effort [5]. The following topics were discussed during this workshop and accordingly described in the roadmap. Many of them remain pertinent: 1. Data collection and curation needs:
o Minimal information standards for nano-data sets (completeness and quality)
o Inter-laboratory studies (ILS) for test protocol and data completeness validation
o Community-wide standardised characterisation; and o How much information is needed to trigger a “recognised hazard”?
2. Tools and methods for data innovation, analysis and simulation needs: o A complete map of data collection and curation workflows to guide the
development of nanoinformatics o A mechanism for federated searches to utilise existing nanotech
databases; o Getting the science right; and o Getting the right data
3. Tools, training, and education perspectives: o Data Accessibility and information sharing o Context is critical for effective information sharing; and o Competing socio-cultural incentives impact data sharing
The Nanoinformatics 2020 Roadmap listed available resources at that time and also proposed several pilot projects. In 2011, COST (European Cooperation in Science and Technology) sponsored a workshop in Maastricht with ~90 attendees on the use of QSAR methods to model biological effects of NMs (www.cost.eu/events/qntr). The resulting paper by Winkler et al. [6] proposed 14 milestones and grouped them in 2-, 5- and 10-year time horizons. For the most part, the milestones reflected:
o a need to generate sufficient data for model development o acceptance of ‘surrogate’ assays useful for modelling if not for regulation o expectation that understanding protein corona formation would provide
necessary mechanistic information; and o a view of informatics as a needed infrastructure for data accessibility
This roadmap also benefited from Winkler’s more recent commentary [7]. While progress was noted, especially the availability of benchmark test materials, there remain insufficient data resulting in a need for surrogate or fast screening assays, for improved
EU US Roadmap Nanoinformatics
16
nano-specific descriptors and for an exploration of chemical grouping. The update in particular emphasised data curation, informatics, and data consolidation and standardised testing. In 2014, the U.S. National Science Foundation (US NSF) funded a workshop held prior to the Sustainable Nanotechnology Organisation meeting in Boston on the general theme of defining the fundamental science needed to support nanoEHS. The resulting paper by Grassian et al. [8] identified mechanistic data gaps that when resolved would enable a predictive biological response capability. In 2015, the first European Modelling Conference, CompNanoTox, took place in Benahavis, Spain, being organised by all European modelling and database projects funded at that time (i.e., NanoPUZZLES, ModENPTox, PreNanoTox, MembraneNanoPart, MODERN, eNanoMapper) and the EU COST action TD1204 MODENA. The resulting paper by Banares et al. [9] described the most important current challenges with respect to NM modelling. This paper described for instance shortcomings with respect to material characterisation, a lack of suitable, validated toxicity assays and a lack of mechanistic understanding of NM toxicity. This roadmap builds on the above documents. In chapters 5, 6, 7 and 8, the state of the art and the current challenges with respect to data collection and data curation (Section 5), nanochemoinformatics modelling (Section 6), materials modelling (Section 7) and nanobioinformatics (Section 8) are described. This is followed by a description of the “nanoinformatics community and stakeholders,” ongoing nanoinformatics activities, available databases, interesting projects and integrated activities etc. (Sections 9 to 11). This leads into Section 12 describing suggested milestones and several useful pilot projects grouped according to their time-horizon as short-term, mid-term or long-term projects, which are listed and described from several perspectives, i.e., the perspective of material characterisation, the perspective of toxicologists, of modellers and regulators.
EU US Roadmap Nanoinformatics
17
5. Data Collection and Curation Nina Jeliazkova1, Christine Ogilvie Hendren2, Danail Hristozov3, Lucian Farcal4, Nikolay Kochev1,5, Philip Doganis6, Peter Ritchie7, Barry Hardy4, Claus Svendsen8, Frederick Klaessig9, Egon Willighagen10, Yoram Cohen11 1 Ideaconsult Ltd, Sofia, Bulgaria 2 Center for the Environmental Implications of NanoTechnology (CEINT), Duke University, Durham, NC, USA 3 Greendecision Srl, Italy 4 Douglas Connect GmbH, Basel, Switzerland 5 Department of Analytical Chemistry and Computer Chemistry, University of Plovdiv, Plovdiv, Bulgaria 6 National Technical University of Athens, Greece 7 Institute of Occupational Medicine, Edinburgh, UK 8 Centre for Ecology and Hydrology, Wallingford, UK 9 Pennsylvania Bio Nano Systems, LLC, USA 10 Department of Bioinformatics, NUTRIM, Maastricht University, NL 11 Center for Environmental Implications of Nanotechnology (CEIN), UCLA, CA A major challenge for the nanoEHS community is the establishment of common languages, standards and harmonised infrastructures with applicability to the needs of the different stakeholders. The complexity of NMs, their physico-chemical properties and their interactions with biological and environmental systems, leads to uncertainty in the applicability of experimental data for regulatory purposes that demand sound scientific answers. Thus, recent community efforts have focused on building databases that support computational modelling and decision frameworks for NM environmental health and safety (nanoEHS) assessment and risk management. Those based on open standards, open source, common languages, and interoperable designs are desirable. Another major challenge for the nanoEHS community is linked to data quality and data curation. The NM data curation topic has been the focus of multiple collaborative efforts and publications [10-14]. Specific recommendations regarding terminology, (meta)data requirements, computational tools, and recommendations regarding the role of organisations and scientific communities have been published [13]. The terminology recommendation includes defining community agreed data completeness and quality criteria. One of the key findings is that the data completeness and quality will depend on specific user or stakeholder needs. Hence it is critical to identify the relevant scientific, regulatory, societal and industrial use cases. Building and adopting common vocabularies or ontologies address the provenance metadata requirements to represent materials and studies, manufacturer supplied identifiers, composition, impurities, as well as experimental protocols, experimental errors, etc. As investigators will vary in their knowledge of informatics, it is desirable to have standardised templates for data entry based on minimum information checklists and ISA-TAB [15] and ISA-TAB-Nano specifications [16]. However, user-friendly templates for data logging captures only one data source, a specific laboratory, when there are also other data sources such as journal articles, proprietary studies, or independently maintained databases. While challenges for NM data curation workflows are extensively described in [11], the broader experience of extracting and compiling literature data, leads to another recognised task of integration of, and exchange between, existing databases. NM entries (information)
EU US Roadmap Nanoinformatics
18
are found not only in dedicated NM databases, but also in generic chemical, toxicology and toxicogenomics databases as well as in regulatory databases like those hosted by ECHA in the context of REACH [17]. To summarise, unstructured nano-related data are relatively abundant, and rapidly generated, but are also quite dispersed across many different sources. Combining data from various sources is hampered by the lack of programmatic access and the absence (or infrequent use) of a widely shared representation of NMs and related experimental data. It has to be noted that while common vocabularies are being developed, the nanoinformatics community has not yet arrived at a commonly agreed “conceptual schema” nor agreed on how to represent the common concepts of the domain and their relationships.
5.1 Challenges: Material Representation The representation, processing, and communication of information about objects are at the core of any information system and informatics in general. The representation of chemical and biological objects is fundamental for the interdisciplinary field of bioinformatics. Chemoinformatics is a well-established field, which supplies tools for representing, processing and solving problems with chemical molecules in general. The term nanoinformatics was introduced to delineate the activities specific to managing and processing information about NMs. An adequate computer representation of the objects (entities) is required in order to handle biological, chemical, or NM information, and to enable the building of information systems. Literally, there are thousands of different descriptors that can be measured or calculated for NMs, but only a subset is likely to be relevant to a specific EHS aspect or a given application. Descriptors encompass physical and chemical identity (i.e., size, shape, chemical composition, and particle architecture) associated with material representation, intrinsic properties and extrinsic properties (Sections 6.2, 7.2.1, 7.2.2). For cheminformatics (Section 6), the central object (entity) is the molecule’s chemical structure, following the origin of the “chemoinformatics” in the context of drug design. There are several levels of chemical structure representations, which reflect different chemistry models or theories. For example, graph theoretical approaches (e.g., constitutional, topological, 3D, conformational representation) are not easily combined with quantum chemical approaches (Section 7) [18]. The structure formalisation is the starting point for all other activities and is reductionist by its nature because only particular aspects of the chemical reality are formalised. The most popular method of representing chemical structures is the chemical graph, which is the basis for representing structures by connection tables, linear notations as SMILES and InChI, and de-facto standard chemical formats such as SDF. Even those chemical databases using the same chemical graph concepts may differ in database technology and physical database schema. Unfortunately, the graph theoretic representation of well-defined chemical structures is ill-suited as a single representation of NMs: it is not able to distinguish all aspects of the NM structure, also partly because that structure may not always be known. As a result, it is difficult to distinguish between properties of a
EU US Roadmap Nanoinformatics
19
nanoscale and bulk material with the same chemical structure. The quantum chemistry formalisms are also able to capture aspects of the NMs and are used to study material functionality and structure (see Sections 7 and 12.4), but may also suffer from a lack of knowledge about the structure. Relating NM identity, characterisation and biological properties often requires less detailed representation than the quantum chemistry level, and there are several parallel attempts in this direction. There is a need for an agreed conceptual representation of a (nano-)material compatible with the emerging regulatory consensus that NMs are to be handled as an extension of chemical substances [19]. However, substances may have complex compositions. The definition of a “substance” in the European Chemicals regulation REACH implicitly covers all forms and sizes such that NMs are included as so called “nanoforms” of a substance (see Section 10.2 for impact on industry and Section 12.3 for further thoughts). Note: The reader is reminded that the terms “substance” and “nanomaterial” may have different definitions in different legislations. For instance, in the United States the Toxic Substances Control Act (TSCA) defines a substance as 'any organic or inorganic substance of a particular molecular identity, including any combination of these substances occurring in whole or in part as a result of a chemical reaction or occurring in nature, and any element or non-combined radical'. In contrast, EU REACH defines a substance as 'a chemical element and its compounds in the natural state or obtained by any manufacturing process, including any additive necessary to preserve its stability and any impurity deriving from the process used, but excluding any solvent which may be separated without affecting the stability of the substance or changing its composition'. The definitions of the terms “substance” and “material” are discussed in Roebben et al. [20], comparing ISO, EU REACH and general scientific definitions of the terms. The Nano Particle Ontology (NPO) defines a NM (NPO_199) as equivalent to a chemical substance (NPO_1973 or CHEBI_59999) that has as a constituent a nano-object, nanoparticle, engineered NM, nanostructured material, or nanoparticle formulation. The OECD Harmonised Templates represent NMs as substances consisting of components, additives and impurities, and the recent IUCLID6 implementation extends the representation to handle nanoforms. Describing the NM composition requires description of many components (also termed constituents) and the complex relations among them. For example, a NM may consist of a core and one or more layers (shells, coatings) around the core. NM representations (descriptions or identities or physical models) may differ across databases. For example, the Nano Exposure and Contextual Information Database (NECID) defines the material only by its core for the purpose of handling exposure scenarios, while the CEINT database introduces an additional concept of “instance” meaning the point in time when the NM transits to the next life cycle stage and warrants measurement of its chemical or biological properties as well as those of the system. The “instance” is considered critical by the CEINT group in order to allow investigation of the dynamic nature of NMs including the transformations and kinetic processes that have been proven to affect NM fate and effects. The EU project NanoMILE took a similar approach, linking “aged” NM properties to the initial pristine properties, and compared
EU US Roadmap Nanoinformatics
20
the toxicity of both. The EU H2020 project NanoFASE is building on the approaches developed by the EU FP7 project NanoMILE and the Center for the Environmental Implications of NanoTechnology (CEINT), such that the characteristics of NMs after “reaction” in different environmental compartments (soil, water, sediment, wastewater treatment or uptake and excretion by organisms) are all considered as different instances, unless experimentally confirmed (and in due course predicted) to be identical to the outcome from the previous compartment. The basis of many chemical databases is the direct link between the chemical structure (as chemical composition) and properties, which is well aligned to supporting modelling. However, the concept of assigning measured properties to chemical structures is yet another approximation, not directly applicable to material data representation. Instead, measured properties have to be assigned to nanoforms of ‘chemical substances’ as legally defined (i.e., considering NMs as a subclass of substances), in line with the IUPAC definition. This approach is also applicable where information on chemical substances, as produced by industry, is required. Flexibility with respect to cases where the measured property is a property not of the entire material, but only one of its components (e.g., surface layer composition) is also relevant.
5.2 Challenges: Property Representation Besides the materials themselves, a nanoinformatics data curation framework must capture the physical and chemical attributes of NMs, including the notions of mixtures, particle size distribution, shape, differences in extent of surface modification, manufacturing conditions, and batch effects. It must also capture the potential for evolution of many of these properties, such as changes in surface speciation, loss of coating, acquisition of an environmental or biological corona, and so forth, when the NM is embedded into a product, is released into the environment or comes into contact with biological organisms. Finally, there are the biological attributes (e.g., toxicological effects of NMs, modes-of-action, toxicity pathways), interactions (with different cell models), and a wide variety of measurement approaches with various specific conditions. Several analytical techniques have been adopted and developed to characterise NMs physico-chemical properties. The selected pilot project on dissolution illustrates the complexity of just one type of measurement. With expanding insight into the factors determining toxicity, the list of potentially relevant properties is growing. In vitro toxicological characterisation for hazard assessment includes many endpoints and moreover each endpoint can be addressed using different assays. High throughput cellular assays and omics data as well as kinetic measurements are becoming increasingly important in NM assessment. A common requirement for all types of users is to link the NM entries to those studies in which toxicological or biological effects of the NMs have been studied, in addition to an accurate physico-chemical characterisation. Thus, the properties and their representation should remain consistent with the descriptors used by ECHA (2017) and EPA (2017) for “nanoforms” and “nanoscale forms,” respectively, but with more detail.
EU US Roadmap Nanoinformatics
21
Supporting such heterogeneous datasets is a significant challenge. However, this is not unique to nanoinformatics. The potential solution is to organise the experimental data around the fundamental concepts of “test” and “measurement” [20]. There is evidence of database developers adopting this approach, although the terms “test”, “assay”, “experiment”, and “endpoint” are often used inconsistently across different players. The OECD guideline defines the “test” or “test method” as the experimental system used to obtain the information about a substance. The term “assay” is considered a synonym. The term “testing” is defined as applying the test method. The endpoints recommended for testing of NMs by the OECD Working Party on Manufactured NMs (OECD WPMN) use the terms and categories from the OECD Harmonised Templates (OHT). The NPO distinguishes between the endpoint of measurement (e.g., particle size, NPO_1694) and the assay used to measure the endpoint (e.g., size assay, NPO_1912), where the details of the assay can be further specified (e.g., uses technique electron microscopy, NPO_1428). This structure is generally the same as the one supported by the OHT (e.g., in the OHT granulometry type of experiment several size-related endpoints can be defined, as well as the equipment used, the protocol and specific conditions). The CODATA UDS (uniform description system) requires specification of how each particular property is measured. ISA-Tab-Nano also allows for defining the qualities measured and detailed protocol conditions and instruments. The level of detail in the OHT, CODATA UDS, ISA-Tab-Nano and available ontologies differ, which is due to their different focus. Examples
● zeta potential - entries for zeta potential property (NPO_1302), measured property (ENM_0000092), calculated property (ENM_8000111)
● materials - are materials with the old Joint Research Centre (JRC) code NM-100 (ENM_9000201) and new code JRCNM01000a (ENM_9000074) the same entity or not (not in the eNanoMapper ontology, per JRC advice)
● same term used in two (or more) ontologies in different context (example: biological process)
● how to describe COMET assay (OBI_0302736) and COMET Fpg assay – is this the same protocol, or are those different protocols. So should they be represented with Fpg= yes/no? or with a protocol parameter “enzyme=Fpg” or enzyme=”None”?
● is TEM a protocol, an experiment, or a measurement instrument? ● Ontology annotation of specifically treated cells (e.g., differentiated THP-1 cells
with macrophage-like properties). If the cell is annotated with THP-1 and the induced cellular change is only described in the protocol, the subsequent data analysis should take into account the protocol details as well.
● how to define “dispersion agent” ● how is “toxicological endpoint” defined? How is it linked or not linked with
specific assays? ● Are new classes/definitions required for chemical composition (or about
discrepancies between ontology concepts)
EU US Roadmap Nanoinformatics
22
5.3 Challenges: Data Management Plans Research Data Management Plans (RDM, DMPs) are commonly used by now, but vary greatly with respect to their content. There is an increasing level of guidance, e.g., the ELIXIR-NL overview. Having a project-level DMP matters as too frequently issues of data sharing come late in the project, slowing down project completion and limiting knowledge sharing. Data management is a cornerstone of collaboration: how, when, with what frequency, in what format are data archived and exchanged, and how, when, with what frequency data curation is done. The growing interest in DMPs has resulted in many suggested tools (see the aforementioned list) and literature, such as several articles in the “Ten Simple Rules” series about cultivating collaboration [21, 22], creating DMPs [23], and care of data [24]. The above initiatives should serve to strengthen the efficiency with which data is archived and retrieved for research purposes and ensure that everyone that uses well annotated and coordinated archived data can collaborate efficiently. Besides interactive access and archiving, data curation has received considerable attention [10, 25]. A group of US and EU scientists wrote a series of articles on this topic [24], for example, dealing with how data completeness and quality could be estimated [13, 14], and the interoperability of the data [26]. Given the importance of DMP for collaboration within a project consortium and after the project, it is surprising that these plans are not consistently peer-reviewed. Second, wider acceptance would be achieved if the DMP were an activity and not a deliverable. Not only is the DMP an active document, but it also needs auditing during the project and should clearly not be left to the project end. Peer review could focus on ensuring these features, in addition to the proposed methods for data management.
5.4 Data Curation Data curation, as defined in Section 2 [27], encompasses all of the activities that are necessary throughout the process of extracting, organising, and entering data and knowledge into discrete formats within digital resources [26], and is central to the process of enabling data integration regardless of the size, scope or purpose of a given project/tool. Various aspects of data curation, including its central role to nanoinformatics, workflow, and data completeness and quality, have been addressed in a series of papers called the NM Data Curation Initiative (NDCI), developed through the US National Cancer Informatics Program’s Nanotechnology Working Group (NCIP NanoWG) [10, 11, 13].
5.4.1 Data Quality and Completeness Based on a survey of 24 nanoinformatics resource representatives and the subsequent development of broad and flexible definitions for both data quality and completeness, Marchese-Robinson et al. report that these concepts are best understood in terms of their fit for a given purpose [13].
EU US Roadmap Nanoinformatics
23
Data quality may be considered to be a function of the potential correctness and trustworthiness of datasets, though there are a wide variety of metrics by which these attributes may be measured, including reproducibility, precision and uncertainty. Due to the pivotal role data curation plays in integrating data, “data quality” can be affected by the lack of compliance anywhere across the knowledge life cycle from initial experimental design and execution through transcription from a publication or database into the target resource and would also critically depend on how the data is annotated. The completeness of data and associated metadata may be considered to include the extent of NM characterisation along with surrounding media and experimental conditions to support specific post-analyses, or relative to conforming to a minimal information checklist. Data driven modelling methods function best with large, diverse data sets with good property coverage and broad chemical range. There is a strong need for a systematic approach to generating data for nano-bio interactions as recently advocated by Bai et al. [28]. Because these concepts continue to evolve and will inherently vary by the purpose and scope of a given resource, the data completeness and quality aspects of pilot projects are best conveyed by explanations of the processes, both technological and workflow related, that are in place to address these issues and to ensure consistency.
5.4.2 Data Curation Process The process of curating data is currently highly resource intensive in terms of management, workflow, sourcing and ontology. As standards for ontology and minimal information requirements develop over time, curation processes and tools may accordingly converge. However, in the meantime, this process should be defined for each resource to understand the implications on data sourcing, extraction, quality, completeness, and fitness for purpose [11].
5.5 Getting Data In – Data Sources and Data Entry It is important to understand the variety of data sources (e.g., literature, intermediate laboratory formats, or raw data), the criteria for inclusion in the resource, and how they are parsed. In addition to the human decision-making aspects, the technological components of curation should be characterised; it is key to understand both manual and automated data exchange formats and web- or desktop-enabled data entry tools.
5.5.1 File Formats and Templates The following section describes several existing approaches to support data entry for regulatory purposes (e.g., OHTs), research data in bioinformatics (e.g., ISA-TAB, ISA-JSON) and its extensions for NM (e.g., ISA-TAB-Nano), as well NANoREG data logging templates [29].
EU US Roadmap Nanoinformatics
24
5.5.1.1 OECD Harmonised Templates The OECD Harmonised Templates (OHTs) are structured (XML) data formats for reporting summary data on safety related studies on chemical substances. The OHTs and the supporting IT tool IUCLID6 (www.iuclid.eu) are used for preparing substance dossiers for REACH and for other regulatory frameworks operating in Europe. The substance identification section is compliant to ECHA guidance for identification and naming of substances under REACH and CLP and requires specification of detailed chemical composition (including impurities and additives), concentrations of each constituent (typical concentration and range concentration), and links to chemical structures and identifiers. Each substance is assigned a universal unique identifier (UUID), which is specific to the company, submitting the dossiers. The common list of reference substances, which also have assigned UUIDs, are used to link company-specific substance entries to the same reference substance and chemical structures. Details on manufacturing can be submitted in the relevant section. The experimental data are arranged hierarchically, within four endpoint groups covering 1) physico-chemical, 2) ecotoxicology, 3) environmental fate, and 4) toxicology. Each endpoint group contains several tens of templates for reporting specific endpoints (e.g., melting point under physico-chemical group, aquatic toxicity under ecotoxicology group). The experimental data are reported separately for each substance in substance dossiers. Specifying the testing protocols with all associated details is mandatory. The protocols used in the regulatory context are established and mostly rely on OECD test guidelines (OECD TGs). The OHTs contain vocabularies in the form of pick-lists for some of the specified fields. A substance can be marked as NM, but there is no support for describing NM specifics at the composition level. However, the surface composition (coating, core, functionalisation, along with the method of measurement), as well as NM characterisation can be specified as additional physico-chemical endpoint study records with thirteen templates being available, which include granulometry (particle size distribution), agglomeration/aggregation, crystalline phase, crystallite and grain size; specific surface area, zeta potential, aspect ratio/shape, dustiness, porosity, pour density, catalytic and photocatalytic activity and radical formation potential. The full list of OHTs is available at www.oecd.org/ehs/templates/templates.htm. NMs are covered by the substance definition of REACH, and the REACH provisions apply to them. NMs can be registered as nanoform(s) in the dossier of the corresponding non-nanoform of a substance or as distinct substance.
5.5.1.2 ISA-Tab, ISA-Tab-nano and ISA-JSON ISA, built around the 'Investigation' (i.e., the project context), 'Study' (i.e., a unit of research) and 'Assay' (i.e., the analytical measurement) data model, is a metadata framework to manage an increasingly diverse set of life science, environmental and biomedical experiments that employ one or a combination of technologies [30]. It was developed by the group of S. Sansone at the University of Oxford e-Research Centre. The framework provides means to describe complex experiments in the form of a directed acyclic graph, arranged as three hierarchical layers (i.e., investigations, studies, assays). The actual experimental readouts are stored in an additional data layer. ISA-Tab is the legacy format, relying on tab-delimited files. The latest specification (Feb 2017) defines
EU US Roadmap Nanoinformatics
25
an Abstract Model, implemented in two format specifications ISA-Tab and ISA-JSON (JavaScript Object Notation). The new ISA-JSON specification includes a JSON schema and an ecosystem of tools used for creating, validating and visualising documents and is designed around the concept of “core” ISA schema and “extensions”. It is expected that different communities will develop extensions specific to their interests. The eNanoMapper project developed a (nano)material extension for ISA-JSON V1 [31]. A separate helper JSON schema is implemented for definition of all components of the NM. The composition of a NM may contain one or several components. Each component has a role (core, coating, etc.) and linkages to other constituents. The linkage describes the relation between two components. For example, two components may be covalently bonded, one being embedded or encapsulated within another constituent etc. The default approach for representation of chemical compounds in ISA-Tab [15] is an ontology entry, which typically points to a single chemical structure. This is insufficient for describing substances of complex composition such as NMs; hence, a material file was introduced to address this need in ISA-Tab-Nano [15]. The latest ISA-Tab-Nano 1.2 specification recommends using the material file only for material composition and nominal characteristics, and to describe the experimentally determined characteristics in regular ISA-Tab assay files. The ISA-Tab-Nano project is an effort of the National Cancer Institute (NCI), National Cancer Informatics Program (NCIP) and Nanotechnology Informatics Working Group (US Nano WG) and an attempt to extend the ISA-Tab format by introducing a separate file for describing the (nano)material components. The ISA-Tab-Nano is documented in a publication [2] and in the US Nano WG wiki2, which included sample spreadsheets, but no tools to parse the files and to enforce the specification. For this reason, the practical use of ISA-Tab-Nano is not straightforward, as demonstrated by the efforts of the EU FP7 project NanoPuzzles [3] and the introduction of “ISA-Tab-logic” templates by the EU FP7 project NANoREG.
5.5.1.3 EU NanoSafety Cluster Excel Templates NANoREG data logging templates for the environmental, health and safety assessment of NMs have been developed under the JRC's leadership within the frame of the EU FP7 flagship project NANoREG [29]. A team of experts in different fields (physical-chemistry, in vivo and in vitro toxicology) has produced a set of easy-to-use templates aimed at harmonising the logging of experimentally produced data in the nanoEHS field. The templates are freely available to the nanoEHS community (Common Creative License – Share alike) [29] as a jump start towards the harmonisation, sharing and linking of data, with the purpose of bringing benefits to the data management at European level and beyond. They have a common first part to identify the sample under investigation; a second part aimed at recording basic information on the dispersion method adopted and to record the essential parameters used to fully describe an assay (the experimental settings); and a third one to log the experimental results. The experimental parameters, their values, together with the Standard Operating Procedure (SOP) linked to a given template, allow for a critical evaluation and/or comparison of the results of a given assay performed in different laboratories. This approach should also allow reproducing
EU US Roadmap Nanoinformatics
26
the assay at a later stage. The structure adopted for the templates tries to reflect the ISA-TAB logic, already widely used in 'omics' studies, while addressing the low user-friendliness of ISA-TAB files, which limits its applicability in a “basic research laboratory environment”. In the summer of 2017, the Center for the Environmental Implications of NanoTechnology (CEINT) led a stakeholder input process to expand the ISA-Tab-Nano logic templates and to propose two new functional assay templates capturing data on attachment efficiency and dissolution rate. The expansions that the templates would be poised to incorporate additional metadata, i.e., regarding sample preparation, instances of characterisation, and media characteristics necessary to track NM transformations (http://ceint.duke.edu/research/nikc/isa-tab-nano). The various adoptions and adaptations of ISA-TAB-Nano, which was from the start intended as a flat file-sharing format, provide a spreadsheet-based solution for informing and organising comparable datasets, which is consistent, but not convenient. The templates represent an important incremental step toward harmonisation of data, but one that must be surpassed in straightforwardness and ease of use to attract sufficient utilisation for amassing significant data. A separate set of Excel templates were developed by the Institute of Occupational Medicine (IOM) (http://www.iom-world.org/) and have been used to gather data in several EU FP7 projects (NANOMMUNE, NanoTEST, ENPRA, MARINA, NanoSolutions, SUN) and the COST action MODENA. These were originally derived in association with the JRC NanoHub from the OECD Harmonised Templates to provide simplified subsets for data collection. They provide a practical format for end-users collecting the results of physico-chemical, in vitro and in vivo toxicology, and more recently eco-toxicology data for a variety of experimental assays addressing nanoEHS. Whilst arranged differently, concentrating on the collection of results, they reflect the principles and include most of the essential metadata features of the ISA-TAB logic, with test method description information and the inclusion of relevant SOPs mandatory requirements. They currently lack systematic links to ontology resources, but have been successfully parsed programmatically and the data has been uploaded for further use in the eNanoMapper database infrastructure. Given their relative practicality for end users it is currently proposed within the EU NanoSafety Cluster (EU NSC) that the best features of the Cluster Excel templates described above, with required ISA-TAB logic and ontology features, should be combined and exploited for the mutual benefit of the end-user in the research laboratory environment, their sponsoring projects, and, with the data ultimately included in shared nanoEHS database(s), for greater long-term community use in a harmonised manner.
5.5.1.4 Semantic Web Formats The semantic web has been introduced as the next generation world wide web, aimed at integrating data and knowledge from different online information sources [32]. To implement this idea of a semantic web, the W3 Consortium has developed the Resource
EU US Roadmap Nanoinformatics
27
Description Framework (RDF, https://www.w3.org/RDF/) and a series of complementary standards to work with RDF, such as serialisation formats like JSON-LD, RDF/XML, and Turtle [33-35]. Since ontologies can also be expressed in RDF, for example with the Web Ontology Language (OWL) [36], this is increasingly adopted as implementation for the FAIR data requirements. This RDF approach was adopted by the eNanoMapper project and data provided by the eNanoMapper database can be downloaded as RDF data [37], using the eNanoMapper ontology. With the semantic web serialisation, eNanoMapper proposed an approach for data completeness testing and for answering scientific questions [38].
5.5.1.5 Format Conversions ISA provides documentation and tools for conversion between ISA-Tab, ISA-JSON and ISA-RDF formats [39]. Tools for conversion between several data formats (Excel templates, ISA-Tab, ISA-JSON v1, OECD HT and semantic formats) have been developed by eNanoMapper [31]. These tools also enable automatic generation of ISA-JSON files from supported input formats (e.g., NANoREG templates). If needed, the ISA-JSON files can be translated into legacy ISA-TAB via the tools provided by the ISA team. Export to ISA-JSON is enabled for each data collection of the eNanoMapper database. Another example of a web-based data system for unstructured datasets with a metadata system for dynamic generation of tabulated data is NanoDatabank [40].
5.6 Getting Data Out - Support for Data Analysis The ultimate goal of a nanosafety data infrastructure extends beyond data retrieval and collocation of similar studies. It includes enabling data analysis and data modelling for several purposes such as theory development, classification/grouping and read-across, weight-of-evidence approaches, regulatory risk assessment and management, or for decision-making, such as in stage-gate models, which are often utilised in research development and innovation processes where specific gates require differently detailed information of the material in order to decide on whether or not to move to the next stage. There are potentially conflicting metadata requirements by the different types of users and use cases. The representation of data compatible with regulatory expectations and (inter)national standards usually translates into a set of ‘robust’ study summaries (rarely raw data) for a given NM. The modelling community presents a different requirement: data analyses usually require a “spreadsheet” or matrix view of data for multiple NMs. The experimental data in the public datasets are usually not in a form appropriate for modelling. Standardisation in these sources is specific to each database. Even in curated collections, the preparation of data for modelling is not straightforward (e.g., the experimental values can be merged into a matrix in many different ways, depending on which experimental protocols and conditions are considered similar; also, there could be multiple values due to replicates or similar experiments).
EU US Roadmap Nanoinformatics
28
A number of recommendations (computational and strategic) for data curation [10, 14] relate to the ability of a data management system to support data analysis, data mining and seamless integration with modelling tools. The first level of support is to be able to download a user-selected subset of the data to be further processed by a modelling package. The next level is the ability to export data programmatically, allowing integration into third party systems and workflow engines (e.g., the Konstanz Information Miner analytics platform KNIME). Another level of integration is providing unified access to data and analysis tools in addition to the data querying facilities. This could be done by either wrapping a selected set of statistical/ machine learning packages into the database application, or using remote modelling or prediction services by submitting computational tasks and obtaining results transparently to the user. All these approaches have pros and cons and have been reviewed several times in the context of safety assessment of chemicals [41, 42]. For eNanoMapper, data access support is implemented through a REST web services application programming interface (API), allowing one to search, retrieve and upload of NMs and experimental data. The API [43] is used to interact with a number of modelling tools developed within eNanoMapper project and is publicly available [44]. Other approaches that link data with tools for high throughput toxicity data processing and model building, assessing the multimedia distribution of NMs and utilisation of decision support tools are included in the nanoinformatics platform www.nanoinfo.org [45].
5.7 Metadata Metadata are, very broadly speaking, “data about the data”. The distinction between data and metadata can vary widely across different disciplines; for example, in some cases metadata is conceived only as the bibliographic information that allows tracing the source of the information set, where in other cases, the term might apply also to quantitative data that describe how (standard methods) or when (temporal specificity) a measurement was taken. Without focusing on a single definition and for the purpose of this roadmap, we consider metadata to be another lens through which to examine whether the data being recorded include sufficient information to sort, evaluate, compare and analyse them effectively at a later time. Moreover, it is important to note the need for fit-for-purpose considerations with regard to data and metadata, regardless of how one distinguishes between them. Whether there is sufficient information to support a desired combination, comparison and analysis of a dataset depends entirely on what research questions and relationships are being investigated [13]. As an example of how metadata vary among studies or contexts, one can consider human toxicology and ecotoxicology studies. For human toxicology, the metadata consists mainly of pristine particle characterisation data, test methodology, and dosing protocols, which are then related to the “primary” observational data on detailed sub-lethal endpoints. In contrast, the observed endpoints of ecotoxicology studies can often be much simpler, e.g., survival, and the relevant metadata required to describe the exposure will generally be significantly more extensive. For ecotoxicity the exposure system (i.e., the environmental compartment components) may interact with the NM,
EU US Roadmap Nanoinformatics
29
resulting in transformations in the material form actually encountered by the receptor [46, 47]. In fact, realistically, actual exposures to materials in the environment for plants, animals and humans alike will involve similar transformations, both before reaching and after entering the organism, such that the relevant form will be dependent on surrounding media, the exposure pathway, and other external factors. In practice, these transformed particles are difficult to measure in situ using routine techniques; yet, the true form of a material that a receptor encounters and the exposure conditions are highly relevant to understanding a resulting toxic response. Because NM transformations are such a pivotal determinant of the outcome(s), it is not enough to know what you put into your ecotoxicology system, and what medium it was you put it in. There are multiple system dependencies that determine the transformations. The metadata requirements for capturing enough parameters to be able to model the fate of a NM in the environment and ultimately the exposure driving the observed effects are extensive. The importance of this can be seen in such examples as low dose chronic NM exposures in complex systems, where providing only information on what material was added to the system, would not allow for predictions of the toxic responses. In this case, absence of detailed metadata describing all biotic and abiotic system constituents and temporal variations in environmental conditions such that interactions can be interrogated would absolutely preclude interpretation of the results.
5.8 Ontologies Ontologies are tools to formalise the language used to exchange knowledge. The necessity for such tools for the nanoEHS community was clearly demonstrated and resulted in a project call within the EU FP7 program in 2012, which led to the formation of the eNanoMapper consortium. A similar need has been recognised by the materials modelling community through actions taken by the European Materials Modelling Council (EMMC, https://emmc.info/). This section provides an overview of current ontologies useful in nanoEHS research. Nanoinformatics examples include the incorporation of the Gene Ontology [48], the annotation of data in databases by eNanoMapper [49] and the dynamic classification scheme of NanoDatabank [39]. As with the physical and biological sciences, there is a range of ontology tools that in turn raise questions about standardisation, consistency, traceability and accessibility. For example, collaborative ontology development between materials modelling and nanoEHS in the context of Basic Formal Ontology (BFO) would lead to a common framework with high synergy potential for studying and documenting materials, their applications and safety. Overall, the Roadmap’s purpose is to encourage progress where progress is possible, but within the context of eventual usefulness in risk assessment. In that sense, progress will be tempered by regulatory framework considerations involving chemical identity (see Section 12.3) and validation (Sections 6.4.1 and 12.4.). To make it easier to reuse a common language, once developed, various tools are available to use ontologies. Table 2 shows general ontology tools, but it is important to
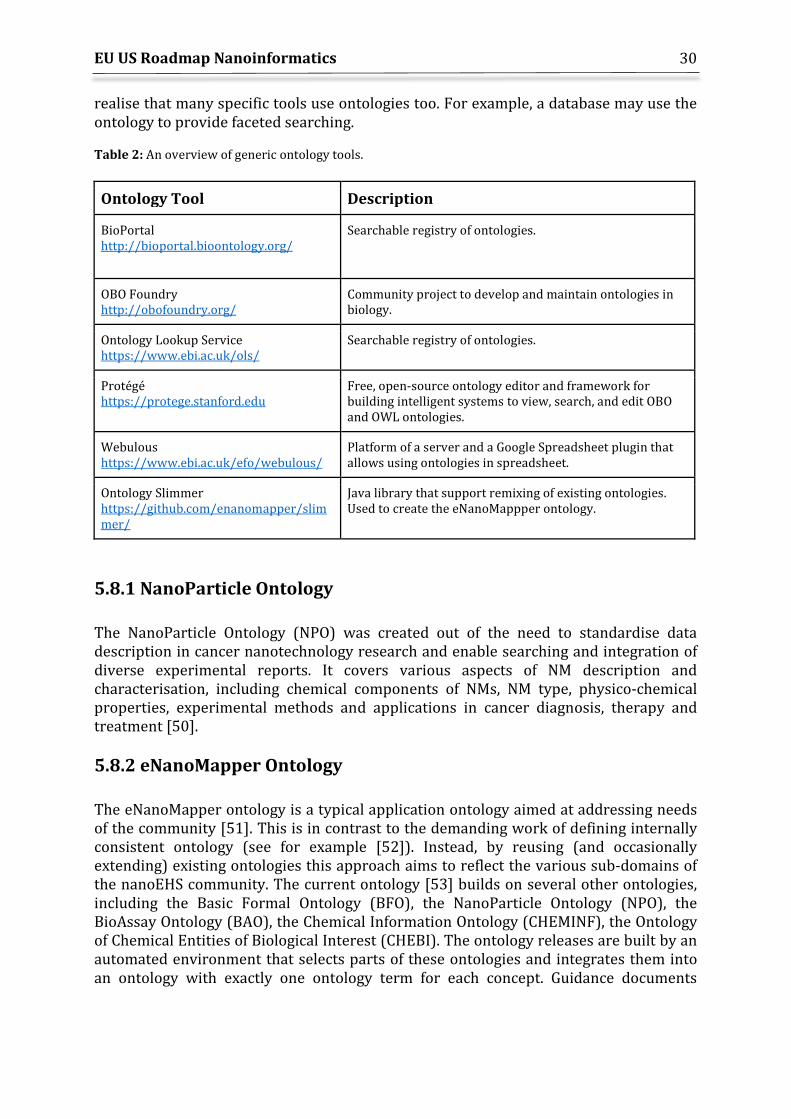
EU US Roadmap Nanoinformatics
30
realise that many specific tools use ontologies too. For example, a database may use the ontology to provide faceted searching. Table 2: An overview of generic ontology tools.
Ontology Tool Description
BioPortal http://bioportal.bioontology.org/
Searchable registry of ontologies.
OBO Foundry http://obofoundry.org/
Community project to develop and maintain ontologies in biology.
Ontology Lookup Service https://www.ebi.ac.uk/ols/
Searchable registry of ontologies.
Protégé https://protege.stanford.edu
Free, open-source ontology editor and framework for building intelligent systems to view, search, and edit OBO and OWL ontologies.
Webulous https://www.ebi.ac.uk/efo/webulous/
Platform of a server and a Google Spreadsheet plugin that allows using ontologies in spreadsheet.
Ontology Slimmer https://github.com/enanomapper/slimmer/
Java library that support remixing of existing ontologies. Used to create the eNanoMappper ontology.
5.8.1 NanoParticle Ontology The NanoParticle Ontology (NPO) was created out of the need to standardise data description in cancer nanotechnology research and enable searching and integration of diverse experimental reports. It covers various aspects of NM description and characterisation, including chemical components of NMs, NM type, physico-chemical properties, experimental methods and applications in cancer diagnosis, therapy and treatment [50].
5.8.2 eNanoMapper Ontology The eNanoMapper ontology is a typical application ontology aimed at addressing needs of the community [51]. This is in contrast to the demanding work of defining internally consistent ontology (see for example [52]). Instead, by reusing (and occasionally extending) existing ontologies this approach aims to reflect the various sub-domains of the nanoEHS community. The current ontology [53] builds on several other ontologies, including the Basic Formal Ontology (BFO), the NanoParticle Ontology (NPO), the BioAssay Ontology (BAO), the Chemical Information Ontology (CHEMINF), the Ontology of Chemical Entities of Biological Interest (CHEBI). The ontology releases are built by an automated environment that selects parts of these ontologies and integrates them into an ontology with exactly one ontology term for each concept. Guidance documents
EU US Roadmap Nanoinformatics
31
demonstrate how other controlled vocabularies map to this ontology, including a list of OECD NMs [54] and the JRC representative NMs [55]. The ontologies existing at the time of the eNanoMapper project that were related to modelling offered only fragmented coverage, with term definitions that were quite often oriented at the specific work or needs of the ontology they were a part of. In order to better describe nanoinformatics modelling actions and results, 162 terms were added to the eNanoMapper ontology, describing experimental and calculated (Image Analysis and algorithm-derived) descriptors, the processes that lead to their generation, modelling, statistics and algorithms [56].
5.8.3 NanoDatabank Ontology The use of a classification scheme to build an ontology for data entry and associated metadata was developed using a flexible dynamic metadata entry (i.e., both structured and unstructured datasets) and organisation in the NanoDatabank system, which is web-accessible [40].
5.8.4 CHEMINF Ontology The Chemical Information (CHEMINF) ontology was set up to improve the interoperability of chemical information and data [57]. It reuses concepts from other ontologies, like the Basic Formal Ontology (BFO), the Semanticscience Integrated Ontology (SIO) and Chemical Entities of Biological Interest (CHEBI) and extends this with the notion that there is information about chemical compounds. This includes a chemical graph, names, identifiers, etc. Importantly, it also formalises how to capture the difference between measured and calculated properties. The eNanoMapper ontology uses this ontology for NM identifiers and for computed properties.
5.8.5 BioAssay Ontology (BAO) The BioAssay Ontology (BAO) aims to address the need for describing and annotating biological assays in a standardised way. Experimental data is organised in “measure groups”. A measure group can be annotated with an endpoint, screened entity (e.g., chemical or NM), assay method and participants (e.g., biological macromolecule). A bioassay may contain multiple measure groups. The measure groups could be combined to create “derived” measure groups (e.g., IC50 is a derived measure from dose response data) [58]. BAO has been used for annotation of a large number of HTS assays in PubChem [59] and is used in Open Access ChEMBL database with chemical-protein affinity data. BAO is not a NM-specific ontology, but provides a useful data model for describing bioassays for arbitrary screened entities. The description of the screened entities is expected to come from elsewhere.
EU US Roadmap Nanoinformatics
32
5.8.6 Materials Modelling Ontology Activities The European Commission published a Review of Materials Modelling (RoMM), now in its 7th edition, which provides a classification of materials modelling that enables a coherent description of materials modelling and a standardised documentation of simulations (called “MODA”) of materials [60]. It applies the MODA documentation to a compendium of applications illustrated by EU H2020 LEIT NMBP Materials projects. Based on the above review, the European Materials Modelling Council (EMMC) proposed a CEN Workshop Agreement (CWA) about "Materials modelling - terminology, classification and metadata" [61], endorsed by more than 15 European Organisations with the objectives of standardisation of terminology, classification and documentation of materials modelling and simulation. The EMMC initially proposed a European Materials Modelling Ontology (EMMO) [62], which extended the Basic Formal Ontology (BFO) to address the granularity levels of materials (atomistic, electronic, mesoscale and continuum) and hence supports the perspectives important to nanoEHS, e.g., nanostructure. In due course, the EMMC decided to deviate from the BFO and build an ontology that would be a better fit for the needs of the community [63].
5.9 Data Exchange
5.9.1 Data Sharing There is significant momentum towards greater access to journal articles, databases and government reports that will allow interested parties and the public in general to have a fuller range of nanoEHS data available for examination. While impediments will certainly lessen, it is unlikely that there will be full access to all data without some requirements being placed on data sharing. From that standpoint, those administering a database should establish an appropriate policy similar to steps they will take for ensuring data security (avoiding intrusions or unauthorised changes to data entries). The data user should, in turn, realise that the data accessed may be incomplete and use professional judgement accordingly. Offering some examples of limitations that might be placed on data access is appropriate. Where academic colleagues will wait for the peer review process to be completed before releasing data, the industrial colleagues will wait for a patent to be allowed. For both, there may be issues of attribution, which would encompass authorship on papers that utilise an investigator’s dataset or payment in the case of a company-sponsored study for a REACH dossier. Competitive pressures and anti-trust laws will influence company decisions, while project proposals, thesis requirements and intent to patent and commercialise may be prominent for some academics. For many of these examples, the remaining data access impediments can be resolved through setting time limits on data embargoes, but for others, especially those data critical to a regulatory decision, industry will argue for confidential business information or trade secret status.
EU US Roadmap Nanoinformatics
33
In terms of data sharing, the experiences with model organisms are illustrative of the above considerations. As described by Leonelli and Ankeny [64], the Caenorhabditis elegans and Arabidopsis thaliana communities of research have been more successful than their Drosophila melanogaster and Mus musculus counterparts in standardising on specific strains of those species, central stock source and sharing of information. Smaller community size and a more pressing need to leverage limited research funding are advantages to Caenorhabditis elegans and Arabidopsis thaliana progress, while selecting one strain for preferred study is disruptive to suppliers and investigators attached to the strains not selected and becomes a disadvantage to the Drosophila and Mus musculus communities. As a multi-disciplinary effort, great care has been taken that the Nanoinformatics 2030 Roadmap itself be a tool fostering community interactions through both its description of current challenges and its suggested milestones. Another important step towards advancing knowledge through sharing of NM datasets will be accomplished through the wide availability of online modelling capabilities. The current picture, where users first find NM data online, must download the datasets in order to process them offline for modelling and then possibly re-upload any results (if they ever do so), makes little sense and severely slows down the advancement of knowledge. Online modelling (or Cloud modelling) infrastructure that makes available both nano-specific modelling and mathematical modelling tools is necessary to bring sophisticated tools and methodologies to a wider audience with a more moderate learning curve, ease of use and reduced or no costs. Such activity is, inevitably, dependent on appropriate and responsible data curation to ensure that high quality and complete datasets are provided, and that each study is screened appropriately. Otherwise creating validated and accurate models in a cloud-based manner becomes impossible. Augmented by advanced Nanoinformatics tools, datasets will be enriched, allowing better decision making at a shorter cycle time. Α global scope platform that provides access to mathematical modelling and nano-specific functionalities is Jaqpot Quattro (http://jaqpot.org), developed within the eNanoMapper project. Apart from a variety of algorithms for regression and clustering, users can perform Read-across, Optimal Experimental Design and Interlaboratory Comparison [44], supporting through both knowledge extraction from existing datasets and intelligent generation of consistent new data. There can be diverse motivations and requirements for each group of users (i.e., academia, industry etc.) that wishes to perform modelling work. At the same time, there can also be diverse platforms with clearly defined features that suit each group's purpose. The first such stakeholder-driven platform for NMs risk modelling and risk management decision making is the SUNDS system that was developed by the EU FP7 project SUN (http://www.sun-fp7.eu/sunds/). This online platform and the web-based System of Systems of the EU H2020 project caLIBRAte are growing in parallel to eventually form an integrated, interoperable data and modelling decision support infrastructure. This internet-based infrastructure will be capable of making efficient use of the available data for predictive modelling of possible risks from both legacy and novel NMs, as well as for the assessment and management of these risks according to regulatory requirements. An approach to data sharing has been recently incorporated in the web-based nanoinformatics platform (www.nanoinfo.org) [45], which provides a centralised data
EU US Roadmap Nanoinformatics
34
management system (NanoDatabank) with various levels of data access/security to allow and promote safe data sharing and storage. The system allows for the formation of user groups and integration of data with a range of data converters and modelling tools for predicting toxicity, fate and transport, and interrogation of complex datasets via machine learning approaches.
5.9.2 Open Science The European Commission has adopted the notion that concepts like Open Science and FAIR data (i.e., Findable, Accessible, Interoperable, Reusable data) benefit the European industries (covering both, Small and Medium Enterprises, SMEs and Large Enterprises, LEs) [65]. The FP7 and H2020 projects have adopted policies around Open Access and Open Data publishing, with great respect of sustainability of existing industries. Open Science is about being able to reuse existing knowledge and finding its origin in the American Open Source community. They noted in the late nineties that the basic rights of being able to use and reuse disseminated knowledge, modify knowledge (curate it, extend it), and redistribute the outcome of that reuse should be protected. This section describes some initiatives important to the nanoinformatics community.
5.9.2.1 European Open Science Cloud (EOSC) and Research Data Management The European Commission is promoting open science data, supported by freely accessible infrastructure. OpenAire integrates institutional repositories and also provides the Zenodo repository to upload research output (datasets and publications) files up to 50GB. Zenodo is hosted at CERN and funded by the EU and CERN and provides integration with DropBox and GitHub. Users can define collections and communities, and configure the uploaded files for restricted access and embargo periods. While Zenodo serves mainly archival purposes, the pan European collaborative data infrastructure (EUDAT) provides generic data services, such as storage and computing services to European researchers and research communities, and offers a joint metadata service integrating metadata from different communities into easily searchable and open catalogues. There is a number of services implementing cloud facilities: B2ACCESS (Authentication and Authorisation, identity provider, implemented by Unity IDM); B2DROP (offering cloud services using own cloud), B2SHARE (providing file sharing); B2STAGE (file transfer services, based on iRods data management system and GridFTP); B2SAFE (providing replication and data management policies); B2FIND (implementing metadata search), and finally BHOST (allowing custom applications to be integrated within the EUDAT infrastructure).
5.9.2.2 Infrastructure for Open Science There are various approaches to establish an infrastructure for open science, and both have traction. Firstly, there is a grassroots approach of addressing many parts of the needed infrastructure, but without integrating them into a single platform. For example, a publication is published in a scientific journal, data are hosted on Zenodo, source code
EU US Roadmap Nanoinformatics
35
on GitHub, and a mailing list with Google Groups. Secondly, one may establish a single platform for everything, which used to be popular. What matters, however, is that services follow the FAIR data principles (i.e., Findable, Accessible, Interoperable, Reusable data). Particularly, interoperability allows linking of components and reduces the chance of vendor lock-in [3].
5.10 Sustainability Objective 2 of this roadmap addresses the overarching goal that all publicly funded research data should be deposited in a sustainable database or knowledge resource. The sustainability of databases and knowledge resources created by different research and development activities is a complex multifactorial goal. What does this mean in practice? If, as part of a publicly-funded nanoEHS project, a laboratory has conducted valuable experiments, which have yielded credible results, that laboratory and others should be able to access those results in the future, e.g., five years after the project ends, and make sense and use of them in a reliable way. The following elements are key to achieving this goal with regards to nanoinformatics: 1) Agreement on best practices at the project start regarding experimental design and peer-reviewed data management plans (DMPs), including consideration of the end use of the data. 2) Data generated throughout the project should be well documented with regards to protocols, templates and metadata, and data processing workflows. Provision of data access, including review and testing, to the nanoEHS knowledge infrastructure, by the curator should be accomplished in a timely manner during the project, (even if authorisation controls are needed). 3) Education and training on data science for project team members should be completed early in the project. Interdisciplinary interactions between younger scientists within networks should be supported. This will be a core task addressed by NanoCommons (https://www.nanocommons.eu), the H2020-funded research infrastructure for nanoinformatics, which has a work package dedicated to training as part of its community building activities. NanoCommons will also operate a Helpdesk offering support to the community in all aspects of nanoinformatics, starting in early 2018. 4) The FAIR principles (i.e., Findable, Accessible, Interoperable, Reusable data) should be followed with regards to access to scientific data resources (refer to objective 2). 5) Data resource completion (e.g., according to FAIR), including a resource review, should be delivered alongside the reporting and publication of the scientific results of projects. 6) A cluster and community wide data governance framework should be established to facilitate data sharing and interactions around data. For example, a simplified process and legal framework for data sharing between projects and programs would be beneficial. Within the EU this could be accomplished within the EU NSC.
EU US Roadmap Nanoinformatics
36
However, clearly a more comprehensive vision would be to establish longer-term knowledge infrastructure programs, which are actually required to ensure sustainability of scientific resources beyond the end of specific, individually funded projects. Such infrastructure programs can address issues of engineering, robustness, performance, quality control, review, maintenance, and support of nanoinformatics projects, which are often not addressed sufficiently during research projects, and are often completely neglected after the completion of projects. OpenRiskNet (https://openrisknet.org) is such an example where data services of relevance to safety assessment will be driven by the needs of the nanoEHS community. The infrastructure project has the EU NSC as a customer. International cooperation between EU and US programs should support the development of interoperable services, common data templates and shared data curation and are an opportunity for infrastructure programs to align, harmonise and avoid unnecessary costs from duplication. Longer-term community infrastructure programs such as NanoCommons (starting the beginning of 2018) provide a common ground for the international community to work together on sustainability of community resources and aid in the development and incorporation of a common language (ontology), best practices and knowledge sharing supporting excellence and governance. Programs such as NanoCommons should also be an opportunity to strengthen international cooperation between EU and US scientists working on related informatics problems, and to interact and collaborate with establishments and agencies (such as EU ECHA and US EPA) on the long-term provision of access to information resources to all stakeholders. A mechanism for fostering a good progression from development of new methods, tools, ontology and best practices, to efforts within standards groups (such as ISO, ASTM, OECD) to develop documentary standards and test methods used within industry and obtaining regulatory acceptance should be outlined. Although it can be said that some tests in their current form are considered acceptable, or are acceptable with minor adaptation (refer to the REACH Implementation Project on Nanomaterials, RIPoN and ECHA guidance R7a-c). Such guidance could be included in documents specifically for difficult to test substances, much in the same manner as in the OECD “Guidance Document on Aquatic Toxicity Testing of Difficult Substances and Mixtures” and others. Simply adding to existing frameworks eases cost and time, and makes the implementation more efficient and accessible. All initiatives should involve a strong consultation with industry and societal stakeholders so as to ensure that resources are created that satisfy needs and have utility.
EU US Roadmap Nanoinformatics
37
6. Nanochemoinformatics and Statistical Modelling Tomasz Puzyn1, Geert Verheyen2, Sabine Van Miert2, Baoshan Xing3, Sarfraz Iqbal1, Qing Zhao4, Vladimir Lobaskin5, Gianpietro Basei6, Anastasios G. Papadiamantis7, Yoram Cohen8 1 University of Gdansk, Gdansk, Poland 2 Thomas More University of Applied Sciences, Geel, Belgium 3 Stockbridge School of Agriculture, University of Massachusetts, Amherst, MA, USA 4 Institute of Applied Ecology, Chinese Academy of Sciences, Shenyang, China 5 University College Dublin, Dublin, Ireland 6 Greendecision Srl, Italy 7 University of Birmingham, Birmingham, UK 8 Center for Environmental Implications of Nanotechnology (CEIN), UCLA, CA
6.1 Introduction The term ‘nanochemoinformatics’ refers to the application and appropriate adaptation of chemoinformatic methods for solving nanotechnology-related questions. Nowadays, such methods are mainly developed for regulatory purposes, i.e., for hazard and exposure assessment. For conventional (i.e., non-“nano”) chemicals methods such as QSAR modelling are increasingly applied, primarily within integrated assessment and testing strategies. However, the application of nanochemoinformatics methods is not limited to nanoEHS, but also covers a broad range of other purposes such as NM functionality. The term “chemoinformatics” is derived from “chemical information” understood as information regarding chemical structure. Information about different aspects of chemical structure can be encoded by a set of quantitative characteristics (e.g., the number of functional groups of a given type, the angle between two selected rings), which are generally referred to as ‘descriptors‘. Data for nanochemoinformatics modelling is usually collected in matrices (tables), where rows represent individual NMs and columns correspond to descriptors (Figure 3). Such a matrix (usually referred as X-matrix) can then be used for analysing similarities between NMs (profiling), which mathematically refers to searching for similarities between the row vectors in the matrix. NMs may be clustered together (grouped) by analysing the similarity of their descriptors by means of various hierarchical and non-hierarchical unsupervised algorithms such as Hierarchical Cluster Analysis (HCA), Principal Component Analysis (PCA), and Density-Based Spatial Clustering (DBSCAN). In any case, care must be taken on the assumptions (e.g., normality, linearity) each algorithm employs for the analysis and the conclusions reached to be statistically valid. That’s why linearity (e.g., Durbin-Watson test) and normality (e.g., Shapiro-Wilks test, Q-Q plots) checks should be performed prior to analysis for selecting the most appropriate algorithm.
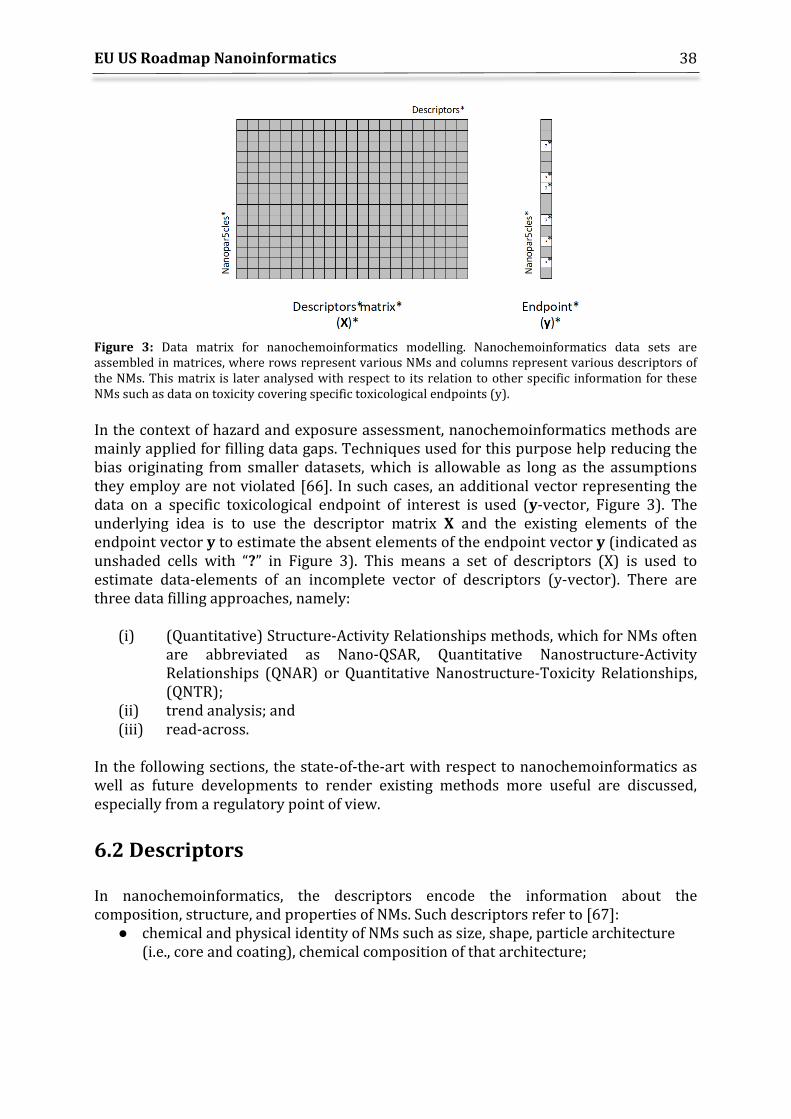
EU US Roadmap Nanoinformatics
38
Figure 3: Data matrix for nanochemoinformatics modelling. Nanochemoinformatics data sets are assembled in matrices, where rows represent various NMs and columns represent various descriptors of the NMs. This matrix is later analysed with respect to its relation to other specific information for these NMs such as data on toxicity covering specific toxicological endpoints (y). In the context of hazard and exposure assessment, nanochemoinformatics methods are mainly applied for filling data gaps. Techniques used for this purpose help reducing the bias originating from smaller datasets, which is allowable as long as the assumptions they employ are not violated [66]. In such cases, an additional vector representing the data on a specific toxicological endpoint of interest is used (y-vector, Figure 3). The underlying idea is to use the descriptor matrix X and the existing elements of the endpoint vector y to estimate the absent elements of the endpoint vector y (indicated as unshaded cells with “?” in Figure 3). This means a set of descriptors (X) is used to estimate data-elements of an incomplete vector of descriptors (y-vector). There are three data filling approaches, namely:
(i) (Quantitative) Structure-Activity Relationships methods, which for NMs often are abbreviated as Nano-QSAR, Quantitative Nanostructure-Activity Relationships (QNAR) or Quantitative Nanostructure-Toxicity Relationships, (QNTR);
(ii) trend analysis; and (iii) read-across.
In the following sections, the state-of-the-art with respect to nanochemoinformatics as well as future developments to render existing methods more useful are discussed, especially from a regulatory point of view.
6.2 Descriptors In nanochemoinformatics, the descriptors encode the information about the composition, structure, and properties of NMs. Such descriptors refer to [67]:
● chemical and physical identity of NMs such as size, shape, particle architecture (i.e., core and coating), chemical composition of that architecture;
EU US Roadmap Nanoinformatics
39
● intrinsic properties of NMs such as crystal structure/crystallinity, purity, surface area and rugosity, porosity, surface functionalities;
● extrinsic (i.e., system-dependent) properties of NMs such as electrophoretic mobility/zeta potential, biological corona, degree of aggregation/agglomeration, dissolution, surface reconstruction, sorption, surface reactivity and persistence.
Descriptors can be experimentally measured properties, usually related to the physical or chemical identity of NMs, and theoretical descriptors, which are derived from the electronic, atomistic and molecular structure of NMs and their immediate environment. Section 6 mainly focuses on descriptors as experimentally measured properties while Section 7 puts emphasis on theoretical descriptors. For the purpose of predictive modelling, any quantitative characteristic that can be consistently measured or calculated in a controlled and reproducible way can serve as a NM descriptor. In some cases, data on NM biological activity such as data for specific toxicity endpoints (e.g., mutagenicity or cytotoxicity expressed as EC50/IC50) might be used as descriptors as well. However, since this is not a purely chemical or physical type of information, such data have mainly found application in Quantitative Activity-Activity Relationships (QAAR) modelling. Generally speaking, the term ‘descriptor‘ may have a broad use in the modelling field. Note: The terms ‘descriptor‘, ‘identity‘ and ‘representation‘ have specific, well-defined meanings in informatics and modelling. Thus, as mentioned in Section 5, establishing a common language is an overarching challenge in nanoinformatics. Rows in the matrix in Figure 3 represent individual NMs. However, the definition of NMs or nanoforms in a regulatory context may include parameters related to their chemical and physical identity. In chemoinformatics, molecular structure has primacy to define the identity of chemicals. For NMs, particle architecture, size, shape or coating composition are distinguishing NM attributes that must be accounted for by the database curator, the modeller or the user. Such issues can be resolved by experience and professional judgement. As a step forward, a physical NM model is proposed in Section 12.3. The development of predictive (eco)toxicity models for conventional chemicals relies heavily on the availability of appropriate chemical descriptors that tie relevant aspects of the molecular structure and physico-chemical properties to the NM under investigation. Well-defined and robust descriptors are essential for correct modelling (i.e., highly predictive and accurate models). The base set of descriptors (the X-matrix) should satisfy the following criteria [68]:
● ideally should allow a structural interpretation; ● have significant correlation with at least one property; ● are not trivial correlations of other base set descriptors; ● exhibit gradually changing values with incremental changes in molecular
structure; ● are not restricted to a too small class of substances.
Descriptor quality and relevance are even more important for NMs as NMs require a larger number and different types of descriptors to account for their distinct properties
EU US Roadmap Nanoinformatics
40
due to several factors. The evaluation/extraction of pertinent descriptors in predictive toxicology for NMs have been suggested for planning and interpreting toxicity studies, as well as for providing guidance to tailor-designed NMs with respect to specific toxicity targets. Minimum data sets of NM descriptors required for predictive modelling encompass information on their chemical composition and intrinsic properties, which are specific for the NM but independent of the system. The system, which is influencing extrinsic properties, can be the matrix of a specific product (i.e., a specific formulation) or a specific biological environment. Unfortunately, many datasets that are currently available for NMs are incomplete and unsystematic [69]. The selection of the most appropriate descriptors is invariably model dependent (i.e., supervised descriptor selection). There are several approaches for description selection from a pool of descriptors. They must consider the redundancy of information provided by certain descriptors as well as the range of descriptor values and information provided. In such an approach, an unsupervised descriptor selection (or pruning) can be accomplished, as described for example by Liu et al. [70]. For chemicals, a hierarchy of descriptors can be derived already from the molecular structure. Molecular descriptors typically relate to steric and electronic properties of the compound and can be measured experimentally or determined computationally. Depending on the information content, descriptors are usually classified according to their dimensionality in 0D, 1D, 2D, 3D or 4D descriptors [71]. 0D or constitutional descriptors (e.g., molecular weight, atom number counts) do not consider the molecular structure; 1D descriptors like Log Kow capture bulk properties; 2D descriptors are derived from molecular connectivity and 3D descriptors take the 3-dimensional geometry of the molecule into account. The 4D descriptors are used to describe the interaction field of the molecule or to describe different conformations of the molecule. In the case of NMs, the composition and the chemical structure often do not reflect the most relevant properties for the activity, which may be linked more closely to the engineered or spontaneously modified surface. These interfacial properties can be context-dependent and may be affected by the surrounding matrix. Therefore, the primary descriptors (i.e., chemical composition and intrinsic properties) may not be the best-suited descriptors to predict the toxicological effects for NMs. Moreover, NM properties can be interdependent, meaning that by changing one property several other ones can be affected too [72]. To tease out these relationships, reliable experimental data should be available to allow the development of models (and descriptors) that describe the relationship and that can subsequently be used to classify related NMs. One approach suggested by Lynch et al. [72] is to identify 3 overarching descriptors (based on principal components analysis of observed variables) that describe intrinsic properties, extrinsic properties and composition aspects of NMs. These can then be related to the endpoints to be modelled. In another recent study, Oh et al. performed an exhaustive correlation/significance analysis of both quantitative and categorical descriptors to correlate the cellular toxicity of quantum dots [14]. This is a suitable approach to identify inter-associations of descriptors and their impacts on the cellular toxicity of quantum dots.
EU US Roadmap Nanoinformatics
41
From chemoinformatics perspective, the most extensive research has been performed for metal oxide NMs. Ying et al. [73] investigated coated and uncoated metal oxide NMs with respect to their toxicity. For coated metal oxide NMs structural descriptors describing the organic surface modifications were the key factors influencing the toxicity. Thus, this part of the study could be referred to as an organic chemicals QSAR study. For the uncoated metal oxide NMs, the experimental descriptors covered morphological structural properties such as size distribution, shape, porosity, etc. and physico-chemical properties such as zeta potential, pKa, surface charge, etc. Several methods are available and established to measure and/or extract these properties, e.g., [74]. Depending on the NM type, different parameters may be more relevant. Additional descriptors can be derived from these measurements, such as surface/volume diameter, aspect ratio or sphericity [75]. In contrast to descriptors for conventional chemicals:
a) a descriptor matrix for nanochemoinformatics rarely consists of calculated (computational) descriptors only; usually experimentally-derived descriptors are used as well
b) experimentally-derived descriptors should consider not only intrinsic, but also system-dependent (i.e., extrinsic) properties of the NMs
c) computational descriptors cannot be simply calculated from a single molecular model because of hardware limitations, but separate simplified models representing various aspects of the structure, e.g., surface, aspect ratio, are needed
Therefore, the most important challenge for future nanochemoinformatics studies is the extension of currently used descriptor sets. This can be divided into several specific tasks:
1. Extension of descriptor sets to better reflect system-dependent (i.e., extrinsic) properties
2. the development of new, preferably computational, descriptors that enable various aspects of the nano-structure to be comprehensively described
3. the development of simplified computational methods and/or molecular models (e.g., coarse-grain molecular mechanics) that enable calculating descriptors in efficient ways
Chemoinformatics relies on descriptors that represent chemical composition. The principles of chemoinformatics were established for drug and agrochemical design and accordingly the greatest depth of experience is available in that area. For the context of drug design, the chemical composition is primarily an organic molecule with an internal structure built on covalent bonds and functional groups. The molecule is in solution and many properties are measured at equilibrium. Polymers are commonly represented by monomer units. In contrast, chemical composition for inorganic and metallic NMs may be derived from phase diagrams as a stoichiometric relation without a specific molecule being present. In silica, the Si atom is chemically bound to four oxygens, even though it is represented stoichiometrically as SiO2. Furthermore, the dissolved species may not have
EU US Roadmap Nanoinformatics
42
a discrete molecular structure, but may rather be ions with different oxidation states or may be complexed with other solutes, or form small clusters. Selecting appropriate descriptors to account for the complexity of surfaces, dissolved species and type of bonding within solids is challenging. For these reasons, the modeller may decide to select some descriptors from material modelling and others from known datasets.
6.2.1 Statistical Assumptions Testing Techniques Statistical techniques always employ underlying assumptions, which make sure that the results obtained and the conclusions reached are valid. For example, in Principal Component Analysis (PCA, see Section 6.3.1), the analysis is based on a matrix of Pearson correlation coefficients and has 5 underlying assumptions: interval-level measurement, random sampling, linearity, normal distribution and bivariate normal distribution [76]. For a PCA to be valid, all assumptions have to be met, although for larger datasets the Pearson coefficient is more robust when the bivariate normal distribution is violated. Similarly, when looking for underlying correlations between the NM descriptors and the dependent variable (e.g., representing a specific toxicological endpoint), it should also be considered that both the independent and dependent variables should follow the chosen tests assumptions. At the same time, a sufficient sample number (usually test specific) is required for a parametric test to be valid or sufficiently robust from divergence from specific assumptions (e.g., t-test). For these reasons, prior to the use of any statistical technique one has to ensure an appropriate sample size and check for underlying statistical assumptions such that the chosen statistical analysis will provide reliable results [76]. For smaller, non-linear or normal datasets the use of non-parametric statistical models such as categorical PCA, Kruskal-Wallis H test or Mood’s Median test is suggested as they are more robust and will provide more reliable results. This is especially true in cases when small datasets are studied (< 50 data points), as those sets are more sensitive to the required assumptions. Those checks provide either statistical (e.g., Shapiro-Wilks, Kolmogorov-Smirnov) or visual results (Q-Q plots). Short descriptions for three of the most commonly used techniques is included below. However, it should be noted that NM datasets often suffer from being rather small such that care must always be taken when choosing statistical models, making sure that they are appropriate for small datasets. The techniques discussed below (i.e., the Durbin-Watson test, the Shapiro-Wilks (SW) test and the Q-Q plots) are specifically designed to test the normality and linearity of data sets. It should be noted, however, that there are cases in which the dependent variable (y - vector) and/ or the descriptors are not normally distributed. It also should be noted that the sample size is of larger importance when assessing statistical assumptions over the correlations of descriptors. Thus, non-parametric statistical analysis methods can be helpful when the data are not normally distributed and the sample size is small. In some cases, hypothesis tests such as a simple t-test may still work better with non-normal data distribution, particularly if the sample number is sufficiently high (i.e., >> 15). In case of non-normality, non-parametric tests such as Kruskal Wallis H test, which is powerful but not very robust with respect to outliers, or
EU US Roadmap Nanoinformatics
43
Mood's Median test, which is not as reliable as the Kruskal Wallis H test but robust with respect to outliers, will provide a better test of performance robustness.
6.2.2 Durbin-Watson Test for Data Linearity The Durbin-Watson (DW) test is used to test the hypothesis that the residuals from a linear regression are uncorrelated. The DW test assumes that the data follow a linear model and tests that the residuals from a least square regression are not correlated against the hypothesis that they follow a first order correlation [77, 78]. The DW test provides a statistic with values ranging from 0 to 4, with 0 and 4 indicating a positive (0) and a negative correlation (4), respectively, and 2 suggesting no correlation [79]. Care should be taken when using the DW test, as it can produce false positive results based on specific data characteristics and it requires a large sample number [80].
6.2.3 Shapiro-Wilks Test for Data Normality The Shapiro-Wilks (SW) test is a statistical method developed by Samuel Sanford Shapiro and Martin Wilk to test whether a dataset follows a normal distribution and can be used to validate underlying normality assumptions, required in other statistical models. SW is the most powerful of the more frequently used normality tests [81] and has also the advantage that it can be used for small sample sizes and extreme values, where other frequently used tests such as Anderson-Darling or Kolmogorov-Smirnoff become unreliable [82, 83]. The SW test will test the null hypothesis that a sample originates from a normally distributed dataset [84]. If the p-value is greater than the desired level of significance (usually 0.05) then the data in question follow a normal distribution, although the exact accepted level of significance may vary. There is no absolute level of significance, as this ultimately is a decision based on various factors, depending on the type of analysis and/or intended use of the data.
6.2.4 Normal Quantile-Quantile Plots (Q-Q plots) Normal Q-Q plots are a visual technique to assess the normality (or other distribution) of a dataset. They can be used in addition to other statistic techniques and are in particular useful for quickly estimating data distribution. They graphically compare the actual data with the theoretically expected values if they followed a normal distribution [83]. The visual estimation of the goodness of fit (with the y = x, 45o line) provides information on whether the data are normally distributed (Figure 4a), skewed (Figure 4b) or sigmoidal (Figure 4c). Outliers may be observed as well (Figure 4b) [85].
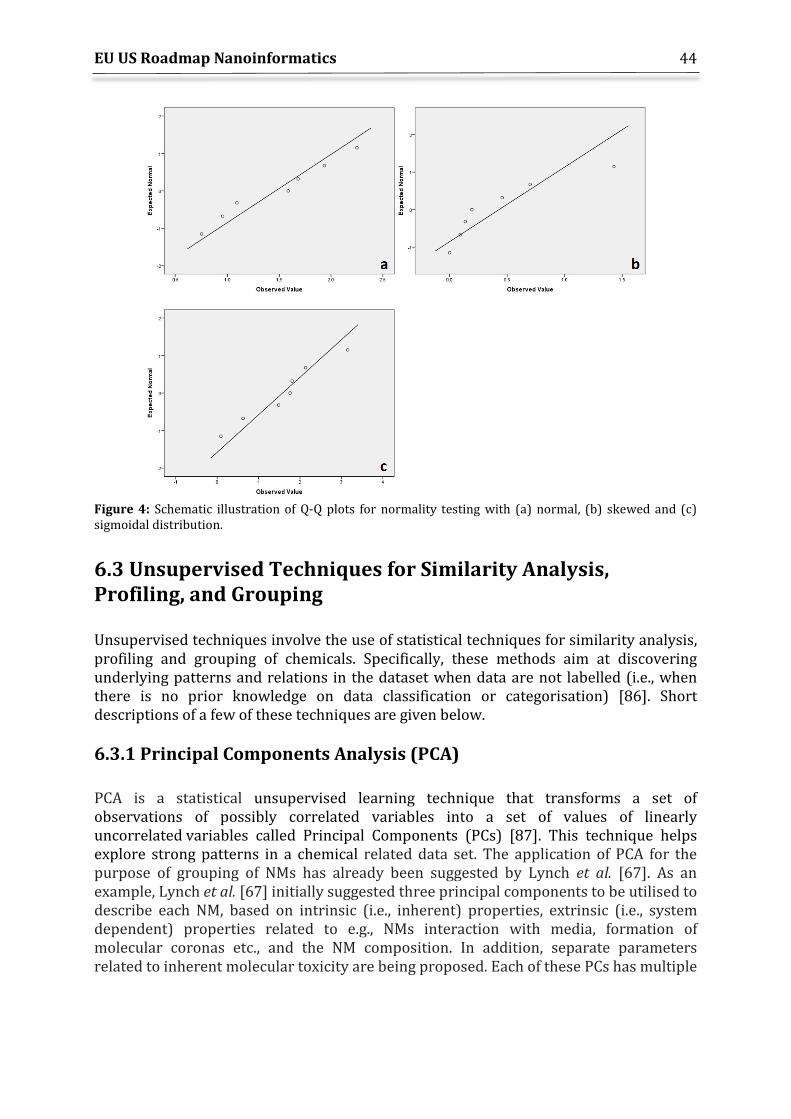
EU US Roadmap Nanoinformatics
44
Figure 4: Schematic illustration of Q-Q plots for normality testing with (a) normal, (b) skewed and (c) sigmoidal distribution.
6.3 Unsupervised Techniques for Similarity Analysis, Profiling, and Grouping Unsupervised techniques involve the use of statistical techniques for similarity analysis, profiling and grouping of chemicals. Specifically, these methods aim at discovering underlying patterns and relations in the dataset when data are not labelled (i.e., when there is no prior knowledge on data classification or categorisation) [86]. Short descriptions of a few of these techniques are given below.
6.3.1 Principal Components Analysis (PCA) PCA is a statistical unsupervised learning technique that transforms a set of observations of possibly correlated variables into a set of values of linearly uncorrelated variables called Principal Components (PCs) [87]. This technique helps explore strong patterns in a chemical related data set. The application of PCA for the purpose of grouping of NMs has already been suggested by Lynch et al. [67]. As an example, Lynch et al. [67] initially suggested three principal components to be utilised to describe each NM, based on intrinsic (i.e., inherent) properties, extrinsic (i.e., system dependent) properties related to e.g., NMs interaction with media, formation of molecular coronas etc., and the NM composition. In addition, separate parameters related to inherent molecular toxicity are being proposed. Each of these PCs has multiple
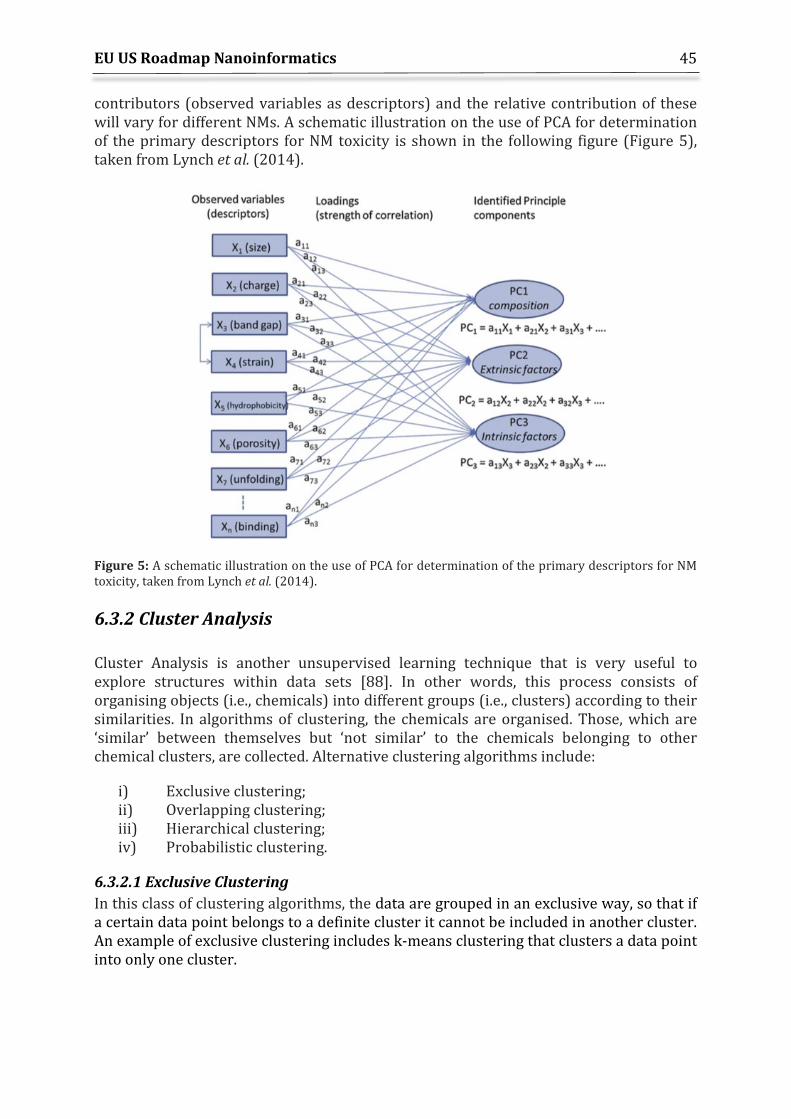
EU US Roadmap Nanoinformatics
45
contributors (observed variables as descriptors) and the relative contribution of these will vary for different NMs. A schematic illustration on the use of PCA for determination of the primary descriptors for NM toxicity is shown in the following figure (Figure 5), taken from Lynch et al. (2014).
Figure 5: A schematic illustration on the use of PCA for determination of the primary descriptors for NM toxicity, taken from Lynch et al. (2014).
6.3.2 Cluster Analysis Cluster Analysis is another unsupervised learning technique that is very useful to explore structures within data sets [88]. In other words, this process consists of organising objects (i.e., chemicals) into different groups (i.e., clusters) according to their similarities. In algorithms of clustering, the chemicals are organised. Those, which are ‘similar’ between themselves but ‘not similar’ to the chemicals belonging to other chemical clusters, are collected. Alternative clustering algorithms include:
i) Exclusive clustering; ii) Overlapping clustering; iii) Hierarchical clustering; iv) Probabilistic clustering.
6.3.2.1 Exclusive Clustering In this class of clustering algorithms, the data are grouped in an exclusive way, so that if a certain data point belongs to a definite cluster it cannot be included in another cluster. An example of exclusive clustering includes k-means clustering that clusters a data point into only one cluster.
EU US Roadmap Nanoinformatics
46
6.3.2.2 Overlapping Clustering These algorithms use fuzzy sets to cluster data, so that each object may belong to two or more clusters with different degrees of membership. In this case, data will be associated to an appropriate membership value.
6.3.2.3 Hierarchical Clustering This algorithm is based on the union between the two nearest clusters. The starting condition is realised by setting every data point as a cluster. After several iterations final clusters are realised. Based on the distance among objects (i.e., chemicals), hierarchical clustering connects these objects to form clusters such that objects closer to each other are more correlated. Hierarchical clustering is often based on Euclidean distance between the data points. However, other similarity metrics can be used as well [89].
6.3.2.4 Probabilistic Clustering This cluster analysis relies on a completely probabilistic approach [90]. Approaches such as Bayesian regression and expectation maximisation (EM) represent probabilistic clustering since algorithms like EM use Gaussian mixture models to assign a posterior probability to each data point as belonging to a certain cluster.
Generally speaking, techniques such as K-means (an exclusive clustering technique) and hierarchical clustering are the most commonly used clustering approaches. Clustering techniques are useful in initial steps of exploratory data analysis, to provide insights about similarities in both toxicological outcomes and descriptors. Moreover, these algorithms are powerful tools to assist grouping and categorisation of chemicals. Indeed, clustering methods have already been adopted in nanochemoinformatics as an initial step in the development of QSAR models to examine if NMs showing similarity in descriptors also show a similar biological activity [91-93] and to provide grouping of NMs in different toxicity classes and then to use those clusters for toxicity prediction of yet untested materials [94].
6.3.3 Self Organising Maps A Kohonen Self Organising Map (SOM) is a special type of Artificial Neural Network (ANN) that it is used to reduce dimensionality of data, providing a representation of the input space through a lattice (usually one- or two-dimensional). The SOM method assigns data points (i.e., chemicals) to prototype vectors of the same size of the total number of descriptors, corresponding to a cell of the lattice. These vectors (called weight vectors or codes) are iteratively updated in such a way that they “self-organise” in a smoothed way: weight vectors of neighbouring nodes in the lattice will thus be similar. SOM clustering analysis provides visual representation of the similarities between responses based on non-categorised response data. Analysis by SOMs is useful since it projects the data onto a 2D map while preserving the topology of original data (i.e., the relative distances among SOM cells are related to the degree of differences in the data vector represented in each cell). SOMs have been successfully used in various exploratory data analyses [95-97].
EU US Roadmap Nanoinformatics
47
Specifically, the general algorithm to train a SOM works as follows:
1. Randomly initialise weight vectors corresponding to each node of the lattice. 2. Select at random an observation (i.e., a chemical) from the dataset. 3. Find the node in the lattice whose prototype vector in the lattice is the most
similar (in terms of e.g., Euclidean distance) to the observation: this node is known as the Best Matching Unit (BMU).
4. Weight vectors of nodes found within the radius of the neighbourhood of the BMU are updated to be similar to the BMU vector. The closer a node is to the BMU, the more the weights are altered. The function used to compute the radius ensures it diminishes at each iteration, in such a way that it starts covering the whole lattice and corresponds to a single node (the BMU) at the final step. Ideally, average distance between nodes in the lattice and dataset sample(s) represented by that node decrease at each iteration, eventually reaching a plateau.
5. Repeat starting from step 2 for N iterations or until no significant change in the weight vectors is observed.
Once the SOM have been trained, it is possible to investigate the distribution of each descriptor across the SOM by means of heat maps. Comparison of these heat maps provides insights about relationships between descriptors. Another useful visualisation is the so-called U-Matrix, which shows the distance between each node and its neighbours: large distances indicate dissimilarity among the nodes, and thus can be viewed as boundaries between clusters of nodes. Indeed, after training, SOM cluster analysis algorithms (described in section 6.3.2) are often applied to the nodes of the lattice, which accordingly categorise the original dataset. Ideally, the clusters derived in such a way are contiguous when drawn with different colours on the lattice. Contiguousness can be ensured by imposing that the nodes be both similar in weight vectors and close to each other. However, care should be taken during reporting, as the original topology of the map is what is most important during analysis of vector similarity. Alternatively, it is possible to guarantee classes to be contiguous by using Supervised SOMs [98], where each node is associated, in addition to its weight vector, to a vector representing specific properties of interest. In this way the SOM learns at the same time relations in the descriptors (X space) and in the desired outcome (Y space), plus the correlation between the two spaces. SOMs analysis followed by clustering analysis have been adopted as a tool to analyse toxicity-related cell signalling pathways for metal and metal oxide NMs at different exposure times [99]. Supervised SOMs, on the other hand, have been used to explore experimental and simulated crystal structures via powder diffraction patterns, highlighting structure-property relations and demonstrating that the results become easier interpretable [100].
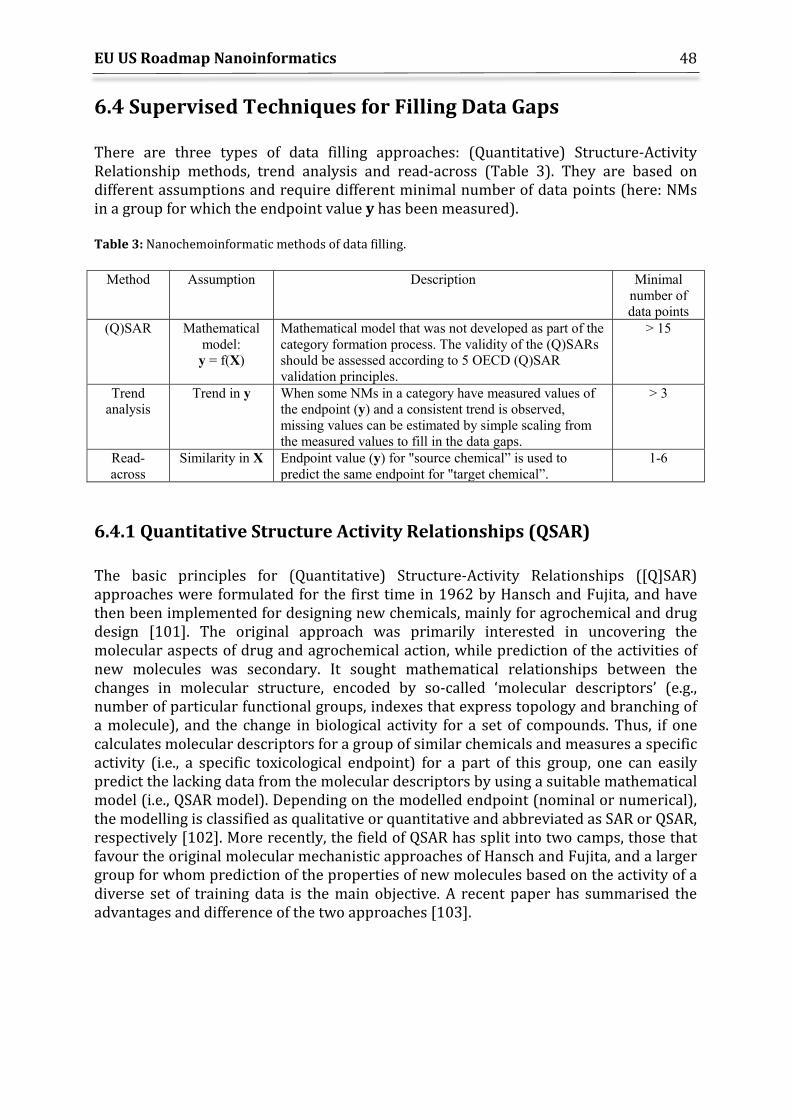
EU US Roadmap Nanoinformatics
48
6.4 Supervised Techniques for Filling Data Gaps There are three types of data filling approaches: (Quantitative) Structure-Activity Relationship methods, trend analysis and read-across (Table 3). They are based on different assumptions and require different minimal number of data points (here: NMs in a group for which the endpoint value y has been measured). Table 3: Nanochemoinformatic methods of data filling.
Method Assumption Description Minimal number of data points
(Q)SAR Mathematical model: y = f(X)
Mathematical model that was not developed as part of the category formation process. The validity of the (Q)SARs should be assessed according to 5 OECD (Q)SAR validation principles.
> 15
Trend analysis
Trend in y When some NMs in a category have measured values of the endpoint (y) and a consistent trend is observed, missing values can be estimated by simple scaling from the measured values to fill in the data gaps.
> 3
Read-across
Similarity in X Endpoint value (y) for "source chemical” is used to predict the same endpoint for "target chemical”.
1-6
6.4.1 Quantitative Structure Activity Relationships (QSAR) The basic principles for (Quantitative) Structure-Activity Relationships ([Q]SAR) approaches were formulated for the first time in 1962 by Hansch and Fujita, and have then been implemented for designing new chemicals, mainly for agrochemical and drug design [101]. The original approach was primarily interested in uncovering the molecular aspects of drug and agrochemical action, while prediction of the activities of new molecules was secondary. It sought mathematical relationships between the changes in molecular structure, encoded by so-called ‘molecular descriptors’ (e.g., number of particular functional groups, indexes that express topology and branching of a molecule), and the change in biological activity for a set of compounds. Thus, if one calculates molecular descriptors for a group of similar chemicals and measures a specific activity (i.e., a specific toxicological endpoint) for a part of this group, one can easily predict the lacking data from the molecular descriptors by using a suitable mathematical model (i.e., QSAR model). Depending on the modelled endpoint (nominal or numerical), the modelling is classified as qualitative or quantitative and abbreviated as SAR or QSAR, respectively [102]. More recently, the field of QSAR has split into two camps, those that favour the original molecular mechanistic approaches of Hansch and Fujita, and a larger group for whom prediction of the properties of new molecules based on the activity of a diverse set of training data is the main objective. A recent paper has summarised the advantages and difference of the two approaches [103].
EU US Roadmap Nanoinformatics
49
Later, when the need to assess potential health risks posed by new chemicals arose, (Q)SAR methods found many applications for hazard assessment. Examples of SAR and QSAR models developed for predicting various toxicity and ecotoxicity endpoints can be found in the literature [104-107]. (Q)SAR can reduce animal testing according to the 3R principles (Replacement, Reduction, Refinement of animal testing) [108]. An international co-operation among OECD member countries on (Q)SARs started in 1990. The OECD principles for validation of (Q)SAR models were released in 2004, and a guidance document was published in 2007. (Q)SAR techniques have also been recommended as valuable alternatives in Article 13 of the EU REACH regulation [109]. In 2009 [110] the groups of Jerzy Leszczynski and Tomasz Puzyn jointly proposed to apply the QSAR methodology for predicting toxicity of NMs (Nano-QSAR). A proof-of-concept (i.e., a first Nano-QSAR) developed for toxicity of 17 metal oxides NMs to E. coli bacteria was published two years later [111]. At the same time, André Nel and collaborators proposed to employ QSAR-like methods for NM High Throughput Screening Data to assess NM safety [112]. In parallel, the groups of Yoram Cohen and Robert Rallo published the first classification Nano-SAR model [113] and proposed using self-organising map analysis for assessing toxicity-related cell signalling pathways [99] and advanced an approached for identifying association rules for cell responses induced by exposure to NMs [114, 115]. The above studies were performed for metals, metal oxides and surface modified variants of such NMs [116]. In addition, Cohen and his group presented more recent work on QSARs for gold NMs that considered the role of the protein corona [117] and QSARs developed for quantum dots [14]. Methodology of Nano-(Q)SAR was further developed during next years, which included new descriptors, methods and models [75, 118-132]. It is widely accepted that Nano-QSAR models can significantly support current efforts with respect to NM grouping and can be used for data gap filling within the established groups. There is a number of recently proposed grouping schemes for NMs, for example the ones worked out by the ECETOC Nano Force Group (DF4NANO) [133], by the Dutch National Institute for Public Health and the Environment (RIVM) [134] and by EU FP7 MARINA research project [135]. QSARs developed for classic chemicals help identify the direct influence of the structure on the modelled property. As such, the model indicates, which structural features are mainly responsible for the observed property or toxicity. In the case of NMs, it might be impossible to go directly from the structure to toxicity, since an additional level of information (i.e., extrinsic properties) should be considered. In this context, “global” Nano-QSAR models can be applied for justifying or establishing particular grouping criteria. This means, the properties of higher levels (i.e., stability) might be expressed as a combination of properties from lower lever (i.e., chemical identity) plus the influence of the system (external conditions, e.g., pH). Thus, human toxicity and ecotoxicity can be expressed as a combination of intrinsic and extrinsic properties of NMs. In such a way, the hypotheses formulated a priori for particular grouping criteria can be verified. When grouping criteria for engineered NMs are finally established, the efforts of the modellers should be put on developing so-called “local” Nano-QSAR models, i.e., models
EU US Roadmap Nanoinformatics
50
capable predicting properties of NMs within the identified groups (categories). In effect, existing data gaps can then be filled. However, only the results from appropriately validated models should be accepted. Well-known universal OECD principles on the validation of QSARs [136] provide the conditions that must be fulfilled to accept the model (and the predicted results) to be used for the regulatory purpose. These are:
1. Clearly defined endpoint; 2. Unambiguous algorithm; 3. Defined applicability domain; 4. Appropriate measures of goodness-of-fit, robustness and predictive ability; 5. Mechanistic interpretation, if possible.
It should be noted that the above condition no. 4. implies that the model must be externally validated. This means the validation should be performed using data on NMs, which have not been previously used for developing that model. Detailed interpretation of the five OECD principles for newly developed Nano-QSARs was widely discussed between the modellers and a summary was presented in Puzyn et al. [137]. It is also noted that in a series of papers by Cohen et al. [114, 117, 138] a workflow for the development and validation of QSARs was presented and demonstrated focusing on the cellular toxicity of NMs. In these studies, issues that pertain to descriptor identification and selection, data processing (and cleaning), model training and validation (including robustness), and determination of model applicability domain are addressed. Firstly, existing Nano-QSAR models are limited to rather simple cases, where usually one in vitro toxicity endpoint was strongly related to one or two simple structural properties of the materials that did not depend on the external conditions (i.e., intrinsic properties). In further perspective, additional work is needed to obtain fully functional models. Such models must include information on the structure, which is dynamically changing in dependence on the external conditions. This may require including additional “dimensionality” in the set of descriptors. Moreover, pure probabilistic approaches in QSAR may be supported by deterministic components, i.e., QSAR equations may be augmented by equations derived based on physical principles. Secondly, the majority of the existing Nano-QSAR models was developed for NMs built from only one type of molecules (e.g., uncoated metal oxides NMs) [75, 111, 125, 131] or from two types, but with one remaining unchanged in the set (e.g., NMs having the same core but differing surface coatings) [139, 140]. Therefore, there is a need to develop new structural descriptors for chemical materials varying by more than one chemical species at the same time. Thirdly, the development of QSARs requires experimental data measured for a sufficient number of NMs varying by the structure and being representative for the whole general population of materials of a given type (e.g., 50 ZnO NM variants differing in size, coating etc., representative for the whole space of possible ZnO NM variants) [141]. Moreover, data for all of them should be obtained by using the same experimental protocol. As it was concluded in various EU projects (Figure 6), when analysing literature, there are
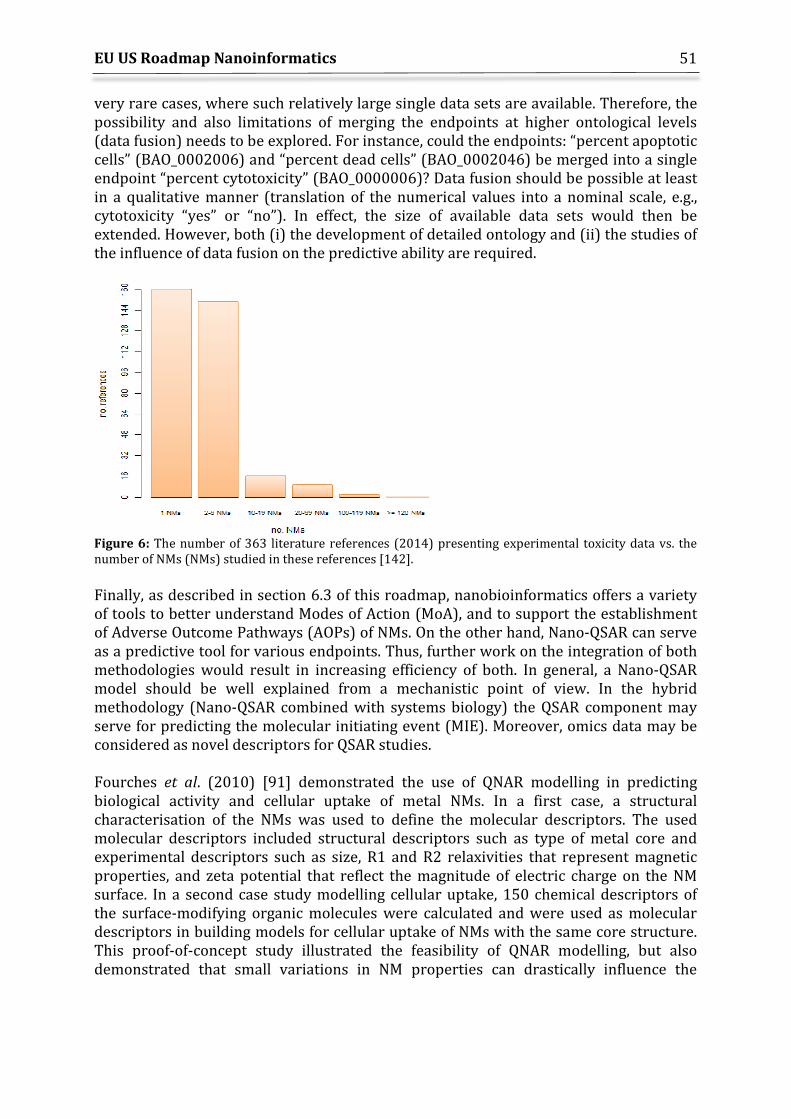
EU US Roadmap Nanoinformatics
51
very rare cases, where such relatively large single data sets are available. Therefore, the possibility and also limitations of merging the endpoints at higher ontological levels (data fusion) needs to be explored. For instance, could the endpoints: “percent apoptotic cells” (BAO_0002006) and “percent dead cells” (BAO_0002046) be merged into a single endpoint “percent cytotoxicity” (BAO_0000006)? Data fusion should be possible at least in a qualitative manner (translation of the numerical values into a nominal scale, e.g., cytotoxicity “yes” or “no”). In effect, the size of available data sets would then be extended. However, both (i) the development of detailed ontology and (ii) the studies of the influence of data fusion on the predictive ability are required.
Figure 6: The number of 363 literature references (2014) presenting experimental toxicity data vs. the number of NMs (NMs) studied in these references [142]. Finally, as described in section 6.3 of this roadmap, nanobioinformatics offers a variety of tools to better understand Modes of Action (MoA), and to support the establishment of Adverse Outcome Pathways (AOPs) of NMs. On the other hand, Nano-QSAR can serve as a predictive tool for various endpoints. Thus, further work on the integration of both methodologies would result in increasing efficiency of both. In general, a Nano-QSAR model should be well explained from a mechanistic point of view. In the hybrid methodology (Nano-QSAR combined with systems biology) the QSAR component may serve for predicting the molecular initiating event (MIE). Moreover, omics data may be considered as novel descriptors for QSAR studies. Fourches et al. (2010) [91] demonstrated the use of QNAR modelling in predicting biological activity and cellular uptake of metal NMs. In a first case, a structural characterisation of the NMs was used to define the molecular descriptors. The used molecular descriptors included structural descriptors such as type of metal core and experimental descriptors such as size, R1 and R2 relaxivities that represent magnetic properties, and zeta potential that reflect the magnitude of electric charge on the NM surface. In a second case study modelling cellular uptake, 150 chemical descriptors of the surface-modifying organic molecules were calculated and were used as molecular descriptors in building models for cellular uptake of NMs with the same core structure. This proof-of-concept study illustrated the feasibility of QNAR modelling, but also demonstrated that small variations in NM properties can drastically influence the
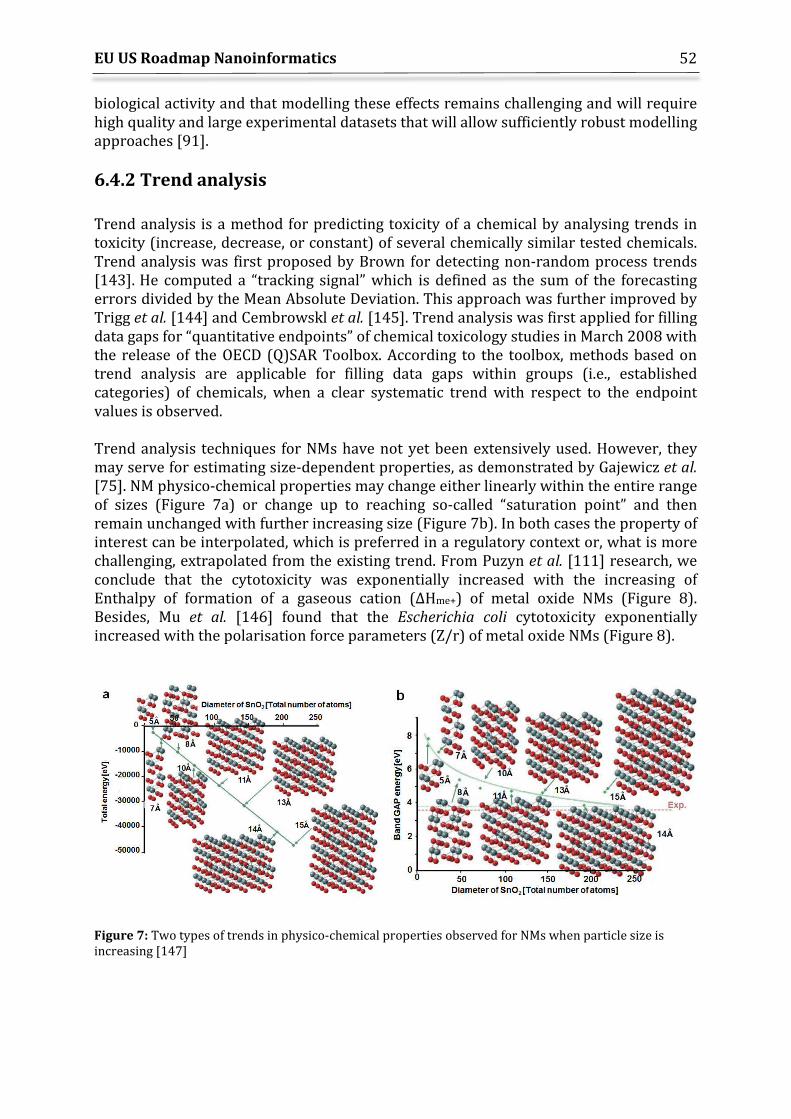
EU US Roadmap Nanoinformatics
52
biological activity and that modelling these effects remains challenging and will require high quality and large experimental datasets that will allow sufficiently robust modelling approaches [91].
6.4.2 Trend analysis Trend analysis is a method for predicting toxicity of a chemical by analysing trends in toxicity (increase, decrease, or constant) of several chemically similar tested chemicals. Trend analysis was first proposed by Brown for detecting non-random process trends [143]. He computed a “tracking signal” which is defined as the sum of the forecasting errors divided by the Mean Absolute Deviation. This approach was further improved by Trigg et al. [144] and Cembrowskl et al. [145]. Trend analysis was first applied for filling data gaps for “quantitative endpoints” of chemical toxicology studies in March 2008 with the release of the OECD (Q)SAR Toolbox. According to the toolbox, methods based on trend analysis are applicable for filling data gaps within groups (i.e., established categories) of chemicals, when a clear systematic trend with respect to the endpoint values is observed. Trend analysis techniques for NMs have not yet been extensively used. However, they may serve for estimating size-dependent properties, as demonstrated by Gajewicz et al. [75]. NM physico-chemical properties may change either linearly within the entire range of sizes (Figure 7a) or change up to reaching so-called “saturation point” and then remain unchanged with further increasing size (Figure 7b). In both cases the property of interest can be interpolated, which is preferred in a regulatory context or, what is more challenging, extrapolated from the existing trend. From Puzyn et al. [111] research, we conclude that the cytotoxicity was exponentially increased with the increasing of Enthalpy of formation of a gaseous cation (ΔHme+) of metal oxide NMs (Figure 8). Besides, Mu et al. [146] found that the Escherichia coli cytotoxicity exponentially increased with the polarisation force parameters (Z/r) of metal oxide NMs (Figure 8).
Figure 7: Two types of trends in physico-chemical properties observed for NMs when particle size is increasing [147]
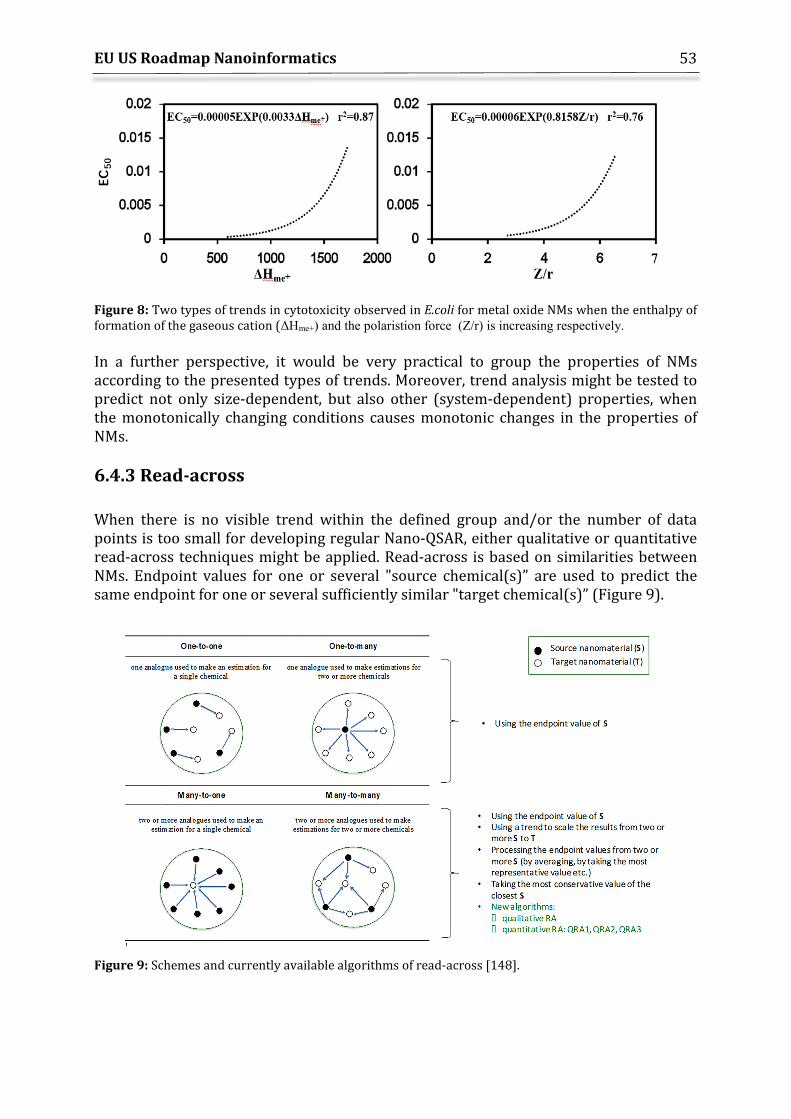
EU US Roadmap Nanoinformatics
53
Figure 8: Two types of trends in cytotoxicity observed in E.coli for metal oxide NMs when the enthalpy of formation of the gaseous cation (ΔHme+) and the polaristion force (Z/r) is increasing respectively. In a further perspective, it would be very practical to group the properties of NMs according to the presented types of trends. Moreover, trend analysis might be tested to predict not only size-dependent, but also other (system-dependent) properties, when the monotonically changing conditions causes monotonic changes in the properties of NMs.
6.4.3 Read-across When there is no visible trend within the defined group and/or the number of data points is too small for developing regular Nano-QSAR, either qualitative or quantitative read-across techniques might be applied. Read-across is based on similarities between NMs. Endpoint values for one or several "source chemical(s)” are used to predict the same endpoint for one or several sufficiently similar "target chemical(s)” (Figure 9).
Figure 9: Schemes and currently available algorithms of read-across [148].
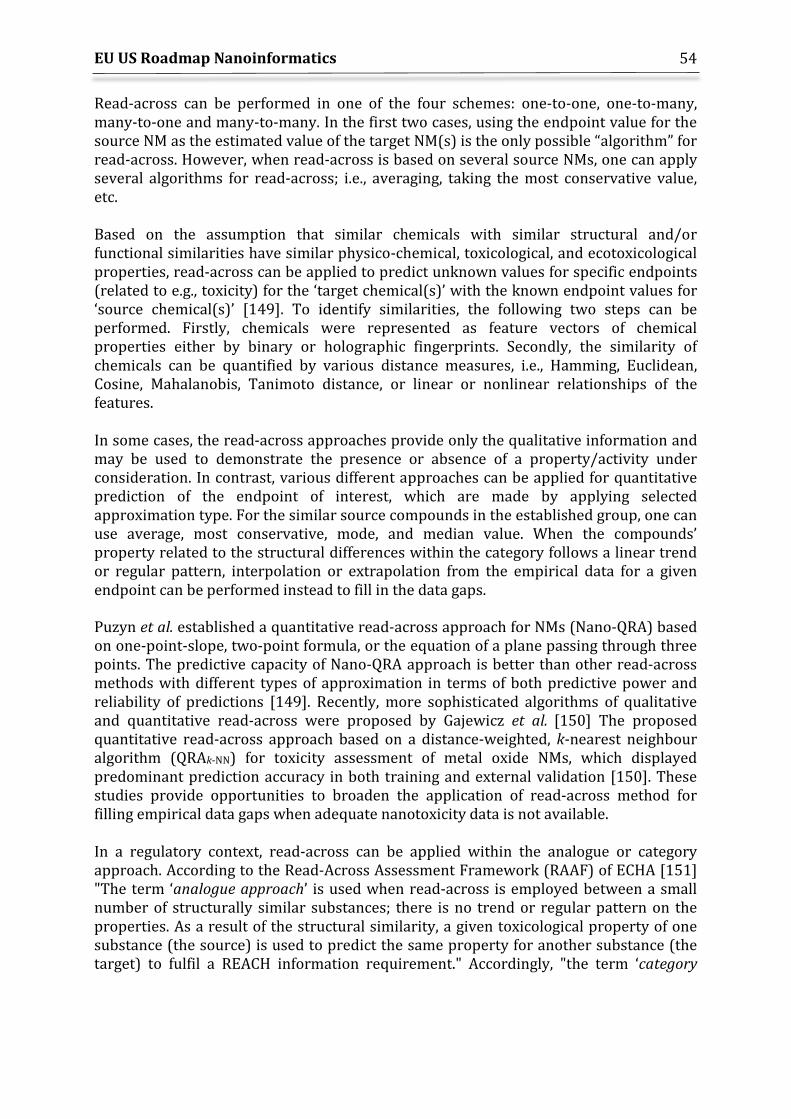
EU US Roadmap Nanoinformatics
54
Read-across can be performed in one of the four schemes: one-to-one, one-to-many, many-to-one and many-to-many. In the first two cases, using the endpoint value for the source NM as the estimated value of the target NM(s) is the only possible “algorithm” for read-across. However, when read-across is based on several source NMs, one can apply several algorithms for read-across; i.e., averaging, taking the most conservative value, etc. Based on the assumption that similar chemicals with similar structural and/or functional similarities have similar physico-chemical, toxicological, and ecotoxicological properties, read-across can be applied to predict unknown values for specific endpoints (related to e.g., toxicity) for the ‘target chemical(s)’ with the known endpoint values for ‘source chemical(s)’ [149]. To identify similarities, the following two steps can be performed. Firstly, chemicals were represented as feature vectors of chemical properties either by binary or holographic fingerprints. Secondly, the similarity of chemicals can be quantified by various distance measures, i.e., Hamming, Euclidean, Cosine, Mahalanobis, Tanimoto distance, or linear or nonlinear relationships of the features. In some cases, the read-across approaches provide only the qualitative information and may be used to demonstrate the presence or absence of a property/activity under consideration. In contrast, various different approaches can be applied for quantitative prediction of the endpoint of interest, which are made by applying selected approximation type. For the similar source compounds in the established group, one can use average, most conservative, mode, and median value. When the compounds’ property related to the structural differences within the category follows a linear trend or regular pattern, interpolation or extrapolation from the empirical data for a given endpoint can be performed instead to fill in the data gaps. Puzyn et al. established a quantitative read-across approach for NMs (Nano-QRA) based on one-point-slope, two-point formula, or the equation of a plane passing through three points. The predictive capacity of Nano-QRA approach is better than other read-across methods with different types of approximation in terms of both predictive power and reliability of predictions [149]. Recently, more sophisticated algorithms of qualitative and quantitative read-across were proposed by Gajewicz et al. [150] The proposed quantitative read-across approach based on a distance-weighted, k-nearest neighbour algorithm (QRAk-NN) for toxicity assessment of metal oxide NMs, which displayed predominant prediction accuracy in both training and external validation [150]. These studies provide opportunities to broaden the application of read-across method for filling empirical data gaps when adequate nanotoxicity data is not available. In a regulatory context, read-across can be applied within the analogue or category approach. According to the Read-Across Assessment Framework (RAAF) of ECHA [151] "The term ‘analogue approach’ is used when read-across is employed between a small number of structurally similar substances; there is no trend or regular pattern on the properties. As a result of the structural similarity, a given toxicological property of one substance (the source) is used to predict the same property for another substance (the target) to fulfil a REACH information requirement." Accordingly, "the term ‘category
EU US Roadmap Nanoinformatics
55
approach’ is used when read-across is employed between several substances that have structural similarity. These substances are grouped together on the basis of defined structural similarity and differences between the substances. As a result of the structural similarity, the toxicological properties will either all be similar or follow a regular pattern. Predictions should cover all parameters as required in the respective REACH information requirements. It may be possible to make predictions within the group for the target substance(s) on the basis of a demonstrable regular pattern. Alternatively, whenever there is more than one source substance in the category and no regular pattern is demonstrated for the property under consideration, the prediction may be based on a read-across from a category member with relevant information in a conservative manner (worst case). The basis for the prediction must be explicit." [151]. Although read-across possesses several advantages, i.e., easy to interpret and implement, applicable in modelling qualitative and quantitative toxicity endpoints, and flexible descriptors and similarity measures for expressing similarity between chemicals, the techniques of read-across have not been sufficiently standardised yet. In effect, the results of estimations using read-across can be ‘expert-dependent’, i.e., may vary depending on the personal experience of experts conducting the study. This is important from the regulatory perspective, because it does not guarantee reliability and reproducibility of the results. Moreover, statistical similarity measures cannot provide the information on toxicity mechanisms. Therefore, within some regulatory frameworks (e.g., REACH), bridging studies must be conducted to remove areas of uncertainty and validate the claimed similarities between the source and target chemicals. For example, as a bare minimum, physico-chemical measures must be known for both the source and the target, and the (eco)toxicological bridging studies will then be chosen based on the strategy and the endpoint needing to be fulfilled. In addition, complex similarity measures need complicated model interpretation. Furthermore, in the case of inadequate analogue chemicals or conflicting toxicity profiles of analogues, the read-across is inapplicable or inaccurate. Therefore, the development of novel read-across algorithms that can provide reliable predictions of the unknown data without further experimentation is very important. Further developments in this area should include design of novel and suitable numerical algorithms for read-across that will be useful in the context of filling data gaps. The feasibility and predictive ability of newly developed read-across algorithms should be verified and validated. Therefore, it would be very practical to establish the principles for the validation of read-across approaches by means of suitable case-studies (i.e., using external data obtained from regulatory (eco)toxicity tests). Furthermore, the recommendations on existing read-across approaches, which are the most relevant for filling data gaps for NMs, should be delivered. In a further perspective, the acceptable and sufficiently standardised algorithm(s) should be implemented into the user-friendly software (e.g., OECD QSAR Toolbox). It is worth mentioning that the proposed algorithms of read-across are universal that means enable to fill the data gaps within categories defined by using of any criteria and grouping (categorisation) system to be applied.

EU US Roadmap Nanoinformatics
56
7. Modelling properties, interactions and fate of NMs Vladimir Lobaskin1, Pietro Asinari2, Thomasz Puzyn3, Yoram Cohen4, Fred Klaessig5
1 University College Dublin, Dublin, Ireland 2 Politecnico di Torino, Torino, Italy 3 University of Gdansk, Gdansk, Poland 4 Center for Environmental Implications of Nanotechnology (CEIN), UCLA, CA 5 Pennsylvania Bio Nano Systems, LLC, USA
7.1 Introduction to Materials Modelling Simulations involving hundreds of thousands of atoms on a microsecond time scale are now routine, where state-of-the-art simulations involve one or two order larger size- and time scales [152]. Molecular simulations are examples of utilising theoretical descriptors in computational modelling. They have become an indispensable instrument in studying materials and are nowadays routinely used, e.g., in drug design for in silico screening of candidate compounds. They are also increasingly used in nanotechnology and nanomedicine. Among areas of active interest is the bionano interface, which is driven by applications in medicine, food, and cosmetics [153-155], as well as predicting toxicity. Although molecular simulations cannot account for biological events leading to toxicity, they can provide a framework for systematic evaluation of NM interactions with biomolecules. Understanding these interactions and the bionano interface’s spatial structure is crucial for achieving a better control over surface activity and for supporting safety regulations. Generally, physics- and chemistry-based materials modelling can provide information about NM properties (intrinsic and extrinsic) that are difficult (or impossible) to measure, offering a time and cost-effective alternative to experimental measurements while also expanding the range of materials considered in developing targeted performance, e.g., safe-by-design. For these reasons, materials modelling is receiving a growing interest by many different sectors, including industrial ones. For example, the European Commission is strongly supporting the Digital Single Market (DSM) [156] which relies also on virtual tools for developing new products. This includes assessing (nano-) safety. The European Materials Modelling Council (EMMC) is supporting this trend by promoting systematic classifications of materials models [60], pre-standardisation [61] and ontologies for interoperability of different models [62]. The EMMC has also issued a roadmap including topics of nanosafety [157].
7.2 Use of computational models to compute NM properties Applying materials modelling to the nanoEHS domain is relatively recent. Most published studies focus on prediction of molecular loading, molecular release, NM adherence, NM size, and polydispersity [158].
EU US Roadmap Nanoinformatics
57
Several studies show very reasonable predictions. However, most of these models focus on specific types of NM only and rely on very limited datasets, making the generalisation of the models very challenging, given the complexity of the NM world. Section 6.2 describes the distinction between statistical modelling and material modelling. In both, a computational nanoEHS model is a set of equations based on parameters (i.e., descriptors), whose selection and magnitude are somehow connected to chemical composition. In both, after descriptors have been selected and values were set, the computational nanoEHS model can be solved (e.g., QSAR, QSPR, trend analysis etc.) and then be compared to either measured properties or biological outcomes. Model acceptance in a regulatory context requires validation (as discussed in Sections 6.4.1 and 12.4). In chemoinformatics, the descriptors are correlated to molecular structure and their values are usually obtained from experimental measurements. There is a heavy reliance on statistical approaches, such as in unsupervised techniques (Section 6.3), and as noted in Section 6.2, chemoinformatics experience is heavily weighted to discrete molecular entities in solution, where a structure involves covalent bonding and functional groups. However, the modeller may also decide to use different types of descriptors, some being based on experimental measurements while others derive from materials modelling or theoretical concepts. In materials modelling [60], an individual descriptor value is generated using a generic and widely applicable physical equation that is combined with a case-specific material relation. Due to the frequently encountered complexity of physical equations, calculating model results may involve ‘solver’ programs (numerical methods) or require ‘post processing’ to generate a property estimate. Model classes and experience span several size ranges and include electronic, atomistic, mesoscopic and continuum categories. This broad range of model types allows for descriptors that incorporate a variety of chemical processes (adsorption, catalysis) and entities (electrons, ions, atoms, covalently bonded molecular structures). In summary, a property and its estimated value from materials modelling may become a descriptor in the computational nanoEHS model in addition to experimentally measured descriptors. For this reason, Section 7 puts emphasis on examining individual nanoEHS descriptors that may be estimated from a suite of physical equations regulated by material relations.
7.2.1 Intrinsic properties and descriptors In regards to the chemical composition and intrinsic properties of NMs, several software programs (e.g., Adriana.Code, Dragon, MolCom-Z and PaDEL-Descriptor) are available and can be used to calculate relevant theoretical descriptors (refer to Section 6.2 for distinction between theoretical and experimentally measured descriptors). Some descriptors can be extracted directly from results of quantum-mechanical calculations. Such calculations can be very computational intense and time consuming. By selecting the appropriate level of theory for geometry optimisation, time and cost of calculations
EU US Roadmap Nanoinformatics
58
can be reduced, but at the cost of the predictive ability. Using simplified, semi-empirical methods (Recife Model 1, Parametrisation Model 6, etc.), it is possible to calculate the molecular parameters for molecules in a short time [110]. However, for structures that are largely different from the structures used for parametrisation, the results will not suffice and may lead to incorrect description of the structure. Thus, for “untypical” molecules, it is better to use ab initio or Density Functional Theory methods, which require more computational resources. This situation also applies for NMs, because they are no longer simple molecular compounds such that the implementation of higher levels of theory in the ab initio formalism is recommended [110]. Fortunately, literature indicates that the most significant size-dependent changes of some physico-chemical properties of spherical NMs are observed below 5 nm, whereas the changes for sizes between 15 and 90 nm typically can be neglected. In addition, Gajewicz et al. [136] showed that for metal oxide clusters several molecular descriptors change with the size of the clusters. The physico-chemical properties either change (i) linearly with size or (ii) up to a “saturation point” (an asymptote), at which point the properties reach constant values that are characteristic for the bulk material. However, this implies that it might be possible to estimate the properties of a given NM by performing calculations for a series of much smaller molecular clusters and then fitting them using an appropriate function [147].
Theoretical descriptors involve quantum chemical or molecular simulation methods to derive molecular properties. In addition, NMs may have their own special properties, e.g., for metal oxide NMs the crystal structure is important [73]. Different types of theoretical descriptors are discerned: (i) constitutional properties such as periodic table-based descriptors such as molecular weight, cation charge, metal electronegativity, etc., which are easy to obtain [120] and (ii) electronic properties (regarding metal oxide NMs) such as band gap and valence gap energy, ΔHMe+ or the molar heat capacity. From a quantum chemistry viewpoint, NMs are large systems, which complicates the necessary calculations at the proper level of theory. Thus, other approaches are needed to determine the proper structural descriptors for nano-QSARs [110]. These quantum-chemical properties can be calculated using several software programs. For example, Puzyn et al. established a model to describe the cytotoxicity of metal oxide NM to E. coli calculating 12 descriptors at the semi-empirical level using the PM6 method implemented in the MOPAC software [111]. The enthalpy of formation of gaseous cation with the same oxidation state as the metal-oxide structure, ΔHMe+, was shown to be an efficient descriptor of the chemical stability of metal oxide NMs with regard to their cytotoxicity. Other descriptors that have been calculated for metal oxide NMs include molar heat capacity, average of the alpha and beta lowest unoccupied molecular orbital (LUMO) energies [159] and the atomisation energy, atomic mass, conduction band energy, ionisation energy and electronegativity [115]. However, it should be noted that the calculation of these descriptors is computationally demanding.
Other approaches to derive structural descriptors have been described in the literature.
(i) Glotzer and Solomon proposed a system of eight orthogonal “dimensions” (surface coverage, aspect ratio, faceting, pattern quantisation, branching, chemical ordering, shape gradient and roughness) to measure the structural similarities between various nanostructures. How to quantify these eight dimensions still needs to be solved [160].
EU US Roadmap Nanoinformatics
59
(ii) The chemical composition can also be expressed by simple constitutional descriptors (e.g., atomic numbers) or by a single descriptor based on correlation weights derived from molecular graph or atomic orbitals theory [161]. Based on these theories, another approach that has been implemented in nano-QSAR model development makes use of the CORAL software [162]. Based on SMILES, optimal descriptors can be defined and correlated with endpoints such as cytotoxicity of metal oxide NMs [118] or binding affinity of fullerene derivatives to HIV-1 protease [163]. However, for general implementation of nano-QSAR models this method of representation of the structure is not feasible because of the complexity of the molecular architecture. Therefore, in a next evolution, the chemical information was integrated with additional heterogeneous (eclectic) data, such as size, concentration, irradiation, porosity, etc. [164]. Building on the SMILES notation, additional SMILES-like sequences of symbols that codify the physico-chemical and biochemical conditions of chemicals and NMs in biological systems have been introduced and termed a quasi-SMILES notation. These can then be used to calculate optimal descriptors and applied in nano-QSAR modelling [164, 165].
(iii) Simplex representation of molecular structure (SiRMS) are a 2D level generated two, tri-, and tetra-atomic molecular fragments for which descriptors can be derived [131].
(iv) The Liquid Drop Model (LDM) is a novel approach to represent the supramolecular structure of NMs [125]. The main idea behind this approach is to use a combination of simple descriptors, which reflect the structure of a NM for the different levels of organisation: from a single metal oxide molecule (i.e., chemical structure) to a supramolecular ensemble of molecules (i.e., NM size). LDM has for example been described to determine the surface energy of NMs [166]. Using the LDM extensive quantum-mechanical calculations can be avoided.
(v) QSAR-perturbation approach in which a moving average approach was applied to the data in order to generate new descriptors that reflect their relative importance in the model [167].
7.2.2 Extrinsic properties and descriptors The environmental fate and biological activity of a NM can be influenced by the surrounding medium, which can affect, for instance, its surface charge, surface reactivity, and surface composition (coating) and even lead to changes in the particle’s core composition. Therefore, a set of extrinsic property descriptors should complement the standard assumptions. Typical examples used for NMs include:
● hydration energy, heats of immersion, contact angle for water ● surface charge density at different pH values and salt concentrations ● dissolution rate and thermodynamic solubility ● binding energies for essential biomolecules or adsorbates functional groups
Atomistic simulation models, both classical and ab initio, and mean-field theories (Poisson-Boltzmann theory) can be used to derive these properties for NMs at realistic conditions. Hydration energy (per unit area) or heat of immersion or contact angle can
EU US Roadmap Nanoinformatics
60
be used to characterise the degree of hydrophobicity of the material. For example, atomistic molecular dynamics simulations can evaluate the adsorption energies of water molecules at the NM surface. Hydration free energies of the dissolved material molecules can be computed to predict the NM dissolution rates, using methodology developed for prediction of free energy of solvation [168]. The charge and hydration energies of NMs should generally be calculated at relevant temperatures (i.e., room or body temperature, respectively), at relevant salt concentrations in addition to water composition (physiological concentrations between 100 mmol/L to 150 mmol/L) and pH values (from 3 to 7), reflecting the conditions in the lab and as well the different compartments of living organisms. For calculation of surface charge at different pH and salt concentrations, one can use the methods based on Poisson-Boltzmann mean field equation that includes charge regulation [169, 170].
7.3 Use of material models for supporting risk assessment Modelling in nanotoxicology is often used in the context of predicting risks due to NM exposure. Generally speaking, for obtaining information about risks one has to combine information about the exposure to a given NM and knowledge about its possible hazards (typically as dose-response relationships) to get insights if a specific exposure is likely to cause any adverse effects. Some risk models, however, also determine the probability that a specific adverse effect will occur. Hence modelling in the context of risk assessment should include exposure models in addition to hazard models. A brief description of a conceptual approach to risk assessment for NMs was provided by Cohen et al. [171] and various frameworks that integrate toxicity and exposure information were recently reviewed by Romero et al. [172]. Exposure models are intended to predict how NM evolve in the environment [171], which includes agglomeration/aggregation [173] behaviour. However, exposure does not only mean exposure of workers, consumers, the general public or the environment. Information about NM exposure is also relevant in the context of whole animal tests (i.e., exposure of the animals), for cell based toxicity tests (i.e., exposure at the cellular level), or even at the molecular level (e.g., to get insights in specific interactions between NMs and a given molecule)[174].
7.4 Challenge: Descriptors and Multiscale Modelling of the Bio-Nano Interface The Bio-Nano interface can be important for initiation of an Adverse Outcome Pathway (AOP) and for systemic distribution of NMs (also refer to chapter 8.3). Thus, NM characteristics that directly determine the interactions between NMs and various biomolecules are most informative. Although they may not be completely independent from the basic properties of the NM (as expressed by their intrinsic descriptors), a systematic evaluation of the descriptors for interactions may make predictive models much more compact and robust. Examples of such descriptors are: content of NM protein corona composition, adsorption enthalpy for an amino acid, lipid molecule, or a protein on the NM surface, hydrophobicity, production of ROS. All of these require a modelling of the NM in realistic environments.
EU US Roadmap Nanoinformatics
61
The major challenge here is the need to use multiscale models for the characterisation of interactions such as reliable and validated force fields. The relevant systems sizes of several nanometres are too large for direct atomistic simulation, so a coarse-grain description is required, which would be able to preserve information about the interaction specificity. In addition to this, the number of relevant molecules involved in the interactions with NM can be enormous, so the corona composition as such (i.e., the list of proteins known to interact with a specific NM) may be an impractical property to be used for predictions. Each NM immersed in plasma typically has its own unique corona that may involve hundreds of different proteins [175]. Abundances of proteins in the corona may reflect the properties of the NM that determine its propensity to bind certain types of molecule. Therefore, one should aim for statistical descriptors of the proteins interacting with the NM. In contrast to NMs, the development of descriptors for biomolecules is relatively straightforward due to their chemical uniformity, e.g., the same amino acids present in all proteins or the nucleic acids in all DNA/ RNA molecules. For proteins, the simplest descriptors can be constructed using their amino acid (AA) sequence. These can include counts of amino acids of different types, net charge or total mass. Already this characterisation is very rich and capable of predicting complex events at the Bio-Nano interface [116, 176]. Moreover, obtaining descriptors from AA sequences can be done by using a wide range of software tools such as the EMBOSS PepStats tool [177]. More advanced descriptors for proteins can be built by analysing their structure. In some cases, starting with the AA sequence of the protein the 3D structure of the molecule can be retrieved from the Protein Data Bank and then used to construct the descriptors. When the structure is not available, one can then use a structure prediction software. There are multiple automated tools available for this task, such as i-Tasser [178]. Using the measured or predicted 3D structure of the protein, several advanced descriptors can be calculated. Lopez et al. developed a one-bead-per-amino acid (united atom – UA) model of globular proteins, which is suitable for this purpose [179, 180]. Some examples of advanced descriptors that can be calculated include protein globule dimensions (radius of gyration and hydrodynamic radius), aspect ratio, dipole moment, rotational inertia, dielectric constant, hydrophobicity, surface charge at different pH and salt concentrations. In addition, protein charge at different pH can be calculated using the Poisson-Boltzmann cell model with charge regulation as reported by Barroso da Silva et al. [181]. For proteins, an evaluation of interaction properties requires an assumption about the protein structure at the conditions of interest. With the known 3D structure of the protein and the NM, Bio-Nano interaction descriptors can be systematically calculated based on how the proteins adsorb onto the surface of the NMs. While a calculation of the precise conformation of adsorbed molecules and a careful evaluation of ensemble averages is definitely a challenging task, several relevant quantities can be calculated using a simplified approach. To make the problem tractable, one can make two major approximations: assume additivity of the interactions between the building blocks of the biomolecule and the NM and neglect the change of conformation for adsorbed molecules. While these assumptions prevent one from obtaining accurate adsorption
EU US Roadmap Nanoinformatics
62
energies, they allow for a uniform screening of thousands of molecules and ranking them based on how strongly they will attach to the surface of the NM. This ranking represents a statistical measure of the content of the biomolecular corona and constitutes a unique fingerprint of a NM. Using the united atom protein model [180], one can compute preferred adsorbed orientation and evaluate mean adsorption energy at different conditions. Moreover, using the same bottom-up construction approach, one can engineer an ultra-coarse-grained model (united amino acid - UAA) that closely reproduces the total protein-protein pairwise interaction energy profiles obtained in the united atom model. In the UAA model, one would typically need between 5 and 30 united-amino acid beads to capture the geometry and reproduce the adsorption characteristics of the original protein. This second coarse-graining can be based on the mass distribution in the complete protein and can be optimised by tuning the protein diffusion coefficients to those obtained using UA model. The UAA model would be then suitable for modelling competitive protein adsorption and formation of protein corona [182]. An extensive gold NMs protein corona dataset was analysed in [117] to identify and quantify the relationships between NM-cell association and protein corona fingerprints (PCFs) in addition to NM physicochemical properties. Quantitative structure–activity relationships (QSARs) were developed based on both linear and non-linear support vector regression (SVR) models making use of a sequential forward floating selection of descriptors. In the above work, an initial pool of 148 descriptors was considered with the analysis eventually identifying four specific serum proteins, along with NM zeta potential as most significant to correlating NM cell association. In a series of papers examining organic molecule and biomolecule adsorption onto NM surfaces, Riviere and colleagues developed the Biological Surface Adsorption Index concept [183]. The adsorption coefficient is expressed as a logarithmic function of five descriptors: excess molar refraction (representing molecular force of lone-pair electrons); the polarity/polarisability parameter; the hydrogen-bond acidity and basicity; and the McGowan characteristic volume describing hydrophobic interactions. Experimentally obtained log K values can be used for determining 5 nanodescriptors describing surface forces related to adsorption.
7.5 Challenge: Missing predictive models for some descriptors According to the mechanistic toxicity paradigm, the NM properties should be related to the molecular and biological modes of action. An approach to derive these relationships is for instance followed in the H2020 SmartNanoTox project (http://www.smartnanotox.eu/). Firstly, one has to focus on the Molecular Initiating Events (MIEs) of the AOPs, triggered by the NM interactions with the biological tissue. When MIEs are known, a calculation of the relevant descriptors becomes essential. Among the known candidate MIEs for NMs, one can name production of ROS, cellular uptake, NM cell association, or lysosomal damage. ROS production and oxidative stress are known to be correlated with the conduction band gap for metal oxide NMs [73, 184].
EU US Roadmap Nanoinformatics
63
The models proposed in these latter works use reactivity descriptors to build the energy band structure of oxide NMs and predicts their ability to induce oxidative stress by comparing the redox potentials of relevant intracellular reactions with the oxides' electronic energy structure. At the same time, descriptors for interactions of NMs with lipids, lung or cell membrane, or receptor proteins are missing. Supposedly, they can be constructed based on molecular interaction descriptors, using the multiscale methodology as described above, and hydrophobicity descriptors. Another obviously missing property is NM dissolution rate, which is associated with ion release, in particular for metal-based NMs. Dissolution can be an important factor for understanding the biodistribution and also the cellular responses to a range of different NMs. It has the potential to become a key information to be used in a screening process for categorising NMs with common hazard potential based on their potential to release ionic species. Several approaches to this problem are taken by SmartNanoTox project: (i) comparisons of bond energies with solvation energies for a given ion/atom/molecule (ii) kinetic models to assess the timescale of any dissolution (iii) biased MD simulations of free energy barriers to dissolution of NMs including surface reconstruction and change on contact with water, (iv) where appropriate direct MD studies of spontaneous dissolution and the influence of surface ligands and coronas. If successful, these approaches will lead to a molecular understanding of the relevant mechanisms of hazard and tractable predictive models for different NM/ligand/water systems. In addition, catalytic activity of NMs can be assessed in the first instance by calculating frontier orbitals for given NM systems by density functional theory and correlating them with experimental data to provide tractable expressions for use in assessing toxicological activity. From the point of release, the state of the NM can change in many respects both before and after the contact with biological tissues. The affected properties may include oxidation, adsorption of foreign material from the atmosphere, waters or soil, partial removal of the engineered coating. The relevant descriptors are: time after release, temperature, coating quality (percentage of coverage), amount of pollutants.
7.6 Challenge: Coupling and linking models for predicting biological events The ability of the NM to dissociate and produce reactive species, to affect the conformation of “vital” biomolecules, or to interfere in metabolic or reproductive processes determines the NM’s ability to cause hazardous effects. From a biological point of view, this can be explained as inducing MIEs leading to the initiation of an adverse outcome (AO), as suggested in the Adverse Outcome Pathway (AOP) framework (also refer to chapter 8.3). NM properties profoundly affect the molecular processes at the Bio-Nano interface. Thus, detailed characterisation of the NM after initial contact with organisms at different stages of the systemic transport can provide molecular level descriptors for “mechanism-aware” toxicity prediction schemes. Materials modelling along with experimental NM characterisation after the contact can be used to develop the relevant NM descriptors. At the first level, such descriptors would include

EU US Roadmap Nanoinformatics
64
characterisation of the interfacial NM contact with biomolecules in terms of binding energies of biomolecule elements (amino acids, lipid headgroups, etc.). Such descriptors should be organised in a Bio-Nano interactions database, which will be used for prediction of the NM corona formation including characterisation of the corona outer surface, and prediction of likelihood of the particular hazardous effects. To finally develop the mechanism-aware QSARs, one should perform systematic analysis of the NM-induced pathways and map the NM physicochemical properties to the MIE and thus to the specific AO for any NM. This approach is described in detail in Chapter 8. The overall assessment scheme thus will combine materials modelling, systems biology, in vivo and in vitro studies.
EU US Roadmap Nanoinformatics
65
8. Nano-Bioinformatics Sabina Halappanavar1,2, Penny Nymark3,4, Roland Grafström3,4, Dario Greco5, Andrew Williams1, Pekka Kohonen3,4 1 Environmental Health Science and Research Bureau, Health Canada, Ottawa, Canada 2 Department of Biology, University of Ottawa, Ottawa, Canada 3 Institute of Environmental Medicine, Karolinska Institutet, Stockholm, Sweden 4 Misvik Biology, Turku, Finland 5 University of Helsinki, Helsinki, Finland Conventional human health risk assessment (HHRA) approaches, on which the chemical regulatory system is founded, involve the targeted assessment of specific adverse health effects such as carcinogenic, mutagenic, reproductive toxicity (CMR) effects or other adverse effects of regulatory importance, which typically involve animal studies. Often, this is time and cost-intensive, and moreover, requires prior knowledge of the mode of action. In addition, most of the chronic studies use maximum tolerated dose and thus lack broader application. The pace at which technology is evolving, new substances or chemicals are being added regularly to the market, requires rapid screening techniques to be included in safety assessment. Mostly, the type of toxicity induced by novel substances is not known. Due to the time and cost burden associated with the conventional testing regime, timely screening of novel chemicals for all potential hazards is not possible. Thus, newer approaches that significantly reduce time and cost are required and are constantly being sought to complete an assessment of a chemical for its potential toxicity, yet providing comprehensive understanding of the underlying mode of action of the toxicity. Comprehensive understanding of adverse effects induced by NMs will require a detailed appreciation of material physics and chemistry, and their anticipated behaviour at various levels of biological organisation including molecular, cellular, organ, and tissue levels as shown in Figure 10 (modified from [185]). Integration of the information derived from these various levels using statistical, mathematical and bioinformatics tools is the key to understanding the overall complexity of the biological responses induced by this novel class of materials and for their effective regulation [185, 186].
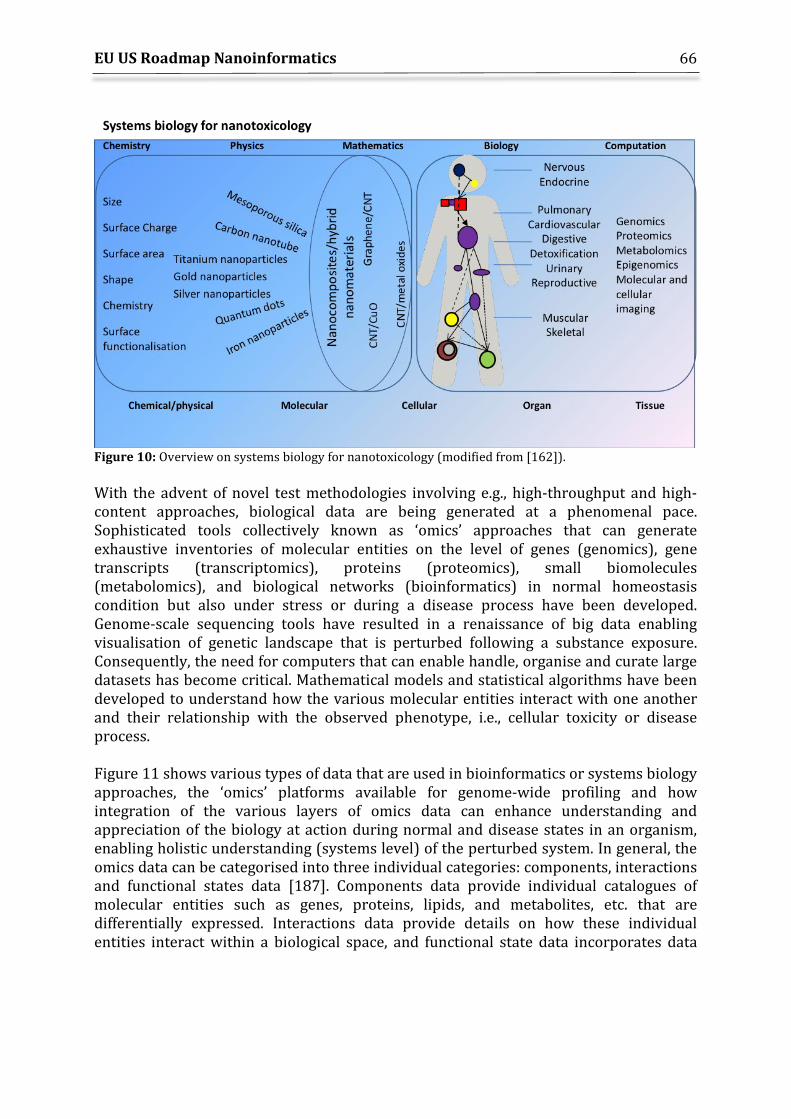
EU US Roadmap Nanoinformatics
66
Figure 10: Overview on systems biology for nanotoxicology (modified from [162]). With the advent of novel test methodologies involving e.g., high-throughput and high-content approaches, biological data are being generated at a phenomenal pace. Sophisticated tools collectively known as ‘omics’ approaches that can generate exhaustive inventories of molecular entities on the level of genes (genomics), gene transcripts (transcriptomics), proteins (proteomics), small biomolecules (metabolomics), and biological networks (bioinformatics) in normal homeostasis condition but also under stress or during a disease process have been developed. Genome-scale sequencing tools have resulted in a renaissance of big data enabling visualisation of genetic landscape that is perturbed following a substance exposure. Consequently, the need for computers that can enable handle, organise and curate large datasets has become critical. Mathematical models and statistical algorithms have been developed to understand how the various molecular entities interact with one another and their relationship with the observed phenotype, i.e., cellular toxicity or disease process. Figure 11 shows various types of data that are used in bioinformatics or systems biology approaches, the ‘omics’ platforms available for genome-wide profiling and how integration of the various layers of omics data can enhance understanding and appreciation of the biology at action during normal and disease states in an organism, enabling holistic understanding (systems level) of the perturbed system. In general, the omics data can be categorised into three individual categories: components, interactions and functional states data [187]. Components data provide individual catalogues of molecular entities such as genes, proteins, lipids, and metabolites, etc. that are differentially expressed. Interactions data provide details on how these individual entities interact within a biological space, and functional state data incorporates data
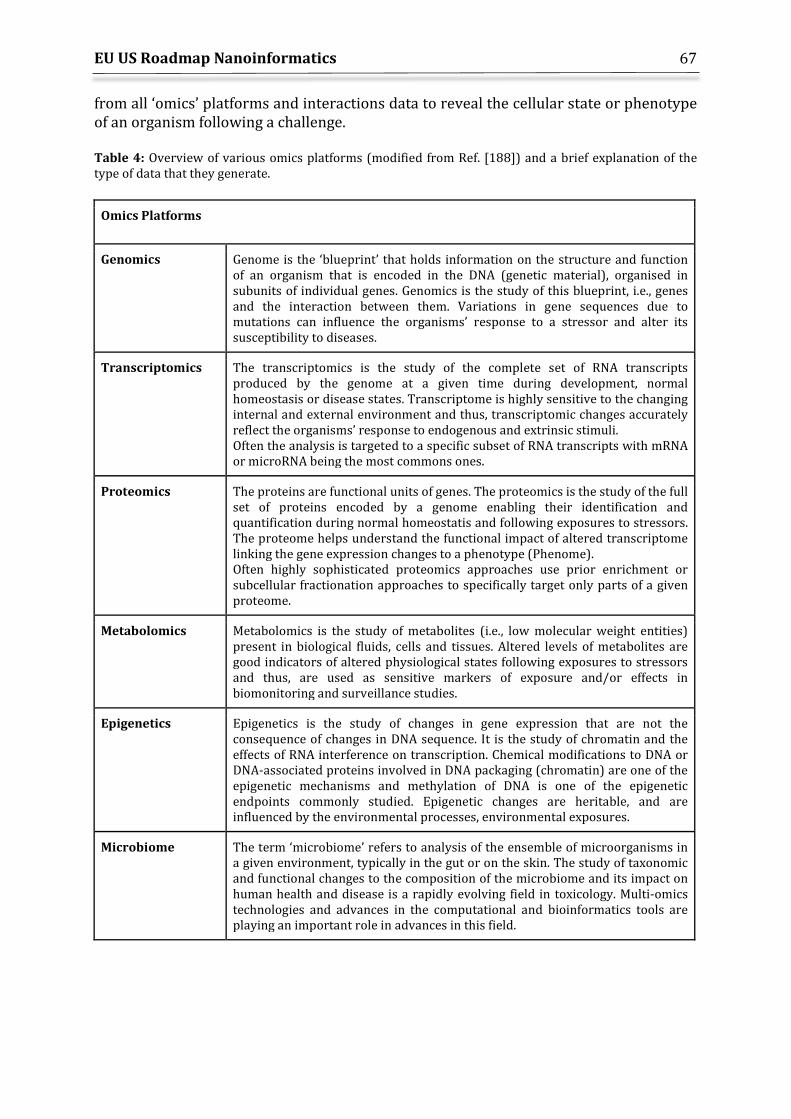
EU US Roadmap Nanoinformatics
67
from all ‘omics’ platforms and interactions data to reveal the cellular state or phenotype of an organism following a challenge. Table 4: Overview of various omics platforms (modified from Ref. [188]) and a brief explanation of the type of data that they generate.
Omics Platforms
Genomics Genome is the ‘blueprint’ that holds information on the structure and function of an organism that is encoded in the DNA (genetic material), organised in subunits of individual genes. Genomics is the study of this blueprint, i.e., genes and the interaction between them. Variations in gene sequences due to mutations can influence the organisms’ response to a stressor and alter its susceptibility to diseases.
Transcriptomics The transcriptomics is the study of the complete set of RNA transcripts produced by the genome at a given time during development, normal homeostasis or disease states. Transcriptome is highly sensitive to the changing internal and external environment and thus, transcriptomic changes accurately reflect the organisms’ response to endogenous and extrinsic stimuli. Often the analysis is targeted to a specific subset of RNA transcripts with mRNA or microRNA being the most commons ones.
Proteomics The proteins are functional units of genes. The proteomics is the study of the full set of proteins encoded by a genome enabling their identification and quantification during normal homeostatis and following exposures to stressors. The proteome helps understand the functional impact of altered transcriptome linking the gene expression changes to a phenotype (Phenome). Often highly sophisticated proteomics approaches use prior enrichment or subcellular fractionation approaches to specifically target only parts of a given proteome.
Metabolomics Metabolomics is the study of metabolites (i.e., low molecular weight entities) present in biological fluids, cells and tissues. Altered levels of metabolites are good indicators of altered physiological states following exposures to stressors and thus, are used as sensitive markers of exposure and/or effects in biomonitoring and surveillance studies.
Epigenetics Epigenetics is the study of changes in gene expression that are not the consequence of changes in DNA sequence. It is the study of chromatin and the effects of RNA interference on transcription. Chemical modifications to DNA or DNA-associated proteins involved in DNA packaging (chromatin) are one of the epigenetic mechanisms and methylation of DNA is one of the epigenetic endpoints commonly studied. Epigenetic changes are heritable, and are influenced by the environmental processes, environmental exposures.
Microbiome The term ‘microbiome’ refers to analysis of the ensemble of microorganisms in a given environment, typically in the gut or on the skin. The study of taxonomic and functional changes to the composition of the microbiome and its impact on human health and disease is a rapidly evolving field in toxicology. Multi-omics technologies and advances in the computational and bioinformatics tools are playing an important role in advances in this field.
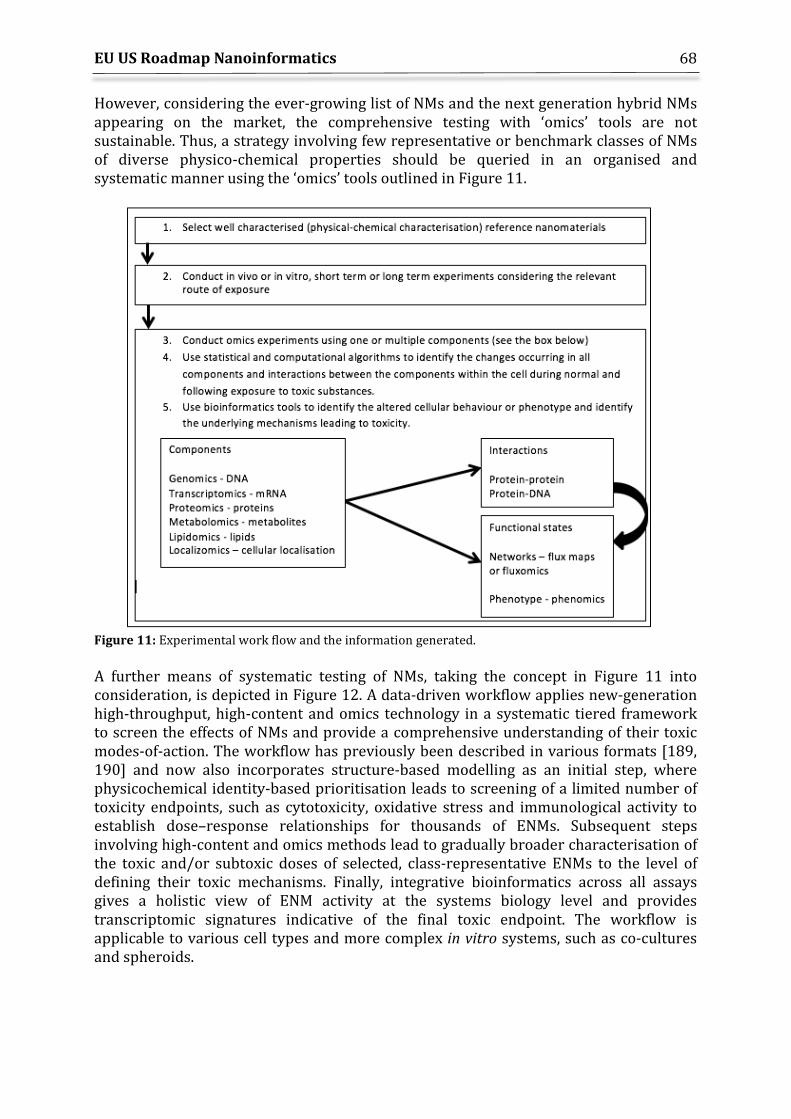
EU US Roadmap Nanoinformatics
68
However, considering the ever-growing list of NMs and the next generation hybrid NMs appearing on the market, the comprehensive testing with ‘omics’ tools are not sustainable. Thus, a strategy involving few representative or benchmark classes of NMs of diverse physico-chemical properties should be queried in an organised and systematic manner using the ‘omics’ tools outlined in Figure 11.
Figure 11: Experimental work flow and the information generated. A further means of systematic testing of NMs, taking the concept in Figure 11 into consideration, is depicted in Figure 12. A data-driven workflow applies new-generation high-throughput, high-content and omics technology in a systematic tiered framework to screen the effects of NMs and provide a comprehensive understanding of their toxic modes-of-action. The workflow has previously been described in various formats [189, 190] and now also incorporates structure-based modelling as an initial step, where physicochemical identity-based prioritisation leads to screening of a limited number of toxicity endpoints, such as cytotoxicity, oxidative stress and immunological activity to establish dose–response relationships for thousands of ENMs. Subsequent steps involving high-content and omics methods lead to gradually broader characterisation of the toxic and/or subtoxic doses of selected, class-representative ENMs to the level of defining their toxic mechanisms. Finally, integrative bioinformatics across all assays gives a holistic view of ENM activity at the systems biology level and provides transcriptomic signatures indicative of the final toxic endpoint. The workflow is applicable to various cell types and more complex in vitro systems, such as co-cultures and spheroids.
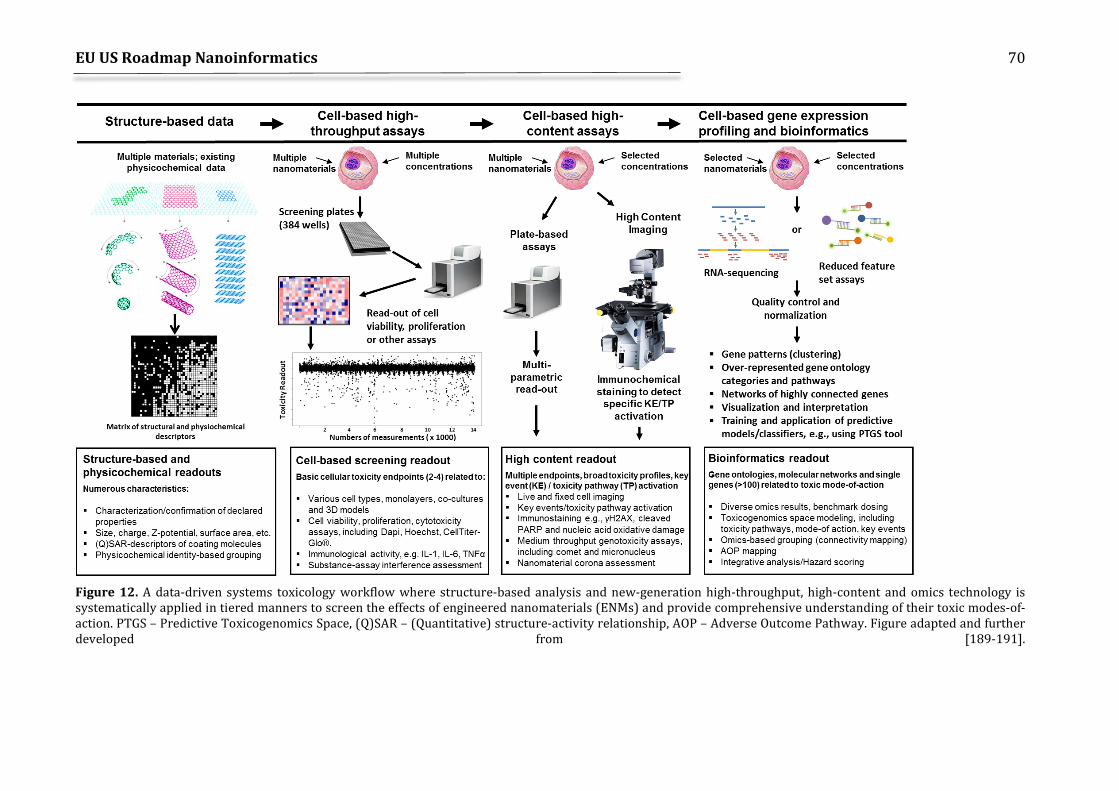
EU US Roadmap Nanoinformatics
70
Figure 12. A data-driven systems toxicology workflow where structure-based analysis and new-generation high-throughput, high-content and omics technology is systematically applied in tiered manners to screen the effects of engineered nanomaterials (ENMs) and provide comprehensive understanding of their toxic modes-of-action. PTGS – Predictive Toxicogenomics Space, (Q)SAR – (Quantitative) structure-activity relationship, AOP – Adverse Outcome Pathway. Figure adapted and further developed from [189-191].
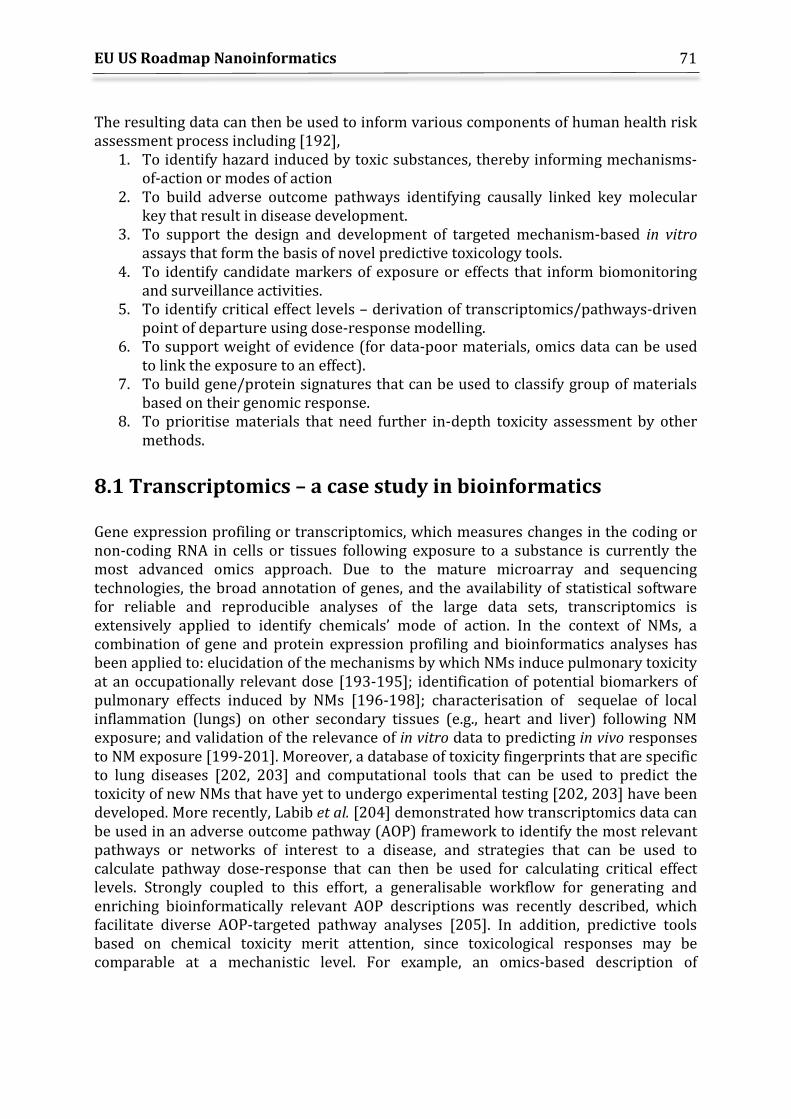
EU US Roadmap Nanoinformatics
71
The resulting data can then be used to inform various components of human health risk assessment process including [192],
1. To identify hazard induced by toxic substances, thereby informing mechanisms-of-action or modes of action
2. To build adverse outcome pathways identifying causally linked key molecular key that result in disease development.
3. To support the design and development of targeted mechanism-based in vitro assays that form the basis of novel predictive toxicology tools.
4. To identify candidate markers of exposure or effects that inform biomonitoring and surveillance activities.
5. To identify critical effect levels – derivation of transcriptomics/pathways-driven point of departure using dose-response modelling.
6. To support weight of evidence (for data-poor materials, omics data can be used to link the exposure to an effect).
7. To build gene/protein signatures that can be used to classify group of materials based on their genomic response.
8. To prioritise materials that need further in-depth toxicity assessment by other methods.
8.1 Transcriptomics – a case study in bioinformatics Gene expression profiling or transcriptomics, which measures changes in the coding or non-coding RNA in cells or tissues following exposure to a substance is currently the most advanced omics approach. Due to the mature microarray and sequencing technologies, the broad annotation of genes, and the availability of statistical software for reliable and reproducible analyses of the large data sets, transcriptomics is extensively applied to identify chemicals’ mode of action. In the context of NMs, a combination of gene and protein expression profiling and bioinformatics analyses has been applied to: elucidation of the mechanisms by which NMs induce pulmonary toxicity at an occupationally relevant dose [193-195]; identification of potential biomarkers of pulmonary effects induced by NMs [196-198]; characterisation of sequelae of local inflammation (lungs) on other secondary tissues (e.g., heart and liver) following NM exposure; and validation of the relevance of in vitro data to predicting in vivo responses to NM exposure [199-201]. Moreover, a database of toxicity fingerprints that are specific to lung diseases [202, 203] and computational tools that can be used to predict the toxicity of new NMs that have yet to undergo experimental testing [202, 203] have been developed. More recently, Labib et al. [204] demonstrated how transcriptomics data can be used in an adverse outcome pathway (AOP) framework to identify the most relevant pathways or networks of interest to a disease, and strategies that can be used to calculate pathway dose-response that can then be used for calculating critical effect levels. Strongly coupled to this effort, a generalisable workflow for generating and enriching bioinformatically relevant AOP descriptions was recently described, which facilitate diverse AOP-targeted pathway analyses [205]. In addition, predictive tools based on chemical toxicity merit attention, since toxicological responses may be comparable at a mechanistic level. For example, an omics-based description of
EU US Roadmap Nanoinformatics
72
toxicological responses that broadly captures and accurately predicts liver toxicity on both cellular and organismal level was recently described [206]. The so called Predictive Toxicogenomics Space (PTGS) describes several toxicity-associated mechanisms such as oxidative stress, cell cycle disturbances, DNA damage response and mitochondrial dysfunction, commonly also associated with NM [189]. In another study, a framework for predicting the hazards associated with complex mixtures of chemicals using single-chemical transcriptomics data was established [207]. Thus, applicability of transcriptomics, not only to identify the subtle biological effects induced by low doses of NMs very early after the exposure, but also in risk characterisation of NMs has been well demonstrated. Although regulatory acceptance of transcriptomics data is not yet achieved, several efforts are being made to harmonise the protocols and data analyses methods. Guidance documents and development of standards are being established. A committee for the “application of genomics to mechanisms-based risk assessment” is established by the ILSI/HESI. OECD has established a Molecular Screening and Toxicogenomics advisory group and have initiated efforts to harmonise genomics approaches for risk assessment. The European Chemicals Agency have also initiated discussion among academia, regulators and industry on the implementation of new approach methodologies (NAMs) into regulations such as REACH [208]. However, for now, the data can be effectively used to inform about chemicals’ mode of action, identify important events relevant to disease progression and in the development of mechanisms-based high-throughput screening (HTS) in vitro assays that are predictive of in vivo responses. Moreover, for data poor substances such as NMs, the data can be used as weight of evidence, and for screening or prioritising NMs for further testing.
8.2 Challenges moving forward While tremendous progress has been made in the area of transcriptomics, several challenges lie ahead. Prior to its routine inclusion in safety testing of substances and regulatory acceptance, standard operating protocols (SOPs) are needed, data reporting and data analysis, quality control including suitable standards or benchmarks, analysis algorithms have to be developed, established, standardised and/or harmonised. Internationally guidelines or guidance documents are needed. The regulatory acceptance criteria have to be developed and areas of regulatory applications have to be identified. Appropriate training courses to analyse and interpret transcriptomics data in a consistent manner must be established. In addition, appropriate data management strategies are a fundamental requirement for efficient nano-bioinformatics. Databases for storing omics data in standardised formats are available and provide access to NM-associated omics data. However, metadata and associated toxicological and physico-chemical data requires NM-specific databases capable of linking to the external omics databases. An example of such a NM-specific database is the eNanoMapper database [49]. This will enable linked and annotated (using ontologies as outlined in Section 5 of this report) build-up of transcriptomics data for reference substances, useful in further nano-bioinformatics modelling approaches.
EU US Roadmap Nanoinformatics
73
Other challenges involve data, tools, software and model sharing. Although some published datasets are deposited in the public repositories and are accessible, the reporting formats for NM and their associated toxicity and physico-chemical data are not standardised for use by other researchers. Transcriptomics is one of the most extensively tested and applied genome-wide profiling tools, although standards are yet to be developed for data analysis and data representation. Transcriptome profiling can involve different microarray platforms and based on the statistical algorithms used, the interpretation of the data can vary from laboratory to laboratory. Thus consistency, reproducibility and reliability are the major issues that need to be tackled and may be addressed to some extent within the nanosafety community by the establishment of consistently tested reference NM data sets.
8.3 Application of other ‘omics’ data to nanotoxicology Because of methodological limitations and the large diversity of proteins and metabolites within the biological samples, proteomics and lipidomics are not applied as extensively as transcriptomics. However, data derived from other ‘omics’ platforms have been used to gain an understanding of the underlying mechanisms of NM induced toxicity. Multi-omics approaches involving lipidomics, proteomics, miRNomics (i.e., microRNAs) and transcriptomics have been applied to derive an understanding of carbon nanotube induced toxicity [199, 209-211]. A redox proteomics approach was proposed as first tier screening method for prioritisation of NMs for further testing [212]. Thus, each omics platform will provide a unique perspective of the changing phenotype, and development and validation of tools that aid in managing, processing and integration of multi-platform data towards biologically meaningful interpretation of the observed changes will be the key. The use of (multi-) omics approaches in nanosafety has recently been reviewed [213].
8.4 Omics data analysis methods As stated above, the key to obtaining biologically relevant results from the microarray studies is the stringent and accurate analysis of large and complex datasets using appropriate statistical and bioinformatics methods. Figure 13 shows the steps involved in analysing ‘omics’ data in general. For many omics technologies and platforms several analytical steps are conceptually common. First, the raw data files must be read into the software environment, the quality of the raw data needs to be evaluated in order to ensure that technically suboptimal data points are excluded. Next, the data preprocessing, consisting mainly of normalisation and batch effect evaluation and correction are carried out. Primary normalisation and data filtering for factors contributing to variation such as differences in dye incorporation, hybridisation efficiencies, etc. within arrays and across arrays will enable identification of differentially expressed genes or proteins. Handling batch effects successfully is largely accepted to be a crucial aspect of omics data analysis, but is unfortunately still neglected and poorly documented in many published studies [214-
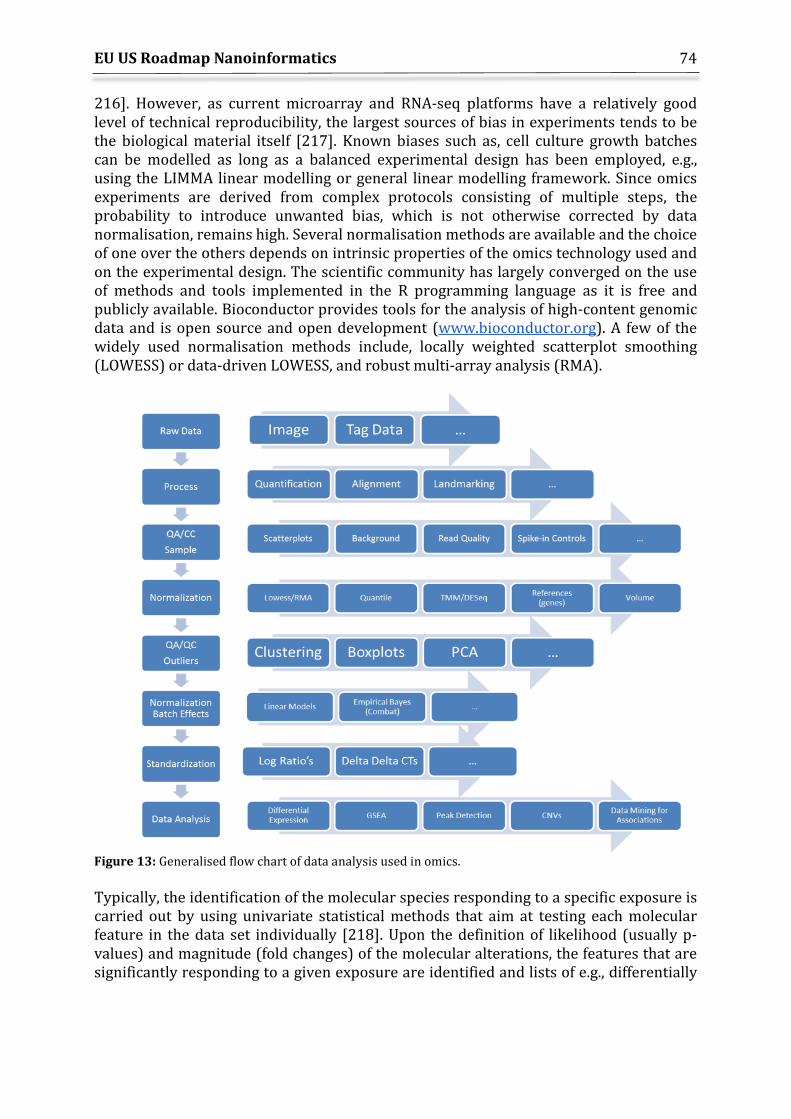
EU US Roadmap Nanoinformatics
74
216]. However, as current microarray and RNA-seq platforms have a relatively good level of technical reproducibility, the largest sources of bias in experiments tends to be the biological material itself [217]. Known biases such as, cell culture growth batches can be modelled as long as a balanced experimental design has been employed, e.g., using the LIMMA linear modelling or general linear modelling framework. Since omics experiments are derived from complex protocols consisting of multiple steps, the probability to introduce unwanted bias, which is not otherwise corrected by data normalisation, remains high. Several normalisation methods are available and the choice of one over the others depends on intrinsic properties of the omics technology used and on the experimental design. The scientific community has largely converged on the use of methods and tools implemented in the R programming language as it is free and publicly available. Bioconductor provides tools for the analysis of high-content genomic data and is open source and open development (www.bioconductor.org). A few of the widely used normalisation methods include, locally weighted scatterplot smoothing (LOWESS) or data-driven LOWESS, and robust multi-array analysis (RMA).
Figure 13: Generalised flow chart of data analysis used in omics. Typically, the identification of the molecular species responding to a specific exposure is carried out by using univariate statistical methods that aim at testing each molecular feature in the data set individually [218]. Upon the definition of likelihood (usually p-values) and magnitude (fold changes) of the molecular alterations, the features that are significantly responding to a given exposure are identified and lists of e.g., differentially
EU US Roadmap Nanoinformatics
75
expressed genes (in the case of transcriptomics) are compiled. In transcriptomics data analysis, a number of methods have been proposed, of which linear models followed by eBayes testing gained enormous popularity [219]. Since microarray analysis involves multiple comparisons, false positives are very common and thus, tests such as the moderated t-tests were developed specifically for microarray analysis. The p-values from the statistical test are then adjusted either using the false discovery rate (FDR) correction to minimise the number of false positives or by controlling the Family-wise error rate (FWER) for example with Bonferroni correction. A false discovery rate adjusted p-value of less than 0.05, and a fold- change cut-off of 1.5 in either direction are routinely applied to the microarray datasets. The resulting stringent list of differentially expressed genes or proteins is then queried to identify altered functional pathways. Advanced statistical techniques such as various types of clustering (e.g., hierarchical, K-means) or self-organising maps (SOMs) enable identification of similar expression patterns across the samples, signatures specific to a class of chemicals, tissue or a cell type or a phenotype. The various statistical methodologies used to analyse the big data are summarised in Section 6. In toxicogenomics, efforts establishing reproducible data analysis frameworks that are communicable to regulators are currently being established. The MicroArray Quality Control (MAQC) consortium accessed the technical performance and application of ‘omics technologies for clinical application and safety assessments. The consortium completed three projects evaluating the performance of microarrays, genome-wide association studies and RNA-sequencing, with particular reference to the reproducibility of transcriptomics data, between-experiment concordance, within-laboratory repeatability, and cross-platform reproducibility. The results from these studies indicate that using a p-value and a fold change threshold and subsequently sorting by the fold-change to identify the most prominent differentially expressed genes enhanced reproducibility of the results while balancing the sensitivity and specificity. The work of the consortium has advanced microarray and RNA-seq analytical pipelines that can be leveraged for developing data analysis frameworks and best practices [192]. However, it should be also considered that, given the complex nature of the molecular interactions, multivariate analysis could help highlighting additional sets of molecular features that might not be strongly associated to exposure effect when considered independently [220-222]. In this sense, multivariate approaches relying on machine learning algorithms can also aid the finding of molecular biomarkers with toxicity predictive value to be further implemented in high-throughput targeted assays. The primary readout of omics experiments usually consists of lists of molecular features significantly altered due to an exposure of a chemical. To further facilitate the interpretation of these results, the molecules (genes, proteins, or metabolites) are mapped onto existing pathway databases and gene ontologies. Eventually, the goal is to anchor the expression changes at the gene or protein levels to the observed phenotype in an organism. A single gene or protein may be involved in multiple functions and therefore identifying isolated groups of genes or proteins that are differentially expressed may not be sufficient to understand the perturbed biology. Software tools for the systematic annotation of gene interactions derived from the literature are available. Classification systems such as gene ontology tools help identify categories of molecules
EU US Roadmap Nanoinformatics
76
that are altered following exposure. Kyoto Encyclopaedia of Genes and Genomes [223], Gene Microarray Pathway Profiler [224], Ingenuity Pathway Analysis [225] or WikiPathways [226] tools can be used to identify pathways and functions that are perturbed following exposure to substances in experimental models. Although these literature-based tools often provide network representations of co-citation relationships, they are not really providing any regulatory gene network inference capability. The statistical evaluation of the pathway and ontology over-representation is usually performed either by a hypergeometric test or a Kolmogorov-Smirnov test. Many tools are freely available online for carrying out this task, which is typically performed by uploading, for instance, a list of differentially expressed genes onto a web service and retrieving lists of significantly enriched biological themes. It should be noted that these services do not always include updated version of the pathways and ontologies definitions, risking introduction of bias in the outcome [227]. A robust approach that considers the complexity of biology and avoids testing isolated genes for significance is gene set enrichment analysis (GSEA). The method determines whether a priori defined sets of genes, such as pathways or gene ontologies, are statistically over-represented in relation to genes outside the pathway when compared to an exposure control [203, 228]. These methods can be assumed to allow better comparison between diverse omics data sets [203, 229]. Furthermore, the results are then useful for omics-based scoring methods, which can be used for predictive modelling [190, 206]. As stated early in the section, omics data can be used to construct AOPs [205, 207] and mechanistic descriptions of key events are being incorporated within a broader biological / toxicological context. GSEA using toxicity-predictive gene sets can be used to evaluate quantitatively such key events. In recent years, multi-omics approaches have been used in an increasing number of biomedical fields. The aim in this type of analyses is to portray a more comprehensive landscape of a biological state of interest by interrogating multiple molecular compartments from the same biological system. Computational methods specifically addressing multi-omics modelling have been proposed [230-233], but this approach is still under-used in nanotoxicology, mainly focusing on a few studies on multi-walled carbon nanotubes [193, 199, 234, 235]. Omics analysis is normally referred to as a high-content analysis, where few samples are tested for a high number of parameters (e.g., genes) and is relatively slow and costly. However, reduced sets of toxicity-associated genes can be assayed at higher throughput and lower cost, e.g., Luminex® or more recently TempO-seq (RASL-seq) targeted RNA sequencing technology [236]. To the benefit of the nanoinformatics community, high-throughput transcriptomics platforms are in development, e.g., in the LINCS and the Tox21 Phase III projects, and enable rapid gene profiling experiments with both several doses and biological replicates using multiple models of 800–1500 genes (reviewed in ref. [237]). Although, NM effects analysed using traditional microarrays, such as Agilent or Affymetrix GeneChips®, form the basis for most existing gene profiling analyses of exposure to NMs and provide reference values for recent next-generation sequencing and future generation of HTS data from selected toxicity-reflective gene sets.

EU US Roadmap Nanoinformatics
77
There is also a clear need to develop new technologies and incorporate novel data streams for human health risk assessment. For example, applying toxicogenomics to characterise the biological responses to exposures to NMs and evaluate possible dose-response relationships [204, 238, 239]. Software such as BMDExpress provides an opportunity to conduct such analyses [240]. Benchmark dose analysis along with multivariate techniques such as GSEA [203] to derive the most sensitive enriched pathway as well as the overall median BMD value for key gene members of significantly enriched pathways, provide good estimates of the most sensitive apical endpoint benchmark dose [241, 242].
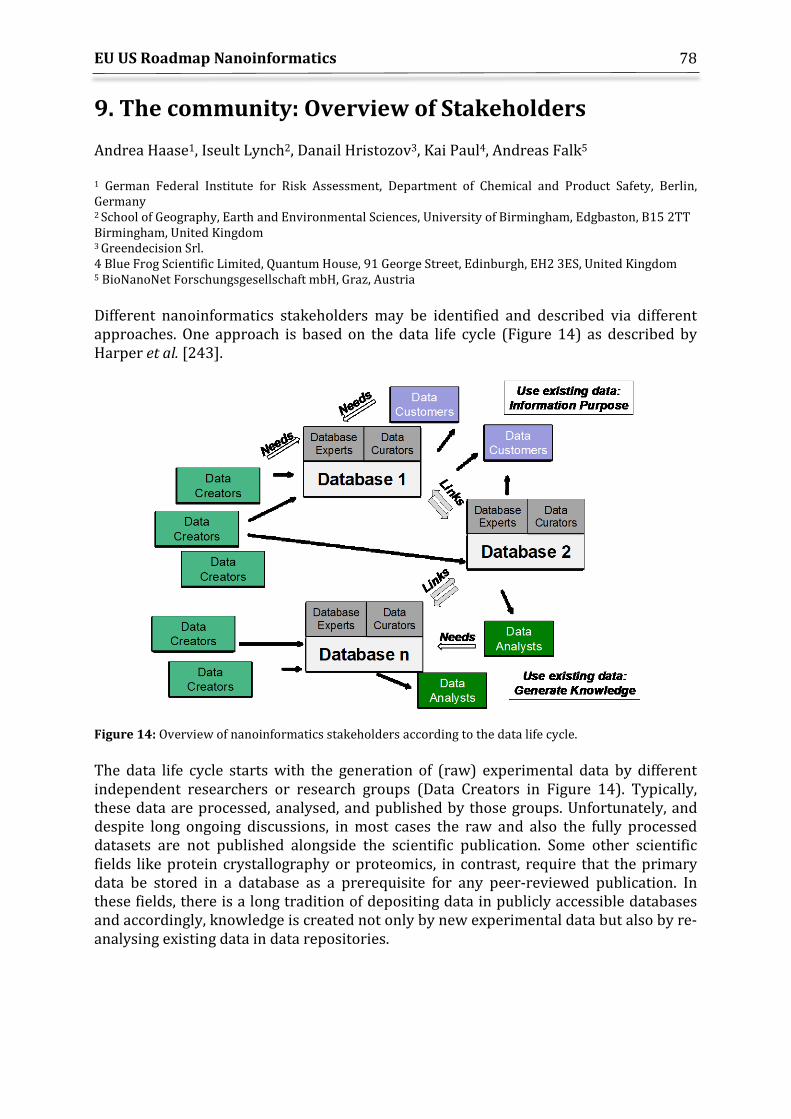
EU US Roadmap Nanoinformatics
78
9. The community: Overview of Stakeholders Andrea Haase1, Iseult Lynch2, Danail Hristozov3, Kai Paul4, Andreas Falk5 1 German Federal Institute for Risk Assessment, Department of Chemical and Product Safety, Berlin, Germany 2 School of Geography, Earth and Environmental Sciences, University of Birmingham, Edgbaston, B15 2TT Birmingham, United Kingdom
3 Greendecision Srl. 4 Blue Frog Scientific Limited, Quantum House, 91 George Street, Edinburgh, EH2 3ES, United Kingdom 5 BioNanoNet Forschungsgesellschaft mbH, Graz, Austria Different nanoinformatics stakeholders may be identified and described via different approaches. One approach is based on the data life cycle (Figure 14) as described by Harper et al. [243].
Figure 14: Overview of nanoinformatics stakeholders according to the data life cycle. The data life cycle starts with the generation of (raw) experimental data by different independent researchers or research groups (Data Creators in Figure 14). Typically, these data are processed, analysed, and published by those groups. Unfortunately, and despite long ongoing discussions, in most cases the raw and also the fully processed datasets are not published alongside the scientific publication. Some other scientific fields like protein crystallography or proteomics, in contrast, require that the primary data be stored in a database as a prerequisite for any peer-reviewed publication. In these fields, there is a long tradition of depositing data in publicly accessible databases and accordingly, knowledge is created not only by new experimental data but also by re-analysing existing data in data repositories.
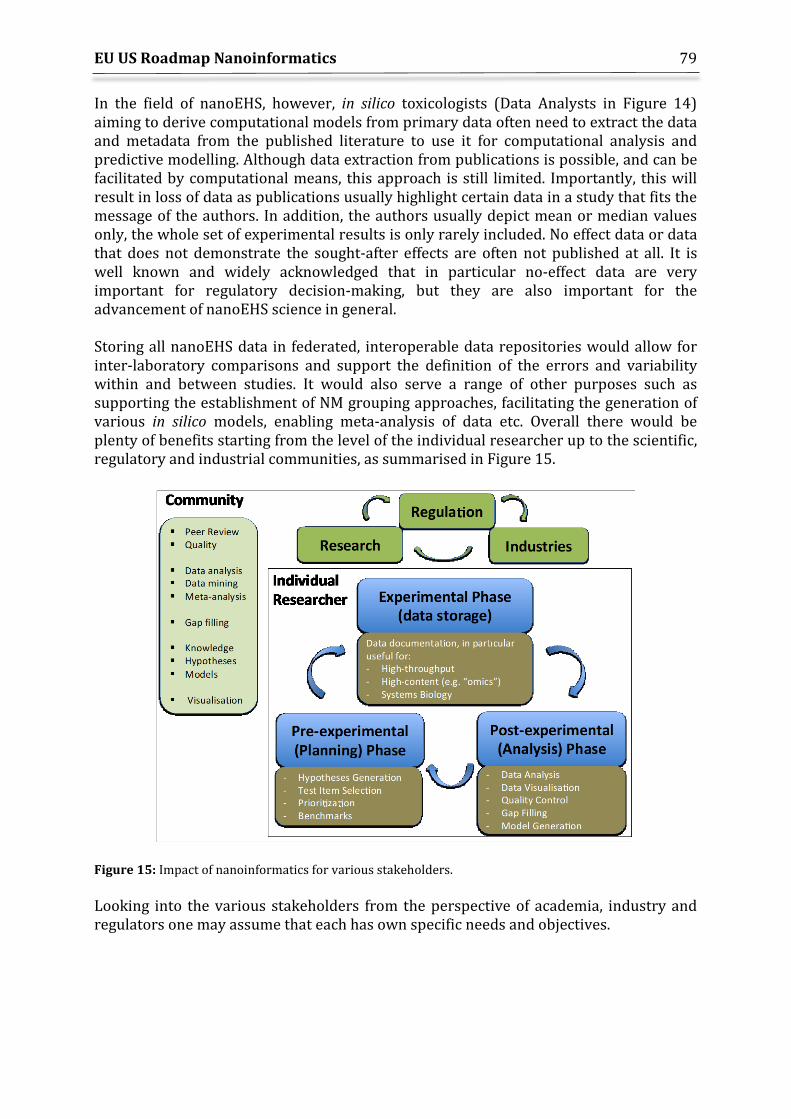
EU US Roadmap Nanoinformatics
79
In the field of nanoEHS, however, in silico toxicologists (Data Analysts in Figure 14) aiming to derive computational models from primary data often need to extract the data and metadata from the published literature to use it for computational analysis and predictive modelling. Although data extraction from publications is possible, and can be facilitated by computational means, this approach is still limited. Importantly, this will result in loss of data as publications usually highlight certain data in a study that fits the message of the authors. In addition, the authors usually depict mean or median values only, the whole set of experimental results is only rarely included. No effect data or data that does not demonstrate the sought-after effects are often not published at all. It is well known and widely acknowledged that in particular no-effect data are very important for regulatory decision-making, but they are also important for the advancement of nanoEHS science in general. Storing all nanoEHS data in federated, interoperable data repositories would allow for inter-laboratory comparisons and support the definition of the errors and variability within and between studies. It would also serve a range of other purposes such as supporting the establishment of NM grouping approaches, facilitating the generation of various in silico models, enabling meta-analysis of data etc. Overall there would be plenty of benefits starting from the level of the individual researcher up to the scientific, regulatory and industrial communities, as summarised in Figure 15.
Figure 15: Impact of nanoinformatics for various stakeholders. Looking into the various stakeholders from the perspective of academia, industry and regulators one may assume that each has own specific needs and objectives.
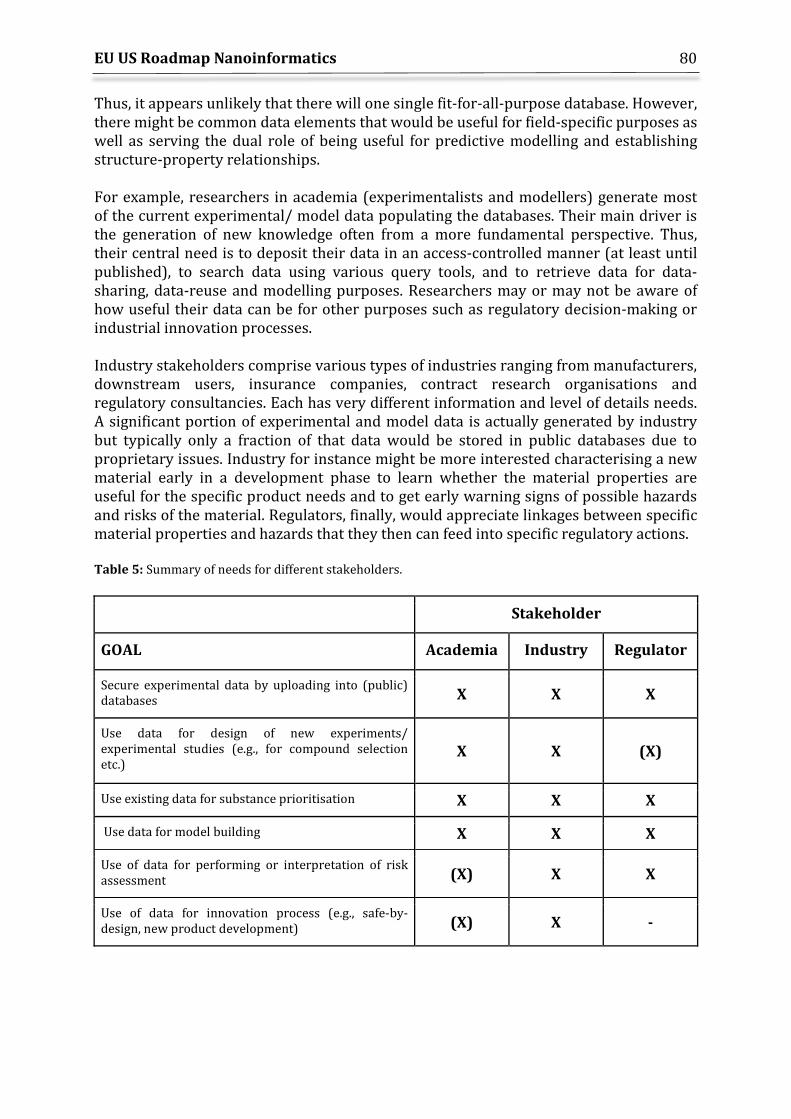
EU US Roadmap Nanoinformatics
80
Thus, it appears unlikely that there will one single fit-for-all-purpose database. However, there might be common data elements that would be useful for field-specific purposes as well as serving the dual role of being useful for predictive modelling and establishing structure-property relationships. For example, researchers in academia (experimentalists and modellers) generate most of the current experimental/ model data populating the databases. Their main driver is the generation of new knowledge often from a more fundamental perspective. Thus, their central need is to deposit their data in an access-controlled manner (at least until published), to search data using various query tools, and to retrieve data for data-sharing, data-reuse and modelling purposes. Researchers may or may not be aware of how useful their data can be for other purposes such as regulatory decision-making or industrial innovation processes. Industry stakeholders comprise various types of industries ranging from manufacturers, downstream users, insurance companies, contract research organisations and regulatory consultancies. Each has very different information and level of details needs. A significant portion of experimental and model data is actually generated by industry but typically only a fraction of that data would be stored in public databases due to proprietary issues. Industry for instance might be more interested characterising a new material early in a development phase to learn whether the material properties are useful for the specific product needs and to get early warning signs of possible hazards and risks of the material. Regulators, finally, would appreciate linkages between specific material properties and hazards that they then can feed into specific regulatory actions. Table 5: Summary of needs for different stakeholders.
Stakeholder
GOAL Academia Industry Regulator
Secure experimental data by uploading into (public) databases X X X
Use data for design of new experiments/ experimental studies (e.g., for compound selection etc.)
X X (X)
Use existing data for substance prioritisation X X X
Use data for model building X X X
Use of data for performing or interpretation of risk assessment (X) X X
Use of data for innovation process (e.g., safe-by-design, new product development) (X) X -

EU US Roadmap Nanoinformatics
81
One of the most important elements needed to progress the field of nanoinformatics is fostering and enhancing dialogue between different stakeholders so that they become aware of the needs of other stakeholders. As nanoscience and nanoEHS are highly interdisciplinary, nanoinformatics can only mature if all the stakeholders actively participate in this process.
EU US Roadmap Nanoinformatics
82
10. The Community: Impact on Stakeholders Danail Hristozov1, Andrea Haase2, Nina Jeliazkova3, Iseult Lynch4, Kai Paul5, Wendel Wohlleben6, Marc A. Williams7, Alan J. Kennedy8, Lisa Strutz9 1 Greendecision Srl. 2 German Federal Institute for Risk Assessment, Germany 3 Ideaconsult Ltd, Bulgaria
4 School of Geography, Earth and Environmental Sciences, University of Birmingham, Edgbaston, B15 2TT Birmingham, United Kingdom 5 Blue Frog Scientific Limited, Quantum House, 91 George Street, Edinburgh, EH2 3ES, United Kingdom 6 BASF SE, Ludwigshafen, Germany 7 U.S. Army Public Health Center (APHC), Toxicology Directorate, Aberdeen Proving Ground, MD, USA 8 U.S. Army Engineer Research and Development Center, Environmental Laboratory, Vicksburg, MS, USA 9 APHC, Environmental Health Sciences & Engineering, Aberdeen Proving Ground, MD, USA
10.1 Impact on Academia To confidently predict the properties, interactions and/or adverse (eco)toxicological effects of NMs, access to high quality data and metadata is essential. The myriad of nanosafety projects have attracted hundreds of millions of euros investment. This inward investment has paid off and translated to the generation of a significant body of highly relevant physico-chemical, toxicokinetic, fate, and exposure and (eco)toxicity data in a little over a decade of applied research. However, this information is only accessible via disparate and heterogeneous sources, which offer different types of information in many different formats (e.g., technical reports, excel spreadsheets, data inventories, knowledge bases, scientific publications). However, for nanoEHS safety assessment the most practical method of making efficient use of this significant body of data is to ensure that all data are uploaded promptly to selected databases. Subsequently, curated and aggregated data should be accessible and linkable to relevant modelling tools. The intention is to make the data accessible to their potential end-users by means of user-friendly interfaces.
In addition to the modelling community, others (e.g. regulators, industry) will benefit from ready-to-use curated datasets, spanning endpoints of regulatory importance, and from open source and/or open access modelling components, developed in collaboration with experts from the respective scientific domains. This will also allow comparison between different modelling approaches, which will ultimately lead to an advancing of the field and a wider (i.e., regulatory) acceptance of nanoinformatics. The inclusion of data quality and completeness criteria, including information that guides the end-user on what is technically and analytically feasible from particular experimental designs, will serve as a unique asset in strengthening the trust and validity of the results derived from a given model system. The modelling community will also benefit from the interoperability of curated data and specific modelling components, which will permit dynamic retrieval and analysis of the data, and do so beyond static datasets.
EU US Roadmap Nanoinformatics
83
Finally, the challenging goal of developing and implementing a global infrastructure will markedly strengthen research cohesion and international collaboration that has already been initiated, e.g., within the EU NanoSafety Cluster (www.nanosafetycluster.eu) or within the US-EU Nanotechnology Communities of Research (https://us-eu.org/). However, it will require long-term coordinated cooperation among EU and US scientific programs, initiatives, and institutions to avoid potential overlap or redundancy and to strengthen complementary efforts that will bring vested groups or individual scientists closer to this overarching goal. Moreover, this goal will likely exert a marked impact on international efforts for harmonising and standardising ontologies and data representation and in sharing specifications.
10.2 Impact on Industry Several types of industries attempt to discover or design outstanding product performance and use nanotechnology and multiscale modelling to achieve this. The solution might include particle-based nanostructures, but might also achieve the required balance of performance, price, safety and sustainability via other routes, including but not limited to, process- or reaction-induced nanostructures in macroscopic parts. Nanoinformatics tools are thus embedded in modelling for the wider concept of “Advanced Materials,” (i.e., Materials for Key Enabling Technologies, European Science Foundation, Materials Science and Engineering, Expert Committee (MatSEEC)). It is anticipated that industry will benefit from obtaining data and modelling capabilities useful for design of “safer” materials (i.e., those materials that display more acceptable EHS profiles) and products of market-ready quality. There is already a significant and growing market for data-driven modelling solutions that can optimise the cost of regulatory risk assessment and support safer product design. Thus, once implemented, the nanoinformatics data curation and modelling infrastructure could increase confidence in the nanotechnology enterprise with the aim of encouraging innovation across several sectors. These sectors include, and would certainly not be limited to, electronics, construction, packaging, food, energy, healthcare, and automotive. In addition, companies, especially small- and medium-sized enterprises (SMEs) with limited resources for health and safety management, are expected to benefit greatly from this interoperable data curation and modelling infrastructure. Implementation of this system via existing risk assessment and management tools (e.g., SUNDS, http://www.sun-fp7.eu/sunds/) can have significant practical value for both industry and regulators alike since it would enable integration of technical data by incorporating the risks, benefits and costs of NMs into sustainability portfolios. This process would enable derivation of informed decisions on how best to address safer production, downstream use and end-of-life treatment of NMs. Technologies like those described above, also have the capacity to assist decision-making in industrial applications – a process that would enable decisions to be made on whether or not to invest in new nanotechnology product development or in selecting alternatives. Such a user-friendly nanoinformatics infrastructure will have practical impact, since it will enable regulators
EU US Roadmap Nanoinformatics
84
to prioritise NMs based on their relative risk profiles, and will permit the selection of the most adequate risk mitigation measures.
Nanoinformatics and the associated modelling infrastructure will be a significant aid to industry risk assessment in different regulatory frameworks (i.e., U.S. EPA TSCA, EU REACH, etc.) and in reducing the costs and time that are required for new product research, development and innovation (R&D&I). For example, under REACH (Article 13, Article 25 and Annex VII-X), animal testing should only be conducted as a last resort, after all other forms of data acquisition are exhausted. This arises from the use of the data derived and synthesised from the literature or databases, use of QSAR analyses or read-across from chemical analogues. However, this is strictly dependent on the availability of high-quality data within databases and the data being easily searchable. As laid down in the mutual acceptance of data (MAD) principle of OECD (OECD, 1981), use of experimental data for regulatory purposes requires that data has been generated according to specific technical guidelines (i.e., OECD TG) and that good laboratory practices (GLP) have been observed. Similarly, when models are used for regulatory purposes, it is requested that the model be established and validated (please refer to Section 6). The most important current drawbacks include the scarcity of high-quality data from current databases or repositories that has been generated by validated or harmonised test methods, the small number of available datasets utilising widely accepted controls, or the availability of benchmark materials that could support comparative analysis of different sets of data. In addition, data are most often stored in widely dispersed, differentially available data repositories, which, moreover, often use different ontologies. Furthermore, any data generated by industry under currently unsuitable or non-standard guidelines might be wasted and even under conditions where this data are available, it will not advance the knowledge of the nano-community.
The availability of a nanoinformatics platform that combines data curation with modelling capabilities and user-friendly interfaces would be particularly interesting for SME, enabling them to more readily perform EHS assessments, to reduce their R&D&I costs and enable them to more effectively compete with larger industries. Moreover, the application of high-quality curated data should reduce the degree of uncertainty in the risk assessment process and could improve the process of risk communication. These measures have the capacity to contribute strengthened confidence in market interpretation of their products and to improved business cases.
10.3 Impact on Regulatory Agencies The nanoinformatics data and modelling infrastructure will markedly impact the safety assessment of NMs. Most importantly, it will provide regulators access to curated data sets covering many different NMs and nanoforms, thus strongly enhancing predictive capability at moderate cost, facilitate comparative analysis, support weight of evidence
EU US Roadmap Nanoinformatics
85
approaches, allow informed hazard analysis and exposure science, and foster the application of modelling in the setting of risk characterisation, analysis and assessment. Nanoinformatics infrastructure might also support advancing regulatory science and regulation. For instance, the possibility of comparing data that originate from different assays covering the same endpoint could reveal possible deficiencies within those assays and across similar end-points. When one considers the fact that the majority of the tests and test guidelines are not yet formally adapted to meet the needs for NMs [244], these insights are critical and urgently required to increase the confidence in decision-making. The data might also highlight whether or not there is a need to use different assessment factors for NMs. Finally, nanoinformatics can support the responsible implementation of NM-specific adaptations in current regulatory frameworks. This can only be established once comprehensive and curated datasets are available. Thus, nanoinformatics can assist the progression and iterative processes of regulatory legislation. Moreover, this type of legislation and the guidance accompanying it (testing and practical guidance procedures), can provide industry with a degree of confidence in following a regulatory framework to achieve specific compliance objectives. Under many frameworks including REACH, there is a need to draft specific and detailed guidelines for testing of NMs, currently still is under development. For instance, currently there are many NM physio-chemical properties identified within IUCLID. However, there is no coordinated consensus on which of these properties are the most important ones for a given purpose, or a robust definition of those properties. In addition, there is no legal obligation to reveal proprietary physico-chemical properties. It is impractical to assess each property for every NM or nanoform due to the cost, time, and relevance. However, within REACH increasing clarity is expected from the amendments to the annexes for the registration of NMs, currently in progress and expected to be in force in 2020. However, nanoinformatics can aid in many areas of dossier preparation, which would thus permit a responsible, time- and cost-effective release of the NM to the market. When properly realised, nanoinformatics data can support the formal adaptation/validation of existing testing methods to meet the specific needs of NMs and at the same time aid in the creation, implementation and validation of new testing methods that might have utility for screening purposes. In addition, novel methods that are more tailored toward the discovery of Mode of Action (MoA) approaches can be potentially validated in the near future. Such tests would include screening methods and functional assays that are central to developing intelligent testing strategies (ITS) or Integrated Assessment and Testing Approaches (IATAs). These include in silico, in chemico, in vitro and a variety of evolving omics methodologies developed to reduce reliance on and use of animals in toxicological screening assays or basic research. Thus, not only might the data have utility in NM regulation, but it might also support a wider, overarching objective aimed at further developing and validating alternative methods. It should be noted that the European Chemicals Agency (ECHA) has already initiated discussion among academia, regulators and industry on the implementation of new approach methodologies (NAMs) into regulations such as REACH [208].
EU US Roadmap Nanoinformatics
86
Additionally, validated, high quality data could be collated in a comprehensive repository, such as EUON (https://euon.echa.europa.eu/). Long term, this database might then be used by OECD QSAR toolbox for example, to permit read-across, data collation, and trend analysis for data-gap filling for NMs. Importantly, such models might also be used to screen for substances of concern, which would then be placed on relevant lists for further actions such as the CoRAP (community rolling action plan) list or SVHC, which is the list of substances of very high concern. Furthermore, for data poor substances such as NMs, this data collection can be used to support weight of evidence approaches.
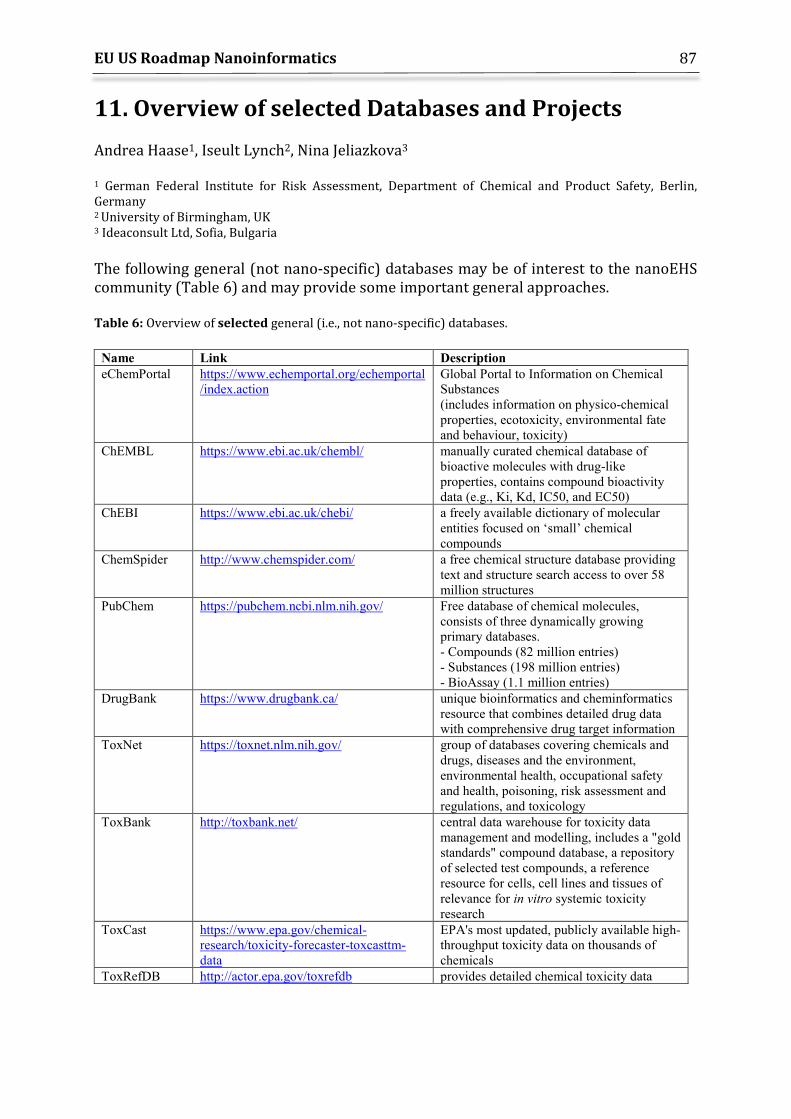
EU US Roadmap Nanoinformatics
87
11. Overview of selected Databases and Projects Andrea Haase1, Iseult Lynch2, Nina Jeliazkova3 1 German Federal Institute for Risk Assessment, Department of Chemical and Product Safety, Berlin, Germany 2 University of Birmingham, UK 3 Ideaconsult Ltd, Sofia, Bulgaria The following general (not nano-specific) databases may be of interest to the nanoEHS community (Table 6) and may provide some important general approaches. Table 6: Overview of selected general (i.e., not nano-specific) databases.
Name Link Description eChemPortal https://www.echemportal.org/echemportal
/index.action Global Portal to Information on Chemical Substances (includes information on physico-chemical properties, ecotoxicity, environmental fate and behaviour, toxicity)
ChEMBL https://www.ebi.ac.uk/chembl/ manually curated chemical database of bioactive molecules with drug-like properties, contains compound bioactivity data (e.g., Ki, Kd, IC50, and EC50)
ChEBI https://www.ebi.ac.uk/chebi/ a freely available dictionary of molecular entities focused on ‘small’ chemical compounds
ChemSpider http://www.chemspider.com/ a free chemical structure database providing text and structure search access to over 58 million structures
PubChem https://pubchem.ncbi.nlm.nih.gov/ Free database of chemical molecules, consists of three dynamically growing primary databases. - Compounds (82 million entries) - Substances (198 million entries) - BioAssay (1.1 million entries)
DrugBank https://www.drugbank.ca/ unique bioinformatics and cheminformatics resource that combines detailed drug data with comprehensive drug target information
ToxNet https://toxnet.nlm.nih.gov/ group of databases covering chemicals and drugs, diseases and the environment, environmental health, occupational safety and health, poisoning, risk assessment and regulations, and toxicology
ToxBank http://toxbank.net/ central data warehouse for toxicity data management and modelling, includes a "gold standards" compound database, a repository of selected test compounds, a reference resource for cells, cell lines and tissues of relevance for in vitro systemic toxicity research
ToxCast https://www.epa.gov/chemical-research/toxicity-forecaster-toxcasttm-data
EPA's most updated, publicly available high-throughput toxicity data on thousands of chemicals
ToxRefDB http://actor.epa.gov/toxrefdb provides detailed chemical toxicity data
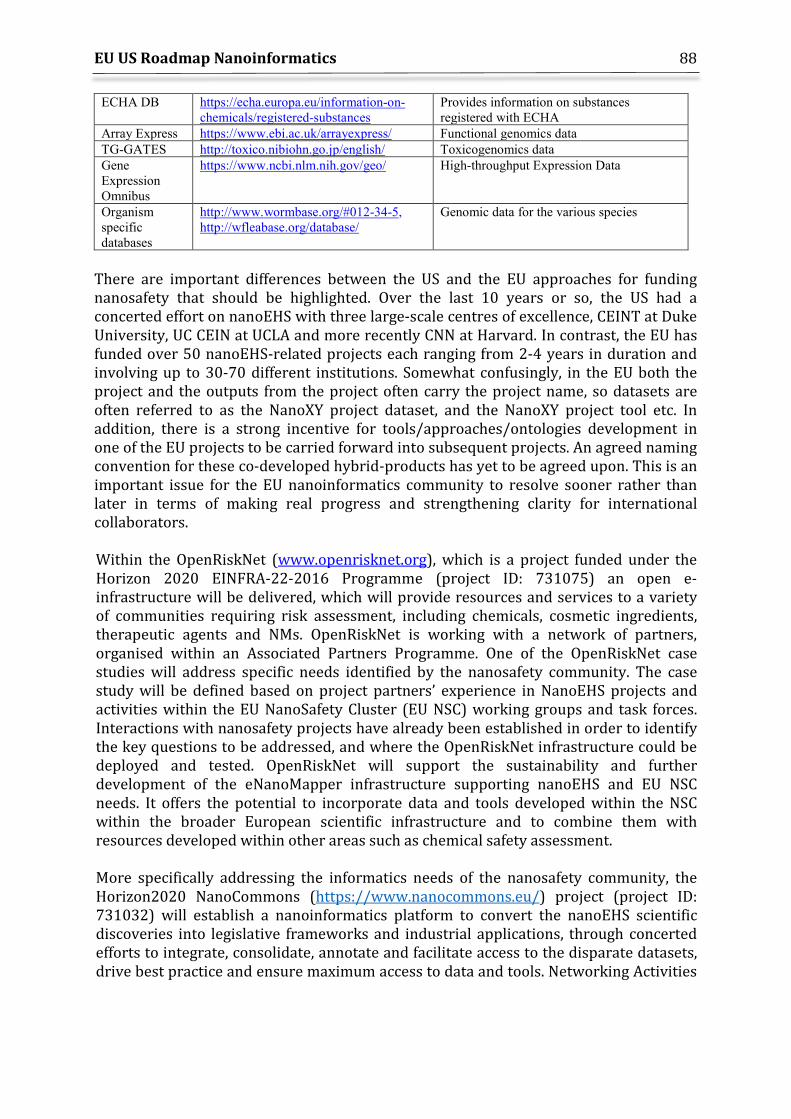
EU US Roadmap Nanoinformatics
88
ECHA DB https://echa.europa.eu/information-on-chemicals/registered-substances
Provides information on substances registered with ECHA
Array Express https://www.ebi.ac.uk/arrayexpress/ Functional genomics data TG-GATES http://toxico.nibiohn.go.jp/english/ Toxicogenomics data Gene Expression Omnibus
https://www.ncbi.nlm.nih.gov/geo/ High-throughput Expression Data
Organism specific databases
http://www.wormbase.org/#012-34-5, http://wfleabase.org/database/
Genomic data for the various species
There are important differences between the US and the EU approaches for funding nanosafety that should be highlighted. Over the last 10 years or so, the US had a concerted effort on nanoEHS with three large-scale centres of excellence, CEINT at Duke University, UC CEIN at UCLA and more recently CNN at Harvard. In contrast, the EU has funded over 50 nanoEHS-related projects each ranging from 2-4 years in duration and involving up to 30-70 different institutions. Somewhat confusingly, in the EU both the project and the outputs from the project often carry the project name, so datasets are often referred to as the NanoXY project dataset, and the NanoXY project tool etc. In addition, there is a strong incentive for tools/approaches/ontologies development in one of the EU projects to be carried forward into subsequent projects. An agreed naming convention for these co-developed hybrid-products has yet to be agreed upon. This is an important issue for the EU nanoinformatics community to resolve sooner rather than later in terms of making real progress and strengthening clarity for international collaborators. Within the OpenRiskNet (www.openrisknet.org), which is a project funded under the Horizon 2020 EINFRA-22-2016 Programme (project ID: 731075) an open e-infrastructure will be delivered, which will provide resources and services to a variety of communities requiring risk assessment, including chemicals, cosmetic ingredients, therapeutic agents and NMs. OpenRiskNet is working with a network of partners, organised within an Associated Partners Programme. One of the OpenRiskNet case studies will address specific needs identified by the nanosafety community. The case study will be defined based on project partners’ experience in NanoEHS projects and activities within the EU NanoSafety Cluster (EU NSC) working groups and task forces. Interactions with nanosafety projects have already been established in order to identify the key questions to be addressed, and where the OpenRiskNet infrastructure could be deployed and tested. OpenRiskNet will support the sustainability and further development of the eNanoMapper infrastructure supporting nanoEHS and EU NSC needs. It offers the potential to incorporate data and tools developed within the NSC within the broader European scientific infrastructure and to combine them with resources developed within other areas such as chemical safety assessment. More specifically addressing the informatics needs of the nanosafety community, the Horizon2020 NanoCommons (https://www.nanocommons.eu/) project (project ID: 731032) will establish a nanoinformatics platform to convert the nanoEHS scientific discoveries into legislative frameworks and industrial applications, through concerted efforts to integrate, consolidate, annotate and facilitate access to the disparate datasets, drive best practice and ensure maximum access to data and tools. Networking Activities
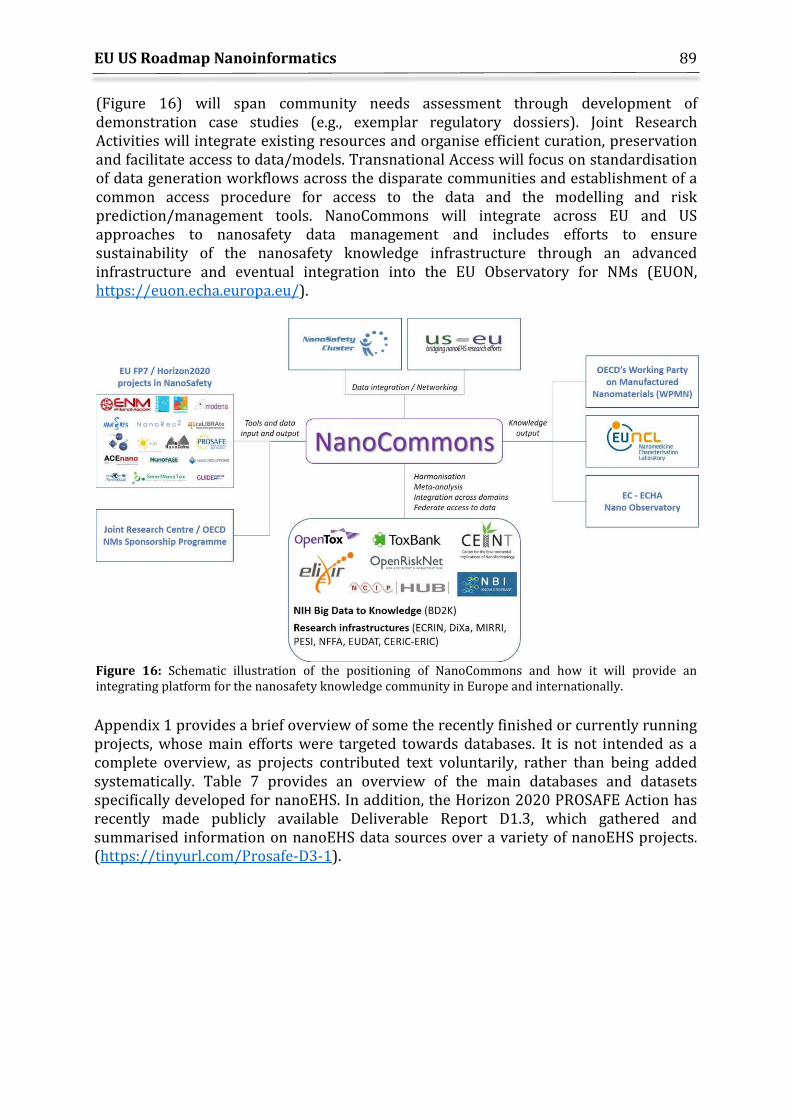
EU US Roadmap Nanoinformatics
89
(Figure 16) will span community needs assessment through development of demonstration case studies (e.g., exemplar regulatory dossiers). Joint Research Activities will integrate existing resources and organise efficient curation, preservation and facilitate access to data/models. Transnational Access will focus on standardisation of data generation workflows across the disparate communities and establishment of a common access procedure for access to the data and the modelling and risk prediction/management tools. NanoCommons will integrate across EU and US approaches to nanosafety data management and includes efforts to ensure sustainability of the nanosafety knowledge infrastructure through an advanced infrastructure and eventual integration into the EU Observatory for NMs (EUON, https://euon.echa.europa.eu/).
Figure 16: Schematic illustration of the positioning of NanoCommons and how it will provide an integrating platform for the nanosafety knowledge community in Europe and internationally. Appendix 1 provides a brief overview of some the recently finished or currently running projects, whose main efforts were targeted towards databases. It is not intended as a complete overview, as projects contributed text voluntarily, rather than being added systematically. Table 7 provides an overview of the main databases and datasets specifically developed for nanoEHS. In addition, the Horizon 2020 PROSAFE Action has recently made publicly available Deliverable Report D1.3, which gathered and summarised information on nanoEHS data sources over a variety of nanoEHS projects. (https://tinyurl.com/Prosafe-D3-1).
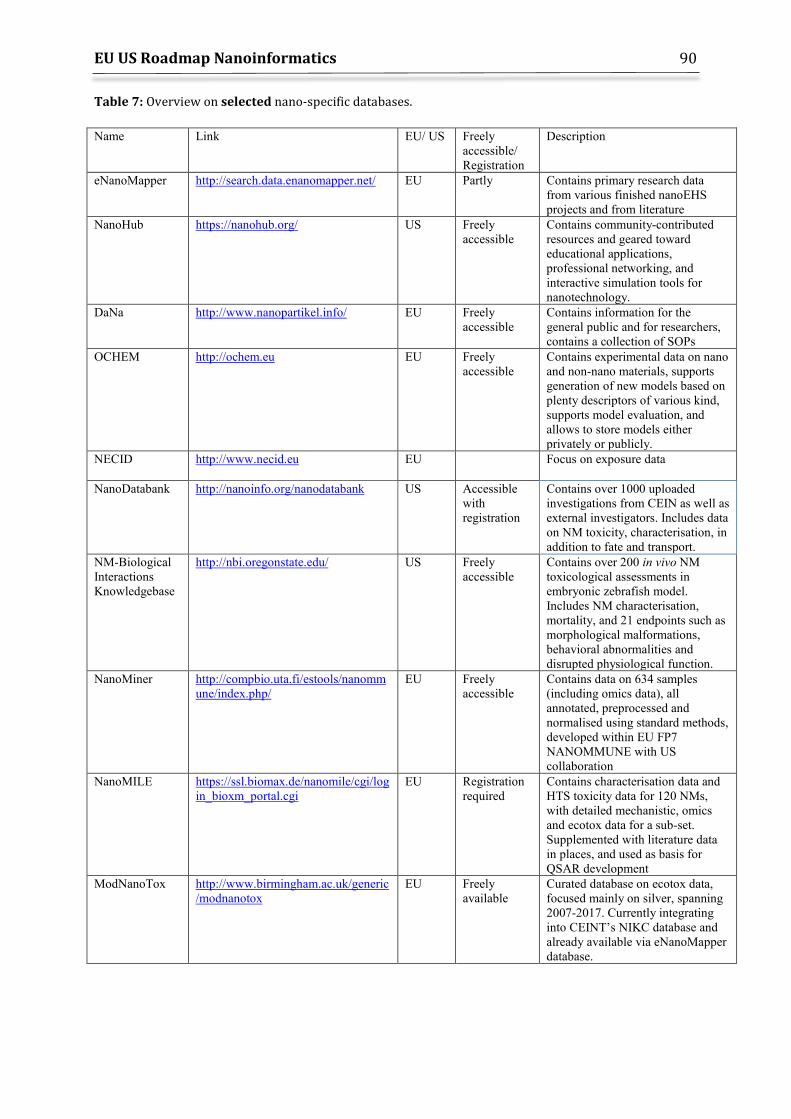
EU US Roadmap Nanoinformatics
90
Table 7: Overview on selected nano-specific databases. Name Link EU/ US Freely
accessible/ Registration
Description
eNanoMapper http://search.data.enanomapper.net/ EU Partly Contains primary research data from various finished nanoEHS projects and from literature
NanoHub https://nanohub.org/
US Freely accessible
Contains community-contributed resources and geared toward educational applications, professional networking, and interactive simulation tools for nanotechnology.
DaNa http://www.nanopartikel.info/ EU Freely accessible
Contains information for the general public and for researchers, contains a collection of SOPs
OCHEM http://ochem.eu EU Freely accessible
Contains experimental data on nano and non-nano materials, supports generation of new models based on plenty descriptors of various kind, supports model evaluation, and allows to store models either privately or publicly.
NECID http://www.necid.eu EU
Focus on exposure data
NanoDatabank http://nanoinfo.org/nanodatabank US Accessible with registration
Contains over 1000 uploaded investigations from CEIN as well as external investigators. Includes data on NM toxicity, characterisation, in addition to fate and transport.
NM-Biological Interactions Knowledgebase
http://nbi.oregonstate.edu/ US Freely accessible
Contains over 200 in vivo NM toxicological assessments in embryonic zebrafish model. Includes NM characterisation, mortality, and 21 endpoints such as morphological malformations, behavioral abnormalities and disrupted physiological function.
NanoMiner http://compbio.uta.fi/estools/nanommune/index.php/
EU Freely accessible
Contains data on 634 samples (including omics data), all annotated, preprocessed and normalised using standard methods, developed within EU FP7 NANOMMUNE with US collaboration
NanoMILE https://ssl.biomax.de/nanomile/cgi/login_bioxm_portal.cgi
EU Registration required
Contains characterisation data and HTS toxicity data for 120 NMs, with detailed mechanistic, omics and ecotox data for a sub-set. Supplemented with literature data in places, and used as basis for QSAR development
ModNanoTox http://www.birmingham.ac.uk/generic/modnanotox
EU Freely available
Curated database on ecotox data, focused mainly on silver, spanning 2007-2017. Currently integrating into CEINT’s NIKC database and already available via eNanoMapper database.
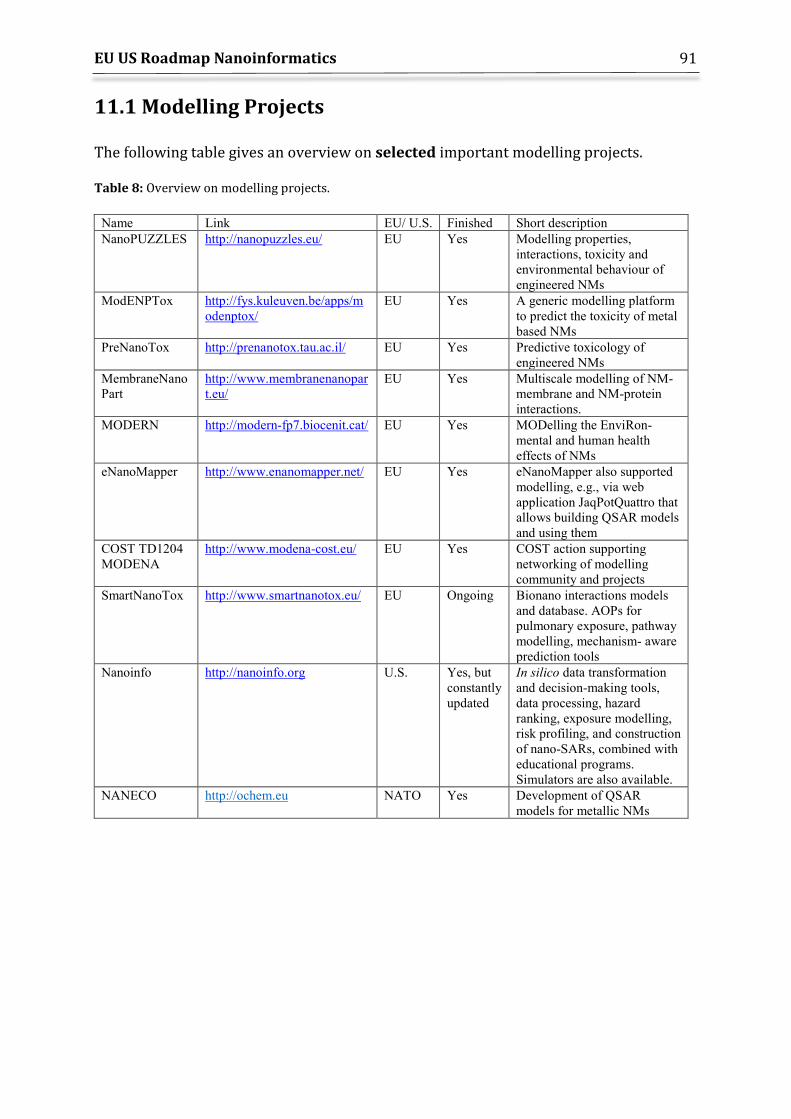
EU US Roadmap Nanoinformatics
91
11.1 Modelling Projects The following table gives an overview on selected important modelling projects. Table 8: Overview on modelling projects.
Name Link EU/ U.S. Finished Short description NanoPUZZLES http://nanopuzzles.eu/ EU Yes Modelling properties,
interactions, toxicity and environmental behaviour of engineered NMs
ModENPTox http://fys.kuleuven.be/apps/modenptox/
EU Yes A generic modelling platform to predict the toxicity of metal based NMs
PreNanoTox http://prenanotox.tau.ac.il/ EU Yes Predictive toxicology of engineered NMs
MembraneNanoPart
http://www.membranenanopart.eu/
EU Yes Multiscale modelling of NM-membrane and NM-protein interactions.
MODERN http://modern-fp7.biocenit.cat/ EU Yes MODelling the EnviRon-mental and human health effects of NMs
eNanoMapper http://www.enanomapper.net/ EU Yes eNanoMapper also supported modelling, e.g., via web application JaqPotQuattro that allows building QSAR models and using them
COST TD1204 MODENA
http://www.modena-cost.eu/ EU Yes COST action supporting networking of modelling community and projects
SmartNanoTox http://www.smartnanotox.eu/ EU Ongoing Bionano interactions models and database. AOPs for pulmonary exposure, pathway modelling, mechanism- aware prediction tools
Nanoinfo http://nanoinfo.org U.S. Yes, but constantly updated
In silico data transformation and decision-making tools, data processing, hazard ranking, exposure modelling, risk profiling, and construction of nano-SARs, combined with educational programs. Simulators are also available.
NANECO http://ochem.eu NATO Yes Development of QSAR models for metallic NMs
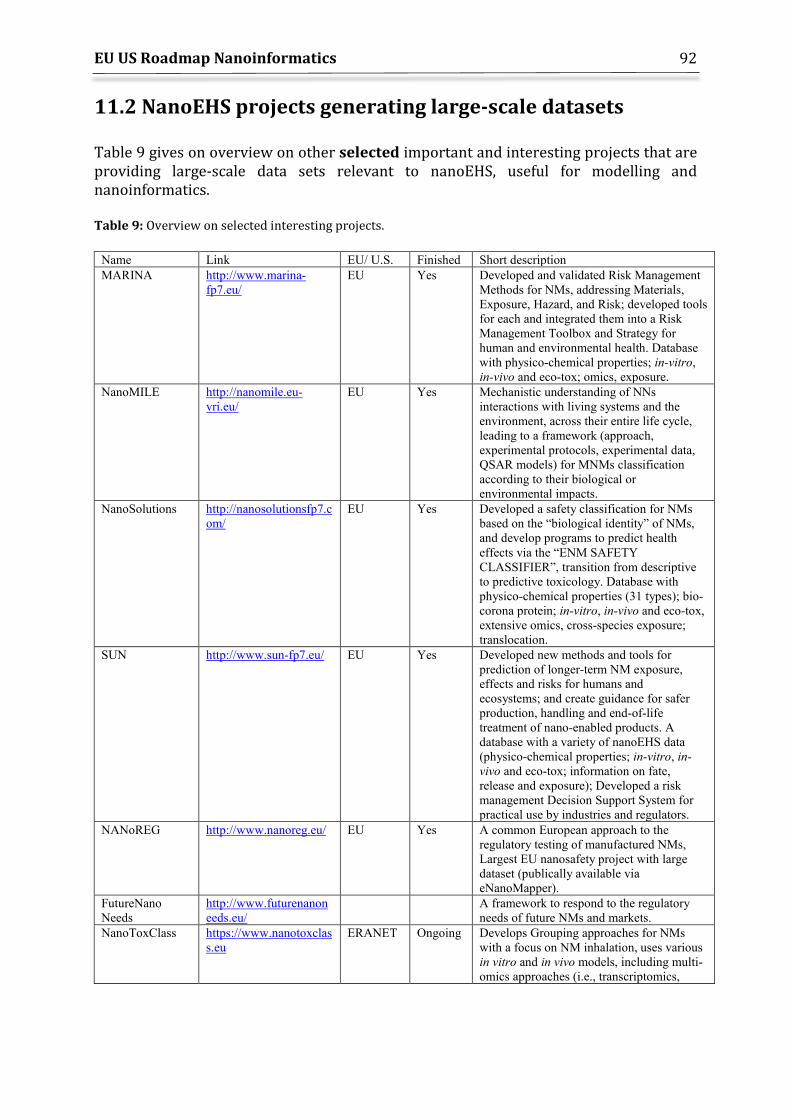
EU US Roadmap Nanoinformatics
92
11.2 NanoEHS projects generating large-scale datasets Table 9 gives on overview on other selected important and interesting projects that are providing large-scale data sets relevant to nanoEHS, useful for modelling and nanoinformatics. Table 9: Overview on selected interesting projects.
Name Link EU/ U.S. Finished Short description MARINA http://www.marina-
fp7.eu/ EU Yes Developed and validated Risk Management
Methods for NMs, addressing Materials, Exposure, Hazard, and Risk; developed tools for each and integrated them into a Risk Management Toolbox and Strategy for human and environmental health. Database with physico-chemical properties; in-vitro, in-vivo and eco-tox; omics, exposure.
NanoMILE http://nanomile.eu-vri.eu/
EU Yes Mechanistic understanding of NNs interactions with living systems and the environment, across their entire life cycle, leading to a framework (approach, experimental protocols, experimental data, QSAR models) for MNMs classification according to their biological or environmental impacts.
NanoSolutions http://nanosolutionsfp7.com/
EU Yes Developed a safety classification for NMs based on the “biological identity” of NMs, and develop programs to predict health effects via the “ENM SAFETY CLASSIFIER”, transition from descriptive to predictive toxicology. Database with physico-chemical properties (31 types); bio-corona protein; in-vitro, in-vivo and eco-tox, extensive omics, cross-species exposure; translocation.
SUN http://www.sun-fp7.eu/ EU Yes Developed new methods and tools for prediction of longer-term NM exposure, effects and risks for humans and ecosystems; and create guidance for safer production, handling and end-of-life treatment of nano-enabled products. A database with a variety of nanoEHS data (physico-chemical properties; in-vitro, in-vivo and eco-tox; information on fate, release and exposure); Developed a risk management Decision Support System for practical use by industries and regulators.
NANoREG http://www.nanoreg.eu/ EU Yes A common European approach to the regulatory testing of manufactured NMs, Largest EU nanosafety project with large dataset (publically available via eNanoMapper).
FutureNano Needs
http://www.futurenanoneeds.eu/
A framework to respond to the regulatory needs of future NMs and markets.
NanoToxClass https://www.nanotoxclass.eu
ERANET Ongoing Develops Grouping approaches for NMs with a focus on NM inhalation, uses various in vitro and in vivo models, including multi-omics approaches (i.e., transcriptomics,
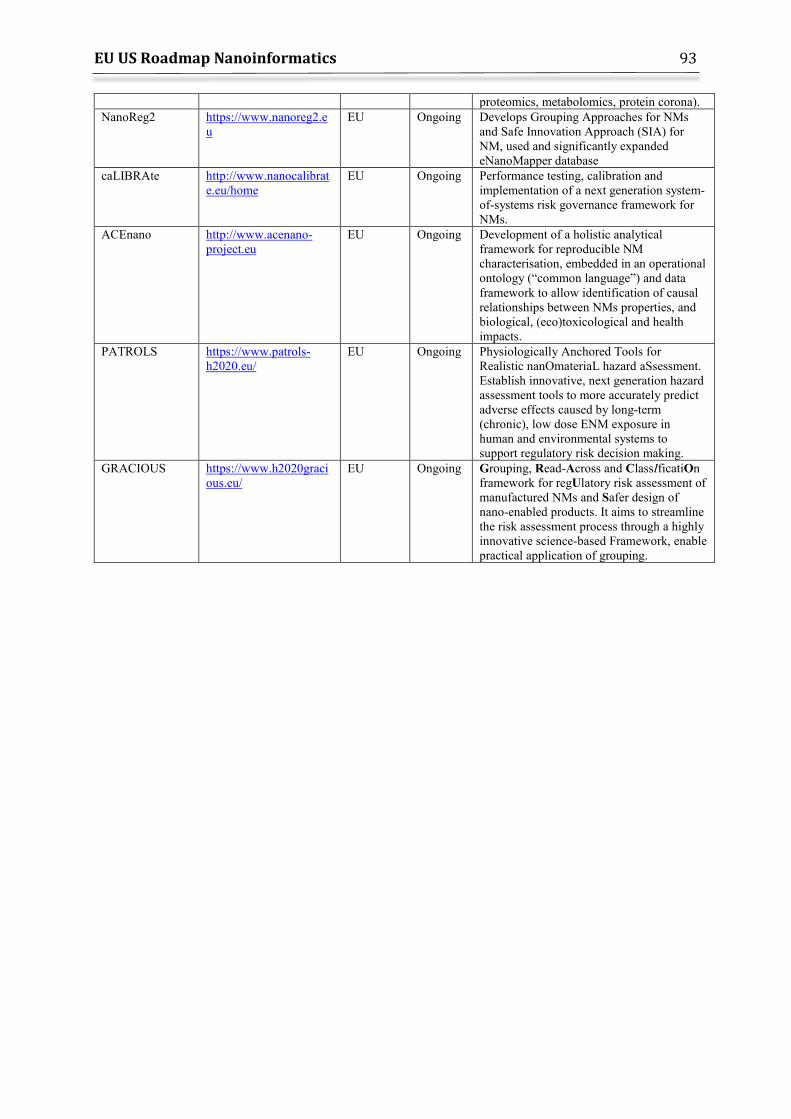
EU US Roadmap Nanoinformatics
93
proteomics, metabolomics, protein corona). NanoReg2 https://www.nanoreg2.e
u EU Ongoing Develops Grouping Approaches for NMs
and Safe Innovation Approach (SIA) for NM, used and significantly expanded eNanoMapper database
caLIBRAte http://www.nanocalibrate.eu/home
EU Ongoing Performance testing, calibration and implementation of a next generation system-of-systems risk governance framework for NMs.
ACEnano http://www.acenano-project.eu
EU Ongoing Development of a holistic analytical framework for reproducible NM characterisation, embedded in an operational ontology (“common language”) and data framework to allow identification of causal relationships between NMs properties, and biological, (eco)toxicological and health impacts.
PATROLS
https://www.patrols-h2020.eu/
EU Ongoing Physiologically Anchored Tools for Realistic nanOmateriaL hazard aSsessment. Establish innovative, next generation hazard assessment tools to more accurately predict adverse effects caused by long-term (chronic), low dose ENM exposure in human and environmental systems to support regulatory risk decision making.
GRACIOUS https://www.h2020gracious.eu/
EU Ongoing Grouping, Read-Across and ClassIficatiOn framework for regUlatory risk assessment of manufactured NMs and Safer design of nano-enabled products. It aims to streamline the risk assessment process through a highly innovative science-based Framework, enable practical application of grouping.
EU US Roadmap Nanoinformatics
94
12. Roadmap as Perspectives, Milestones and Pilot Projects Fred Klaessig1, Andrea Haase2, Yoram Cohen3, Vicki Grassian4, Vicki Stone5, Ulla Vogel6, Dave Spurgeon7, Claus Svendsen7, Germ Visser8, Andreas Falk9, Andrew Worth10, Dave Winkler11, Iseult Lynch12, Marc A. Williams13, Alan Kennedy14, Lisa Strutz15, Elizabeth Hahn-Dantona,16 Igor Linkov17 and NIH NanoWG participants 1 Pennsylvania Bio Nano Systems, LLC, USA 2 German Federal Institute for Risk Assessment, Germany 3 University of California, USA 4 University of California San Diego, USA 5 Herriot Watt University, Edinburgh, UK 6 National Research Centre for the Working Environment, Copenhagen, Denmark 7 Centre for Ecology and Hydrology, Wallingford, UK 8 DSM Science & Technology 9 BioNanoNet 10 European Commission, Joint Research Centre, Ispra, Italy 11 CSIRO, Manufacturing, Australia; La Trobe University, Australia; Monash University, Australia 12 University of Birmingham 13 U.S. Army Public Health Center (APHC), Toxicology Directorate, Aberdeen Proving Ground, MD, USA 14 U.S. Army Engineer Research and Development Center Environmental Laboratory, Vicksburg, MS, USA 15 APHC, Environmental Health Sciences & Engineering, Aberdeen Proving Ground, MD, USA 16 Medical Science & Computing, LLC 17 U.S. Army Engineer Research and Development Center, Concord, MA, USA
12.1 Introduction The EU-U.S. Nanoinformatics Roadmap 2030 consists of perspectives, milestones and pilot projects. The perspectives combine the open issues identified in earlier sections in order to highlight opportunities for coordination of efforts, and to elucidate individual milestones. The perspectives relate to toxicology (Section 12.2), physico-chemical properties (Section 12.3) and modelling (Section 12.4). The milestones described in Table 11, re-cast the perspectives into a chronological order, focusing on situations where early validation and acceptance by regulatory authorities is reasonable. The Proposed Pilot Projects described in Table 12, represent suggestions for initial efforts that would bring together various stakeholder communities. Other sections of the Nanoinformatics 2030 Roadmap describe concepts and collaborations that advance the goals outlined in Section 3. However, in suggesting milestones and pilot studies, we are placing some boundaries on expectations. Informatics and ontologies require a disciplined attention on definitions, controlled vocabularies, well-defined data sets and metadata. Consequently, we wish to be explicit regarding the steps taken in crafting the milestones and pilot projects of the NanoInformatics Roadmap. This introduction provides context; the three “perspectives” describe challenges facing the scientific community in achieving the stated goals of the Roadmap; and the subsequent “commentary” connects this work to related EU Roadmaps (available via www.nanosafetycluster.eu). The resulting milestones and suggested pilot studies are provided below as tables.
EU US Roadmap Nanoinformatics
95
Milestones are listed according to short-, intermediate- and long-term horizons that are aligned to the scientific fields that will contribute most to that specific topic. The short-term objectives establish a base set of activities; the intermediate-term objectives measure progress; and the long-term goals anticipate regulatory requirements for the resulting tools to be accepted by risk assessment professionals. The overarching strategy involves a progression of predictive computational models, each one specific to a topic area (i.e., property, species, biological response), or to a stage in the life cycle of a given NM. Each one is expected to have utility in risk assessment. A modular approach allows for flexibility in using the available data, in judging model accuracy and in addressing regulatory requirements. Two visualisations are used to offset the flexibility around models. The Particle Description can be used to align physicochemical properties to specific particle regions (e.g., core, shell, hydration layer, etc.) and composition. The Particle Journey can be used to align models to stages in the life cycle of a given NM or to laboratory tests (e.g., membrane/biological barrier contact, internalisation, biodistribution/subcellular localisation, site of action, mode of action, transformation, and clearance mechanisms, etc.). The milestones in this roadmap address three recognised challenges facing nanoinformatics and predictive computational models: (1) limited data; (2) limited data access due to proprietary, intellectual property or legal restrictions combined with the lack of long-term support for a nano-data repository and data curation with acceptable recall and precision to retrieve data from appropriate repositories; and (3) regulatory requirements for harmonised test methods that are conducted according to GLP standards. In response, the milestones seek to: (a) encourage data generation through collaboration, the use of surrogate test methods, and newer screening techniques, while (b) recognising that progress will be uneven and (c) suggest that a read-across approach and related data-filling techniques (e.g., QSARs, trend analyses, and design of experiments) represent tools for introducing the fruits of this work into the regulatory process. The reader is reminded that the background to the individual milestones and their sources were provided in Section 4, e.g., the Nanoinformatics 2020 Roadmap [4, 5]; the COST sponsored workshop in Maastricht [6, 7]; and a 2014 NSF-sponsored workshop [8]. These earlier resources were updated using concepts as examined in Sections 5-8 and now include a more explicit identification of the likely steps that are important to the processes of regulatory validation and acceptance.
12.2 Perspectives for Toxicological Milestones The Nanoinformatics 2030 Roadmap responds to two key aspects of the toxicological and related biological sciences (i.e., ecotoxicology, medicine, physiology and pharmacology, and systems biology). Firstly, there is a hypothesis-driven approach to research and new knowledge development, which is conducted against an infrastructure backdrop of bioinformatics, assay development, alternative test strategies, Adverse Outcome Pathways (AOPs), and the introduction of new capabilities with ‘omics-based
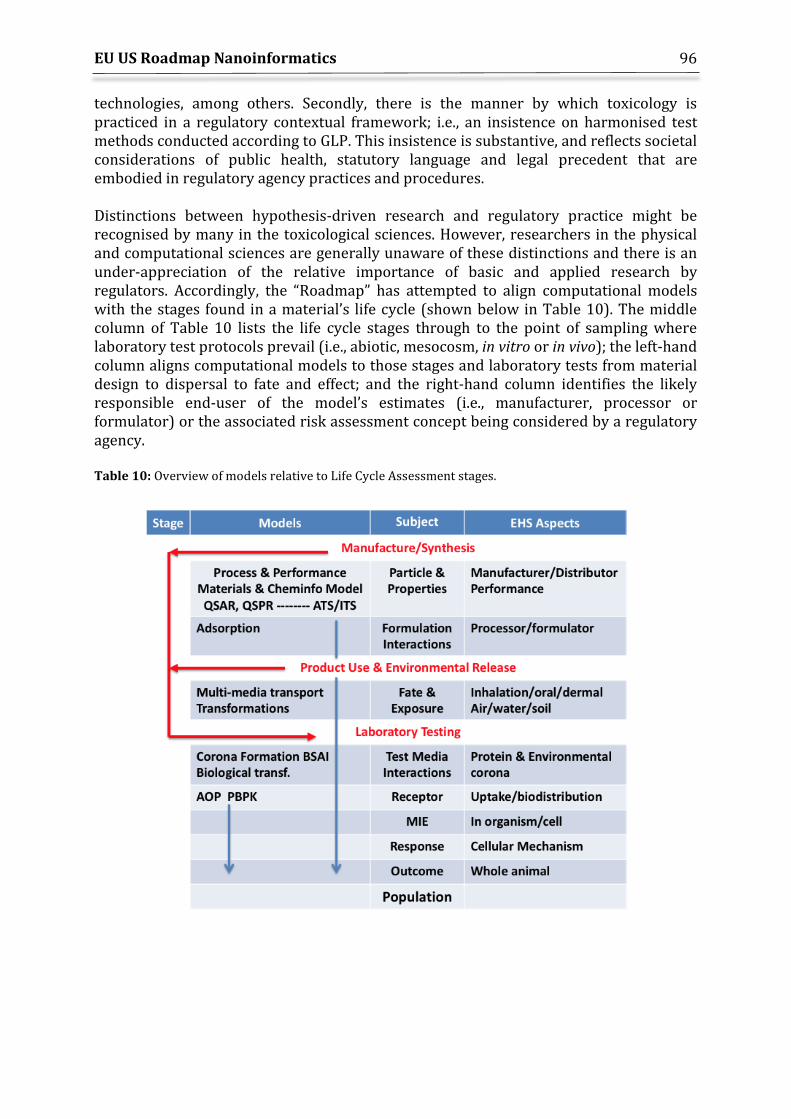
EU US Roadmap Nanoinformatics
96
technologies, among others. Secondly, there is the manner by which toxicology is practiced in a regulatory contextual framework; i.e., an insistence on harmonised test methods conducted according to GLP. This insistence is substantive, and reflects societal considerations of public health, statutory language and legal precedent that are embodied in regulatory agency practices and procedures. Distinctions between hypothesis-driven research and regulatory practice might be recognised by many in the toxicological sciences. However, researchers in the physical and computational sciences are generally unaware of these distinctions and there is an under-appreciation of the relative importance of basic and applied research by regulators. Accordingly, the “Roadmap” has attempted to align computational models with the stages found in a material’s life cycle (shown below in Table 10). The middle column of Table 10 lists the life cycle stages through to the point of sampling where laboratory test protocols prevail (i.e., abiotic, mesocosm, in vitro or in vivo); the left-hand column aligns computational models to those stages and laboratory tests from material design to dispersal to fate and effect; and the right-hand column identifies the likely responsible end-user of the model’s estimates (i.e., manufacturer, processor or formulator) or the associated risk assessment concept being considered by a regulatory agency. Table 10: Overview of models relative to Life Cycle Assessment stages.
EU US Roadmap Nanoinformatics
97
New Approach Methodologies (NAM) and Adverse Outcome Pathways (AOPs) are examples of novel, hypothesis-driven research. Currently, they are not specifically implemented and routinely accepted/used by regulators, as they have not yet undergone validation as outlined by the OECD [245]. In general, regulatory expectations of reliability and relevance, such as those expressed in the Klimisch score [246], favour established assays (e.g., from the U.S. EPA or OECD TG) that are known to be conducted in accordance with GLP. Risk assessment professionals may estimate a property or biological activity when chemical substances are grouped with tools that might include QSAR/QSPRs, trend analysis or read-across with inherent default rules for filling those data gaps by providing information on the property or biological activity of a chemical or a class of structurally related chemicals. Read-across can also be used for estimating effects across biological species. Data-filling techniques (e.g., QSARs, trend analyses and read-across) have been considered for NMs [247, 248] and offer potential approaches for developing and introducing new methodologies (e.g., NAM, AOP and computational methods) to the regulatory process. Procedures for grouping NMs, however, remain to be established. Similarity in the mechanism of biological response (AOPs, toxicokinetics, etc.) will likely be a significant consideration. Many of the models in Table 10 are reliant on progress in understanding of particle interactions, such as cellular uptake, to supplement the more established interpretations of pharmacological or toxicological kinetics based on molecular interactions, e.g., PB/PK models incorporating results of absorption, distribution, metabolism and excretion testing. The criteria that regulators will deem necessary for model acceptance will become increasingly visible with future progress, as described in guidance documents of FDA [249] for PB/PK models, OECD [TG 417, 2010] and US EPA (61 FR 56274) [250] for toxicokinetics, and the ICH S3A for assessing systemic exposures [251]. The milestones alert the reader to such matters through phrases like ‘credible AOPs’, ‘validation requirements’, and ‘regulatory endorsement’ but essentially fail to provide guidance on how to achieve them.
12.3 Perspectives for Physico-chemical Milestones While several nanoEHS disciplines describe chemical substances using simple chemical formulae for molecular identities, e.g., TiO2, these fields with respect to physico-chemical properties. The Chemical Abstract Services (CAS) does not index TiO2 information according to volume or shape. Yet, in early 2017, the US EPA with ‘nanoscale form’ and ECHA with ‘nanoform’ decided to differentiate particles with identical core compositions using size, shape and surface chemistry/coating distinctions [252, 253]. In materials science, a phase of uniform composition that is in equilibrium with other phases through the phase rule defines a molecular identity, which was one justification for not considering size (volume) when indexing information. However, the physico-
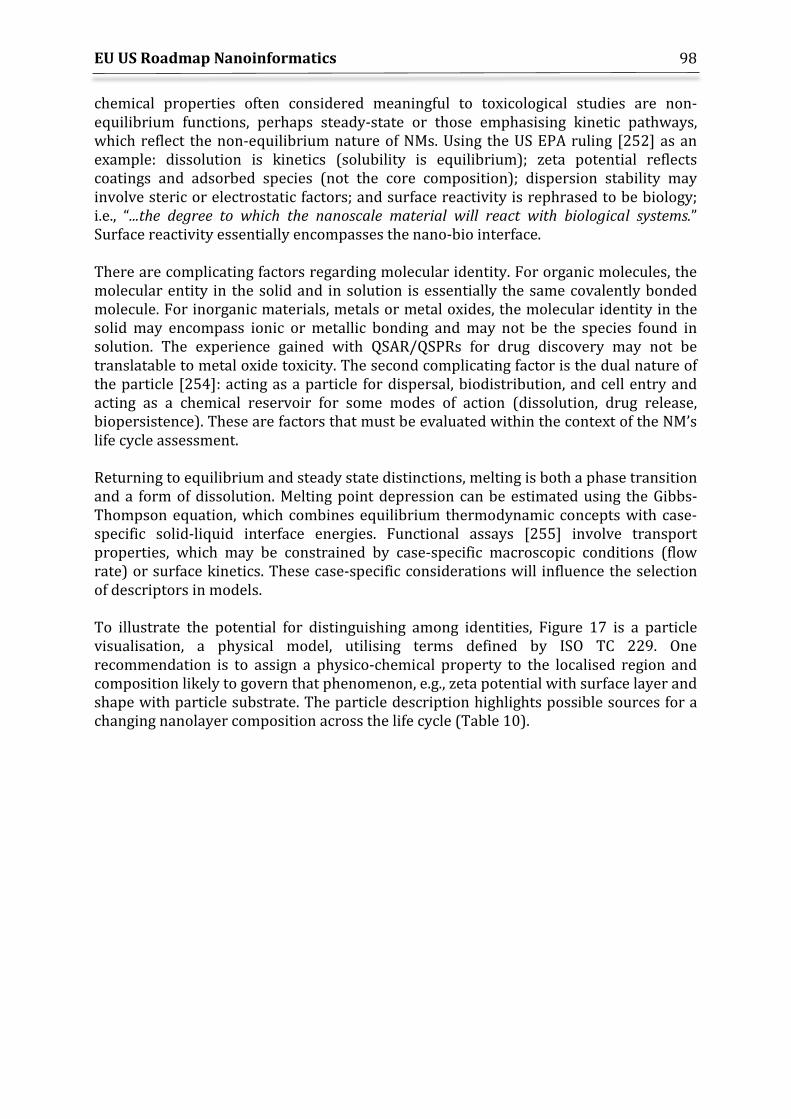
EU US Roadmap Nanoinformatics
98
chemical properties often considered meaningful to toxicological studies are non-equilibrium functions, perhaps steady-state or those emphasising kinetic pathways, which reflect the non-equilibrium nature of NMs. Using the US EPA ruling [252] as an example: dissolution is kinetics (solubility is equilibrium); zeta potential reflects coatings and adsorbed species (not the core composition); dispersion stability may involve steric or electrostatic factors; and surface reactivity is rephrased to be biology; i.e., “...the degree to which the nanoscale material will react with biological systems.” Surface reactivity essentially encompasses the nano-bio interface. There are complicating factors regarding molecular identity. For organic molecules, the molecular entity in the solid and in solution is essentially the same covalently bonded molecule. For inorganic materials, metals or metal oxides, the molecular identity in the solid may encompass ionic or metallic bonding and may not be the species found in solution. The experience gained with QSAR/QSPRs for drug discovery may not be translatable to metal oxide toxicity. The second complicating factor is the dual nature of the particle [254]: acting as a particle for dispersal, biodistribution, and cell entry and acting as a chemical reservoir for some modes of action (dissolution, drug release, biopersistence). These are factors that must be evaluated within the context of the NM’s life cycle assessment. Returning to equilibrium and steady state distinctions, melting is both a phase transition and a form of dissolution. Melting point depression can be estimated using the Gibbs-Thompson equation, which combines equilibrium thermodynamic concepts with case-specific solid-liquid interface energies. Functional assays [255] involve transport properties, which may be constrained by case-specific macroscopic conditions (flow rate) or surface kinetics. These case-specific considerations will influence the selection of descriptors in models. To illustrate the potential for distinguishing among identities, Figure 17 is a particle visualisation, a physical model, utilising terms defined by ISO TC 229. One recommendation is to assign a physico-chemical property to the localised region and composition likely to govern that phenomenon, e.g., zeta potential with surface layer and shape with particle substrate. The particle description highlights possible sources for a changing nanolayer composition across the life cycle (Table 10).
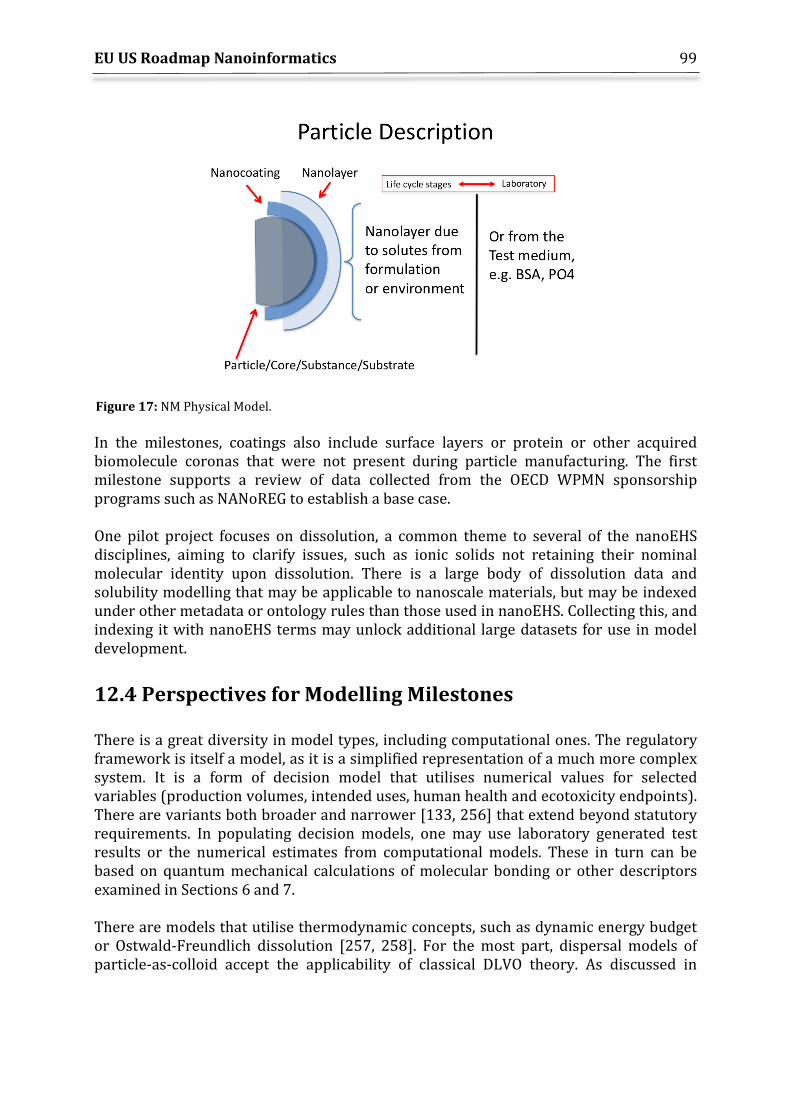
EU US Roadmap Nanoinformatics
99
Figure 17: NM Physical Model. In the milestones, coatings also include surface layers or protein or other acquired biomolecule coronas that were not present during particle manufacturing. The first milestone supports a review of data collected from the OECD WPMN sponsorship programs such as NANoREG to establish a base case. One pilot project focuses on dissolution, a common theme to several of the nanoEHS disciplines, aiming to clarify issues, such as ionic solids not retaining their nominal molecular identity upon dissolution. There is a large body of dissolution data and solubility modelling that may be applicable to nanoscale materials, but may be indexed under other metadata or ontology rules than those used in nanoEHS. Collecting this, and indexing it with nanoEHS terms may unlock additional large datasets for use in model development.
12.4 Perspectives for Modelling Milestones There is a great diversity in model types, including computational ones. The regulatory framework is itself a model, as it is a simplified representation of a much more complex system. It is a form of decision model that utilises numerical values for selected variables (production volumes, intended uses, human health and ecotoxicity endpoints). There are variants both broader and narrower [133, 256] that extend beyond statutory requirements. In populating decision models, one may use laboratory generated test results or the numerical estimates from computational models. These in turn can be based on quantum mechanical calculations of molecular bonding or other descriptors examined in Sections 6 and 7. There are models that utilise thermodynamic concepts, such as dynamic energy budget or Ostwald-Freundlich dissolution [257, 258]. For the most part, dispersal models of particle-as-colloid accept the applicability of classical DLVO theory. As discussed in
EU US Roadmap Nanoinformatics
100
Section 12.3, size-dependent properties imply that the NM is not at equilibrium, but rather in a steady state or a kinetically hindered state. This raises significant concerns when a computational estimate of dissolution is incorporated into a decision model or physiologically-based pharmacokinetic (PB/PK) ADME (absorption, distribution, metabolism, and excretion) model without considering kinetically hindered dissolution mechanisms [133, 249, 258]. There is also uncertainty regarding the meaning of ‘structure’ when proposing a computational model for QSPR. Is it the structure of a molecule (bond lengths, angles, functional groups) or is it the particle’s external shape influencing those molecular concepts or is it the particle’s internal arrangement of surface, coating, and surface layer? The same questions about the meaning of ‘structure’ arise with QSARs. All models, frameworks and theories are prone to variants of Type III errors, where the question posed extends beyond the model’s domain, yet the model returns a result. Basing computational models solely on in vitro assay data to predict in vivo outcomes raises the prospect of such errors, as does using QSPR or other models to predict properties outside of the domain of the ‘training’ dataset. Models, like experiments, can be surprisingly robust and can fail as well [259]. Model validation, which is the subject of an OECD guidance document regarding QSAR models [136], raises two related issues. Firstly, the QSAR model must have a “defined domain of applicability” and secondly, should have a “mechanistic interpretation (if possible)” that ties the NM descriptors to the biological endpoint being predicted. There is also a guidance document on computerised systems, including databases, data approval and periodic review that may be applicable to the data sets used to validate a model [260]. It is not yet known how these guidance documents will be applied to computational models or the underlying datasets. This is one reason for favouring a modularised approach, where each module can be tested against data specific to a target endpoint, thereby enhancing its acceptability in data-filling. Descriptors might be tested using broad datasets extending beyond nanoscale materials, but once accepted then be re-calibrated to a narrower nanoscale material dataset for a regulatory submission.
12.5 Commentary on related EU activities The European Nano Safety Cluster has published two related documents: the 2016 “Closer to the Market Roadmap” (CTTM) and the 2017 “Regulatory Research Roadmap” (RRR) [261, 262]. Additionally, the Joint Research Centre has published a final report for the NanoComput project [263]. Some commentary is appropriate as there are significant overlaps, but with different focal points. The CTTM emphasis is on assuring workers and consumers that there are procedures, policies and programs in place to reduce uncertainties surrounding nano-enabled products. Integral to the CTTM program is providing “solid operational knowledge (high
EU US Roadmap Nanoinformatics
101
level of scientific expertise and robust accumulated datasets)” (Recommendations in [261]). A significant overlap occurs in the discussions of two bottlenecks ([260], page 30) that identifies the responsible parties for resolving hurdles (basic scientific knowledge, research to support regulation and nanotechnology market/CTTM). For “uncertainties in risk assessment and in regulation,” the recommendation for regulatory research in the CTTM is to improve and stabilise regulation and to communicate uncertainties. Regarding the “lack of validated methods (toxicological and analytical) for nanosafety assessment,” the CTTM recommends developing scientific knowledge via equipment, harmonisation, round robin testing, validation studies and general guidelines on how to standardise nano-specific protocols. The RRR [262] has a fully integrated risk analysis framework as its objective, while the Nanoinformatics Roadmap leverages databases and metadata considerations to expand the use of computational models. In both cases, validation is critical to successful use by regulators. Both the RRR and Nanoinformatics Roadmap attempt to bring awareness of regulatory requirements forward in time. For the RRR, this is expressed as: “It should also be noted that while the hexagon diagrams indicate prioritisation, issues situated on the right-hand side (long term and distant future priorities) of each prioritisation diagram need to be considered at an early stage to ensure that any short-term activity generates outputs that will be useful for developing longer-term priorities.” The RRR connects high quality data to validated methods, while the Nanoinformatics Roadmap ties quality to the metadata found in either ISA-TAB-nano or ISA-TAB-JSON formats and in the ontology (NPO or eNanoMapper). The EC’s Joint Research Centre has issued a report [263] reviewing current computational models that may be useful to regulatory authorities. It is very comprehensive and shares many concepts with this Roadmap, but with a different emphasis. The JRC’s advisory role in the European Commission leads it to specific recommendations regarding public dissemination, filling knowledge gaps with concrete regulatory applications in mind and developing a one stop hub for databases and models. The Roadmap offers milestones directed at a wider stakeholder group whose activities may contribute useful data for modelling, but leaving applicability to regulatory frameworks as a second validation step. In the Table listing milestones, the scientific fields most involved in achieving a specific goal along the roadmap are indicated, aligning roughly with the CTTM approach. Additionally, the same colour code used with the RRR’s hexagons has been added to the Milestone Table to identify those activities that are predominantly data generation, method development and regulatory framework milestones. Relative to the JRC report, the milestones place greater emphasis on read-across exercises as a means to gain feedback on model and dataset acceptability.
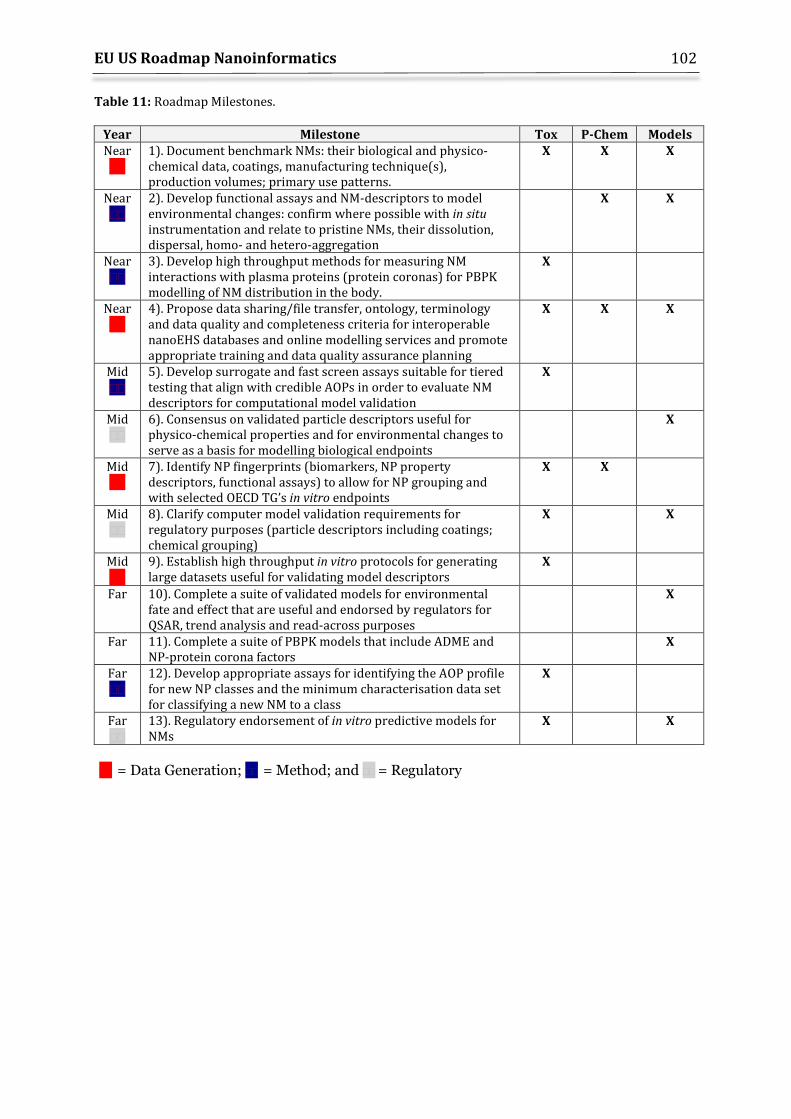
EU US Roadmap Nanoinformatics
102
Table 11: Roadmap Milestones.
Year Milestone Tox P-Chem Models Near ��
1). Document benchmark NMs: their biological and physico-chemical data, coatings, manufacturing technique(s), production volumes; primary use patterns.
X X X
Near ��
2). Develop functional assays and NM-descriptors to model environmental changes: confirm where possible with in situ instrumentation and relate to pristine NMs, their dissolution, dispersal, homo- and hetero-aggregation
X X
Near ��
3). Develop high throughput methods for measuring NM interactions with plasma proteins (protein coronas) for PBPK modelling of NM distribution in the body.
X
Near ��
4). Propose data sharing/file transfer, ontology, terminology and data quality and completeness criteria for interoperable nanoEHS databases and online modelling services and promote appropriate training and data quality assurance planning
X X X
Mid ��
5). Develop surrogate and fast screen assays suitable for tiered testing that align with credible AOPs in order to evaluate NM descriptors for computational model validation
X
Mid ��
6). Consensus on validated particle descriptors useful for physico-chemical properties and for environmental changes to serve as a basis for modelling biological endpoints
X
Mid ��
7). Identify NP fingerprints (biomarkers, NP property descriptors, functional assays) to allow for NP grouping and with selected OECD TG’s in vitro endpoints
X X
Mid ��
8). Clarify computer model validation requirements for regulatory purposes (particle descriptors including coatings; chemical grouping)
X X
Mid ��
9). Establish high throughput in vitro protocols for generating large datasets useful for validating model descriptors
X
Far 10). Complete a suite of validated models for environmental fate and effect that are useful and endorsed by regulators for QSAR, trend analysis and read-across purposes
X
Far 11). Complete a suite of PBPK models that include ADME and NP-protein corona factors
X
Far ��
12). Develop appropriate assays for identifying the AOP profile for new NP classes and the minimum characterisation data set for classifying a new NM to a class
X
Far ��
13). Regulatory endorsement of in vitro predictive models for NMs
X X
�� = Data Generation; �� = Method; and �� = Regulatory
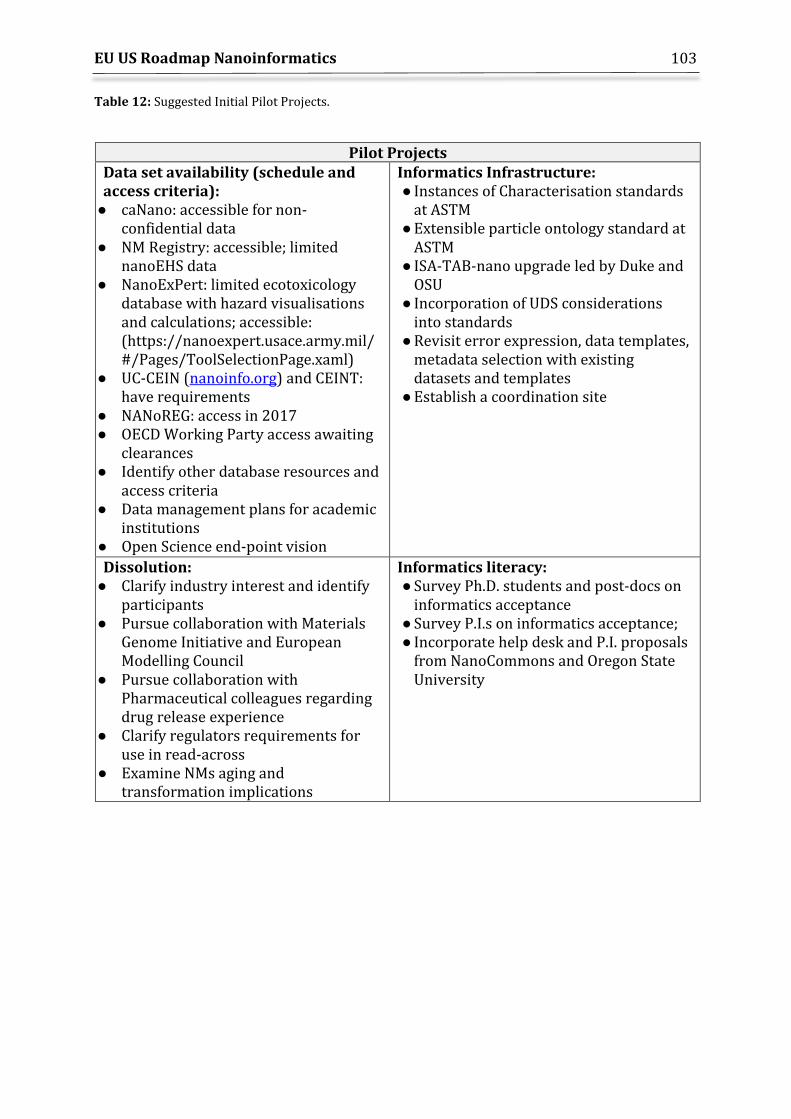
EU US Roadmap Nanoinformatics
103
Table 12: Suggested Initial Pilot Projects.
Pilot Projects Data set availability (schedule and access criteria): ● caNano: accessible for non-
confidential data ● NM Registry: accessible; limited
nanoEHS data ● NanoExPert: limited ecotoxicology
database with hazard visualisations and calculations; accessible: (https://nanoexpert.usace.army.mil/#/Pages/ToolSelectionPage.xaml)
● UC-CEIN (nanoinfo.org) and CEINT: have requirements
● NANoREG: access in 2017 ● OECD Working Party access awaiting
clearances ● Identify other database resources and
access criteria ● Data management plans for academic
institutions ● Open Science end-point vision
Informatics Infrastructure: ● Instances of Characterisation standards
at ASTM ● Extensible particle ontology standard at
ASTM ● ISA-TAB-nano upgrade led by Duke and
OSU ● Incorporation of UDS considerations
into standards ● Revisit error expression, data templates,
metadata selection with existing datasets and templates
● Establish a coordination site
Dissolution: ● Clarify industry interest and identify
participants ● Pursue collaboration with Materials
Genome Initiative and European Modelling Council
● Pursue collaboration with Pharmaceutical colleagues regarding drug release experience
● Clarify regulators requirements for use in read-across
● Examine NMs aging and transformation implications
Informatics literacy: ● Survey Ph.D. students and post-docs on
informatics acceptance ● Survey P.I.s on informatics acceptance; ● Incorporate help desk and P.I. proposals
from NanoCommons and Oregon State University
EU US Roadmap Nanoinformatics
104
13. References 1. McWilliams, A., The Maturing Nanotechnology Market: Products and Applications.
NAN031G, Global Markets, BBC Research Report, 2016. 2. Harper, T., Global Nanotechnology Funding 2011, in Cientifica White Papers. 2011. 3. Guiding Principles for Findable, Accessible, Interoperable and Re-usable Data
Publishing version b1.0, in FORCE11 [Internet]. 2014. 4. de la Iglesia, D., et al., Nanoinformatics 2020 roadmap. 2011. 5. Maojo, V., Nanoinformatics in Europe: The ACTION-Grid White Paper. 2010. 6. Winkler, D.A., et al., Applying quantitative structure–activity relationship
approaches to nanotoxicology: Current status and future potential. Toxicology, 2013. 313(1): p. 15-23.
7. Winkler, D.A., Recent advances, and unresolved issues, in the application of computational modelling to the prediction of the biological effects of nanomaterials. Toxicology and Applied Pharmacology, 2016. 299(Supplement C): p. 96-100.
8. Grassian, V.H., et al., NanoEHS - defining fundamental science needs: no easy feat when the simple itself is complex. Environmental Science: Nano, 2016. 3(1): p. 15-27.
9. Bañares, M.A., et al., CompNanoTox2015: novel perspectives from a European conference on computational nanotoxicology on predictive nanotoxicology. Nanotoxicology, 2017. 11(7): p. 839-845.
10. Hendren, C.O., et al., The Nanomaterial Data Curation Initiative: A collaborative approach to assessing, evaluating, and advancing the state of the field. Beilstein Journal of Nanotechnology, 2015. 6: p. 1752-1762.
11. Powers, C.M., et al., Nanocuration workflows: Establishing best practices for identifying, inputting, and sharing data to inform decisions on nanomaterials. Beilstein Journal of Nanotechnology, 2015. 6: p. 1860-1871.
12. Powers, C.M., et al., Supporting Information Nanocuration workflows: Establishing best practices for identifying, inputting, and sharing data to inform decisions on nanomaterials. 2015.
13. Marchese Robinson, R.L., et al., How should the completeness and quality of curated nanomaterial data be evaluated? Nanoscale, 2016. 8(19): p. 9919-9943.
14. Oh, E., et al., Meta-analysis of cellular toxicity for cadmium-containing quantum dots. Nature Nanotechnology, 2016. 11: p. 479.
15. Sansone, S.-A., et al., Toward interoperable bioscience data. Nature genetics, 2012. 44(2): p. 121-126.
16. Thomas, D.G., et al., ISA-TAB-Nano: A Specification for Sharing Nanomaterial Research Data in Spreadsheet-based Format. BMC Biotechnology, 2013. 13(1): p. 2.
17. Doganis, P., et al., Deliverable Report D3.1 Technical Specification and initial implementation of the protocol and data management web services. Zenodo, 2015.
18. Wegner, J.K., et al., Cheminformatics. Commun. ACM, 2012. 55(11): p. 65-75. 19. EUON. Nanomaterials are chemical substances. 2017 [cited 2017 11 November
2017]; Available from: https://euon.echa.europa.eu/nanomaterials-are-chemical-substances.
EU US Roadmap Nanoinformatics
105
20. Roebben, G., et al., Reference materials and representative test materials: the nanotechnology case. Journal of Nanoparticle Research, 2013. 15(3): p. 1455.
21. Masum, H., et al., Ten Simple Rules for Cultivating Open Science and Collaborative R&D. PLOS Computational Biology, 2013. 9(9): p. e1003244.
22. Vicens, Q. and P.E. Bourne, Ten Simple Rules for a Successful Collaboration. PLOS Computational Biology, 2007. 3(3): p. e44.
23. Michener, W.K., Ten Simple Rules for Creating a Good Data Management Plan. PLOS Computational Biology, 2015. 11(10): p. e1004525.
24. Goodman, A., et al., Ten Simple Rules for the Care and Feeding of Scientific Data. PLOS Computational Biology, 2014. 10(4): p. e1003542.
25. Rumble, J.R., Accessing Materials Data: Challenges and Directions in the Digital Era. Integrating Materials and Manufacturing Innovation, 2017. 6(2): p. 172-186.
26. Karcher, S., et al., Integration among databases and data sets to support productive nanotechnology: Challenges and recommendations. NanoImpact, 2018. 9: p. 85-101.
27. Cragin, M., et al. An educational program on data curation. Poster. in Science and Technology Section of the annual American Library Association conference. Washington, DC. 2007.
28. Bai, X., et al., Toward a systematic exploration of nano-bio interactions. Toxicology and Applied Pharmacology, 2017. 323(Supplement C): p. 66-73.
29. Totaro, S., H. Crutzen, and J. Riego Sintes, Data logging templates for the environmental, health and safety assessment of nanomaterials. EUR 28137 EN; doi:10.2787/505397; January 2017.
30. ISATools. ISA Model and Serialization Specifications. ISA Tools API 2016 [cited 2017 16th November]; Available from: http://isa-specs.readthedocs.io/en/latest/.
31. Jeliazkova, N., et al., Deliverable Report D3.4 ISA-Tab templates for common bioselected set of assays. Zenodo, 2016.
32. Berners-Lee, T., J. Hendler, and O. Lassila, The semantic web. Scientific american, 2001. 284(5): p. 28-37.
33. Consortium, W.W.W., JSON-LD 1.0: a JSON-based serialization for linked data. 2014.
34. Gandon, F. and G. Schreiber, RDF 1.1 XML Syntax: W3C Recommendation 25 February 2014. World Wide Web Consortium. http://www. w3. org/TR/rdf-syntax-grammar, 2014.
35. Beckett, D., et al., RDF 1.1 Turtle-Terse RDF Triple Language. W3C Recommendation 25 February 2014. 2016.
36. Hitzler, P., et al., OWL 2 web ontology language primer. W3C recommendation, 11 December 2012. 2012.
37. Willighagen, E., et al., Deliverable Report D3.3 Modules and services for linking and integration with third party databases. Zenodo, 2016.
38. Willighagen, E.L., et al. Answering Scientific Questions with linked European Nanosafety Data [version 1; not peer reviewed]. in SWAT4LS. 2016.
39. ISATools. ISA tools API. 2017 [cited 2017 11 November]; Available from: https://isatools.readthedocs.io/en/latest/.
40. Cohen, Y., et al. NanoDatabank. nanoinfo 2014 [cited 2017 16th November]; Available from: http://nanoinfo.org/#!/nanodatabank/.
EU US Roadmap Nanoinformatics
106
41. Jeliazkova, N., Web tools for predictive toxicology model building. Expert Opinion on Drug Metabolism & Toxicology, 2012. 8(7): p. 791-801.
42. Tetko, I.V., U. Maran, and A. Tropsha, Public (Q)SAR Services, Integrated Modeling Environments, and Model Repositories on the Web: State of the Art and Perspectives for Future Development. Molecular Informatics, 2017. 36(3): p. 1600082-n/a.
43. eNanoMapper. eNanoMapper prototype database API. 2017 [cited 2017 16th November]; Available from: http://enanomapper.github.io/API/.
44. Chomenidis, C., et al., Jaqpot Quattro: A Novel Computational Web Platform for Modeling and Analysis in Nanoinformatics. Journal of Chemical Information and Modeling, 2017. 57(9): p. 2161-2172.
45. Cohen, Y., et al. Nanoinformatics platform for assessing the environmental impact of nanomaterials. 2014 [cited 2017 16th November]; Available from: http://www.Nanoinfo.org.
46. Lowry, G.V., et al., Transformations of Nanomaterials in the Environment. Environmental Science & Technology, 2012. 46(13): p. 6893-6899.
47. Mitrano, D.M., et al., Review of nanomaterial aging and transformations through the life cycle of nano-enhanced products. Environment International, 2015. 77(Supplement C): p. 132-147.
48. Tsiliki, G., et al., Enriching Nanomaterials Omics Data: An Integration Technique to Generate Biological Descriptors. Small Methods, 2017. 1(11): p. 1700139-n/a.
49. Jeliazkova, N., et al., The eNanoMapper database for nanomaterial safety information. Beilstein Journal of Nanotechnology, 2015. 6: p. 1609-1634.
50. Thomas, D.G., R.V. Pappu, and N.A. Baker, NanoParticle Ontology for cancer nanotechnology research. Journal of Biomedical Informatics, 2011. 44(1): p. 59-74.
51. Hastings, J., et al., eNanoMapper: harnessing ontologies to enable data integration for nanomaterial risk assessment. Journal of Biomedical Semantics, 2015. 6(1): p. 10.
52. Baclawski, K., et al., Consistency Checking of Semantic Web Ontologies, in The Semantic Web — ISWC 2002: First International Semantic Web Conference Sardinia, Italy, June 9–12, 2002 Proceedings, I. Horrocks and J. Hendler, Editors. 2002, Springer Berlin Heidelberg: Berlin, Heidelberg. p. 454-459.
53. Chang, J., et al., eNanoMapper/ontologies: Final release of eNanoMapper ontology (Version v4.0). Zenodo, 2016.
54. eNanoMapper Ontology IRIs for the OECD nanomaterials. eNanoMapper Working Draft 18 October 2017 2017 [cited 2017 11 November]; Available from: http://specs.enanomapper.net/oecd/.
55. Chang, J. eNanoMapper Ontology IRIs for the JRC representative industrial nanomaterials. eNanoMapper Working Draft 03 September 2017 2017 [cited 2017 11 November]; Available from: http://specs.enanomapper.net/jrc/.
56. Rieswijk, L., et al., Deliverable Report D2.4 Descriptor Calculation Algorithms and Methods. Zenodo, 2017.
57. Hastings, J., et al., The Chemical Information Ontology: Provenance and Disambiguation for Chemical Data on the Biological Semantic Web. PLOS ONE, 2011. 6(10): p. e25513.
EU US Roadmap Nanoinformatics
107
58. Schürer, S.C., et al., BioAssay Ontology Annotations Facilitate Cross-Analysis of Diverse High-Throughput Screening Data Sets. Journal of Biomolecular Screening, 2011. 16(4): p. 415-426.
59. Visser, U., et al., BioAssay Ontology (BAO): a semantic description of bioassays and high-throughput screening results. BMC Bioinformatics, 2011. 12(1): p. 257.
60. De Baas, A.e., What makes a material function? Let me compute the ways... in Modeling in FP7 NMP Programme, European Commission. 6th edition. 2017. https://publications.europa.eu/en/publication-detail/-/publication/ec1455c3-d7ca-11e6-ad7c-01aa75ed71a1.
61. The CEN Workshop Agreement. CEN/WS MODA - Materials modelling - terminology, classification and metadata (CWA 17284). 2018. ftp://ftp.cencenelec.eu/CEN/Sectors/TCandWorkshops/Workshops/WS%20MODA/CWA_17284.pdf.
62. Ghedini, E., et al., EMMO the European Materials Modelling Ontology. 2017. https://emmc.info/wp-content/uploads/2017/12/EMMC_IntOp2017-Cambridge_Ghedini_Bologna.pdf.
63. Ghedini, E., et al. emmo-european-materials-modelling-ontology. 2018 [cited 2018 12 November]; Available from: https://emmc.info/taxonda/emmo-european-materials-modelling-ontology/.
64. Leonelli, S. and R.A. Ankeny, Re-thinking organisms: The impact of databases on model organism biology. Studies in History and Philosophy of Science Part C: Studies in History and Philosophy of Biological and Biomedical Sciences, 2012. 43(1): p. 29-36.
65. Directorate-General for Research and Innovation (European Commission), Realising the European open science cloud: First report and recommendations of the Commission high level expert group on the European open science cloud. 2016, European Commission: Online.
66. Barnard, J. and X.-L. Meng, Applications of multiple imputation in medical studies: from AIDS to NHANES. Statistical Methods in Medical Research, 1999. 8(1): p. 17-36.
67. Mills, K.C., et al., Nanomaterial registry: database that captures the minimal information about nanomaterial physico-chemical characteristics. Journal of Nanoparticle Research, 2014. 16(2): p. 2219.
68. Todeschini, R. and V. Consonni, Handbook of molecular descriptors. Vol. 11. 2008: John Wiley & Sons.
69. Wang, X.Z., et al., Principal component and causal analysis of structural and acute in vitro toxicity data for nanoparticles. Nanotoxicology, 2014. 8(5): p. 465-476.
70. Liu, R., R. Rallo, and Y. Cohen, Unsupervised Feature Selection Using Incremental Least Squares. International Journal of Information Technology & Decision Making, 2011. 10(06): p. 967-987.
71. Steinbeck, C., et al., Recent Developments of the Chemistry Development Kit (CDK) - An Open-Source Java Library for Chemo- and Bioinformatics. Current Pharmaceutical Design, 2006. 12(17): p. 2111-2120.
72. Lynch, I., C. Weiss, and E. Valsami-Jones, A strategy for grouping of nanomaterials based on key physico-chemical descriptors as a basis for safer-by-design NMs. Nano Today, 2014. 9(3): p. 266-270.
EU US Roadmap Nanoinformatics
108
73. Ying, J., T. Zhang, and M. Tang, Metal Oxide Nanomaterial QNAR Models: Available Structural Descriptors and Understanding of Toxicity Mechanisms. Nanomaterials, 2015. 5(4): p. 1620.
74. Bigdeli, A., et al., Towards defining new nano-descriptors: extracting morphological features from transmission electron microscopy images. RSC Advances, 2014. 4(104): p. 60135-60143.
75. Gajewicz, A., et al., Towards understanding mechanisms governing cytotoxicity of metal oxides nanoparticles: Hints from nano-QSAR studies. Nanotoxicology, 2015. 9(3): p. 313-325.
76. O'Rourke, N., L. Hatcher, and E.J. Stepanski, A step-by-step approach to using SAS for univariate & multivariate statistics. 2005: SAS Institute.
77. White, K.J., The Durbin-Watson Test for Autocorrelation in Nonlinear Models. The Review of Economics and Statistics, 1992. 74(2): p. 370-373.
78. Draper, N.R. and H. Smith, Applied regression analysis. 2014: John Wiley & Sons. 79. Durbin, J. and G.S. Watson, Testing for serial correlation in least squares
regression.III. Biometrika, 1971. 58(1): p. 1-19. 80. Mark, H. and J. Workman, Chemometrics in spectroscopy. 2010: Academic Press. 81. Razali, N.M. and Y.B. Wah, Power comparisons of shapiro-wilk, kolmogorov-
smirnov, lilliefors and anderson-darling tests. Journal of statistical modeling and analytics, 2011. 2(1): p. 21-33.
82. Peat, J. and B. Barton, Medical statistics: A guide to data analysis and critical appraisal. 2008: John Wiley & Sons.
83. Thode, H.C., Testing for normality. Vol. 164. 2002: CRC press. 84. Shapiro, S.S. and M.B. Wilk, An Analysis of Variance Test for Normality (Complete
Samples). Biometrika, 1965. 52(3/4): p. 591-611. 85. Gibbons, J.D. and S. Chakraborti, Nonparametric Statistical Inference, in
International Encyclopedia of Statistical Science, M. Lovric, Editor. 2011, Springer Berlin Heidelberg: Berlin, Heidelberg. p. 977-979.
86. Bishop, C.M., Pattern recognition and machine learning. Vol. 1. 2006: Springer Private Limited.
87. Bro, R. and A.K. Smilde, Principal component analysis. Analytical Methods, 2014. 6(9): p. 2812-2831.
88. Hillenbrand, U., Consistent parameter clustering: Definition and analysis. Pattern Recognition Letters, 2007. 28(9): p. 1112-1122.
89. Odziomek, K., A. Rybinska, and T. Puzyn, Unsupervised Learning Methods and Similarity Analysis in Chemoinformatics, in Handbook of Computational Chemistry, J. Leszczynski, Editor. 2016, Springer Netherlands: Dordrecht. p. 1-38.
90. Smyth, P., Model selection for probabilistic clustering using cross-validated likelihood. Statistics and computing, 2000. 10(1): p. 63-72.
91. Fourches, D., et al., Quantitative Nanostructure-Activity Relationship (QNAR) Modeling. 2010.
92. Epa, V.C., et al., Modeling Biological Activities of Nanoparticles. Nano Letters, 2012. 12(11): p. 5808-5812.
93. Fourches, D., et al., Computer-aided design of carbon nanotubes with the desired bioactivity and safety profiles. Nanotoxicology, 2016. 10(3): p. 374-383.
EU US Roadmap Nanoinformatics
109
94. Agnieszka, G., et al., Novel approach for efficient predictions properties of large pool of nanomaterials based on limited set of species: nano-read-across. Nanotechnology, 2015. 26(1): p. 015701.
95. Chon, T.-S., Self-Organizing Maps applied to ecological sciences. Ecological Informatics, 2011. 6(1): p. 50-61.
96. Tamayo, P., et al., Interpreting patterns of gene expression with self-organizing maps: Methods and application to hematopoietic differentiation. Proceedings of the National Academy of Sciences, 1999. 96(6): p. 2907-2912.
97. Törönen, P., et al., Analysis of gene expression data using self-organizing maps. FEBS Letters, 1999. 451(2): p. 142-146.
98. Melssen, W., R. Wehrens, and L. Buydens, Supervised Kohonen networks for classification problems. Chemometrics and Intelligent Laboratory Systems, 2006. 83(2): p. 99-113.
99. Rallo, R., et al., Self-Organizing Map Analysis of Toxicity-Related Cell Signaling Pathways for Metal and Metal Oxide Nanoparticles. Environmental Science & Technology, 2011. 45(4): p. 1695-1702.
100. Willighagen, E.L., et al., Supervised Self-Organizing Maps in Crystal Property and Structure Prediction. Crystal Growth & Design, 2007. 7(9): p. 1738-1745.
101. Hansch, C. and A. Leo, Substituent constants for correlation analysis in chemistry and biology. 1979: Wiley.
102. Puzyn, T., J. Leszczynski, and M.T. Cronin, Recent advances in QSAR studies: methods and applications. Vol. 8. 2010: Springer Science & Business Media.
103. Fujita, T. and D.A. Winkler, Understanding the Roles of the “Two QSARs”. Journal of Chemical Information and Modeling, 2016. 56(2): p. 269-274.
104. Das, R.N. and K. Roy, Development of classification and regression models for Vibrio fischeri toxicity of ionic liquids: green solvents for the future. Toxicology Research, 2012. 1(3): p. 186-195.
105. Cassani, S., et al., Daphnia and fish toxicity of (benzo)triazoles: Validated QSAR models, and interspecies quantitative activity–activity modelling. Journal of Hazardous Materials, 2013. 258-259: p. 50-60.
106. Tetko, I.V., et al., Critical Assessment of QSAR Models of Environmental Toxicity against Tetrahymena pyriformis: Focusing on Applicability Domain and Overfitting by Variable Selection. Journal of Chemical Information and Modeling, 2008. 48(9): p. 1733-1746.
107. Puzyn, T., et al., Quantitative structure—activity relationships for the prediction of relative in vitro potencies (REPs) for chloronaphthalenes. Journal of Environmental Science and Health, Part A, 2007. 42(5): p. 573-590.
108. Russell, W.M.S., R.L. Burch, and C.W. Hume, The principles of humane experimental technique. 1959.
109. Regulation, E., No 1907/2006 of the European Parliament and of the Council of 18 December 2006 concerning the Registration. Evaluation, Authorisation and Restriction of Chemicals (REACH), establishing a European Chemicals Agency, amending Directive, 1999. 45: p. 1-849.
110. Puzyn, T., D. Leszczynska, and J. Leszczynski, Toward the Development of “Nano-QSARs”: Advances and Challenges. Small, 2009. 5(22): p. 2494-2509.
111. Puzyn, T., et al., Using nano-QSAR to predict the cytotoxicity of metal oxide nanoparticles. Nature Nanotechnology, 2011. 6: p. 175.
EU US Roadmap Nanoinformatics
110
112. Nel, A., et al., Nanomaterial Toxicity Testing in the 21st Century: Use of a Predictive Toxicological Approach and High-Throughput Screening. Accounts of Chemical Research, 2013. 46(3): p. 607-621.
113. Liu, R., et al., Nano-SAR development for bioactivity of nanoparticles with considerations of decision boundaries. Small, 2013. 9(9-10): p. 1842-1852.
114. Liu, R., et al., Quantitative Structure-Activity Relationships for Cellular Uptake of Surface-Modified Nanoparticles. Combinatorial Chemistry & High Throughput Screening, 2015. 18(4): p. 365-375.
115. Liu, R., et al., Development of structure-activity relationship for metal oxide nanoparticles. Nanoscale, 2013. 5(12): p. 5644-5653.
116. Walkey, C.D., et al., Protein Corona Fingerprinting Predicts the Cellular Interaction of Gold and Silver Nanoparticles. ACS Nano, 2014. 8(3): p. 2439-2455.
117. Liu, R., et al., Prediction of nanoparticles-cell association based on corona proteins and physicochemical properties. Nanoscale, 2015. 7(21): p. 9664-9675.
118. Toropov, A.A., et al., Novel application of the CORAL software to model cytotoxicity of metal oxide nanoparticles to bacteria Escherichia coli. Chemosphere, 2012. 89(9): p. 1098-1102.
119. Toropov, A.A., et al., QSAR as a random event: Modeling of nanoparticles uptake in PaCa2 cancer cells. Chemosphere, 2013. 92(1): p. 31-37.
120. Kar, S., et al., Periodic table-based descriptors to encode cytotoxicity profile of metal oxide nanoparticles: A mechanistic QSTR approach. Ecotoxicology and Environmental Safety, 2014. 107(Supplement C): p. 162-169.
121. Lubinski, L., et al., Evaluation criteria for the quality of published experimental data on nanomaterials and their usefulness for QSAR modelling. SAR and QSAR in Environmental Research, 2013. 24(12): p. 995-1008.
122. Toropova, A.P., et al., Optimal descriptor as a translator of eclectic information into the prediction of thermal conductivity of micro-electro-mechanical systems. Journal of Mathematical Chemistry, 2013. 51(8): p. 2230-2237.
123. Kar, S., et al., Nano-quantitative structure–activity relationship modeling using easily computable and interpretable descriptors for uptake of magnetofluorescent engineered nanoparticles in pancreatic cancer cells. Toxicology in Vitro, 2014. 28(4): p. 600-606.
124. Odziomek, K., et al., Toward quantitative structure activity relationship (QSAR) models for nanoparticles. 2015, Ernest Orlando Lawrence Berkeley National Laboratory, Berkeley, CA (US).
125. Sizochenko, N., et al., From basic physics to mechanisms of toxicity: the "liquid drop" approach applied to develop predictive classification models for toxicity of metal oxide nanoparticles. Nanoscale, 2014. 6(22): p. 13986-13993.
126. Toropova, A.P., et al., Optimal nano-descriptors as translators of eclectic data into prediction of the cell membrane damage by means of nano metal-oxides. Environmental Science and Pollution Research, 2015. 22(1): p. 745-757.
127. Ambure, P., et al., “NanoBRIDGES” software: Open access tools to perform QSAR and nano-QSAR modeling. Chemometrics and Intelligent Laboratory Systems, 2015. 147(Supplement C): p. 1-13.
128. Mikolajczyk, A., et al., Zeta Potential for Metal Oxide Nanoparticles: A Predictive Model Developed by a Nano-Quantitative Structure–Property Relationship Approach. Chemistry of Materials, 2015. 27(7): p. 2400-2407.
EU US Roadmap Nanoinformatics
111
129. Mikolajczyk, A., et al., Ab Initio Studies of Anatase TiO2 (101) Surface-supported Au8 Clusters. Current Topics in Medicinal Chemistry, 2015. 15(18): p. 1859-1867.
130. Celina, S. and P. Tomasz, The performance of selected semi-empirical and DFT methods in studying C 60 fullerene derivatives. Nanotechnology, 2015. 26(45): p. 455702.
131. Sizochenko, N., et al., Causal inference methods to assist in mechanistic interpretation of classification nano-SAR models. RSC Advances, 2015. 5(95): p. 77739-77745.
132. Tantra, R., et al., Nano(Q)SAR: Challenges, pitfalls and perspectives. Nanotoxicology, 2015. 9(5): p. 636-642.
133. Arts, J.H.E., et al., A decision-making framework for the grouping and testing of nanomaterials (DF4nanoGrouping). Regulatory Toxicology and Pharmacology, 2015. 71(2, Supplement): p. S1-S27.
134. Sellers, K., et al., Grouping nanomaterials: A strategy towards grouping and read-across. 2015: Rijksinstituut voor Volksgezondheid en Milieu RIVM.
135. Oomen, A., et al., Grouping and Read-Across Approaches for Risk Assessment of Nanomaterials. International Journal of Environmental Research and Public Health, 2015. 12(10): p. 13415.
136. OECD, Guidance Document on the Validation of (Quantitative) Structure-Activity Relationship [(Q)SAR] Models (ENV/JM/MONO(2007)2), in OECD, Series on Testing and Assessment No. 69. 2007, OECD Publishing, Paris, France. Link: http://www.oecd.org/officialdocuments/publicdisplaydocumentpdf/?doclanguage=en&cote=env/jm/mono(2007)2.
137. Puzyn, T., et al., Perspectives from the NanoSafety Modelling Cluster on the validation criteria for (Q)SAR models used in nanotechnology. Food and Chemical Toxicology, 2018. 112: p. 478-494.
138. Liu, R., et al., Evaluation of Toxicity Ranking for Metal Oxide Nanoparticles via an in Vitro Dosimetry Model. ACS Nano, 2015. 9(9): p. 9303-9313.
139. Singh, K.P. and S. Gupta, Nano-QSAR modeling for predicting biological activity of diverse nanomaterials. RSC Advances, 2014. 4(26): p. 13215-13230.
140. P. Toropova, A. and A. A. Toropov, Mutagenicity: QSAR - quasi-QSAR - nano-QSAR. Mini Reviews in Medicinal Chemistry, 2015. 15(8): p. 608-621.
141. Le, T.C., et al., An Experimental and Computational Approach to the Development of ZnO Nanoparticles that are Safe by Design. Small, 2016. 12(26): p. 3568-3577.
142. Richarz, A.-N., et al., Compilation of Data and Modelling of Nanoparticle Interactions and Toxicity in the NanoPUZZLES Project, in Modelling the Toxicity of Nanoparticles, L. Tran, M.A. Bañares, and R. Rallo, Editors. 2017, Springer International Publishing: Cham. p. 303-324.
143. Brown, R.G., Smoothing, forecasting and prediction of discrete time series. 2004: Courier Corporation.
144. Trigg, D.W., Monitoring a Forecasting System. Journal of the Operational Research Society, 1964. 15(3): p. 271-274.
145. Cembrowski, G.S., et al., Trend Detection in Control Data: Optimization and Interpretation of Trigg's Technique for Trend Analysis. Clinical Chemistry, 1975. 21(10): p. 1396.
146. Mu, Y., et al., Predicting toxic potencies of metal oxide nanoparticles by means of nano-QSARs. Nanotoxicology, 2016. 10(9): p. 1207-1214.
EU US Roadmap Nanoinformatics
112
147. Gajewicz, A., et al., Metal Oxide Nanoparticles: Size-Dependence of Quantum-Mechanical Properties. Nanoscience & Nanotechnology-Asia, 2011. 1(1): p. 53-58.
148. Puzyn, T. and A. Gajewicz, Numerical algorithms for supporting qualitative and quantitative read-across in Grouping and read-across for the hazard assessment of manufactured nanomaterials report from the expert meeting, OECD, Editor. 2016. https://one.oecd.org/document/ENV/JM/MONO%282016%2959/en/pdf.
149. Gajewicz, A., et al., Addressing a bottle neck for regulation of nanomaterials: quantitative read-across (Nano-QRA) algorithm for cases when only limited data is available. Environmental Science: Nano, 2017. 4(2): p. 346-358.
150. Gajewicz, A., What if the number of nanotoxicity data is too small for developing predictive Nano-QSAR models? An alternative read-across based approach for filling data gaps. Nanoscale, 2017. 9(24): p. 8435-8448.
151. ECHA, Read-Across Assessment Framework (RAAF). 2017, European Chemicals Agency: Online.
152. Palmer, J.C. and P.G. Debenedetti, Recent advances in molecular simulation: A chemical engineering perspective. AIChE Journal, 2015. 61(2): p. 370-383.
153. Brancolini, G., et al., Docking of Ubiquitin to Gold Nanoparticles. ACS Nano, 2012. 6(11): p. 9863-9878.
154. Ding, F., et al., Direct observation of a single nanoparticle-ubiquitin corona formation. Nanoscale, 2013. 5(19): p. 9162-9169.
155. Khan, S., A. Gupta, and C.K. Nandi, Controlling the Fate of Protein Corona by Tuning Surface Properties of Nanoparticles. The Journal of Physical Chemistry Letters, 2013. 4(21): p. 3747-3752.
156. European Commission. Shaping the Digital Single Market. 2017. https://ec.europa.eu/digital-single-market/en/policies/shaping-digital-single-market.
157. Asinari, P., et al., Promoting the use of physics/chemistry-based materials modelling in assessing nanotoxicity for health and medicine. 2016. https://emmc.info/wp-content/uploads/2016/05/MaterialsModelling-for-Nanotoxicity_2016-05-16_v07.pdf.
158. Jones, D.E., H. Ghandehari, and J.C. Facelli, A review of the applications of data mining and machine learning for the prediction of biomedical properties of nanoparticles. Computer Methods and Programs in Biomedicine, 2016. 132(Supplement C): p. 93-103.
159. Pathakoti, K., et al., Using experimental data of Escherichia coli to develop a QSAR model for predicting the photo-induced cytotoxicity of metal oxide nanoparticles. Journal of Photochemistry and Photobiology B: Biology, 2014. 130(Supplement C): p. 234-240.
160. Glotzer, S.C. and M.J. Solomon, Anisotropy of building blocks and their assembly into complex structures. Nature Materials, 2007. 6: p. 557.
161. Toropova, A.P., A.A. Toropov, and S.K. Maksudov, QSPR modeling mineral crystal lattice energy by optimal descriptors of the graph of atomic orbitals. Chemical Physics Letters, 2006. 428(1): p. 183-186.
162. Benfenati, E., et al., coral Software: QSAR for Anticancer Agents. Chemical Biology & Drug Design, 2011. 77(6): p. 471-476.
EU US Roadmap Nanoinformatics
113
163. Toropov, A.A., et al., SMILES-based optimal descriptors: QSAR analysis of fullerene-based HIV-1 PR inhibitors by means of balance of correlations. Journal of Computational Chemistry, 2010. 31(2): p. 381-392.
164. Toropov, A.A., R. Rallo, and A.P. Toropova, Use of Quasi-SMILES and Monte Carlo Optimization to Develop Quantitative Feature Property/Activity Relationships (QFPR/QFAR) for Nanomaterials. Current Topics in Medicinal Chemistry, 2015. 15(18): p. 1837-1844.
165. Toropova, A.P., et al., Quasi-SMILES as a tool to utilize eclectic data for predicting the behavior of nanomaterials. NanoImpact, 2016. 1(Supplement C): p. 60-64.
166. Nanda, K.K., Liquid-drop model for the surface energy of nanoparticles. Physics Letters A, 2012. 376(19): p. 1647-1649.
167. Luan, F., et al., Computer-aided nanotoxicology: assessing cytotoxicity of nanoparticles under diverse experimental conditions by using a novel QSTR-perturbation approach. Nanoscale, 2014. 6(18): p. 10623-10630.
168. Jämbeck, J.P.M. and A.P. Lyubartsev, Update to the General Amber Force Field for Small Solutes with an Emphasis on Free Energies of Hydration. The Journal of Physical Chemistry B, 2014. 118(14): p. 3793-3804.
169. Behrens, S.H. and M. Borkovec, Electrostatic Interaction of Colloidal Surfaces with Variable Charge. The Journal of Physical Chemistry B, 1999. 103(15): p. 2918-2928.
170. Behrens, S.H. and M. Borkovec, Exact Poisson-Boltzmann solution for the interaction of dissimilar charge-regulating surfaces. Physical Review E, 1999. 60(6): p. 7040-7048.
171. Cohen, Y., et al., In Silico Analysis of Nanomaterials Hazard and Risk. Accounts of Chemical Research, 2013. 46(3): p. 802-812.
172. Romero-Franco, M., et al., Needs and challenges for assessing the environmental impacts of engineered nanomaterials (ENMs). Beilstein Journal of Nanotechnology, 2017. 8: p. 989-1014.
173. Haoyang Haven, L., et al., Effect of hydration repulsion on nanoparticle agglomeration evaluated via a constant number Monte–Carlo simulation. Nanotechnology, 2015. 26(4): p. 045708.
174. Harper, S.L., et al., Proactively designing nanomaterials to enhance performance and minimise hazard. International Journal of Nanotechnology, 2008. 5(1): p. 124-142.
175. Dobrovolskaia, M.A., et al., Protein corona composition does not accurately predict hematocompatibility of colloidal gold nanoparticles. Nanomedicine: Nanotechnology, Biology and Medicine, 2014. 10(7): p. 1453-1463.
176. Kamath, P., et al., Predicting Cell Association of Surface-Modified Nanoparticles Using Protein Corona Structure - Activity Relationships (PCSAR). Current Topics in Medicinal Chemistry, 2015. 15(18): p. 1930-1937.
177. Rice, P., I. Longden, and A. Bleasby, EMBOSS: the European molecular biology open software suite. 2000, Elsevier Current Trends.
178. Roy, A., A. Kucukural, and Y. Zhang, I-TASSER: a unified platform for automated protein structure and function prediction. Nature Protocols, 2010. 5: p. 725.
179. Lopez, H., et al., Multiscale Modelling of Bionano Interface, in Modelling the Toxicity of Nanoparticles, L. Tran, M.A. Bañares, and R. Rallo, Editors. 2017, Springer International Publishing: Cham. p. 173-206.
EU US Roadmap Nanoinformatics
114
180. Lopez, H. and V. Lobaskin, Coarse-grained model of adsorption of blood plasma proteins onto nanoparticles. The Journal of Chemical Physics, 2015. 143(24): p. 243138.
181. Barroso daSilva, F.L. and L.G. Dias, Development of constant-pH simulation methods in implicit solvent and applications in biomolecular systems. Biophysical Reviews, 2017. 9(5): p. 699-728.
182. Poggio, S., et al., Bionano interactions: A key to mechanistic understanding of nanoparticle toxicity (In press). 2017.
183. Xia, X.R., et al., Mapping the Surface Adsorption Forces of Nanomaterials in Biological Systems. ACS Nano, 2011. 5(11): p. 9074-9081.
184. Burello, E. and A.P. Worth, A theoretical framework for predicting the oxidative stress potential of oxide nanoparticles. Nanotoxicology, 2011. 5(2): p. 228-235.
185. Halappanavar, S., et al., Promise and peril in nanomedicine: the challenges and needs for integrated systems biology approaches to define health risk. Wiley Interdisciplinary Reviews: Nanomedicine and Nanobiotechnology, 2017: p. e1465-n/a.
186. Riebeling, C., et al., Systems Biology to Support Nanomaterial Grouping, in Modelling the Toxicity of Nanoparticles, L. Tran, M.A. Bañares, and R. Rallo, Editors. 2017, Springer International Publishing: Cham. p. 143-171.
187. Joyce, A.R. and B.Ø. Palsson, The model organism as a system: integrating 'omics' data sets. Nature Reviews Molecular Cell Biology, 2006. 7: p. 198.
188. DeBord, D.G., et al., Use of the “Exposome” in the Practice of Epidemiology: A Primer on -Omic Technologies. American Journal of Epidemiology, 2016. 184(4): p. 302-314.
189. Nymark, P., et al., Toxic and genomic influences of inhaled nanomaterials as a basis for predicting adverse outcome. Annals of the American Thoracic Society, 2017. In press.
190. Grafstrom, R.C., et al., Toward the replacement of animal experiments through the bioinformatics-driven analysis of ‘omics’ data from human cell cultures. Altern Lab Anim, 2015. 43(5): p. 325-32.
191. Kohonen, P., et al., Cancer Biology, Toxicology and Alternative Methods Development Go Hand-in-Hand. Basic & Clinical Pharmacology & Toxicology, 2014. 115(1): p. 50-58.
192. Sauer, U.G., et al., The challenge of the application of 'omics technologies in chemicals risk assessment: Background and outlook. Regulatory Toxicology and Pharmacology, 2017.
193. Halappanavar, S., et al., Transcriptional profiling identifies physicochemical properties of nanomaterials that are determinants of the in vivo pulmonary response. Environmental and Molecular Mutagenesis, 2015. 56(2): p. 245-264.
194. Feliu, N., et al., Next-Generation Sequencing Reveals Low-Dose Effects of Cationic Dendrimers in Primary Human Bronchial Epithelial Cells. ACS Nano, 2015. 9(1): p. 146-163.
195. Costa, P.M., et al., Transcriptional profiling reveals gene expression changes associated with inflammation and cell proliferation following short-term inhalation exposure to copper oxide nanoparticles. Journal of Applied Toxicology, 2017: p. n/a-n/a.
EU US Roadmap Nanoinformatics
115
196. Halappanavar, S., et al., Pulmonary response to surface-coated nanotitanium dioxide particles includes induction of acute phase response genes, inflammatory cascades, and changes in microRNAs: A toxicogenomic study. Environmental and Molecular Mutagenesis, 2011. 52(6): p. 425-439.
197. Saber, A.T., et al., Particle-induced pulmonary acute phase response may be the causal link between particle inhalation and cardiovascular disease. Wiley Interdisciplinary Reviews: Nanomedicine and Nanobiotechnology, 2014. 6(6): p. 517-531.
198. Guo, N.L., et al., Multiwalled Carbon Nanotube-Induced Gene Signatures in the Mouse Lung: Potential Predictive Value for Human Lung Cancer Risk and Prognosis. Journal of Toxicology and Environmental Health, Part A, 2012. 75(18): p. 1129-1153.
199. Nymark, P., et al., Extensive temporal transcriptome and microRNA analyses identify molecular mechanisms underlying mitochondrial dysfunction induced by multi-walled carbon nanotubes in human lung cells. Nanotoxicology, 2015. 9(5): p. 624-635.
200. Jackson, P., et al., Exposure of pregnant mice to carbon black by intratracheal instillation: Toxicogenomic effects in dams and offspring. Mutation Research/Genetic Toxicology and Environmental Mutagenesis, 2012. 745(1–2): p. 73-83.
201. Kinaret, P., et al., Network Analysis Reveals Similar Transcriptomic Responses to Intrinsic Properties of Carbon Nanomaterials in Vitro and in Vivo. ACS Nano, 2017. 11(4): p. 3786-3796.
202. Nikota, J., et al., Meta-analysis of transcriptomic responses as a means to identify pulmonary disease outcomes for engineered nanomaterials. Particle and fibre toxicology, 2016. 13(1): p. 25.
203. Williams, A. and S. Halappanavar, Application of bi-clustering of gene expression data and gene set enrichment analysis methods to identify potentially disease causing nanomaterials. Data in Brief, 2017. 15(Supplement C): p. 933-940.
204. Labib, S., et al., Nano-risk Science: application of toxicogenomics in an adverse outcome pathway framework for risk assessment of multi-walled carbon nanotubes. Particle and Fibre Toxicology, 2016. 13(1): p. 15.
205. Nymark, P., et al., A data fusion pipeline for generating and enriching Adverse Outcome Pathway descriptions. Toxicological Sciences, 2017: p. kfx252-kfx252.
206. Kohonen, P., et al., A transcriptomics data-driven gene space accurately predicts liver cytopathology and drug-induced liver injury. Nature Communications, 2017. 8: p. 15932.
207. Labib, S., et al., A framework for the use of single-chemical transcriptomics data in predicting the hazards associated with complex mixtures of polycyclic aromatic hydrocarbons. Archives of Toxicology, 2017. 91(7): p. 2599-2616.
208. ECHA. Proccedings of a Scientific Workshop. in Topical Scientific Workshop - New Approach Methodologies in Regulatory Science. 2016. Helsinki: European Chemicals Agency.
209. Shvedova, A.A., et al., Mechanisms of carbon nanotube-induced toxicity: Focus on oxidative stress. Toxicology and Applied Pharmacology, 2012. 261(2): p. 121-133.
EU US Roadmap Nanoinformatics
116
210. Tyurina, Y.Y., et al., Global Phospholipidomics Analysis Reveals Selective Pulmonary Peroxidation Profiles upon Inhalation of Single-Walled Carbon Nanotubes. ACS Nano, 2011. 5(9): p. 7342-7353.
211. Teeguarden, J.G., et al., Comparative Proteomics and Pulmonary Toxicity of Instilled Single-Walled Carbon Nanotubes, Crocidolite Asbestos, and Ultrafine Carbon Black in Mice. Toxicological Sciences, 2011. 120(1): p. 123-135.
212. Riebeling, C., et al., A redox proteomics approach to investigate the mode of action of nanomaterials. Toxicology and Applied Pharmacology, 2016. 299(Supplement C): p. 24-29.
213. Costa, P.M. and B. Fadeel, Emerging systems biology approaches in nanotoxicology: Towards a mechanism-based understanding of nanomaterial hazard and risk. Toxicology and Applied Pharmacology, 2016. 299: p. 101-111.
214. Chen, C., et al., Removing Batch Effects in Analysis of Expression Microarray Data: An Evaluation of Six Batch Adjustment Methods. PLOS ONE, 2011. 6(2): p. e17238.
215. Leek, J.T., et al., Tackling the widespread and critical impact of batch effects in high-throughput data. Nature Reviews Genetics, 2010. 11: p. 733.
216. Goh, W.W.B., W. Wang, and L. Wong, Why Batch Effects Matter in Omics Data, and How to Avoid Them. Trends in Biotechnology, 2017. 35(6): p. 498-507.
217. Hansen, K.D., et al., Sequencing technology does not eliminate biological variability. Nature biotechnology, 2011. 29(7): p. 572-573.
218. Saeys, Y., I. Inza, and P. Larrañaga, A review of feature selection techniques in bioinformatics. bioinformatics, 2007. 23(19): p. 2507-2517.
219. Ritchie, M.E., et al., limma powers differential expression analyses for RNA-sequencing and microarray studies. Nucleic acids research, 2015. 43(7): p. e47-e47.
220. Inza, I., et al., Filter versus wrapper gene selection approaches in DNA microarray domains. Artificial intelligence in medicine, 2004. 31(2): p. 91-103.
221. Kursa, M.B., Robustness of Random Forest-based gene selection methods. BMC bioinformatics, 2014. 15(1): p. 8.
222. Abeel, T., et al., Robust biomarker identification for cancer diagnosis with ensemble feature selection methods. Bioinformatics, 2009. 26(3): p. 392-398.
223. Wixon, J. and D. Kell, Website Review: The Kyoto Encyclopedia of Genes and Genomes—KEGG. http://www.genome.ad.jp/kegg. Yeast, 2000. 17(1): p. 48-55.
224. Dahlquist, K.D., et al., GenMAPP, a new tool for viewing and analyzing microarray data on biological pathways. Nature Genetics, 2002. 31: p. 19.
225. Qiagen. Ingenuity Pathway Analysis. 2018 [cited 2018 12 November]; Available from: https://www.qiagenbioinformatics.com/products/ingenuity-pathway-analysis/.
226. Pico, A.R., et al., WikiPathways: Pathway Editing for the People. PLOS Biology, 2008. 6(7): p. e184.
227. Wadi, L., et al., Impact of outdated gene annotations on pathway enrichment analysis. Nature methods, 2016. 13(9): p. 705-706.
228. Subramanian, A., et al., Gene set enrichment analysis: a knowledge-based approach for interpreting genome-wide expression profiles. Proceedings of the National Academy of Sciences, 2005. 102(43): p. 15545-15550.
EU US Roadmap Nanoinformatics
117
229. Rahmatallah, Y., F. Emmert-Streib, and G. Glazko, Gene set analysis approaches for RNA-seq data: performance evaluation and application guideline. Briefings in Bioinformatics, 2016. 17(3): p. 393-407.
230. Fisch, K.M., et al., Omics Pipe: a community-based framework for reproducible multi-omics data analysis. Bioinformatics, 2015. 31(11): p. 1724-1728.
231. Meng, C., et al., A multivariate approach to the integration of multi-omics datasets. BMC Bioinformatics, 2014. 15(1): p. 162.
232. Yang, Z. and G. Michailidis, A non-negative matrix factorization method for detecting modules in heterogeneous omics multi-modal data. Bioinformatics, 2015. 32(1): p. 1-8.
233. Costa, P.M. and B. Fadeel, Chapter 7 Emerging Systems Toxicology Approaches in Nanosafety Assessment, in Nanotoxicology: Experimental and Computational Perspectives. 2018, The Royal Society of Chemistry. p. 174-202.
234. Dymacek, J., et al., mRNA and miRNA regulatory networks reflective of multi-walled carbon nanotube-induced lung inflammatory and fibrotic pathologies in mice. Toxicological Sciences, 2014. 144(1): p. 51-64.
235. Snyder-Talkington, B.N., et al., Multiwalled carbon nanotube-induced pulmonary inflammatory and fibrotic responses and genomic changes following aspiration exposure in mice: a 1-year postexposure study. Journal of Toxicology and Environmental Health, Part A, 2016. 79(8): p. 352-366.
236. Grimm, F.A., et al., A chemical–biological similarity-based grouping of complex substances as a prototype approach for evaluating chemical alternatives. Green Chemistry, 2016. 18(16): p. 4407-4419.
237. Collins, A.R., et al., High throughput toxicity screening and intracellular detection of nanomaterials. Wiley Interdisciplinary Reviews: Nanomedicine and Nanobiotechnology, 2017. 9(1).
238. Moffat, I., et al., Comparison of toxicogenomics and traditional approaches to inform mode of action and points of departure in human health risk assessment of benzo [a] pyrene in drinking water. Critical reviews in toxicology, 2015. 45(1): p. 1-43.
239. Chepelev, N.L., et al., Integrating toxicogenomics into human health risk assessment: lessons learned from the benzo [a] pyrene case study. Critical reviews in toxicology, 2015. 45(1): p. 44-52.
240. Yang, L., B.C. Allen, and R.S. Thomas, BMDExpress: a software tool for the benchmark dose analyses of genomic data. BMC Genomics, 2007. 8(1): p. 387.
241. Dean, J.L., et al., Editor's Highlight: Application of Gene Set Enrichment Analysis for Identification of Chemically Induced, Biologically Relevant Transcriptomic Networks and Potential Utilization in Human Health Risk Assessment. Toxicological Sciences, 2017. 157(1): p. 85-99.
242. Farmahin, R., et al., Recommended approaches in the application of toxicogenomics to derive points of departure for chemical risk assessment. Archives of Toxicology, 2017. 91(5): p. 2045-2065.
243. Harper, S.L., et al., Nanoinformatics workshop report: current resources, community needs and the proposal of a collaborative framework for data sharing and information integration. Computational science & discovery, 2013. 6(1): p. 014008.
EU US Roadmap Nanoinformatics
118
244. Petersen, E.J., et al., Adapting OECD Aquatic Toxicity Tests for Use with Manufactured Nanomaterials: Key Issues and Consensus Recommendations. Environmental Science & Technology, 2015. 49(16): p. 9532-9547.
245. OECD, Guidance Document on the Validation and International Acceptance of New or Updated Test Methods for Hazard Assessment (ENV/JM/MONO(2005)14), in OECD Series on Testing and Assessment Number 34, OECD, Editor. 2005, OECD Publishing, Paris, France. Link: http://www.oecd.org/officialdocuments/publicdisplaydocumentpdf/?doclanguage=en&cote=env/jm/mono(2005)14.
246. Klimisch, H.-J., M. Andreae, and U. Tillmann, A systematic approach for evaluating the quality of experimental toxicological and ecotoxicological data. Regulatory toxicology and pharmacology, 1997. 25(1): p. 1-5.
247. OECD, Guidance on Grouping of Chemicals, Second Edition (ENV/JM/MONO(2014)4), in OECD Series on Testing and Assessment Number 194. 2014, OECD Publishing, Paris, France. Link: http://www.oecd.org/officialdocuments/publicdisplaydocumentpdf/?cote=env/jm/mono(2014)4&doclanguage=en.
248. OECD, Approaches on Nano Grouping/Equivalence/Read-Across Concepts Based on Physical-Chemical Properties (GERA-PC) for Regulatory Regimes (ENV/JM/MONO(2016)3), in OECD Series on the Safety of Manufactured Nanomaterials. 2016, OECD Publishing, Paris, France. Link: http://www.oecd.org/officialdocuments/publicdisplaydocumentpdf/?cote=env/jm/mono(2016)3&doclanguage=en.
249. FDA.gov. Physiologically Based Pharmacokinetic Analyses — Format and Content Guidance for Industry. 2016 [cited 2017 11th November]; Available from: https://www.fda.gov/downloads/Drugs/GuidanceComplianceRegulatoryInformation/Guidances/UCM531207.pdf.
250. U.S. EPA. 61 FR 56274 - GUIDELINES FOR REPRODUCTIVE TOXICITY RISK ASSESSMENT. 1996. https://www.gpo.gov/fdsys/granule/FR-1996-10-31/96-27473.
251. International Council for Harmonisation. ICH S3A Toxicokinetics: the assessment of systemic exposure in toxicity studies. 1994. http://www.ich.org/fileadmin/Public_Web_Site/ICH_Products/Guidelines/Safety/S3A/Step4/S3A_Guideline.pdf.
252. EPA, Chemical Substances When Manufactured or Processed as Nanoscale Materials; TSCA Reporting and Recordkeeping Requirements, E.P. Agency, Editor. 2017. p. 3641-3655.
253. ECHA, Appendix 4: Recommendations for nanomaterials applicable to the Guidance on Registration (Draft (Public) Version 1.0), E.C. Agency, Editor. 2017.
254. Johnston, J., et al., State-of-the-science report on predictive models and modeling approaches for characterizing and evaluating exposure to nanomaterials. US Environmental Protection Agency, Office of Research and Development, Athens, GA, 2010.
255. Hendren, C.O., et al., A functional assay-based strategy for nanomaterial risk forecasting. Science of the Total Environment, 2015. 536: p. 1029-1037.
256. Linkov, I., et al., For nanotechnology decisions, use decision analysis. Nano Today, 2013. 8(1): p. 5-10.
EU US Roadmap Nanoinformatics
119
257. Klanjscek, T., E.B. Muller, and R.M. Nisbet, Feedbacks and tipping points in organismal response to oxidative stress. Journal of Theoretical Biology, 2016. 404(Supplement C): p. 361-374.
258. Wang, L. and G.H. Nancollas, Pathways to biomineralization and biodemineralization of calcium phosphates: the thermodynamic and kinetic controls. Dalton Transactions, 2009(15): p. 2665-2672.
259. Mäki, U., Models are experiments, experiments are models. Journal of Economic Methodology, 2005. 12(2): p. 303-315.
260. OECD, Application of GLP Principles to Computerised Systems (ENV/JM/M ONO(2016)13), in OECD Series on Principles of Good Laboratory Practice and Compliance Monitoring No. 17. 2016, OECD Publishing, Paris, France. Link: http://www.oecd.org/officialdocuments/publicdisplaydocumentpdf/?cote=env/jm/mono(2016)13&doclanguage=en.
261. Falk, A., et al., Research roadmap for nanosafety-Part III: Closer to the market (CTTM). 2016.
262. Stone, V., et al., Research priorities relevant to development or updating of nano-relevant regulations and guidelines. 2017.
263. Worth, A., et al., Evaluation of the availability and applicability of computational approaches in the safety assessment of nanomaterials, in JRC Scientific and Technical Report. 2017, European Commission: Publications Office of the European Union: Luxembourg. Report and supplementary materials at: https://ec.europa.eu/jrc/en/science-update/review-computational-models-safety-assessment-nanomaterials.
EU US Roadmap Nanoinformatics
120
14. Acknowledgments Firstly, we are very grateful for continuous funding and support from the EC that enabled many of the projects, workshops and other activities as mentioned and described in this roadmap. We are also very grateful for continuous funding and support from the U.S. Other countries funding, in particular funding from Canada, China or others, should also be acknowledged. As explained earlier in the introduction section, this document builds on older documents and of course those deserve a special acknowledgment as well. In particular we would like to emphasise the special role of the NIH NanoWG, the EU NanoSafety Cluster (EU NSC) and the US EU Communities of Research (COR) as they greatly facilitated and continuously supported this document. We also would like to thank all the experts and institutions contributing with plenty of valuable comments on the on-line draft version of this roadmap, which was released in November 2017 on the EU NSC website for public consultation. All the comments have been carefully reviewed and were considered in this final version. In particular we want to thank the SweNanoSafe Team for their very careful proofreading and commenting, which was highly appreciated. In addition, we received detailed comments from the European Materials Modelling Council (EMMC), which should be acknowledged here. Moreover, many experts joined several of our face-to-face meetings and teleconferences (as hosted by the U.S. NIH NanoWG or EU NSC WG) and crucially shaped the final version this roadmap with various detailed comments. In particular we thank Stacey Harper (Oregon State University, USA), Mark D. Hoover (U.S. NIOSH), Anil Patri (U.S. FDA), John Rumble (R + R Data Service, USA), Treye Thomas (U.S. CPCS), Hugues Crutzen and Hubert Rauscher (EC JRC) for valuable comments. Marc A. Williams (U.S. Army Public Health Center (APHC), Toxicology Directorate, Aberdeen Proving Ground, MD, USA) and David Winkler (CSIRO Manufacturing, Australia; La Trobe University, Australia; Monash University, Australia) provided edits that helped greatly in achieving consistency across sections. In addition, we would like to thank several experts at the EC, who also continuously supported this document personally. In particular Georgios Katalagarianakis (EC, DG R&I) deserves a special acknowledgement. We also thank Anne de Baas (EC, DG R&I) for valuable comments and last but not least, Lisa Friedersdorf and Stacey Standridge (U.S. NNCO) and Trey Thomas of the Consumer Product Safety Commission should be thanked for their continuous support to the roadmap. In addition, all the authors who helped with a detailed proofreading to shape the final version of this roadmap should be acknowledged here, in particular Marc A. Williams and Dave Winkler. Finally, a very special thanks goes to Anastasios G. Papadiamantis, Iseult Lynch and Eva Valsami-Jones (University of Birmingham) for continuous support with all the final formatting and for carefully proofreading several versions of the document.
EU US Roadmap Nanoinformatics
121
Appendix 1: Summary of Database Projects (2010-2017) The NSC Working Group on Databases together with the caLIBRAte project, distributed a database survey in December 2016. Thirty-two responses were received, from the following projects: Cerasafe, DaNA, eNanoMapper, MARINA, NanoFate, NanoImpactNet, NanoMILE, NanoPUZZLES, NANoREG, Nanosolutions, Nanovalid, NECID, S2NANO, Sanowork, Scaffold, Serenade, SIRENA, SUN, TINE, UK NanoRegister, and VieilleNanos. According to the responses, the majority of types of data and information on NMs collected by the responding projects (multiple answers possible) were on physico-chemical characterisation (24), in vitro toxicity (17), in vivo toxicity (17), ecotoxicology (14), human exposure (12), or environmental release/fate (10). Other questions of the survey addressed the main objective(s) of the database, database design and implementation, database availability/accessibility, the use of semantics technology methods, the data collection and curation, the copyright and licensing aspects. The results of the survey will be published on the EU NanoSafety Cluster website. Further details of selected projects are given below.
A1.1 eNanoMapper The EU FP7 project eNanoMapper ran from February 2014 to February 2017 and developed a computational framework for NMs toxicological data, which is based on open standards, open source, common languages, and an interoperable design, enabling a more effective and integrated approach to risk assessment. eNanoMapper has created a modular, extensible infrastructure for transparent data sharing, data analysis, and the creation of computational toxicology models, which aims to support data management in the area of nanoEHS and to enable an integrated approach for the risk assessment of NMs. To achieve these, eNanoMapper developed an ontology, a data infrastructure and modelling tools with applicability in risk assessment of NMs. The ontology includes common vocabulary terms used in nanosafety research. The database includes functionalities for data protection, data sharing, data quality assurance, search interfaces for different needs and usages, comparability and cross-talk with other databases (https://search.data.enanomapper.net). A collection of descriptors, computational toxicology models and modelling tools were developed, enabling the use and integration of nanosafety data from various sources [A1-A3], including web tools: Jaqpot (http://www.jaqpot.org, [A4]) which allows online Modelling (building and validating models), Read-across, Interlaboratory comparison and Experimental Design, while Nano-lazar, available at https://nano-lazar.in-silico.ch/predict, offers online Read-across toxicity predictions. The project also provided a rich library of information and documentation (tutorials, webinars, reports and publications) to support and guide the users. In addition, a collection of modelling tools developed within FP7 nano modelling projects was created: http://www.enanomapper.net/nsc-modelling-tools.
EU US Roadmap Nanoinformatics
122
A1.2 NanoDatabank NanoDatabank, developed by the Nanoinformatics group of the UCLA Center for Environmental Implications of Nanotechnology (CEIN), is a centralised and integrated web-based database management system for NMs. NanoDatabank, which is an integral component of a nanoinformatics platform (nanoinfo.org), was developed with a framework for classification and storage of various structured as well as unstructured NMs relevant data types. NanoDatabank provides storage and sharing of data using language independent and easy to understand collection of key-value pairs in the form of JavaScript object notation (JSON) based objects. The classification structure of NanoDatabank are consistent with existing ontologies and hierarchy trees such as the Nano Particle Ontology (NPO) [A5], eNanoMapper [A6] as well as with data format provided by Nanomaterial standards such as ISA-TAB-NANO [A7]. NanoDatabank currently contains data sets on more than 1000 NM types, 900 investigations regarding NM toxicity (including metal oxides, quantum dots, CNTs and more) and 150 investigations regarding F&T and ENM characterisation. NanoDatabank supports nanoinformatics tools/simulators by providing (a) accessibility to data sets by various simulators and data processing tools, (b) ability to upload raw data and perform various data processing functions, and (c) an intelligent system to allow advanced querying of records within the system. NanoDatabank stores investigation data as part of studies which contain one or more investigations. Each investigation is classified via a dynamic system (i.e., classification trees for (i) NMs and (ii) Investigations embedding classification sub-trees for studies and associated data files). Given the above, Meta Data files are automatically generated as well as dynamic summary reports of NanoDatabank uploaded investigations. Studies and investigations are linked to specific NMs in the NMs NanoCatalog.
A1.3 NECID Under the leadership of IFA (Institute for Occupational Safety and Health of the German Social Accident Insurance) and TNO (TNO – innovation for life) a working group of PEROSH (Partnership for European Research in Occupational Safety and Health) institutes developed and tested a database software called NECID (Nano Exposure and Contextual Information Database). The software supports the user to collect and store data of exposure measurements of NOAA (Nano-Objects and their Agglomerates and Aggregates). In addition to measurement data of individual instruments the collection and documentation of work conditions, or so called “contextual information,” is a focus of this project. The NECID software includes a NM specific exposure database, as well as features for data sharing and data assessment. The software runs locally on a computer but also offers a web-based central database for the exchange of information. A key factor for the project is the harmonisation of “nano exposure measurements” and their documentation. Therefor NECID uses, as far as possible, a harmonised ontology to enable links to other databases. During the construction of NECID, cooperation and exchange of information to other projects like NANoREG, MARINA, caLIBRAte, GUIDEnano were important parts of the work.
EU US Roadmap Nanoinformatics
123
After an intensive testing phase within the project a software license for NECID is available to every organisation dealing with the challenge of handling NOAA or the risk assessment of these tasks. At the moment the license is free of charge. For further information please contact [email protected] or visit the webpage WWW.NECID.eu.
A1.4 SERENADE CEREGE-Labex SERENADE is the primary contact in Europe for the US database efforts led by CEINT– Duke University with ongoing effort on data management, curation and with the US-nanoinformatics program as to determine a strategic plan for data standardisation, templates and guidance documents for data harmonisation between Europe and USA. Discussions were also active during the ProSafe –OECD conference in Paris (end of 2016) to link EU and US databases (interoperability, ontology, data exchange formats). The CEINT group works in close collaboration with the EU Nanosafety Cluster Database Group and the EU-US Database CORs (Community of Research) on templates harmonisation and especially on the NanoReg templates and format. All partners to share expertise for products stability assessment (simulation of products use), environmental fate study, ecotoxicology, end of life with the ProSAfe project, and develop common set-up protocols in order to compare data and implement exposure models.
A1.5 GuideNano A web-based Exposure Scenario Library has been developed within the GUIDENANO project to read-across the exposure scenarios. The library includes contextual information (NMs properties, task description, exposure controls) and measurement data of 200 occupational exposure scenarios covering a wide range of NMs (CNT, CNF, SiO2, ZnO, Ag etc.). The library can be searched by NM name, life-cycle, source domain, contributing exposure scenario. The ES Library is hosted online and managed by IOM and available using the link: http://guidenano.iom-world.co.uk/. GuideNano partners continue to work with eNanoMapper and other members of NSC Working Group to map the ES Library variables with those already available in the eNanoMapper database and to add new terms if necessary with the aim of constructing an exposure ontology and ultimately to make all the exposure data available via the database developed in eNanoMapper.
A1.6 SUN The SUN project has successfully accomplished the design, implementation and population of a web-based data repository, a searchable operational project database to store and maintain the data generated by the project. An extensive exercise was carried out with SUN project partners to develop data collection templates, procurement, completeness, quality-checked, collation and storage of the scientific project data into a flexible and user-friendly operational database. The implemented database provides facilities to search, query and retrieve selected project data-sets. We anticipated sharing and uploading the SUN data to an instance of the “final” eNanoMapper database early on in the project however, data sharing permissions, embargos etc. needs to be formalised with SUN project partners. To advance this, SUN partners are currently involved in
EU US Roadmap Nanoinformatics
124
further related developments, having been contacted by the NANOREG2 and CaLIBRAte projects, aiming to supply them with final SUN data.
A1.7 MARINA The MARINA project addresses four themes in the Risk Assessment and Management of NMs: Materials, Exposure, Hazard, and Risk. It developed referential tools from each of these themes and integrated them into a Risk Management Toolbox and Strategy for both human and environmental health. The tools were also demonstrated by means of case studies. The fundamental achievements of MARINA are: (i) A well tested set of reference NMs with thoroughly validated referential characterisation methods. (ii) The methods to further understand the properties, interaction, exposure, and fate of ENM in relation to human health and the quality of the environment. (iii) The harmonised, and standardised reference methods for hazard assessment for both human and environmental health and an integrated/intelligent testing strategy. (iv) The risk assessment tools by combining elements of (i), (ii) and (iii); and strategies for monitoring ENM exposure for human health and the environment (including accidental massive release; e.g., explosion or environmental spillage). (v) The MARINA database of experimental results to be shared with the EU Nanosafety Cluster and other ongoing or future projects. (vi) Over 80 scientific papers published in peer-reviewed-journals.
A1.8 NANOSOLUTIONS The main innovation of the NANOSOLUTIONS project has been the development of the ENM Safety Classifier. This novel hazard profiling principle will help in understanding and defining the toxic potential of different types of ENM. It can be used by the ENM industry as well as the regulatory community to manage, reduce ENM-associated uncertainties, and bring clarity to the current debate, since it enables classifying ENM into different hazard categories. During the course of the project, HTS platforms for rapid screening of ENMs, based on robust and validated in vitro assays, have also been developed and optimised for ENMs. These platforms can be used to implement new assays based on the biomarkers identified by the Safety Classifier. The data gathered in the project has contributed to the life cycle impact evaluation of ENM-based products, and will ultimately clarify their global environmental impact. Validation of the Safety Classifier has been carried out with industrially relevant materials. NANOSOLUTIONS will make its data available to other qualified parties and this open access to high-quality data on the material characteristics of various classes of ENM and the relevant biological outcomes across several species, including healthy and susceptible individuals, will serve as a valuable resource for future ENM safety prediction and classification.
A1.9 NanoMILE Project NanoMILE was completed in February 2017. Within NanoMILE, several computational methodologies, including semi-empirical quantum mechanical (QM) treatment of MNMs crystals, were applied for the estimation of metal and metal oxide MNMs properties to identify specific physicochemical features that may be used as “MNM fingerprints” and novel nano-descriptors. The proposed computational scheme involved the use of various approaches, such as semi-empirical QM calculations, to
EU US Roadmap Nanoinformatics
125
calculate a range of MNM physicochemical properties. Initially, semi-empirical (PM6/PM7) QM calculations were performed on a set of 12 MNMs with varying sizes to monitor the evolution of properties and to compare them with the experimentally measured properties from their synthesised counterparts. However, in order to adequately compare our computed results with experimental findings, there is a need to consider larger MNM clusters than those treated with traditional semi-empirical approaches based on the gradual replication of the crystal cell unit. Unfortunately, such calculations cannot be performed for systems that usually exceed 500-600 atoms due to software and machine memory limitations [A8]. To overcome this obstacle, modified PM6/ PM7 calculations were performed for selected MNM systems; by doing so, it was possible to obtain MNM properties for systems up to 4000 atoms (approximately 4 nm). Within NanoMILE FP7 project, a well-organised dataset of NMs has been created and was analyzed by in silico methods, including the cellular uptake of 109 NMs in pancreatic cancer cells (PaCa2). A validated QNAR model for the prediction of the cellular uptake in pancreatic cancer cells based on this dataset was developed according to OECD principles and then released online through Enalos Cloud platform (http://enalos.insilicotox.com/QNAR_PaCa2/). This dedicated web service was developed to make the model available to anyone interested in acquiring knowledge on potential effects of NMs in a decision-making framework. In an effort to highlight the usefulness of the web service, the entire PubChem database was exploited to select surface modifiers and propose a prioritised list of novel surface modifiers [A9].
A1.10 NanoInformatics Knowledge Commons (NIKC) The NanoInformatics Knowledge Commons (NIKC) Database was designed by the Center for Environmental Implications of NanoTechnology (CEINT) to gather engineered NM exposure and toxicity data into an organisational structure permitting readily accessible data for broader scientific inquiry. The NIKC consists of a database (DB) and associated applications for data entry and data analysis; the DB contains CEINT data as well as data extracted from published literature, and is accessible to CEINT members as well as NIKC collaborator groups in the US and abroad. The NIKC is an important component in realising the goals of CEINT, which include: elucidating the general principles that determine NM behaviour in the environment; identifying data and metadata necessary to support forecast of exposure potential, bioaccumulation, and bioactivity; and identifying key functional assays [A10] that are predictive of measurements of interest. The NIKC supports development of analytical tools such as the Nano Product Hazard and Exposure Analytical Tool (NanoPHEAT), a custom-built app designed to graphically indicate exposure risk outcomes from products incorporating engineered NMs. CEINT has also adopted management of the community-driven ISA-TAB-Nano project [A7], which establishes consistent file-sharing formats for NM data to enable integration of information even in advance of formally established standard(s) processes. ISA-TAB-Nano was developed by the National Cancer Informatics Program’s Nanotechnology Working Group (NCIP NanoWG) and has been adopted and adapted by a number of projects including the EU-wide NANoREG project. CEINT is leading the community-based effort to expand the standardised protocol templates used to develop consistent
EU US Roadmap Nanoinformatics
126
and comparable data, with a particular focus on including critical elements of NM datasets identified via CEINT’s work. These include: transformation and exposure endpoints, inclusion of media parameters within the primary dataset that describe NM characterisations, and functional assay measurements used to predict (exposure and hazard) outcomes of interest.
A1.11 QsarDB QsarDB has been developed over the course of the past decade within several EU funded and national (in Estonia) research initiatives (see www.qsardb.org). It is a general repository solution for organising, storing, preserving and using QSAR models. It is also designed for accommodating nano-structures and nano-materials. The storage of QSAR models and related data is a complicated issue and available storage solutions have been reviewed recently [A11]. QsarDB is open and gives freedom to develop model to the developer and allows preserving and efficient reusing of models. What is equally important, it gives an easy access to QSAR models to potential users, providing transparent view to the constituents of the model and allows independent verification. QsarDB consists of several components (e.g., data format, repository and tools). Qsar DataBank data format [A12] is a format for representing QSAR model information (data and models) in systematic and machine-readable way. Qsar DataBank data format is generic and has been also used for Quantitative nano-Structure-Activity Relationships [see example collection of models http://hdl.handle.net/10967/120]. The format is extendable, for example to include further developments for models with nanostructures and nanoparticles. The archives in Qsar DataBank data format can be freely deposited to the QsarDB smart repository [13]. The QsarDB smart repository is a practical resource and tool that enables research groups, project teams and institutions to share, present and use Quantitative Structure-Activity Relationships data and models. At the moment, the repository includes over 400 (Q)SAR models, is expanding and developed further.
A1.12 GRACIOUS The newly funded GRACIOUS H2020 project will continue the efforts of the above projects to establish a data curation system, which will be developed based on the eNanoMapper database and on elements and templates from other relevant nanosafety data inventories such as NANoREG, NanoReg2, DANA 2.0, SUN, MARINA and NanoETox to allow both the integration of newer data and the use of raw and aggregated data for regulatory risk assessment and Stage-Gate innovation decision making. This data curation system will be designed to allow seamless integration with a variety of modelling tools (ranging from simple rules and theoretical models to complex in silico (e.g., Q(n)SP/AR) algorithms) into an interoperable data and modelling ‘infrastructure’. This ‘infrastructure’ will be connected to the GRACIOUS interoperable module for grouping and read-across of nanoforms to deliver to it curated data and computing capabilities. The module will be specifically designed to enable existing user-friendly risk assessment and management software tools (e.g., SUNDS, caLIBRAte SoS) to perform grouping and read-across. Its results will be delivered as easy to comprehend dynamic charts and textual reports to facilitate further analysis and/or decision making.
EU US Roadmap Nanoinformatics
127
A1.13 References A1. Helma, C., M. Rautenberg, and D. Gebele, Nano-Lazar: Read-Across Predictions for Nanoparticle Toxicities with Calculated and Measured Properties. Frontiers in Pharmacology, 2017. 8(377). A2. Drakakis, G., et al., Decision Trees for Continuous Data and Conditional Mutual Information as a Criterion for Splitting Instances. Combinatorial Chemistry & High Throughput Screening, 2016. 19(5): p. 423-428. A3. Tsiliki, G., et al., RRegrs: an R package for computer-aided model selection with multiple regression models. Journal of Cheminformatics, 2015. 7(1): p. 46. A4. Chomenidis, C., et al., Jaqpot Quattro: A Novel Computational Web Platform for Modelling and Analysis in Nanoinformatics. Journal of Chemical Information and Modelling, 2017. 57(9): p. 2161-2172. A5. Thomas, D.G., R.V. Pappu, and N.A. Baker, NanoParticle Ontology for cancer nanotechnology research. Journal of Biomedical Informatics, 2011. 44(1): p. 59-74. A6. Chang, J., et al., eNanoMapper/ontologies: Final release of eNanoMapper ontology (Version v4.0). Zenodo, 2016. A7. Thomas, D.G., et al., ISA-TAB-Nano: A Specification for Sharing Nanomaterial Research Data in Spreadsheet-based Format. BMC Biotechnology, 2013. 13(1): p. 2. A8. Jagiello, K., et al., Size-dependent electronic properties of nanomaterials: How this novel class of nanodescriptors supposed to be calculated? Structural Chemistry, 2017. 28(3): p. 635-643. A9. Melagraki, G. and A. Afantitis, Enalos InSilicoNano platform: an online decision support tool for the design and virtual screening of nanoparticles. RSC Advances, 2014. 4(92): p. 50713-50725. A10. Hendren, C.O., et al., A functional assay-based strategy for nanomaterial risk forecasting. Science of the Total Environment, 2015. 536: p. 1029-1037. A11. Sild, S., et al., Storing and using quantitative and qualitative structure–activity relationships in the era of toxicological and chemical data expansion, in Big Data in Predictive Toxicology, in Issues in Toxicology (In press), D. Neagu and A. Richarz, Editors. 2017, Royal Society of Chemistry. A12. Ruusmann, V., S. Sild, and U. Maran, QSAR DataBank - an approach for the digital organization and archiving of QSAR model information. Journal of Cheminformatics, 2014. 6(1): p. 25. A13. Ruusmann, V., S. Sild, and U. Maran, QSAR DataBank repository: open and linked qualitative and quantitative structure–activity relationship models. Journal of Cheminformatics, 2015. 7: p. 32.
Related Documents