EU CYBERSECURI TY MARKET ANALYSIS EU CYBERSECURITY MARKET ANALYSIS IoT in Distribution Grids APRIL 2022

Welcome message from author
This document is posted to help you gain knowledge. Please leave a comment to let me know what you think about it! Share it to your friends and learn new things together.
Transcript
EU CYBERSECURITY MARKET ANALYSIS
EU CYBERSECURITY MARKET ANALYSIS IoT in Distribution Grids
APRIL 2022
EU CYBERSECURITY MARKET ANALYSIS April 2022
2
ABOUT ENISA
The European Union Agency for Cybersecurity, ENISA, is the Union’s agency dedicated to achieving a high common level of cybersecurity across Europe. Established in 2004 and strengthened by the EU Cybersecurity Act, the European Union Agency for Cybersecurity contributes to EU cyber policy, enhances the trustworthiness of ICT products, services and processes with cybersecurity certification schemes, cooperates with Member States and EU bodies, and helps Europe prepare for the cyber challenges of tomorrow. Through knowledge sharing, capacity building and awareness raising, the Agency works together with its key stakeholders to strengthen trust in the connected economy, to boost resilience of the Union’s infrastructure, and, ultimately, to keep Europe’s society and citizens digitally secure. More information about ENISA and its work can be found here: www.enisa.europa.eu.
CONTACT For contacting the authors please use [email protected]. For media enquiries about this paper, please use [email protected].
AUTHORS Domenico Ferrara (ENISA), Louis Marinos (ENISA), Silvia Portesi (ENISA), Eleni Tsekmezoglou (ENISA), Gartner Team
ACKNOWLEDGEMENTS ENISA would like to thank the following persons and organisation:
• The ENISA Advisory Group, the ECCG and SCCG for their input during the scoping phase and for their feedback during the validation phase of this report;
• The Members and Observers of the ENISA Ad Hoc Working Group on EU Cybersecurity Market for their guidance and feedback during the validation phase of this report;
• The ENISA Colleagues who provided input and/or reviewed this report.
LEGAL NOTICE This publication represents the views and interpretations of ENISA, unless stated otherwise. It does not endorse a regulatory obligation of ENISA or of ENISA bodies pursuant to the Regulation (EU) No 2019/881.
ENISA has the right to alter, update or remove the publication or any of its contents. It is intended for information purposes only and it must be accessible free of charge. All references to it or its use as a whole or partially must contain ENISA as its source.
Third-party sources are quoted as appropriate. ENISA is not responsible or liable for the content of the external sources including external websites referenced in this publication.
Neither ENISA nor any person acting on its behalf is responsible for the use that might be made of the information contained in this publication. ENISA maintains its intellectual property rights in relation to this publication.
COPYRIGHT NOTICE © European Union Agency for Cybersecurity (ENISA), 2022

EU CYBERSECURITY MARKET ANALYSIS April 2022
3
This publication is licenced under CC-BY 4.0 “Unless otherwise noted, the reuse of this document is authorised under the Creative Commons Attribution 4.0 International (CC BY 4.0) licence (https://creativecommons.org/licenses/by/4.0/). This means that reuse is allowed, provided that appropriate credit is given and any changes are indicated”.
Cover image © Shutterstock, shutterstock.com
For any use or reproduction of photos or other material that is not under the ENISA copyright, permission must be sought directly from the copyright holders.
ISBN 978-92-9204-560-9 DOI 10.2824/519005
EU CYBERSECURITY MARKET ANALYSIS April 2022
4
TABLE OF CONTENTS
EXECUTIVE SUMMARY 7
1. INTRODUCTION 9
1.1 SCOPING AND SELECTED THE FOCUS OF THE REPORT: IOT CYBERSECURITY IN DISTRIBUTION GRIDS 9
1.2 SPECIFICITIES OF THIS MARKET ANALYSIS 9
1.3 STRUCTURE OF THE REPORT 9
1.4 DATA COLLECTION 10
1.5 BACKGROUND: A CHANGING LANDSCAPE IN THE ELECTRICITY INDUSTRY 10
2. MARKET STRUCTURE 13
2.1 INTRODUCTION TO THE MARKET STRUCTURE 13
2.2 RESEARCH QUESTIONS 14
2.3 KEY ASSETS OF THE ELECTRICITY GRIDS FROM AN IOT PERSPECTIVE: SMART TRANSFORMERS AND SMART METERS 14
2.4 COVERED GEOGRAPHIES 16
2.5 IOT CYBERSECURITY MARKET IN DISTRIBUTION GRIDS IN EU-27 16
2.5.1 IoT cybersecurity market of smart transformers 16 2.5.2 IoT cybersecurity market of smart electricity meters 23 2.5.3 IoT cybersecurity market: aggregated results 27
3. DEMAND-SIDE RESEARCH 29
3.1 INTRODUCTION TO THE DEMAND-SIDE RESEARCH SECTION 29
3.2 RESEARCH QUESTIONS FOR THE DEMAND-SIDE 29
3.3 METHODOLOGY OF THE DEMAND-SIDE RESEARCH 30
3.4 MARKET TRENDS ON THE DEMAND-SIDE 30
4. SUPPLY-SIDE RESEARCH 37
4.1 INTRODUCTION TO THE SUPPLY-SIDE ANALYSIS 37
4.2 RESEARCH QUESTIONS FOR THE SUPPLY-SIDE ANALYSIS 37
EU CYBERSECURITY MARKET ANALYSIS April 2022
5
4.3 METHODOLOGY OF THE SUPPLY-SIDE ANALYSIS 37
4.4 ARCHETYPES OF SUPPLIERS 37
4.4.1 Multi-domain industrial assets vendors 38 4.4.2 Multi-domain IT vendors 40 4.4.3 Specialist IoT vendors 43 4.4.4 IoT Cybersecurity specialist vendors 45
4.5 PROFILES OF REPRESENTATIVE MARKET PLAYERS 46
4.5.1 General Electric 46 4.5.2 Hitachi ABB Power Grids 46 4.5.3 Microsoft 47 4.5.4 Oracle 47 4.5.5 CloudPlugs 48 4.5.6 Telit 48 4.5.7 Nozomi Networks 49 4.5.8 Radiflow 49
4.6 VENDORS IN SCOPE FOR THE ANALYSIS 50
4.7 MARKET TRENDS ON THE SUPPLY-SIDE 50
5. TECHNOLOGY RESEARCH 53
5.1 INTRODUCTION TO THE TECHNOLOGY RESEARCH SECTION 53
5.2 RESEARCH QUESTIONS ON TECHNOLOGY 53
5.3 METHODOLOGY OF TECHNOLOGY ANALYSIS 53
5.4 IOT CYBERSECURITY TECHNOLOGY TRENDS IN DISTRIBUTION GRIDS 54
5.4.1 Cyber-physical system security 55 5.4.2 Operational Technology security 55 5.4.3 Positioning, Navigation, and Timing (PNT) security 56 5.4.4 Digital Risk Protection Services 57 5.4.5 Homomorphic Encryption 57
6. MACRO-ENVIRONMENTAL FACTORS 59
6.1 INTRODUCTION TO THE MACRO-ENVIRONMENTAL FACTORS SECTION 59
6.2 RESEARCH QUESTIONS 59
6.3 METHODOLOGY OF ANALYSIS 59
6.4 MACRO-ECONOMIC FACTORS OF THE IOT CYBERSECURITY MARKET 60
6.4.1 Accelerated electrification of vehicles in EU 60 6.4.2 Aftermath of the COVID-19 pandemic 61 6.4.3 Available green bonds and government funding for energy transformation 61 6.4.4 Limited workforce to execute on grid digitalisation 61 6.4.5 Accelerated growth in electricity consumption because of global warming 61 6.4.6 Relevant legal framework of IoT cybersecurity in distribution grids 62

EU CYBERSECURITY MARKET ANALYSIS April 2022
6
7. CONCLUSIONS 63
7.1 MAIN FINDINGS 63
7.2 WAYS FORWARD 63
A ANNEX: COVERED IOT CYBERSECURITY MARKET SEGMENT 65
B ANNEX: ACRONYM TABLE 68
EU CYBERSECURITY MARKET ANALYSIS April 2022
7
EXECUTIVE SUMMARY
Due to increasing digital transformation across various sectors, cybersecurity is now at the forefront for many organisations. This trend has been further reinforced by the continuous development of relevant EU legislative and policy frameworks, such as the Network and Information Security (NIS) Directive1, the EU Cybersecurity Act (CSA)2 and the Digital Single Market Strategy3.
The NIS Directive represents the first EU-wide legislation on cybersecurity. Its objective is to achieve a high common level of cybersecurity across all national ‘Operators of Essential Service’ (OES). The identified OESs include various industries, such as energy, transport and water distribution. The energy infrastructure is one of the most complex and, at the same time, critical infrastructures that other business sectors depend upon to deliver essential services. Therefore, unavailability in supply of energy may potentially have high impact on economy and society. A potential disruption for a long period of time can cause a disfunctions in society, industry and trade by even affecting the gross domestic product (GDP). As will be outlined in this study, the NIS Directive has important implications for numerous organisations, including those managing the electrical grid in the Member States. The ability for organisations to ensure the cybersecurity of power supply is of fundamental value for the functioning of Member States and the every-day lives of European citizens. As such, successful cyber-attacks may have a devastating impact on the performance of power grids. By way of example, the 2015 cyber-attack in Ukraine4 cut the electricity of 225,000 households, damaged industrial control systems, and resulted in lasting operational implications on the electricity grid for several weeks.
Meanwhile, it must be noted that the electricity industry is undergoing a radical transformation, driven by political, economic, social, and environmental factors, as well as by the increased digitalisation through the adoption of new technologies and new market entrants. Considering the recent policy developments on IoT cybersecurity5, one could reasonably state that IoT technologies are increasingly at the forefront of this transformation. Be that as it may, as organisations continue to digitalise their operations and improve the flexibility of the grid to accommodate renewable energy sources, their attack surface has increased. Vulnerable (interconnected) IoT devices6 can be accessed by malicious actors, resulting in stolen information or malicious activities that could cause disruptions to the safe operation of energy assets, causing potential harm to individuals, organisations, or Member States.
In accordance with its mandate under the CSA, ENISA observes and analyses the cybersecurity market in the European Union. It is within this context that ENISA delivers this report which aims at analysing the IoT cybersecurity market in distribution grids in the European Union. This analysis has been conducted as a proof of concept (PoC) of the initial version of the ENISA
1 https://eur-lex.europa.eu/legal-content/EN/TXT/PDF/?uri=CELEX:32016L1148&from=EN, accessed 20 September 2021. 2 https://eur-lex.europa.eu/legal-content/EN/TXT/PDF/?uri=CELEX:32019R0881&from=EN, accessed 20 September 2021. 3 https://eur-lex.europa.eu/legal-content/EN/TXT/PDF/?uri=CELEX:52015DC0192&from=EN, accessed 20 September 2021. 4 https://www.wired.com/2016/03/inside-cunning-unprecedented-hack-ukraines-power-grid/, accessed December 2021. 5 See for instance, EU's Cybersecurity Strategy for the Digital Decade, JOIN/2020/18 final, https://eur-lex.europa.eu/legal-content/EN/ALL/?uri=JOIN:2020:18:FIN (see in particular Section 1.5 An Internet of Secure Things), accessed 13 January 2022; Council Conclusions on the cybersecurity of connected devices, 2 December 2020, 13629/20, https://data.consilium.europa.eu/doc/document/ST-13629-2020-INIT/en/pdf, accessed 13 January 2022; Commission Delegated Regulation of 29.10.2021 supplementing Directive 2014/53/EU of the European Parliament and of the Council with regard to the application of the essential requirements referred to in Article 3(3), points (d), (e) and (f), of that Directive, https://eur-lex.europa.eu/legal-content/EN/TXT/?uri=PI_COM%3AC%282021%297672&qid=1638116539090, accessed 13 January 2022. For an overview on European Commission policy on IoT, see https://digital-strategy.ec.europa.eu/en/policies/secure-internet-things, accessed 13 January 2022. 6 In this report "IoT" and "connected devices" are used as synonymous.
EU CYBERSECURITY MARKET ANALYSIS April 2022
8
Cybersecurity Market Analysis Framework (ECSMAF) developed by the Agency in 2021 and published in April 20227.
As described in ENISA Cybersecurity Market Analysis Framework (ECSMAF), the scoping is key for the success of the analysis. The decision to conduct an analysis focused on IoT cybersecurity market in distribution grids was made by taking into account a variety of scoping criteria such as: level of adoption of IoT in the smart grid, size of the relevant market, reported level of exposure to cyberthreats, assumed added value of the analysis for the stakeholders, but also available project resources.
This report analyses demand and supply of IoT cybersecurity in distribution grids. Furthermore, it provides detailed indications on how this market might further develop in the future. That being said, the conclusions provided in the report are related to the envisaged scope, being thus non-exhaustive with regard to the entire smart-grid infrastructure. Moreover, in the frame of available resources, the analysis is based on existing market data delivered by a contractor. While they constitute a good sample to assess international market dynamics, trends and characteristics, they do not encompass the complete picture of the EU IoT cybersecurity market. This can be achieved in prospective, more targeted analyses of this market segment.
The research that was conducted resulted in the following highlights:
• IoT cybersecurity spending within the distribution grids of the EU-27 is mainly driven by the adoption of electricity “smart” meters.
• From 2025 to 2030, the IoT cybersecurity market related to smart meters is expected to be mainly driven by Operational Expenditures (OPEX) rather than Capital Expenditures (CAPEX). In practice, this means that more capital is expected to be spent for the maintenance of IoT cybersecurity (such as maintenance of security software installed in IoT devices, e.g. software patches) than for the purchase of new cybersecurity hardware or software.
• Analysis indicates that there are no IoT monopolies. Nonetheless, organisations tend to favour larger IoT vendors that possess the necessary capabilities to cover a wide spectrum of requirements, limiting the space for market entry of smaller organisations in consequence.
• There are four main archetypes of suppliers within the IoT cybersecurity market, these being: multi-domain industrial assets vendors, multi-domain IT vendors, specialist IoT vendors, and IoT cybersecurity specialist vendors.
• The above-mentioned archetypes exhibit different competitive dynamics, i.e., focussing on a particular market segment vs. diversification.
• The increase of demand for cybersecurity tools and services to improve its IoT cybersecurity capabilities, represents one of the main trends by the energy industry.
• Embedded cybersecurity into IoT infrastructure and IoT management platforms represents one of the trends on the supply-side portfolios.
• There are multiple technological development trends in the IoT cybersecurity market. Among these, cyber-physical system security and operational technology security are expected to materialize in the short term.
7 https://www.enisa.europa.eu/publications/market-analysis-framework
EU CYBERSECURITY MARKET ANALYSIS April 2022
9
1. INTRODUCTION
1.1 SCOPING AND SELECTED THE FOCUS OF THE REPORT: IOT CYBERSECURITY IN DISTRIBUTION GRIDS This report analyses the IoT cybersecurity market in distribution grids covering both international and European Union (EU) market developments.
This report is seen as a proof of concept (PoC) of an early version of the ENISA Cybersecurity Market Analysis Framework (ECSMAF) that was developed by the Agency in 2021 and published in April 20227.
As highlighted in the ECSMAF, scoping is a key step of the cybersecurity market analysis. While other potential market segments were also considered for the analysis - in particular IoT cybersecurity in connected health, IoT cybersecurity in connected industry, and IoT security in connected cars -, after careful consideration, the IoT in distribution grids was selected as scope for this analysis for different reasons: firstly, the market size, threat exposure, adoption/opportunity growth and the policy-making focus/interest have been used for the selection of this market segment. Secondly, it has been chosen to serve the purpose of piloting an early version of the framework and achieve further improvements, where appropriate. Thirdly, the selected scope allowed to conduct an analysis that met resource requirements and project timeframe.
1.2 SPECIFICITIES OF THIS MARKET ANALYSIS As mentioned above, this report serves as a Proof of Concept (PoC) of an early version of the ENISA Cybersecurity Market Analysis Framework (ECSMAF) developed by ENISA in 2021 and published in April 20227. The published version contains further improvements, accommodating experiences/issues identified from this market analysis.
It must be noted that, on the one hand, some elements in the framework have not been used for the present analysis (See 2.2.1 - Scoping the analysis and ECSMAF parametrization, ECSMAF Version 1.0); on the other hand, this analysis contains some information not strictly foreseen in the framework. For instance, available contractor data sources and knowledge/expertise were largely used and injected into the present analysis where deemed appropriate, in some cases going beyond the elements of the framework.
It is worth mentioning, that due to time constraints, the finalisation of Version 1.07 of the framework was done in parallel to the completion of the PoC. Some changes were made to an early version of the framework, following experiences from this pilot. However, the published Version 1.0 includes some additional elements not used within this analysis, but will be used in future ones.
Since the intention is to gradually improve the framework through further insights gained within additional analyses, the ECSMAF will be gradually updated over the coming years.
Because of its scope, its purpose (i.e. serving as a PoC of the framework), the limited resources and the restricted raw market data availability, this analysis could reach only a certain level of detail and depth.
1.3 STRUCTURE OF THE REPORT In accordance with the ECSMAF, this report is structured accordingly in five different sections:
EU CYBERSECURITY MARKET ANALYSIS April 2022
10
1. Market structure: This section provides an estimation of the market size of IoT cybersecurity in the EU.
2. Supply-side analysis: This section examines the key competitive trends of representative market suppliers of IoT cybersecurity and defines the main archetypes of suppliers within the market. Since the IoT cybersecurity vendor landscape is predominantly global, this section looks at the market from a global perspective.
3. Demand-side analysis: This section provides the analysis of the key drivers of the demand-side for IoT cybersecurity products or services.
4. Technology research: This section examines the key technology trends in the market, assesses their significance for the wider IoT cybersecurity market and provides an estimation of their projected materialisation in the EU.
5. Macro-environmental factors: This section identifies the external factors that could have a significant impact on how the IoT cybersecurity market further develops in the EU.
1.4 DATA COLLECTION This analysis has been conducted based mainly on already available data, delivered by the contractor. Due to time and resource restrictions, no primary research has been performed (i.e. dedicated surveys).
Cut-off date of the data collection was end of November 2021. However, some documents consulted after this cut-off date are also referenced in the analysis. They have been included during the final review.
1.5 BACKGROUND: A CHANGING LANDSCAPE IN THE ELECTRICITY INDUSTRY Driven by developments in political, economic and social environments, as well as by new technologies, the value chain of the electricity industry is undergoing the most significant transformation for some decades. The traditional electricity grid — monopolistic, heavily regulated, highly predictable, and unidirectional — is no longer adequate to meet new environmental and consumption requirements.
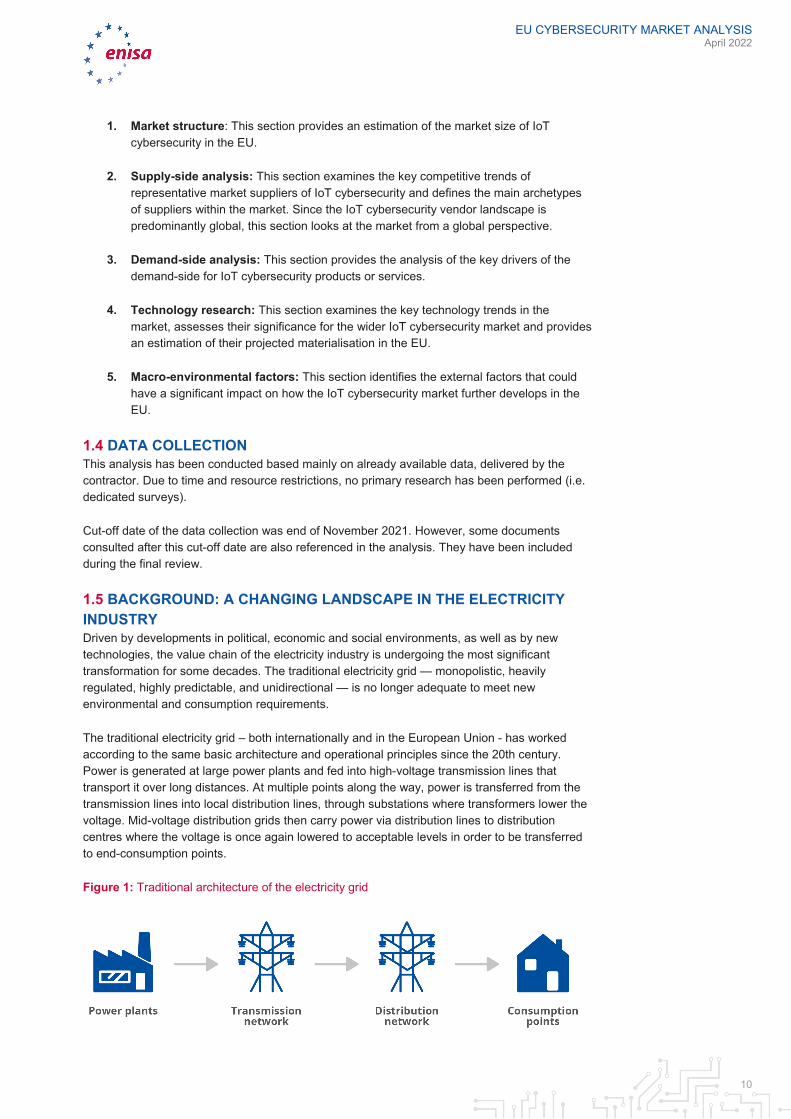
The traditional electricity grid – both internationally and in the European Union - has worked according to the same basic architecture and operational principles since the 20th century. Power is generated at large power plants and fed into high-voltage transmission lines that transport it over long distances. At multiple points along the way, power is transferred from the transmission lines into local distribution lines, through substations where transformers lower the voltage. Mid-voltage distribution grids then carry power via distribution lines to distribution centres where the voltage is once again lowered to acceptable levels in order to be transferred to end-consumption points.
Figure 1: Traditional architecture of the electricity grid
EU CYBERSECURITY MARKET ANALYSIS April 2022
11
In sum, the architectural design of traditional distribution grids is based on one-way transmission of power from a central power station through distribution level intermediaries to the end-consumers. As will be outlined in this report, this architecture is changing (see also Figure 3).
The increasing integration of renewable and distributed energy sources (e.g. electricity storage), in combination with the introduction of new market mechanisms enabling increased participation of customers in the electricity market (e.g. distributed generation), are contributing to the transformation of the distribution grid architecture in order to support such bidirectional power flows.
The technology-related challenges of this transformation are amplified by the fact that in most countries the “traditional” electric grid has already historically grown into very complex networks. Regulatory actions and limited investments of operators have resulted in an aging infrastructure with significant technical complexity.
Arguably, the creation of a flexible and bidirectional system – where customers can also be energy producers, energy managers and market participants – will require an adaptable and technologically advanced distribution grid. Developing a dynamic grid that is able to absorb and use the rapid expansion of distributed energy resources and other solutions will necessitate the deployment of advanced digital technologies. Small and large grid owners and operators will need to manage the electric power balance, to adjust their business models, while investing to a modern grid infrastructure.
Inherently, the transformation entails a greater reliance on digital capabilities and dynamically interconnected IoT devices. As a result, the digitalisation of grids makes owners, operators and consumers more exposed to cybersecurity threats. Empirical evidence (i.e. number of incidents) indicates that electricity grids are exposed to new threat vectors for multiple reasons, as outlined in the subsequent paragraphs.
Firstly, there are several state and non-state actors seeking to inflict economic or security damage to country-wide grid infrastructures. While malicious actors might have different motives, the energy industry constitutes a prominent target due to their role in national economies and the livelihood of citizens. By way of example, in 2018 it was reported that Russian hackers acquired access to the control systems of multiple U.S. generation plants, which could have resulted in shutdowns and blackouts.8 In addition, cybercriminals target the energy sector and critical infrastructure for profit9.
Secondly, the nature of the energy sector is intrinsically linked to geographically distributed assets and infrastructures (e.g. one could identify over 300 power plants10 and 11 million kilometres of low voltage distribution lines11 across EU Member States). Geographically distributed assets and infrastructure are also used for renewable energy sources including solar and wind power. This geographical distribution complicates uniform visibility and maintenance of Information Technology (IT) and Operational Technology (OT) systems.
A third factor is the extended lifespans of OT systems within the energy sector (e.g. transformers often last for 30 to 40 years).12 These OT systems often run on legacy technology that is only serviceable by a limited number of vendors, which have traditionally specialised in
8 https://www.bbc.com/news/technology-44937787, accessed 20 Sep 2021. 9 https://www.securityweek.com/australian-electricity-provider-cs-energy-hit-ransomware, accessed December 2021. 10 https://climateanalytics.org/briefings/eu-coal-phase-out/, accessed 20 Sep 2021. 11 https://www3.eurelectric.org/powerdistributionineurope/, accessed 20 Sep 2021. 12 https://www.powermag.com/clinging-to-power-why-extending-transformer-life-is-key/#:~:text=Under%20ideal%20conditions%2C%20transformers%20are,just%2020%20to%2025%20years., accessed 20 Sep 2021.
EU CYBERSECURITY MARKET ANALYSIS April 2022
12
OT rather than IT systems. As OT-IT technology converges, vendors have started to develop new security related products and services often based IoT and analytics solutions.
Since state-of-the-art digital and security capabilities are often provided in an OPEX model (e.g. SaaS), policy makers need to revisit whether current regulations are actually encouraging owners and operators to adopt such services.
Finally, the policy and legal framework related to the cybersecurity of IoT is evolving. For instance, according to the European Commission work programme for 202213, released on 19 October 2021, a proposal on a European cybersecurity resilience act (legislative) will be published in Q3 2022”14 and it will aim to “establish common cybersecurity standards for products”15, whereas products will likely include interconnected IoT devices.
13 https://ec.europa.eu/info/sites/default/files/com2021_645_en.pdf 14 https://www.europarl.europa.eu/legislative-train/theme-a-europe-fit-for-the-digital-age/file-european-cyber-resilience-act 15 https://ec.europa.eu/info/sites/default/files/com2021_645_en.pdf
EU CYBERSECURITY MARKET ANALYSIS April 2022
13
2. MARKET STRUCTURE
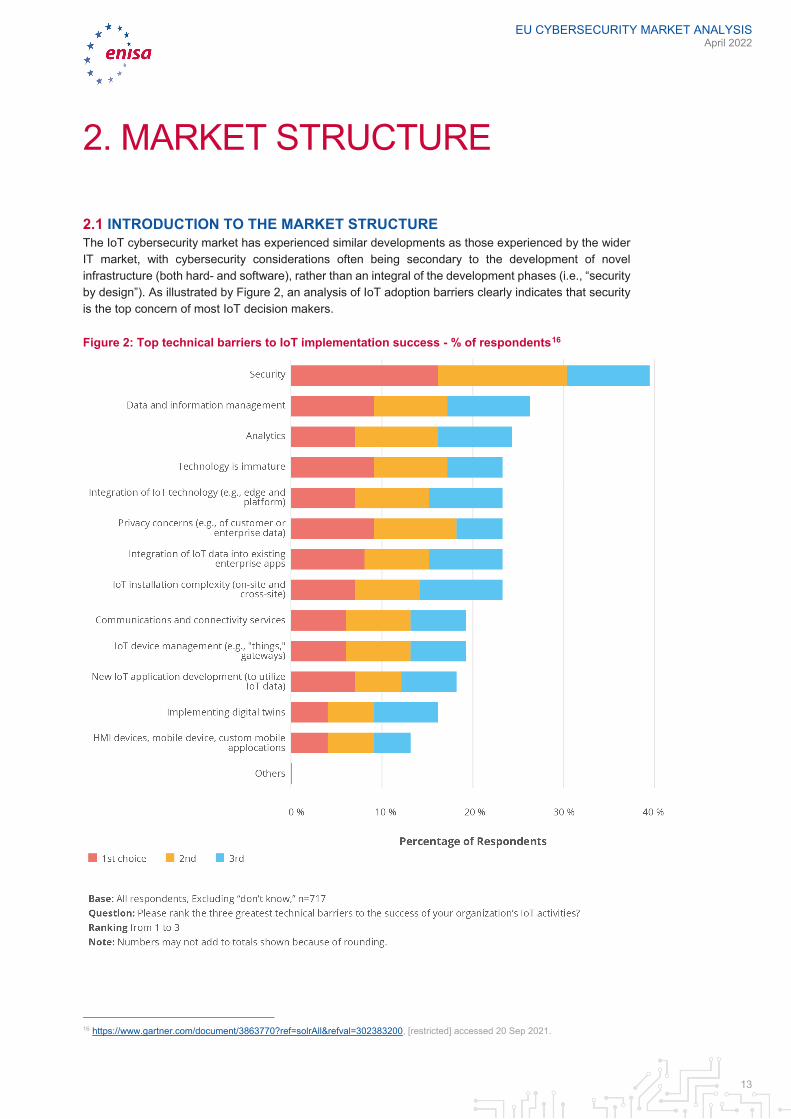
2.1 INTRODUCTION TO THE MARKET STRUCTURE The IoT cybersecurity market has experienced similar developments as those experienced by the wider IT market, with cybersecurity considerations often being secondary to the development of novel infrastructure (both hard- and software), rather than an integral of the development phases (i.e., “security by design”). As illustrated by Figure 2, an analysis of IoT adoption barriers clearly indicates that security is the top concern of most IoT decision makers.
Figure 2: Top technical barriers to IoT implementation success - % of respondents16
16 https://www.gartner.com/document/3863770?ref=solrAll&refval=302383200, [restricted] accessed 20 Sep 2021.

EU CYBERSECURITY MARKET ANALYSIS April 2022
14
The expected vulnerabilities resulting the swift IoT-adoption and the fast-changing threat landscape are leading to growing levels of spending on IoT security products and services.
2.2 .RESEARCH QUESTIONS According to ECSMAF7 (See Section 2.1.1 - ECSMAF, Version 1.0), the two main elements of the market structure and segmentation are the determination of value chain at scope and the determination corresponding value stack. The three analysis dimensions for these elements are the market size, the market growth and the market geographical distribution.
The analysis of the market structure of IoT cybersecurity in distribution grids addresses the following research questions:
1. What is the size and the geographical distribution of the IoT cybersecurity market in the EU-27 distribution grids?
2. Is the demand for IoT devices growing in the EU-27 distribution grids? 3. Is the demand for IoT cybersecurity growing in the EU-27 distribution grids? 4. How is the cybersecurity expenditure distributed between key assets of the distribution
grids? 5. How is the split between OPEX and CAPEX?
2.3 KEY ASSETS OF THE ELECTRICITY GRIDS FROM AN IOT PERSPECTIVE: SMART TRANSFORMERS AND SMART METERS Before replying to the research questions, it is important to highlight that the key assets of electricity grid in scope from an IoT perspective are mainly:
1. smart transformers; and 2. smart metres.
Table 1: Description of assets of the electricity grid in scope
Asset / device Description
Smart transformers High/Medium voltage transformers with smart actuators that help grid operators to manage voltage levels and regulate the active and reactive power levels of the distribution grid.
Smart meters Measure electricity consumption/generation readings and communicate this information to energy organisations and end-users.
EU CYBERSECURITY MARKET ANALYSIS April 2022
15
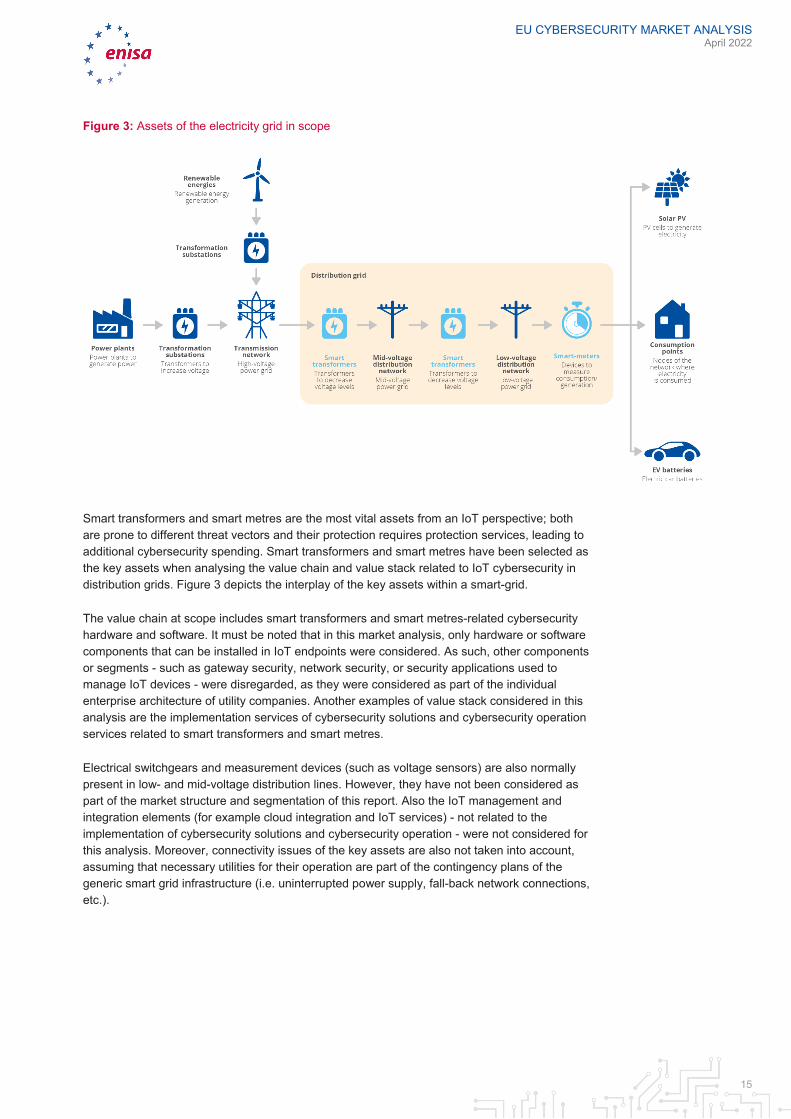
Figure 3: Assets of the electricity grid in scope
Smart transformers and smart metres are the most vital assets from an IoT perspective; both are prone to different threat vectors and their protection requires protection services, leading to additional cybersecurity spending. Smart transformers and smart metres have been selected as the key assets when analysing the value chain and value stack related to IoT cybersecurity in distribution grids. Figure 3 depicts the interplay of the key assets within a smart-grid.
The value chain at scope includes smart transformers and smart metres-related cybersecurity hardware and software. It must be noted that in this market analysis, only hardware or software components that can be installed in IoT endpoints were considered. As such, other components or segments - such as gateway security, network security, or security applications used to manage IoT devices - were disregarded, as they were considered as part of the individual enterprise architecture of utility companies. Another examples of value stack considered in this analysis are the implementation services of cybersecurity solutions and cybersecurity operation services related to smart transformers and smart metres.
Electrical switchgears and measurement devices (such as voltage sensors) are also normally present in low- and mid-voltage distribution lines. However, they have not been considered as part of the market structure and segmentation of this report. Also the IoT management and integration elements (for example cloud integration and IoT services) - not related to the implementation of cybersecurity solutions and cybersecurity operation - were not considered for this analysis. Moreover, connectivity issues of the key assets are also not taken into account, assuming that necessary utilities for their operation are part of the contingency plans of the generic smart grid infrastructure (i.e. uninterrupted power supply, fall-back network connections, etc.).
EU CYBERSECURITY MARKET ANALYSIS April 2022
16
2.4 COVERED GEOGRAPHIES In accordance with the geographical scope of this report, all EU Member States have been considered.
Table 2: EU-27 countries included in the market model17
Countries included in the market model
AT Austria FI Finland LV Latvia
BE Belgium FR France MT Malta
BG Bulgaria GR Greece NL Netherlands
CY Cyprus HR Croatia PL Poland
CZ Czech HU Hungary PT Portugal
DE Germany IE Ireland RO Romania
DK Denmark IT Italy SE Sweden
EE Estonia LT Lithuania SI Slovenia
ES Spain LU Luxembourg SK Slovakia
2.5 IOT CYBERSECURITY MARKET IN DISTRIBUTION GRIDS IN EU-27
2.5.1 IoT cybersecurity market of smart transformers
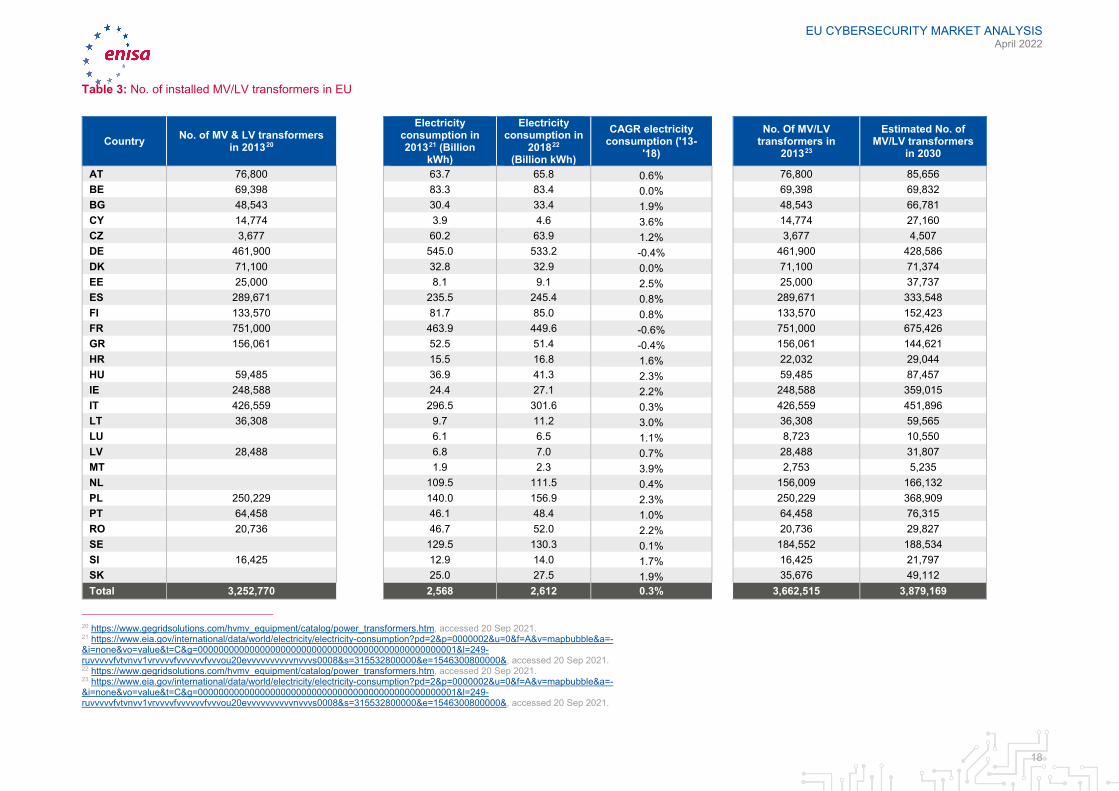
2.5.1.1 Projections of the installed base of transformers in EU-27 In accordance with the structure of the market model an estimation of the installed base of transformers in EU was made on the basis of the following four-stage approach (see Figure 4):
1. The figures of Eurolectric18 were used to determine the number of installed MV/LV (Medium voltage/low voltage) transformers in the EU-27 countries in 2013. The dataset includes figures for all EU-27 countries except Croatia, Luxemburg, Malta, The Netherlands, Slovakia and Sweden.
17 The countries are listed here in alphabetical order by country code. 18 https://www3.eurelectric.org/powerdistributionineurope/, accessed 20 Sep 2021.
EU CYBERSECURITY MARKET ANALYSIS April 2022
17
2. The number of installed MV/LV transformers in the countries for which no public information was obtained, is estimated on the assumption that the number of MV/LV transformers is proportional to electricity consumption in those respective countries.
3. The CAGR (Compounded Annual Growth Rate)19 of electricity consumption in the EU-27 between 2013 and 2018 was obtained. Since the EIA21 does not provide complete electricity consumption data for the years 2019 and 2020, we use 2013 as a baseline year and modelled the consumption growth based on available data points.
4. The number of installed MV/LV transformers between 2013 and 2030 is assumed to grow according to the same CAGR as electricity consumption in the EU-27 countries from 2013 to 2018. Electricity consumption data between 2018 and 2030 is assumed to grow at the same rate as it did between 2013 and 2018. In consequence, we do not account for potential factors that could accelerate electricity consumption in the future, such as increased adoption of electric vehicles. We use assumption as a conservative scenario to estimate the minimum number of endpoints/assets to be connected until 2030.
19 The compound annual growth rate (CAGR) is “the annualized average rate of revenue growth between two given years, assuming growth takes place at an exponentially compounded rate” (from https://www.gartner.com/en/information-technology/glossary/cagr-compound-annual-growth-rate, accessed 1 February 2022).
EU CYBERSECURITY MARKET ANALYSIS April 2022
18
Table 3: No. of installed MV/LV transformers in EU
Country No. of MV & LV transformers in 201320
Electricity consumption in 201321 (Billion
kWh)
Electricity consumption in
201822 (Billion kWh)
CAGR electricity consumption ('13-
'18)
No. Of MV/LV transformers in
201323
Estimated No. of MV/LV transformers
in 2030
AT 76,800 63.7 65.8 0.6% 76,800 85,656 BE 69,398 83.3 83.4 0.0% 69,398 69,832 BG 48,543 30.4 33.4 1.9% 48,543 66,781 CY 14,774 3.9 4.6 3.6% 14,774 27,160 CZ 3,677 60.2 63.9 1.2% 3,677 4,507 DE 461,900 545.0 533.2 -0.4% 461,900 428,586 DK 71,100 32.8 32.9 0.0% 71,100 71,374 EE 25,000 8.1 9.1 2.5% 25,000 37,737 ES 289,671 235.5 245.4 0.8% 289,671 333,548 FI 133,570 81.7 85.0 0.8% 133,570 152,423 FR 751,000 463.9 449.6 -0.6% 751,000 675,426 GR 156,061 52.5 51.4 -0.4% 156,061 144,621 HR 15.5 16.8 1.6% 22,032 29,044 HU 59,485 36.9 41.3 2.3% 59,485 87,457 IE 248,588 24.4 27.1 2.2% 248,588 359,015 IT 426,559 296.5 301.6 0.3% 426,559 451,896 LT 36,308 9.7 11.2 3.0% 36,308 59,565 LU 6.1 6.5 1.1% 8,723 10,550 LV 28,488 6.8 7.0 0.7% 28,488 31,807 MT 1.9 2.3 3.9% 2,753 5,235 NL 109.5 111.5 0.4% 156,009 166,132 PL 250,229 140.0 156.9 2.3% 250,229 368,909 PT 64,458 46.1 48.4 1.0% 64,458 76,315 RO 20,736 46.7 52.0 2.2% 20,736 29,827 SE 129.5 130.3 0.1% 184,552 188,534 SI 16,425 12.9 14.0 1.7% 16,425 21,797 SK 25.0 27.5 1.9% 35,676 49,112 Total 3,252,770 2,568 2,612 0.3% 3,662,515 3,879,169
20 https://www.gegridsolutions.com/hvmv_equipment/catalog/power_transformers.htm, accessed 20 Sep 2021. 21 https://www.eia.gov/international/data/world/electricity/electricity-consumption?pd=2&p=0000002&u=0&f=A&v=mapbubble&a=-&i=none&vo=value&t=C&g=00000000000000000000000000000000000000000000000001&l=249-ruvvvvvfvtvnvv1vrvvvvfvvvvvvfvvvou20evvvvvvvvvvnvvvs0008&s=315532800000&e=1546300800000&, accessed 20 Sep 2021. 22 https://www.gegridsolutions.com/hvmv_equipment/catalog/power_transformers.htm, accessed 20 Sep 2021. 23 https://www.eia.gov/international/data/world/electricity/electricity-consumption?pd=2&p=0000002&u=0&f=A&v=mapbubble&a=-&i=none&vo=value&t=C&g=00000000000000000000000000000000000000000000000001&l=249-ruvvvvvfvtvnvv1vrvvvvfvvvvvvfvvvou20evvvvvvvvvvnvvvs0008&s=315532800000&e=1546300800000&, accessed 20 Sep 2021.
EU CYBERSECURITY MARKET ANALYSIS April 2022
19
2.5.1.2 Adoption of IoT devices in MV/LV transformers in the EU-27 There are two adoption rationales behind the inclusion of IoT devices in MV/LV transformers as to respond to the growing trend of grid digitalisation, these being:
1. The adoption of new transformers with “smart” capabilities (e.g. remote operation, data sharing with utilities’ control centres).
2. Upgrading existing MV/LV transformers to enable “smart” capabilities, which is often referred to as retrofit solutions.
2.5.1.3 Adoption of IoT devices in MV/LV transformers in the EU-27 (new “smart” transformers) On the basis of market research, three drivers for the installation of new “smart” transformers can be identified in the product portfolios of multiple asset providers (e.g. General Electric24) in distribution grids:
1. MV/LV “smart” transformers that are installed to meet the growing demand for transformers due to of electricity consumption growth: These are mainly assets that are installed to cope with a growing electricity demand and/or network expansion. This figure is calculated based on the projection illustrated by Table 3.
2. MV/LV “smart” transformers that are installed to substitute failing assets: These are mainly assets that are installed to replace failing assets. A failure rate of 0.3% of the installed transformers per year is assumed, complemented by 36% of transformers that cannot be economically fixed and need replacement.25
3. MV/LV “smart” transformers that are installed to substitute assets that have arrived at the end of its lifespan: This is mainly equipment that has met its lifespan and needs replacement. We assume an average lifespan of 35 years for a MV/LV transformer.26
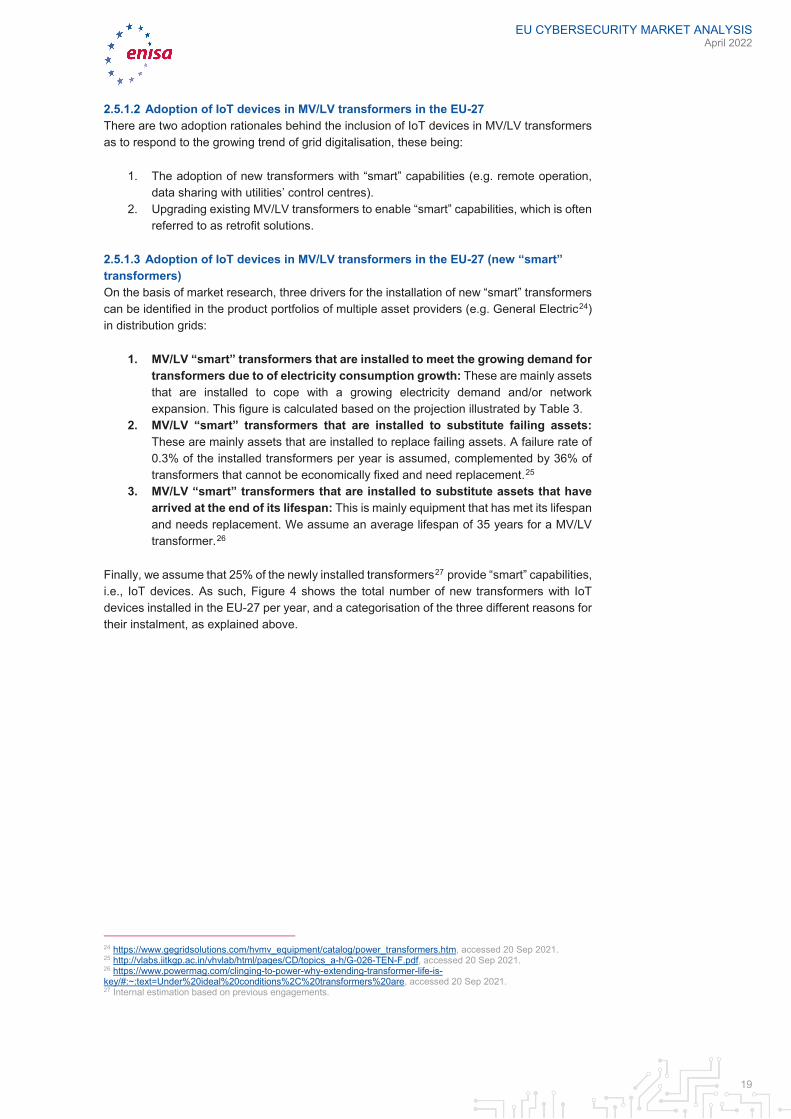
Finally, we assume that 25% of the newly installed transformers27 provide “smart” capabilities, i.e., IoT devices. As such, Figure 4 shows the total number of new transformers with IoT devices installed in the EU-27 per year, and a categorisation of the three different reasons for their instalment, as explained above.
24 https://www.gegridsolutions.com/hvmv_equipment/catalog/power_transformers.htm, accessed 20 Sep 2021. 25 http://vlabs.iitkgp.ac.in/vhvlab/html/pages/CD/topics_a-h/G-026-TEN-F.pdf, accessed 20 Sep 2021. 26 https://www.powermag.com/clinging-to-power-why-extending-transformer-life-is-key/#:~:text=Under%20ideal%20conditions%2C%20transformers%20are, accessed 20 Sep 2021. 27 Internal estimation based on previous engagements.
EU CYBERSECURITY MARKET ANALYSIS April 2022
20
Figure 4: Number of MV/LV transformers replaced in the EU 27 - Replacement reasons (%) per FY28
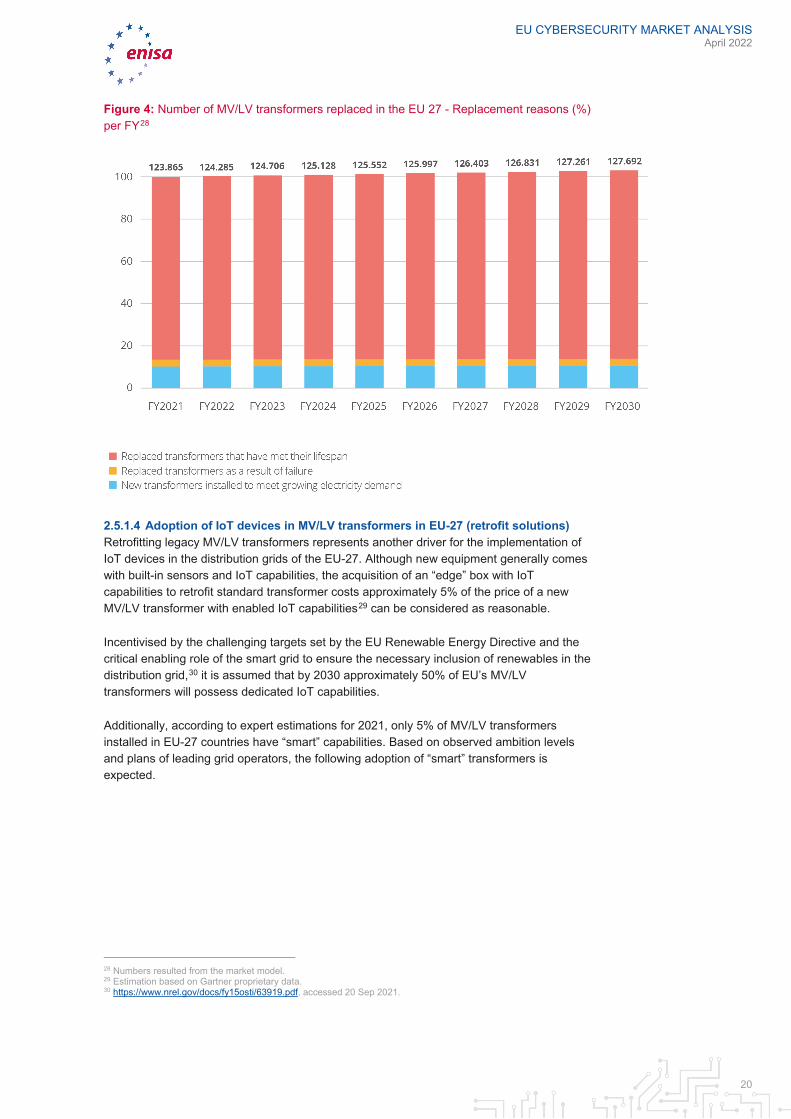
2.5.1.4 Adoption of IoT devices in MV/LV transformers in EU-27 (retrofit solutions) Retrofitting legacy MV/LV transformers represents another driver for the implementation of IoT devices in the distribution grids of the EU-27. Although new equipment generally comes with built-in sensors and IoT capabilities, the acquisition of an “edge” box with IoT capabilities to retrofit standard transformer costs approximately 5% of the price of a new MV/LV transformer with enabled IoT capabilities29 can be considered as reasonable.
Incentivised by the challenging targets set by the EU Renewable Energy Directive and the critical enabling role of the smart grid to ensure the necessary inclusion of renewables in the distribution grid,30 it is assumed that by 2030 approximately 50% of EU’s MV/LV transformers will possess dedicated IoT capabilities.
Additionally, according to expert estimations for 2021, only 5% of MV/LV transformers installed in EU-27 countries have “smart” capabilities. Based on observed ambition levels and plans of leading grid operators, the following adoption of “smart” transformers is expected.
28 Numbers resulted from the market model. 29 Estimation based on Gartner proprietary data. 30 https://www.nrel.gov/docs/fy15osti/63919.pdf, accessed 20 Sep 2021.
EU CYBERSECURITY MARKET ANALYSIS April 2022
21
Figure 5: Estimated adoption of retrofitted MV/LV transformers - Replacement reasons (%) per FY
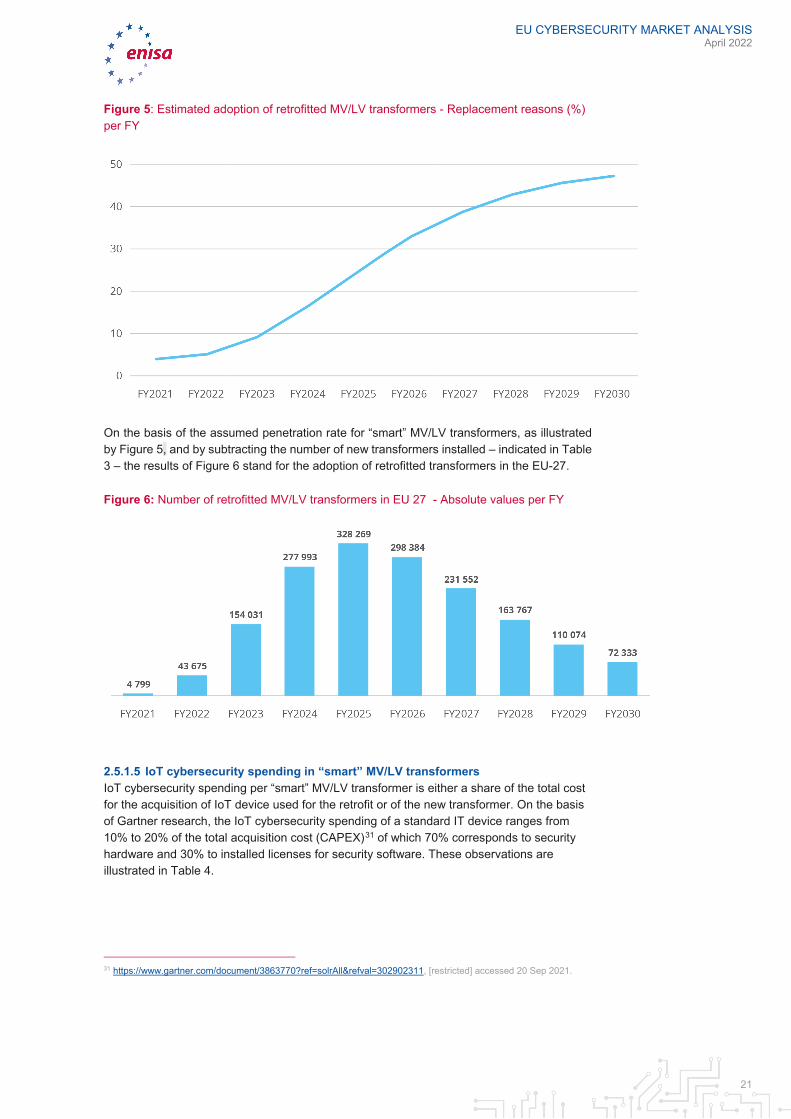
On the basis of the assumed penetration rate for “smart” MV/LV transformers, as illustrated by Figure 5, and by subtracting the number of new transformers installed – indicated in Table 3 – the results of Figure 6 stand for the adoption of retrofitted transformers in the EU-27.
Figure 6: Number of retrofitted MV/LV transformers in EU 27 - Absolute values per FY
2.5.1.5 IoT cybersecurity spending in “smart” MV/LV transformers IoT cybersecurity spending per “smart” MV/LV transformer is either a share of the total cost for the acquisition of IoT device used for the retrofit or of the new transformer. On the basis of Gartner research, the IoT cybersecurity spending of a standard IT device ranges from 10% to 20% of the total acquisition cost (CAPEX)31 of which 70% corresponds to security hardware and 30% to installed licenses for security software. These observations are illustrated in Table 4.
31 https://www.gartner.com/document/3863770?ref=solrAll&refval=302902311, [restricted] accessed 20 Sep 2021.
EU CYBERSECURITY MARKET ANALYSIS April 2022
22
Furthermore, the operational expenditure (OPEX) is derived from the maintenance of security software installed in IoT devices (e.g. software patches), which are estimated to represent 20% of the total acquisition costs.32
Table 4: Estimated IoT cybersecurity spending data per “smart” transformer
Factor Value
Data Processing Unit (DPU) price retrofitted transformer CAPEX (€)33 600
DPU price new transformer CAPEX (€) 480
Cybersecurity related spending (% of CAPEX DPU price) 15%
HW security spending (% of total security spending) 70%
SW security spending (% of total security spending) 30%
SW maintenance spending (% of SW security spending) 20%
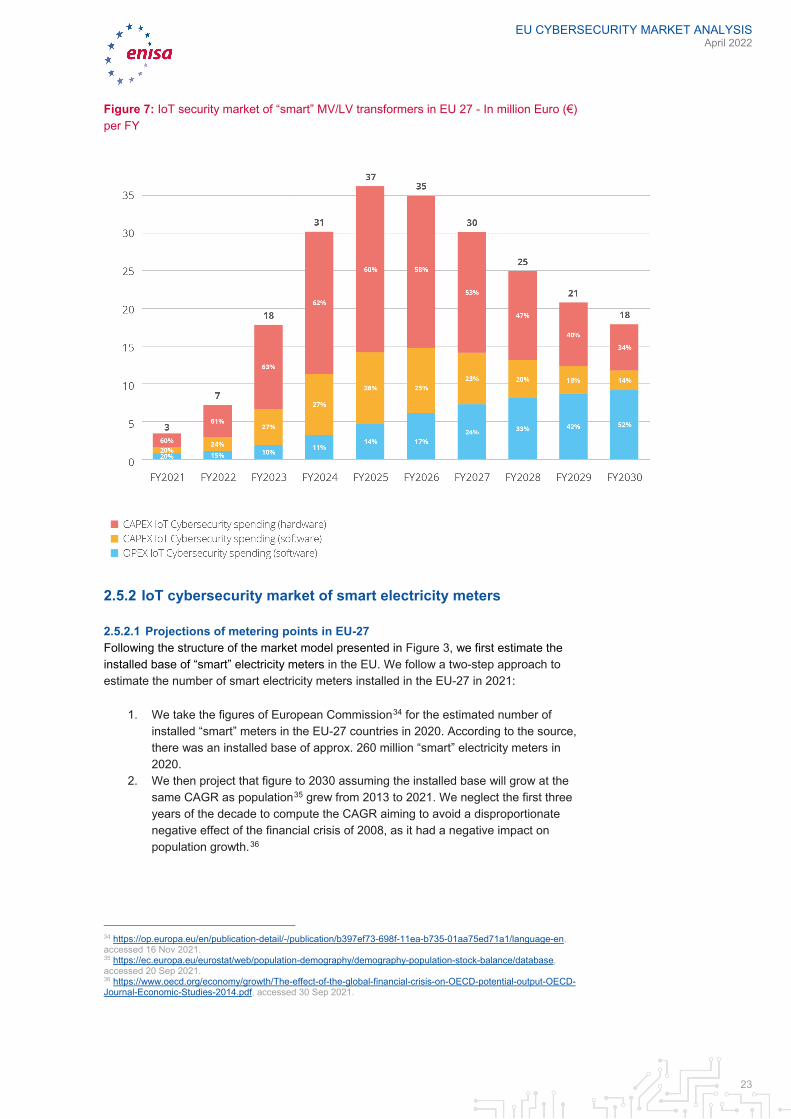
Figure 7 shows the estimated market size of IoT cybersecurity for “smart” MV/LV transformers. We expect that policies adopted by the EU with regard to clean energy generation, combined with the growing cybersecurity threats faced by the utilities industry, will have a significant impact on the IoT cybersecurity market.
32 https://www.brainsell.com/blog/maintenance-fees-what-are-you-actually-paying-for/#:~:text=The%20Software%20maintenance%20fee%20is,the%20license%20cost%20per%20year., accessed 20 Sep 2021. 33 Estimation based on Gartner proprietary data.
EU CYBERSECURITY MARKET ANALYSIS April 2022
23
Figure 7: IoT security market of “smart” MV/LV transformers in EU 27 - In million Euro (€) per FY
2.5.2 IoT cybersecurity market of smart electricity meters
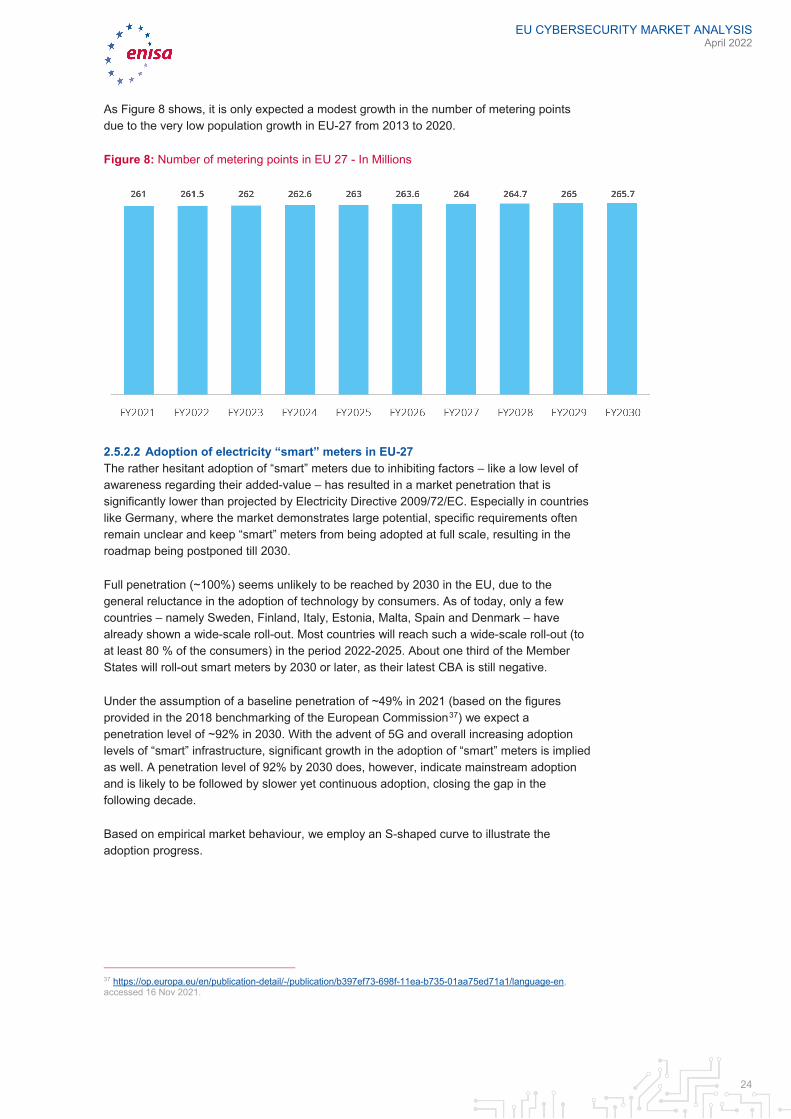
2.5.2.1 Projections of metering points in EU-27 Following the structure of the market model presented in Figure 3, we first estimate the installed base of “smart” electricity meters in the EU. We follow a two-step approach to estimate the number of smart electricity meters installed in the EU-27 in 2021:
1. We take the figures of European Commission34 for the estimated number of installed “smart” meters in the EU-27 countries in 2020. According to the source, there was an installed base of approx. 260 million “smart” electricity meters in 2020.
2. We then project that figure to 2030 assuming the installed base will grow at the same CAGR as population35 grew from 2013 to 2021. We neglect the first three years of the decade to compute the CAGR aiming to avoid a disproportionate negative effect of the financial crisis of 2008, as it had a negative impact on population growth.36
34 https://op.europa.eu/en/publication-detail/-/publication/b397ef73-698f-11ea-b735-01aa75ed71a1/language-en, accessed 16 Nov 2021. 35 https://ec.europa.eu/eurostat/web/population-demography/demography-population-stock-balance/database, accessed 20 Sep 2021. 36 https://www.oecd.org/economy/growth/The-effect-of-the-global-financial-crisis-on-OECD-potential-output-OECD-Journal-Economic-Studies-2014.pdf, accessed 30 Sep 2021.
EU CYBERSECURITY MARKET ANALYSIS April 2022
24
As Figure 8 shows, it is only expected a modest growth in the number of metering points due to the very low population growth in EU-27 from 2013 to 2020.
Figure 8: Number of metering points in EU 27 - In Millions
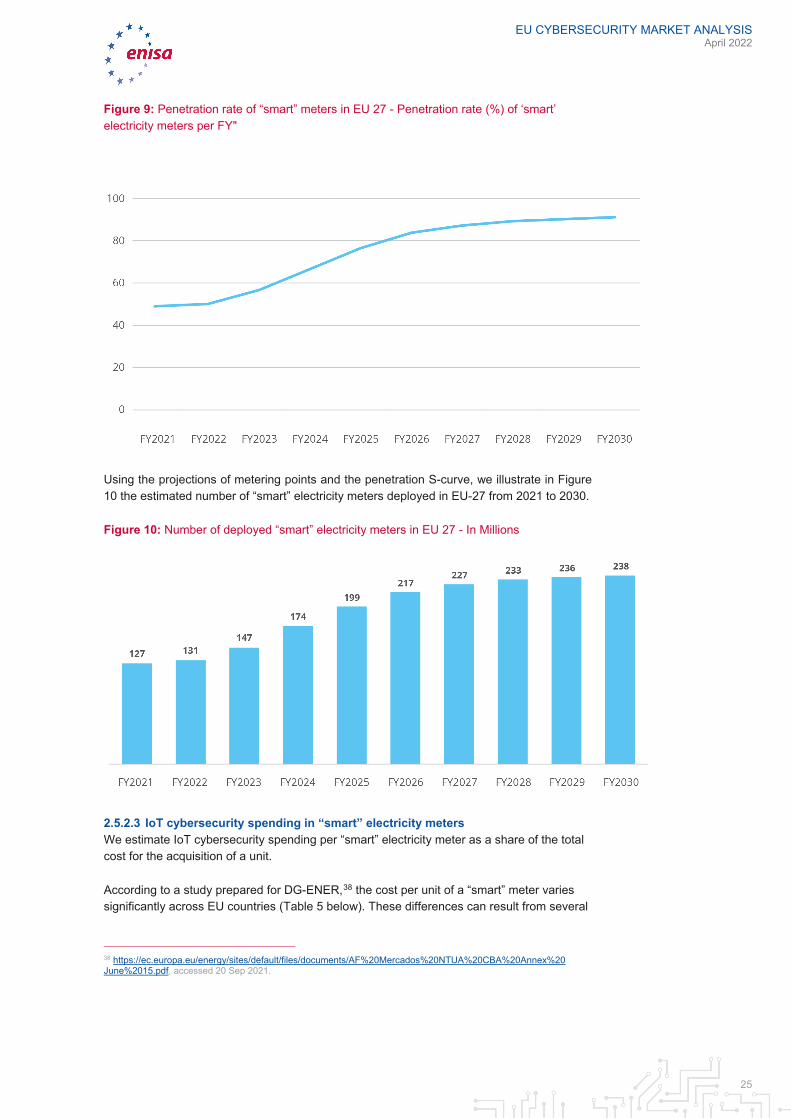
2.5.2.2 Adoption of electricity “smart” meters in EU-27 The rather hesitant adoption of “smart” meters due to inhibiting factors – like a low level of awareness regarding their added-value – has resulted in a market penetration that is significantly lower than projected by Electricity Directive 2009/72/EC. Especially in countries like Germany, where the market demonstrates large potential, specific requirements often remain unclear and keep “smart” meters from being adopted at full scale, resulting in the roadmap being postponed till 2030.
Full penetration (~100%) seems unlikely to be reached by 2030 in the EU, due to the general reluctance in the adoption of technology by consumers. As of today, only a few countries – namely Sweden, Finland, Italy, Estonia, Malta, Spain and Denmark – have already shown a wide-scale roll-out. Most countries will reach such a wide-scale roll-out (to at least 80 % of the consumers) in the period 2022-2025. About one third of the Member States will roll-out smart meters by 2030 or later, as their latest CBA is still negative.
Under the assumption of a baseline penetration of ~49% in 2021 (based on the figures provided in the 2018 benchmarking of the European Commission37) we expect a penetration level of ~92% in 2030. With the advent of 5G and overall increasing adoption levels of “smart” infrastructure, significant growth in the adoption of “smart” meters is implied as well. A penetration level of 92% by 2030 does, however, indicate mainstream adoption and is likely to be followed by slower yet continuous adoption, closing the gap in the following decade.
Based on empirical market behaviour, we employ an S-shaped curve to illustrate the adoption progress.
37 https://op.europa.eu/en/publication-detail/-/publication/b397ef73-698f-11ea-b735-01aa75ed71a1/language-en, accessed 16 Nov 2021.
EU CYBERSECURITY MARKET ANALYSIS April 2022
25
Figure 9: Penetration rate of “smart” meters in EU 27 - Penetration rate (%) of ‘smart’ electricity meters per FY"
Using the projections of metering points and the penetration S-curve, we illustrate in Figure 10 the estimated number of “smart” electricity meters deployed in EU-27 from 2021 to 2030.
Figure 10: Number of deployed “smart” electricity meters in EU 27 - In Millions
2.5.2.3 IoT cybersecurity spending in “smart” electricity meters We estimate IoT cybersecurity spending per “smart” electricity meter as a share of the total cost for the acquisition of a unit.
According to a study prepared for DG-ENER,38 the cost per unit of a “smart” meter varies significantly across EU countries (Table 5 below). These differences can result from several
38 https://ec.europa.eu/energy/sites/default/files/documents/AF%20Mercados%20NTUA%20CBA%20Annex%20 June%2015.pdf, accessed 20 Sep 2021.
EU CYBERSECURITY MARKET ANALYSIS April 2022
26
factors, such as the functionalities covered by the device (e.g. existence of a display) or the contractual agreements between countries and manufacturers.
To keep the following model concise, we assume Hungary’s cost per unit for all EU-27 countries because it represents the median of the sample covered in the study.39
Table 5: Cost of a “smart” electricity meter
Germany Hungary Portugal Slovakia Romania Belgium
Acquisition cost per unit (€)
145 96 56 92 75 194
We then assume that IoT cybersecurity spending accounts for 10% to 20% of the total acquisition cost (CAPEX) of which 70% correspond to security hardware and 30% to licenses for security software that is installed on the IoT device. Refer to Table 6 for the corresponding data.
Operational expenditures (OPEX) resulting from maintaining the security software installed on IoT devices (e.g. software patches), are estimated to represent 20% of the total acquisition costs.40
Table 6: IoT cybersecurity spending data per smart meters
Factor Value
Cybersecurity related spending (% of CAPEX DPU price) 31 15%
HW security spending (% of total security spending)31 70%
SW security spending (% of total security spending)31 30%
SW maintenance spending (% of SW security spending)32 20%
39 Ibid. 40 https://www.brainsell.com/blog/maintenance-fees-what-are-you-actually-paying-for/#:~:text=The%20Software%20maintenance%20fee%20is,the%20license%20cost%20per%20year., accessed 20 Sep 2021.
EU CYBERSECURITY MARKET ANALYSIS April 2022
27
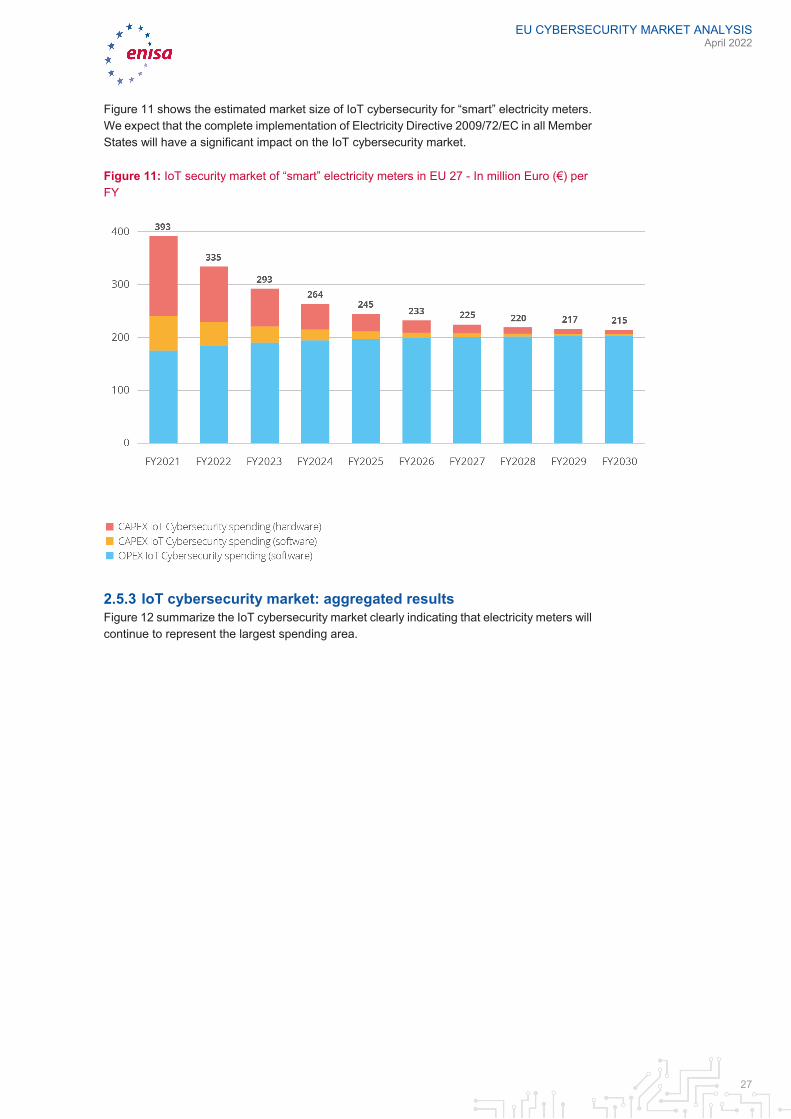
Figure 11 shows the estimated market size of IoT cybersecurity for “smart” electricity meters. We expect that the complete implementation of Electricity Directive 2009/72/EC in all Member States will have a significant impact on the IoT cybersecurity market.
Figure 11: IoT security market of “smart” electricity meters in EU 27 - In million Euro (€) per FY
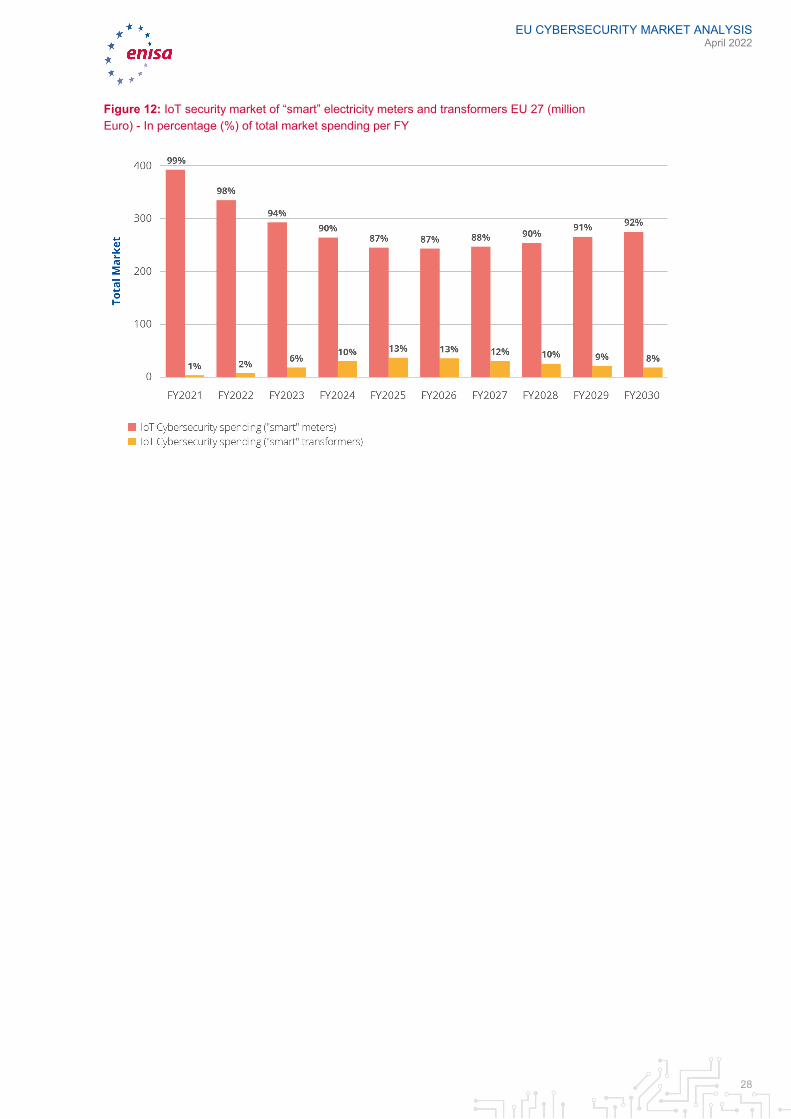
2.5.3 IoT cybersecurity market: aggregated results Figure 12 summarize the IoT cybersecurity market clearly indicating that electricity meters will continue to represent the largest spending area.
EU CYBERSECURITY MARKET ANALYSIS April 2022
28
Figure 12: IoT security market of “smart” electricity meters and transformers EU 27 (million Euro) - In percentage (%) of total market spending per FY
EU CYBERSECURITY MARKET ANALYSIS April 2022
29
3. DEMAND-SIDE RESEARCH
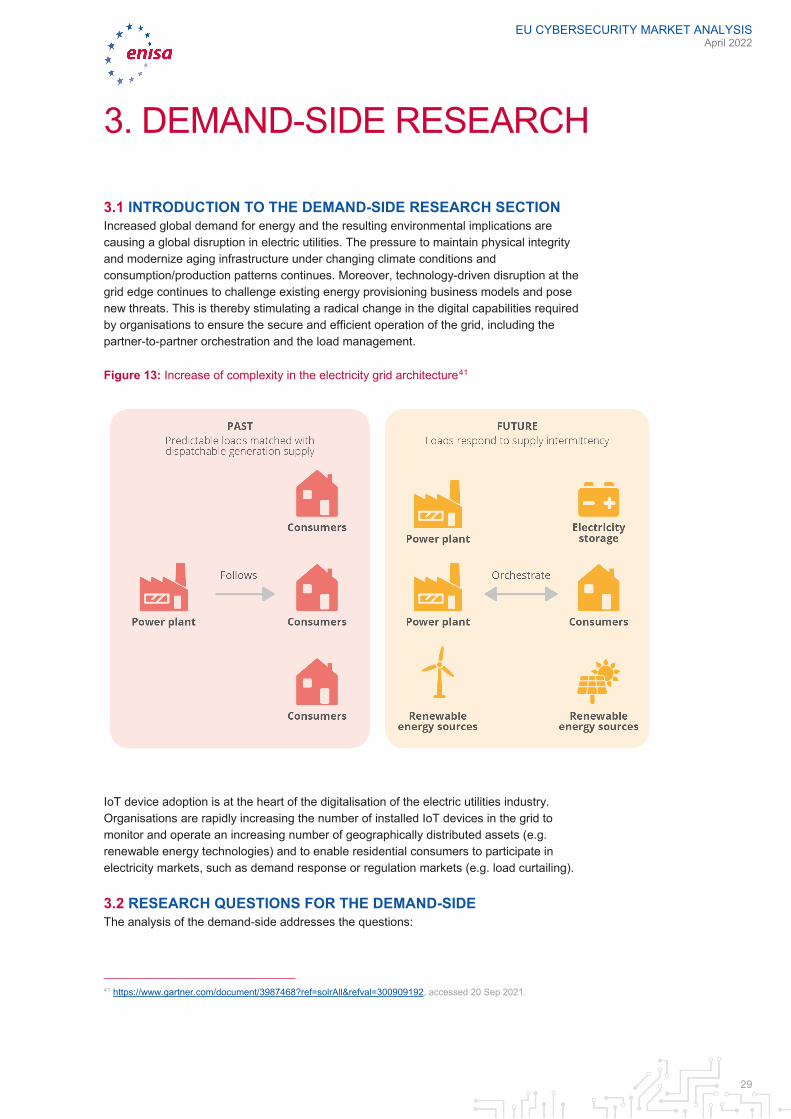
3.1 INTRODUCTION TO THE DEMAND-SIDE RESEARCH SECTION Increased global demand for energy and the resulting environmental implications are causing a global disruption in electric utilities. The pressure to maintain physical integrity and modernize aging infrastructure under changing climate conditions and consumption/production patterns continues. Moreover, technology-driven disruption at the grid edge continues to challenge existing energy provisioning business models and pose new threats. This is thereby stimulating a radical change in the digital capabilities required by organisations to ensure the secure and efficient operation of the grid, including the partner-to-partner orchestration and the load management.
Figure 13: Increase of complexity in the electricity grid architecture41
IoT device adoption is at the heart of the digitalisation of the electric utilities industry. Organisations are rapidly increasing the number of installed IoT devices in the grid to monitor and operate an increasing number of geographically distributed assets (e.g. renewable energy technologies) and to enable residential consumers to participate in electricity markets, such as demand response or regulation markets (e.g. load curtailing).
3.2 RESEARCH QUESTIONS FOR THE DEMAND-SIDE The analysis of the demand-side addresses the questions:
41 https://www.gartner.com/document/3987468?ref=solrAll&refval=300909192, accessed 20 Sep 2021.
EU CYBERSECURITY MARKET ANALYSIS April 2022
30
1) Which are the main trends in the demand of IoT cybersecurity in the distribution grids?
2) Which drivers can be identified for IoT cybersecurity adoption in the distribution grids?
3.3 METHODOLOGY OF THE DEMAND-SIDE RESEARCH The analysis of the demand-side of the IoT cybersecurity market is performed by taking into account the trends and the key reasons for consumers of IoT cybersecurity (e.g. utilities) to purchase IoT cybersecurity services or products; in other words to assume provision of Hardware and Software, Distribution (of hardware and software), but also advisory & consulting, Implementation services, managed services, and R&D and education, which are all elements of the value stack42 for this market segment.
3.4 MARKET TRENDS ON THE DEMAND-SIDE With widespread IoT deployments across grids and consumption points, it remains a fundamental issue for many organisations to better assess the risk exposure of IoT devices.
As a result, the demand for cybersecurity tools and services aimed at improving IoT cybersecurity capabilities of organisations will be increasing in the energy industry43; the global demand for IoT cybersecurity in the energy industry is expected to grow with a 19.4% Compounded Annual Growth Rate between 2018 and 2024.
According to a global survey conducted by IBM44, organisations identify the following IoT cybersecurity threats as the top drivers to invest in IoT cybersecurity (see Figure 14). Given that the utilities industry is dominated by large players with multinational presence (e.g. Iberdrola, a Spanish utility, has presence in Europe, North and South America), we assume that the results of this survey apply as well to utilities operating in the EU.
42 See Section 2.2.2 - Cybersecurity market taxonomy, ECSMAF Version 1.0, https://www.enisa.europa.eu/publications/market-analysis-framework 43 https://www.gartner.com/document/3981757?ref=solrAll&refval=300973953, accessed 20 Sep 2021. 44 Source: IBM Institute for Business Value benchmark study, 2018.
EU CYBERSECURITY MARKET ANALYSIS April 2022
31
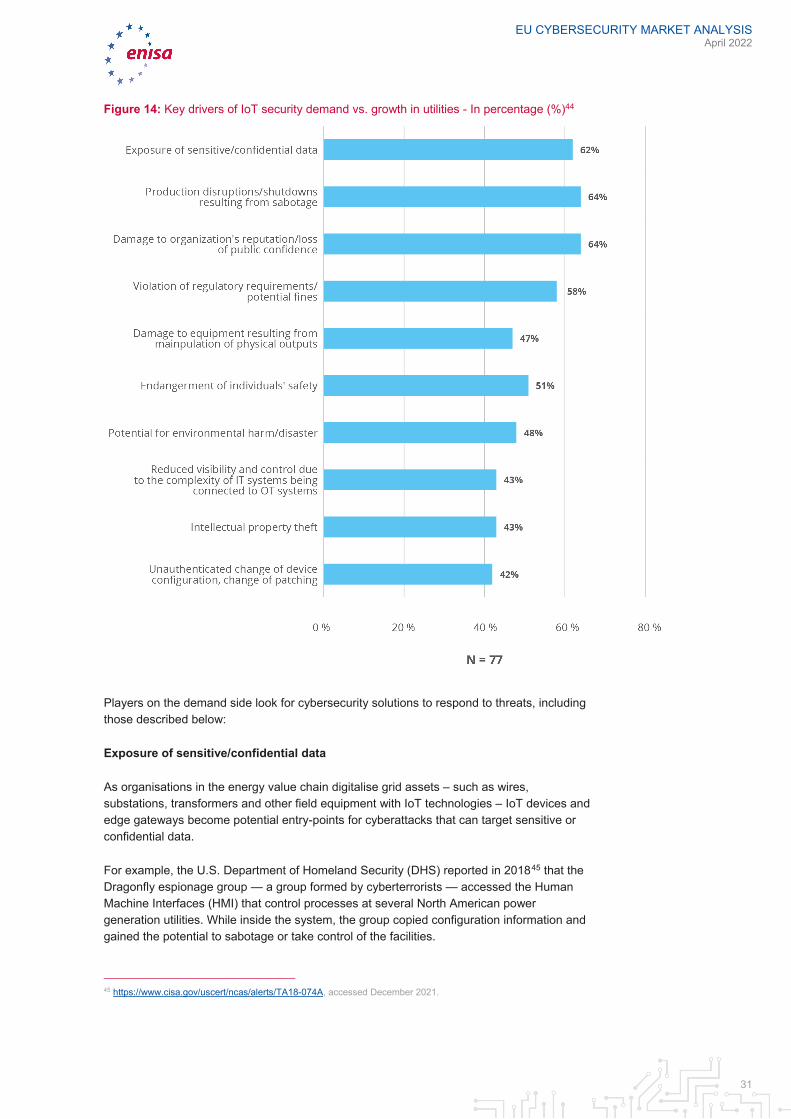
Figure 14: Key drivers of IoT security demand vs. growth in utilities - In percentage (%)44
Players on the demand side look for cybersecurity solutions to respond to threats, including those described below:
Exposure of sensitive/confidential data
As organisations in the energy value chain digitalise grid assets – such as wires, substations, transformers and other field equipment with IoT technologies – IoT devices and edge gateways become potential entry-points for cyberattacks that can target sensitive or confidential data.
For example, the U.S. Department of Homeland Security (DHS) reported in 201845 that the Dragonfly espionage group — a group formed by cyberterrorists — accessed the Human Machine Interfaces (HMI) that control processes at several North American power generation utilities. While inside the system, the group copied configuration information and gained the potential to sabotage or take control of the facilities.
45 https://www.cisa.gov/uscert/ncas/alerts/TA18-074A, accessed December 2021.
EU CYBERSECURITY MARKET ANALYSIS April 2022
32
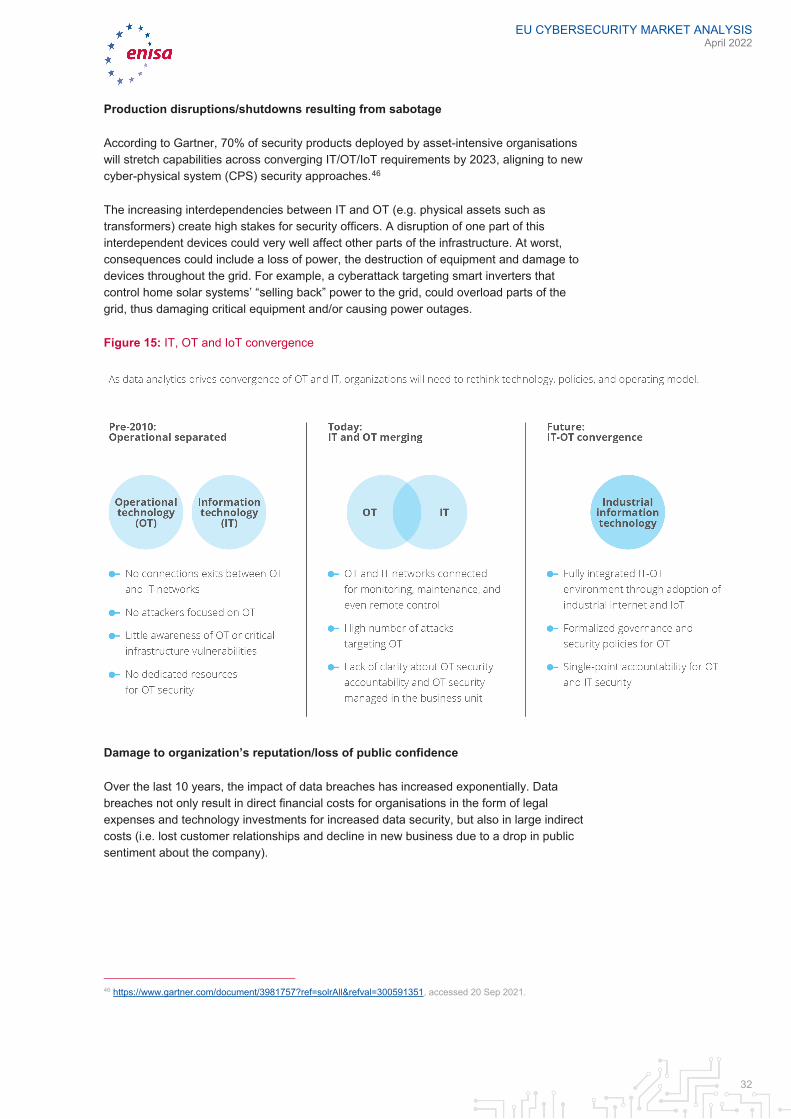
Production disruptions/shutdowns resulting from sabotage
According to Gartner, 70% of security products deployed by asset-intensive organisations will stretch capabilities across converging IT/OT/IoT requirements by 2023, aligning to new cyber-physical system (CPS) security approaches.46
The increasing interdependencies between IT and OT (e.g. physical assets such as transformers) create high stakes for security officers. A disruption of one part of this interdependent devices could very well affect other parts of the infrastructure. At worst, consequences could include a loss of power, the destruction of equipment and damage to devices throughout the grid. For example, a cyberattack targeting smart inverters that control home solar systems’ “selling back” power to the grid, could overload parts of the grid, thus damaging critical equipment and/or causing power outages.
Figure 15: IT, OT and IoT convergence
Damage to organization’s reputation/loss of public confidence
Over the last 10 years, the impact of data breaches has increased exponentially. Data breaches not only result in direct financial costs for organisations in the form of legal expenses and technology investments for increased data security, but also in large indirect costs (i.e. lost customer relationships and decline in new business due to a drop in public sentiment about the company).
46 https://www.gartner.com/document/3981757?ref=solrAll&refval=300591351, accessed 20 Sep 2021.
EU CYBERSECURITY MARKET ANALYSIS April 2022
33
Figure 16: Public sentiment index before and after security attack47
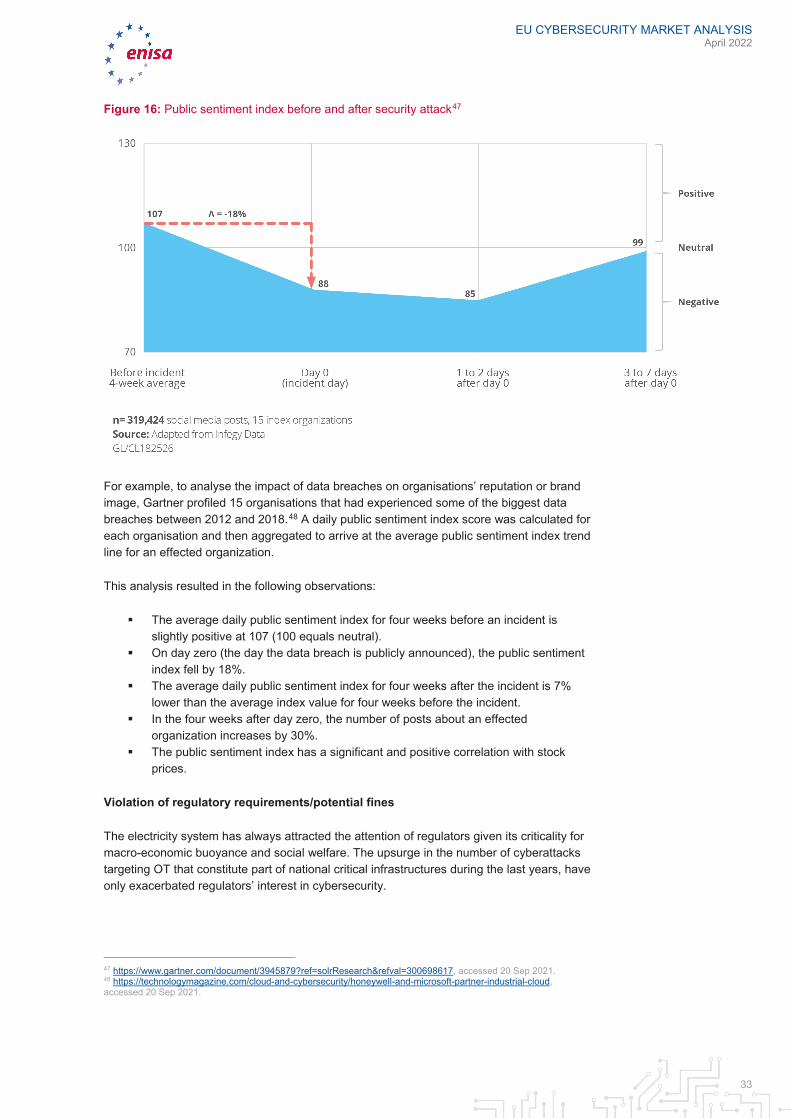
For example, to analyse the impact of data breaches on organisations’ reputation or brand image, Gartner profiled 15 organisations that had experienced some of the biggest data breaches between 2012 and 2018.48 A daily public sentiment index score was calculated for each organisation and then aggregated to arrive at the average public sentiment index trend line for an effected organization.
This analysis resulted in the following observations:
The average daily public sentiment index for four weeks before an incident is slightly positive at 107 (100 equals neutral).
On day zero (the day the data breach is publicly announced), the public sentiment index fell by 18%.
The average daily public sentiment index for four weeks after the incident is 7% lower than the average index value for four weeks before the incident.
In the four weeks after day zero, the number of posts about an effected organization increases by 30%.
The public sentiment index has a significant and positive correlation with stock prices.
Violation of regulatory requirements/potential fines
The electricity system has always attracted the attention of regulators given its criticality for macro-economic buoyance and social welfare. The upsurge in the number of cyberattacks targeting OT that constitute part of national critical infrastructures during the last years, have only exacerbated regulators’ interest in cybersecurity.
47 https://www.gartner.com/document/3945879?ref=solrResearch&refval=300698617, accessed 20 Sep 2021. 48 https://technologymagazine.com/cloud-and-cybersecurity/honeywell-and-microsoft-partner-industrial-cloud, accessed 20 Sep 2021.
EU CYBERSECURITY MARKET ANALYSIS April 2022
34
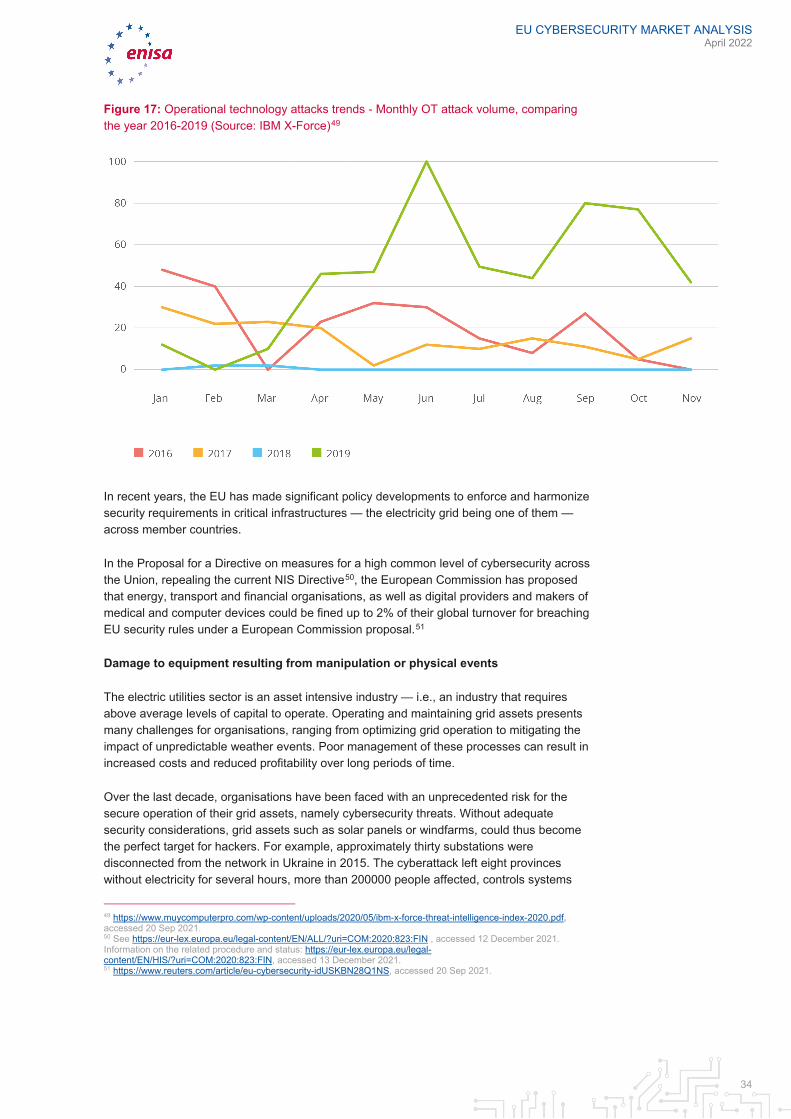
Figure 17: Operational technology attacks trends - Monthly OT attack volume, comparing the year 2016-2019 (Source: IBM X-Force)49
In recent years, the EU has made significant policy developments to enforce and harmonize security requirements in critical infrastructures — the electricity grid being one of them — across member countries.
In the Proposal for a Directive on measures for a high common level of cybersecurity across the Union, repealing the current NIS Directive50, the European Commission has proposed that energy, transport and financial organisations, as well as digital providers and makers of medical and computer devices could be fined up to 2% of their global turnover for breaching EU security rules under a European Commission proposal.51
Damage to equipment resulting from manipulation or physical events
The electric utilities sector is an asset intensive industry — i.e., an industry that requires above average levels of capital to operate. Operating and maintaining grid assets presents many challenges for organisations, ranging from optimizing grid operation to mitigating the impact of unpredictable weather events. Poor management of these processes can result in increased costs and reduced profitability over long periods of time.
Over the last decade, organisations have been faced with an unprecedented risk for the secure operation of their grid assets, namely cybersecurity threats. Without adequate security considerations, grid assets such as solar panels or windfarms, could thus become the perfect target for hackers. For example, approximately thirty substations were disconnected from the network in Ukraine in 2015. The cyberattack left eight provinces without electricity for several hours, more than 200000 people affected, controls systems
49 https://www.muycomputerpro.com/wp-content/uploads/2020/05/ibm-x-force-threat-intelligence-index-2020.pdf, accessed 20 Sep 2021. 50 See https://eur-lex.europa.eu/legal-content/EN/ALL/?uri=COM:2020:823:FIN , accessed 12 December 2021. Information on the related procedure and status: https://eur-lex.europa.eu/legal-content/EN/HIS/?uri=COM:2020:823:FIN, accessed 13 December 2021. 51 https://www.reuters.com/article/eu-cybersecurity-idUSKBN28Q1NS, accessed 20 Sep 2021.
EU CYBERSECURITY MARKET ANALYSIS April 2022
35
were physically damaged, and the operations of the grid were affected for several weeks after the attack.52
Endangerment of individuals’ safety
Advanced data sharing capabilities across OT systems enabled by IoT devices also implies that today’s control systems are more vulnerable to cyberthreats due to the increased interconnectivity, cloud computing and enhanced hacker skills. Although cyberattackers’ attention has traditionally been focused on enterprise IT systems, malicious attention is now increasingly turning to control systems.
Cyberattacks to control systems not only endanger the safety of energy assets, but also the lives of individuals and workers. For example, a cyberattack in 1999 to the control systems of a gas pipeline resulted in three deaths and eight injured after malicious actors caused the pipeline to rupture near Bellingham, Washington, flooding two local creeks with 237,000 gallons of gasoline.
Potential for environmental harm/disaster
IoT devices also pose a pollution liability risk. In the event malicious access to the control systems that manage the operation of grid or generation assets, significant environmental damage can be caused by the adversary.
For example, an employee laid off by Chevron, an oil company, deactivated the company's incident alert system by hacking into the computers in charge of the system. The intrusion was only discovered when an emergency occurred at a Chevron refinery in Richmond which exposed thousands of people living in proximity to toxic substance for several hours.53
Reduced visibility and control due to the complexity of IT systems being connected to OT systems
According to Forrester, 82% of organisations are not able to identify all the devices connected to their network54 and this problem is only expected to grow. Utilities are the industry that use highest number of IoT endpoints, totalling 1.17 billion endpoints in 2019, and increasing by 17% in 2020 to reach 1.37 billion endpoints55 (mainly driven by widespread adoption of smart meters).
The key issue for organisations with these vulnerable IoT endpoints is that they may become access points for cyber attackers, even without realising such security breach has occurred.
For example, a recent security research at a wind-turbine farm indicated that physical vulnerabilities and a lack of network security allowed researchers to traverse the entire wind farm’s network within minutes. They have identified misconfiguration of access privileges that would have enabled them to cause revenue losses of anywhere from $10,000 to $30,000 per hour or even destroy the turbines entirely.56
52 https://ecs-org.eu/documents/publications/5fdb2673903c6.pdf, accessed 20 Sep 2021. 53 https://ecs-org.eu/documents/publications/5fdb2673903c6.pdf, accessed 20 Sep 2021. 54 https://www.csoonline.com/article/3262968/eliminate-the-iot-security-blind-spot.html, accessed 20 Sep 2021. 55 https://www.gartner.com/en/newsroom/press-releases/2019-08-29-gartner-says-5-8-billion-enterprise-and-automotive-io, accessed 20 Sep 2021. 56 https://www.blackhat.com/docs/us-17/wednesday/us-17-Staggs-Adventures-In-Attacking-Wind-Farm-Control-Networks.pdf, accessed 20 Sep 2021.
EU CYBERSECURITY MARKET ANALYSIS April 2022
36
Intellectual property theft
Beyond the theft of customer data, regulatory fines and reputational damage are other less-obvious costs for organisations that may result from cyberattacks. The theft of intellectual property (IP) is an example hereto.
For example, in 2011 Night Dragon, a series of cyber-attacks, stole confidential information from large oil players. The list of affected organisations included big, traditional players of this industry, such as Exxon Mobil, Royal Dutch Shell and BP. The cyber-attacks took gigabytes of highly sensitive internal documents, including proprietary information about oil- and gas-field operations, project financing, and bidding documents.57
Additional user requirements
It must be noted, than this analysis of trends and drivers should not be considered as exhaustive. The trends and drivers mentioned in this Chapter are only those that more clearly emerged from the analysis conducted for this PoC, which, as explained earlier in this report, was based mainly on already available data. By focusing on cybersecurity, this analysis did not specifically focus on data protection. Additional primary research (i.e. surveys) could lead to the identification of additional trends and drivers on the demand side, regarding specifically privacy issues. This is particularly relevant, given the variation of privacy requirements among various states at international level.
Besides cybersecurity solutions to respond to the above threats, some best practices for cyber-security and privacy of the smart metering systems58 together with cybersecurity baseline requirements have been developed by relevant associations59. One can assume that the implementation of such good practices helps reducing the exposure to the threats considered in this chapter.
57 https://isssource.com/%E2%80%98night-dragon%E2%80%99-cyber-attacks-big-oil/, accessed 20 Sep 2021. 58 2012/148/EU: Commission Recommendation of 9 March 2012 on preparations for the roll-out of smart metering systems, https://eur-lex.europa.eu/legal-content/EN/ALL/?uri=celex:32012H0148 , accessed 1 February 2022, and European Commission, Best Available Techniques Reference Document for the cyber-security and privacy of the 10 minimum functional requirements of the Smart Metering Systems, https://ec.europa.eu/energy/sites/ener/files/documents/bat_wp4_bref_smart-metering_systems_final_deliverable.pdf , accessed 1 February 2022. 59 Such as the European Smart Metering Infrastructure Group (ESMIG), and the European Network for Cybersecurity (ENCS) together with the European Distribution System Operators (E.DSO).
EU CYBERSECURITY MARKET ANALYSIS April 2022
37
4. SUPPLY-SIDE RESEARCH
4.1 INTRODUCTION TO THE SUPPLY-SIDE ANALYSIS The following sections present the research questions formulated for the supply-side analysis, the methodology used, the archetypes of suppliers, as well as the trends identified on the supply side.
4.2 RESEARCH QUESTIONS FOR THE SUPPLY-SIDE ANALYSIS The analysis of the supply-side addresses the following research questions:
1. Which are the main archetypes of vendors in the global and EU market of IoT cybersecurity products/services for distribution electricity grids?
2. What kind of IoT functional solutions/services is each archetype of vendors providing to the market?
3. What kind of IoT cybersecurity solutions/services is each archetype of vendors providing to the market?
4. How does the product portfolio of representative vendors look like? 5. What is the level of engagement of EU-headquartered and/or owned companies in
this market? 6. How does the market look like in terms of supply (competitiveness, market power,
etc.)? 7. Which areas of this market have the biggest potential for expansion or
improvement? 8. Which are the main trends on the supply-side?
4.3 METHODOLOGY OF THE SUPPLY-SIDE ANALYSIS The analysis of the supply-side of the IoT cybersecurity market in distribution electricity grids is structured in two different parts:
1. Analysis of key trends and competitive behaviours of key archetypes of suppliers of IoT cybersecurity solutions or services.
2. Competitive profiles of selected vendors/suppliers of IoT cybersecurity solutions/products.
It is important to highlight that the list of representative vendors below is not exhaustive and more companies might be taken into account from the supply side. The objective of this section is not to provide an exhaustive list of market players for each archetype, but rather to analyse key trends emerging in the supply-side of the IoT cybersecurity market. Due to resource constraints, the selection of vendors in this analysis was based only on available data sources.
The selection of representative vendors was based on industry experts’ opinions, estimated revenue sizes and product innovation approaches provided by Gartner.
4.4 ARCHETYPES OF SUPPLIERS Four different archetypes of suppliers/vendors of IoT cybersecurity solutions or services have been identified in the IoT cybersecurity market:
EU CYBERSECURITY MARKET ANALYSIS April 2022
38
1. Multi-domain industrial assets vendors: Covers traditional vendors of assets, equipment and OT systems that have expanded their market portfolio towards digitalised solutions and services.
2. Multi-domain IT vendors: Covers large providers of IT solutions and/or services that have expanded their offerings into the IoT cybersecurity market.
3. Specialist IoT vendors: Covers vendors of IoT solutions looking to complement the capabilities of their IoT solutions with IoT cybersecurity capabilities.
4. IoT cybersecurity specialist vendors: Covers market vendors in IoT cybersecurity that first entered the market with dedicated IoT cybersecurity offerings.
4.4.1 Multi-domain industrial assets vendors
Multi-domain industrial assets vendors are established operations technology original equipment manufacturers (OT OEMs) with decades of experience in industrial control and automation systems, machine-to-machine, as well as supervisory control and data acquisition (SCADA) solutions. These vendors tend to cover a wide spectrum of IoT components and are capable to satisfy diverse requirements of large clients across markets and regions. Some of these vendors have already recognised the need to digitalize their core business and are actively adding digital capabilities to the industrial services and assets that they traditionally supply. While they may lag behind other players (e.g. Multi-domain IT vendors) with respect to digital capabilities, they often have a better understanding of the operational requirements of vertical industries due to their long-standing relation as providers of industrial assets and O&M services. For example General Electric, a large North American industrial group, launched GE Digital in 2015. This company segment is specialised in software and IT services for industrial players, such as security managed IT services or predictive maintenance software.60
60 https://www.ge.com/digital/, accessed 20 Sep 2021.
EU CYBERSECURITY MARKET ANALYSIS April 2022
39
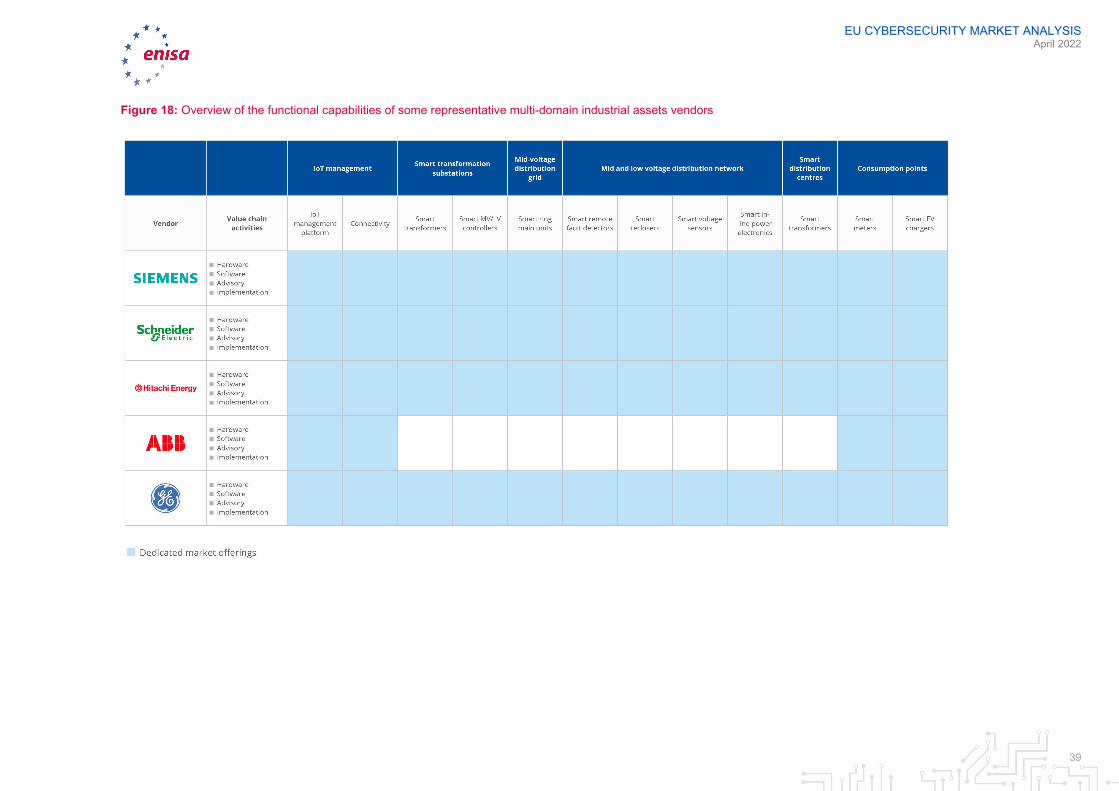
Figure 18: Overview of the functional capabilities of some representative multi-domain industrial assets vendors
EU CYBERSECURITY MARKET ANALYSIS April 2022
40
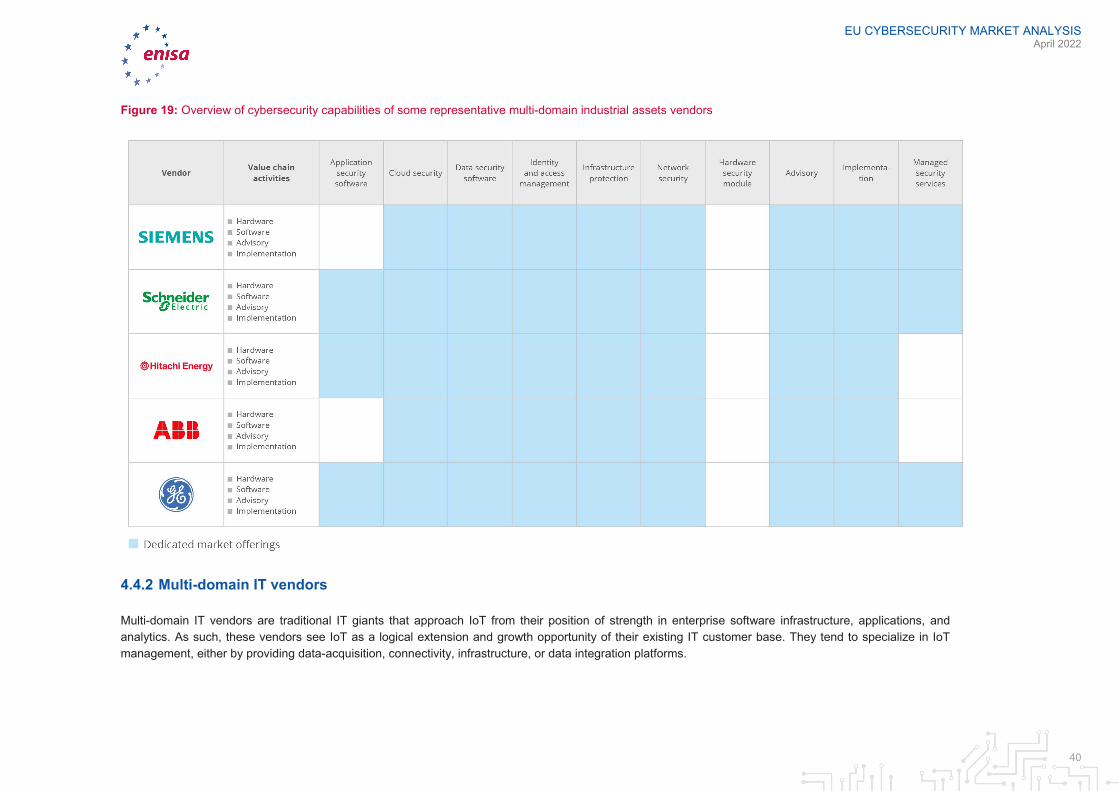
Figure 19: Overview of cybersecurity capabilities of some representative multi-domain industrial assets vendors
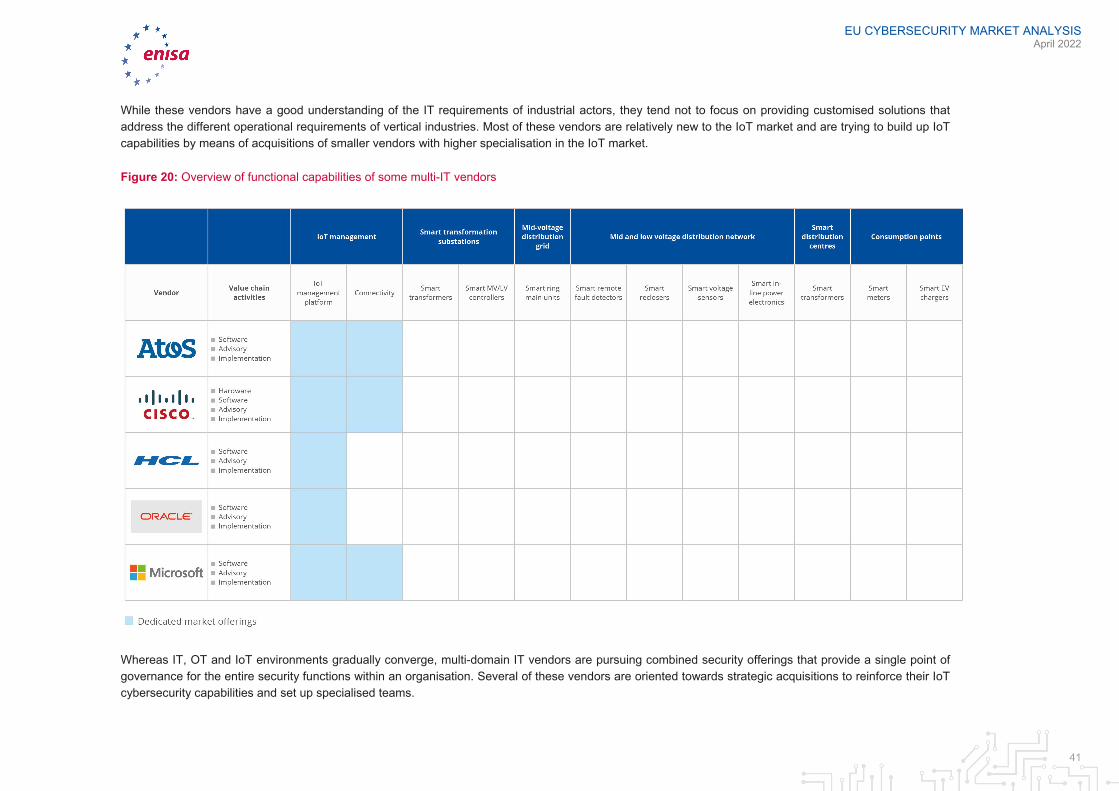
4.4.2 Multi-domain IT vendors
Multi-domain IT vendors are traditional IT giants that approach IoT from their position of strength in enterprise software infrastructure, applications, and analytics. As such, these vendors see IoT as a logical extension and growth opportunity of their existing IT customer base. They tend to specialize in IoT management, either by providing data-acquisition, connectivity, infrastructure, or data integration platforms.
EU CYBERSECURITY MARKET ANALYSIS April 2022
41
While these vendors have a good understanding of the IT requirements of industrial actors, they tend not to focus on providing customised solutions that address the different operational requirements of vertical industries. Most of these vendors are relatively new to the IoT market and are trying to build up IoT capabilities by means of acquisitions of smaller vendors with higher specialisation in the IoT market.
Figure 20: Overview of functional capabilities of some multi-IT vendors
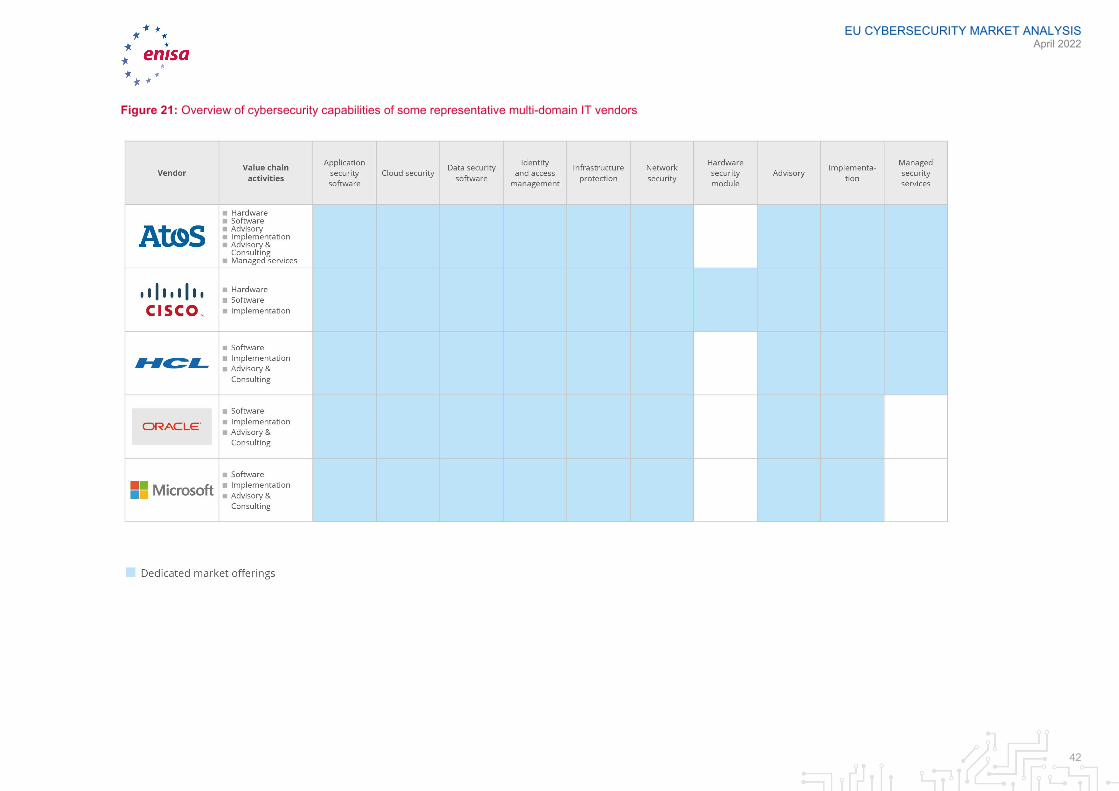
Whereas IT, OT and IoT environments gradually converge, multi-domain IT vendors are pursuing combined security offerings that provide a single point of governance for the entire security functions within an organisation. Several of these vendors are oriented towards strategic acquisitions to reinforce their IoT cybersecurity capabilities and set up specialised teams.
EU CYBERSECURITY MARKET ANALYSIS April 2022
42
Figure 21: Overview of cybersecurity capabilities of some representative multi-domain IT vendors
EU CYBERSECURITY MARKET ANALYSIS April 2022
43
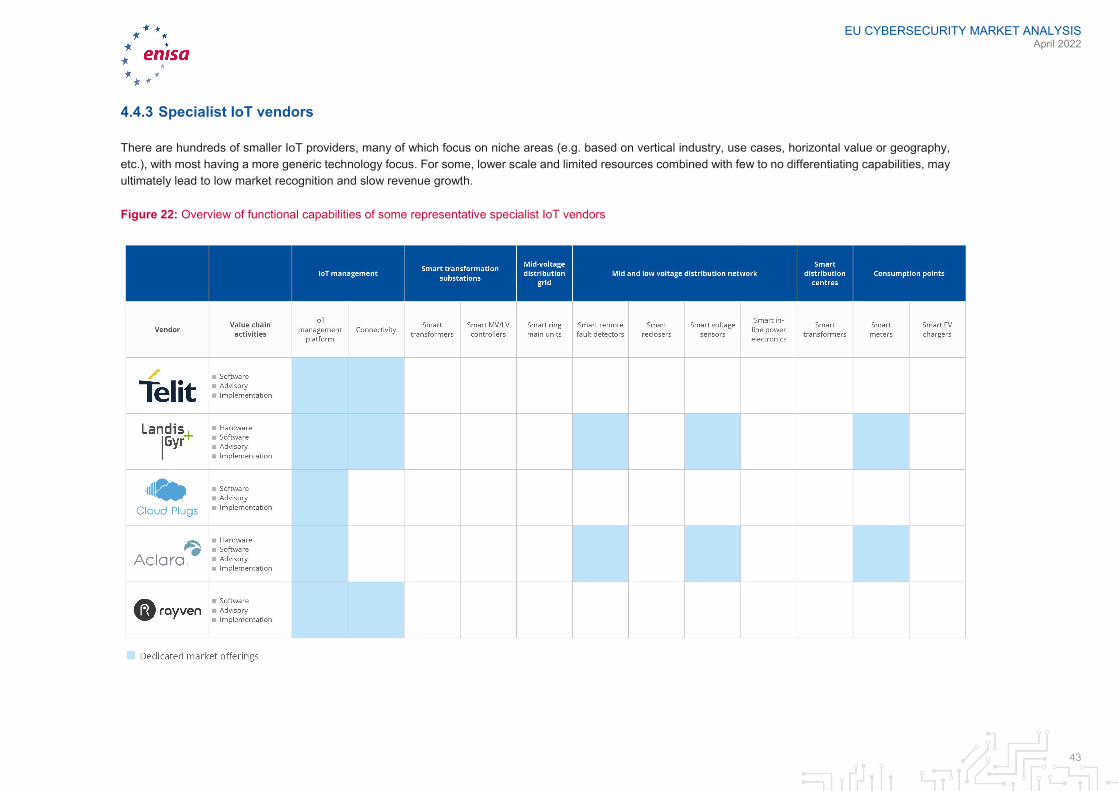
4.4.3 Specialist IoT vendors
There are hundreds of smaller IoT providers, many of which focus on niche areas (e.g. based on vertical industry, use cases, horizontal value or geography, etc.), with most having a more generic technology focus. For some, lower scale and limited resources combined with few to no differentiating capabilities, may ultimately lead to low market recognition and slow revenue growth.
Figure 22: Overview of functional capabilities of some representative specialist IoT vendors
EU CYBERSECURITY MARKET ANALYSIS April 2022
44
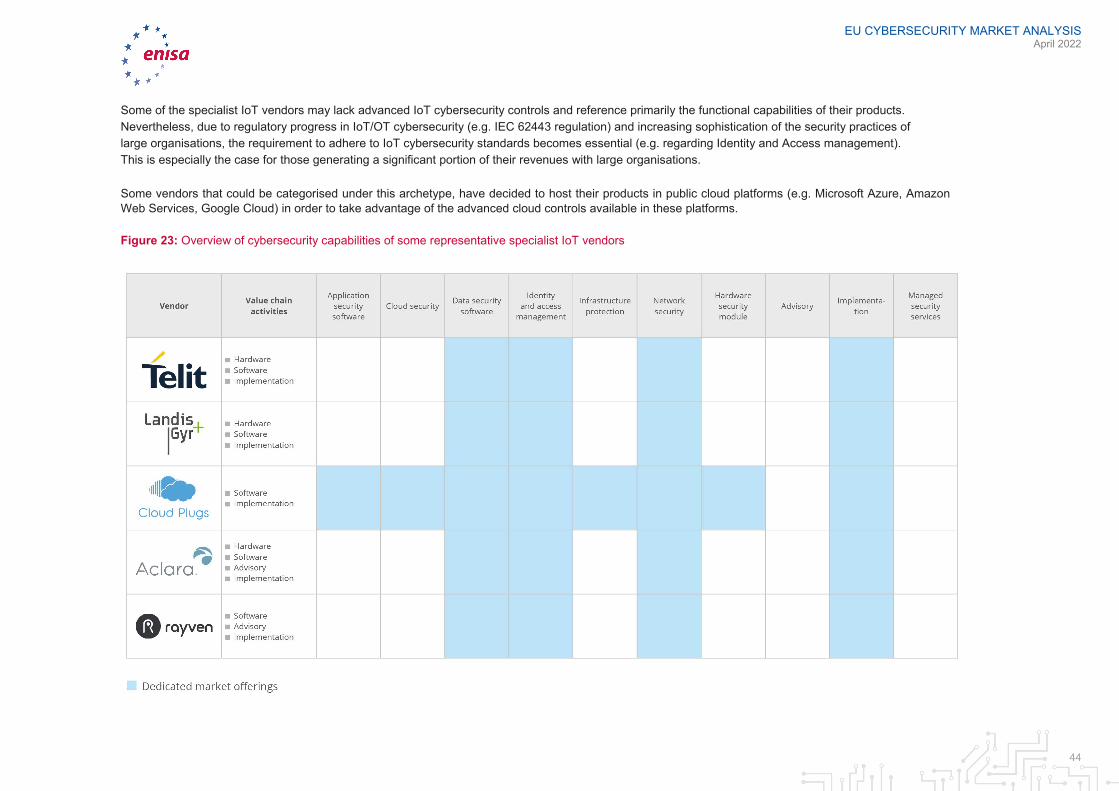
Some of the specialist IoT vendors may lack advanced IoT cybersecurity controls and reference primarily the functional capabilities of their products. Nevertheless, due to regulatory progress in IoT/OT cybersecurity (e.g. IEC 62443 regulation) and increasing sophistication of the security practices of large organisations, the requirement to adhere to IoT cybersecurity standards becomes essential (e.g. regarding Identity and Access management). This is especially the case for those generating a significant portion of their revenues with large organisations.
Some vendors that could be categorised under this archetype, have decided to host their products in public cloud platforms (e.g. Microsoft Azure, Amazon Web Services, Google Cloud) in order to take advantage of the advanced cloud controls available in these platforms.
Figure 23: Overview of cybersecurity capabilities of some representative specialist IoT vendors
EU CYBERSECURITY MARKET ANALYSIS April 2022
45
4.4.4 IoT Cybersecurity specialist vendors
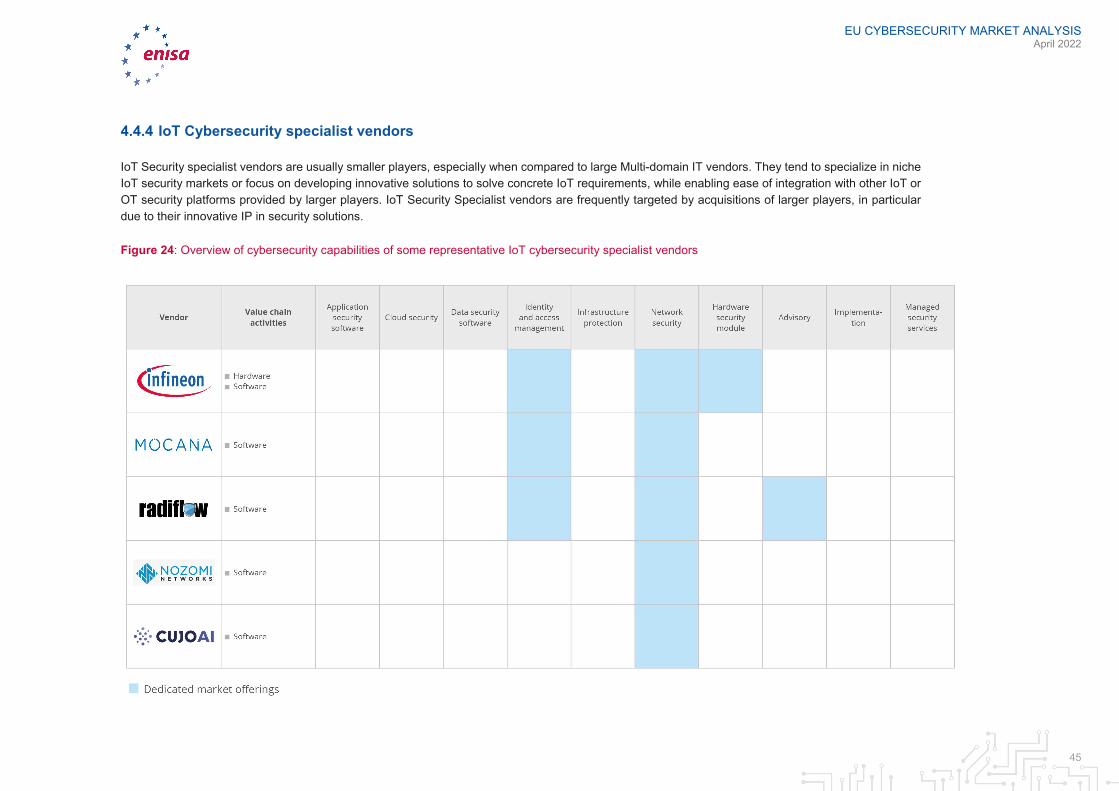
IoT Security specialist vendors are usually smaller players, especially when compared to large Multi-domain IT vendors. They tend to specialize in niche IoT security markets or focus on developing innovative solutions to solve concrete IoT requirements, while enabling ease of integration with other IoT or OT security platforms provided by larger players. IoT Security Specialist vendors are frequently targeted by acquisitions of larger players, in particular due to their innovative IP in security solutions.
Figure 24: Overview of cybersecurity capabilities of some representative IoT cybersecurity specialist vendors
EU CYBERSECURITY MARKET ANALYSIS April 2022
46
4.5 PROFILES OF REPRESENTATIVE MARKET PLAYERS IoT vendors need to ensure differentiation from their competitors, in an environment dominated by customer’s attention and revenue. The organisations that are described below provide a representative cross-section of actors within the identified vendor archetypes.
Representative vendors of each archetype have been selected for the analysis based on industry experts’ opinions, estimated revenue sizes and product innovation approaches provided by Gartner.
4.5.1 General Electric
4.5.1.1 Product or portfolio overview General Electric (GE) has traditionally specialised in supplying equipment (e.g. transformers) for most actors across the electricity value chain (e.g. Distribution System Operators, utilities). Currently, GE is expanding through a growing portfolio of digitally enabled equipment (e.g. “Connected” transformers), solutions (e.g. GE Digital Predix) and services (e.g. software implementation or certification).61
GE’s flagship product to manage IoT devices is GE Digital Predix, an application platform designed for building IoT-enabled industrial data-intense and analytics-intense solutions. The platform is based on a distributed application and service architecture and is delivered as a platform as a service (PaaS) able to operate on the cloud and on-premises.62 The platform includes use cases such as asset-intensive monitoring and automation, predictive maintenance, operations optimisation, digital twin and other critical industrial use cases.
GE Digital Predix has been developed in compliance with security certifications for OT or IoT equipment, such as the IEC 62443-2-4. GE offers security solutions such as Identification and Authentication, IoT discovery and lifecycle management.
4.5.2 Hitachi ABB Power Grids
4.5.2.1 Product or portfolio overview Hitachi ABB Power Grids (HAPG) is a joint venture formed on 1 July 2020 between Hitachi (80.1%) and ABB (19.9%), with approximately $10 billion in business volume.63 HPAG has a broad portfolio of equipment (e.g. transformers), solutions, and services (e.g. consulting and advisory, maintenance) across the electricity value chain.64
HPAG’s competes with other providers through its Lumada IoT platform that aims to fulfil requirements for asset-intensive industries like manufacturing, transportation, energy and utilities. Lumada can be fully deployed in on-premises, hybrid and cloud-centric patterns, giving customers a compelling range of options.65
HPAG’s provides IoT security with its JP1 product. JP1 includes features for IoT, such as Device Management, a product for security lifecycle management of IoT, the JP1 for IoT-NX Netmonitor and JP1 for IoT-NX Usbmonitor appliances. The latter is preventing use of unauthorized PCs or Universal Serial Bus (USB) devices. Hitachi intends to provide more extensive IoT cybersecurity services in the future.66
61 https://www.ge.com/digital/, accessed 20 Sep 2021. 62 https://www.gartner.com/document/3991952?ref=solrAll&refval=301467021, [restricted] accessed 20 Sep 2021. 63 https://new.abb.com/news/detail/64657/abb-completes-divestment-of-power-grids-to-hitachi, accessed 20 Sep 2021. 64Internal analysis of public information provided by the vendor, such as their product catalogue, on their website (e.g. hitachi.com) 65 https://www.ge.com/digital/, accessed 20 Sep 2021. 66 https://www.hitachi.com/hirt/, accessed 20 Sep 2021.
EU CYBERSECURITY MARKET ANALYSIS April 2022
47
4.5.3 Microsoft
4.5.3.1 Product or portfolio overview Microsoft leverages its position as a cloud and technology mega-vendor to provide a broad portfolio of IoT capabilities in its cloud flagship offering Azure. The starting point for clients concentrates on either a SaaS approach with Azure IoT Central, or a platform as a service (PaaS) approach with Azure IoT Reference Architecture and Solution Accelerators. This is supported by a large portfolio of product capabilities including Azure Sphere, Azure IoT Device SDK, Windows 10, Azure Stream Analytics, Azure Digital Twins, Azure IoT Hub, Azure IoT Hub Device Provisioning Service, Azure Machine Learning (Azure ML) and more. The product portfolio also includes certified Azure Intelligent Edge platform solutions, ranging from gateway devices to server class on-premises edge solutions.67
Microsoft applies a holistic partner strategy to drive business opportunities. This includes industrial companies, like ABB,68 Honeywell,69or multiple system integrators, such as Accenture,70 and Cognizant.71
Microsoft minimizes exposure to IoT threats by means of a SIEM (Security Information and Event Management) system for integrated IoT, SOAR (security orchestration, automation and response) and Extended Detection and Response (XDR), including cloud services and devices.72
Microsoft IoT cybersecurity product covers a wide range of domains, including asset discovery, network security, cloud infrastructure security, edge device hardware security, threat and anomaly detection, identity and authentication.73
4.5.4 Oracle
4.5.4.1 Product or portfolio overview Oracle’s IoT Cloud Service supports the IoT market based on Oracle’s enterprise applications. Oracle moved to complete end-to-end IoT-enabled application solutions, departing from an emphasis on platform technologies. An application-centric approach provides a faster time to market and a faster time to value. Oracle emphasizes on use-case-based solutions with prebuilt content, such as Asset Monitoring, Product as a Service, Production Monitoring, Digital Field Service, Fleet and Shipment Tracking, and Connected Worker. Oracle maintains observed and verifiable industrial use-cases across manufacturing and natural resources, transportation, and utilities.74
67 https://www.ge.com/digital/, accessed 20 Sep 2021. 68 https://partner.microsoft.com/ru-kz/case-studies/abb, accessed 20 Sep 2021. 69 https://technologymagazine.com/cloud-and-cybersecurity/honeywell-and-microsoft-partner-industrial-cloud, accessed 20 Sep 2021. 70 https://blogs.partner.microsoft.com/mpn/azure-partner-insights-the-benefits-of-digital-transformation-for-customers/, accessed 20 Sep 2021. 71 https://www.cognizant.com/us/en/about-cognizant/partners/microsoft, accessed 20 Sep 2021. 72 https://azure.microsoft.com/en-us/services/iot-hub/?&ef_id=CjwKCAjw7rWKBhAtEiwAJ3CWLOZwYy719vAHDkU6qAjhQhXKnM7CqIsr_R9IWzxEuhF7YKS4YrBDuRoCt60QAvD_BwE:G:s&OCID=AID2200258_SEM_CjwKCAjw7rWKBhAtEiwAJ3CWLOZwYy719vAHDkU6qAjhQhXKnM7CqIsr_R9IWzxEuhF7YKS4YrBDuRoCt60QAvD_BwE:G:s&gclid=CjwKCAjw7rWKBhAtEiwAJ3CWLOZwYy719vAHDkU6qAjhQhXKnM7CqIsr_R9IWzxEuhF7YKS4YrBDuRoCt60QAvD_BwE#overview, accessed 20 Sep 2021. 73 https://technologymagazine.com/cloud-and-cybersecurity/honeywell-and-microsoft-partner-industrial-cloud, accessed 20 Sep 2021. 74 https://www.gartner.com/document/3992187?ref=solrAll&refval=301476546, [restricted] accessed 20 Sep 2021.
EU CYBERSECURITY MARKET ANALYSIS April 2022
48
The strength of Oracle’s middleware, integration capabilities and solutions provides out-of-the-box connectivity with a range of Oracle and third-party enterprise applications. Moreover they provide with the ability to integrate with third-party cloud systems.75
Oracle’s IoT security solutions use a single, unified infrastructure architecture. Oracle works with partners utilizing security management and a collaboration API that enables third-party vendors to securely execute functions such as device registration, activation and device life cycle events.76
4.5.5 CloudPlugs
4.5.5.1 Product or portfolio overview CloudPlugs is a start-up IoT vendor based in the U.S. Founded in 2014, CloudPlugs provides a device-to-cloud interconnectivity solution. CloudPlugs’ vision is to enable asset connectivity, optimisation of operations and the delivery of new digital services. CloudPlugs offers a breadth of asset connectivity, IoT computing and cloud connectivity adapters to ensure IoT data and events are ingested, analysed, enriched, stored and acted upon.77
CloudPlugs IoT platform-stack enables integration of microcontroller-based devices with the PicoPlug agent, the integration of assets through gateways or virtual machines running its SmartPlug agent, or Edge One, a container-based edge-computing platform. Edge One includes multiple off-the-shelf protocol and database connectors, rules and complex event processing engines, and it offers the ability to easily build and deploy custom containerized applications and digital services. Edge One can send data to any cloud or data lake and can operate online, offline or in store and forward modes, providing flexibility to meet the operational requirements of different industries.78
CloudPlugs offers fully protected and encrypted core process, local database and user application space to prevent foreign script injection. All communications are encrypted with TLS 1.2.79
4.5.6 Telit
4.5.6.1 Product or portfolio overview Telit is a manufacturer of wireless connectivity modules and also an IoT services provider with a portfolio of IoT software platforms and global IoT connectivity services.80
Telit’s broad catalogue of communications modules provides enterprises with simpler sourcing, including managed IoT connectivity and IoT device management without the need of sourcing an additional provider across a variety of industry verticals.81
75 https://blogs.partner.microsoft.com/mpn/azure-partner-insights-the-benefits-of-digital-transformation-for-customers/, accessed 20 Sep 2021. 76 https://enterpriseiotinsights.com/20181016/security/cybersecurity-iot-oracle, accessed 20 Sep 2021. 77 Internal analysis of public information provided by the vendor, such as their product catalogue, on their website (e.g. Cloudplugs.com) 78 https://azure.microsoft.com/en-us/services/iot-hub/?&ef_id=CjwKCAjw7rWKBhAtEiwAJ3CWLOZwYy719vAHDkU6qAjhQhXKnM7CqIsr_R9IWzxEuhF7YKS4YrBDuRoCt60QAvD_BwE:G:s&OCID=AID2200258_SEM_CjwKCAjw7rWKBhAtEiwAJ3CWLOZwYy719vAHDkU6qAjhQhXKnM7CqIsr_R9IWzxEuhF7YKS4YrBDuRoCt60QAvD_BwE:G:s&gclid=CjwKCAjw7rWKBhAtEiwAJ3CWLOZwYy719vAHDkU6qAjhQhXKnM7CqIsr_R9IWzxEuhF7YKS4YrBDuRoCt60QAvD_BwE#overview, accessed 20 Sep 2021. 79 Ibid. 80 https://www.gartner.com/document/3999757?ref=solrAll&refval=301477048, [restricted] accessed 20 Sep 2021. 81 https://technologymagazine.com/cloud-and-cybersecurity/honeywell-and-microsoft-partner-industrial-cloud, accessed 20 Sep 2021.
EU CYBERSECURITY MARKET ANALYSIS April 2022
49
Telit has network agreements only with European and US-based providers, which limits its ability to offer local IoT connectivity out of these regions beyond roaming services.
Telit’s main source of revenue is the hardware business. Managed IoT connectivity services is a small portion of the overall IoT business it manages, though it shows double-digit growth yearly.82
4.5.7 Nozomi Networks
4.5.7.1 Product or portfolio overview Nozomi Networks competitive differentiation focuses on strong operational visibility by delivering detailed OT asset discovery and monitoring. Its rapid detection of cyber and process risks supports fast incident response.83
Nozomi’s SCADAguardian Advanced product offers an innovative hybrid passive/active approach to deliver in-depth asset inventory and granular OT monitoring leveraging AI, along with anomaly and signature-based risk detection, early warning of cyber risks and process risks. Nozomi also provides a solution supporting MSSP partners and those with multitenant architecture.84
The company has developed strategic partnerships with a range of leading technology and security providers such as FireEye, Fortinet, Cisco, Atos, IBM, GE and Leonardo. The company has also built strategic integrations with a variety of vendors in sectors such as SIEM, MSSP, network security and IT analytics.85
4.5.8 Radiflow
4.5.8.1 Product or portfolio overview Founded in 2009 as part of the RAD group, Radiflow launched its solutions at the end of 2011 and recently closed a round of Series B funding of $18 million. Radiflow solutions are sold as either integrated into a wider end-to-end solution of global automation vendors, or as a stand-alone security solution by local channel partners.86
Radiflow’s monitoring and protection portfolio includes iSID an industrial IDS, supporting monitoring of OT networks for anomalies. iSAP smart probe processes traffic in remote sites and works alongside a central IDS control. Secure Gateway allows segmentation of OT networks offering industrial DPI and access control capabilities.87
Radiflow’s security toolset validates the behaviour of both machine-to-machine applications and human-to-machine sessions in distributed operational networks. Radiflow’s security solutions are available as both in-line gateways for remote sites and as a nonintrusive intrusion detection system (IDS) that can be deployed per site or centrally.88
82 https://technologymagazine.com/cloud-and-cybersecurity/honeywell-and-microsoft-partner-industrial-cloud, accessed 20 Sep 2021. 83 https://www.gartner.com/document/3995558?ref=solrAll&refval=301477233, [restricted] accessed 20 Sep 2021. 84 https://www.gartner.com/document/3992187?ref=solrAll&refval=301476546, [restricted] accessed 20 Sep 2021. 85 Ibid. 86 Ibid. 87 Ibid. 88 Ibid.
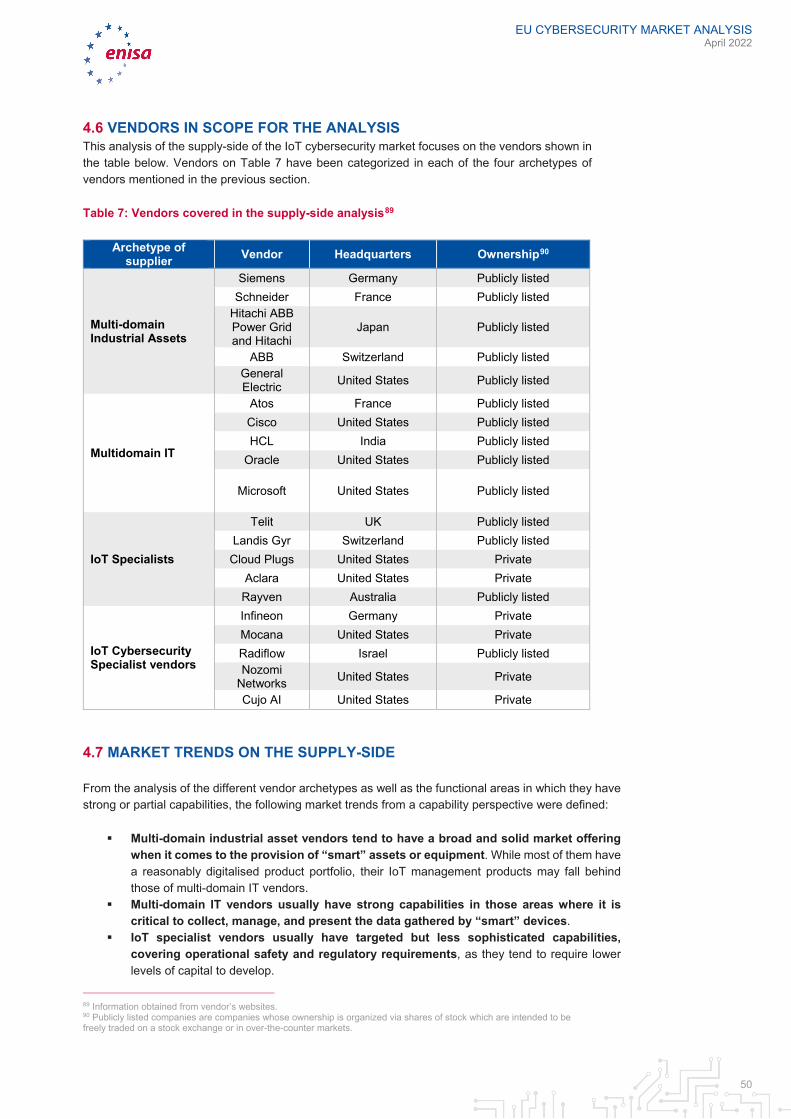
EU CYBERSECURITY MARKET ANALYSIS April 2022
50
4.6 VENDORS IN SCOPE FOR THE ANALYSIS This analysis of the supply-side of the IoT cybersecurity market focuses on the vendors shown in the table below. Vendors on Table 7 have been categorized in each of the four archetypes of vendors mentioned in the previous section.
Table 7: Vendors covered in the supply-side analysis89
Archetype of supplier Vendor Headquarters Ownership90
Multi-domain Industrial Assets
Siemens Germany Publicly listed Schneider France Publicly listed
Hitachi ABB Power Grid and Hitachi
Japan Publicly listed
ABB Switzerland Publicly listed General Electric United States Publicly listed
Multidomain IT
Atos France Publicly listed Cisco United States Publicly listed HCL India Publicly listed
Oracle United States Publicly listed
Microsoft United States Publicly listed
IoT Specialists
Telit UK Publicly listed Landis Gyr Switzerland Publicly listed
Cloud Plugs United States Private Aclara United States Private
Rayven Australia Publicly listed
IoT Cybersecurity Specialist vendors
Infineon Germany Private Mocana United States Private Radiflow Israel Publicly listed Nozomi
Networks United States Private
Cujo AI United States Private
4.7 MARKET TRENDS ON THE SUPPLY-SIDE
From the analysis of the different vendor archetypes as well as the functional areas in which they have strong or partial capabilities, the following market trends from a capability perspective were defined:
Multi-domain industrial asset vendors tend to have a broad and solid market offering when it comes to the provision of “smart” assets or equipment. While most of them have a reasonably digitalised product portfolio, their IoT management products may fall behind those of multi-domain IT vendors.
Multi-domain IT vendors usually have strong capabilities in those areas where it is critical to collect, manage, and present the data gathered by “smart” devices.
IoT specialist vendors usually have targeted but less sophisticated capabilities, covering operational safety and regulatory requirements, as they tend to require lower levels of capital to develop.
89 Information obtained from vendor’s websites. 90 Publicly listed companies are companies whose ownership is organized via shares of stock which are intended to be freely traded on a stock exchange or in over-the-counter markets.
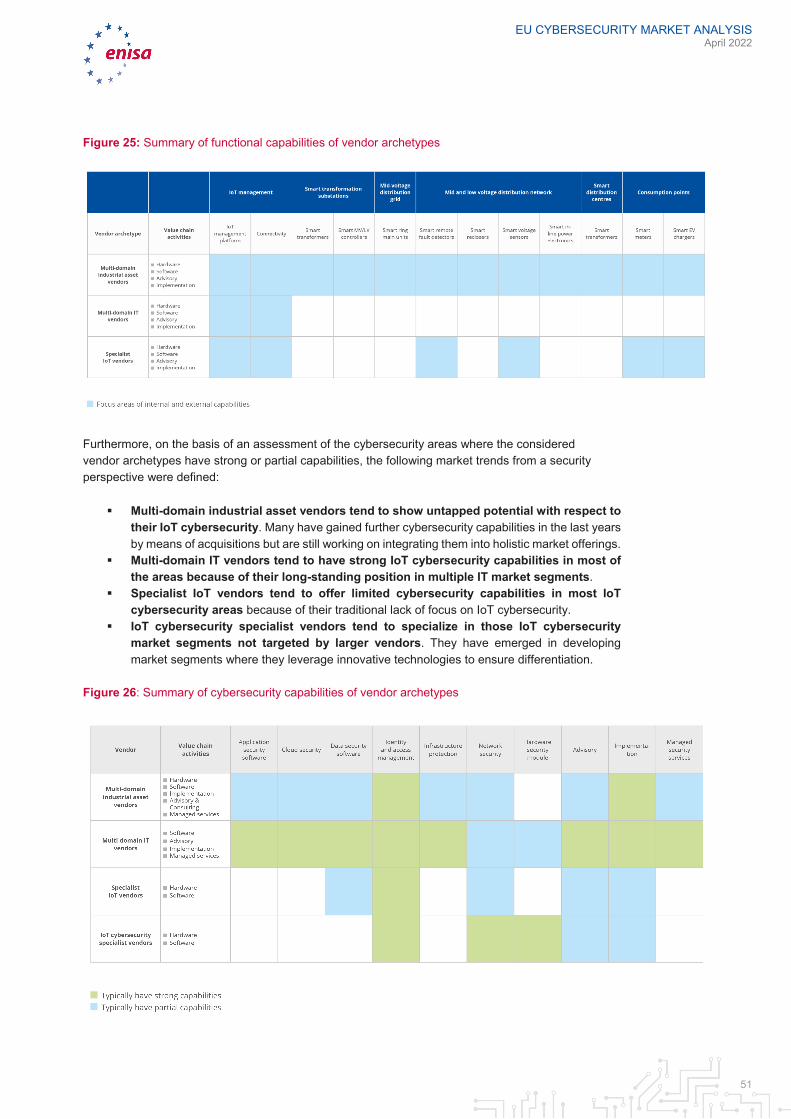
EU CYBERSECURITY MARKET ANALYSIS April 2022
51
Figure 25: Summary of functional capabilities of vendor archetypes
Furthermore, on the basis of an assessment of the cybersecurity areas where the considered vendor archetypes have strong or partial capabilities, the following market trends from a security perspective were defined:
Multi-domain industrial asset vendors tend to show untapped potential with respect to their IoT cybersecurity. Many have gained further cybersecurity capabilities in the last years by means of acquisitions but are still working on integrating them into holistic market offerings.
Multi-domain IT vendors tend to have strong IoT cybersecurity capabilities in most of the areas because of their long-standing position in multiple IT market segments.
Specialist IoT vendors tend to offer limited cybersecurity capabilities in most IoT cybersecurity areas because of their traditional lack of focus on IoT cybersecurity.
IoT cybersecurity specialist vendors tend to specialize in those IoT cybersecurity market segments not targeted by larger vendors. They have emerged in developing market segments where they leverage innovative technologies to ensure differentiation.
Figure 26: Summary of cybersecurity capabilities of vendor archetypes

EU CYBERSECURITY MARKET ANALYSIS April 2022
52
In addition, when focusing on IoT, there is a clear distinction from the trends seen within IT, where there is a varied and crowded stand-alone cybersecurity marketplace. With IoT, this is unlikely to happen due to the requirements and limitations of deploying software in many IoT environments. As such, embedded cybersecurity has been observed as a preferable option here. As a result, it is expected that – despite a relatively small number of successful stand-alone cybersecurity product providers exploiting current cybersecurity gaps – in the medium to long term, IoT infrastructure and platforms will increasingly embed required cybersecurity features at the endpoint or as part of the networking infrastructure.
Traditional IT security vendors are exploiting this trend by making their data interoperable with multiple, potentially available IT security solutions – e.g. Security Operations Centres (SOCs), ticketing systems, or security orchestration. In this manner, compatibility with existing security solutions and products can be achieved. The modularity angle associated with platform-based features and functionalities is attractive to end-users, who can adapt them based on their current security infrastructure, needs and maturity.
The platform business model also implies that vendors can increasingly offer pricing models based on software-as-a-service and provide more cloud-based and analytics-centric solutions. Some vendors now offer both, passive on-premises solutions for brownfield systems (e.g. already installed grid assets), as well as active, cloud-based solutions for greenfield systems.
The rise of Artificial Intelligence (AI) and Machine Learning (ML) technologies has also spurred the emergence of smaller players with solutions to fulfil concrete cybersecurity requirements with innovative approaches that are often easier to deploy. They may address evolving needs and requirements of utilities that can be integrated in the utilities’ existing operations technology (OT) security platforms.
Traditional vendors of electricity grid assets (e.g. transformers) are also present in the IoT cybersecurity market. They have progressed in the digitalisation of their legacy offerings and came to realize the business opportunity in bundling IoT cybersecurity solutions and services that reach across their assets, OT and IoT commercial offerings. A selection of vendors in that space tends to offer a high degree of specialisation in the utilities industry, which often has unique cybersecurity needs due to the types of systems and protocols deployed, unique sales cycles, or safety and security requirements.
Finally, the IoT cybersecurity market also includes vendors that are specialised in functional components, such as IoT connectivity solutions or smart metering devices. Although the IoT cybersecurity segment does not necessarily represent a core market for these vendors, they are increasingly adding IoT cybersecurity features to their products in order to address the growing concern of utilities with cybersecurity threats.
EU CYBERSECURITY MARKET ANALYSIS April 2022
53
5. TECHNOLOGY RESEARCH
5.1 INTRODUCTION TO THE TECHNOLOGY RESEARCH SECTION The digital transformation in the utilities industry goes hand-in-hand with an increasing number of data sources, systems, and interconnected assets of various kinds. Ultimately, the connectivity of endpoints with modern, open network technologies and IoT platforms is the foundation of the digitalisation of the utilities industry.
Consequentially, electricity grids are becoming less isolated from outside networks due to the need to:
• coordinate decentralised, intermittent, and non-dispatchable generation assets (e.g. renewable energy sources),
• manage the growing penetration of distributed energy resources (e.g. Photovoltaic Panels) installed at consumption endpoints and,
• manage the evolving role of consumers as active market players (e.g. demand response, generation, storage).
Less isolation and more integration require a different approach to cybersecurity where “trust levels” of different types, with very strict levels of what each entity might be able to do, play a key role.
At the heart of this change is the demand to integrate enterprise IT systems in order to digitalise organisations for remote connectivity to improve operations, automation and lower operation costs. However, as legacy systems and grid assets (e.g. transformers) evolve toward more-connected systems, their cybersecurity posture is increasingly challenged.
The use of IoT technologies has unique safety, business continuity and physical security implications. As attack surface increases due to the increasing number of connected devices, the need to address physical threats and cyberthreats will lead to the adoption of emerging technologies to address an array of environments spanning across the utilities industry (i.e. cyber-physical systems).
5.2 RESEARCH QUESTIONS ON TECHNOLOGY The technology research analysis addresses the question on which key technological trends regarding IoT cybersecurity are noticeable within distribution grids.
5.3 METHODOLOGY OF TECHNOLOGY ANALYSIS This report examines technology trends in IoT cybersecurity in context of the electricity distribution grids. The technology analysis addresses the following research questions:
1. Which are the (main) technology trends that are perceived in the market? 2. When these trends are expected to have a significant impact on the market? 3. What impact these trends will have on relevant markets?
Time to impact or “range” is measured in the years to early majority adoption. This is when technology adoption is “ready for prime time.” It is important to point out that the time to technology impact or range is not the same as the time to act on the technology. When and how product leaders should act depends on the company’s business strategy. Providers that want to
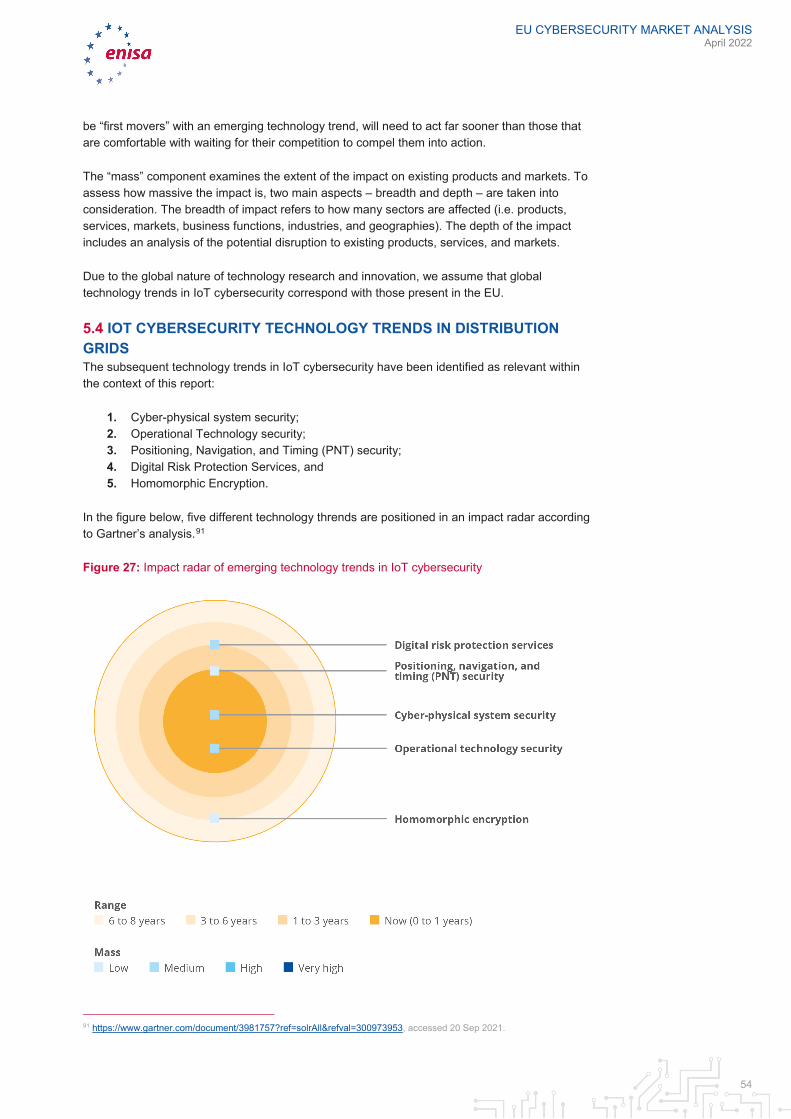
EU CYBERSECURITY MARKET ANALYSIS April 2022
54
be “first movers” with an emerging technology trend, will need to act far sooner than those that are comfortable with waiting for their competition to compel them into action.
The “mass” component examines the extent of the impact on existing products and markets. To assess how massive the impact is, two main aspects – breadth and depth – are taken into consideration. The breadth of impact refers to how many sectors are affected (i.e. products, services, markets, business functions, industries, and geographies). The depth of the impact includes an analysis of the potential disruption to existing products, services, and markets.
Due to the global nature of technology research and innovation, we assume that global technology trends in IoT cybersecurity correspond with those present in the EU.
5.4 IOT CYBERSECURITY TECHNOLOGY TRENDS IN DISTRIBUTION GRIDS The subsequent technology trends in IoT cybersecurity have been identified as relevant within the context of this report:
1. Cyber-physical system security; 2. Operational Technology security; 3. Positioning, Navigation, and Timing (PNT) security; 4. Digital Risk Protection Services, and 5. Homomorphic Encryption.
In the figure below, five different technology thrends are positioned in an impact radar according to Gartner’s analysis.91
Figure 27: Impact radar of emerging technology trends in IoT cybersecurity
91 https://www.gartner.com/document/3981757?ref=solrAll&refval=300973953, accessed 20 Sep 2021.
EU CYBERSECURITY MARKET ANALYSIS April 2022
55
5.4.1 Cyber-physical system security Cyber-physical systems (CPS) are defined as engineered systems that orchestrate sensing, computation, control, networking, and analytics to interact with the physical world (including humans). As such, they enable safe, real-time, secure, reliable, resilient, and adaptable grid operation.
CPS in distribution grids is emerging through the convergence of IT, OT and ET systems, through increased use of IoT-like sensors (e.g. voltage meters) in the grid, through remotely controlled or maintained systems or via deployment of new algorithms and automation solutions.
The need for a comprehensive and coordinated security approach will require organisations to deploy cyber-physical systems solutions that cover the entire cyber-physical risk spectrum.
The product capabilities will range across the spectrum of an adaptive security model, from prevention tools (such as network firewalling and endpoint security tools), to detection mechanisms (such as system monitoring and inventorying) and predictive solutions (like threat intelligence).
Emerging CPS security use-cases, in which controls apply across IT, IoT, OT and physical environments, include:
Real-time visibility and asset discovery for every asset connected to enterprise networks, regardless of where they reside, and whether they are managed by engineering, operations or IT;92
Managed detection and response (MDR) and incident response (IR) services;93 Best-of-breed approaches to threat intelligence and vulnerability management that
consider the uniqueness of OT environments in combination with IT security principle.
5.4.1.1 Range: Now CPS-Sec technology has become a critical area of focus for utilities and grid operators. This is due to the increased number of threat vectors targeting utilities, such as the Snake/EKANS ransomware, which has successfully impacted several organisations such as Enel,94 in 2020.
According to Gartner, 50% of security products and services marketed today as “Internet of Things (IoT)” will focus on industry-specific CPS-Sec needs by 2023, compared with a negligible number today.95
5.4.1.2 Mass: Medium The overall mass for CPS-Sec is estimated to be medium.96 As organisations continue to automate and connect assets to drive increased productivity, CPS will continue to deploy.
5.4.2 Operational Technology security OT security is the practice of protecting critical production and operational systems and services in asset-centric enterprises, such as the utilities industry. As the OT market moves toward more-connected systems and newly designed “greenfield” systems (e.g. connected transformers), the traditional OT management, governance, infrastructure and security become part of a broader security effort defined that becomes intertwined with IoT and IT security.
92 https://www.gartner.com/document/3991219?ref=authbottomrec&refval=4001838 , [restricted] accessed 20 Sep 2021, 93 https://www.gartner.com/document/3981757?ref=solrAll&refval=300973953, accessed 20 Sep 2021. 94 https://blog.malwarebytes.com/threat-analysis/2020/06/honda-and-enel-impacted-by-cyber-attack-suspected-to-be-ransomware/, accessed 20 Sep 2021. 95 https://www.gartner.com/document/3981757?ref=solrAll&refval=300973953, accessed 20 Sep 2021. 96 https://www.gartner.com/document/3981757?ref=solrAll&refval=300973953, accessed 20 Sep 2021.
EU CYBERSECURITY MARKET ANALYSIS April 2022
56
5.4.2.1 Range: Now OT security has become a critical area of focus for utilities. Trying to protect critical infrastructures, along with trying to preserve safety and reliability at a time when digital transformation and the need to automate business operations is presenting new risks.
This progress has been driven by fast growth and adoption rates, with an estimated CAGR of 36% from 2021 to 2022.97 This growth has been supported by a diverse number of use-cases, such as smart-grid implementations where advanced data sharing capabilities between utilities’ operation and planning IT systems with OT are required.
5.4.2.2 Mass: Medium OT security’s impact on existing products and markets is expected to be medium. Network security equipment, vulnerability management, endpoint security and professional services are among the most impacted markets where providers are looking to expand capabilities to meet rising demand.
According to Gartner,98 as utilities’ maturity in OT security increases an increasing number of IT security activities and controls will be applied to OT environments. This trend is expected to accelerate the interest of established IT services/security in this market, and perhaps drive consolidation, i.e., reduction of the number of market players in the market as a result of larger players acquiring smaller, OT-specialised market players.
For example, Atos, a French provider of IT services, recently acquired Cryptovision in order to strengthen its security product line.
5.4.3 Positioning, Navigation, and Timing (PNT) security Positioning, navigation, and timing (PNT) is a combination of three capabilities:
Positioning, which is the ability to determine location and orientation accurately and precisely;
Navigation, which is the ability to determine current and desired position, correct course, orientation, and speed to attain a desired position anywhere around the world, and
Timing, which is the ability to acquire and maintain accurate and precise time from a standard (Coordinated Universal Time, or UTC), anywhere in the world.
PNT is provided by Global Navigation Satellite Systems (GNSSs), such as the Global Positioning System (GPS), Galileo, GLONASS and BeiDou Navigation Satellite System. The most widely used PNT service is GPS.
Information on positioning, if not properly protected, might expose the power grids, e.g. thus becoming the target of a drone attack. In addition, GPS equipment, as a source of precision timing, is vulnerable to different forms of deliberate attack, as well as unintentional compromises99. GPS is used by many applications deployed to manage grid operations in the electricity subsector, leading thus to materialization of risks to operations, if GPS accuracy is compromised.
Top electricity distribution applications for precision timing include Sequence of Events (SOE)/Digital Fault Recorders (DFR), protective relays, synchro-phasor measurements, and 97 https://www.gartner.com/document/code/352921?ref=authbody&refval=3991219, accessed 20 Sep 2021. 98 https://www.gartner.com/document/3981757?ref=solrAll&refval=300973953, accessed 20 Sep 2021. 99 For an analysis on threats against energy providers’ services see the ENISA report on ‘Power Sector Dependency on Time Service: attacks against time sensitive services’, https://www.enisa.europa.eu/publications/power-sector-dependency, accessed 17 January 2022.
EU CYBERSECURITY MARKET ANALYSIS April 2022
57
disturbance monitoring and reporting.100 Protective relays, for example, depend on precision timing to synchronize monitoring samples and telecommunication equipment.101
5.4.3.1 Range: Short (1 to 3 Years) Although illegal jammers are already using transmitters to interfere with GPS signals to scramble or alter location and time of IoT devices, this trend is expected to materialize in 1 to 3 years.102
Several techniques are already emerging to counteract PNT cyberthreats, such as using encrypted systems and communications, obscuring antennas/install decoys, duplicate antennas, blocking antennas, or ground-based navigation beacons.
5.4.3.2 Mass: Low Gartner estimates the overall mass to be overall low. Many assets are still static, although digital transformation using automation and robotics is increasing, accelerated by the COVID-19 pandemic.103
5.4.4 Digital Risk Protection Services The digital risk protection services (DRPS) market is composed of technology and service providers offering solutions developed to protect critical digital assets and data exposed to external threats. These solutions provide visibility into the clear (surface) web, dark web and deep web sources to identify potential threats to critical assets and provide contextual information on threat actors, their tactics and processes utilized to conduct malicious activity. DRPS provides support in four areas: mapping, monitoring, mitigating, and managing the impact on critical digital assets. They ensure that business operations are preserved.
5.4.4.1 Range: Medium (3 to 6 Years) The estimated distance to the early majority target is anticipated to be at about 5% to 20% of the journey, at a rather early stage. Otherwise, the pace of investment growth in this technology is fairly fast and is expected to drive swift adoption of this new technology. DRPS offerings are particularly valuable for manufacturing organisations that give particular value to their brand. The ability to protect against phishing campaigns is also key for this vertical, particularly as cybercriminals seem to increasingly target this sector.
5.4.4.2 Mass: Medium The impact of DRPS on existing products and markets is medium. This comes as a result of overlapping with some complementary mainstream cybersecurity offerings, such as threat intelligence (TI), social media security, endpoint protection platforms (EPPs), secure email gateways (SEGs) and managed security services (MSSs). Here, providers have been able to expand offerings by adding DRPS to their service catalogues as an integration to their core capabilities, as well as stand-alone DRPS. Growing interest in DRPS-type of capabilities will impact a growing number of sectors (e.g. automotive, consumer goods), seeking out new market opportunities.
New providers are expanding capabilities to cover the whole spectrum of digital risks, stretching to the cyber-physical layer and public cloud environments. This is creating new opportunities and expanding the reach to new buying roles, such as chief marketing officers, chief privacy officers and chief information officers.
5.4.5 Homomorphic Encryption
100 https://www.epri.com/research/products/000000003002020266, accessed 20 Sep 2021. 101 https://www.gartner.com/document/3945879?ref=solrResearch&refval=300698617, accessed 20 Sep 2021. 102 https://www.gartner.com/document/3981757?ref=solrAll&refval=300591351, accessed 20 Sep 2021. 103 https://www.gartner.com/document/3981757?ref=solrAll&refval=300973953, accessed 20 Sep 2021.
EU CYBERSECURITY MARKET ANALYSIS April 2022
58
Homomorphic encryption (HE) is a cryptographic method that enables third parties to process encrypted data and return an encrypted result to the data owner, while providing no knowledge about the data or the results. HE enables providers to protect proprietary algorithms and data owners to keep data private. In practice today, fully homomorphic encryption (FHE) is not fast enough for most manufacturing implementations. As such, partially homomorphic encryption (PHE) might be a more practical implementation.
As the IoT market matures, stored sensor data collected through countless sensor nodes must be protected as intellectual property and other sensitive data are vulnerable to attack. HE is useful to provide encryption to sensor data that can be shared across an ever-growing number of interconnected meters and actuators installed across the distribution grid.
5.4.5.1 Range: Medium (3 to 6 Years) Homomorphic encryption is three to six years out, because several factors are inhibiting the adoption in the near term. Performance issues, cost, lack of standardization and complexity are expected to slowly progress to the early maturity stage.
5.4.5.2 Mass: Low Gartner expects low mass from in the HE market, given cost and performance issues for real-time data needed for distribution grids operation. In addition, computational costs for HE might be out of reach for many utilities.104
104 https://www.gartner.com/document/3981757?ref=solrAll&refval=300973953, accessed 20 Sep 2021.
EU CYBERSECURITY MARKET ANALYSIS April 2022
59
6. MACRO-ENVIRONMENTAL FACTORS
6.1 INTRODUCTION TO THE MACRO-ENVIRONMENTAL FACTORS SECTION As the IoT cybersecurity market continues to grow in the EU, different factors that determine the end-user’s IoT cybersecurity adoption process will increase in influence.
A macro-environment refers to the set of conditions that exist in the economy as a whole, rather than in a particular sector or region. As described in Section 2.1.5 of ECSMAF Version 17 PEST analysis is one of the most frequently applied measurement tool, used to analyse how four external factors (Political, Economic, Social and Technology) affect the operations of an organisation or a specific market segment, in particular:
1. Political: These factors play a critical role, not only in investment decisions (e.g. IoT cybersecurity investment), but they also can alter the long-term sustainability of different markets. Some examples include the governance system, regulations, democracy and institutions.
2. Economic: These factors have a direct impact on the potential attractiveness of a given market in a particular region or country. Some examples are inflation rate, GDP growth rate, Foreign Exchange Rate, or disposable income level.
3. Social: These factors can be usually linked to workforce talent availability and the level of demand. Some examples include the power structure in the society, women participation in the workforce, emerging end-user behaviour, etc.
4. Technology: These are factors that relate to innovations in technology that may affect the operations of organizations and a specific market segment. They refer to technology advancement and maturity, the emergence of disruptive technologies, the level of innovation, automation, research and development (R&D) activity, technological change and the amount of technological awareness that a market possesses.
Other additional factors, not included in the PEST analysis that could be considered are environmental factors (some examples include greenhouse emissions, or habitat destruction) and legal factors (e.g. cybersecurity related requirements). Both environmental and legal factors are important for this analysis on IoT cybersecurity of distribution grids and are covered in this chapter.
6.2 RESEARCH QUESTIONS The analysis of macro-environmental factors addresses the question:
• Which macro-environmental factors are influencing IoT cybersecurity in EU distribution grids?
6.3 METHODOLOGY OF ANALYSIS This section examines macro-environmental factors that could have a significant impact on how the IoT cybersecurity market further develops. Additionally, the results of the analyses presented in this reported — especially those of the market model — could be impacted by these factors.
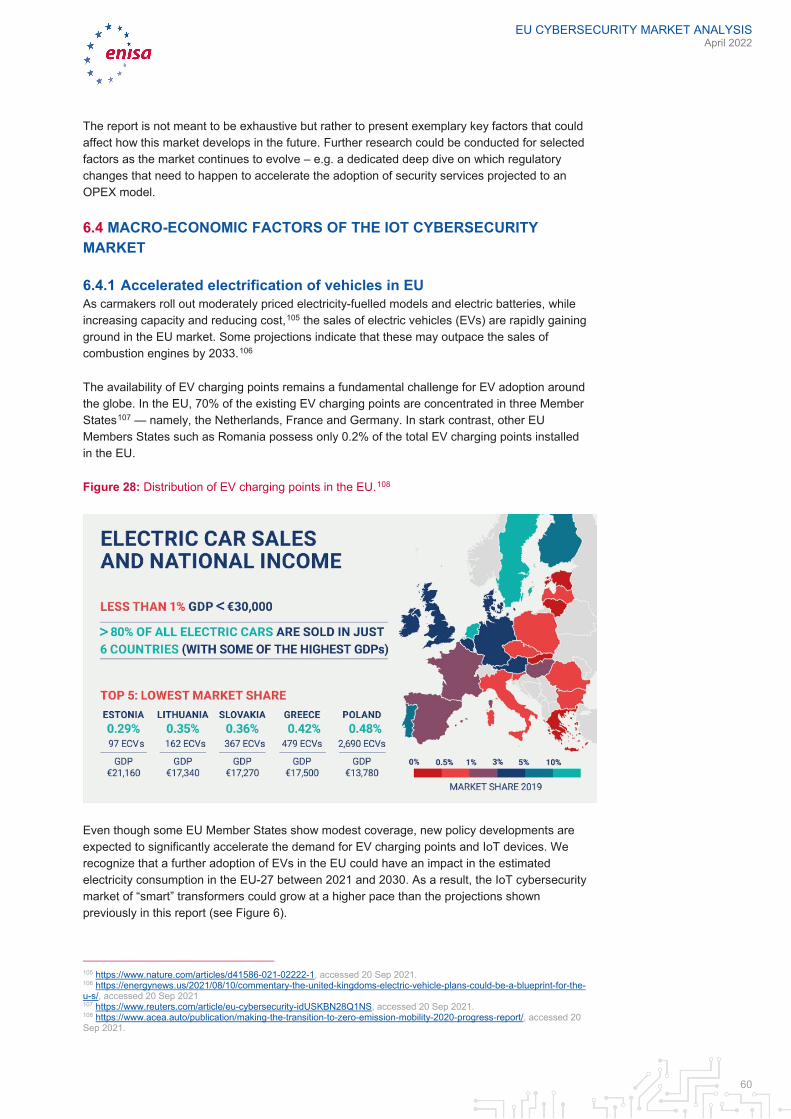
EU CYBERSECURITY MARKET ANALYSIS April 2022
60
The report is not meant to be exhaustive but rather to present exemplary key factors that could affect how this market develops in the future. Further research could be conducted for selected factors as the market continues to evolve – e.g. a dedicated deep dive on which regulatory changes that need to happen to accelerate the adoption of security services projected to an OPEX model.
6.4 MACRO-ECONOMIC FACTORS OF THE IOT CYBERSECURITY MARKET
6.4.1 Accelerated electrification of vehicles in EU As carmakers roll out moderately priced electricity-fuelled models and electric batteries, while increasing capacity and reducing cost,105 the sales of electric vehicles (EVs) are rapidly gaining ground in the EU market. Some projections indicate that these may outpace the sales of combustion engines by 2033.106
The availability of EV charging points remains a fundamental challenge for EV adoption around the globe. In the EU, 70% of the existing EV charging points are concentrated in three Member States107 — namely, the Netherlands, France and Germany. In stark contrast, other EU Members States such as Romania possess only 0.2% of the total EV charging points installed in the EU.
Figure 28: Distribution of EV charging points in the EU.108
Even though some EU Member States show modest coverage, new policy developments are expected to significantly accelerate the demand for EV charging points and IoT devices. We recognize that a further adoption of EVs in the EU could have an impact in the estimated electricity consumption in the EU-27 between 2021 and 2030. As a result, the IoT cybersecurity market of “smart” transformers could grow at a higher pace than the projections shown previously in this report (see Figure 6).
105 https://www.nature.com/articles/d41586-021-02222-1, accessed 20 Sep 2021. 106 https://energynews.us/2021/08/10/commentary-the-united-kingdoms-electric-vehicle-plans-could-be-a-blueprint-for-the-u-s/, accessed 20 Sep 2021 107 https://www.reuters.com/article/eu-cybersecurity-idUSKBN28Q1NS, accessed 20 Sep 2021. 108 https://www.acea.auto/publication/making-the-transition-to-zero-emission-mobility-2020-progress-report/, accessed 20 Sep 2021.
EU CYBERSECURITY MARKET ANALYSIS April 2022
61
6.4.2 Aftermath of the COVID-19 pandemic While COVID-19 pandemic has accelerated the adoption of digital technologies across many industries, the impact on the electric grids is less direct and needs further analysis. We recommend planning dedicated research activities on this subject as part of a wider research agenda.
6.4.3 Available green bonds and government funding for energy transformation Green bonds are designated bonds intended to encourage sustainability and to support climate-related or other types of special environmental targets, such as energy efficiency projects, CO2 reduction, etc.
Green bonds come with tax incentives such as tax exemption and tax credits, making them a more attractive investment compared to a comparable taxable bond. These tax advantages provide a monetary incentive to private investors.
To progress with its roadmap to become carbon-neutral by 2050,109 the EU has recently launched their Green Bonds program110 aimed at financing member states’ environmental beneficial projects, taking its first step to potentially become the biggest issuer of environmentally friendly debt with a record-sized deal.
We make the hypothesis that depending on the success of this program, the adoption of “smart” meters and transformers could be accelerated. As a result, the market projections of the IoT cybersecurity market presented in this report would accelerate.
6.4.4 Limited workforce to execute on grid digitalisation The combination of a decreasing EU’s working-age population and poor attractiveness of the construction sector is generating challenges for construction companies to fill job vacancies across EU. For example, between 2010 and 2018, the Czech Republic and Slovenia recorded the largest increase in the share of vacancies to the amount of people employed in the sector (621.9% and 411.7% respectively).111
As a result, we make the hypothesis that depending on how the availability of skilled construction workers develops, there may not be enough workers to execute grid digitalisation projects and, even if funding is available, the adoption rates of IoT cybersecurity assumed for this report may not be achieved.
6.4.5 Accelerated growth in electricity consumption because of global warming The accumulation of greenhouse gases in Earth’s atmosphere destabilises the temperature equilibrium and has far-reaching effects on energy consumption patterns.112
Extreme weather and climate conditions have strong influence on energy consumption, which directly affects planning and operations of these systems.113 For example, several studies
109 https://ec.europa.eu/commission/presscorner/detail/en/ip_20_335, accessed 20 Sep 2021. 110 https://www.reuters.com/business/sustainable-business/eu-starts-sale-debut-green-bond-ifr-2021-10-12/, accessed 12 Oct 2021. 111 https://ecs-org.eu/documents/publications/5fdb2673903c6.pdf, accessed 20 Sep 2021. 112 https://www.frontiersin.org/articles/10.3389/frsc.2021.644789/full, accessed 20 Sep 2021. 113 Ronalds, B. F., Wonhas, A., and Troccoli, A. (2010). “A new era for energy and meteorology,” in Weather Matters for Energy, eds A. Troccoli, L. Dubus and S. E. Haupt (New York, NY: Springer), 3–16. doi: 10.1007/978-1-4614-9221-4_1
EU CYBERSECURITY MARKET ANALYSIS April 2022
62
quantify the increase in residential heating and cooling demands and electric power supply under climate change scenarios.114
We recognize that an increase in temperature across EU-27 countries due to global warming, could have an impact in the estimated electricity consumption in the EU-27 between 2021 and 2030. As a result, the IoT cybersecurity market of “smart” transformers could grow at a higher pace than the projections shown in this report.
6.4.6 Relevant legal framework of IoT cybersecurity in distribution grids Current legal framework and ongoing or planned legislative and policy initiatives related to the cybersecurity of IoT in distribution grids play an important role. For instance, privacy requirements contribute to shape the market. And the importance of privacy is proved by a number of initiatives taken, with the most important one being the Privacy Impact Assessment for smart meters driven by European Commission115.
114 Sailor, D. J., and Munoz, J. R. (1997). Sensitivity of electricity and natural gas consumption to climate in the U.S.A. Methodology and results for eight states. Energy 22, 987–998. doi: 10.1016/S0360-5442(97)00034-0 115 https://eur-lex.europa.eu/legal-content/EN/TXT/HTML/?uri=CELEX:32014H0724&from=FR
EU CYBERSECURITY MARKET ANALYSIS April 2022
63
7. CONCLUSIONS
This report offers interesting insights into the transformation of the traditional electricity industry and the increasing role of IoT technologies in this regard. Furthermore, it examines both the supply and demand side of the smart grid IoT cybersecurity ecosystem in the EU.
As organisations continue to digitalise their operations and improve the flexibility of the grid to accommodate renewable energy sources, their attack surface has also increased; an evolution that has been documented and assessed in this report.
7.1 MAIN FINDINGS The main findings of this report are:
• IoT cybersecurity spending within the distribution grids of the EU-27 is mainly driven by the adoption of electricity “smart” meters.
• From 2025 to 2030, the IoT cybersecurity market related to smart metres is expected to be mainly driven by Operational Expenditures (OPEX) rather than Capital Expenditures (CAPEX). In practice, this means that more capital is expected to be spent for the maintenance of IoT cybersecurity (such as maintenance of security software installed in IoT devices, e.g. software patches), than for the purchase of new cybersecurity hardware or software.
• Analysis indicates that there are no IoT monopolies. Organisations tend to favour larger IoT vendors that possess the necessary capabilities to cover a wide spectrum of requirements, limiting the space for market entry of smaller organisations in consequence.
• There are four main archetypes of suppliers within the IoT cybersecurity market, these being: multi-domain industrial assets vendors, multi-domain IT vendors, specialist IoT vendors, and IoT cybersecurity specialist vendors.
• The above-mentioned archetypes exhibit different competitive dynamics, i.e., focussing on a particular market segment vs. diversification.
• The increase of the demand by the energy industry for cybersecurity tools and services to improve IoT cybersecurity capabilities of organisations represents one of the trends on the demand-side.
• Embedded cybersecurity into IoT infrastructure and platforms represents one of the trends on the supply-side.
• There are multiple technological trends developing in the IoT cybersecurity market. Among these, cyber-physical system security and operational technology security are expected to materialize in the short term.
7.2 WAYS FORWARD This report analyses the IoT cybersecurity market in distribution grids in EU and has served as a proof-of-concept of an early version of the ENISA Cybersecurity Market Analysis Framework that was developed in 20217. While confirming the good overall functioning of the framework, it helped identify aspects of the framework that can be improved.
Some improvements have been already included in the initial version of the framework, which is expected to further evolve based on the experience that ENISA will gather by applying the framework to conduct additional analyses. In 2022 and beyond, ENISA, also with the support of

EU CYBERSECURITY MARKET ANALYSIS April 2022
64
the recently established Ad Hoc Working Group (AHWG) on EU Cybersecurity Market116, will conduct additional cybersecurity market analyses. Such activities could focus for instance on other IoT markets, and/or on horizontal aspects of the EU cybersecurity market (e.g. cybersecurity certification). Based on the experience from conducting the present analysis, particular attention will be given to the definition of the scope of future analyses, since the scoping represents an important initial element for the outcome of the analysis and the usability of achieved results.
116 https://www.enisa.europa.eu/topics/standards/adhoc_wg_calls/ad-hoc-working-group-on-cybersecurity-market, accessed 13 December 2021.

EU CYBERSECURITY MARKET ANALYSIS April 2022
65
A ANNEX: COVERED IOT CYBERSECURITY MARKET SEGMENT Most relevant cybersecurity segments and categories for IOT device are highlighted in light blue in the next table.
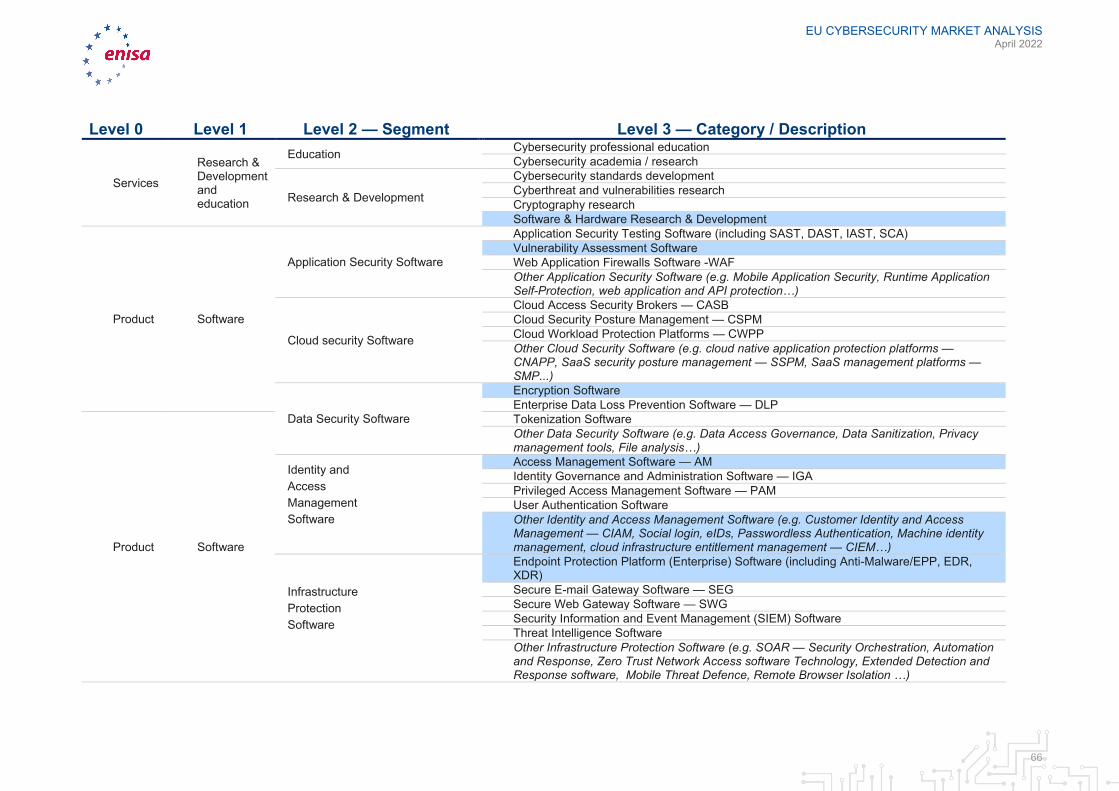
EU CYBERSECURITY MARKET ANALYSIS April 2022
66
Level 0 Level 1 Level 2 — Segment Level 3 — Category / Description
Services
Research & Development and education
Education Cybersecurity professional education Cybersecurity academia / research
Research & Development
Cybersecurity standards development Cyberthreat and vulnerabilities research Cryptography research Software & Hardware Research & Development
Product Software
Application Security Software
Application Security Testing Software (including SAST, DAST, IAST, SCA) Vulnerability Assessment Software Web Application Firewalls Software -WAF Other Application Security Software (e.g. Mobile Application Security, Runtime Application Self-Protection, web application and API protection…)
Cloud security Software
Cloud Access Security Brokers — CASB Cloud Security Posture Management — CSPM Cloud Workload Protection Platforms — CWPP Other Cloud Security Software (e.g. cloud native application protection platforms — CNAPP, SaaS security posture management — SSPM, SaaS management platforms — SMP...)
Data Security Software
Encryption Software Enterprise Data Loss Prevention Software — DLP
Product Software
Tokenization Software Other Data Security Software (e.g. Data Access Governance, Data Sanitization, Privacy management tools, File analysis…)
Identity and Access Management Software
Access Management Software — AM Identity Governance and Administration Software — IGA Privileged Access Management Software — PAM User Authentication Software Other Identity and Access Management Software (e.g. Customer Identity and Access Management — CIAM, Social login, eIDs, Passwordless Authentication, Machine identity management, cloud infrastructure entitlement management — CIEM…)
Infrastructure Protection Software
Endpoint Protection Platform (Enterprise) Software (including Anti-Malware/EPP, EDR, XDR) Secure E-mail Gateway Software — SEG Secure Web Gateway Software — SWG Security Information and Event Management (SIEM) Software Threat Intelligence Software Other Infrastructure Protection Software (e.g. SOAR — Security Orchestration, Automation and Response, Zero Trust Network Access software Technology, Extended Detection and Response software, Mobile Threat Defence, Remote Browser Isolation …)
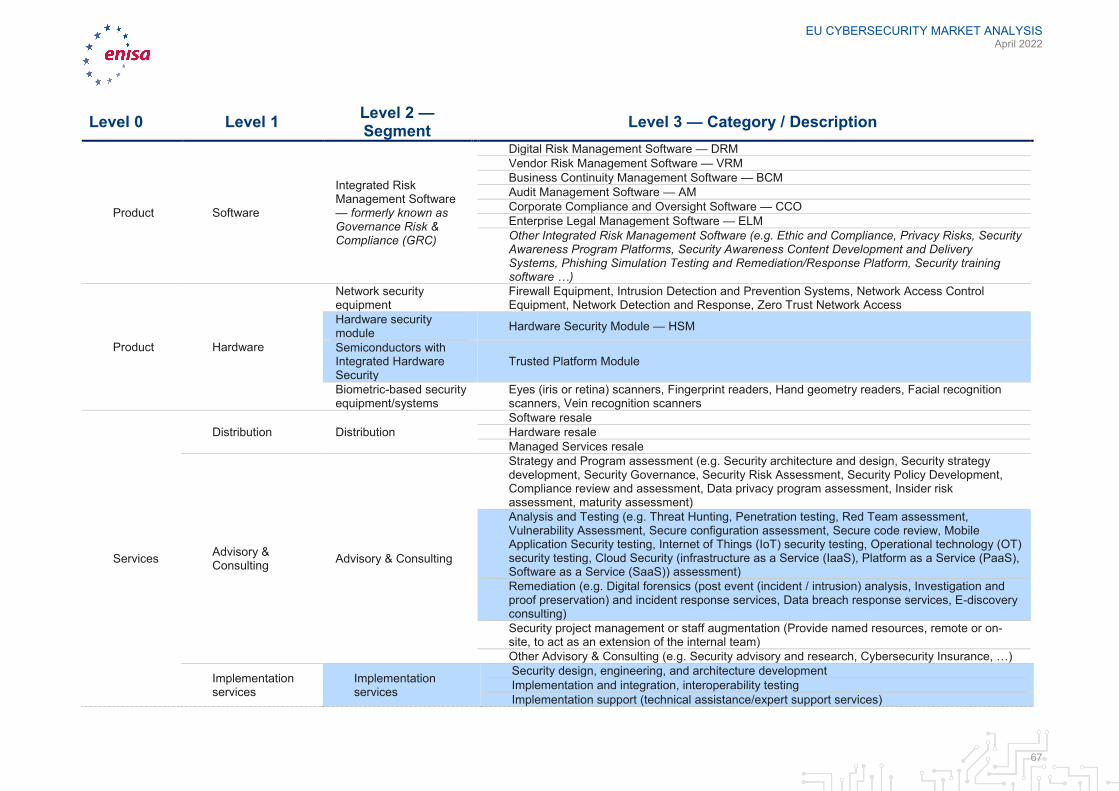
EU CYBERSECURITY MARKET ANALYSIS April 2022
67
Level 0 Level 1 Level 2 — Segment Level 3 — Category / Description
Product Software
Integrated Risk Management Software — formerly known as Governance Risk & Compliance (GRC)
Digital Risk Management Software — DRM Vendor Risk Management Software — VRM Business Continuity Management Software — BCM Audit Management Software — AM Corporate Compliance and Oversight Software — CCO Enterprise Legal Management Software — ELM Other Integrated Risk Management Software (e.g. Ethic and Compliance, Privacy Risks, Security Awareness Program Platforms, Security Awareness Content Development and Delivery Systems, Phishing Simulation Testing and Remediation/Response Platform, Security training software …)
Product Hardware
Network security equipment
Firewall Equipment, Intrusion Detection and Prevention Systems, Network Access Control Equipment, Network Detection and Response, Zero Trust Network Access
Hardware security module Hardware Security Module — HSM
Semiconductors with Integrated Hardware Security
Trusted Platform Module
Biometric-based security equipment/systems
Eyes (iris or retina) scanners, Fingerprint readers, Hand geometry readers, Facial recognition scanners, Vein recognition scanners
Services
Distribution Distribution Software resale Hardware resale Managed Services resale
Advisory & Consulting Advisory & Consulting
Strategy and Program assessment (e.g. Security architecture and design, Security strategy development, Security Governance, Security Risk Assessment, Security Policy Development, Compliance review and assessment, Data privacy program assessment, Insider risk assessment, maturity assessment) Analysis and Testing (e.g. Threat Hunting, Penetration testing, Red Team assessment, Vulnerability Assessment, Secure configuration assessment, Secure code review, Mobile Application Security testing, Internet of Things (IoT) security testing, Operational technology (OT) security testing, Cloud Security (infrastructure as a Service (IaaS), Platform as a Service (PaaS), Software as a Service (SaaS)) assessment) Remediation (e.g. Digital forensics (post event (incident / intrusion) analysis, Investigation and proof preservation) and incident response services, Data breach response services, E-discovery consulting) Security project management or staff augmentation (Provide named resources, remote or on-site, to act as an extension of the internal team) Other Advisory & Consulting (e.g. Security advisory and research, Cybersecurity Insurance, …)
Implementation services
Implementation services
Security design, engineering, and architecture development Implementation and integration, interoperability testing Implementation support (technical assistance/expert support services)
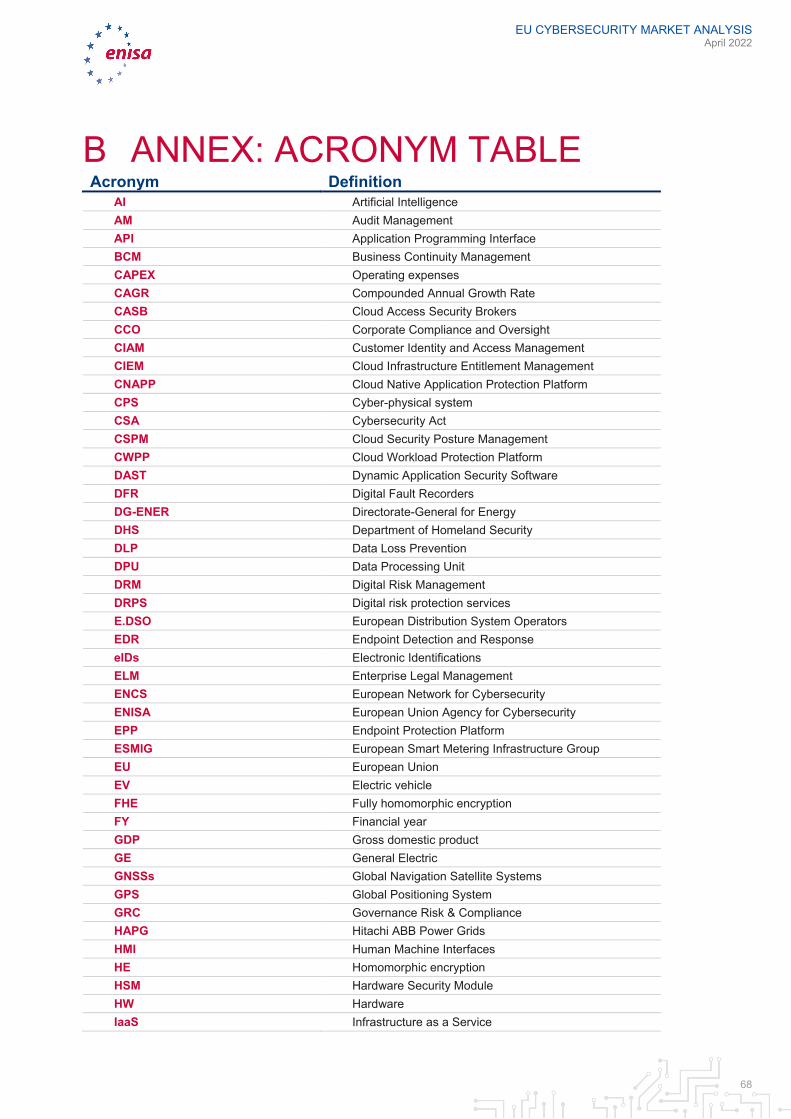
EU CYBERSECURITY MARKET ANALYSIS April 2022
68
B ANNEX: ACRONYM TABLE Acronym Definition
AI Artificial Intelligence AM Audit Management API Application Programming Interface BCM Business Continuity Management CAPEX Operating expenses CAGR Compounded Annual Growth Rate CASB Cloud Access Security Brokers CCO Corporate Compliance and Oversight CIAM Customer Identity and Access Management CIEM Cloud Infrastructure Entitlement Management CNAPP Cloud Native Application Protection Platform CPS Cyber-physical system CSA Cybersecurity Act CSPM Cloud Security Posture Management CWPP Cloud Workload Protection Platform DAST Dynamic Application Security Software DFR Digital Fault Recorders DG-ENER Directorate-General for Energy DHS Department of Homeland Security DLP Data Loss Prevention DPU Data Processing Unit DRM Digital Risk Management DRPS Digital risk protection services E.DSO European Distribution System Operators EDR Endpoint Detection and Response eIDs Electronic Identifications ELM Enterprise Legal Management ENCS European Network for Cybersecurity ENISA European Union Agency for Cybersecurity EPP Endpoint Protection Platform ESMIG European Smart Metering Infrastructure Group EU European Union EV Electric vehicle FHE Fully homomorphic encryption FY Financial year GDP Gross domestic product GE General Electric GNSSs Global Navigation Satellite Systems GPS Global Positioning System GRC Governance Risk & Compliance HAPG Hitachi ABB Power Grids HMI Human Machine Interfaces HE Homomorphic encryption HSM Hardware Security Module HW Hardware IaaS Infrastructure as a Service
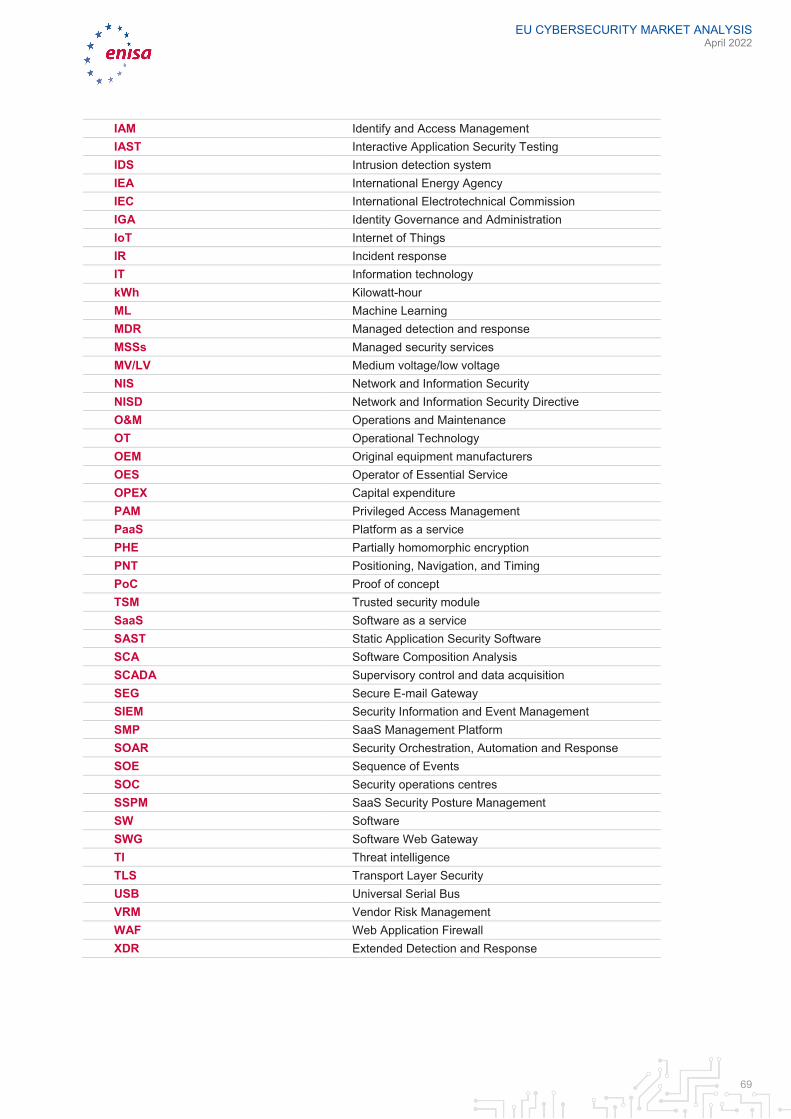
EU CYBERSECURITY MARKET ANALYSIS April 2022
69
IAM Identify and Access Management IAST Interactive Application Security Testing IDS Intrusion detection system IEA International Energy Agency IEC International Electrotechnical Commission IGA Identity Governance and Administration IoT Internet of Things IR Incident response IT Information technology kWh Kilowatt-hour ML Machine Learning MDR Managed detection and response MSSs Managed security services MV/LV Medium voltage/low voltage NIS Network and Information Security NISD Network and Information Security Directive O&M Operations and Maintenance OT Operational Technology OEM Original equipment manufacturers OES Operator of Essential Service OPEX Capital expenditure PAM Privileged Access Management PaaS Platform as a service PHE Partially homomorphic encryption PNT Positioning, Navigation, and Timing PoC Proof of concept TSM Trusted security module SaaS Software as a service SAST Static Application Security Software SCA Software Composition Analysis SCADA Supervisory control and data acquisition SEG Secure E-mail Gateway SIEM Security Information and Event Management SMP SaaS Management Platform SOAR Security Orchestration, Automation and Response SOE Sequence of Events SOC Security operations centres SSPM SaaS Security Posture Management SW Software SWG Software Web Gateway TI Threat intelligence TLS Transport Layer Security USB Universal Serial Bus VRM Vendor Risk Management WAF Web Application Firewall XDR Extended Detection and Response
TP-0
7-22
-048
-EN
-N
ABOUT ENISA The European Union Agency for Cybersecurity, ENISA, is the Union’s agency dedicated to achieving a high common level of security across Europe. Established in 2004 and strengthened by the EU security Act, the European Union Agency for security contributes to EU cyber policy, enhances the trustworthiness of ICT products, services and processes with security certification schemes, cooperates with Member States and EU bodies, and helps Europe prepare for the cyber challenges of tomorrow. Through knowledge sharing, capacity building and awareness raising, the Agency works together with its key stakeholders to strengthen trust in the connected economy, to boost resilience of the Union’s infrastructure, and, ultimately, to keep Europe’s society and citizens digitally secure. More information about ENISA and its work can be found here: www.enisa.europa.eu.
ISBN 978-92-9204-560-9 doi: 10.2824/519005
Related Documents


![ENISA-EU Nieuwsbrief - Nationaal Cyber Security Centrum · ENISA-EU Nieuwsbrief ... [ 8] en EU Member States Incident Response Developments [ 9]. €10 miljoen EU-financiering beschikbaar](https://static.cupdf.com/doc/110x72/603a9351987fbe4edf52b147/enisa-eu-nieuwsbrief-nationaal-cyber-security-centrum-enisa-eu-nieuwsbrief-.jpg)