1 THIS REPORT CONTAINS ASSESSMENTS OF COMMODITY AND TRADE ISSUES MADE BY USDA STAFF AND NOT NECESSARILY STATEMENTS OF OFFICIAL U.S. GOVERNMENT POLICY Required Report - public distribution Date: 8/24/2018 GAIN Report Number: SP1820 EU-28 Stone Fruit Annual 2018 Approved By: Jennifer Clever, Agricultural Attaché Prepared By: Carmen Valverde, Agricultural Specialist Report Highlights: EU-28 production of peaches and nectarines in MY 2018/19 is estimated at 3.5 million MT, 12 percent lower compared to the previous campaign due to unfavorable weather conditions in most of the major producing countries. Total cherry production in MY 2018/19 is projected to grow to 793,058 MT, a 30 percent increase compared with last season. This increase is supported by expected strong growth in Poland and Germany. The value of EU-28 stone fruit exports continues to decline as a result of the 2014 Russian embargo imposed on agricultural and food products, including stone fruit, from the European Union. During MY 2017/18, EU imports of U.S. cherries increased significantly, valued at $ 9.4 million, and reinstated the United States as the fourth largest non-EU supplier of cherries.

Welcome message from author
This document is posted to help you gain knowledge. Please leave a comment to let me know what you think about it! Share it to your friends and learn new things together.
Transcript
1
THIS REPORT CONTAINS ASSESSMENTS OF COMMODITY AND TRADE ISSUES MADE BY
USDA STAFF AND NOT NECESSARILY STATEMENTS OF OFFICIAL U.S. GOVERNMENT
POLICY
Required Report - public distribution
Date: 8/24/2018
GAIN Report Number: SP1820
EU-28
Stone Fruit Annual
2018
Approved By:
Jennifer Clever, Agricultural Attaché
Prepared By:
Carmen Valverde, Agricultural Specialist
Report Highlights:
EU-28 production of peaches and nectarines in MY 2018/19 is estimated at 3.5 million MT, 12 percent
lower compared to the previous campaign due to unfavorable weather conditions in most of the major
producing countries. Total cherry production in MY 2018/19 is projected to grow to 793,058 MT, a 30
percent increase compared with last season. This increase is supported by expected strong growth in
Poland and Germany. The value of EU-28 stone fruit exports continues to decline as a result of the
2014 Russian embargo imposed on agricultural and food products, including stone fruit, from the
European Union. During MY 2017/18, EU imports of U.S. cherries increased significantly, valued at $
9.4 million, and reinstated the United States as the fourth largest non-EU supplier of cherries.
2
Disclaimer: This report presents the situation and outlook for stone fruit including peaches, nectarines
and cherries in the EU-28. The report presents the views of the authors and does not reflect the official
view of the U.S. Department of Agriculture (USDA). The data are not official USDA data.
This report was written with the contributions of the following Foreign Agricultural Service analysts:
Ornella Bettini FAS/Rome covering Italy
Dimosthenis Faniadis FAS/Rome covering Greece
Xavier Audran FAS/Paris covering France
Mila Boshnakova FAS/Sofia covering Bulgaria
Mira Kobuszynska FAS/Warsaw covering Poland
Sabine Lieberz FAS/ Berlin covering Germany
Gellert Golya FAS/Budapest covering Hungary
Carmen Valverde FAS/Madrid covering Spain and Portugal
Tania de Belder FAS/USEU Brussels covering the EU policy section
Harmonized System (HS) Codes:
Peaches and nectarines HS Code 080930
Cherries HS Code 080921, 080929
Abbreviations and definitions used in this report
CAP Common Agricultural Policy
CMO Common Market Organization
EC European Commission
EU European Union
FAS Foreign Agricultural Service
GTA Global Trade Atlas
MY Marketing year: January/December
MS EU Member State
MT Metric ton (1,000 kg)
MMT Million Metric Tons
PS&D Production, Supply and Demand
USD U.S. Dollar
Note: The European Union Member States (MS) are mandated to annually provide the EU Commission
with data concerning the “production area” of permanent crops. This means “the area that can
potentially be harvested in the reference harvest year. It excludes all non-producing areas, such as new
plantations that have not yet started to produce” (Regulation (EC) No 543/2009 of the European
Parliament and of the Council of 18 June 2009, Article 2 (f)). In this report, this corresponds to the line
3
“Planted Area.” Not all MS publish harvested data. Hence, in this report, the line “Area Harvested” is a
FAS Post estimate.
Executive Summary
Production of peaches and nectarines in MY 2018/19 for the EU-28 is estimated at 3.5 million MT, 12
percent lower compared to the previous campaign due to expected lower production in most of the major
producing countries due to unfavorable weather conditions, with a long winter and a wet and cold
spring, which reduced the volume harvested. According to FAS post projections, the area planted is
projected to remain stable in MY 2018/19 at around 228,000 ha.
In MY 2018/19 fresh consumption of peaches and nectarines is projected to decrease to 2.6 MMT. Use
of peaches and nectarines for processing may also decrease to 711,480 MT as a result of the lower
supply compared to previous year.
In the first half of 2018 EU-28 imports of peaches and nectarines rose 23 percent with increased imports
from Chile and Turkey. Imports may increase further due to lower production forecasts in MY 2018/19.
In MY 2017/18, the EU’s imports of peaches and nectarines were 27,124 MT, 13 percent lower than the
previous year due to the decrease in production valued at $66 million mainly from South Africa, Chile
and Morocco.
The EU is a net exporter of peaches and nectarines with exports largely exceeding imports. During the
first half of 2018, EU-28 exports of peaches and nectarines declined 37 percent due to lower production
forecasts in MY 2018/19. In MY 2017/18, the EU’s exports of peaches and nectarines were valued at
$180 million, a 10 percent increase with 11 percent higher volume exported from the previous year
reaching 250,906 MT. The main destination for EU-28 peaches and nectarines in MY 2017/18 was
Belarus followed by Switzerland and Ukraine.
On August 7, 2014, the Russian government implemented a one year ban on a range of agricultural and
food products, including stone fruit, from the United States, the European Union, Canada, Australia, and
Norway. This ban has been extended at least until the end of 2018. After two years of the
implementation of the Russian embargo, EU-28 peaches and nectarines exports to Russia continue to be
negligible costing an estimated $170 million.
Total cherry production in MY 2018/19 is projected at 793,058 MT, a 30 percent increase compared
with last season, due to the expected strong growth in Poland and Germany. According to FAS
projections, the updated data for the total EU planted area for cherries is estimated at around 158,000 ha
in MY 2018/19. In the main producing regions of France, there were reports of heavy pest and fungal
infestation, especially Drosophila Suzukii and Moniliosis in several production areas. France’s 2016
decision to ban a pesticide (Dimethoate) efficient against Drosophila Suzukii has enhanced crop losses.
4
Consumption of fresh cherries in the EU may rise with an estimated volume of around 481,000 MT in
MY 2018/19. Also cherries for processing may also increase in MY 2018/19 recovering to normal levels
primarily due to the rebound in Polish production, the EU’s largest cherry processor.
In the last two years, the EU has become a net importer of cherries sourced mostly from Turkey, the
world’s leading cherry producer. In MY 2017/18, the EU imports of fresh cherries dropped 17 percent,
valued at $181 million with a total volume of 48,657 MT. As a result of lower EU cherry production in
2017, the United States recovered its position as the fourth largest non-EU supplier of cherries to EU-28,
valued at $9.4 million. However, in MY 2018/19, EU-28 imports of cherries may lower due to the
expected growth in EU cherry production.
The EU exports of fresh cherries in MY 2017/18 were valued at $30 million, a 15 percent decrease from
the previous year with 44 percent lower volume, reaching 13,989 MT. This is the lowest level of exports
in the last five years. The main destinations for EU-28 cherries in MY 2017/18 were Serbia,
Switzerland and Belarus as EU-28 cherry exports to Russia were negligible due to the Russian embargo
after two consecutive years, costing $41 million.
5
Commodities
Fresh Peaches & Nectarines
The main EU-28 producers of peaches and nectarines are Spain, Italy, Greece and France, in this order.
There is also limited production in other EU MS, including Hungary, Portugal, Bulgaria and Poland.
Italy used to be the EU’s largest producer but in recent years Spain has become the biggest producer and
exporter due to its early season harvest and yielding varieties. Greece is the leading EU peach
processor.
Production
Production of peaches and nectarines in MY 2018/19 for the EU-28 is estimated at 3.5 million MT, 12
percent lower compared to the previous campaign due to an expected decrease in most of the major
producing countries. Fruit quality is expected to be good. Production in the main producing countries is
shown in Table 1 below.
The EU area planted of peaches and nectarines in MY 2017/18 is around 228,000 ha. According to FAS
post projections, the area planted is projected to remain stable in MY 2018/19 at around 228,000 ha.
This is the result of productivity gains achieved with the introduction of new and higher yielding
varieties that bring more diversity in the types of fruit and spread in harvest dates.
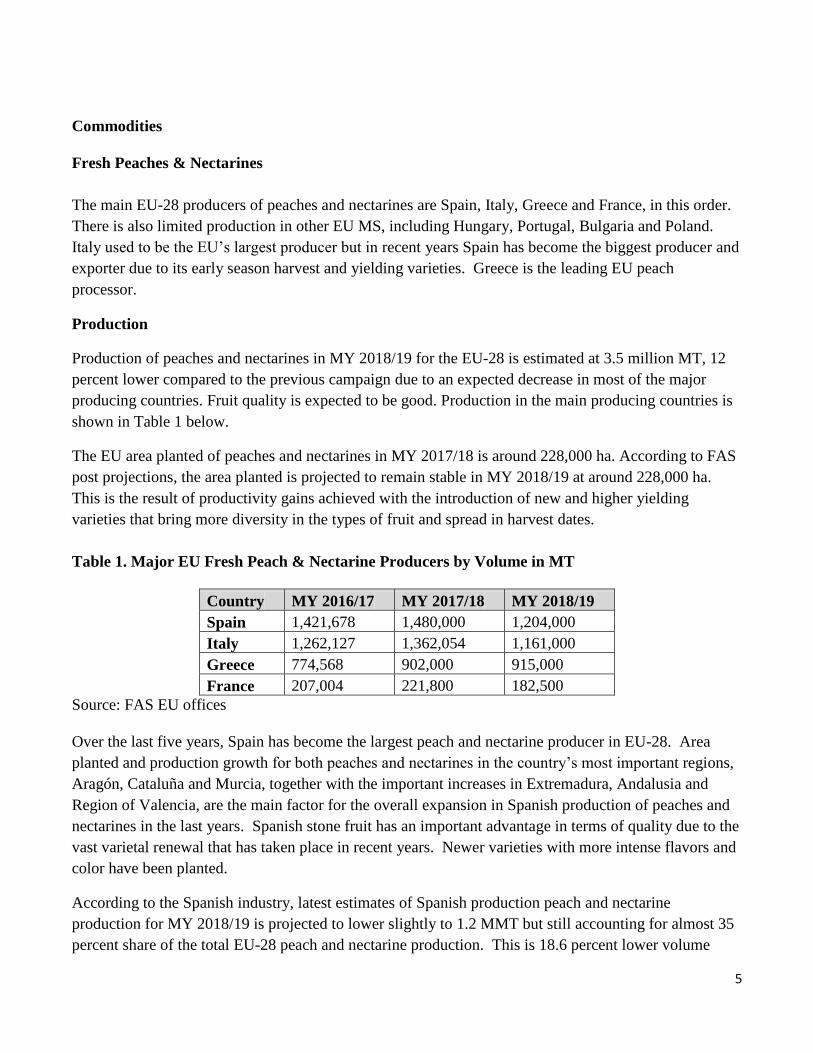
Table 1. Major EU Fresh Peach & Nectarine Producers by Volume in MT
Country MY 2016/17 MY 2017/18 MY 2018/19
Spain 1,421,678 1,480,000 1,204,000
Italy 1,262,127 1,362,054 1,161,000
Greece 774,568 902,000 915,000
France 207,004 221,800 182,500
Source: FAS EU offices
Over the last five years, Spain has become the largest peach and nectarine producer in EU-28. Area
planted and production growth for both peaches and nectarines in the country’s most important regions,
Aragón, Cataluña and Murcia, together with the important increases in Extremadura, Andalusia and
Region of Valencia, are the main factor for the overall expansion in Spanish production of peaches and
nectarines in the last years. Spanish stone fruit has an important advantage in terms of quality due to the
vast varietal renewal that has taken place in recent years. Newer varieties with more intense flavors and
color have been planted.
According to the Spanish industry, latest estimates of Spanish production peach and nectarine
production for MY 2018/19 is projected to lower slightly to 1.2 MMT but still accounting for almost 35
percent share of the total EU-28 peach and nectarine production. This is 18.6 percent lower volume
6
compared to the previous season due to unfavorable weather conditions, with a long winter and a wet
and cold spring, which reduced the volume harvested.
In Italy, Campania, Emilia-Romagna, Piemonte, Sicilia, Puglia, Calabria, Basilicata, and Veneto are the
main producing regions. Italy’s MY 2018/19 peach and nectarine production is forecast at 1,161,000
MT, 15 percent lower than the previous campaign due to the end of February frost that affected the
South. In addition, further area reductions in Emilia-Romagna, Piemonte, Veneto, and Basilicata due to
the Sharka disease also support the lower forecast. Italian crop area is around 67,000 ha.
According to the Greek industry, there are approximately 50,000 hectares currently cultivated
for peaches and nectarines. The main producing areas include four areas (Imathia, Pella, Pieria,
and Kozani) of Central Macedonia located in northern Greece, and the area of Larissa, in
Thessaly, Central Greece. Most of the crop is harvested in June and July. Greece’s MY
2018/19 peach and nectarine production is preliminary forecasted to slightly increase by 1.4
percent. July rains did not affect early peach and nectarine varieties but significantly reduced
the yields of the late varieties. Greece’s MY2018/19 cling peach crop is forecast to increase by
5.3 percent (400,000 MT), due to new plantations entering production.
2018 France’s peaches and nectarines crop is expected to be down 18 percent from 2017 due to
unfavorable weather condition in the spring (late frost followed by excess of moisture), and down 17
percent from the 5 years average due to lower production area. Peach and Nectarine orchards continued
to shrink due to poor economic conditions for peach producers in recent years combined with losses of
trees due to the Sharka disease.
Consumption
In MY 2018/19 fresh consumption of peaches and nectarines is projected to decrease to 2.6 MMT. Use
of peaches and nectarines for processing may also decrease to 711,480 MT as a result of the lower
supply compared to previous year.
Most Italian and Spanish peaches and nectarines are consumed fresh. Consumers in southern countries
generally prefer large, sweet, and pulpy fruits, while the North European markets prefer smaller, slightly
sour, and crunchy fruits.
Greece is the major peach processor in the EU followed by Spain. Greek nectarine production
is destined mainly for the fresh market; Freestone peach varieties are used for fresh
consumption, while clingstone varieties are predominantly used in processing.
Trade
7
The EU is a net exporter of peaches and nectarines with exports largely exceeding imports.
Imports
As seen in Table 2 below, the main suppliers of peaches and nectarines to the EU-28 in MY 2017/18
were South Africa, Chile and Morocco. Morocco’s main destination of peaches and nectarines to the EU
is mainly France. France has a massive peaches and nectarines trade deficit, with more than half of total
imports sourced in the southern hemisphere and imported during the European off-season. In MY
2017/18, the EU’s imports of peaches and nectarines were 27,124 MT, 13 percent lower than previous
year due to the decrease in production valued at $66 million.
In the first half of 2018 EU-28 imports of peaches and nectarines rose 23 percent with increased imports
from Chile and Turkey. Imports may increase further due to a reduction of production forecasts in MY
2018/19.
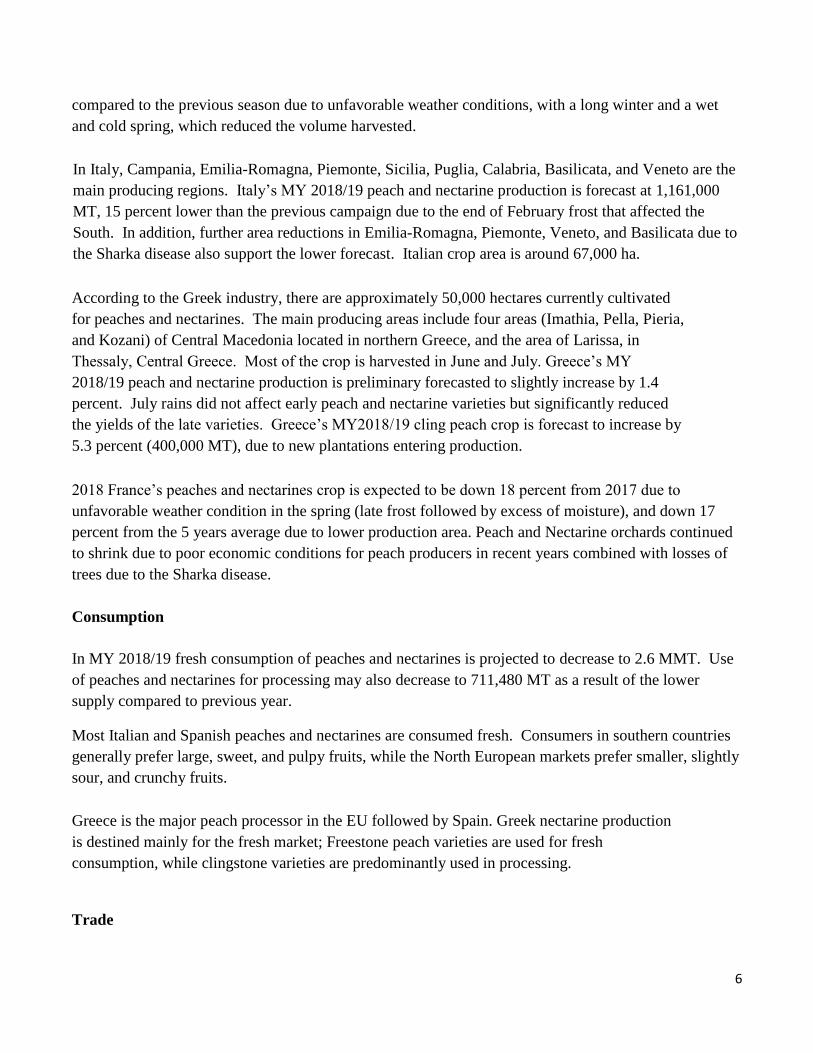
Table 2. EU-28 Imports of Fresh Peaches & Nectarines by Origin in MT
Country of Origin MY 2015/16 MY 2017/18 MY 2018/19
South Africa 8,881 11,327 10,023
Chile 9,924 10,208 8,775
Morocco 4,791 3,626 3,963
Turkey 1,580 3,363 2,283
Others 3,054 2,674 2,080
Total Imports 28,230 31,198 27,124
Source: GTA
8
Exports
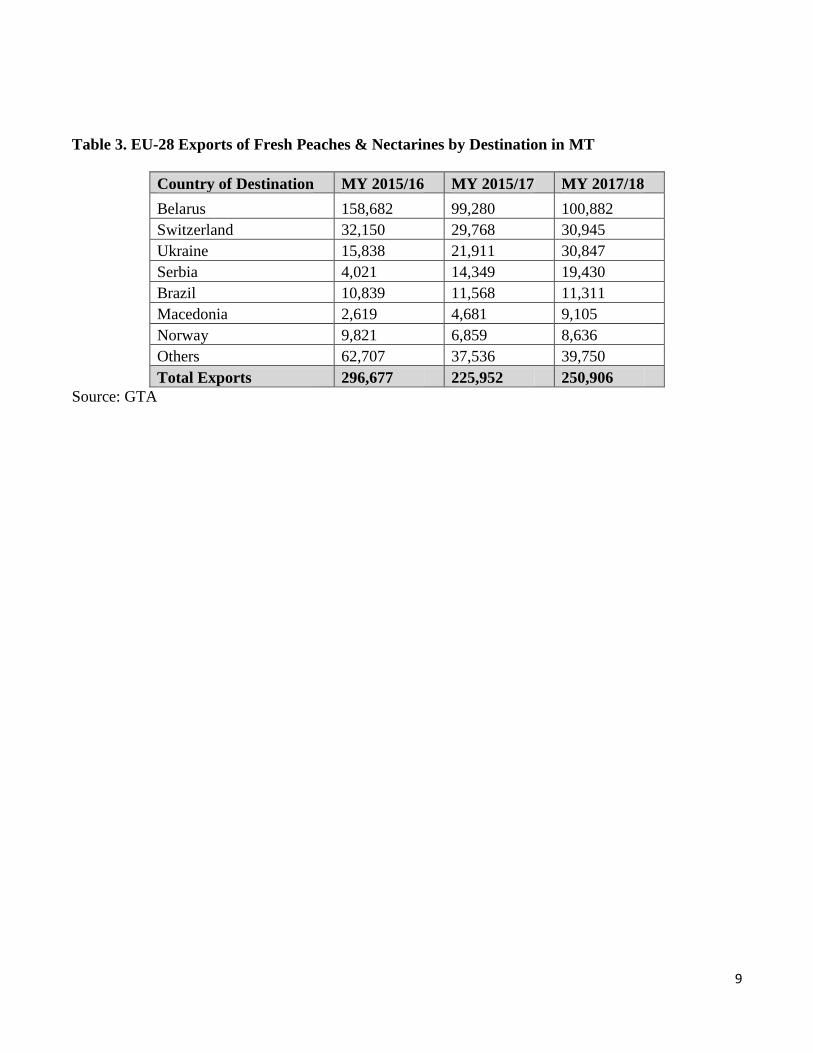
In MY 2017/18, the EU’s exports of peaches and nectarines were valued at $180 million, a 10 percent
increase with 11 percent higher volume exported from the previous year reaching 250,906 MT. The
main destination for EU-28 peaches and nectarines in MY 2017/18 was Belarus followed by
Switzerland and Ukraine (See Table 3). Exports of peaches and nectarines to Serbia grew significantly
in MY 2016/17 and continued growing in MY 2017/18, primarily from Greece. EU-28 peaches and
nectarines exports to Russia were negligible due to the Russian embargo imposed on agricultural and
food products, including stone fruit, from the European Union (See Policy Section) after two
consecutive years, costing $170 million.
The EU’s major producers compete for sales within the European market. Thanks to an earlier
harvesting period with high quality products, Spain continues to dominate the European market.
Spanish total exports in 2017 were 930,681 MT, 95 percent of which went mainly to the EU-28. The
loss of the Russian market due to the 2014 Russian embargo was compensated by an increase of exports
to other Member States and to third countries such as Switzerland or Brazil. Also exports to Canada
grew significantly in MY 2017/18. In July 2016, China authorized imports of peaches from Spain, but
year-to-date Spanish peach exports to China are negligible.
In 2017, Italy exported 222,235 MT of peaches and nectarines, 2.7 percent lower than the previous year
due to reduced volumes sent to Germany (-16 percent), the leading destination, representing 36 percent
of total exports.
In the first half of 2018, EU-28 exports of peaches and nectarines declined 37 percent due to the drop in
production forecasts in MY 2018/19. Due to a reduction of production forecasts in MY 2018/19 exports
may decrease.
9
Table 3. EU-28 Exports of Fresh Peaches & Nectarines by Destination in MT
Country of Destination MY 2015/16 MY 2015/17 MY 2017/18
Belarus 158,682 99,280 100,882
Switzerland 32,150 29,768 30,945
Ukraine 15,838 21,911 30,847
Serbia 4,021 14,349 19,430
Brazil 10,839 11,568 11,311
Macedonia 2,619 4,681 9,105
Norway 9,821 6,859 8,636
Others 62,707 37,536 39,750
Total Exports 296,677 225,952 250,906
Source: GTA
10
Production, Supply and Demand Data
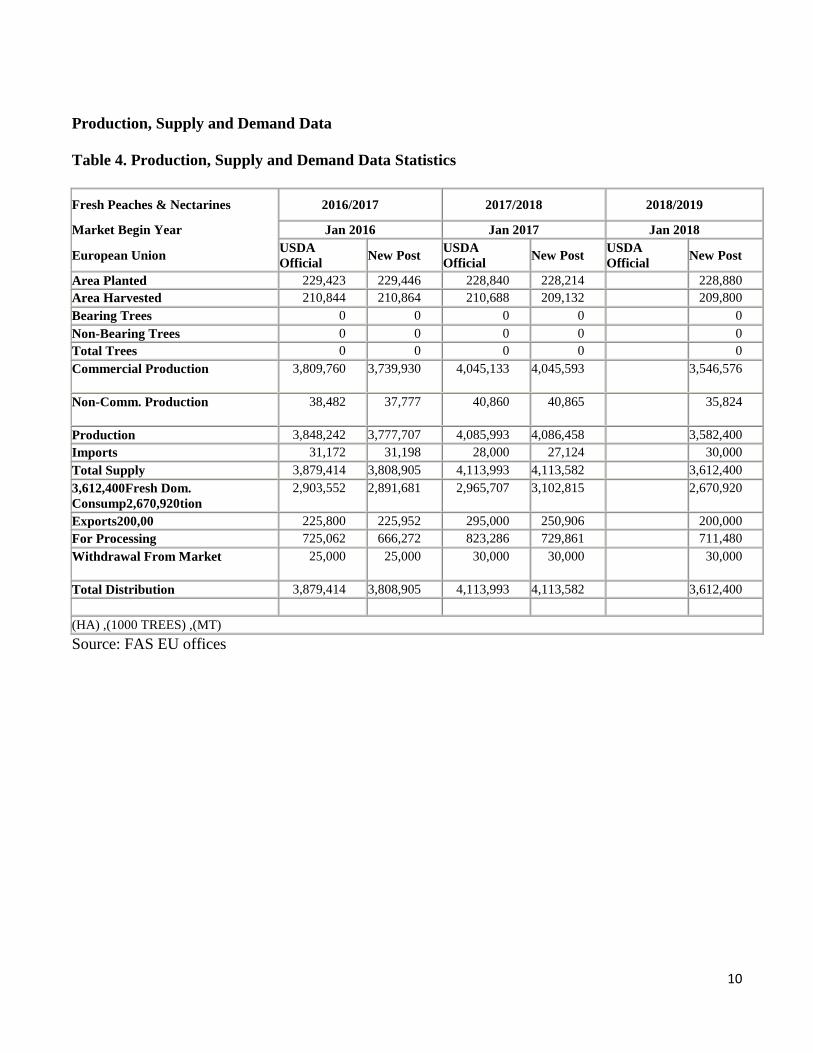
Table 4. Production, Supply and Demand Data Statistics
Fresh Peaches & Nectarines 2016/2017 2017/2018 2018/2019
Market Begin Year Jan 2016 Jan 2017 Jan 2018
European Union USDA
Official New Post
USDA
Official New Post
USDA
Official New Post
Area Planted 229,423 229,446 228,840 228,214 228,880
Area Harvested 210,844 210,864 210,688 209,132 209,800
Bearing Trees 0 0 0 0 0
Non-Bearing Trees 0 0 0 0 0
Total Trees 0 0 0 0 0
Commercial Production 3,809,760 3,739,930 4,045,133 4,045,593 3,546,576
Non-Comm. Production 38,482 37,777 40,860 40,865 35,824
Production 3,848,242 3,777,707 4,085,993 4,086,458 3,582,400
Imports 31,172 31,198 28,000 27,124 30,000
Total Supply 3,879,414 3,808,905 4,113,993 4,113,582 3,612,400
3,612,400Fresh Dom.
Consump2,670,920tion
2,903,552 2,891,681 2,965,707 3,102,815 2,670,920
Exports200,00 225,800 225,952 295,000 250,906 200,000
For Processing 725,062 666,272 823,286 729,861 711,480
Withdrawal From Market 25,000 25,000 30,000 30,000 30,000
Total Distribution 3,879,414 3,808,905 4,113,993 4,113,582 3,612,400
(HA) ,(1000 TREES) ,(MT)
Source: FAS EU offices
11
Commodities
Fresh Cherries (Sweet & Sour)
The main EU-28 producers of fresh cherries are Poland, Spain and Italy. Traditionally Germany was in
forth position but in the last few years, Greece and Hungary have surpassed German cherry production
(See Table 5). There is also limited production in other EU MS, including Bulgaria, France and
Portugal. Poland is the EU’s largest cherry processor transforming 75 percent of its cherry production.
Spain is the biggest exporter due to its early season harvest and Germany the biggest EU importer of
cherry. Italy is the number one consumer of fresh cherries.
Production
Total cherry production in MY 2018/19 is projected at 793,058 MT, or 30 percent increase compared
with last season, due to the expected strong growth in Poland and Germany.
According to FAS projections, the updated data of total EU planted area of cherries estimates an area of
around 158,000 ha in MY 2018/19.
Post’s MY 2018/19 forecast for Poland’s total sweet and sour cherries production stands at 260,000 MT.
This could be a record harvest for Poland in recent years. This year, tree fruit yield has been very
abundant, compared to MY 2017/18 when the cherry crop hit a record low. Therefore, in MY 2018/19
the percentage increase in cherry production will show a rise of 185 percent compared to the previous
year. The total production number consists of 200,000 MT sour cherries and 60,000 MT sweet cherries.
In MY 2018/19, cherry orchard’s acreage remained unchanged in comparison with the previous year,
and amounted to 39,000 hectares.
The winter was mild, and in the most regions of Poland there were no winterkills in cherry orchards.
The higher-than-average air temperatures in April, rapidly accelerated the development of fruit trees by
two weeks earlier than usual, and shortened the flowering period. Very dry weather conditions adversely
affected flowering of very young orchards. Older trees with a well-developed root system were in a
very good shape despite the lack of rain, and very low soil moisture. Fruit quality is generally good.
The occurrence of diseases and pests was significantly reduced in MY 2018/19.
Italy’s MY 2018/19 cherry production is preliminarily forecast at 96,000 MT, a decrease of
approximately 19 percent compared to the previous marketing year. The decrease is attributed to cold
temperatures at the end of February that delayed flowering, followed by hail and rain from mid-May to
mid-June. Fruit quality is expected to be good and fruit size small and medium. Puglia, Campania,
Emilia-Romagna, and Veneto are the leading producing areas. In addition, new orchards are entering
production in Trentino. Bigarreau, Regina, Kordia, Giorgia, and Ferrovia are the main cherry varieties
grown in Italy.
12
Spanish cherry production for MY 2018/19 is projected at 103,758 MT, 3.5 percent higher than the
previous year’s level. The main cherry producing areas are Extremadura, accounting for over 35 percent
of Spain’s total, and Aragon, responsible for over 20 percent of Spain’s production. In Spain, cherry
harvesting takes place from the end of April through mid-August. The dominant varieties are:
Napoleon, which is sold fresh and used for jams; Ambrunesa, which is a late variety with a crispy
consistency and sweet taste; and, Burlat, an early harvested variety bearing a thick fruit with red, strong,
juicy and sweet pulp. Some new varieties include Starking, Lapins, Summit, Vittoria, Van (California),
Picota and Sandy. The sour varieties include Richmond, Montmorency, and Morello.
Greece’s MY 2018/19 cherry season is forecast to increase 5.3 percent due to favorable weather
conditions during fruit setting. The extensive rainfall that occurred on the harvest period resulted in
production loss in the main producing areas of Northern Greece. However, fruit quality is expected to
be good. Pella, Imathia, Kozani (Northern Greece), and Larissa, Lamia (Central Greece) are the leading
producing areas.
Hungary is one of Europe’s largest sour cherry producers. The area planted with sour cherries is 14,400
ha, and it is harvested on about 13,000 ha. Domestic varieties are almost exclusively cultivated in the
country. Technology and production level varies widely. In 2018, flowering was strong and clement
weather and high pollination activity helped the fruit set. Night frosts did not damage cherry orchards.
Hence, production in MY 2018/19 is expected to be higher than the previous year. Annual sweet cherry
production is around 11,000MT in Hungary and is expected to remain flat in 2018 because of spring
frosts and notable fruit drop after flowering. New Hungarian hybrids, such as “Carmen”, “Rita” and
“Vera” are getting more popular among farmers.
Total German cherry production for MY 2018/19 is estimated at 61,100 MT. This is 2.5 times the
production of the preceding year when devastating frost in mid-April 2017 led to a record low
production. This also represent a 34 percent increase compared to the historical (2008-2017) ten-year
average. Sweet cherry production is estimated at 44,300 MT and tart cherries at 16,800 MT.
Bulgaria expects increase in cherry harvested areas, yields and production with 15 percent more
harvested areas, 18 percent higher yields and 36 percent increase in total cherry production.
France’s cherries crop in 2018 is expected to reach a record low, down 30 percent from 2017 due to poor
weather conditions (excess of moisture leading to fruit rot) enhanced by heavy losses due to insect
attacks (namely Drosophila Suzukii). Area planted for cherry trees continued to decline as old orchards
are no systematically renewed. Producers blame the lack of new disease resistant varieties as well as the
high production cost. In the main producing regions (southern half of France), there were reports of
heavy pest and fungal infestation, especially Drosophila Suzukii and Moniliosis in several production
areas. The 2016 French decision to ban a pesticide (Dimethoate) efficient against Drosophila Suzukii
have enhanced the losses (See Policy Section).
13
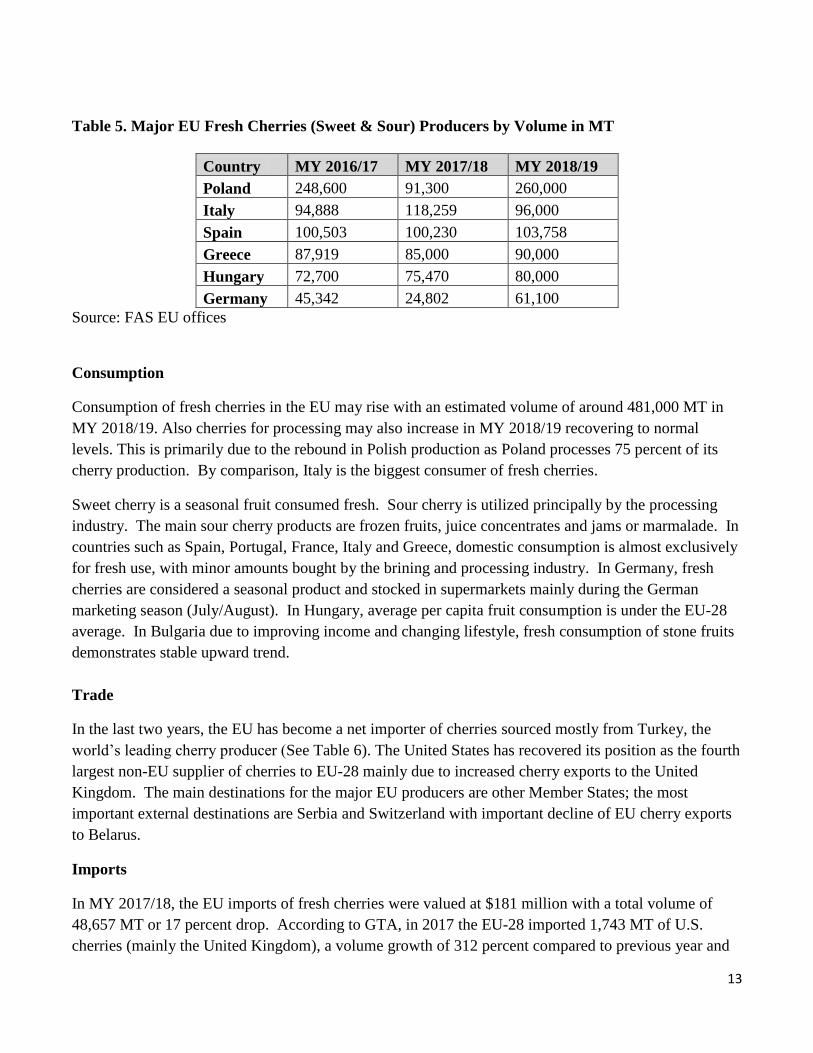
Table 5. Major EU Fresh Cherries (Sweet & Sour) Producers by Volume in MT
Country MY 2016/17 MY 2017/18 MY 2018/19
Poland 248,600 91,300 260,000
Italy 94,888 118,259 96,000
Spain 100,503 100,230 103,758
Greece 87,919 85,000 90,000
Hungary 72,700 75,470 80,000
Germany 45,342 24,802 61,100
Source: FAS EU offices
Consumption
Consumption of fresh cherries in the EU may rise with an estimated volume of around 481,000 MT in
MY 2018/19. Also cherries for processing may also increase in MY 2018/19 recovering to normal
levels. This is primarily due to the rebound in Polish production as Poland processes 75 percent of its
cherry production. By comparison, Italy is the biggest consumer of fresh cherries.
Sweet cherry is a seasonal fruit consumed fresh. Sour cherry is utilized principally by the processing
industry. The main sour cherry products are frozen fruits, juice concentrates and jams or marmalade. In
countries such as Spain, Portugal, France, Italy and Greece, domestic consumption is almost exclusively
for fresh use, with minor amounts bought by the brining and processing industry. In Germany, fresh
cherries are considered a seasonal product and stocked in supermarkets mainly during the German
marketing season (July/August). In Hungary, average per capita fruit consumption is under the EU-28
average. In Bulgaria due to improving income and changing lifestyle, fresh consumption of stone fruits
demonstrates stable upward trend.
Trade
In the last two years, the EU has become a net importer of cherries sourced mostly from Turkey, the
world’s leading cherry producer (See Table 6). The United States has recovered its position as the fourth
largest non-EU supplier of cherries to EU-28 mainly due to increased cherry exports to the United
Kingdom. The main destinations for the major EU producers are other Member States; the most
important external destinations are Serbia and Switzerland with important decline of EU cherry exports
to Belarus.
Imports
In MY 2017/18, the EU imports of fresh cherries were valued at $181 million with a total volume of
48,657 MT or 17 percent drop. According to GTA, in 2017 the EU-28 imported 1,743 MT of U.S.
cherries (mainly the United Kingdom), a volume growth of 312 percent compared to previous year and
14
valued at $9.4 million. The increase in imports from the U.S. was in response to the lower EU cherry
production in 2017. In MY 2018/19, as the EU cherry production is expected to rise, U.S. cherry
exports may return to normal levels.
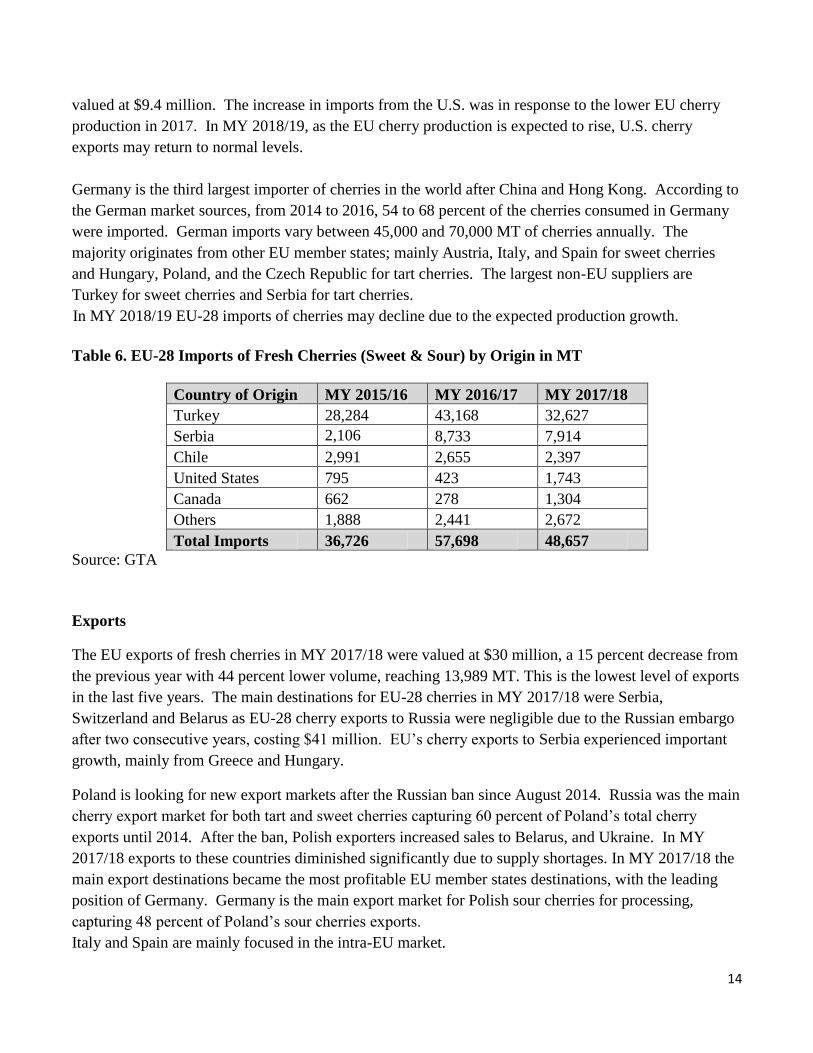
Germany is the third largest importer of cherries in the world after China and Hong Kong. According to
the German market sources, from 2014 to 2016, 54 to 68 percent of the cherries consumed in Germany
were imported. German imports vary between 45,000 and 70,000 MT of cherries annually. The
majority originates from other EU member states; mainly Austria, Italy, and Spain for sweet cherries
and Hungary, Poland, and the Czech Republic for tart cherries. The largest non-EU suppliers are
Turkey for sweet cherries and Serbia for tart cherries.
In MY 2018/19 EU-28 imports of cherries may decline due to the expected production growth.
Table 6. EU-28 Imports of Fresh Cherries (Sweet & Sour) by Origin in MT
Country of Origin MY 2015/16 MY 2016/17 MY 2017/18
Turkey 28,284 43,168 32,627
Serbia 2,106 8,733 7,914
Chile 2,991 2,655 2,397
United States 795 423 1,743
Canada 662 278 1,304
Others 1,888 2,441 2,672
Total Imports 36,726 57,698 48,657
Source: GTA
Exports
The EU exports of fresh cherries in MY 2017/18 were valued at $30 million, a 15 percent decrease from
the previous year with 44 percent lower volume, reaching 13,989 MT. This is the lowest level of exports
in the last five years. The main destinations for EU-28 cherries in MY 2017/18 were Serbia,
Switzerland and Belarus as EU-28 cherry exports to Russia were negligible due to the Russian embargo
after two consecutive years, costing $41 million. EU’s cherry exports to Serbia experienced important
growth, mainly from Greece and Hungary.
Poland is looking for new export markets after the Russian ban since August 2014. Russia was the main
cherry export market for both tart and sweet cherries capturing 60 percent of Poland’s total cherry
exports until 2014. After the ban, Polish exporters increased sales to Belarus, and Ukraine. In MY
2017/18 exports to these countries diminished significantly due to supply shortages. In MY 2017/18 the
main export destinations became the most profitable EU member states destinations, with the leading
position of Germany. Germany is the main export market for Polish sour cherries for processing,
capturing 48 percent of Poland’s sour cherries exports.
Italy and Spain are mainly focused in the intra-EU market.
15
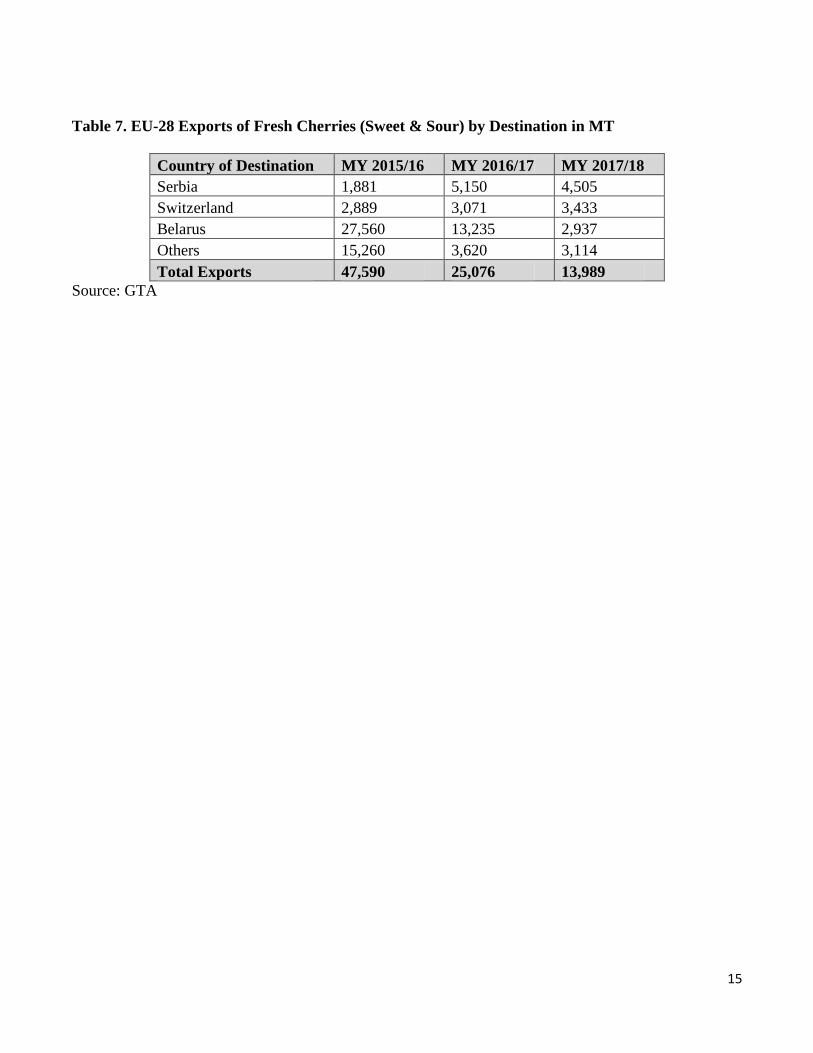
Table 7. EU-28 Exports of Fresh Cherries (Sweet & Sour) by Destination in MT
Country of Destination MY 2015/16 MY 2016/17 MY 2017/18
Serbia 1,881 5,150 4,505
Switzerland 2,889 3,071 3,433
Belarus 27,560 13,235 2,937
Others 15,260 3,620 3,114
Total Exports 47,590 25,076 13,989
Source: GTA
16
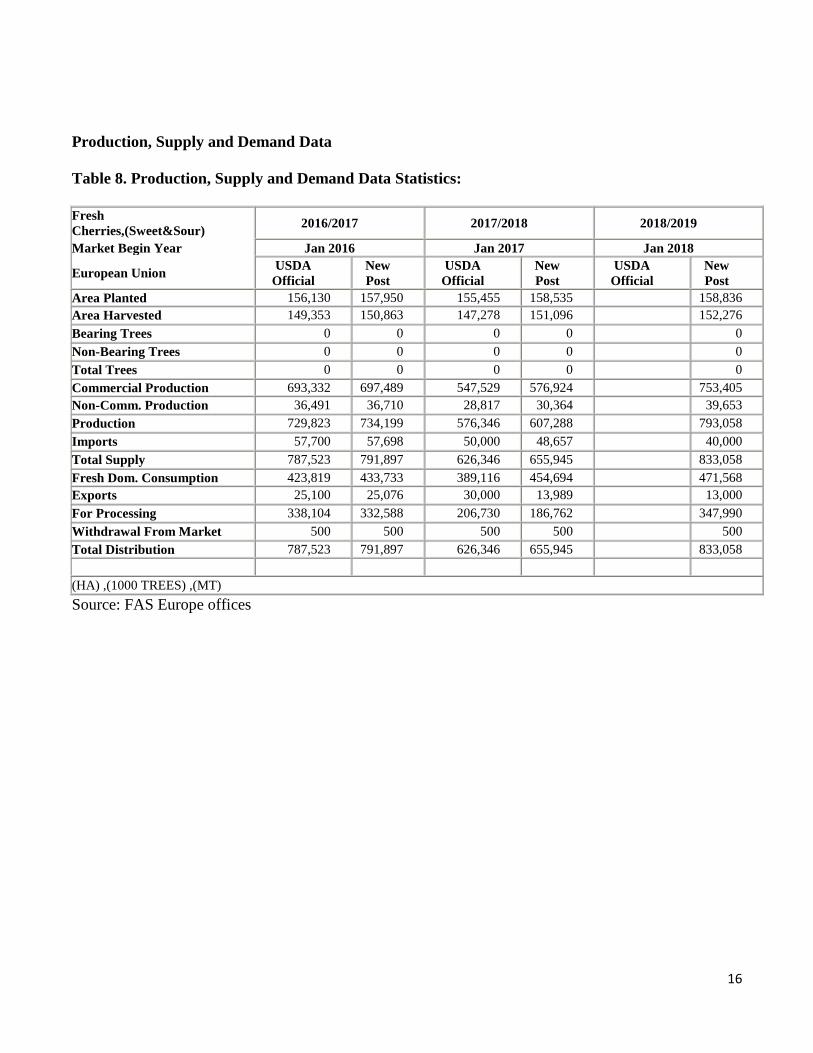
Production, Supply and Demand Data
Table 8. Production, Supply and Demand Data Statistics:
Fresh
Cherries,(Sweet&Sour) 2016/2017 2017/2018 2018/2019
Market Begin Year Jan 2016 Jan 2017 Jan 2018
European Union USDA
Official
New
Post
USDA
Official
New
Post
USDA
Official
New
Post
Area Planted 156,130 157,950 155,455 158,535 158,836
Area Harvested 149,353 150,863 147,278 151,096 152,276
Bearing Trees 0 0 0 0 0
Non-Bearing Trees 0 0 0 0 0
Total Trees 0 0 0 0 0
Commercial Production 693,332 697,489 547,529 576,924 753,405
Non-Comm. Production 36,491 36,710 28,817 30,364 39,653
Production 729,823 734,199 576,346 607,288 793,058
Imports 57,700 57,698 50,000 48,657 40,000
Total Supply 787,523 791,897 626,346 655,945 833,058
Fresh Dom. Consumption 423,819 433,733 389,116 454,694 471,568
Exports 25,100 25,076 30,000 13,989 13,000
For Processing 338,104 332,588 206,730 186,762 347,990
Withdrawal From Market 500 500 500 500 500
Total Distribution 787,523 791,897 626,346 655,945 833,058
(HA) ,(1000 TREES) ,(MT)
Source: FAS Europe offices
17
Trade Shows
Trade fairs play a key role in presenting new products to the trade or in finding additional buyers and
importers. The most important trade shows related to the fruit and vegetable sectors are:
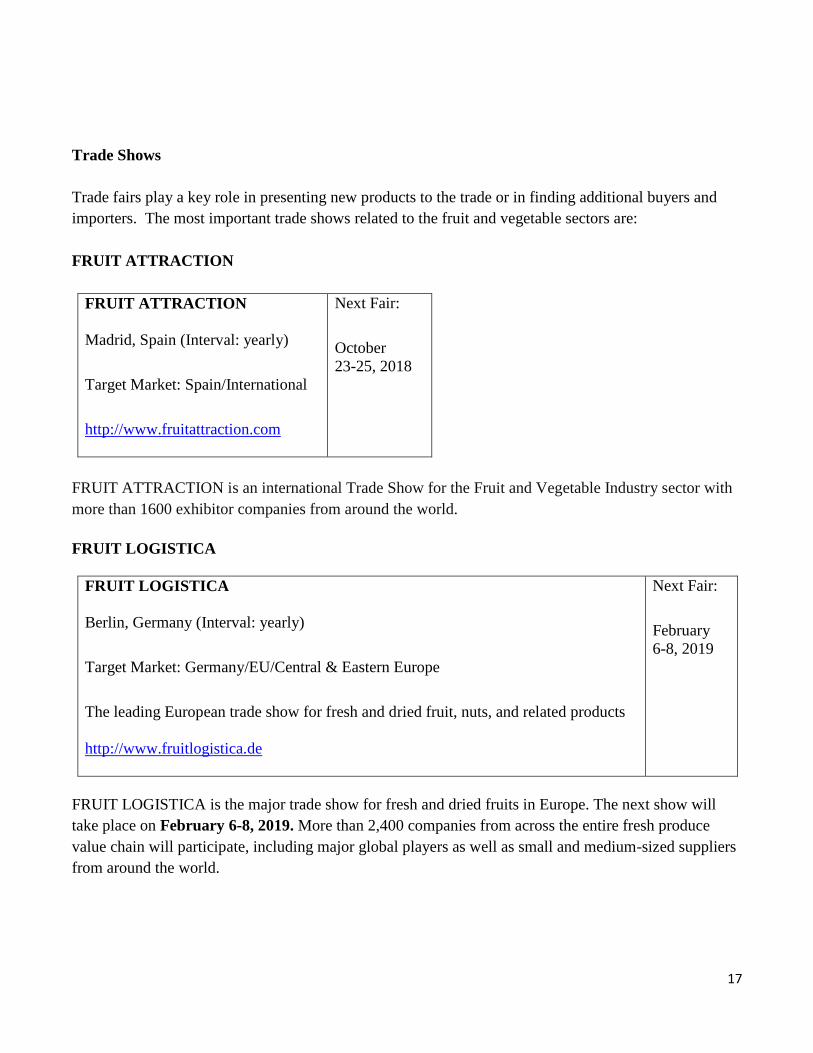
FRUIT ATTRACTION
FRUIT ATTRACTION
Madrid, Spain (Interval: yearly)
Target Market: Spain/International
http://www.fruitattraction.com
Next Fair:
October
23-25, 2018
FRUIT ATTRACTION is an international Trade Show for the Fruit and Vegetable Industry sector with
more than 1600 exhibitor companies from around the world.
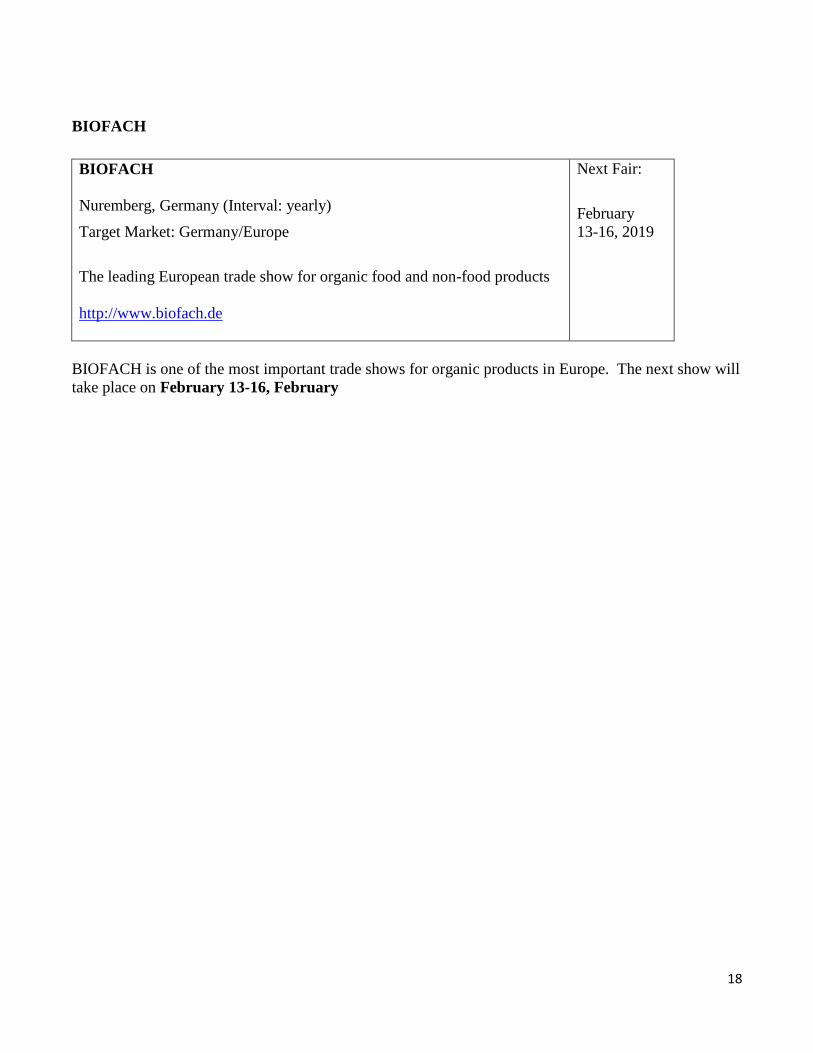
FRUIT LOGISTICA
FRUIT LOGISTICA
Berlin, Germany (Interval: yearly)
Target Market: Germany/EU/Central & Eastern Europe
The leading European trade show for fresh and dried fruit, nuts, and related products
http://www.fruitlogistica.de
Next Fair:
February
6-8, 2019
FRUIT LOGISTICA is the major trade show for fresh and dried fruits in Europe. The next show will
take place on February 6-8, 2019. More than 2,400 companies from across the entire fresh produce
value chain will participate, including major global players as well as small and medium-sized suppliers
from around the world.
18
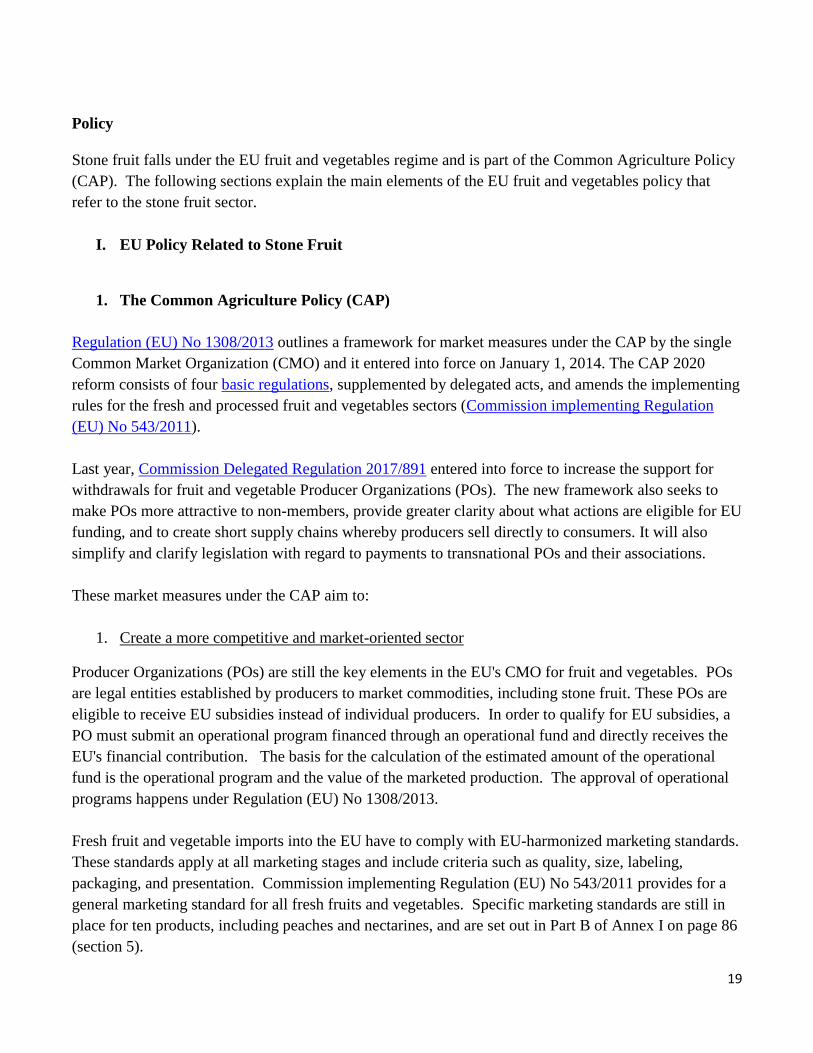
BIOFACH
BIOFACH
Nuremberg, Germany (Interval: yearly)
Target Market: Germany/Europe
The leading European trade show for organic food and non-food products
http://www.biofach.de
Next Fair:
February
13-16, 2019
BIOFACH is one of the most important trade shows for organic products in Europe. The next show will
take place on February 13-16, February
19
Policy
Stone fruit falls under the EU fruit and vegetables regime and is part of the Common Agriculture Policy
(CAP). The following sections explain the main elements of the EU fruit and vegetables policy that
refer to the stone fruit sector.
I. EU Policy Related to Stone Fruit
1. The Common Agriculture Policy (CAP)
Regulation (EU) No 1308/2013 outlines a framework for market measures under the CAP by the single
Common Market Organization (CMO) and it entered into force on January 1, 2014. The CAP 2020
reform consists of four basic regulations, supplemented by delegated acts, and amends the implementing
rules for the fresh and processed fruit and vegetables sectors (Commission implementing Regulation
(EU) No 543/2011).
Last year, Commission Delegated Regulation 2017/891 entered into force to increase the support for
withdrawals for fruit and vegetable Producer Organizations (POs). The new framework also seeks to
make POs more attractive to non-members, provide greater clarity about what actions are eligible for EU
funding, and to create short supply chains whereby producers sell directly to consumers. It will also
simplify and clarify legislation with regard to payments to transnational POs and their associations.
These market measures under the CAP aim to:
1. Create a more competitive and market-oriented sector
Producer Organizations (POs) are still the key elements in the EU's CMO for fruit and vegetables. POs
are legal entities established by producers to market commodities, including stone fruit. These POs are
eligible to receive EU subsidies instead of individual producers. In order to qualify for EU subsidies, a
PO must submit an operational program financed through an operational fund and directly receives the
EU's financial contribution. The basis for the calculation of the estimated amount of the operational
fund is the operational program and the value of the marketed production. The approval of operational
programs happens under Regulation (EU) No 1308/2013.
Fresh fruit and vegetable imports into the EU have to comply with EU-harmonized marketing standards.
These standards apply at all marketing stages and include criteria such as quality, size, labeling,
packaging, and presentation. Commission implementing Regulation (EU) No 543/2011 provides for a
general marketing standard for all fresh fruits and vegetables. Specific marketing standards are still in
place for ten products, including peaches and nectarines, and are set out in Part B of Annex I on page 86
(section 5).
20
2. Diminish crisis-related fluctuations in producers’ income
To achieve this objective, the EU offers funding under the operational programs for:
- Product withdrawal
- Green harvesting/non-harvesting;
- Promotion/communication tools;
- Training measures;
- Harvest insurance;
- Assistance to secure bank loans, and support for administrative costs associated with setting up
mutual funds.
National authorities must determine, in their national strategies, which of these instruments can receive
funds in their countries. POs may take out loans on commercial terms to finance crisis prevention and
management measures. The repayment of the capital and the interest on those loans may be eligible for
financial assistance under the operational programs of POs.
3. Encourage increased consumption of fruit and vegetables in the EU
The sector may also benefit from the European promotion budget for agricultural products and quality
schemes. The Commission reformed its promotion policy with an extension of the product scope and a
greater focus on export markets. The current promotion budget of $76 million (€60 million) will
increase annually until it reaches $255 million (€200 million) in 2020. There will be no longer need for
national co-funding and EU associations will be able to apply directly for a program.
4. Increase the use of environmentally friendly cultivation and production techniques
At least 10 percent of operational program funding must be spent on environmental actions that go
beyond mandatory environmental standards. MS with recognized POs must draw up a National
Framework for Environmental Action (NEF) as part of their “national strategy for sustainable
operational program.” The NEF must contain a non-exhaustive list of environmental actions and the
conditions applicable to them in the MS concerned.
CAP after 2020:
On 1 June 2018, the European Commission presented legislative proposals on the common agricultural
policy (CAP) beyond 2020. The aim of the new proposals is to better respond to current and future
challenges such as climate change. The CAP will continue to support European farmers, but the overall
budget is lower compared to the previous period.
For information on the CAP after 2020, please see:
https://ec.europa.eu/info/food-farming-fisheries/key-policies/common-agricultural-policy/future-cap_en
21
2. Certification of Fruit Shipments
Fruit, vegetable, and nut shipments exported to the EU require a phytosanitary certificate. A
USDA/Animal Plant Health Inspection Service (APHIS) inspector issues these certificates in accordance
with international regulations established by the International Plant Protection Convention of the Food
and Agriculture Organization of the United Nations. This standard-setting body coordinates cooperation
between nations to control plant and plant product pests and to prevent their spread.
Council Directive 2000/29/EC contains provisions concerning compulsory plant health checks. This
includes documentary, identity, and physical plant health checks to verify compliance with EU import
requirements. There is more information available on the DG Health and Food Safety (DG Sante)
website: http://ec.europa.eu/food/plant/plant_health_biosecurity/non_eu_trade/index_en.htm
Commission Regulation 1756/2004 provides for a possibility to carry out plant health checks at reduced
frequency when justified. The European Commission published the updated list of products on January
1, 2018. On an annual basis, the Commission monitors imports of fruit and vegetables to determine
how to adjust the frequency of testing consignments.
3. Maximum Residue Levels for Fruit
Maximum Residue Levels (MRLs) for pesticides, including import tolerances, have been harmonized
throughout the EU since September 2008. As a marketing tool, some retail chains in the EU adopt
private standards that exceed EU regulations by requiring their suppliers to adhere to stricter company
policies that limit the maximum residues to 30, 50, or 70 percent of the respective EU MRL. Please find
the link to the EU MRL database , as well as to the global MRL database for MRLs worldwide.
22
4. Tariffs
EU imports of fresh fruit and vegetables are subject to the Entry Price System (EPS), which has been in
place in its current form since the Uruguay Round. It is a complex tariff system, which provides a high
level of protection to EU producers. In this system, fruits and vegetables imported at or above an
established entry price are charged an ad valorem duty only. Produce valued below the entry price are
charged a tariff equivalent in addition to the ad valorem duty. The tariff equivalent is graduated for
products valued between 92 and 100 percent of the entry price. The ad valorem duty and the full tariff
equivalent are levied on imports valued at less than 92 percent of the entry price.
Commission Implementing Regulation 2017/1925 published the tariff levels for 2018.
The tariffs for stone fruit remain unchanged compared to the levels of 2017 and are on page 97 for
cherries, peaches and nectarines. The United States tends to sell high quality products at higher prices,
which typically do not face additional duties.
II. Russian ban on agricultural products
On August 7, 2014, the Russian government implemented a ban for one year on a range of agricultural
and food products, including stone fruit, from the United States, the European Union (EU), Canada,
Australia, and Norway, in response to U.S. and EU sanctions over Russian actions in Ukraine. Rather
than allow the ban to expire, Russia opted to extend it. The current extension is set to expire at the end
of 2018, but it expected to be extended again.
The CMO rules (see Regulation 1308/2013 in part I) provide various market management tools to
stabilize markets and the Commission is empowered under the reformed CAP to take "exceptional
measures" in case of market disruption. As such, the Commission introduced specific market support
measures for the European fruit and vegetable sector since the start of the ban in 2014 until 2017. The
Commission did not announce any new support measures in response to the current ban.
Please find more information on the Commission’s response to the Russian ban here:
http://ec.europa.eu/agriculture/russian-import-ban/index_en.htm
23
III. French ban of dimethoate on cherries
On April 10, 2018, the French Ministry of Agriculture published its third decree to reinstate the 2016
dimethoate ban prohibiting imports of fresh cherries (with the exception of organic cherries) from EU
Member States or countries where dimethoate can be legally used on cherry trees. The decree is valid
until December 31, 2018. Growers use dimethoate to fight Drosphila suzukii, an Asian fruit fly that
causes considerable damages in cherry orchards. France suspects it to be dangerous to human health.
France imports roughly one fifth of its consumption, the bulk coming from EU countries including some
(such as Spain, Italy and Spain) that have already banned dimethoate. The French prohibition suspends
imports of cherries from the United States since 2016, valued at around $1 million annually. For more
information, see GAIN FR1808 In 2018 France reinstates its ban on U.S. cherry imports.
IV. Upcoming reviews for MRLs on cherries, peaches and nectarines
Plant protection products (PPPs) along with maximum residue levels (MRLs) and import tolerances are
an increasingly important issue in the EU, since there is a significant reduction in the number of active
substances that are available for use. Regulation (EC) No 1107/2009 and Regulation (EC) No 396/2005
regulate PPPs and MRLs respectively. There is a consistent review of active substances for which the
approval is up for renewal, as well as their associated MRLs. Additionally, existing MRLs are also
being reviewed through a process known as an Article 12 review. The first list below indicates the
upcoming MRL reviews for the main stone fruit commodities under this Article 12 process. The second
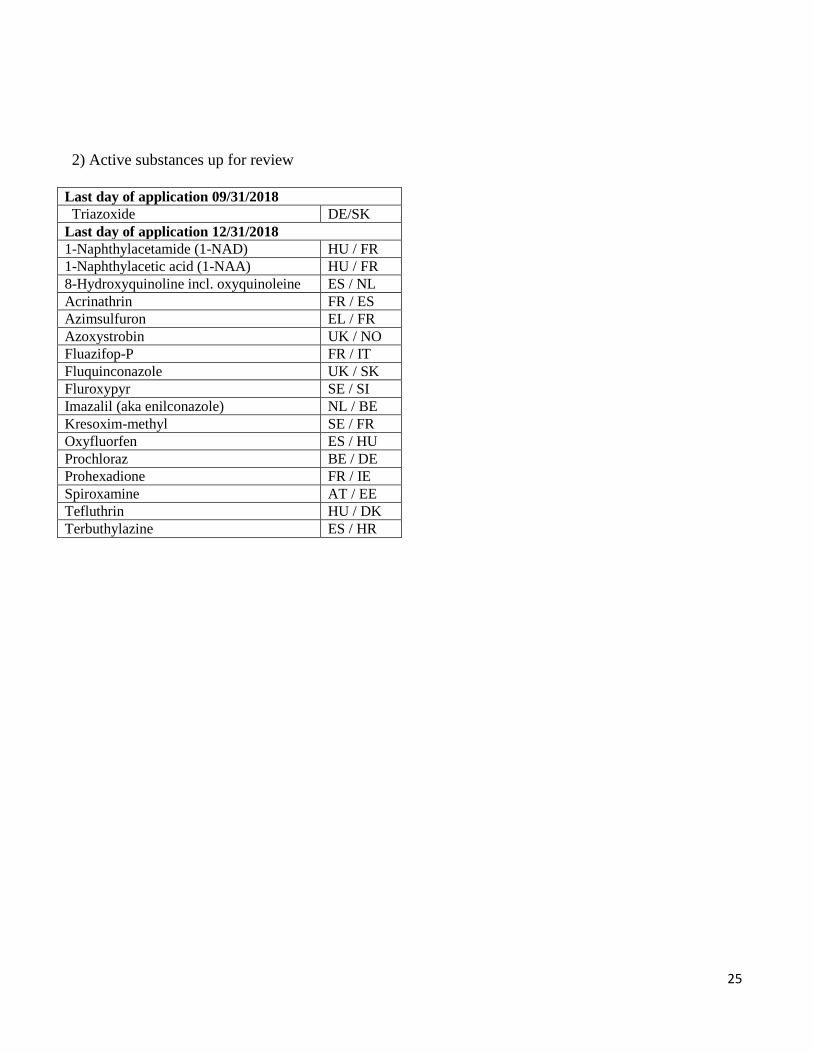
list includes the active substances which are, or will soon be, up for renewal. It is important to note that
these lists are not all-inclusive. Due to the complexity of the renewal process and the importance of the
issue, stakeholders should actively engage early in these review processes by reaching out to the
applicant. Together with the applicant, they can ensure that the necessary data are already available for
the review or if trials for data collection are in progress or should be initiated, especially if the substance
is not used or authorized in the EU. It is highly recommended to contact the assigned "Rapporteur
Member State" (RMS) which will carry out the first evaluation of the active substance and existing EU
pesticide MRLs. Stakeholders are encouraged to engage with FAS on substances and MRLs of
importance to their commodities.
24
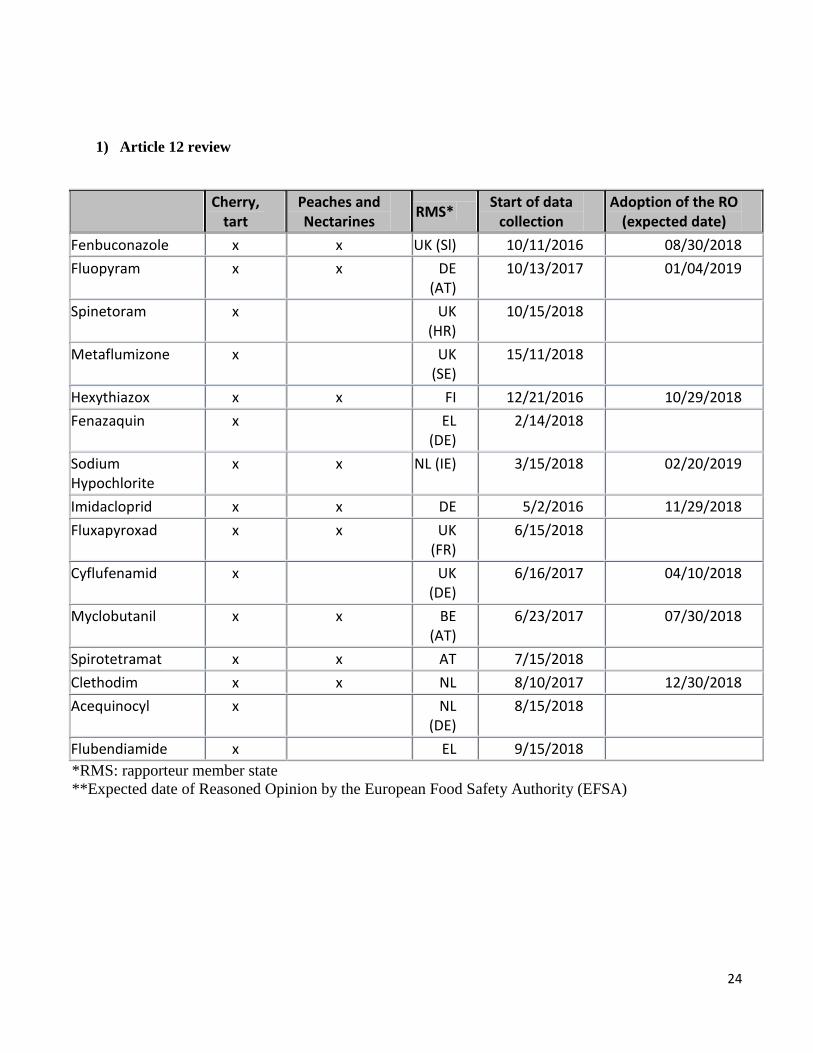
1) Article 12 review
Cherry, tart
Peaches and Nectarines
RMS* Start of data
collection
Adoption of the RO (expected date)
Fenbuconazole x x UK (Sl) 10/11/2016 08/30/2018
Fluopyram x x DE (AT)
10/13/2017 01/04/2019
Spinetoram x UK (HR)
10/15/2018
Metaflumizone x UK (SE)
15/11/2018
Hexythiazox x x FI 12/21/2016 10/29/2018
Fenazaquin x EL (DE)
2/14/2018
Sodium Hypochlorite
x x NL (IE) 3/15/2018 02/20/2019
Imidacloprid x x DE 5/2/2016 11/29/2018
Fluxapyroxad x x UK (FR)
6/15/2018
Cyflufenamid x UK (DE)
6/16/2017 04/10/2018
Myclobutanil x x BE (AT)
6/23/2017 07/30/2018
Spirotetramat x x AT 7/15/2018
Clethodim x x NL 8/10/2017 12/30/2018
Acequinocyl x NL (DE)
8/15/2018
Flubendiamide x EL 9/15/2018
*RMS: rapporteur member state
**Expected date of Reasoned Opinion by the European Food Safety Authority (EFSA)
25
2) Active substances up for review
Last day of application 09/31/2018
Triazoxide
DE/SK
Last day of application 12/31/2018
1-Naphthylacetamide (1-NAD) HU / FR
1-Naphthylacetic acid (1-NAA) HU / FR
8-Hydroxyquinoline incl. oxyquinoleine ES / NL
Acrinathrin FR / ES
Azimsulfuron EL / FR
Azoxystrobin UK / NO
Fluazifop-P FR / IT
Fluquinconazole UK / SK
Fluroxypyr SE / SI
Imazalil (aka enilconazole) NL / BE
Kresoxim-methyl SE / FR
Oxyfluorfen ES / HU
Prochloraz BE / DE
Prohexadione FR / IE
Spiroxamine AT / EE
Tefluthrin HU / DK
Terbuthylazine ES / HR
Related Documents