Ethylene-Regulated Floral Volatile Synthesis in Petunia Corollas 1[w] Beverly A. Underwood 2 , Denise M. Tieman, Kenichi Shibuya, Richard J. Dexter, Holly M. Loucas, Andrew J. Simkin, Charles A. Sims, Eric A. Schmelz, Harry J. Klee, and David G. Clark* Department of Environmental Horticulture (B.A.U., K.S., R.J.D., H.M.L., D.G.C.), Department of Horticultural Sciences (D.M.T., A.J.S., H.J.K.), and Department of Food Science and Human Nutrition (C.A.S.), University of Florida, Gainesville, Florida 32611; and Centerof Medical, Agricultural, and Veterinary Entomology, United States Department of Agriculture-Agricultural Research Service, Gainesville, Florida 32608 (E.A.S.) In many flowering plants, such as petunia (Petunia 3 hybrida), ethylene produced in floral organs after pollination elicits a series of physiological and biochemical events, ultimately leading to senescence of petals and successful fertilization. Here, we demonstrate, using transgenic ethylene insensitive (44568) and Mitchell Diploid petunias, that multiple components of emission of volatile organic compounds (VOCs) are regulated by ethylene. Expression of benzoic acid/salicylic acid carboxyl methyltransferase (PhBSMT1 and 2) mRNA is temporally and spatially down-regulated in floral organs in a manner consistent with current models for postpollination ethylene synthesis in petunia corollas. Emission of methylbenzoate and other VOCs after pollination and exogenous ethylene treatment parallels a reduction in PhBSMT1 and 2 mRNA levels. Under cyclic light conditions (day/night), PhBSMT mRNA levels are rhythmic and precede emission of methylbenzoate by approximately 6 h. When shifted into constant dark or light conditions, PhBSMT mRNA levels and subsequent methylbenzoate emission correspondingly decrease or increase to minimum or maximum levels observed during normal conditions, thus suggesting that light may be a more critical influence on cyclic emission of methylbenzoate than a circadian clock. Transgenic PhBSMT RNAi flowers with reduced PhBSMT mRNA levels show a 75% to 99% decrease in methylbenzoate emission, with minimal changes in other petunia VOCs. These results implicate PhBSMT1 and 2 as genes responsible for synthesis of methylbenzoate in petunia. Many flowers exhibit a colorful display of petals and emit a complex mixture of floral volatile organic compounds (VOCs) that are together attractive to both pollinators and humans. Regulation of floral volatiles corresponds to pollinator activity times and receptivity of the flower to a pollination event (Dudareva et al., 2000; Schiestl and Ayasse, 2001). In many flowers, physiological changes take place fol- lowing pollination and fertilization including petal wilting and abscission, color changes, flower closure, fruit development, and seed development (for review, see O’Neill, 1997). The plant hormone ethylene has been shown to coordinate several of these postpolli- nation processes in many different plant species (van Doorn, 1997). In many plants, ethylene is synthesized and per- ceived in a localized, specific, and reproducible man- ner after pollination, underscoring the importance of understanding the progression of events and role of ethylene during pollination and fertilization. Petunia (Petunia 3 hybrida) is an excellent model system for studying postpollination responses because ethylene synthesis has been well characterized (Hoekstra and Weges, 1986; Tang and Woodson, 1996; Jones et al., 2003) and components of the ethylene-signaling path- way have been investigated (Wilkinson et al., 1997; Shibuya et al., 2004). In petunia, ethylene synchronizes pollen tube growth (Holden et al., 2003) and petal wilting (Hoekstra and Weges, 1986; Gubrium et al., 2000). An initial burst of ethylene is produced from the stigma/style within 2 to 4 h after pollination (Hoekstra and Weges, 1986), when pollen tubes have just started to germinate and grow into the stigma (Tang and Woodson, 1996). This is followed by sustained, auto- catalytic ethylene production from the stigma/style and ovary, beginning approximately 12 h after polli- nation and peaking at 24 h after pollination. Ethylene production from the corolla is induced during this second phase between 24 and 36 h after pollination (Jones et al., 2003). The second phase of ethylene synthesis, which corresponds with the timing of fer- tilization, is responsible for corolla senescence (Hoek- stra and Weges, 1986). Floral fragrance is composed of low M r VOCs that, together with other floral cues, are thought to stimu- 1 This work was supported by the Fred Gloeckner Foundation (grant to D.G.C.), by the American Floral Endowment (grant to D.G.C.), by the U.S. Department of Agriculture Floral and Nursery Crops Initiative (grant to D.G.C.), by the Florida Agricultural Experiment Station, National Science Foundation (grant no. DBI– 0211875 to H.J.K.), and by the University of Florida (alumni fellow- ship to B.A.U.). This paper is contribution R-10643 from the Florida Agricultural Experiment Station. 2 Present address: The Institute for Genomic Research, 9712 Medical Center Drive, Rockville, MD 20850. * Corresponding author; e-mail geranium@ufl.edu; fax 352–392– 3870. [w] The online version of this article contains Web-only data. Article, publication date, and citation information can be found at www.plantphysiol.org/cgi/doi/10.1104/pp.104.051144. Plant Physiology, May 2005, Vol. 138, pp. 255–266, www.plantphysiol.org Ó 2005 American Society of Plant Biologists 255 www.plant.org on October 14, 2014 - Published by www.plantphysiol.org Downloaded from Copyright © 2005 American Society of Plant Biologists. All rights reserved.

Welcome message from author
This document is posted to help you gain knowledge. Please leave a comment to let me know what you think about it! Share it to your friends and learn new things together.
Transcript
Ethylene-Regulated Floral Volatile Synthesis inPetunia Corollas1[w]
Beverly A. Underwood2, Denise M. Tieman, Kenichi Shibuya, Richard J. Dexter, Holly M. Loucas,Andrew J. Simkin, Charles A. Sims, Eric A. Schmelz, Harry J. Klee, and David G. Clark*
Department of Environmental Horticulture (B.A.U., K.S., R.J.D., H.M.L., D.G.C.), Department of HorticulturalSciences (D.M.T., A.J.S., H.J.K.), and Department of Food Science and Human Nutrition (C.A.S.), University ofFlorida, Gainesville, Florida 32611; and Center of Medical, Agricultural, and Veterinary Entomology, UnitedStates Department of Agriculture-Agricultural Research Service, Gainesville, Florida 32608 (E.A.S.)
Inmany flowering plants, such as petunia (Petunia 3 hybrida), ethylene produced in floral organs after pollination elicits a seriesof physiological and biochemical events, ultimately leading to senescence of petals and successful fertilization. Here, wedemonstrate, using transgenic ethylene insensitive (44568) andMitchell Diploid petunias, that multiple components of emissionof volatile organic compounds (VOCs) are regulated by ethylene. Expression of benzoic acid/salicylic acid carboxylmethyltransferase (PhBSMT1 and 2) mRNA is temporally and spatially down-regulated in floral organs in a manner consistentwith currentmodels for postpollination ethylene synthesis in petunia corollas. Emission ofmethylbenzoate and other VOCs afterpollination and exogenous ethylene treatment parallels a reduction inPhBSMT1 and 2mRNA levels.Under cyclic light conditions(day/night), PhBSMTmRNA levels are rhythmic and precede emission of methylbenzoate by approximately 6 h. When shiftedinto constant dark or light conditions,PhBSMTmRNAlevels and subsequentmethylbenzoate emission correspondinglydecreaseor increase tominimum ormaximum levels observed during normal conditions, thus suggesting that lightmay be amore criticalinfluence on cyclic emission of methylbenzoate than a circadian clock. Transgenic PhBSMT RNAi flowers with reduced PhBSMTmRNA levels show a 75% to 99% decrease in methylbenzoate emission, with minimal changes in other petunia VOCs. Theseresults implicate PhBSMT1 and 2 as genes responsible for synthesis of methylbenzoate in petunia.
Many flowers exhibit a colorful display of petals andemit a complex mixture of floral volatile organiccompounds (VOCs) that are together attractive toboth pollinators and humans. Regulation of floralvolatiles corresponds to pollinator activity times andreceptivity of the flower to a pollination event(Dudareva et al., 2000; Schiestl and Ayasse, 2001). Inmany flowers, physiological changes take place fol-lowing pollination and fertilization including petalwilting and abscission, color changes, flower closure,fruit development, and seed development (for review,see O’Neill, 1997). The plant hormone ethylene hasbeen shown to coordinate several of these postpolli-nation processes in many different plant species (vanDoorn, 1997).
In many plants, ethylene is synthesized and per-ceived in a localized, specific, and reproducible man-ner after pollination, underscoring the importance ofunderstanding the progression of events and role ofethylene during pollination and fertilization. Petunia(Petunia 3 hybrida) is an excellent model system forstudying postpollination responses because ethylenesynthesis has been well characterized (Hoekstra andWeges, 1986; Tang and Woodson, 1996; Jones et al.,2003) and components of the ethylene-signaling path-way have been investigated (Wilkinson et al., 1997;Shibuya et al., 2004). In petunia, ethylene synchronizespollen tube growth (Holden et al., 2003) and petalwilting (Hoekstra and Weges, 1986; Gubrium et al.,2000). An initial burst of ethylene is produced from thestigma/style within 2 to 4 h after pollination (Hoekstraand Weges, 1986), when pollen tubes have just startedto germinate and grow into the stigma (Tang andWoodson, 1996). This is followed by sustained, auto-catalytic ethylene production from the stigma/styleand ovary, beginning approximately 12 h after polli-nation and peaking at 24 h after pollination. Ethyleneproduction from the corolla is induced during thissecond phase between 24 and 36 h after pollination(Jones et al., 2003). The second phase of ethylenesynthesis, which corresponds with the timing of fer-tilization, is responsible for corolla senescence (Hoek-stra and Weges, 1986).
Floral fragrance is composed of low Mr VOCs that,together with other floral cues, are thought to stimu-
1 This work was supported by the Fred Gloeckner Foundation(grant to D.G.C.), by the American Floral Endowment (grant toD.G.C.), by the U.S. Department of Agriculture Floral and NurseryCrops Initiative (grant to D.G.C.), by the Florida AgriculturalExperiment Station, National Science Foundation (grant no. DBI–0211875 to H.J.K.), and by the University of Florida (alumni fellow-ship to B.A.U.). This paper is contribution R-10643 from the FloridaAgricultural Experiment Station.
2 Present address: The Institute for Genomic Research, 9712Medical Center Drive, Rockville, MD 20850.
* Corresponding author; e-mail [email protected]; fax 352–392–3870.
[w] The online version of this article contains Web-only data.Article, publication date, and citation information can be found at
www.plantphysiol.org/cgi/doi/10.1104/pp.104.051144.
Plant Physiology, May 2005, Vol. 138, pp. 255–266, www.plantphysiol.org � 2005 American Society of Plant Biologists 255 www.plant.org on October 14, 2014 - Published by www.plantphysiol.orgDownloaded from
Copyright © 2005 American Society of Plant Biologists. All rights reserved.
late pollinator activity. Floral VOCs are derived frommultiple biosynthetic pathways in plant cells andinclude benzenoids, fatty acid derivatives, isopren-oids, and others (Knudsen et al., 1993). In flowers ofsome plant species, the availability of pollinator re-wards and quality and intensity of the fragrance hasbeen reported to reflect the pollination status (Burquezand Corbet, 1991; Schiestl and Ayasse, 2001). Post-pollination changes in fragrance have been describedfor orchid (Platanthera bifolia: Tollsten, 1993; Ophyryssphegodes: Schiestl and Ayasse, 2001) and recently forpetunia and snapdragon (Antirrhinum majus) flowers(Negre et al., 2003). The changes in VOC emissionpresumably direct pollinators to unpollinated flowers.In petunia, the floral VOC methylbenzoate (MeBA)decreases after pollination (Negre et al., 2003). Genescharacterized in vitro to catalyze MeBA synthesis,S-adenosyl-L-methionine:benzoic acid/salicylic acidcarboxyl methyltransferases (PhBSMTs), also showdecreased expression after pollination and exposureto ethylene in whole flowers, implicating a role forethylene in regulating this process.
In this study, we investigated the physiologicalimportance of ethylene in the regulation of floral vola-tile synthesis after pollination in petunia cv MitchellDiploid (MD) and ethylene-insensitive CaMV35S::etr1-1 (44568). PhBSMT1 and PhBSMT2 expressionwere examined in detail in individual floral organsafter ethylene treatments and pollination. Our resultsindicated not only that PhBSMT expression and MeBAemission were ethylene regulated in a temporal andspatial manner, but also that there was additionalrhythmic regulation that appeared to be controlled byboth light and circadian factors. Changes in floral VOCemission after pollination provided strong evidencefor ethylene regulation and rhythmic emission ofoverall floral VOC synthesis. The biochemical functionof PhBSMT1 and 2 in vivo was determined using anRNAi approach to complement in vitro enzyme assays(Negre et al., 2003) and to support expression studies
shown here. The physiological implications of thiscomplex floral volatile regulation are discussed.
RESULTS
Floral VOC Emission Is Spatially Regulated
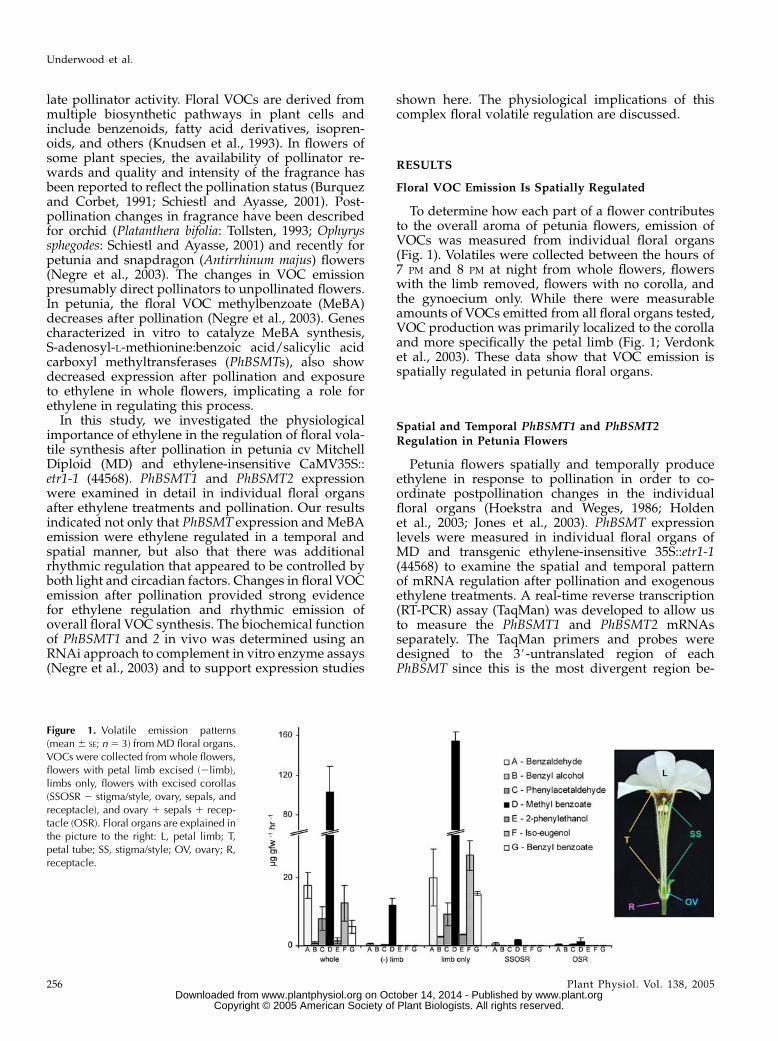
To determine how each part of a flower contributesto the overall aroma of petunia flowers, emission ofVOCs was measured from individual floral organs(Fig. 1). Volatiles were collected between the hours of7 PM and 8 PM at night from whole flowers, flowerswith the limb removed, flowers with no corolla, andthe gynoecium only. While there were measurableamounts of VOCs emitted from all floral organs tested,VOC production was primarily localized to the corollaand more specifically the petal limb (Fig. 1; Verdonket al., 2003). These data show that VOC emission isspatially regulated in petunia floral organs.
Spatial and Temporal PhBSMT1 and PhBSMT2Regulation in Petunia Flowers
Petunia flowers spatially and temporally produceethylene in response to pollination in order to co-ordinate postpollination changes in the individualfloral organs (Hoekstra and Weges, 1986; Holdenet al., 2003; Jones et al., 2003). PhBSMT expressionlevels were measured in individual floral organs ofMD and transgenic ethylene-insensitive 35S::etr1-1(44568) to examine the spatial and temporal patternof mRNA regulation after pollination and exogenousethylene treatments. A real-time reverse transcription(RT-PCR) assay (TaqMan) was developed to allow usto measure the PhBSMT1 and PhBSMT2 mRNAsseparately. The TaqMan primers and probes weredesigned to the 3#-untranslated region of eachPhBSMT since this is the most divergent region be-
Figure 1. Volatile emission patterns(mean6 SE; n5 3) from MD floral organs.VOCs were collected from whole flowers,flowers with petal limb excised (2limb),limbs only, flowers with excised corollas(SSOSR 2 stigma/style, ovary, sepals, andreceptacle), and ovary 1 sepals 1 recep-tacle (OSR). Floral organs are explained inthe picture to the right: L, petal limb; T,petal tube; SS, stigma/style; OV, ovary; R,receptacle.
Underwood et al.
256 Plant Physiol. Vol. 138, 2005 www.plant.org on October 14, 2014 - Published by www.plantphysiol.orgDownloaded from
Copyright © 2005 American Society of Plant Biologists. All rights reserved.
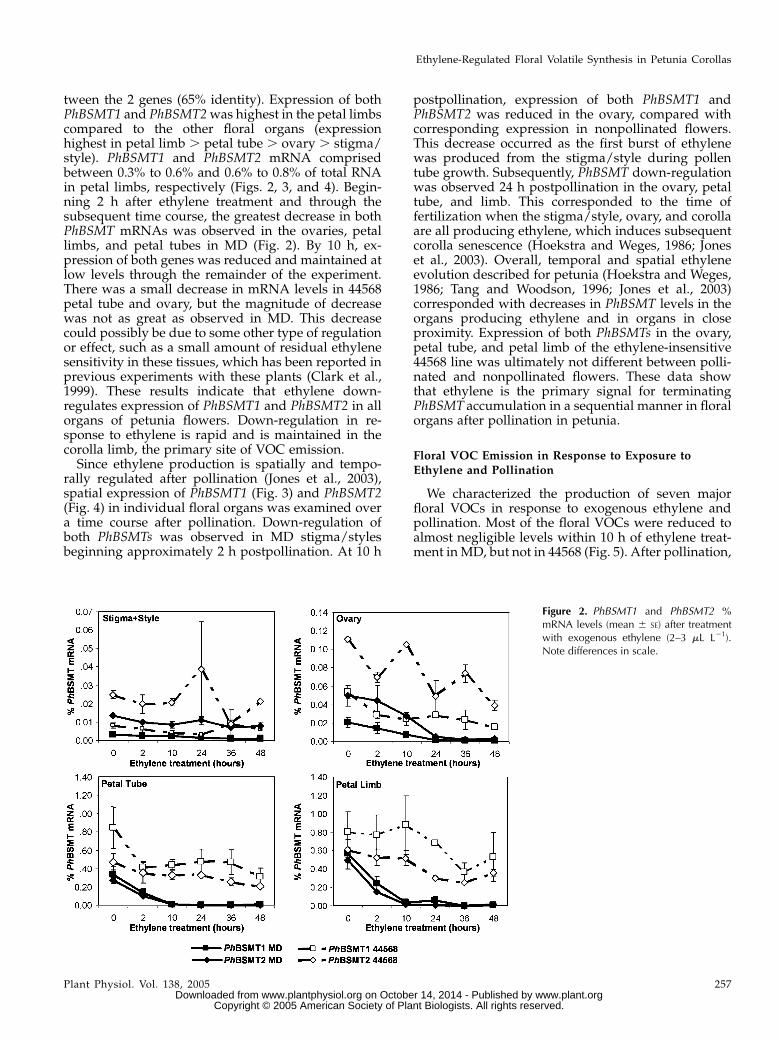
tween the 2 genes (65% identity). Expression of bothPhBSMT1 and PhBSMT2was highest in the petal limbscompared to the other floral organs (expressionhighest in petal limb . petal tube . ovary . stigma/style). PhBSMT1 and PhBSMT2 mRNA comprisedbetween 0.3% to 0.6% and 0.6% to 0.8% of total RNAin petal limbs, respectively (Figs. 2, 3, and 4). Begin-ning 2 h after ethylene treatment and through thesubsequent time course, the greatest decrease in bothPhBSMT mRNAs was observed in the ovaries, petallimbs, and petal tubes in MD (Fig. 2). By 10 h, ex-pression of both genes was reduced and maintained atlow levels through the remainder of the experiment.There was a small decrease in mRNA levels in 44568petal tube and ovary, but the magnitude of decreasewas not as great as observed in MD. This decreasecould possibly be due to some other type of regulationor effect, such as a small amount of residual ethylenesensitivity in these tissues, which has been reported inprevious experiments with these plants (Clark et al.,1999). These results indicate that ethylene down-regulates expression of PhBSMT1 and PhBSMT2 in allorgans of petunia flowers. Down-regulation in re-sponse to ethylene is rapid and is maintained in thecorolla limb, the primary site of VOC emission.Since ethylene production is spatially and tempo-
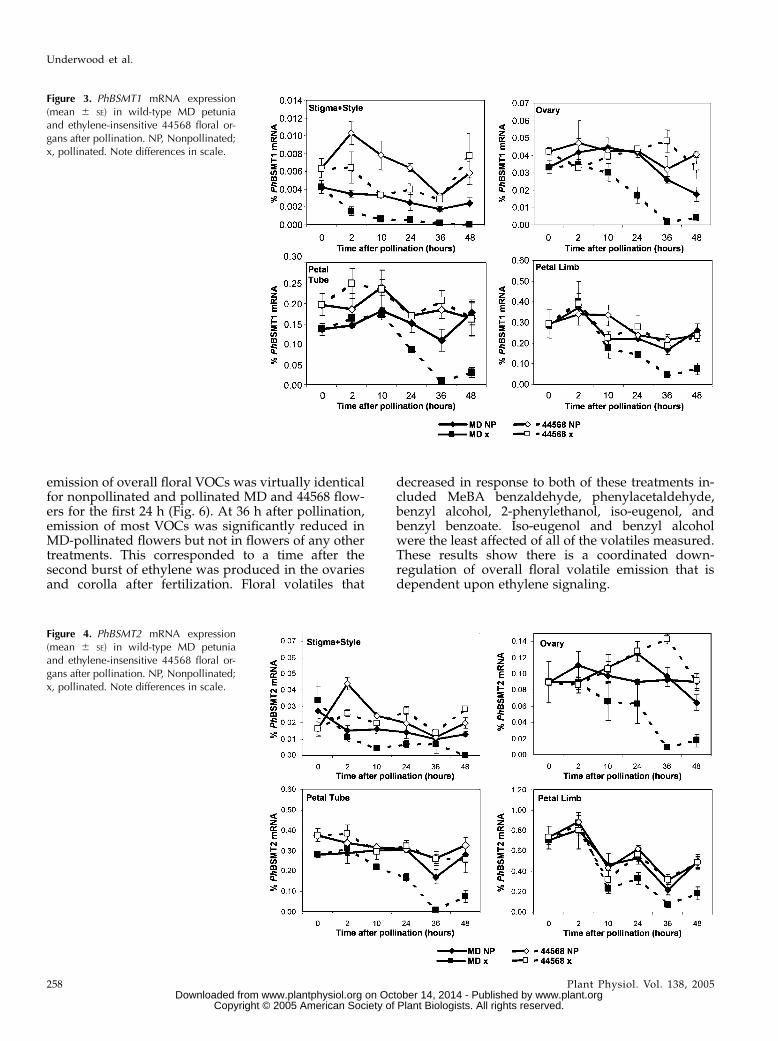
rally regulated after pollination (Jones et al., 2003),spatial expression of PhBSMT1 (Fig. 3) and PhBSMT2(Fig. 4) in individual floral organs was examined overa time course after pollination. Down-regulation ofboth PhBSMTs was observed in MD stigma/stylesbeginning approximately 2 h postpollination. At 10 h
postpollination, expression of both PhBSMT1 andPhBSMT2 was reduced in the ovary, compared withcorresponding expression in nonpollinated flowers.This decrease occurred as the first burst of ethylenewas produced from the stigma/style during pollentube growth. Subsequently, PhBSMT down-regulationwas observed 24 h postpollination in the ovary, petaltube, and limb. This corresponded to the time offertilization when the stigma/style, ovary, and corollaare all producing ethylene, which induces subsequentcorolla senescence (Hoekstra and Weges, 1986; Joneset al., 2003). Overall, temporal and spatial ethyleneevolution described for petunia (Hoekstra and Weges,1986; Tang and Woodson, 1996; Jones et al., 2003)corresponded with decreases in PhBSMT levels in theorgans producing ethylene and in organs in closeproximity. Expression of both PhBSMTs in the ovary,petal tube, and petal limb of the ethylene-insensitive44568 line was ultimately not different between polli-nated and nonpollinated flowers. These data showthat ethylene is the primary signal for terminatingPhBSMT accumulation in a sequential manner in floralorgans after pollination in petunia.
Floral VOC Emission in Response to Exposure toEthylene and Pollination
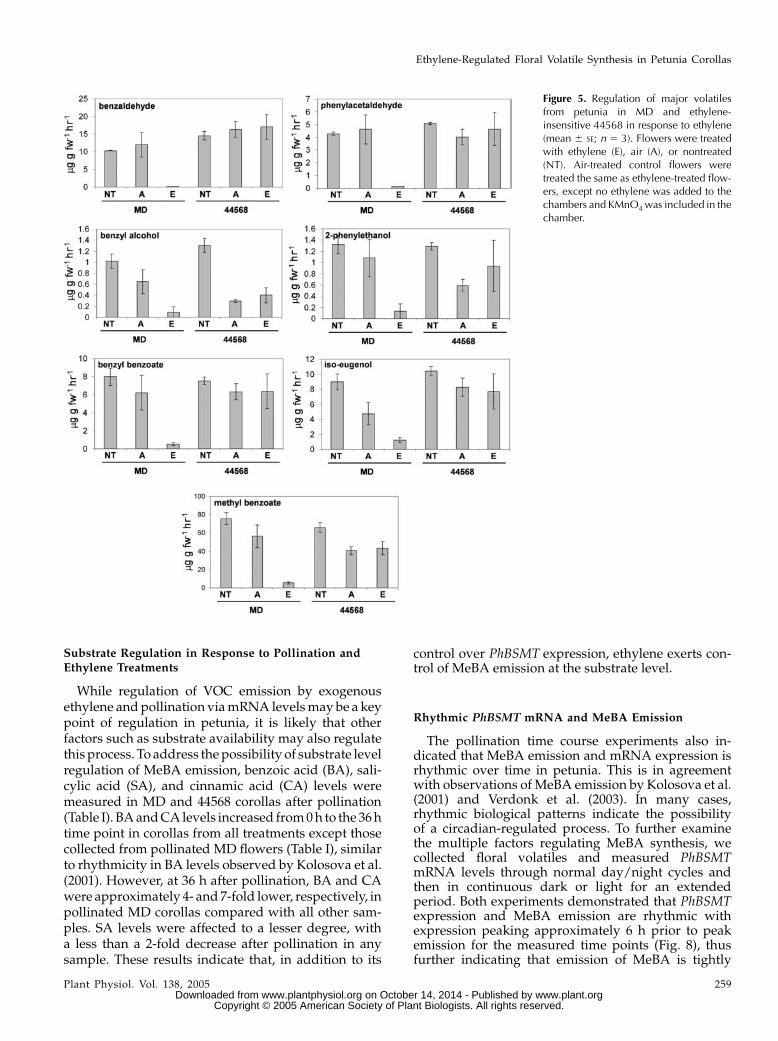
We characterized the production of seven majorfloral VOCs in response to exogenous ethylene andpollination. Most of the floral VOCs were reduced toalmost negligible levels within 10 h of ethylene treat-ment inMD, but not in 44568 (Fig. 5). After pollination,
Figure 2. PhBSMT1 and PhBSMT2 %mRNA levels (mean 6 SE) after treatmentwith exogenous ethylene (2–3 mL L21).Note differences in scale.
Ethylene-Regulated Floral Volatile Synthesis in Petunia Corollas
Plant Physiol. Vol. 138, 2005 257 www.plant.org on October 14, 2014 - Published by www.plantphysiol.orgDownloaded from
Copyright © 2005 American Society of Plant Biologists. All rights reserved.
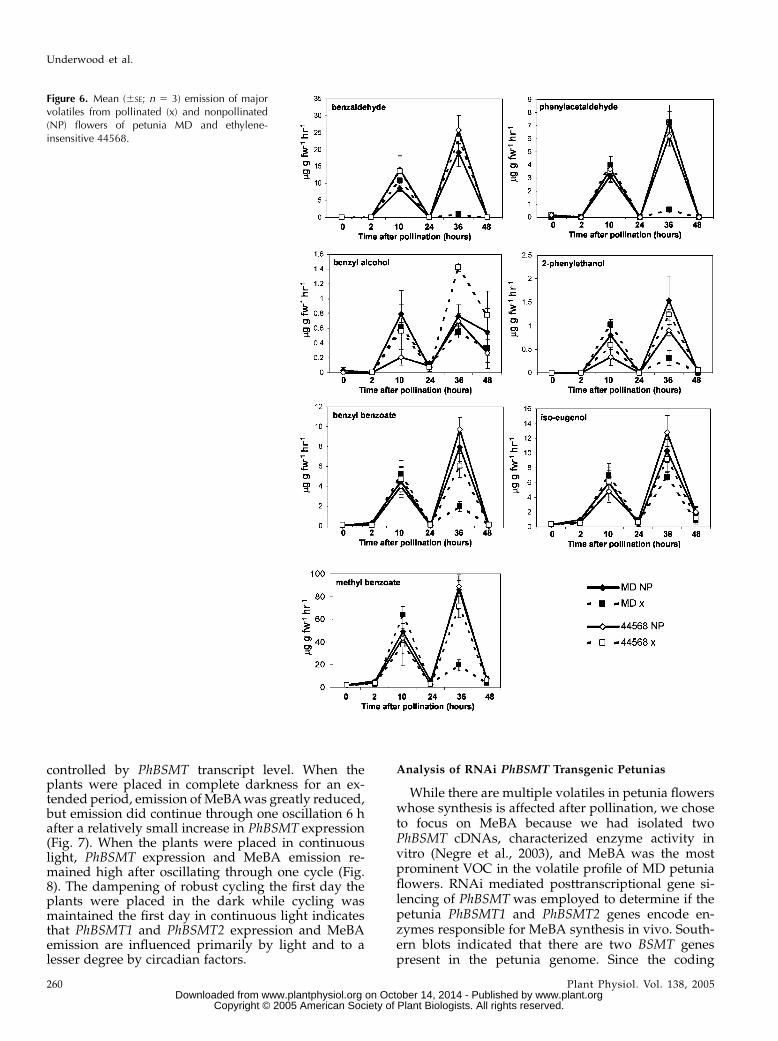
emission of overall floral VOCs was virtually identicalfor nonpollinated and pollinated MD and 44568 flow-ers for the first 24 h (Fig. 6). At 36 h after pollination,emission of most VOCs was significantly reduced inMD-pollinated flowers but not in flowers of any othertreatments. This corresponded to a time after thesecond burst of ethylene was produced in the ovariesand corolla after fertilization. Floral volatiles that
decreased in response to both of these treatments in-cluded MeBA benzaldehyde, phenylacetaldehyde,benzyl alcohol, 2-phenylethanol, iso-eugenol, andbenzyl benzoate. Iso-eugenol and benzyl alcoholwere the least affected of all of the volatiles measured.These results show there is a coordinated down-regulation of overall floral volatile emission that isdependent upon ethylene signaling.
Figure 3. PhBSMT1 mRNA expression(mean 6 SE) in wild-type MD petuniaand ethylene-insensitive 44568 floral or-gans after pollination. NP, Nonpollinated;x, pollinated. Note differences in scale.
Figure 4. PhBSMT2 mRNA expression(mean 6 SE) in wild-type MD petuniaand ethylene-insensitive 44568 floral or-gans after pollination. NP, Nonpollinated;x, pollinated. Note differences in scale.
Underwood et al.
258 Plant Physiol. Vol. 138, 2005 www.plant.org on October 14, 2014 - Published by www.plantphysiol.orgDownloaded from
Copyright © 2005 American Society of Plant Biologists. All rights reserved.
Substrate Regulation in Response to Pollination andEthylene Treatments
While regulation of VOC emission by exogenousethylene andpollination viamRNA levelsmay be a keypoint of regulation in petunia, it is likely that otherfactors such as substrate availability may also regulatethis process. To address the possibility of substrate levelregulation of MeBA emission, benzoic acid (BA), sali-cylic acid (SA), and cinnamic acid (CA) levels weremeasured in MD and 44568 corollas after pollination(Table I). BAandCA levels increased from0h to the 36htime point in corollas from all treatments except thosecollected from pollinated MD flowers (Table I), similarto rhythmicity in BA levels observed by Kolosova et al.(2001). However, at 36 h after pollination, BA and CAwere approximately 4- and7-fold lower, respectively, inpollinated MD corollas compared with all other sam-ples. SA levels were affected to a lesser degree, witha less than a 2-fold decrease after pollination in anysample. These results indicate that, in addition to its
control over PhBSMT expression, ethylene exerts con-trol of MeBA emission at the substrate level.
Rhythmic PhBSMT mRNA and MeBA Emission
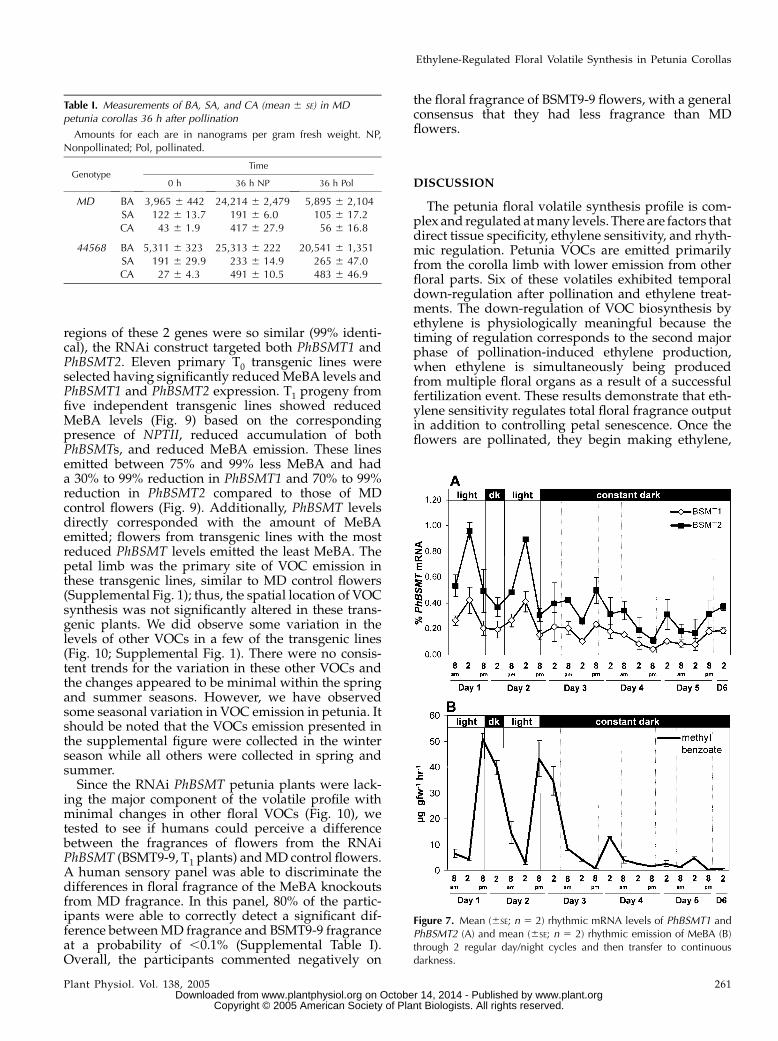
The pollination time course experiments also in-dicated that MeBA emission and mRNA expression isrhythmic over time in petunia. This is in agreementwith observations ofMeBA emission by Kolosova et al.(2001) and Verdonk et al. (2003). In many cases,rhythmic biological patterns indicate the possibilityof a circadian-regulated process. To further examinethe multiple factors regulating MeBA synthesis, wecollected floral volatiles and measured PhBSMTmRNA levels through normal day/night cycles andthen in continuous dark or light for an extendedperiod. Both experiments demonstrated that PhBSMTexpression and MeBA emission are rhythmic withexpression peaking approximately 6 h prior to peakemission for the measured time points (Fig. 8), thusfurther indicating that emission of MeBA is tightly
Figure 5. Regulation of major volatilesfrom petunia in MD and ethylene-insensitive 44568 in response to ethylene(mean 6 SE; n 5 3). Flowers were treatedwith ethylene (E), air (A), or nontreated(NT). Air-treated control flowers weretreated the same as ethylene-treated flow-ers, except no ethylene was added to thechambers and KMnO4 was included in thechamber.
Ethylene-Regulated Floral Volatile Synthesis in Petunia Corollas
Plant Physiol. Vol. 138, 2005 259 www.plant.org on October 14, 2014 - Published by www.plantphysiol.orgDownloaded from
Copyright © 2005 American Society of Plant Biologists. All rights reserved.
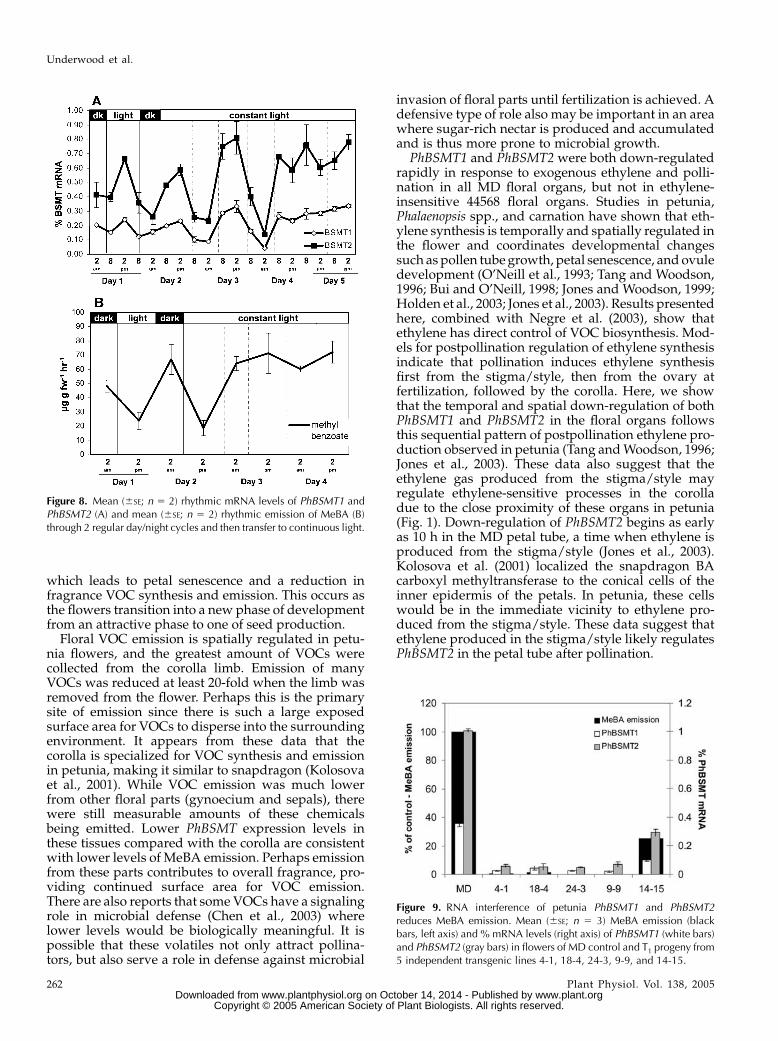
controlled by PhBSMT transcript level. When theplants were placed in complete darkness for an ex-tended period, emission of MeBAwas greatly reduced,but emission did continue through one oscillation 6 hafter a relatively small increase in PhBSMT expression(Fig. 7). When the plants were placed in continuouslight, PhBSMT expression and MeBA emission re-mained high after oscillating through one cycle (Fig.8). The dampening of robust cycling the first day theplants were placed in the dark while cycling wasmaintained the first day in continuous light indicatesthat PhBSMT1 and PhBSMT2 expression and MeBAemission are influenced primarily by light and to alesser degree by circadian factors.
Analysis of RNAi PhBSMT Transgenic Petunias
While there are multiple volatiles in petunia flowerswhose synthesis is affected after pollination, we choseto focus on MeBA because we had isolated twoPhBSMT cDNAs, characterized enzyme activity invitro (Negre et al., 2003), and MeBA was the mostprominent VOC in the volatile profile of MD petuniaflowers. RNAi mediated posttranscriptional gene si-lencing of PhBSMTwas employed to determine if thepetunia PhBSMT1 and PhBSMT2 genes encode en-zymes responsible for MeBA synthesis in vivo. South-ern blots indicated that there are two BSMT genespresent in the petunia genome. Since the coding
Figure 6. Mean (6SE; n 5 3) emission of majorvolatiles from pollinated (x) and nonpollinated(NP) flowers of petunia MD and ethylene-insensitive 44568.
Underwood et al.
260 Plant Physiol. Vol. 138, 2005 www.plant.org on October 14, 2014 - Published by www.plantphysiol.orgDownloaded from
Copyright © 2005 American Society of Plant Biologists. All rights reserved.
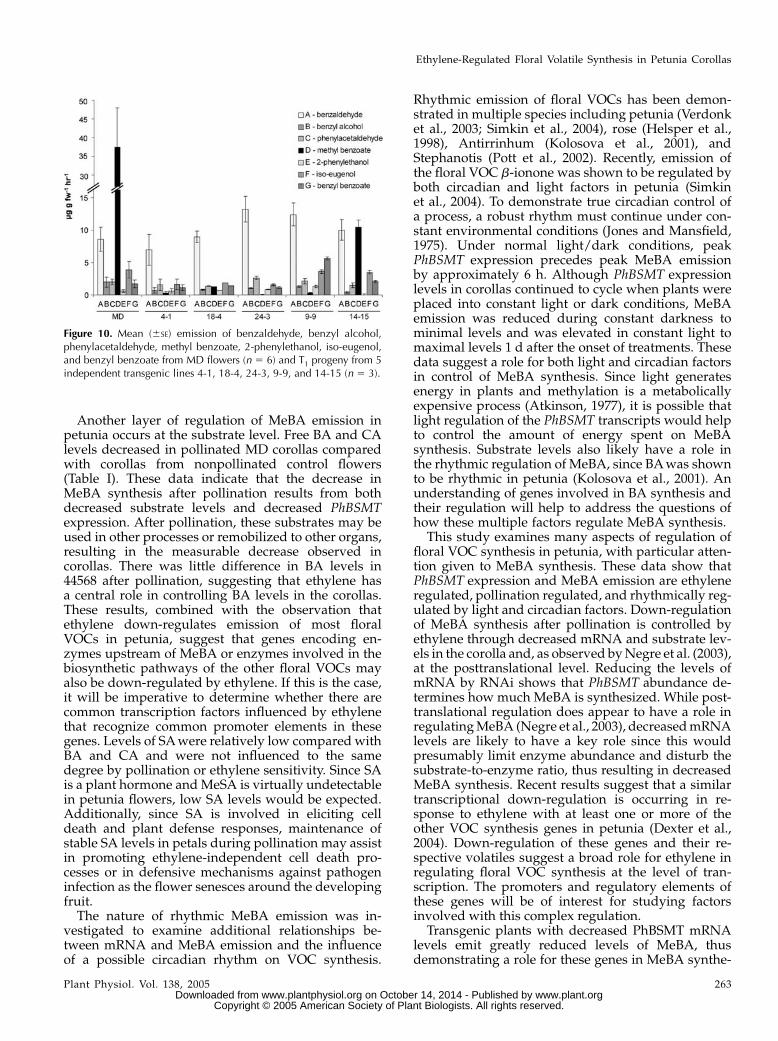
regions of these 2 genes were so similar (99% identi-cal), the RNAi construct targeted both PhBSMT1 andPhBSMT2. Eleven primary T0 transgenic lines wereselected having significantly reducedMeBA levels andPhBSMT1 and PhBSMT2 expression. T1 progeny fromfive independent transgenic lines showed reducedMeBA levels (Fig. 9) based on the correspondingpresence of NPTII, reduced accumulation of bothPhBSMTs, and reduced MeBA emission. These linesemitted between 75% and 99% less MeBA and hada 30% to 99% reduction in PhBSMT1 and 70% to 99%reduction in PhBSMT2 compared to those of MDcontrol flowers (Fig. 9). Additionally, PhBSMT levelsdirectly corresponded with the amount of MeBAemitted; flowers from transgenic lines with the mostreduced PhBSMT levels emitted the least MeBA. Thepetal limb was the primary site of VOC emission inthese transgenic lines, similar to MD control flowers(Supplemental Fig. 1); thus, the spatial location of VOCsynthesis was not significantly altered in these trans-genic plants. We did observe some variation in thelevels of other VOCs in a few of the transgenic lines(Fig. 10; Supplemental Fig. 1). There were no consis-tent trends for the variation in these other VOCs andthe changes appeared to be minimal within the springand summer seasons. However, we have observedsome seasonal variation in VOC emission in petunia. Itshould be noted that the VOCs emission presented inthe supplemental figure were collected in the winterseason while all others were collected in spring andsummer.Since the RNAi PhBSMT petunia plants were lack-
ing the major component of the volatile profile withminimal changes in other floral VOCs (Fig. 10), wetested to see if humans could perceive a differencebetween the fragrances of flowers from the RNAiPhBSMT (BSMT9-9, T1 plants) andMD control flowers.A human sensory panel was able to discriminate thedifferences in floral fragrance of the MeBA knockoutsfrom MD fragrance. In this panel, 80% of the partic-ipants were able to correctly detect a significant dif-ference betweenMD fragrance and BSMT9-9 fragranceat a probability of ,0.1% (Supplemental Table I).Overall, the participants commented negatively on
the floral fragrance of BSMT9-9 flowers, with a generalconsensus that they had less fragrance than MDflowers.
DISCUSSION
The petunia floral volatile synthesis profile is com-plex and regulated atmany levels. There are factors thatdirect tissue specificity, ethylene sensitivity, and rhyth-mic regulation. Petunia VOCs are emitted primarilyfrom the corolla limb with lower emission from otherfloral parts. Six of these volatiles exhibited temporaldown-regulation after pollination and ethylene treat-ments. The down-regulation of VOC biosynthesis byethylene is physiologically meaningful because thetiming of regulation corresponds to the second majorphase of pollination-induced ethylene production,when ethylene is simultaneously being producedfrom multiple floral organs as a result of a successfulfertilization event. These results demonstrate that eth-ylene sensitivity regulates total floral fragrance outputin addition to controlling petal senescence. Once theflowers are pollinated, they begin making ethylene,
Figure 7. Mean (6SE; n 5 2) rhythmic mRNA levels of PhBSMT1 andPhBSMT2 (A) and mean (6SE; n 5 2) rhythmic emission of MeBA (B)through 2 regular day/night cycles and then transfer to continuousdarkness.
Table I. Measurements of BA, SA, and CA (mean 6 SE) in MDpetunia corollas 36 h after pollination
Amounts for each are in nanograms per gram fresh weight. NP,Nonpollinated; Pol, pollinated.
GenotypeTime
0 h 36 h NP 36 h Pol
MD BA 3,965 6 442 24,214 6 2,479 5,895 6 2,104SA 122 6 13.7 191 6 6.0 105 6 17.2CA 43 6 1.9 417 6 27.9 56 6 16.8
44568 BA 5,311 6 323 25,313 6 222 20,541 6 1,351SA 191 6 29.9 233 6 14.9 265 6 47.0CA 27 6 4.3 491 6 10.5 483 6 46.9
Ethylene-Regulated Floral Volatile Synthesis in Petunia Corollas
Plant Physiol. Vol. 138, 2005 261 www.plant.org on October 14, 2014 - Published by www.plantphysiol.orgDownloaded from
Copyright © 2005 American Society of Plant Biologists. All rights reserved.
which leads to petal senescence and a reduction infragrance VOC synthesis and emission. This occurs asthe flowers transition into a new phase of developmentfrom an attractive phase to one of seed production.
Floral VOC emission is spatially regulated in petu-nia flowers, and the greatest amount of VOCs werecollected from the corolla limb. Emission of manyVOCs was reduced at least 20-fold when the limb wasremoved from the flower. Perhaps this is the primarysite of emission since there is such a large exposedsurface area for VOCs to disperse into the surroundingenvironment. It appears from these data that thecorolla is specialized for VOC synthesis and emissionin petunia, making it similar to snapdragon (Kolosovaet al., 2001). While VOC emission was much lowerfrom other floral parts (gynoecium and sepals), therewere still measurable amounts of these chemicalsbeing emitted. Lower PhBSMT expression levels inthese tissues compared with the corolla are consistentwith lower levels of MeBA emission. Perhaps emissionfrom these parts contributes to overall fragrance, pro-viding continued surface area for VOC emission.There are also reports that some VOCs have a signalingrole in microbial defense (Chen et al., 2003) wherelower levels would be biologically meaningful. It ispossible that these volatiles not only attract pollina-tors, but also serve a role in defense against microbial
invasion of floral parts until fertilization is achieved. Adefensive type of role also may be important in an areawhere sugar-rich nectar is produced and accumulatedand is thus more prone to microbial growth.
PhBSMT1 and PhBSMT2 were both down-regulatedrapidly in response to exogenous ethylene and polli-nation in all MD floral organs, but not in ethylene-insensitive 44568 floral organs. Studies in petunia,Phalaenopsis spp., and carnation have shown that eth-ylene synthesis is temporally and spatially regulated inthe flower and coordinates developmental changessuch as pollen tubegrowth, petal senescence, andovuledevelopment (O’Neill et al., 1993; Tang and Woodson,1996; Bui and O’Neill, 1998; Jones and Woodson, 1999;Holden et al., 2003; Jones et al., 2003). Results presentedhere, combined with Negre et al. (2003), show thatethylene has direct control of VOC biosynthesis. Mod-els for postpollination regulation of ethylene synthesisindicate that pollination induces ethylene synthesisfirst from the stigma/style, then from the ovary atfertilization, followed by the corolla. Here, we showthat the temporal and spatial down-regulation of bothPhBSMT1 and PhBSMT2 in the floral organs followsthis sequential pattern of postpollination ethylene pro-duction observed in petunia (Tang andWoodson, 1996;Jones et al., 2003). These data also suggest that theethylene gas produced from the stigma/style mayregulate ethylene-sensitive processes in the corolladue to the close proximity of these organs in petunia(Fig. 1). Down-regulation of PhBSMT2 begins as earlyas 10 h in the MD petal tube, a time when ethylene isproduced from the stigma/style (Jones et al., 2003).Kolosova et al. (2001) localized the snapdragon BAcarboxyl methyltransferase to the conical cells of theinner epidermis of the petals. In petunia, these cellswould be in the immediate vicinity to ethylene pro-duced from the stigma/style. These data suggest thatethylene produced in the stigma/style likely regulatesPhBSMT2 in the petal tube after pollination.
Figure 8. Mean (6SE; n 5 2) rhythmic mRNA levels of PhBSMT1 andPhBSMT2 (A) and mean (6SE; n 5 2) rhythmic emission of MeBA (B)through 2 regular day/night cycles and then transfer to continuous light.
Figure 9. RNA interference of petunia PhBSMT1 and PhBSMT2reduces MeBA emission. Mean (6SE; n 5 3) MeBA emission (blackbars, left axis) and % mRNA levels (right axis) of PhBSMT1 (white bars)and PhBSMT2 (gray bars) in flowers of MD control and T1 progeny from5 independent transgenic lines 4-1, 18-4, 24-3, 9-9, and 14-15.
Underwood et al.
262 Plant Physiol. Vol. 138, 2005 www.plant.org on October 14, 2014 - Published by www.plantphysiol.orgDownloaded from
Copyright © 2005 American Society of Plant Biologists. All rights reserved.
Another layer of regulation of MeBA emission inpetunia occurs at the substrate level. Free BA and CAlevels decreased in pollinated MD corollas comparedwith corollas from nonpollinated control flowers(Table I). These data indicate that the decrease inMeBA synthesis after pollination results from bothdecreased substrate levels and decreased PhBSMTexpression. After pollination, these substrates may beused in other processes or remobilized to other organs,resulting in the measurable decrease observed incorollas. There was little difference in BA levels in44568 after pollination, suggesting that ethylene hasa central role in controlling BA levels in the corollas.These results, combined with the observation thatethylene down-regulates emission of most floralVOCs in petunia, suggest that genes encoding en-zymes upstream of MeBA or enzymes involved in thebiosynthetic pathways of the other floral VOCs mayalso be down-regulated by ethylene. If this is the case,it will be imperative to determine whether there arecommon transcription factors influenced by ethylenethat recognize common promoter elements in thesegenes. Levels of SAwere relatively low compared withBA and CA and were not influenced to the samedegree by pollination or ethylene sensitivity. Since SAis a plant hormone andMeSA is virtually undetectablein petunia flowers, low SA levels would be expected.Additionally, since SA is involved in eliciting celldeath and plant defense responses, maintenance ofstable SA levels in petals during pollination may assistin promoting ethylene-independent cell death pro-cesses or in defensive mechanisms against pathogeninfection as the flower senesces around the developingfruit.The nature of rhythmic MeBA emission was in-
vestigated to examine additional relationships be-tween mRNA and MeBA emission and the influenceof a possible circadian rhythm on VOC synthesis.
Rhythmic emission of floral VOCs has been demon-strated in multiple species including petunia (Verdonket al., 2003; Simkin et al., 2004), rose (Helsper et al.,1998), Antirrinhum (Kolosova et al., 2001), andStephanotis (Pott et al., 2002). Recently, emission ofthe floral VOC b-ionone was shown to be regulated byboth circadian and light factors in petunia (Simkinet al., 2004). To demonstrate true circadian control ofa process, a robust rhythm must continue under con-stant environmental conditions (Jones and Mansfield,1975). Under normal light/dark conditions, peakPhBSMT expression precedes peak MeBA emissionby approximately 6 h. Although PhBSMT expressionlevels in corollas continued to cycle when plants wereplaced into constant light or dark conditions, MeBAemission was reduced during constant darkness tominimal levels and was elevated in constant light tomaximal levels 1 d after the onset of treatments. Thesedata suggest a role for both light and circadian factorsin control of MeBA synthesis. Since light generatesenergy in plants and methylation is a metabolicallyexpensive process (Atkinson, 1977), it is possible thatlight regulation of the PhBSMT transcripts would helpto control the amount of energy spent on MeBAsynthesis. Substrate levels also likely have a role inthe rhythmic regulation of MeBA, since BAwas shownto be rhythmic in petunia (Kolosova et al., 2001). Anunderstanding of genes involved in BA synthesis andtheir regulation will help to address the questions ofhow these multiple factors regulate MeBA synthesis.
This study examines many aspects of regulation offloral VOC synthesis in petunia, with particular atten-tion given to MeBA synthesis. These data show thatPhBSMT expression and MeBA emission are ethyleneregulated, pollination regulated, and rhythmically reg-ulated by light and circadian factors. Down-regulationof MeBA synthesis after pollination is controlled byethylene through decreased mRNA and substrate lev-els in the corolla and, as observed byNegre et al. (2003),at the posttranslational level. Reducing the levels ofmRNA by RNAi shows that PhBSMT abundance de-termines how much MeBA is synthesized. While post-translational regulation does appear to have a role inregulatingMeBA (Negre et al., 2003), decreasedmRNAlevels are likely to have a key role since this wouldpresumably limit enzyme abundance and disturb thesubstrate-to-enzyme ratio, thus resulting in decreasedMeBA synthesis. Recent results suggest that a similartranscriptional down-regulation is occurring in re-sponse to ethylene with at least one or more of theother VOC synthesis genes in petunia (Dexter et al.,2004). Down-regulation of these genes and their re-spective volatiles suggest a broad role for ethylene inregulating floral VOC synthesis at the level of tran-scription. The promoters and regulatory elements ofthese genes will be of interest for studying factorsinvolved with this complex regulation.
Transgenic plants with decreased PhBSMT mRNAlevels emit greatly reduced levels of MeBA, thusdemonstrating a role for these genes in MeBA synthe-
Figure 10. Mean (6SE) emission of benzaldehyde, benzyl alcohol,phenylacetaldehyde, methyl benzoate, 2-phenylethanol, iso-eugenol,and benzyl benzoate from MD flowers (n 5 6) and T1 progeny from 5independent transgenic lines 4-1, 18-4, 24-3, 9-9, and 14-15 (n 5 3).
Ethylene-Regulated Floral Volatile Synthesis in Petunia Corollas
Plant Physiol. Vol. 138, 2005 263 www.plant.org on October 14, 2014 - Published by www.plantphysiol.orgDownloaded from
Copyright © 2005 American Society of Plant Biologists. All rights reserved.
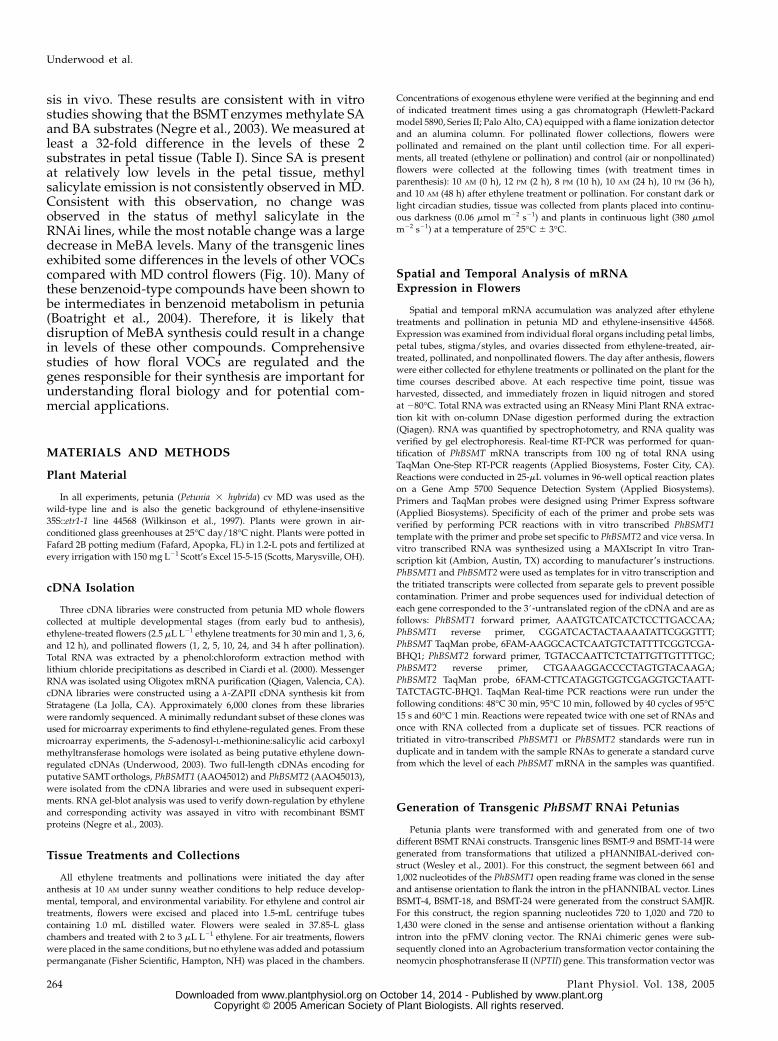
sis in vivo. These results are consistent with in vitrostudies showing that the BSMTenzymes methylate SAand BA substrates (Negre et al., 2003). We measured atleast a 32-fold difference in the levels of these 2substrates in petal tissue (Table I). Since SA is presentat relatively low levels in the petal tissue, methylsalicylate emission is not consistently observed in MD.Consistent with this observation, no change wasobserved in the status of methyl salicylate in theRNAi lines, while the most notable change was a largedecrease in MeBA levels. Many of the transgenic linesexhibited some differences in the levels of other VOCscompared with MD control flowers (Fig. 10). Many ofthese benzenoid-type compounds have been shown tobe intermediates in benzenoid metabolism in petunia(Boatright et al., 2004). Therefore, it is likely thatdisruption of MeBA synthesis could result in a changein levels of these other compounds. Comprehensivestudies of how floral VOCs are regulated and thegenes responsible for their synthesis are important forunderstanding floral biology and for potential com-mercial applications.
MATERIALS AND METHODS
Plant Material
In all experiments, petunia (Petunia 3 hybrida) cv MD was used as the
wild-type line and is also the genetic background of ethylene-insensitive
35S::etr1-1 line 44568 (Wilkinson et al., 1997). Plants were grown in air-
conditioned glass greenhouses at 25�C day/18�C night. Plants were potted in
Fafard 2B potting medium (Fafard, Apopka, FL) in 1.2-L pots and fertilized at
every irrigation with 150 mg L21 Scott’s Excel 15-5-15 (Scotts, Marysville, OH).
cDNA Isolation
Three cDNA libraries were constructed from petunia MD whole flowers
collected at multiple developmental stages (from early bud to anthesis),
ethylene-treated flowers (2.5 mL L21 ethylene treatments for 30 min and 1, 3, 6,
and 12 h), and pollinated flowers (1, 2, 5, 10, 24, and 34 h after pollination).
Total RNA was extracted by a phenol:chloroform extraction method with
lithium chloride precipitations as described in Ciardi et al. (2000). Messenger
RNAwas isolated using Oligotex mRNA purification (Qiagen, Valencia, CA).
cDNA libraries were constructed using a l-ZAPII cDNA synthesis kit from
Stratagene (La Jolla, CA). Approximately 6,000 clones from these libraries
were randomly sequenced. Aminimally redundant subset of these clones was
used for microarray experiments to find ethylene-regulated genes. From these
microarray experiments, the S-adenosyl-L-methionine:salicylic acid carboxyl
methyltransferase homologs were isolated as being putative ethylene down-
regulated cDNAs (Underwood, 2003). Two full-length cDNAs encoding for
putative SAMTorthologs, PhBSMT1 (AAO45012) and PhBSMT2 (AAO45013),
were isolated from the cDNA libraries and were used in subsequent experi-
ments. RNA gel-blot analysis was used to verify down-regulation by ethylene
and corresponding activity was assayed in vitro with recombinant BSMT
proteins (Negre et al., 2003).
Tissue Treatments and Collections
All ethylene treatments and pollinations were initiated the day after
anthesis at 10 AM under sunny weather conditions to help reduce develop-
mental, temporal, and environmental variability. For ethylene and control air
treatments, flowers were excised and placed into 1.5-mL centrifuge tubes
containing 1.0 mL distilled water. Flowers were sealed in 37.85-L glass
chambers and treated with 2 to 3 mL L21 ethylene. For air treatments, flowers
were placed in the same conditions, but no ethylenewas added and potassium
permanganate (Fisher Scientific, Hampton, NH) was placed in the chambers.
Concentrations of exogenous ethylene were verified at the beginning and end
of indicated treatment times using a gas chromatograph (Hewlett-Packard
model 5890, Series II; Palo Alto, CA) equippedwith a flame ionization detector
and an alumina column. For pollinated flower collections, flowers were
pollinated and remained on the plant until collection time. For all experi-
ments, all treated (ethylene or pollination) and control (air or nonpollinated)
flowers were collected at the following times (with treatment times in
parenthesis): 10 AM (0 h), 12 PM (2 h), 8 PM (10 h), 10 AM (24 h), 10 PM (36 h),
and 10 AM (48 h) after ethylene treatment or pollination. For constant dark or
light circadian studies, tissue was collected from plants placed into continu-
ous darkness (0.06 mmol m22 s21) and plants in continuous light (380 mmol
m22 s21) at a temperature of 25�C 6 3�C.
Spatial and Temporal Analysis of mRNAExpression in Flowers
Spatial and temporal mRNA accumulation was analyzed after ethylene
treatments and pollination in petunia MD and ethylene-insensitive 44568.
Expression was examined from individual floral organs including petal limbs,
petal tubes, stigma/styles, and ovaries dissected from ethylene-treated, air-
treated, pollinated, and nonpollinated flowers. The day after anthesis, flowers
were either collected for ethylene treatments or pollinated on the plant for the
time courses described above. At each respective time point, tissue was
harvested, dissected, and immediately frozen in liquid nitrogen and stored
at 280�C. Total RNAwas extracted using an RNeasy Mini Plant RNA extrac-
tion kit with on-column DNase digestion performed during the extraction
(Qiagen). RNA was quantified by spectrophotometry, and RNA quality was
verified by gel electrophoresis. Real-time RT-PCR was performed for quan-
tification of PhBSMT mRNA transcripts from 100 ng of total RNA using
TaqMan One-Step RT-PCR reagents (Applied Biosystems, Foster City, CA).
Reactions were conducted in 25-mL volumes in 96-well optical reaction plates
on a Gene Amp 5700 Sequence Detection System (Applied Biosystems).
Primers and TaqMan probes were designed using Primer Express software
(Applied Biosystems). Specificity of each of the primer and probe sets was
verified by performing PCR reactions with in vitro transcribed PhBSMT1
template with the primer and probe set specific to PhBSMT2 and vice versa. In
vitro transcribed RNA was synthesized using a MAXIscript In vitro Tran-
scription kit (Ambion, Austin, TX) according to manufacturer’s instructions.
PhBSMT1 and PhBSMT2were used as templates for in vitro transcription and
the tritiated transcripts were collected from separate gels to prevent possible
contamination. Primer and probe sequences used for individual detection of
each gene corresponded to the 3#-untranslated region of the cDNA and are as
follows: PhBSMT1 forward primer, AAATGTCATCATCTCCTTGACCAA;
PhBSMT1 reverse primer, CGGATCACTACTAAAATATTCGGGTTT;
PhBSMT TaqMan probe, 6FAM-AAGGCACTCAATGTCTATTTTCGGTCGA-
BHQ1; PhBSMT2 forward primer, TGTACCAATTCTCTATTGTTGTTTTGC;
PhBSMT2 reverse primer, CTGAAAGGACCCCTAGTGTACAAGA;
PhBSMT2 TaqMan probe, 6FAM-CTTCATAGGTGGTCGAGGTGCTAATT-
TATCTAGTC-BHQ1. TaqMan Real-time PCR reactions were run under the
following conditions: 48�C 30 min, 95�C 10 min, followed by 40 cycles of 95�C15 s and 60�C 1 min. Reactions were repeated twice with one set of RNAs and
once with RNA collected from a duplicate set of tissues. PCR reactions of
tritiated in vitro-transcribed PhBSMT1 or PhBSMT2 standards were run in
duplicate and in tandem with the sample RNAs to generate a standard curve
from which the level of each PhBSMT mRNA in the samples was quantified.
Generation of Transgenic PhBSMT RNAi Petunias
Petunia plants were transformed with and generated from one of two
different BSMT RNAi constructs. Transgenic lines BSMT-9 and BSMT-14 were
generated from transformations that utilized a pHANNIBAL-derived con-
struct (Wesley et al., 2001). For this construct, the segment between 661 and
1,002 nucleotides of the PhBSMT1 open reading frame was cloned in the sense
and antisense orientation to flank the intron in the pHANNIBAL vector. Lines
BSMT-4, BSMT-18, and BSMT-24 were generated from the construct SAMJR.
For this construct, the region spanning nucleotides 720 to 1,020 and 720 to
1,430 were cloned in the sense and antisense orientation without a flanking
intron into the pFMV cloning vector. The RNAi chimeric genes were sub-
sequently cloned into an Agrobacterium transformation vector containing the
neomycin phosphotransferase II (NPTII) gene. This transformation vector was
Underwood et al.
264 Plant Physiol. Vol. 138, 2005 www.plant.org on October 14, 2014 - Published by www.plantphysiol.orgDownloaded from
Copyright © 2005 American Society of Plant Biologists. All rights reserved.
introduced into Agrobacterium tumefaciens by triparental mating and used for
transforming leaf explants from 5-week-old MD seedlings according to the
methods of Jorgensen et al. (1996). Primary transformants were grown under
standard greenhouse conditions, and transgenic plants were selected by PCR
for presence of NPTII, reduced BSMT mRNA levels, and reduced MeBA
emission. Flowers were self pollinated to produce T1 progeny from phenotype
positive lines that were analyzed for presence of transgene by PCR analysis. T1
progeny plants from each line were analyzed for phenotypes by measurement
of MeBA emission and measurement of BSMT mRNA levels.
Volatile Collection and Analysis
For ethylene treatment volatile collections, flowers were excised and
treated with ethylene as described in tissue collection methods. An additional
untreated control was included for the ethylene experiments to control for
flower excision, induced variability in air, and ethylene treatments. For this
control, flowers at the same developmental stages were collected fresh from
the plants to compare with air-treated control flowers. For pollinated flower
samples, flowers were pollinated on the plant and not excised until the time of
volatile collection. Flowers used for spatial volatile analysis were collected
from freshly opened flowers in the evening between 8 and 9 PM. Flowers and
floral organs were weighed prior to volatile collection. Three flowers were
collected per treatment and each time point/treatment was repeated three
times. Flowers from the BSMT RNAi screen were collected three times with
3 to 5 flowers/collection at 8 PM for the initial screen and once more with
putative positive lines at 12 AM to verify that reduced MeBA emission was
reduced when MeBA emission is maximal in MD (Kolosova et al., 2001).
Volatiles were collected for 1 h according to collection protocol described by
Schmelz et al. (2001). Briefly, filtered air was flowed at a constant rate for 1 h
over flowers in glass tubes (17 mm 3 61 cm, 127-mL volume) with volatiles
collecting on columns with Super-Q resin. Volatiles collected on the Super-Q
resin were eluted with methylene chloride (Fisher Scientific). A total of 400 ng
nonyl acetate was added to the columns as an internal standard before the
volatiles were eluted. Identification of each of the floral volatiles was verified
by gas chromatography-mass spectrometry (Schmelz, et al., 2001).
BA and SA Extraction and Quantification
BA and SA were extracted and quantified by gas chromatography-mass
spectrometry (Schmelz et al., 2003). Basal control levels of BA may have been
overestimated due to trace BA contaminants in analytical grade solvents;
however, significant differences between treatment groups were unaffected
and remain valid (Schmelz et al., 2004). Petal tissue was excised fromMD and
44568 whole flowers after 10 h treatment with 2 to 3 mL L21 ethylene or 36 h
after pollination and stored at 280�C until extraction. Two replicate sets of
tissues were used for substrate quantification.
Human Sensory Panels
Human sensory panels were used to determine if differences in fragrance
of the reduced MeBA flowers and MD wild-type flowers could be discrim-
inated by human olfaction. The flower samples were prepared from freshly
excised flowers at anthesis from MD and knockout line BSMT-9. Excised
flowers were placed immediately into 5-mL water agarose blocks, then placed
into 210-mL glass jars and sealed with lids for approximately 120 min before
testing. A triangle test (Lawless and Heymann, 1998) was performed with 60
human subjects, each randomly given a set of 3 unmarked flowers for
sampling of the floral fragrances. Each set of flowers consisted of two flowers
of the same genotype and one of the other genotype. The test was performed
both with two controls and one transgenic or two transgenics and one control
and panelists were asked to judge which flower had a different fragrance.
Additional descriptive comments were also solicited from the test subjects
to determine if there were preferences in floral fragrance. The statistical
significance of the correct number of judgments was determined as described
(Lawless and Heymann, 1998).
Sequence data from this article have been deposited with the EMBL/
GenBank data libraries under accession numbers AAO45012 and AAO45013.
Received August 4, 2004; returned for revision February 1, 2005; accepted
February 1, 2005.
LITERATURE CITED
Atkinson DE (1977) Functional stoichiometric coupling and metabolic
prices. In Cellular Energy Metabolism and Its Regulation. Academic
Press, New York, pp 31–83
Boatright J, Negre F, Chen X, Kish CM, Wood B, Peel G, Orlova I, Gang D,
Rhodes D, Dudareva N (2004) Understanding in vivo benzenoid
metabolism in petunia petal tissue. Plant Physiol 135: 1993–2011
Bui AQ, O’Neill SD (1998) Three 1-aminocyclopropane-1-carboxylate
synthase genes regulated by primary and secondary pollination signals
in orchid flowers. Plant Physiol 116: 419–428
Burquez A, Corbet SA (1991) Do flowers resorb nectar? Funct Ecol 5:
369–379
Chen F, D’Auria JC, Tholl D, Ross JR, Gershenzon J, Noel JP, Pichersky E
(2003) An Arabidopsis thaliana gene for methylsalicylate biosynthesis,
identified by a biochemical genomics approach, as a role in defense.
Plant J 36: 577–588
Ciardi J, Tieman DM, Lund SD, Jones JB, Stall RE, Klee HJ (2000)
Response to Xanthomonas campestris pv. vesicatoria in tomato involves
regulation of ethylene receptor gene expression. Plant Physiol 123:
81–92
Clark DG, Gubrium EK, Klee HJ, Barrett JE, Nell TA (1999) Root
formation in ethylene insensitive plants. Plant Physiol 121: 53–59
Dexter RJ, Shibuya K, Loucas HM, Clark DG, Underwood BA, Tieman
DM, Klee HJ (2004) The isolation of BEBT from Petunia hybrida: a flower
specific gene involved in floral volatile synthesis (abstract no. 273). In
Plant Biology 2004, American Society of Plant Biologists, July 24–28,
2004, Lake Buena Vista, FL
Dudareva N, Murfitt LM, Mann CJ, Gorenstein N, Kolosova N, Kish CM,
Bonham C, Wood K (2000) Developmental regulation of methyl ben-
zoate biosynthesis and emission in snapdragon flowers. Plant Cell 12:
949–961
Gubrium EK, Clevenger DJ, Clark DG, Barrett JE, Nell TA (2000) Re-
production and horticultural performance of transgenic ethylene-
insensitive petunias. J Am Soc Hortic Sci 125: 277–281
Helsper JPFG, Davies JA, Bouwmeester HJ, Krol AF, van Kampen MH
(1998) Circadian rhythmicity in emission of volatile compounds by
flowers of Rosa hybrida L. cv. Honesty. Planta 207: 88–95
Hoekstra FA, Weges R (1986) Lack of control by early pistillate ethylene
on the accelerated wilting of Petunia hybrida flowers. Plant Physiol 80:
403–408
Holden MJ, Marty JA, Singh-Cundy A (2003) Pollination-induced ethyl-
ene promotes the early phase of pollen tube growth in Petunia inflata.
J Plant Physiol 160: 261–269
Jones MB, Mansfield TA (1975) Circadian rhythms in plants. Sci Prog Oxf
62: 103–125
Jones ML, Langston BJ, Johnson F (2003). Pollination-induced senescence
of ethylene sensitive and insensitive petunias. In M Vendrell, F Romo-
jaro, eds, Biology and Biotechnology of the Plant Hormone Ethylene III.
Kluwer Academic Publishers, Dordrecht, The Netherlands
Jones ML, Woodson WR (1999) Interorgan signaling following pollination
in carnations. J Am Soc Hortic Sci 124: 598–604
Jorgensen RA, Cluster PD, English J, Oue O, Napoli CA (1996) Chalcone
synthase cosuppression phenotypes in petunia flowers: comparison of
sense vs antisense constructs and single-copy vs complex T-DNA
sequences. Plant Mol Biol 31: 957–973
Knudsen JT, Tollsten L, Bergstrom LG (1993) Review article number 76:
Floral scents: a checklist of volatile compounds isolated by head-space
techniques. Phytochemistry 33: 253–280
Kolosova N, Gorenstein N, Kish CM, Dudareva N (2001) Regulation of
circadian methyl benzoate emission in diurnally and nocturnally
emitting plants. Plant Cell 13: 2333–2347
Lawless HT, Heymann H (1998) Sensory Evaluation of Food. Chapman and
Hall Publishers, New York
Negre F, Kish CM, Boatright J, Underwood BA, Shibuya K, Wagner C,
Clark DG, Dudareva N (2003) Regulation of methylbenzoate emis-
sion after pollination in snapdragon and petunia flowers. Plant Cell 15:
2992–3006
O’Neill SD (1997) Pollination regulation of flower development. Annu Rev
Plant Physiol Plant Mol Biol 48: 547–574
O’Neill SD, Nadeau JA, Zhang XS, Bui AQ, Halevy AH (1993) Interorgan
regulation of ethylene biosynthetic genes by pollination. Plant Cell 5:
419–432
Ethylene-Regulated Floral Volatile Synthesis in Petunia Corollas
Plant Physiol. Vol. 138, 2005 265 www.plant.org on October 14, 2014 - Published by www.plantphysiol.orgDownloaded from
Copyright © 2005 American Society of Plant Biologists. All rights reserved.
Pott MB, Pichersky E, Piechulla B (2002) Transcriptional and post-
translational regulation of S-adenosyl-L-methionine: salicylic acid car-
boxyl methyltransferase (SAMT) during Stephanotis floribunda flower
development. J Plant Physiol 159: 925–934
Schiestl FP, Ayasse M (2001) Post-pollination emission of a repellent
compound in a sexually deceptive orchid: a new mechanism for max-
imising reproductive success? Oecologia 126: 531–534
Schmelz EA, Alborn HT, Tumlinson JH (2001) The influence of intact-
plant and excised-leaf bioassay designs on volicitin- and jasmonic acid-
induced sesquiterpene volatile release in Zea mays. Planta 214: 171–179
Schmelz EA, Engelberth J, Alborn HT, O’Donnell P, Sammons M,
Toshima H, Tumlinson JH (2003) Simultaneous analysis of phytohor-
mones, phytotoxins, and volatile organic compounds in plants. Proc
Natl Acad Sci USA 100: 10522–10557
Schmelz EA, Engelberth J, Tumlinson JH, Block A, Alborn HT (2004) The
use of vapor phase extraction in metabolic profiling of phytohormones
and other metabolites. Plant J 39: 790–808
Shibuya K, Barry KG, Ciardi JA, Loucas HM, Underwood BA,
Nourizadeh S, Ecker JR, Klee HJ, Clark DG (2004) The central role
of PhEIN2 in ethylene responses throughout plant development in
petunia. Plant Physiol 136: 2900–2912
Simkin AJ, Underwood BA, Auldridge M, Loucas HM, Shibuya E,
Schmelz E, Clark DG, Klee HJ (2004) Circadian regulation of the
PhCCD1 carotenoid dioxygenase controls emission of b-ionone, a fra-
grance volatile of petunia flowers. Plant Physiol 136: 3504–3514
Tang XY, Woodson WR (1996) Temporal and spatial expression of
1-aminocyclopropane-1-carboxylate oxidase mRNA following pollina-
tion of immature and mature petunia flowers. Plant Physiol 112: 503–511
Tollsten L (1993) Amultivariate approach to post-pollination changes in the
floral scent of Platanthera bifolia (Orchidaceae). Nord J Bot 13:
495–499
Underwood BA (2003) Effects of ethylene on floral fragrance in Petunia x
hybrida Mitchell Diploid. PhD dissertation. University of Florida,
Gainesville, FL
van Doorn WG (1997) Effects of pollination on floral attraction and
longevity. J Exp Bot 48: 1615–1622
Verdonk JC, de Vos CHR, Verhoeven HA, Haring MA, van Tunen AJ,
Schuurink RC (2003) Regulation of floral scent production in petunia
revealed by targeted metabolomics. Phytochemistry 62: 997–1008
Wesley SV, Helliwell CA, Smith NA, Wang MB, Rouse DT, Liu Q,
Gooding PS, Singh SP, Abbott D, Stoutjesdijk PA, et al (2001)
Construct design for efficient, effective and high-throughput gene
silencing in plants. Plant J 27: 581–590
Wilkinson JQ, Lanahan MB, Clark DG, Bleecker AB, Chang C,
Meyerowitz EM, Klee HJ (1997) A dominant mutant receptor from
Arabidopsis confers ethylene insensitivity in heterologous plants.
Nat Biotechnol 15: 444–447
Underwood et al.
266 Plant Physiol. Vol. 138, 2005 www.plant.org on October 14, 2014 - Published by www.plantphysiol.orgDownloaded from
Copyright © 2005 American Society of Plant Biologists. All rights reserved.
Related Documents