Ethnoarchaeological study of phytolith assemblages from an agro-pastoral village in Northern Greece (Sarakini): development and application of a Phytolith Difference Index Georgia Tsartsidou a, * , Simcha Lev-Yadun b , Nikos Efstratiou c , Steve Weiner d a Ephoreia of Palaeoanthropology-Speleology of Southern Greece, Ministry of Culture Greece, Ardittou 34B, Athens 11636, Greece b Department of Biology, University of Haifa-Oranim, Tivon 36006, Israel c Department of Archaeology, Faculty of Philosophy, University of Thessaloniki, 54006 Thessaloniki, Greece d Kimmel Center for Archaeological Science, Department of Structural Biology, Weizmann Institute of Science, Rehovot 76100, Israel Received 21 January 2007; received in revised form 6 May 2007; accepted 9 May 2007 Abstract Phytolith assemblages are analysed in an ethnographic agro-pastoral community in Northern Greece. A new method for analyzing the data, combined with the concentrations of phytoliths per gram sediment, helps to differentiate diverse uses of space in the village. The Phytolith Dif- ference Index (PDI) contrasts the phytolith assemblages in sediment samples from the region around the village least affected by human activ- ities with those in the village and its immediate surroundings. The PDI reveals that many of the samples are dominated by the input of the stalks of the domestic cereal, rye, which is used for food, animal fodder and roof thatching. The PDI also differentiates between dung from mules or donkeys with dung from free ranging cows and goats. Activity areas analysed include storage areas, stabling areas, animal enclosures, floors from living areas that were repeatedly swept, hearths and open areas between structures. The combined use of the PDI, together with phytolith concentrations and phytolith morphotype analyses, may prove to be useful for deciphering activity areas in archaeological sites of not only agro- pastoralists, but also pastoralists and hunteregatherers. Ó 2007 Elsevier Ltd. All rights reserved. Keywords: Phytoliths; Ethnoarchaeology; Activity areas; Greece 1. Introduction The arrangement and use of space in archaeological sites provide information on social and economic aspects of the community. Spatial organization studies, to date, are mostly based on domestic architecture, artifact analysis, osteo-archae- ology, plant macro-remains and geological studies (Carr, 1984; Kent, 1987, 1990; Brochier et al., 1992; Courty et al., 1994; Efstratiou et al., 1998; Allison, 1999; Moore et al., 2000; Hodder and Cessford, 2004). Phytoliths are particularly valuable in this respect, as they provide information on the distribution of botanical remains and related activities (Ma- della, 2001; Rosen, 2001, 2005; Sullivan and Kealhofer, 2004; Shahack-Gross et al., 2005; Piperno, 2006). Further- more, phytolith analyses conducted in abandoned Maasai villages in Kenya showed how they can be used to identify animal enclosures (Shahack-Gross et al., 2003, 2004). This study demonstrates the advantages of using an ethnographic approach for developing new tools for studying spatial organi- zation in archaeological sites. Here we explore the potential of using phytolith assem- blages to reconstruct aspects of spatial organization in an agro-pastoral community. The village of Sarakini is located in the mountains of Northern Greece. It was selected because in many respects it maintained a ‘traditional’ way of life due to its cultural (Slav speaking Muslim minority) and physical * Corresponding author. Tel.: þ30 2108310372; fax: þ30 2107561438. E-mail address: [email protected] (G. Tsartsidou). 0305-4403/$ - see front matter Ó 2007 Elsevier Ltd. All rights reserved. doi:10.1016/j.jas.2007.05.008 Journal of Archaeological Science 35 (2008) 600e613 http://www.elsevier.com/locate/jas

Welcome message from author
This document is posted to help you gain knowledge. Please leave a comment to let me know what you think about it! Share it to your friends and learn new things together.
Transcript

Journal of Archaeological Science 35 (2008) 600e613http://www.elsevier.com/locate/jas
Ethnoarchaeological study of phytolith assemblages from an agro-pastoralvillage in Northern Greece (Sarakini): development and application of
a Phytolith Difference Index
Georgia Tsartsidou a,*, Simcha Lev-Yadun b, Nikos Efstratiou c, Steve Weiner d
a Ephoreia of Palaeoanthropology-Speleology of Southern Greece, Ministry of Culture Greece, Ardittou 34B, Athens 11636, Greeceb Department of Biology, University of Haifa-Oranim, Tivon 36006, Israel
c Department of Archaeology, Faculty of Philosophy, University of Thessaloniki, 54006 Thessaloniki, Greeced Kimmel Center for Archaeological Science, Department of Structural Biology, Weizmann Institute of Science, Rehovot 76100, Israel
Received 21 January 2007; received in revised form 6 May 2007; accepted 9 May 2007
Abstract
Phytolith assemblages are analysed in an ethnographic agro-pastoral community in Northern Greece. A new method for analyzing the data,combined with the concentrations of phytoliths per gram sediment, helps to differentiate diverse uses of space in the village. The Phytolith Dif-ference Index (PDI) contrasts the phytolith assemblages in sediment samples from the region around the village least affected by human activ-ities with those in the village and its immediate surroundings. The PDI reveals that many of the samples are dominated by the input of the stalksof the domestic cereal, rye, which is used for food, animal fodder and roof thatching. The PDI also differentiates between dung from mules ordonkeys with dung from free ranging cows and goats. Activity areas analysed include storage areas, stabling areas, animal enclosures, floorsfrom living areas that were repeatedly swept, hearths and open areas between structures. The combined use of the PDI, together with phytolithconcentrations and phytolith morphotype analyses, may prove to be useful for deciphering activity areas in archaeological sites of not only agro-pastoralists, but also pastoralists and hunteregatherers.� 2007 Elsevier Ltd. All rights reserved.
Keywords: Phytoliths; Ethnoarchaeology; Activity areas; Greece
1. Introduction
The arrangement and use of space in archaeological sitesprovide information on social and economic aspects of thecommunity. Spatial organization studies, to date, are mostlybased on domestic architecture, artifact analysis, osteo-archae-ology, plant macro-remains and geological studies (Carr,1984; Kent, 1987, 1990; Brochier et al., 1992; Courty et al.,1994; Efstratiou et al., 1998; Allison, 1999; Moore et al.,2000; Hodder and Cessford, 2004). Phytoliths are particularlyvaluable in this respect, as they provide information on the
* Corresponding author. Tel.: þ30 2108310372; fax: þ30 2107561438.
E-mail address: [email protected] (G. Tsartsidou).
0305-4403/$ - see front matter � 2007 Elsevier Ltd. All rights reserved.
doi:10.1016/j.jas.2007.05.008
distribution of botanical remains and related activities (Ma-della, 2001; Rosen, 2001, 2005; Sullivan and Kealhofer,2004; Shahack-Gross et al., 2005; Piperno, 2006). Further-more, phytolith analyses conducted in abandoned Maasaivillages in Kenya showed how they can be used to identifyanimal enclosures (Shahack-Gross et al., 2003, 2004). Thisstudy demonstrates the advantages of using an ethnographicapproach for developing new tools for studying spatial organi-zation in archaeological sites.
Here we explore the potential of using phytolith assem-blages to reconstruct aspects of spatial organization in anagro-pastoral community. The village of Sarakini is locatedin the mountains of Northern Greece. It was selected becausein many respects it maintained a ‘traditional’ way of life due toits cultural (Slav speaking Muslim minority) and physical
601G. Tsartsidou et al. / Journal of Archaeological Science 35 (2008) 600e613
isolation from other rural and urban centers in the region. Theaccess to the village was, until the late 1980s, confined to for-est roads and was therefore difficult. Even today the area is noteasily accessible in winter. Furthermore, there is a rich body ofethnoarchaeological and social anthropological evidenceavailable for this village due to research carried out in thearea for over 20 years (Efstratiou, 1982, 1984, 1985, 1990,1999, 2002; Tsibiridou, 1994, 1999, 2000). These studies pro-vide information on issues pertaining to ‘geographical’ and so-cial arrangements in the village, as well as on different aspectsof everyday life. The extended contacts of Efstratiou and Tsi-biridou with the villagers facilitated our access to the commu-nity. A local ‘guide’ (informant), Ali Sinap, worked with usand provided invaluable information on the current and pastuses of each area and structure in the village.
The objective of this study is to determine to what extentvariations in phytolith assemblages reflect the spatial organiza-tion of the agro-pastoral village. Different plants and plantparts produce phytoliths with different morphologies (Piperno,2006). After the plant organic materials have degraded, thephytoliths generally remain in the sediments. They can thusbe used to differentiate uses of space based on the major planttypes and parts that were used for functions such as foddering,flour production, cereal storage, fuel, matting, roofing andmany other purposes. In fact, the phytolith record reflectsthe archaeozoological record (through foddering, dung fuel,etc.) as well as the archaeobotanical record. As the phytolithdatabase is enormous, we have developed a novel approachto initially assess the variations between assemblages. Withthis information in hand, we further analyse in detail specificareas of interest, and in particular those that can be appliedto better understanding other archaeological sites that havesimilar characteristics.
1.1. Description of the ethnographic environment
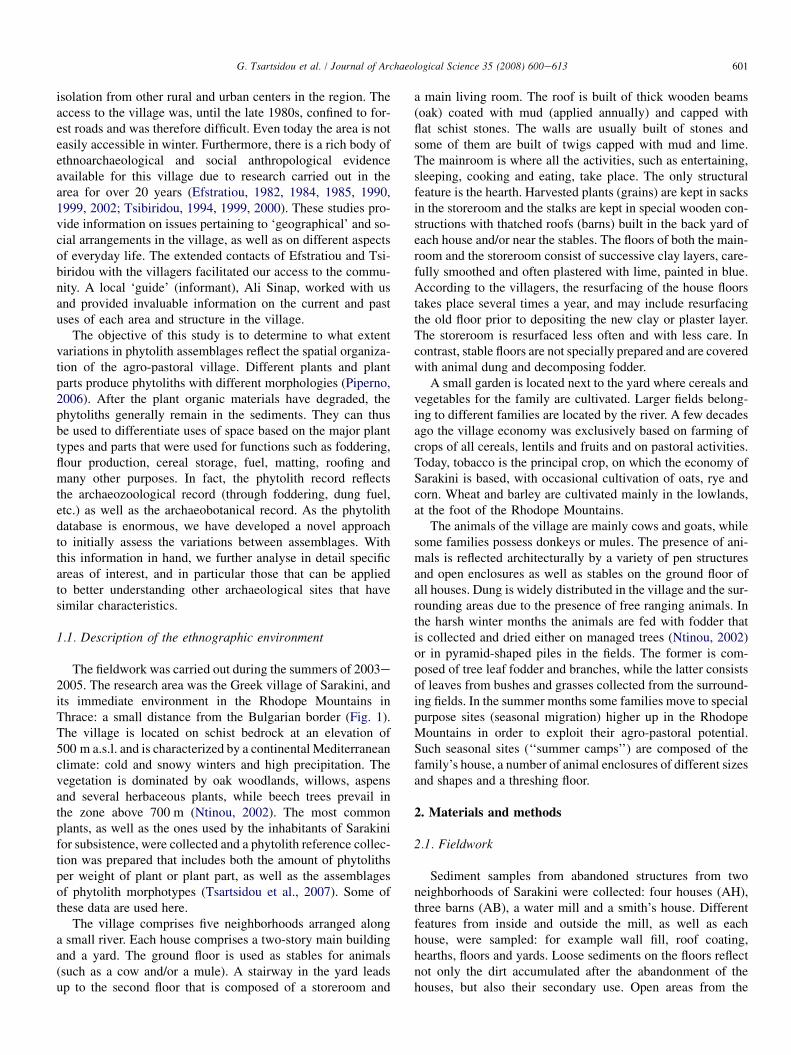
The fieldwork was carried out during the summers of 2003e2005. The research area was the Greek village of Sarakini, andits immediate environment in the Rhodope Mountains inThrace: a small distance from the Bulgarian border (Fig. 1).The village is located on schist bedrock at an elevation of500 m a.s.l. and is characterized by a continental Mediterraneanclimate: cold and snowy winters and high precipitation. Thevegetation is dominated by oak woodlands, willows, aspensand several herbaceous plants, while beech trees prevail inthe zone above 700 m (Ntinou, 2002). The most commonplants, as well as the ones used by the inhabitants of Sarakinifor subsistence, were collected and a phytolith reference collec-tion was prepared that includes both the amount of phytolithsper weight of plant or plant part, as well as the assemblagesof phytolith morphotypes (Tsartsidou et al., 2007). Some ofthese data are used here.
The village comprises five neighborhoods arranged alonga small river. Each house comprises a two-story main buildingand a yard. The ground floor is used as stables for animals(such as a cow and/or a mule). A stairway in the yard leadsup to the second floor that is composed of a storeroom and
a main living room. The roof is built of thick wooden beams(oak) coated with mud (applied annually) and capped withflat schist stones. The walls are usually built of stones andsome of them are built of twigs capped with mud and lime.The mainroom is where all the activities, such as entertaining,sleeping, cooking and eating, take place. The only structuralfeature is the hearth. Harvested plants (grains) are kept in sacksin the storeroom and the stalks are kept in special wooden con-structions with thatched roofs (barns) built in the back yard ofeach house and/or near the stables. The floors of both the main-room and the storeroom consist of successive clay layers, care-fully smoothed and often plastered with lime, painted in blue.According to the villagers, the resurfacing of the house floorstakes place several times a year, and may include resurfacingthe old floor prior to depositing the new clay or plaster layer.The storeroom is resurfaced less often and with less care. Incontrast, stable floors are not specially prepared and are coveredwith animal dung and decomposing fodder.
A small garden is located next to the yard where cereals andvegetables for the family are cultivated. Larger fields belong-ing to different families are located by the river. A few decadesago the village economy was exclusively based on farming ofcrops of all cereals, lentils and fruits and on pastoral activities.Today, tobacco is the principal crop, on which the economy ofSarakini is based, with occasional cultivation of oats, rye andcorn. Wheat and barley are cultivated mainly in the lowlands,at the foot of the Rhodope Mountains.
The animals of the village are mainly cows and goats, whilesome families possess donkeys or mules. The presence of ani-mals is reflected architecturally by a variety of pen structuresand open enclosures as well as stables on the ground floor ofall houses. Dung is widely distributed in the village and the sur-rounding areas due to the presence of free ranging animals. Inthe harsh winter months the animals are fed with fodder thatis collected and dried either on managed trees (Ntinou, 2002)or in pyramid-shaped piles in the fields. The former is com-posed of tree leaf fodder and branches, while the latter consistsof leaves from bushes and grasses collected from the surround-ing fields. In the summer months some families move to specialpurpose sites (seasonal migration) higher up in the RhodopeMountains in order to exploit their agro-pastoral potential.Such seasonal sites (‘‘summer camps’’) are composed of thefamily’s house, a number of animal enclosures of different sizesand shapes and a threshing floor.
2. Materials and methods
2.1. Fieldwork
Sediment samples from abandoned structures from twoneighborhoods of Sarakini were collected: four houses (AH),three barns (AB), a water mill and a smith’s house. Differentfeatures from inside and outside the mill, as well as eachhouse, were sampled: for example wall fill, roof coating,hearths, floors and yards. Loose sediments on the floors reflectnot only the dirt accumulated after the abandonment of thehouses, but also their secondary use. Open areas from the

Fig. 1. The location of the village of Sarakini in Northern Greece.
602 G. Tsartsidou et al. / Journal of Archaeological Science 35 (2008) 600e613
village were also sampled: paths, fields, threshing floors, fod-der piles and fresh dung (goat, cow and mule/donkey). We alsosampled sediments from a summer camp, including two enclo-sures, a floor, wall fill and a hearth from a house, and a thresh-ing floor Finally, we sampled the collapsed house of the smithlocated at the periphery of the neighborhood. All the abovestructures, apart from the smith’s house and the mill, wasabandoned about 15 years prior to the study. The smith’s housewas abandoned more than 20 years before the study, and themill was in use two years before the study. The use of eacharea was described in detail by Ali Sinap, our informant. Fi-nally for comparison, we collected regional (control) samplesfrom open areas outside the village. In total 117 samples werecollected (Table 1).
2.2. Phytolith analysis
The treatment of the samples followed the method of Al-bert (2000) and is described briefly below. A different methodwas used for the removal of the organics as many of the sed-iment samples of Sarakini were rich in organics. By ashingthese samples and not using hydrogen peroxide, we avoidedthe possible entrapment of phytoliths within undigested or-ganic matter. The sediment samples were heated in a furnaceat 500 �C for 4 h. The ash was treated with 1 N HCl andcentrifuged (3500 rpm for 10 min), resuspended in deionizedwater and centrifuged again. The supernatant was discardedand the washing was repeated three times. This constituted
the acid insoluble fraction (AIF). The AIF was transferredinto a centrifuge tube and 5 ml of heavy liquid were added.The suspension was sonicated for 10 min until it was well dis-persed. It was then centrifuged at 3500 rpm for 20 min. Thesupernatant was transferred to another centrifuge tube, 1 mlof water was added and again centrifuged as above. This cyclewas repeated once more and then the tube was filled withwater for the final centrifugation and wash. In so doing thedenser minerals were separated from the less dense silica infour stages. All the four fractions were weighed dry. Thelast two fractions contained almost all the phytoliths. About1 mg of each of these fractions was accurately weighed andthen placed on two slides. Entellan glue (Merck) was addedand cover slips were lowered carefully over the well-mixedsuspensions. Ideally 200 phytoliths with consistent morphol-ogy (see Albert et al., 1999 for the definition) were countedon each slide, when possible, and normalized to per thousandvalues. Albert and Weiner (2001) demonstrated that the count-ing of 194 phytoliths with consistent morphology gives anerror of �23%. The total number of phytoliths on the slide(consistent and variable morphologies) was then determinedand related to 1 g of sediment following the method of Albertet al., (1999).
The phytolith morphologies (referred to as morphotypes)were classified according to their anatomical origin. Whenthis was not possible they were classified according to theirgeometrical shape following the terminology used by Albert(2000), Brown (1984), Metcalfe (1960), Piperno (1988) and

Table 1
List of all the samples analysed from Sarakini. It also shows the number of
phytoliths per gram sediment and the PDI index value of each sample
Sample
number
Description PDI # Phytoliths/
g sediment
SAR 1 AH1mainroom/roof coating 1 1500
SAR 4 AH1 mainroom/wall fill 34 96,000
SAR 5 AH1 mainroom/floor loose sediment 80 150,000
SAR 6 AH1 floor top final cover 1 2000
SAR 7 AH1 mainroom/floor beneath first plaster 1 200
SAR 8 AH1 clay layer beneath 7 1 0
SAR 9 AH1 3 cm beneath the first layer 1 500
SAR 10 AH1 loose sediment/SW corner of house 175 200,000
SAR 11 AH1 loose sediment in the hearth 105 72,000
SAR 12 AH1 hearth floor 1 150,000
SAR 14 AH 2 roof coating 1 8000
SAR 15 AH2 courtyard. Section 1 top 52 500,000
SAR 16 AH2 courtyard. Section 1 bedrock 1 1500
SAR 17 AH2 courtyard. Section 2 top 68 500,000
SAR 18 AH2 courtyard. Section 2 bedrock 1 2000
SAR 19 AB3: sediment with goat/sheep dung 363 67,000
SAR 20 AB3 top soil 223 76,000
SAR 21 AB3 section - surface whitish layer 1 29,500
SAR 22 AB3 section - surface crust 74 112,000
SAR 23 AB3 section - under sample 21 1 12,000
SAR 24 AB3 section - gray layer under sample 23 1 100
SAR 25 AB3 section - under sample 24 1 2000
SAR 26 AB3 section - bottom 37 100,000
SAR 27 AB3 loose sediment at the lower part of
barn floor
140 350,000
SAR 30 Regional sample (forest) 23 6000
SAR 31 SC caprine enclosure. Section top 1e2 cm 27 70,000
SAR 32 SC caprine enclosure. Section 2e5 cm 38 56,000
SAR 33 SC caprine enclosure. Section> 5 cm 1 200
SAR 34 SC control of caprine enclosure.
Section top 1e2 cm
66 2,000,000
SAR 35 SC control of caprine enclosure.
Section 2e5 cm
39 350,000
SAR 36 SC control of caprine enclosure.
Section 5e8 cm
53 200,000
SAR 37 SC house hearth sediment 1 70
SAR 38 SC sediment between wall stones 1 0
SAR 39 SC house floor section/surface
layer - charcoal-rich
69 96,000
SAR 40 SC house floor section/section 3e5 cm.
Top of the real floor?
31 27,000
SAR 41 SC house floor section> 5 cm, clay-rich 1 0
SAR 42 SC cattle/horse enclosure.
Section top 1e3 cm
55 700,000
SAR 43 SC cattle/horse enclosure. Section 3e6 cm 48 61,000
SAR 44 SC cattle/horse enclosure. Section > 6 cm 80 31,000
SAR 45 SC open area between enclosures.
Section top
132 150,000
SAR 46 SC open area between enclosures.
Section> 3 cm
92 88,000
SAR 47 SC control above the site. Section top 138 200,000
SAR 48 SC control above the site. Section> 2 cm 115 89,000
SAR 49 SC control - open area next to threshing
floor. Section top
76 10,500
SAR 50 SC control - open area next to
threshing floor
64 8000
SAR 51 SC threshing floor section 1 top 69 14,000
SAR 52 SC threshing floor section 1 midde 31 19,000
SAR 53 SC threshing floor section 1 bottom 37 22,000
SAR 54 SC threshing floor section 2
(next to wall) top
92 800,000
Table 1 (continued )
Sample
number
Description PDI # Phytoliths/
g sediment
SAR 55 SC threshing floor section 2
(next to wall) 2e4 cm
123 190,000
SAR 55B SC threshing floor section 2
(next to wall) 4e6 cm
32 78,000
SAR 69 AH 5 sediment from the exit of toilet 78 100,000
SAR 70 AH 5 control - open field next to house 49 100,000
SAR 73 AB5 floor section surface,
hay sediment (1e4 cm)
92 3,700,000
SAR 74 AB5 floor section (4e8 cm) 94 2,000,000
SAR 75 AB5 floor section bottom (>8 cm) 83 600,000
SAR 77 AH5 threshing floor section top 82 100,000
SAR 78 AH5 threshing floor section 2e4 cm 1 3000
SAR 79 AH1 courtyard accumulated dung (mule?) 146 2,800,000
SAR 80 Goat dung 534 800,000
SAR 81 Cattle dung 220 250,000
SAR 82 AH1 yard sediment 111 1,500,000
SAR 83 AH1 storeroom floor section surface layer 234 55,000
SAR 84 AH1 storeroom floor section lower layer 62 160,000
SAR 85 AH1 storeroom base 38 128,000
SAR 86 AH1 stable 401 150,000
SAR 87A AH1 mainroom loose sediment adhering
to plaster floor
177 28,500
SAR 87B AH1 mainroom loose sediment 1 cm
above floor. SW corner
78 79,000
SAR 90 AH1 mainroom section,
7 cm from surface
1 4500
SAR 91 AH1 floor section - base (mud mixture) 57 17,500
SAR 93 Path next to AH2 37 173,500
SAR 94 AB3 control - open field next to barn 49 19,500
SAR 95 Animal fodder (straw) accumulated next
to AB3
237 111,000
SAR 96 Path at Gorna quarter 54 250,000
SAR 97 Kupan fodder: mixture of grasses and
dicot herbs and shrubs
307 850,000
SAR 99 Smith’s house control - open area above
the house
1 1500
SAR 100 Smith’s house. Section top 46 32,500
SAR 101 Smith’s house. Section 13 cm 1 8,000
SAR 102 Smith’s house. Section 20 cm 84 33,500
SAR 103 Smith’s house. Section 30 cm 79 171,000
SAR 104 Smith’s house. Section 40 cm 107 1,200,000
SAR 105 Smith’s house. Section 45 cm 83 984,000
SAR 145 Mill floor surface 64 142,000
SAR 146 Mill floor section 1e2 cm 93 104,000
SAR 147 Mill floor section> 2 cm 104 168,000
SAR 148 Mill hearth sediment 175 238,000
SAR 149 Mill yard sediment 26 317,000
SAR 150 Sediment with slag from the slope
under smith’s house
49 109,500
SAR 151 Bedrock: regolith on mica schist 1 100
SAR 152 AB6 floor section - hay-rich sediment 83 1,000,000
SAR 153 AB6 floor section bottom 47 75,000
SAR 202 AH7 mainroom floor section surface 1 27,500
SAR 203 AH7 mainroom floor section 0.5 cm 1 2,500
SAR 204 AH7 mainroom floor section 1 cm 1 100
SAR 205 AH7 mainroom floor section 2 cm 1 100
SAR 206 AH7 mainroom floor section bottom
(mud mixture and clay?)
1 1000
SAR 207 AH7 storeroom floor successive
clay layers
1 200
SAR 208 AH7 storeroom floor section bottom
(mud mixture)
1 0
(continued on next page)
603G. Tsartsidou et al. / Journal of Archaeological Science 35 (2008) 600e613
Table 1 (continued)
Sample
number
Description PDI # Phytoliths/
g sediment
SAR 209 AH7 storeroom floor successive
clay layers
1 1000
SAR 212 SC Cattle enclosure sediment
with much dung
40 4,500,000
SAR 249 Natural clay deposit 1 0
SAR 301 Regional sample (grassland) section top 24 4500
SAR 302 Regional sample (grassland) section
bottom
10 2500
SAR 303 AH8 Storeroom floor section 0.5 cm.
Clay layer with lime
47 23,500
SAR 304 AH8 storeroom floor section 1 cm.
Crude clay layer
1 3000
SAR 305 AH8 storeroom floor section 2 cm.
Mud mixture
1 7000
SAR 306 AH9 storeroom floor section 0.5 cm.
Clay floor with lime
1 900
SAR 307 AH9 storeroom floor section 1 cm.
Dark grayish black layer
1 1000
SAR 308 AH9 storeroom floor section 2 cm.
Mud mixture
1 1000
SAR 309 AH9 storeroom floor section> 2 cm
Sub-stratum
1 1500
SAR 310 AH9 mainroom floor section 0e4 cm.
Dung layer
139 117,000
SAR 311 AH9 mainroom floor section 4e6 cm.
Clay floors
1 150
SAR 312 AH9 mainroom floor section 6.5 cm.
Gray layer
21 13,000
SAR 313 AH9 mainroom floor section 7 cm.
Sub-stratum
1 1500
SAR 314 Regional sample: grassland next to pen.
Section top
52 15,500
SAR 315 Regional control: grassland next to pen.
Section bottom
48 148,500
SAR 316 Regional sample (forest) 30 102,000
AH¼Abandoned House, AB¼Abandoned Barn, SC¼ Summer Camp.
604 G. Tsartsidou et al. / Journal of Archaeological Science 35 (2008) 600e613
Twiss et al. (1969). Where appropriate we also followed theInternational Code for Phytolith Nomenclature (Madellaet al., 2005). Table 2 lists the morphologies identified.
2.3. The Phytolith Difference Index (PDI)
The 117 samples collected in and around Sarakini containtogether 114 different phytolith morphotypes. This constitutesan enormous amount of data that are difficult to analyse. Asa first step in the analysis, we identify samples that havebeen impacted directly or indirectly to different extents byhuman behavior. This initial analysis is followed by a detailedstudy of the phytolith assemblages.
The approach we use for assessing human impact on thephytolith assemblages is to normalize all the samples (ex-pressed as per thousand morphotypes) to the average of four‘‘regional’’ samples (SAR 30, 301, 302, 316), which in our es-timate has been least affected by human behavior in this area.They were obtained from open grasslands and forested areasnear the village. We do not claim that these four sampleshave not been impacted by human behavior, but that they
are the best possible ‘‘regional’’ samples currently availableto us from this area. Table 2 shows their morphotype assem-blages. It also shows the averages of each of the morphotypesfrom the four samples. We use this averaged assemblage asour representative regional sample. We emphasize that thesesamples are not replicates, but representatives of the less im-pacted areas around the village.
The manner, in which the samples are normalized, is shownusing the three dung samples (Table 2). Basically, the per thou-sand value of each morphotype in the sample is divided by theaverage regional value for that morphotype, and the sum of thevalues for each of the individual morphotypes is referred to asthe Phytolith Difference Index (PDI). As we would like to max-imize the difference between a sample and the regional average,we arbitrarily replaced the zeros in the regional average with 1part per thousand. In so doing the contribution of morphotypesabsent in the regional samples but present in the village samplesis not lost. The normalization also minimizes the input to thePDI of samples that have morphotypes that are more abundantin the regional average. If the normalized value for a specificmorphotype is less than 0.5, we round it off to zero, and if itis greater than 0.5, it is rounded off to 1. We also rounded offthe higher values in the same way.
We tried various other methods of calculation, including mul-tivariable analysis. Multivariable analysis was rejected, since itrelated the samples to the distances, negative or positive fromthe regional controls. Our method takes into account only thepositive distance of each sample from the regional samples, aswe assume that at least one phytolith of every morphotype wouldbe found had we counted enough phytoliths. Another importantcriterion for choosing the above mode of calculation was that itmaximizes the differences between the three dung samples (seebelow). This reflects the fact that the diets of the mules/donkeys,the cows and the goats are very different.
Note that a plot of phytoliths per gram sediment versusnumber of morphotypes does not differentiate between thethree dung samples, and in fact has a linear distribution(data not shown). This implies that the more phytoliths thereare in the sample, the larger is the number of morphotypes;a relation that is not too helpful for differentiating between ac-tivity areas.
3. Results
Table 1 lists the PDI values and phytolith concentrations foreach of the samples analysed. Samples, in which less than 100consistent morphology phytoliths were counted, were regardedas statistically unreliable. They were given an arbitrary PDIvalue of 1. The error of the PDI value is certainly largerthan the �23% analytical error introduced by the countingof the morphotypes (Albert and Weiner, 2001), because ofthe normalization procedure. As the four regional samplesare not replicates, we did not use the standard deviations onthe average values as a basis for calculating the normalizationerror. Instead, we calculated the variability of the PDI for 20arbitrary samples introduced by using each regional sampleseparately. The standard deviation of the average of this value

Table 2
The phytolith morphotypes (SS¼ silica skeleton, i.e. articulated phytoliths) present in the four ‘‘regional’’ samples (per thousand), as well as the three dung
samples (SAR 79, 80, 81 of mule or donkey, goat and cow, respectively)
Morphotypes Regional samples Regional samples Dung samples Dung samples
Consistent morphology
phytoliths
SAR
30
SAR
301
SAR
302
SAR
316
SAR
30
SAR
301
SAR
302
SAR
316
Average SAR
79
SAR
80
SAR
81
SAR
79
SAR
80
SAR
81
Absolute numbers Per thousand Per thousand Normalized
Bulliform 2 5 2 1 14 29 31 3 19 4 4 6 0 0 0
Conical 0 0 0 0 0 0 0 0 1 0 4 0 0 4 0
Trapeziform 22 44 10 32 157 257 156 84 164 125 32 71 1 0 0
Cylindric 0 0 1 1 0 0 16 3 5 20 5 1 4 1 0
Ovate 0 0 0 0 0 0 0 0 1 1 0 0 1 0 0
Hair cell 10 9 5 54 71 53 78 141 86 32 43 78 0 0 1
Hair cell aculeate 0 0 0 0 0 0 0 0 1 3 0 0 3 0 0
Hair base 0 0 0 0 0 0 0 0 1 4 2 0 4 2 0
Papillae wild 0 0 0 0 0 0 0 0 1 0 7 15 0 7 15
Papillae Triticum sp. 0 0 0 0 0 0 0 0 1 1 0 0 1 0 0
Papillae indetermined 0 0 0 0 0 0 0 0 1 10 5 8 10 5 8
Prickle 6 37 8 85 43 216 125 223 152 11 5 25 0 0 0
Elongate 0 0 0 1 0 0 0 3 1 0 0 0 0 0 0
Cuneiform bulliform 0 1 0 0 0 6 0 0 1 0 0 0 0 0 0
Long cell dendritic 1 3 0 7 7 18 0 18 11 33 2 12 3 0 1
Long cell echinate 0 0 0 0 0 0 0 0 1 6 0 0 6 0 0
Long cell psilate 54 38 18 145 386 222 281 380 317 38 52 119 0 0 0
Long cell n-lobate 0 0 0 1 0 0 0 3 1 0 0 0 0 0 0
Long cell sinuate 1 0 0 0 7 0 0 0 2 5 0 0 3 0 0
Long cell nodulose 0 1 0 2 0 1 0 1 1 0 0 0 0 0 0
Parallelepiped thick
round ends
0 0 0 2 0 0 0 5 1 0 5 2 0 4 2
Parallelepiped thick
square ends
0 0 0 1 0 0 0 3 1 0 0 0 0 0 0
Tabular 7 1 0 1 50 6 0 3 15 19 7 5 1 0 0
Tabular striate 1 0 0 0 7 0 0 0 2 0 0 0 0 0 0
Bilobate 0 1 0 0 0 6 0 0 1 1 18 0 1 12 0
Short cell cross 0 0 0 0 0 0 0 0 1 0 5 15 0 5 15
Short cell rondel 25 25 20 39 179 146 313 102 185 558 91 215 3 0 1
Short cell saddles 0 1 0 2 0 6 0 5 3 11 27 333 4 10 120
Globular 0 4 0 0 0 23 0 0 6 0 0 0 0 0 0
SS bulliforms 0 0 0 0 0 0 0 0 1 0 2 0 0 2 0
SS crenates 0 0 0 0 0 0 0 0 1 4 0 2 4 0 2
SS indetermined 0 0 0 1 0 0 0 3 1 29 2 5 29 2 5
SS jigsaw puzzle 0 0 0 0 0 0 0 0 1 0 4 0 0 4 0
SS long cells dendritic 0 0 0 0 0 0 0 0 1 16 0 0 16 0 0
SS long cells dendritic
wild
0 0 0 0 0 0 0 0 1 8 0 0 8 0 0
SS long cells dendritic
Hordeum/Secale
0 0 0 0 0 0 0 0 1 1 0 0 1 0 0
SS long cells psilate 2 1 0 1 14 6 0 3 6 18 4 19 3 1 3
SS long cells psilate
and crenates
0 0 0 0 0 0 0 0 1 3 2 0 3 2 0
SS long cells sinuate 0 0 0 0 0 0 0 0 1 8 0 1 8 0 1
SS long cells sinuate
and rondel
0 0 0 0 0 0 0 0 1 8 0 0 8 0 0
SS long cells sinuate
and saddles
0 0 0 0 0 0 0 0 1 13 0 0 13 0 0
SS long cells nodulose 0 0 0 0 0 0 0 0 1 0 0 4 0 0 4
SS long cells nodulose
and saddles
0 0 0 0 0 0 0 0 1 0 0 1 0 0 1
SS papillae 0 0 0 0 0 0 0 0 1 0 0 2 0 0 2
SS papillae wild 0 0 0 0 0 0 0 0 1 0 2 0 0 2 0
SS dicot leaf epidermis 0 0 0 2 0 0 0 5 1 6 611 44 5 467 34
SS globose cells 0 0 0 0 0 0 0 0 1 3 0 0 3 0 0
Tracheids 9 0 0 4 64 0 0 10 19 0 61 13 0 3 1
Total PDI 140 171 64 382 146 534 220
It is also illustrated how the PDI index is calculated for the three dung samples.
605G. Tsartsidou et al. / Journal of Archaeological Science 35 (2008) 600e613

Fig. 2. Plot of the number of phytoliths per gram sediment versus the PDI value for each sample with more than 100 consistent morphology phytoliths. Note that
only the samples from the sediment surface are included. Dung samples (SAR 79, 80, 81 of mule or donkey, goat and cow, respectively) are highlighted.
606 G. Tsartsidou et al. / Journal of Archaeological Science 35 (2008) 600e613
is �7%. We thus estimate the error on a PDI value to bearound �30%.
Fig. 2 is a plot of PDI values versus phytolith concentra-tions of the sediment samples from the village. We includeonly the samples collected at the surface and samples in whichmore than 100 consistent morphology phytoliths werecounted. The range of PDI values is from 10 to 534, and thephytolith concentrations span three orders of magnitude. Thesamples thus exhibit major differences in both parameters.Fig. 2 shows a box around the four regional control samples.These samples, as expected, have low PDI values (10e30)and also relatively low concentrations of phytoliths (fromaround 10,000 to 100,000 per gram sediment).
In order to assess the significance of the PDI, we first focuson the three dung samples (identified in Fig. 2). The mule/don-key dung, cow and goat dung samples all have relatively highphytolith concentrations, as expected, but most significantlyhave very different PDI values: 146, 220 and 534, respectively.The PDI values should be different as the diets of these ani-mals are different (mainly grasses including cereals with theirinflorescence for the mule/donkey; mainly wild grasses andsome cereal straw for the free ranging cows; and mainly dicotleaves and hay/straw for the free ranging goats). A qualitativeanalysis of the phytolith assemblages recovered from thesethree dung samples is consistent with the above animal diets;cereal husk phytoliths are found only in the horse dung, whilewild grass phytoliths, mainly Chloridoids (35%) are commonin the cow dung and dicot leaf phytoliths constitute 68% of thephytoliths in the goat dung. To better understand the dung PDIvalues, we also calculated the PDI values for wild grasses, ce-reals and leaves from dicots a conifer and a fern obtained fromplants in the vicinity of the village (Table 3).
Fig. 3 shows a plot of the number of phytoliths per gramdry plant weight versus their PDI values. The grasses in gen-eral contain many more phytoliths than most of the dicotleaves on a dry weight basis. This is a well-known phenome-non (Piperno, 2006; Twiss et al., 1969). The PDI values ofmost of the leaves have values greater than 400. The mostcommon leaf bearing plants in the area are the fern (Pteridiumaquilinum), three oak species (Quercus frainetto, Quercus
petraea, and Quercus pubescens) and a beech (Fagus sylva-tica). They all have leaves with PDI values around 670. Fur-thermore, a common plant in the area is chicory (Cichoriumsp.), a dicot herb. Its PDI value is very high (709). Two tallwild grasses that are also common in the area, the needle grass(Stipa bromoides) and the quaking grass (Briza maxima), havehigh PDI values (571 and 796, respectively). Most of the wildgrasses have PDI values in the range of 200e800. The mostcommon short wild grass in the area is Bermuda grass (Cyno-don dactylon), a wild grass that covers much of the RhodopeMountains as a grass mat. Its PDI value is 459. These grasses,together with leaves of the common plants, must certainly con-stitute a major part of the diet of the goats. This is consistentwith the goat dung PDI value of 534� 160. The free rangingcow dung has a PDI value of 220� 66. This is low comparedto most of the grasses and especially Bermuda grass. The dietof these cows presumably also includes a major unknowncomponent(s) with a low PDI value, leaves from dicots withlow PDI values and possibly the young growth of woodydicots.
Most of the cereals have PDI values in the range of 200e500. The exception is the stem of rye (Secale cereale), whichhas a value of 116. The diet of a free ranging cow could alsoinclude cereals. This is certainly reflected in the PDI value forcow dung, namely 220� 66, assuming that some major cerealcomponents of the diet could have been rye stems. The mule/donkey dung PDI value is even lower, namely 146� 44. Againthe only cereal that has a value in this range is rye stem (PDIvalue of 116). The PDI value of the dung is somewhat highersince the mules/donkeys also eat the inflorescence of rye. Thelatter has a PDI value of 225. Rye is in fact the major cerealproduced for fodder in the village.
Two samples of animal fodder (SAR 95 and 97) were col-lected from piles stored in a field and a cultivated area at thevillage. Fodder sample SAR 95 is a straw fodder consistingmost probably of oats (Avena sativa), one of the two cultivatedcereals nowadays in the village. The PDI value of this strawfodder is 237 (Fig. 2). Fodder sample SAR 97 contains a vari-ety of plant types, i.e. wild grasses, dicot leaves and herbs. Ithas a PDI value of 307 (Fig. 2). Both the fodder samples have

Table 3
List of all the samples shown in the plot of Fig. 3
Plants (part of the
plant analysed)
Latin name PDI #Phytoliths
per gram
dry plant
Hare tail (stem) Lagurus ovatus 55 7,000,000
Fig (leaves) Ficus carica 77 1,000,000
Tamarisk (leaves) Tamarix sp. 81 3500
Rye (stem) Secale cereale 116 500,000
Sage (whole plant) Salvia officinalis 179 17,500
Terebinth (leaves) Pistacia terebinthus 185 11,000
Hynaldia (husk) Haynaldia vilosa 189 2,500,000
Melick grass Melica sp. 200 3,000,000
Brome (whole plant) Bromus sp. 210 6,000,000
Willow (leaves) Salix sp. 211 1500
Juniper (leaves) Juniperus oxycedrus 218 100,000
Hynaldia (stem) Haynaldia vilosa 223 1,000,000
Rye (husk) Secale cereale 225 4,000,000
Wild pear (leaves) Pyrus amygdaliformis 229 3000
Wild cherry (leaves) Prunus avium 236 500
Goat grass (stem) Aegilops sp. 243 3,000,000
Black alder (leaves) Alnus glutinosa 264 3000
Hare tail (husk) Lagurus ovatus 275 7,500,000
Quaking grass (stem) Briza maxima 286 500,000
Thyme (whole plant) Thymus sp. 291 18,000
Cat’s tail (stem) Phleum phleoides 295 500,000
Goat grass (husk) Aegilops sp. 302 2,000,000
Reed (husk) Arundo sp. 308 5,000,000
Oats (husk) Avena sativa 314 2,000,000
Beard grass (stem) Polypogon monspeliensis 318 2,500,000
Nettle (whole plant) Urtica sp. 331 3,000,000
Barley (husk) Hordeum vulgare 343 1,000,000
Needlegrass (husk) Stipa bromoides 356 8,000,000
Cat’s tail (husk) Phleum phleoides 364 10,000,000
Rye grass (stem) Lolium sp. 370 1,000,000
Nettle tree (leaves) Celtis australis 378 5,000,000
Orchard grass
(whole plant)
Dactylis glomerata 384 4,500,000
Oats (stem) Avena sativa 398 500,000
Christ’s thorn (leaves) Paliurus spina christi 411 5000
Beard grass (husk) Polypogon monspeliensis 412 12,000,000
Kermes oak (leaves) Quercus coccifera 415 20,000
Barley (stem) Hordeum vulgare 423 1,500,000
Basswood (leaves) Phillyrea latifolia 445 9000
Rye grass (husk) Lolium sp. 453 3,000,000
Blackberry (leaves) Rubus sp. 459 1000
Bermuda grass
(whole plant)
Cynodon dactylon 459 2,000,000
Wheat (husk) Triticum aestivum 459 4,000,000
Hornbean (leaves) Carpinus sp. 465 500,000
Wild service
tree (leaves)
Sorbus torminalis 480 100,000
Manna ash (leaves) Fraxinus ornus 508 100,000
Wheat (stem) Triticum aestivum 534 3,000,000
Hawthorn (leaves) Crataegus sp. 536 6000
Needlegrass (stem) Stipa bromoides 571 3,000,000
Strawberry tree (leaves) Arbutus andrachne 579 28,000
Almond tree (leaves) Prunus amygdalus 580 58,000
Common elder (leaves) Sambucus nigra 600 2000
Fern (leaves) Pteridium aquilinum 612 500,000
Chaste tree (leaves) Vitex agnus castus 621 38,000
Vine (leaves) Vitis sylvestris 641 6500
Downy oak (leaves) Quercus pubescens 651 1,000,000
Beech (leaves) Fagus sylvatica 655 1,500,000
Reed (stem) Arundo sp. 666 1,500,000
Durmast oak (leaves) Quercus petraea 679 500,000
(continued)
Table 3 (continued )
Plants (part of the
plant analysed)
Latin name PDI #Phytoliths
per gram
dry plant
Hungarian oak (leaves) Quercus frainetto 708 200,000
Maple (leaves) Acer monspessulanum 709 2,000,000
Chicory (whole plant) Cichorium sp. 709 30,000
Aspen (leaves) Populus alba 729 1,500,000
Quaking grass (husk) Briza maxima 796 2,000,000
Walnut (leaves) Juglans regia 962 500,000
Lime (leaves) Tilia sp. 968 1,500,000
It also shows the number of phytoliths per gram dry plant as well as their PDI
values.
607G. Tsartsidou et al. / Journal of Archaeological Science 35 (2008) 600e613
PDI values well within the range of the PDI values for cowand goat dung samples. In conclusion, the PDI values and phy-tolith concentrations are consistent with the dung and foddervalues analysed from samples in the village.
3.1. PDI values in the sediment samples
Fig. 4 is a plot of phytolith concentrations versus PDIvalues of all the samples. Also shown are those that had toofew phytoliths with consistent morphologies for reliably calcu-lating a PDI value. These were arbitrarily given a PDI value of1. In order to facilitate the analysis, the data are divided intofour boxes. The samples from each box will be discussedseparately.
3.1.1. Box 1This box contains the four regional control samples. It also
contains samples that were probably collected from outsidethe village for construction purposes, such as wall fill betweenstones and the constructed base of several floors. Other sam-ples are from soil surfaces such as in the smith’s house andthe summer camp house. A surprising result is that the samplefrom the surface layers of the summer camp caprine enclosurefalls into this box. According to Ali Sinap, the dung from thatenclosure was regularly removed for fertilizing the fields, andprobably what was analysed was the underlying soil (see be-low). In addition some of the samples are from the base orclose to the base of sediment sections. The samples abovethem are usually richer in phytoliths. They are probably inthis box because they were ‘‘diluted’’ with substrate sediment.In general, most of the samples in this box could be derivedfrom sediments from the local area that have not been influ-enced much by the addition of plants due to human/animal ac-tivities. Surprisingly, three samples from one trench in thesummer camp’s threshing floor are also in this box. They aredevoid of plant remains and thus they are included in thesame box with regional samples.
3.1.2. Box 2These are samples that have very few consistent morphology
phytoliths and have low phytolith concentrations (less than10,000 phytoliths per gram). In fact most of them have less

Fig. 3. Plot of the number of phytoliths per gram of dry plant tissue versus the PDI values for wild grasses (black circles), cereals (white circles) and dicot leaves
(rhombs) of common plants collected in the vicinity of the village.
608 G. Tsartsidou et al. / Journal of Archaeological Science 35 (2008) 600e613
phytoliths than the regional controls in Box 1. Some of thesesamples are derived from sediment just above the bedrock(which in this area does not contain phytoliths). Some arefrom the room floors in the houses (see below). Two samplesare from the clay-rich coating on the roof beams of the houses.The clay used for roof beam coatings is purified under water.The source of the clay was also analysed (SAR 249) and isalso devoid of phytoliths. One sample is from an open areaabove the smith’s house, and several are from hearths or floorsediments close to hearths. The latter samples could be enrichedin wood ash. Wood ash is known to contain relatively few con-sistent morphology phytoliths, but many more variable-shapedphytoliths, which are of course included in the count of the phy-tolith concentration (Albert and Weiner, 2001; Tsartsidou et al.,2007). Variable-shaped phytoliths are also present in these sam-ples. Sample SAR 12, for example, comes from the hearth ofAH1. It has relatively high phytolith concentration (150,000)comprising mostly (80%) variable morphology phytoliths.
3.1.3. Box 3Most of the samples are in this box. The phytolith concen-
trations are above 100,000 per gram and the PDI values are inthe range of 26e175. It is significant that the sample PDIvalues in this box are centered around the rye stem PDI value
Fig. 4. Plot of phytolith per gram of sediment versus PDI values of all the samples
ogies for reliably calculating a PDI value. These were arbitrarily given a PDI valu
of 116� 35. The mule/donkey dung sample is also in this box(SAR 79). Note that this is the only dung sample that con-tained phytoliths from cereals. Almost all the samples fromthe barns are in Box 3. The barns in this village are allthatched with rye stems that often still contain their inflores-cence parts. Fallen thatch often covers the barn floors. Animalswere fed rye straw (stems). Several threshing floor samplesfrom both the summer camp and the village are in this box,as are the mill site samples (SAR 145e149) that have fairlyhigh concentrations of phytoliths. The latter has the highestcontent of husk phytoliths (22%) of all the village areas.
All the samples in this box are associated in one way oranother with cereals, and judging from the PDI values the pre-dominant cereal should be rye. Rye is indeed the most com-mon cereal in the barns. Note that the thatched roofs of allwooden structures, apart from barns, are made only of ryestraw. The bread is made of rye. Rye was often used as a com-mercial staple, e.g. for paying the smith or for renting fieldsfor cultivation (Efstratiou, 2002). It is hence the most commoncereal in the village.
There are samples that fall within this box that are consis-tent with the use of rye, although we have no direct evidencefor this. Two yard samples from the AH2 house are in this box.Since rye was used for many of the village activities (thatching
. Also shown are samples that had too few phytoliths with consistent morphol-
e of 1 if less than 100 were found on the slide (Box 2).

609G. Tsartsidou et al. / Journal of Archaeological Science 35 (2008) 600e613
or food making) rye remains are expected to be found in theyards, where some processing or storage most probably tookplace. Provisional wooden structures are often built in theyards to house the rye straw for repairing the roofs (Efstratiou,2002). Most of the samples from the smith’s house are in Box3 (see below). Several caprine enclosure samples and samplesfrom the open area between the enclosures in the summercamp are in this box. Clearly this does not reflect a normalcaprine diet (see above). The summer camp tenants cultivatedrye for roof thatching and animal fodder according to Ali Si-nap. It is possible that much rye was included in the caprinediet at the summer camp.
3.1.4. Box 4This box contains the samples that generally have high phy-
tolith concentrations and high PDI values. All these samplesare in one way or another associated with dung: either cow/cattle dung with lower PDI values or goat dung with higherPDI values. The AH1 house storeroom floor sample and twofodder samples are in this box. Sample 19 with a PDI valueof 363 is derived from a barn (AB3). This is a clear-cut con-tradiction, as the PDI values of other barn samples are low.The phytolith morphotypes identified in this sample aremainly grass stem phytoliths (55%) and dicot leaves (20%).In barn AB3 goat dung is present on the floor, as this structurewas secondarily being used to house goats. This would there-fore account for the anomalous PDI value.
Sample SAR 86 with a PDI value of 401 is from the floor ofa stable in house AH1, in which mules/donkeys were housed.This PDI value is in contradiction to the value obtained formule dung. We would infer that a past use of this ground floorspace was for goats/sheep or cows, when the house was occu-pied. On the other hand sample SAR 82, from the yard ofthe same house, has a PDI value (111) similar to that ofmule/donkey dung.
3.2. Analyses of specific locations
3.2.1. Smith’s houseThis was a two-story house with stonewalls. Part of the
house had collapsed totally. We sampled a section of sedimentsfrom the collapsed area down to a depth of 45 cm. Fig. 5 is a plot
Fig. 5. Plot of the number of phytoliths per gram sediment versus t
of the number of phytoliths as a function of section depth. Eventhough no differences in the sediments can be discerned by eye,the phytolith concentrations increase from less than 10,000 pergram sediment 13 cm below the top to around one million pergram sediment in the bottom two samples. The PDI values ofthe lower two samples are 107 and 83, implying that the phyto-lith morphotypes are dominated by rye stems. This is mostlikely therefore the remains of the ground floor stable fora mule or a donkey. Note that each family in Sarakini used topay 14 kg of rye per year to the smith for his services to thecommunity (Efstratiou, 2002). He used them for food and fod-der or he sold them in the town market. The very low phytolithconcentrations in the upper part of the section are also consis-tent with these sediments being the remains of the second floorliving room or storeroom. One sample (SAR 102) has a highcontent of husk phytoliths and a PDI value of 84: consistentwith having been derived from a storeroom floor. On the otherhand the deeper samples, i.e. SAR 104 and 105 contain dicotleaves and sedges, consistent with stable floors.
3.2.2. Summer campDuring the summer months, cows, goats and sheep from the
village were maintained at a site some 5 km from the village,but at a much higher elevation (700 m). The camp includesa cattle enclosure and a caprine enclosure, a house wherethe owner lived, open fields for cultivation and a threshingfloor. The latter was partially cut into the slope of the hilland was built up on the other side to make it level. The surfacewas seasonally re-prepared with a layer of hard cow dung. Inthe 20 or so years that have elapsed since the summer campwas in operation, free roaming cattle and caprines have beenin this area.
Fig. 6 shows a plot of the phytolith concentrations versusPDI values. The boxes have roughly the same limits as thoseshown in Fig. 2. Box 3 has been separated here into two boxes,3a and 3b. The cattle/horse enclosure surface samples (SAR212 and 42) fall in Box 3a, consistent with a diet of mainlyrye stems. The samples from inside the caprine enclosure,however, are within Box 1, namely comparable to the regionalcontrols. The samples just outside the caprine enclosure con-tain much higher phytolith concentrations (Box 3a), but thesehave PDI values characteristic of rye stems. There is no
he depth of samples within a section dug at the smith’s house.

Fig. 6. Plot of the phytolith per gram sediments versus the PDI values for the summer camp samples. The arrows connect samples in the same section.
610 G. Tsartsidou et al. / Journal of Archaeological Science 35 (2008) 600e613
indication from the PDI values of dung remnants from cap-rines. In fact the results imply that the caprine enclosure wascleaned out well, and that the area around the enclosure wascontaminated by dung from animals that ate mostly rye.This was confirmed by Ali Sinap. A sample from the floorof the hut (SAR 40) falls in Box 3a. This indicates the process-ing or storage of rye in the hut. This sample is overlain bya layer rich in charcoal with very few phytoliths (SAR 39)that apparently accumulated in the last 20 or so years sinceabandonment.
Box 3b contains two samples from areas outside the enclo-sures. These have PDI values similar to that of free rangingcows (SAR 81). This might reflect the presence of cows inthe site possibly during the 20 years following the abandon-ment of the summer camp. Surprisingly, the samples just2 cm below the surface of these samples in both cases havemuch lower PDI values (Box 1), but rather similar phytolithconcentrations. The animals that produced that dung musthave been fed a greater proportion of rye stems. It is thereforepossible that this reflects the diet of the animals maintained atthe site when the camp was in operation. The analysis of themorphotypes in these samples shows that the two surface sam-ples contain the highest number of Chloridoid grasses (33%)in all the summer camp samples. This is consistent with thepresent day vegetation in the area (Bermuda grass), whichalso constitutes a major component of the fodder of the freeranging cows. In addition the analysis of cow dung showsa similarly high content of Chloridoid grasses (33%).
The threshing floor samples are also enigmatic. In one sec-tion, the surface sample contains a high concentration of phy-toliths with a PDI value of 92, and this increases in the section(PDI 123). This is not indicative of the inflorescence PDIvalues of cereals (around 400) apart from rye (PDI 225). Thesethreshing floors were hardened with cow dung prior to use (Ef-stratiou, 2002). It is therefore conceivable that this sample re-flects the dung from cows fed mostly rye. The increase ofChloridoid grasses from 2% to 15% in the lower samples isconsistent with cow dung. It is also in accordance with the in-crease in PDI values of these samples. The other threshing
floor samples had phytolith concentrations similar to thosein the controls outside the threshing floor. This can be ex-plained by the fact that most of the threshing floors were dis-mantled and re-made every year. Given the shortage ofcultivated land the threshing floor area itself was used as a cul-tivation plot. After the harvest, the ‘spot’ itself was turnedagain into a threshing floor.
3.2.3. House living and storage room floorsThe second floors of both the living and storage rooms in all
houses are constructed using the same technique: thick oakbeams overlain by a layer of fern leaves at the base. This wasthen covered by a mud mixture with straw. These layers supportthe laminated clay floor layers. These are resurfaced severaltimes a year. The top of the clay floor is often covered witha thin layer of lime painted in blue. The very low phytolith con-centrations in the floors may be the result of extensive but care-ful cleaning and sweeping of the floors before resurfacing. Notethat the storeroom clay floors are resurfaced less often and withless care than the mainroom floors. They may therefore betterpreserve traces of the use of these rooms in the past. They dohave higher phytolith contents. The floor samples of the store-room in AH1 (SAR 83 and 84) have hundreds of thousands ofphytoliths per gram sediment that increase with depth. Bothsamples have high numbers of husk phytoliths, which also in-crease with depth (from 13% to 16%). In addition the PDIvalues are very low (230 for the upper layer and around 50for the lower one). These are consistent with the storage of ce-reals and most probably rye (rye inflorescence PDI value is225). Note that the roof of the barn constructed in the backyard of this house is thatched with rye.
After the abandonment of the houses, the floors were cov-ered by loose sediment derived in part from the disintegrationof the walls and roofs, as well as dirt brought in by intrudinganimals and humans, and by the wind. Many of these roomswere used as warehouses by neighbors. In a few cases theywere used as chicken coops or as stables. The PDI values ofthe loose sediments range from 78 to 177 reflecting the varietyof plant materials that accumulated on the floors.

611G. Tsartsidou et al. / Journal of Archaeological Science 35 (2008) 600e613
4. Discussion
This study shows that the PDI values in conjunction withphytolith concentrations can be used as an initial indicationof certain village subsistence practices. These parameters re-flect well the agro-pastoral nature of this village community,and that rye is the major cereal crop used for bread, for thatch-ing of roofs, and as a component of animal fodder. Further-more, the information obtained is relevant not only to thearchaeobotanical record, but also to the archaeozoological re-cord as much of the information obtained is, albeit indirectly,about domesticated animals. As phytoliths are usually pre-served in large quantities in archaeological environments,this analytical tool can be used to better understand spatial pat-terning in archaeological sites of an agro-pastoral character. Itmay also be useful for differentiating between pastoral sitesand hunter gatherer sites: a major problem especially in EastAfrica (Shahack-Gross et al., 2003, 2004) We note, however,that when applying this tool to other geographic regions, localregional control samples need to be collected and analysed, sothat the local regional vegetation profile of phytoliths can becontrasted with the site phytolith assemblages.
We perceive the use of the PDI together with phytolith con-centrations as only an initial step in the analysis of the archae-obotanical record of an archaeological site. We emphasize thatsamples with completely different phytolith assemblages canin principle produce similar PDI values. Thus it is essentialto carefully examine the spectrum of morphotypes present ineach sample, to make sure that the conclusions drawn fromthe PDI are reasonable. Furthermore, information fromcharred botanical remains and pollen profiles should also bestudied together with the phytoliths to produce a more com-plete picture of the archaeobotanical record.
This ethnoarchaeological study highlights some of the po-tential applications of the PDI/phytolith concentration param-eters to archaeological sites. These will be briefly discussed.
4.1. Identifying domestic animals based on dungphytolith assemblages
The PDI clearly differentiates between the dung of goats,cows and mule/donkey in Sarakini. This most useful attributewould be applicable to an archaeological site if similar cir-cumstances prevailed. This, however, may not occur if the fol-lowing parameters were different.
The very high PDI values of goat dung in Sarakini reflect thehigh PDI values of the leaves of the common trees in the areaand the common local wild grasses. Not all leaves have highPDI values, and if these leaves were the main leaf componentof the goat diet, this could eliminate the ‘‘goat PDI signal’’.The PDI value would then be intermediate and not differentfrom free ranging cows. Morphotype analysis could, however,be used to differentiate between phytolith assemblages ofgrasses and leaves, as opposed to only grasses. The former is in-dicative of goats, and the latter is indicative of cows.
The clear-cut differentiation of the donkey/mule dung fromthe other domestic animals is due to the unusually low PDI value
of rye. In general this fact greatly facilitated the identification ofa variety of activity areas in the village as being specifically re-lated to rye storage or processing. This would not have been pos-sible if another cereal was the major staple in the village. Rye,however, was used over large areas in Europe because of its har-diness to cold, resistance to drought and its ability to grow onacid sandy soils (Zohary and Hopf, 2000). It was also an impor-tant crop of Thrace and Macedonia in Greece in the second cen-tury A.D. (Sallares, 1991). This attribute of the PDI shouldtherefore also be applicable in these areas.
As many of the wild grasses and the domestic cereals pro-duce similar PDI values in Sarakini, it will be necessary to per-form a detailed morphotype analysis to differentiate betweenthe two (Rosen, 1992; Tsartsidou et al., 2007). Identifyingthe specific cereal type probably requires the use of morpho-metric tools developed by Ball et al. (1996).
4.2. Identifying animal enclosures
Animal enclosures can be identified by high phytolith con-centrations, a characteristic laminated fabric in the sedimentsdue to trampling and by the presence of dung spherulites(Canti, 1997, 1998, 1999; Shahack-Gross et al., 2003). Thefact that the PDI values in Sarakini clearly differentiate don-key/mule from cows and from goats, makes it possible touse this tool to identify not only the enclosure, but also the do-mestic animals housed in the enclosure in archaeological sites.As noted above, this depends upon specific circumstances thatmay not exist at other sites.
We noted that certain animal enclosures had no phytolithswhatsoever. This is due to the fact that the dung was removedfrom the enclosure for fertilizer. In the summer camp, we alsoobserved that the areas around the enclosure contained abun-dant phytoliths. Thus in an archaeological site it might be pos-sible to map the enclosure boundaries by the absence ofphytoliths in the sediments if dung was removed. This couldindicate that the occupants of the site were agro-pastoralists,as they would have used the dung as fertilizer, or that themain fuel in the area was dung rather than wood. Both optionscould be further examined using detailed morphotype analysis.
4.3. Identifying rye storage and processing facilities
All the barns contained PDI values indicative of rye, exceptfor one, which was being secondarily used to house goats. Wenote, however, that the roofs were also thatched with rye, andin fact with rye stalks that still had the inflorescences attached.Thus the presence of PDI values indicative of rye could be dueeither to the thatch or to the storage of rye or both. The barnswere constructed entirely of wood and thatch. In such situa-tions, it would be very difficult to identify barns in the archae-ological record and to differentiate them from open-air ryestorage or dung accumulations of animals that only ate ryestalks. The presence of dung spherulites and a microlaminatedtexture would help to differentiate between some of theseoptions (Albert et al., 2008).
612 G. Tsartsidou et al. / Journal of Archaeological Science 35 (2008) 600e613
The floor samples from the water mill all contained clear-cut rye PDI values. In an archaeological context, this informa-tion together with macroscopic remains indicative of a millcould be used to identify the cereal being processed.
The threshing floors analysed either contained very low con-centrations of phytoliths or when substantial amounts werefound, they had intermediate PDI values. This probably reflectsthe fact that prior to threshing the surface was smoothed by alayer of dung. If this is indicative of past conditions, then itwould indicate that phytoliths, at least, are not likely to behelpful for identifying threshing floors in archaeological sites.
4.4. Identifying living rooms
The laminated clay floors, the wall plaster and the roof fillcoating contained very few phytoliths. This reflects the factthat the clay used for these purposes was brought from a specialarea and processed. Thus in an archaeological site, the absenceof phytoliths could well be indicative of the use of specializedconstruction materials. We did note that the adjacent storageroom floors contained more phytoliths than in the living roomfloors. This could be due to trampling in of degraded plant re-mains, or that less care was taken to acquire the raw materialsfor these floors. Again morphometric analysis could differenti-ate between these two possibilities.
The analysis of dirt that had accumulated on top of thefloors in abandoned living rooms showed that many phytolithsare present. Their assemblages mostly reflect secondary use ofthe space. We did observe that the sediment samples fromhearths contained a high proportion of irregular phytoliths,consistent with them having been derived from wood ash (Al-bert and Weiner, 2001; Schiegl et al., 2004). We noted that inalmost all houses we examined, the living room was beingused for storage, or in one case as a chicken coop and in an-other case as a stable. It will be very difficult to distinguishsecondary use from primary use of space in such rooms basedon the dirt that accumulated on the floor after abandonment.
4.5. Identifying the two-story house construction
The upper part of the section analysed of the collapsedsmith’s house contained very low phytolith concentrations,as opposed to the lower part of the section. The latter sampleshad PDI values characteristic of rye. These observations areconsistent with the collapse of the two-story house. Suchhouse construction has been detected ethnographically in otherareas of Greece as well as Anatolia (Hall et al., 1973), Iran(Kramer, 1979) and Syria (Sweet, 1960) and it is commonin many archaeological sites (Bronze Age and historical times)in Greece (Vermeule, 1972).
5. Conclusions
Here we show that the Phytolith Difference Index togetherwith phytolith concentrations differentiates the different usesof space in the village of Sarakini. This novel method shouldbe useful for an initial analysis of phytolith assemblages in an
archaeological site. It could provide valuable information onthe possible uses of space. By following this up with detailedanalyses of the phytolith morphotypes, a more complete un-derstanding of the archaeobotanical record and how it relatesto the use of space could be obtained. The types of activityareas that were identified in Sarakini based on the PDI valuesin conjunction with phytolith concentrations are room floors ofdifferent types (living rooms versus storage rooms), livingareas that have been repetitively swept, hearths, or areaswith dispersed ashes, areas related to cereal storage and espe-cially rye and areas associated with pastoral activities. Con-cerning the latter, information on agricultural practices suchas rye storage and cereal processing, as well as pastoral prac-tices related to the stabling and feeding of domestic animals,can be obtained.
Acknowledgements
We especially thank Ali Sinap for his invaluable help forguiding us to all abandoned structures of the village and forproviding us with information on the use of each area sampled.We also thank Ofer Bar-Yosef for his help with sampling andElias Markolefas and Elisabetta Boaretto for their help onmathematical issues. We thank Mr. George Schwartzmann,Sarasota, Florida, for his generous financial support. We alsothank the Kimmel Center for Archaeological Science for theirfinancial support. S.W. is the incumbent of the Dr. TrudeBurchardt professorial chair of Structural Biology. G.T. con-ducted this study during her fellowship in environmental stud-ies by the Wiener Laboratory at the American School ofClassical Studies at Athens.
References
Albert, R.M., 2000. Study of Ash Layers through Phytolith Analyses from the
Middle Palaeolithic levels of Kebara and Tabun Caves. Ph.D. thesis, Uni-
versity of Barcelona, Barcelona.
Albert, R.M., Tsatskin, A., Ronen, A., Lavi, O., Estroff, L., Lev-Yadun, S.,
Weiner, S., 1999. Mode of occupation of Tabun Cave, Mt. Carmel Israel,
during the Mousterian period: a study of the sediments and the phytoliths.
Journal of Archaeological Science 26, 1249e1260.
Albert, R.M., Weiner, S., 2001. Study of phytoliths in prehistoric ash layers
using a quantitative approach. In: Meunier, J.D., Coline, F. (Eds.), Phyto-
liths: Applications in Earth Sciences and Human History. A.A. Balkema
Publishers, Netherlands, pp. 251e266.
Albert, R.M., Shahack-Gross, R., Cabanes, D., Gilboa, A., Lev-Yadun, S.,
Portillo, M., Sharon, I., Boaretto, E., Weiner, S., 2008. Phytolith rich layers
from the Late Bronze and Iron Ages at Tel-Dor (Israel): mode of formation
and archaeological significance. Journal of Archaeological Science 35, 57e75.
Allison, P.M., 1999. The Archaeology of Household Activities. Routledge,
New York.
Ball, T., Gardner, J.S., Brotherson, J.D., 1996. Identifying phytoliths produced
by the inflorescence bracts of three species of wheat (Triticum monococ-cum L., T. dicoccum Schrank., and T. aestivum L.) using computer-assisted
image and statistical analyses. Journal of Archaeological Science 23,
619e632.
Brochier, J.E., Villa, P., Giacomarra, M., Tagliacozzo, A., 1992. Sheperds and
sediments: geo-ethnoarchaeology of pastoral sites. Journal of Anthropo-
logical Archaeology 11, 47e102.
Brown, D.A., 1984. Prospects and limits of a phytolith key for grasses in the
Central United States. Journal of Archaeological Science 11, 345e368.

613G. Tsartsidou et al. / Journal of Archaeological Science 35 (2008) 600e613
Canti, M., 1997. An investigation of microscopic calcareous spherulites from
herbivore dungs. Journal of Archaeological Science 24, 219e231.
Canti, M., 1998. The micromorphological identification of faecal spherulites
from archaeological and modern materials. Journal of Archaeological Sci-
ence 25, 434e444.
Canti, M., 1999. The production and preservation of faecal spherulites: ani-
mals, environment, and taphonomy. Journal of Archaeological Science
26, 251e258.
Carr, C., 1984. In: Schiffer, M.B. (Ed.), The Nature of Organization of Intrasite
Archaeological Records and Spatial Analytic Approaches to Their Investi-
gation. Advances in Archaeological Method and Theory, vol. 7. Academic
Press, Inc., pp. 103e127.
Courty, M.A., Goldberg, P., Macfail, R.I., 1994. Ancient People-lifestyles and
Cultural Patterns, Acapulco, Mexico.
Efstratiou, N., 1982. Ethnoarchaeological research in Thrace e introduction.
Thracian Journal 3, 115e124.
Efstratiou, N., 1984. Ethnoarchaeological research in Thrace. Archaeology 13,
20e26.
Efstratiou, N., 1985. Production and subsistence in a traditional community of
Thrace. Thracian Journal 6, 203e212.
Efstratiou, N., 1990. Prehistoric habitation and structures in Northern Greece:
an ethnoarchaeological case-study. Bulletin de Correspondance Hellenique
(Supp. XIX), 33e41.
Efstratiou, N., 1999. Pastoralism in highland Rhodope: archaeological implica-
tions from recent observations. Recent perspectives from archaeology, history
and ethnology. In: Bartosiewicz, L., Greenfield, H.J. (Eds.), Transhumant
Pastoralism in Southern Europe. Archaeolingua, Budapest, pp. 145e158.
Efstratiou, N., 2002. Ethnoarchaeological Explorations in the Pomak Villages
of Rhodope. Vanias, Thessaloniki (in Greek).
Efstratiou, N., Fumanal, M.P., Ferrer, C., Urem Kotsos, D., Curci, A.,
Tagliacozzo, A., Stratouli, G., Valamoti, S.M., Ntinou, M., Badal, E.,
Madella, M., Skourtopoulou, K., 1998. Excavations at Neolithic settlement
of Makri, Thrace, Greece (1988e1996) e a preliminary report. Saguntum
31, 11e62.
Hall, G., McBride, S., Riddell, A., 1973. Architectural study. Anatolian Stud-
ies 23, 245e269.
Hodder, I., Cessford, C., 2004. Daily practices and social memory at Cata-
lhoyuk. American Antiquity 69, 17e40.
Kent, S., 1987. Method and Theory for Activity Area Research. An Ethnoarch-
aeological Approach. Columbia University Press, New York.
Kent, S. (Ed.), 1990. Domestic Architecture and the Use of Space. Cambridge
University Press, Cambridge.
Kramer, C., 1979. Ethnoarchaeology. Impications of Ethnography for Archae-
ology. Columbia University Press, New York.
Madella, M., 2001. Understanding archaeological structures by means of phy-
tolith analysis: a test from the Iron Age site Kilise Tepe-Turkey. In: Meu-
nier, J.D., Coline, F. (Eds.), Phytoliths: Applications in Earth Sciences and
Human History. A.A. Balkema Publishers, Netherlands, pp. 173e182.
Madella, M., Alexandre, A., Ball, T., 2005. International code for phytolith
nomenclature. Annals of Botany 96, 253e260.
Metcalfe, C.R., 1960. Anatomy of the Monocotyledons I. Oxford University
Press, London.
Moore, T.M.A., Hillman, G.C., Legge, J.A., 2000. Village on the Euphrates.
Oxford University Press, Oxford.
Ntinou, M., 2002. La Paleovegetacion en el Norte de Grecia desde el Tardigla-
ciar hasta el Antlantico. Formaciones Vegetales, Recursos y Usos. BAR
International Series 1038.
Piperno, D.R., 1988. Phytolith Analysis: An Archaeological and Geological
Perspective. Academic Press, New York.
Piperno, D., 2006. Phytoliths: A Comprehensive Guide for Archaeologists and
Paleoecologists. Altamira Press, Lanham MD.
Rosen, A.M., 1992. Preliminary identification of silica skeletons from near eastern
archaeological sites: an anatomical approach. In: Rapp, G., Mulholand, S.C.
(Eds.), Phytolith Systematics. Plenum Press, New York, pp. 129e148.
Rosen, A.M., 2001. Phytolith evidence for agro-pastoral economies in the
Scythian period of southern Kazakhstan. In: Meunier, J.D., Coline, F.
(Eds.), Phytoliths: Applications in Earth Sciences and Human History.
A.A. Balkema Publishers, Netherlands, pp. 183e198.
Rosen, A.M., 2005. Phytolith indicators of plant and land use at Catalhoyuk.
In: Hodder, I. (Ed.), Inhabiting Catalhoyuk: Reports from the 1995e1999
Seasons Part A. McDonald Institute Monographs, vol. 4, pp. 203e212.
Catalhoyuk Project. Cambridge.
Sallares, R., 1991. The Ecology of the Ancient Greek World. Duckworth,
London.
Schiegl, S., Stockhammer, P., Scott, C., Wadley, L., 2004. A mineralogical and
phytolith study of the Middle Stone Age hearths in Sibudu cave, Kwazulu-
Natal South Africa. South African Journal of Science 100, 185e194.
Shahack-Gross, R., Marshall, F., Weiner, S., 2003. Geo-ethnoarchaeology
of pastoral sites: the identification of livestock enclosures in abandoned
Maasai settlements. Journal of Archaeological Science 30, 439e459.
Shahack-Gross, R., Marshall, F., Ryan, K., Weiner, S., 2004. Reconstruction of
spatial organisation in abandoned Maasai settlements: implications for site
structure in the pastoral Neolithic of East Africa. Journal of Archaeological
Science 31, 1395e1411.
Shahack-Gross, R., Albert, R.M., Gilboa, A., Nagar-Hilman, O., Sharon, I.,
Weiner, S., 2005. Geoarchaeology in an urban context: the uses of space
in a Phoenician monumental building at Tel Dor (Israel). Journal of Ar-
chaeological Science 32, 1417e1431.
Sullivan, K.A., Kealhofer, L., 2004. Identifying activity areas in archaeological
soils from a colonial house lot using phytolith analysis and soil chemistry.
Journal of Archaeological Science 31, 1659e1673.
Sweet, S., 1960. Tell Toqaan: A Syrian village, Museum of Anthropology.
Anthropological Papers. University of Michigan.
Tsartsidou, G., Lev-Yadun, S., Albert, R.M., Rosen, M.A., Efstratiou, N.,
Weiner, S., 2007. The phytolith archaeological record: strengths and weak-
nesses evaluated based on a quantitative modern reference collection from
Greece. Journal of Archaeological Science 34 (8), 1262e1275.
Tsibiridou, F., 1994. Xoros: domikes anaparastasis. Ethnologia 3, 5e31
(in Greek).
Tsibiridou, F., 1999. Mas lene Pomakous. Mnemon 21, 163e182 (in Greek).
Tsibiridou, F., 2000. Les Pomak dans la Thrace greque. Discours ethnique et
practiques Socioculturelles. L’Harmattan, Paris.
Twiss, P.C., Erwin, S., Smith, R.M., 1969. Morphological classification of grass
phytoliths. Soil Science Society of America Proceedings 33, 109e115.
Vermeule, E., 1972. Greece in the Bronze Age. University of Chicago Press,
Chicago.
Zohary, D., Hopf, M., 2000. Domestication of Plants in the Old World. Oxford
University Press, Oxford.
Related Documents