Research report June 2021 Ethnicity coding in English health service datasets Supported by Sarah Scobie, Jonathan Spencer, Veena Raleigh

Welcome message from author
This document is posted to help you gain knowledge. Please leave a comment to let me know what you think about it! Share it to your friends and learn new things together.
Transcript
Research report June 2021
Ethnicity coding in English health service datasets
Supported by
Sarah Scobie, Jonathan Spencer, Veena Raleigh

iiEthnicity coding in English health service datasets
Acknowledgements
The NHS Race and Health Observatory supported this project and we would
particularly like to thank Dr Habib Naqvi and Owen Chinembiri for their
advice and insights throughout the project. We would also like to thank
participants at our workshop on ethnicity coding, particularly colleagues from
the Office for National Statistics and Public Health England for sharing their
expertise. Special thanks also go to our reviewers for their thoughtful feedback
and advice on earlier versions of this report: Professor Peter Goldblatt, UCL
Institute of Health Equity; Steve Wyatt, The Strategy Unit; and Theo Georghiou
and John Appleby, Nuffield Trust.
This work uses data provided by patients and collected by the NHS as part of
their care and support. Read more on our website www.nuffieldtrust.org.uk/ about/corporate-policies#informationsecurity-and-data.
This report uses Hospital Episode Statistics (HES) data (year range 2010/11
to 2019/20). Copyright © 2020, re-used with permission. A data-sharing
agreement with NHS Digital (DARS-NIC-226261-M2T0Q) governed access to
and use of HES data for this project.

1Ethnicity coding in English health service datasets
Contents
Key points 2
Summary 4
Context 11
Data and methods 18
Findings 24
Discussion and conclusion 44
Recommendations 47
Appendix 1: Emergency Care and Community Services data 49
Appendix 2: Population estimates for ethnic groups 50
Appendix 3: Options to enhance ethnicity coding using linked data 52
1
2
3
4
5
6

2Ethnicity coding in English health service datasets
1 2 3 4 5 6
Key points
• The Covid-19 pandemic has highlighted the extent and impact of ethnic
disparities in health to communities, health services and government.
However, poor data about ethnicity has obscured the true extent of ethnic
disparities in the impact of the pandemic.
• Many health related datasets do not routinely include ethnicity. Ethnicity
recorded within hospital records is used instead, but mis-coding in
hospital data mean that estimates of Covid-19 infections, hospitalisations
and deaths could be over or under counted in minority ethnic and
White groups.
• Our analysis of the quality of ethnicity coding in hospital datasets found
data quality problems including:
– incomplete coding and inconsistent use of codes
– an excessive and growing proportion of patients have ethnicity
recorded as “not known”, “not stated” or “other” which impedes reliable
analyses of ethnic differences, and
– systematic biases in data quality - for example, data quality is worse
in London, in adults of working age, and for patients with short
hospital stays.
• Importantly, data quality problems affect records for minority ethnic
patients disproportionately.
• The lack of comprehensive, high quality data on health and mortality by
ethnicity is a significant obstacle to understanding ethnic inequalities
in health, and therefore how the diverse health needs of different ethnic
groups can be addressed.
3Ethnicity coding in English health service datasets
1 2 3 4 5 6
• Action is needed to improve data quality at source by developing and
implementing up to date guidance on ethnicity coding for health service
providers and GPs.
• In the meantime, users of data need to be aware of problems with ethnicity
coding, and analysis and reporting of ethnicity data quality issues
is essential.
4Ethnicity coding in English health service datasets
1 2 3 4 5 6
Summary
Introduction
The Covid-19 pandemic has highlighted the extent and impact of ethnic
disparities in health to communities, health services and government.
The pandemic has also demonstrated that the limited availability of ethnicity
data and the quality of the data are reducing understanding of, ethnic
inequalities, and the ability to identify effective responses. Current challenges
range from the absence of ethnicity data in essential data sources such as
death registrations (from which mortality statistics are derived), to poor
coverage in primary care data, outdated ethnicity codes used within the NHS
compared with those used in the 2011 and 2021 censuses, and systematic
differences in ethnicity coding between White and minority ethnic groups.
Effectively using currently available ethnicity data and improving the quality
of the data are vital for identifying and addressing ethnic disparities in health.
For this report we have analysed the quality and consistency of ethnicity
coding within widely used health datasets, in order to inform users of
ethnicity data and identify the actions needed to improve the quality of the
underlying data.
Along with providing insights for data users, the report sets out
recommendations for policy-makers and organisations that generate and
regulate health data.
Approach
We conducted a descriptive analysis of ethnicity category coding in English
NHS hospital datasets and the Community Services Data Set (CSDS). We
assessed the completeness, validity and consistency of ethnic category coding,
and explored variations in coding between different groups of patients and
1

5Ethnicity coding in English health service datasets
1 2 3 4 5 6
services. We also compared the distribution of people from ethnic groups in
health care datasets by age group with population estimates from the Office
for National Statistics (ONS).
We analysed data from 2010/11 to 2019/20 on inpatients, outpatients, accident
and emergency (A&E) attendances – including using the new Emergency Care
Data Set (ECDS) – and community services referrals. These five datasets use
the ethnicity codes used in the 2001 census.
Our analysis complements work by Public Health England and the ONS
on how to address data quality problems with ethnicity data in producing
health statistics1.
Key findings
We found that, overall, the proportion of health records containing the
patient’s ethnicity code was high, with 87% of the over 17 million inpatient
spells having a valid ethnic group recorded in 2019/20, a slightly higher
proportion than for outpatient attendances (83% of over 96 million) and A&E
attendances (86% of over 19 million). In addition, 8.5% of inpatient records
had a code of ‘not stated’, which, although a permitted code, is not useful for
analysis purposes. However, 8.8% of inpatient spells had an ‘other’ ethnic
group coded. These proportions have increased since 2010/11, from 6.1% (not
stated) and 7.2% (‘other’ ethnic groups).
Importantly, records without ethnicity codes were not distributed evenly
between ethnic groups. For most ages, specific minority ethnic groups were
under-represented in health data when compared with national population
estimates by ethnic group, while ‘other’ ethnicity codes were over-represented.
Further, analysis of the consistency of coding for the same individual
indicated that records of patients from minority ethnic groups were less
likely to be recorded consistently over time or have a specific code. ‘Other’,’
1 Nuffield Trust (2021) ‘Nuffield Trust and NHS Race and Health Observatory workshop
on ethnicity coding’. www.nuffieldtrust.org.uk/files/2021-04/workshop-on-ethnicity-coding-20210330-notes.pdf.

6Ethnicity coding in English health service datasets
1 2 3 4 5 6
not stated’, ‘not known’ and invalid codes were not uniformly distributed
between ethnic groups. Excluding these missing ethnicity data from analysis
is likely to introduce bias in the results, and impacts most on minority ethnic
patients’ records.
There were differences in coding according to patient and service
characteristics, which indicate that there are systemic factors that impact on
data quality. For example:
• the proportion of inpatient spells with ethnicity not stated was highest
for men aged 16–64 (at over 10%) and lowest for the over-80s (6.5%) and
babies and children under five (at 5.8%)
• coding of ethnicity was more complete for patients who died in hospital
compared with those discharged (3.2% of records for the former were
recorded as ethnicity not known versus 4.0% for the latter, and 6.5% of
records for the former were recorded as ethnicity not stated versus 8.6% for
the latter)
• coding of ethnicity in London showed more patients with ethnicity not
stated (14%), or recorded in one of the ‘other’ categories (24%), compared
with 8.5% not stated and 8.8% ‘other’ across England
• data quality for independent health care providers was worse than
for NHS providers, with only 62% of records having a known, stated
ethnicity category.
Almost a half of inpatients had more than one inpatient record over a
three-year period (2017/18 to 2019/20), and overall, almost three-quarters
of patients had more than one contact (as an inpatient, outpatient or A&E
attendee) over the three years. A third of patients with multiple contacts had
inconsistent ethnicity codes.

7Ethnicity coding in English health service datasets
1 2 3 4 5 6
Inconsistent codes disproportionately impacted on minority ethnic groups:
• Patients who were White Irish, ‘other White’, ‘other Mixed’ or from ‘any
other ethnic group’ were inconsistently coded as White British.
• ‘Other’ impacted on the coding of Asian and Black ethnic groups – for
example in the A&E dataset, 7.5% of Indian patients also had a code of
‘other Asian’, and 9.1% of Black Caribbean patients and 7.6% of Black
African patients also had a code of ‘other Black’.
• Up to 40% of ‘any other ethnic group’ patients also had an alternative
ethnic group code, with minority ethnic groups comprising two-thirds of
patients impacted.
Conclusions
The Covid-19 pandemic has highlighted significant health inequalities
between minority ethnic and White groups, and between different minority
ethnic groups. The diversity of health patterns between different ethnic
groups, and the need for a differentiated response, are now widely recognised.
However, the lack of comprehensive, high-quality data on health and mortality
by ethnicity is a significant obstacle to understanding ethnic inequalities in
health, and therefore how the diverse health needs of different ethnic groups
can be addressed.
Accurate ethnicity coding to the most granular code possible is crucial,
because of significant differences between ethnic groups in terms of health
outcomes, experiences of health services, health risk factors and wider
determinants of health such as deprivation. The proportion of records
coded as ‘other Asian’, ‘other Black’ and ‘other White’ is higher in health
records than in other sources, indicating miscoding. This is unsatisfactory
given differences in health risks within broad groups, for example between
Pakistani, Bangladeshi and Indian groups, and between Black Caribbean and
Black African groups.
8Ethnicity coding in English health service datasets
1 2 3 4 5 6
Our findings have two important implications:
• Making the best use of available data. Analysis using ethnicity data as
released will overcount some categories of patients (particularly ‘other’
ethnic categories) and therefore undercount activity for specific minority
ethnic groups. Understanding and reporting on the quality of ethnicity data
is essential.
• Looking ahead, improving the underlying quality of data. Urgent action
is required to address poor-quality ethnicity coding data at source – when
NHS organisations and general practitioners (GPs) collect and record data
from patients.
These improvements are essential for enabling ethnic disparities in health to
be understood and addressed in the future.
From our analysis we have set out areas for further research, to enable data
quality issues to be understood and addressed.
Recommendations
Responsibility for the coding and quality of ethnicity data in health records is
dispersed across a number of organisations, national and local, including the
Department of Health and Social Care, NHS England and NHS Improvement,
NHS Digital, NHS organisations and GPs. All have a role to play in improving
the quality of the ethnicity data available for analysing and addressing ethnic
inequalities in health.
Our recommendations relate to:
• improving the analytical potential of currently available data,
notwithstanding the associated data quality problems (short term)
• improving the quality of the underlying source data (medium term).
9Ethnicity coding in English health service datasets
1 2 3 4 5 6
To improve the analysis of ethnicity using existing health data, we recommend
the following:
• NHS Digital regularly publishes data on the quality of ethnicity coding
within the Data Quality Maturity Index and this should also include the
proportion of records coded as not known, not stated, an ‘other’ group and
‘any other ethnic group’.
Action: NHS Digital
• The UK Statistics Authority should review the quality of ethnicity coding
within health statistics, in order to identify and make recommendations for
improving the quality and consistency of data.
Action: UK Statistics Authority
• Analyses of health care activity should routinely include the ethnic
dimension, and consider and report on the quality of coding.
Action: Data analysts and users
• Analysis methods to address data quality issues in analysis of ethnic
differences should be clearly described and, where appropriate and
feasible, the methodology developed by Public Health England for
reassigning ethnicity in health records should be used.
Action: Data analysts and users
To improve the quality of source data on ethnicity in the future, we
recommend the following:
• The Health Inequalities Improvement Programme at NHS England and
NHS Improvement should work with NHS Digital and the NHS Race
and Health Observatory on developing and implementing guidance for
ethnicity coding in the NHS, in keeping with priority 3 of the NHS England
and NHS Improvement operational guidance2. Guidance needs to cover
NHS-funded care, wherever this is provided, and include protocols for
2 NHS England and NHS Improvement (2021) 2021/22 Priorities and Operational Planning
Guidance. NHS England and NHS Improvement. www.england.nhs.uk/wp-content/uploads/2021/03/B0468-nhs-operational-planning-and-contracting-guidance.pdf.
10Ethnicity coding in English health service datasets
1 2 3 4 5 6
asking patients their ethnicity and recording it in health records, using the
updated 2021 census categories.
Action: NHS England and NHS Improvement
• Integrated care system leaders should use their role to reduce inequalities
to improve the quality of ethnicity coding in health records, ensuring
that the updated guidance on ethnicity coding is implemented, and
learning from local partners and spreading best practice in data quality
and analysis.
Action: Integrated care system leaders
• Boards and leaders of NHS providers and commissioners, and GP
practices, should take ownership of the quality of ethnicity coding for their
patients, ensure that the updated guidance is implemented, routinely
monitor the quality of coding, identify how it can be improved, and put
in place actions to achieve this. Once guidance on ethnicity coding is
available, all health care providers should endeavour to record/update/
correct ethnicity coding in all patient records.
Action: All NHS providers and commissioners, and GP practices
• The Care Quality Commission should incorporate the assessment of the
quality of ethnicity coding in its inspections and ratings, and address
independent providers’ poor-quality coding, taking action where
the data suggest possible shortfalls and a failure to implement the
updated guidance.
Action: Care Quality Commission

11Ethnicity coding in English health service datasets
2 3 4 5 61
Context
Why the coding of ethnicity matters
The Covid-19 pandemic has brought the extent and impact of ethnic
disparities in health to the forefront for communities, health services and
government. Several studies and reports3 have shown that the risk of Covid-19
infection, severe disease and mortality is significantly higher among people
from minority ethnic communities than in the White population. Differences
in health outcomes between ethnic groups are not unique to Covid-19,4,5 but
the pandemic has drawn attention to them, and this focus provides a potential
opportunity to address long-standing inequalities in health care.
The pandemic has also demonstrated that limited and poor-quality ethnicity
data are reducing understanding of, ethnic inequalities, and the ability to
identify effective responses. Comprehensive and high-quality ethnicity data
are essential for improving the health and wellbeing of people from minority
ethnic communities. They play a vital role in:
• supporting needs assessments and service planning
• enabling the monitoring of equity of access and outcomes
• informing clinical practice
• improving the evidence on inequalities in population-based risks
and outcomes
3 The Independent Scientific Advisory Group for Emergencies (SAGE) (2020) Disparities in the Impact of COVID-19 in Black and Minority Ethnic Populations: Review of the evidence and recommendations for action. The Independent SAGE Report 6. The Independent
SAGE. www.independentsage.org/wp-content/uploads/2020/07/Independent-SAGE-BME-Report_02July_FINAL.pdf.
4 Public Health England (2017) Public Health Outcomes Framework: Health equity report: Focus on ethnicity. Public Health England. https://assets.publishing.service.gov.uk/government/uploads/system/uploads/attachment_data/file/733093/PHOF_Health_Equity_Report.pdf.
5 Raleigh V and Holmes J (2021) ‘The health of people from ethnic minority groups in
England’. www.kingsfund.org.uk/publications/health-people-ethnic-minority-groups-england. Accessed 11 May 2021.
2

12Ethnicity coding in English health service datasets
2 3 4 5 61
• supporting high-quality research.
Ethnicity data from hospital datasets are widely used in analysis of other
health related data, including mortality, amplifying the impact of data quality
issues further.6
What is already known about the quality of ethnicity coding?
Current challenges in terms of ethnicity coding range from the absence of
ethnicity data in essential data sources such as death registrations (from
which mortality statistics are derived), to poor coverage in primary care data,7
outdated ethnicity codes used within the NHS compared with the 2011 and
2021 censuses, and systematic differences in coding between White and
minority ethnic groups.
Raleigh and Goldblatt8 set out evidence of the poor quality of ethnicity coding
across a range of health datasets, including:
• weak agreement between ethnicity coding in hospital data compared with
self-reported ethnicity as captured in the 2010 Cancer Patient Experience
Survey in England,9 with routine hospital data miscoding between 20% and
35% of patients from major ethnic groups (Indian, Pakistani, Bangladeshi,
6 Public Health England (2020) Disparities in the risk and outcomes of COVID-19. Public
Health England. https://assets.publishing.service.gov.uk/government/uploads/system/uploads/attachment_data/file/908434/Disparities_in_the_risk_and_outcomes_of_COVID_August_2020_update.pdf. Accessed 18 May 2021.
7 Mathur R, Rentsch CT, Morton CE, Hulme WJ, Schultze A and others (2021) ‘Ethnic
differences in SARS-CoV-2 infection and COVID-19-related hospitalisation, intensive
care unit admission, and death in 17 million adults in England: an observational cohort
study using the OpenSAFELY platform’, The Lancet 397(10286), 1711–24. https://doi.org/10.1016/S0140-6736(21)00634-6. Accessed 11 May 2021.
8 Raleigh V and Goldblatt P (2020) Ethnicity Coding in Health Records. The King’s Fund.
www.kingsfund.org.uk/publications/ethnicity-coding-health-records.
9 Saunders CL, Abel GA, El Turabi A and Lyratzopoulos G (2013) ‘Accuracy of routinely
recorded ethnic group information compared with self-reported ethnicity: evidence from
the English Cancer Patient Experience survey’, BMJ Open 3(6). https://bmjopen.bmj.com/content/3/6/e002882. Accessed 11 May 2021.

13Ethnicity coding in English health service datasets
2 3 4 5 61
Chinese, Black Caribbean and Black African)
• very poor agreement between the ethnicity coding of minority ethnic
groups in primary care and hospital records – for patients of South Asian
ethnicity, the agreement was only 50%, and weaker still for other ethnic
groups, while there was high concordance for the White group10
• evidence from a qualitative study of substantial variations in data
classification, and practical challenges in data collection and usage, which
undermine the integrity of the data collected11
• the over-representation of ‘other’ codes in NHS datasets, including ‘any
other ethnic group’, ‘other Black’, ‘other Asian’ and ‘other White’, which has
led to disproportionately high rates of Covid-19 infections and mortality
being recorded for the ‘other’ groups, and has been identified in other
contexts, including mental health services12 and detentions under the
Mental Health Act 198313 – overuse of the ‘other’ categories inevitably
means that ethnicity is not being recorded correctly for every ethnic group,
including the White group.
The legal framework and policy context
Reducing inequalities in health is a moral imperative. It is also enshrined
in legislation. The Health and Social Care Act 2012 introduced specific legal
duties for health bodies in England to have regard to inequalities in the
10 Mathur R, Bhaskaran K, Chaturvedi N, Leon DA, vanStaa T, Grundy E and Smeeth L (2014)
‘Completeness and usability of ethnicity data in UK-based primary care and hospital
databases’, Journal of Public Health (Oxford, England) 36(4), 684–92, doi: 10.1093/
pubmed/fdt116.
11 Morrison Z, Fernando B, Kalra D, Cresswell K, Robertson A and Sheikh A (2014) ‘The
collection and utilisation of patient ethnicity data in general practices and hospitals in the
United Kingdom: a qualitative case study’, Informatics in Primary Care 21(3), 118–31.
12 Cabinet Office (2017, revised 2018) Race Disparity Audit. Cabinet Office. https://assets.publishing.service.gov.uk/government/uploads/system/uploads/attachment_data/file/686071/Revised_RDA_report_March_2018.pdf.
13 UK Government (2021) ‘Detentions under the Mental Health Act’. www.ethnicity-facts-figures.service.gov.uk/health/mental-health/detentions-under-the-mental-health-act/latest#:~:text=. Black people were most likely to be the detained ethnic group – 232.8
detentions for every 100,000 people.

14Ethnicity coding in English health service datasets
2 3 4 5 61
provision of health services and the outcomes achieved. The Race Relations
Amendment Act 2000 built on previous legislation (the Race Relations Act
1976) designed to ban discrimination on grounds of race and requires public
authorities to promote race equality. And the Equality Act 2010 extended
anti-discrimination legislation to cover nine protected characteristics,
including race.
Within the NHS, the requirement to address inequalities has been embedded
within successive strategic plans14 and operational guidance, most recently in
the planning guidance for 2020/21.2 The latest guidance builds on the 31 July
2020 letter from NHS England and NHS Improvement to the NHS about the
third phase of the NHS response to Covid-19,15 requiring the NHS and GPs to
comprehensively record ethnicity. Integrated care systems are now required to:
Ensure datasets are complete and timely: systems are asked to continue
to improve the collection and recording of ethnicity data across primary
care, outpatients, A&E, mental health, community services, and
specialised commissioning… Systems should also implement mandatory
ethnicity data reporting in primary care, to enable demographic data
to be linked with other datasets and support an integrated approach to
performance monitoring for improvement.16
The renewed focus on recording ethnicity in health records is welcome.
However, without complementary action to improve data quality, it will not
be sufficient to allow valid analyses of ethnic disparities. Accurate recording of
ethnicity using specific ethnicity codes is essential for meaningful analysis.
How should ethnicity be coded in health care records and what are the challenges?
14 NHS England (2019) The NHS Long Term Plan. NHS England. www.longtermplan.nhs.uk/publication/nhs-long-term-plan. Accessed 11 May 2021.
15 NHS England and NHS Improvement (2020) ‘Important – for action – third phase of NHS
response to Covid-19’. Letter. www.england.nhs.uk/coronavirus/wp-content/uploads/sites/52/2020/07/20200731-Phase-3-letter-final-1.pdf.
16 NHS England and NHS Improvement (2021) 2021/22 Priorities and Operational Planning Guidance: Implementation guidance, p. 12. NHS England and NHS Improvement.
www.england.nhs.uk/wp-content/uploads/2021/03/B0468-implementation-guidance-21-22-priorities-and-operational-planning-guidance.pdf.

15Ethnicity coding in English health service datasets
2 3 4 5 61
Ethnicity is a complex, multidimensional concept, often defined by
features such as a shared history, common cultural traditions and common
geographical origin, language and literature.8 It is therefore a highly subjective
classification, but one which an individual is required to articulate within a
simple data item structure. As such, the only true meaningful categorisation is
self-definition.
The principle that ethnic group should be self-identified, rather than ascribed
by someone else, underpins ONS guidance for the collection and classification
of ethnic group, national identity and religion data in the UK.17 Although
the guidance relates to how questions should be asked in social surveys, the
general principles also apply to recording ethnicity in health records. The ONS
recommends that the ethnic group question should be asked in a way that
allows the respondent to see all possible response options before making their
decision, recognising that categories are not exclusive in all cases. Individuals
may change their self-identified ethnicity over time and dependent on
circumstances: for example, while more than 90% of White, Chinese and
South Asian people self-identified with the same ethnicity between the
1991 and 2001 censuses, almost one in four (23%) Black African and Black
Caribbean people did so.18
Guidance for the NHS on the recording of ethnicity dates back to 2001,
when a Data Set Coding Notice (DSC Notice: 02/2001)19 was issued to NHS
organisations after the passing of the Race Relations Amendment Act 2000.
This enshrined the principle of self-identification, and required the NHS to use
the 17 ethnic categories included in the 2001 census. In addition to issuing the
Data Set Coding Notice, the Health and Social Care Information Centre held a
17 Office for National Statistics (2016) ‘Measuring equality: a guide for the collection
and classification of ethnic group, national identity and religion data in the UK’.
www.ons.gov.uk/methodology/classificationsandstandards/measuringequality/ethnicgroupnationalidentityandreligion. Accessed 11 May 2021.
18 Platt L, Simpson L and Akinwale B (2005) ‘Stability and change in ethnic groups in
England and Wales’, Population Trends (121), 35–46. www.researchgate.net/profile/Bola-Akinwale-2/publication/7516932_Stability_and_change_in_ethnic_groups_in_England_and_Wales/links/54de12700cf22a26721e4f98/Stability-and-change-in-ethnic-groups-in-England-and-Wales.pdf.
19 NHS Digital (2017) ‘Information Standards Notices and Data Set Change Notices’.
https://nhs-prod.global.ssl.fastly.net/binaries/content/assets/legacy/excel/m/0/isns-and-dscns-archive.xlsx. Accessed 11 May 2021.

16Ethnicity coding in English health service datasets
2 3 4 5 61
series of events with NHS organisations to introduce the ethnic category code
changes and discuss the implications with key staff, and training materials for
use nationally were developed and provided to the NHS.
It is unclear the extent to which NHS organisations are following the principle
of self-identification, or whether health workers understand the need for
high-quality data on ethnicity.20 Asking patients to complete a form asking for
their ethnicity can undoubtedly present challenges in a clinical setting when
staff may be under pressure and patients are unwell or lack capacity. Hence,
it is possible that this requirement is not always followed. It may also occur
if staff are simply unaware that self-reporting is the required procedure or,
for example, if there is uncertainty about whether staff are required to ask for
ethnicity again if it is already recorded for an earlier episode of care. Further,
the response options available in NHS systems may not be consistent across
different organisations and care settings.
20 Morrison Z, Fernando B, Kalra D, Cresswell K, Robertson A and Sheikh A (2014) ‘The
collection and utilisation of patient ethnicity data in general practices and hospitals in
the United Kingdom: a qualitative case study’, Informatics in Primary Care 21(3), 118–31.
https://hijournal.bcs.org/index.php/jhi/article/view/63/103. Accessed 11 May 2021.

17Ethnicity coding in English health service datasets
2 3 4 5 61
Importantly, guidance for the NHS has not been updated since 2001.
The categories used within the NHS are no longer in line with the census
categories for 2011 or 2021. This presents a specific challenge in comparing
health data with population estimates: patients are not being presented
with the same response options as the data sources used for denominators
to calculate population rates. Further, data collection systems within NHS
organisations use a variety of coding systems, which may not map directly
onto the categories identified in the NHS Data Dictionary.
Epidemiological analyses require linkage across different datasets, and
population denominators to calculate rates, for example for mortality or
hospital admissions. Ensuring that ethnicity is self-reported in the NHS using
a consistent set of codes to other population and health data is essential if
discrepancies and biases in the data are to be avoided. The ONS and Public
Health England (PHE) are taking measures to ensure their analyses are as
robust as possible.21 However, it is unclear whether data quality issues are
widely known and taken into account by users of NHS data across the NHS,
within academia and among policy-makers.
Incomplete or inaccurate ethnicity data mean that we cannot reliably assess
the health needs of, and access and outcomes for, different ethnic groups.
Furthermore, analyses may actually be misleading if particular ethnic groups
are over-coded or under-coded.
This report
Our analysis in this report of the quality of ethnicity coding within widely
used English hospital and community services datasets provides a thorough
assessment of the quality of ethnicity coding, and identifies significant data
quality issues. This will inform data users about the issues, so they can take
account of them in their analyses. We also identify actions that need to be
taken to improve the underlying quality of data on ethnicity.
21 Nuffield Trust (2021) ‘Nuffield Trust and NHS Race and Health Observatory workshop
on ethnicity coding’. www.nuffieldtrust.org.uk/files/2021-04/workshop-on-ethnicity-coding-20210330-notes.pdf.

18Ethnicity coding in English health service datasets
3 4 5 61 2
Data and methods
Data
We analysed ethnicity coding using Hospital Episodes Statistics (HES) on
inpatients, outpatients and A&E (see Table 1), along with data for 2019/20
from the Emergency Care Data Set (ECDS) and the Community Services Data
Set (CSDS) (see Appendix 1). We did not have access to any primary care data
for this project.
The volume of data recorded in each HES dataset has increased over time.
While this reflects increased activity in many cases (for example, emergency
admissions), it may in part reflect changes in what activity data providers
have submitted. For example, in recent years, more activity from minor injury
units has been recorded in the A&E dataset, and there has been more non-
consultant-led activity in the outpatient dataset.
Table 1: Data included from Hospital Episodes Statistics (millions)
Financial year
Inpatientsa Outpatientsb A&E
Patients Spells Patients Spells Patients Attendances2010/11 8.7 14.8 18.2 70.3 10.8 16.2
2011/12 8.8 14.9 18.5 72.6 11.5 17.6
2012/13 8.8 15.1 19.1 75.5 11.9 18.3
2013/14 8.9 15.4 20.5 82.1 11.9 18.5
2014/15 9.1 15.8 20.5 85.6 12.6 19.6
2015/16 9.2 16.2 20.8 89.4 13.0 20.5
2016/17 9.4 16.5 21.2 93.9 13.1 20.9
2017/18 9.4 16.5 21.4 93.5 13.2 21.3
2018/19 9.6 17.1 22.0 96.4 13.8 22.4
2019/20 9.5 17.1 23.6 96.4 12.4c 19.4c
Notes:
a Inpatient activity was grouped into spells, and regular day and night attendances
were excluded.
b Only attended outpatient appointments were included.
c A&E data cover April 2019 to January 2020 due to the change from A&E HES to the ECDS.
3

19Ethnicity coding in English health service datasets
3 4 5 61 2
We undertook more detailed analysis using inpatient data, because they were
more complete in terms of ethnicity. For most of the analysis we focused on
A&E HES records, rather than the ECDS, given the longer time series for the
former, and did not carry out detailed analysis of the community services
dataset, given the low proportion of records with an ethnic group code.
Ethnicity groups in NHS datasets
The ethnic group codes used in NHS datasets relate to the ethnicity codes
used in the 2001 census (see Table 2). Codes A to S represent different ethnic
groups, with code S being a catch-all for ‘any other ethnic group’. In addition, a
code of ‘not stated’ (Z) is intended to be used when an individual chooses not
to give their ethnicity. The ‘not known’ group (99, or X before 2013) is intended
to be used for people who were not asked their ethnicity, for people who were
unable to answer, and for any missing or other values not in the NHS Data
Dictionary. It should be noted that ONS codes for the 2011 census include
additional codes that are not available in NHS datasets: a separate code
for people from an Arab background and separate codes within the White
group for people from a Roma background and people from a Gypsy or Irish
Traveller background.

20Ethnicity coding in English health service datasets
3 4 5 61 2
Table 2: Ethnicity categories in NHS datasets
Code Ethnic category description Other?
Valid ethnic group
A British (White)
B Irish (White)
C Any other White background Other
D White and Black Caribbean (Mixed)
E White and Black African (Mixed)
F White and Asian (Mixed)
G Any other Mixed background Other
H Indian (Asian or Asian British)
J Pakistani (Asian or Asian British)
K Bangladeshi (Asian or Asian British)
L Any other Asian background Other
M Caribbean (Black or Black British)
N African (Black or Black British)
P Any other Black background Other
R Chinese (other ethnic group)
S Any other ethnic group Other
Not stated Z Not stated
Not known
X Not known (before 2013)
99 Not known (since 2013)
? Missing or values not in the NHS Data Dictionary

21Ethnicity coding in English health service datasets
3 4 5 61 2
Population data by ethnic group
In our analysis we used the 2018 population estimates by ethnic group derived
from the census and migration data.22 These are available by age and sex, and
so enabled us to compare coding within age groups.
Limitations with currently available population estimates by ethnic group,
alternative sources and trends over time in the ethnic composition of the
population are discussed in Appendix 2.
Research questions and methods
In this section we set out our three research questions, along with the methods
we used to answer them.
Research question 1: How does ethnic coding in NHS datasets compare with the ethnic composition of the general population?
Comparison with the ethnic composition of the general population provides
context for interpreting coding by ethnic group within health datasets.
We compared population estimates by ethnic category from the ONS for
each age group, with the distribution of ethnicity codes in inpatient data for
2019/20, to examine how different groups were represented in health care
datasets. Differences between ethnic groups, even with age groups, could
indicate differential need or access to services, as well as differences in the
completeness or validity of ethnicity coding.
22 Office for National Statistics (2018) ‘Population denominators by ethnic group,
regions and countries: England and Wales, 2011 to 2018’. www.ons.gov.uk/peoplepopulationandcommunity/populationandmigration/populationestimates/adhocs/008780populationdenominatorsbyethnicgroupregionsandcountriesengland andwales2011to2017. Accessed 11 May 2021.
22Ethnicity coding in English health service datasets
3 4 5 61 2
Research question 2: To what extent is ethnicity coding complete and valid and how does this vary between groups of patients?
We analysed the completeness and validity of ethnic category coding across
NHS datasets. As a result of previously identified issues with the over-
representation of ‘other’ groups, we also examined the proportion of ‘other’
codes within the datasets, combining all of the ‘other’ categories.
Using these measures (see Box 1 for definitions), we examined:
• what proportion of records have an ethnic group coded in the most recent
year for all five datasets, including the Emergency Care Data Set (ECDS)
and the Community Services Data Set (CSDS)
• how coding has changed over time, from 2010/11 to 2019/20, in HES data
• how data quality varies between sub-groups of patients and across the
patient pathway, focusing on data from 2019/20.
Our scope in this project was to describe ethnicity coding quality and
variation, to highlight these to users of ethnicity data. We did not undertake a
multivariate analysis to explore the relationship between factors.

23Ethnicity coding in English health service datasets
3 4 5 61 2
Box 1: Definitions of the measures of data quality used
Completeness, indicated by the proportion of not known codes: the percentage of records with a not known code (X or 99), a missing value or any other value apart from A to S or Z.
Not stated: the percentage of records with not stated code (Z) – while this is a permitted code, it does not provide data that are useable for the analysis of ethnicity.
Valid ethnic group: the percentage of records with codes A to S, and subsets of this:
‘Other’ groups: the percentage of records recorded as an ‘other White’ (C), ‘other Mixed’ (G), ‘other Asian’ (L) or ‘other Black’ (P), or ‘any other ethnic group’ (S).
Any other group: the percentage of records with code ‘Any other ethnic group’ (S)
Research question 3: How consistently is ethnicity coded, for patients who have multiple health records?
Finally, we assessed the consistency of ethnic category coding for individuals
over time, across multiple contacts with hospitals. We constructed a patient
index for any patient who appeared in the inpatient, outpatient and A&E data
in 2017/18, 2018/19 or 2019/20. This index enabled us to track patients with
multiple contacts across these services. We then examined the extent to which
people’s ethnicity records were consistent over time, and whether this varied
between ethnic groups.

24Ethnicity coding in English health service datasets
41 3 5 62
Findings
Comparison with population estimates
We compared the ethnicity of inpatients with national estimates of ethnicity
in the general population, by age group. Despite limitations with currently
available population data (see Appendix 2), a comparison of the ethnic
distribution of inpatients and population estimates provides additional
insights into potential systemic problems in ethnicity recording in
health datasets.
Figure 1 shows age/sex population pyramids by ethnicity for mid-2018
ONS population estimates.22 Percentages are used to allow comparison
between ethnic groups, for which the population count is very different. The
distribution based on inpatient records is overlaid (using dots).
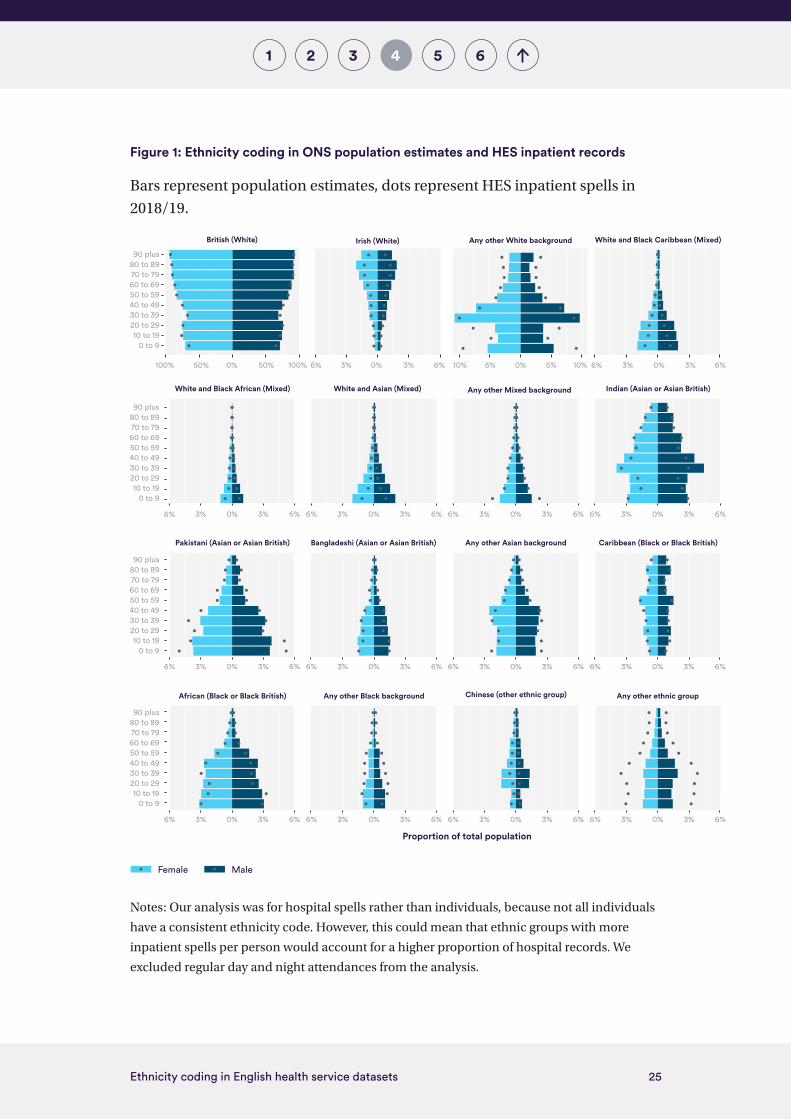
This shows that, in most cases, hospital records over-represent ‘other’
categories while under-representing Mixed ethnic groups, and some specific
ethnic groups. For example, among the population, 1.1% of women in their 40s
are recorded as being from ‘any other ethnic group’, but this represents 2.7% of
records in the inpatient dataset. For boys under the age of 10, the population
estimates indicate that around 2% of them are ‘White and Asian (Mixed)’, but
only 1.1% of records indicate that they are in this ethnic group.
While differences in the ethnic distribution between inpatients and the
general population could reflect differential access or need, the differences
for ‘other’ groups are striking. When 2021 census data are available (expected
during 2022), it will be possible to undertake a more detailed comparison
against that gold standard, including analysis at the regional level.
4
25Ethnicity coding in English health service datasets
41 3 5 62
Figure 1: Ethnicity coding in ONS population estimates and HES inpatient records
Bars represent population estimates, dots represent HES inpatient spells in
2018/19.
Notes: Our analysis was for hospital spells rather than individuals, because not all individuals
have a consistent ethnicity code. However, this could mean that ethnic groups with more
inpatient spells per person would account for a higher proportion of hospital records. We
excluded regular day and night attendances from the analysis.
Proportion of total population
0 to 910 to 19
20 to 2930 to 3940 to 4950 to 5960 to 6970 to 7980 to 8990 plus
0 to 910 to 19
20 to 2930 to 3940 to 4950 to 5960 to 6970 to 7980 to 8990 plus
6% 3% 0% 3% 6% 6% 3% 0% 3% 6% 6% 3% 0% 3% 6% 6% 3% 0% 3% 6%
0 to 910 to 19
20 to 2930 to 3940 to 4950 to 5960 to 6970 to 7980 to 8990 plus
0 to 910 to 19
20 to 2930 to 3940 to 4950 to 5960 to 6970 to 7980 to 8990 plus
White and Black African (Mixed) White and Asian (Mixed) Any other Mixed background Indian (Asian or Asian British)
6% 3% 0% 3% 6% 6% 3% 0% 3% 6%
6% 3% 0% 3% 6% 10% 10%
6% 3% 0% 3% 6% 6% 3% 0% 3% 6%
Pakistani (Asian or Asian British) Bangladeshi (Asian or Asian British) Any other Asian background Caribbean (Black or Black British)
6% 3% 0% 3% 6% 6% 3% 0% 3% 6% 6% 3% 0% 3% 6% 6% 3% 0% 3% 6%
African (Black or Black British) Any other Black background Chinese (other ethnic group) Any other ethnic group
6% 3% 0% 3% 6%100% 50% 50%0% 100%
White and Black Caribbean (Mixed)British (White) Irish (White)
5% 0% 5%
Any other White background
Female Male

26Ethnicity coding in English health service datasets
41 3 5 62
What proportion of NHS records had an ethnic group coded?
In 2019/20, 87% of inpatient, 86% of A&E, and 85% of Emergency Care Data Set
(ECDS), records had a known ethnic category recorded and 83% of outpatient
records had one (see Figure 2). In contrast, only 61% of Community Services
Data Set (CSDS) records had ethnicity recorded; this is a new dataset with
significant coverage and data quality issues.
In addition to records with a valid ethnic group, 8.5% of inpatient and 11% of
outpatient records were recorded as not stated.
The proportion of records with an ethnicity code of ‘any other group’ and
those with ‘other’ ethnic group codes was highest for the A&E dataset and the
related ECDS.
0% 10% 20% 30% 40% 50% 60% 70% 80% 90% 100%
Inpatient
Outpatient
A&E
ECDS
CSDS
Figure 2: Completeness and validity of ethnicity coding across NHS datasets, 2019/20
Any other group ‘Other’ groups Valid ethnic group Not stated Not known

27Ethnicity coding in English health service datasets
41 3 5 62
How has coding changed over time?
The quality of ethnicity coding in the outpatient and A&E datasets improved
dramatically between 2010/11 and 2012/13 (see Figure 3). This was linked
to wider improvements in data quality over this period. The proportion of
inpatient records that have a valid ethnic group has been declining slowly
since 2010. Meanwhile there has been an increase in the proportion of records
where ethnic group is not stated (see Figure 4).
In addition, there was also an increase in the proportion of records that were
in an ‘other’ ethnic group category. For inpatient records it rose from 7.2% to
8.8% between 2010/11 and 2019/20 (see Figure 5). The proportion of ‘any other
ethnic group’ records specifically increased from 1.5% to 2.1%.
0%
10%
20%
30%
40%
50%
60%
70%
80%
90%
100%
Figure 3: Proportion of records with a valid ethnic group code, 2010/11 to 2019/20
2019/202018/192017/182016/172015/162014/152013/142012/132011/122010/11
Financial year
Prop
orti
on o
f rec
ords
with
a
valid
eth
nic
grou
p co
de
Inpatient
A&E
Outpatient
0%
2%
4%
6%
8%
10%
12%
14%
2019/202018/192017/182016/172015/162014/152013/142012/132011/122010/11
Figure 4: Proportion of records with ethnicity not stated, 2010/11 to 2019/20
Financial year
Prop
orti
on o
f rec
ords
with
et
hnic
ity
not s
tate
d
Outpatient
Inpatient
A&E

28Ethnicity coding in English health service datasets
41 3 5 62
There are a number of potential explanations for this. A similar increase in
‘other’ and Mixed ethnic group categories can be seen in population estimates
by ethnic group (see Appendix 2). Over this time period there was significant
inward migration of European migrants, which may have contributed to the
increase in the ‘other White’ category. There may also be a generational shift in
how individuals record their ethnic group, with people in second- or third-
generation ethnic groups changing how they ascribe their ethnicity.18
Variations in data quality between sub-groups of patients and population groups
We examined how the quality of ethnicity coding varied for different groups
of patients or activity types. For brevity, in this section the comparisons are
discussed primarily for inpatient data, and only where there were substantial
differences in coding between sub-groups or over time.
Age and gender
There was variation in ethnicity coding by age and, for working-age patients,
by gender. For example, records for working-age men were almost twice as
likely to have an ethnicity code of not stated as records for people over the age
of 80 and children under five (see Figure 6). We also found that older people
0%
1%
2%
3%
4%
5%
6%
7%
8%
9%
10%
2019/202018/192017/182016/172015/162014/152013/142012/132011/122010/11
Figure 5: Proportion of inpatient spells categorised as in an ‘other’ ethnic group, 2010/11 to 2019/20
Any other White background
Any other Black background
Any other ethnic background
Any other Mixed background
Any other Asian background
Financial year
Prop
orti
on o
f inp
atie
nt s
pells
cat
egor
ised
as
in a
n ‘o
ther
’ eth
nic
grou
p

29Ethnicity coding in English health service datasets
41 3 5 62
and women were less likely to have not known codes. Differences in terms of
age and gender could reflect the frequency of contacts, with working-age men
having fewer admissions than other age–gender combinations. The increasing
proportion of records with a not stated ethnicity code between 2010/11 and
2019/20 was apparent across all age groups apart from children.
Note: Gender differences were only noted for working-age inpatients, so the split is not shown
for other age groups.
Region
There were substantial differences in ethnicity coding between regions, with
almost double the proportion of spells being recorded as not stated in London
and the South East than in other regions, accounting for more than one in
eight records in these regions (see Figure 7).
London had three times as many spells recorded as an ‘other’ category
than other regions, with 6.5% recorded as ‘any other ethnic group’. Higher
proportions of ‘other’ groups were in line with population estimates of ‘other’
ethnic groups in London, although nearly a fifth (18%) of records did not have
a valid ethnic group, hindering direct comparison with population estimates.
0%
2%
4%
6%
8%
10%
12%
2019/202018/192017/182016/172015/162014/152013/142012/132011/122010/11
Prop
orti
on o
f inp
atie
nt s
pells
with
an
ethn
ic g
roup
cat
egor
y of
not
sta
ted
Figure 6: Proportion of inpatient spells with an ethnic group category of not stated, by age and gender, 2010/11 to 2019/20
Financial year
Male – 18 to 64
Female – 18 to 64
5 to 17
65 to 79
80 plus
0 to 4

30Ethnicity coding in English health service datasets
41 3 5 62
Variation between providers
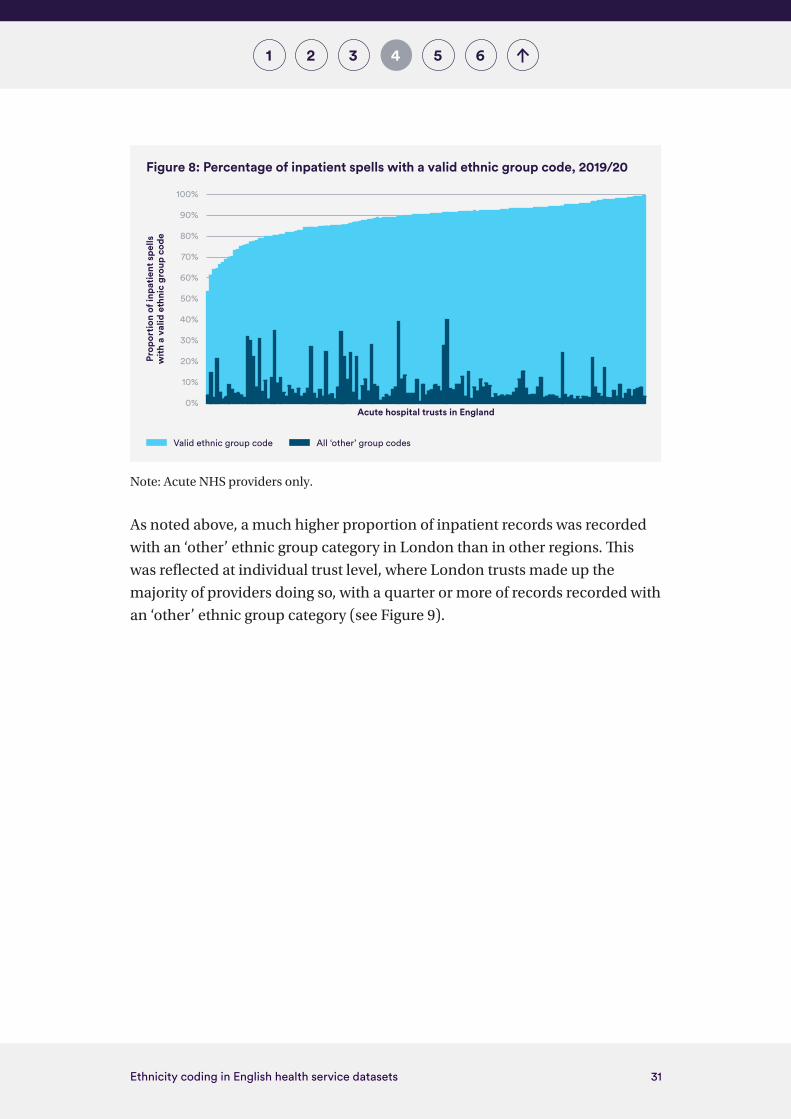
The proportion of records with a valid ethnic group varied markedly between
providers, from 53% to almost 100% (see Figure 8). This range suggests there is
significant potential for providers to learn from best practice, and for very high
levels of data quality to be achieved. In some cases, a very high percentage of
valid ethnicity codes includes a large proportion of records – up to 40% – being
recorded in one of the ‘other’ ethnic groups, and this coding has been found to
be over-used in the NHS8.
0% 5% 10% 15% 20% 25%
East of England
West Midlands
North West
North East
Yorkshire and the Humber
East Midlands
South West
South East
London
Figure 7: Regional di�erences in the proportion of inpatient spells recorded as not stated or an ‘other’ category, 2019/20
% not stated % ‘other’ groups
31Ethnicity coding in English health service datasets
41 3 5 62
Note: Acute NHS providers only.
As noted above, a much higher proportion of inpatient records was recorded
with an ‘other’ ethnic group category in London than in other regions. This
was reflected at individual trust level, where London trusts made up the
majority of providers doing so, with a quarter or more of records recorded with
an ‘other’ ethnic group category (see Figure 9).
0%
10%
20%
30%
40%
50%
60%
70%
80%
90%
100%
Figure 8: Percentage of inpatient spells with a valid ethnic group code, 2019/20
Acute hospital trusts in England
Prop
orti
on o
f inp
atie
nt s
pells
w
ith a
val
id e
thni
c gr
oup
code
Valid ethnic group code All ‘other’ group codes
32Ethnicity coding in English health service datasets
41 3 5 62
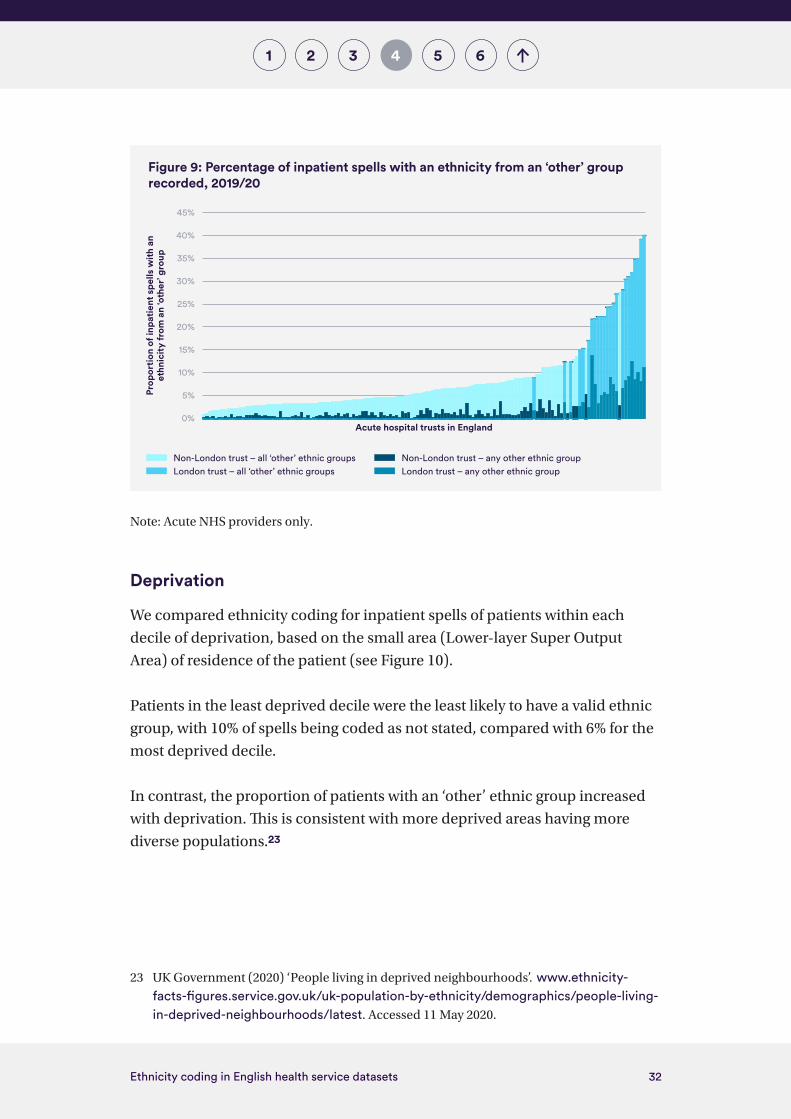
Note: Acute NHS providers only.
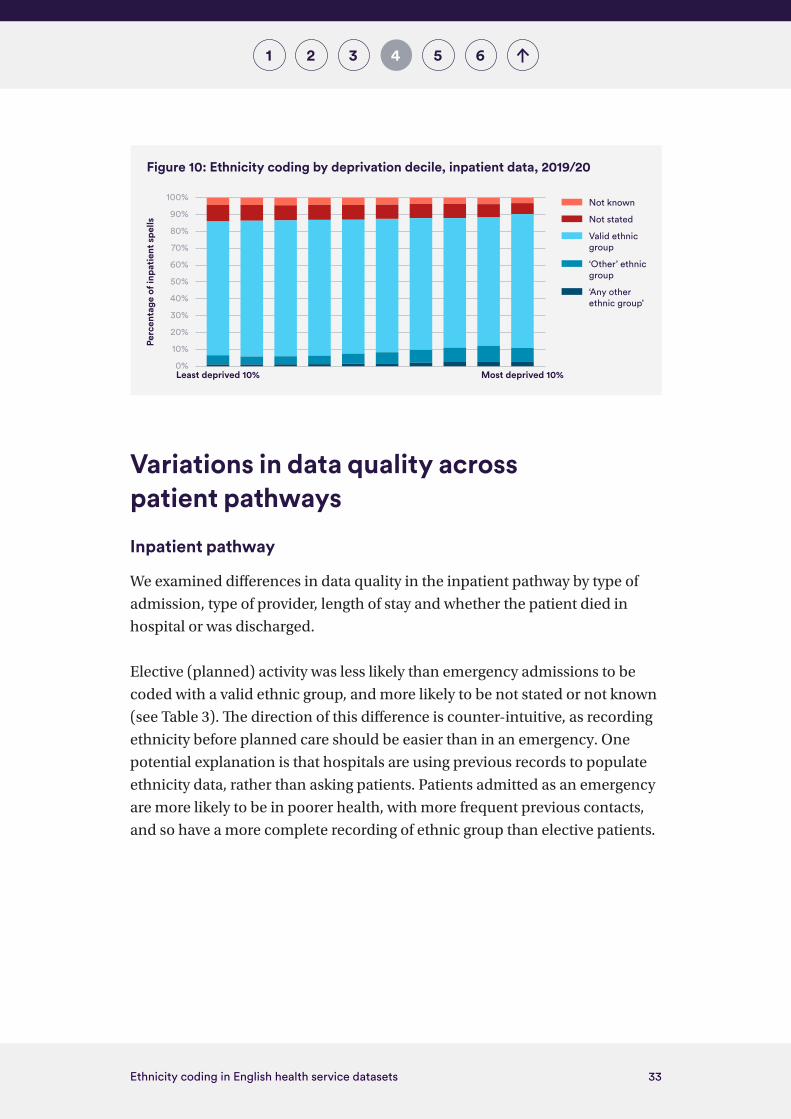
Deprivation
We compared ethnicity coding for inpatient spells of patients within each
decile of deprivation, based on the small area (Lower-layer Super Output
Area) of residence of the patient (see Figure 10).
Patients in the least deprived decile were the least likely to have a valid ethnic
group, with 10% of spells being coded as not stated, compared with 6% for the
most deprived decile.
In contrast, the proportion of patients with an ‘other’ ethnic group increased
with deprivation. This is consistent with more deprived areas having more
diverse populations.23
23 UK Government (2020) ‘People living in deprived neighbourhoods’. www.ethnicity-facts-figures.service.gov.uk/uk-population-by-ethnicity/demographics/people-living-in-deprived-neighbourhoods/latest. Accessed 11 May 2020.
0%
5%
10%
15%
20%
25%
30%
35%
40%
45%
Figure 9: Percentage of inpatient spells with an ethnicity from an ‘other’ group recorded, 2019/20
Acute hospital trusts in England
Prop
orti
on o
f inp
atie
nt s
pells
with
an
ethn
icit
y fr
om a
n ‘o
ther
’ gro
up
Non-London trust – all ‘other’ ethnic groups Non-London trust – any other ethnic groupLondon trust – all ‘other’ ethnic groups London trust – any other ethnic group
33Ethnicity coding in English health service datasets
41 3 5 62
Variations in data quality across patient pathways
Inpatient pathway
We examined differences in data quality in the inpatient pathway by type of
admission, type of provider, length of stay and whether the patient died in
hospital or was discharged.
Elective (planned) activity was less likely than emergency admissions to be
coded with a valid ethnic group, and more likely to be not stated or not known
(see Table 3). The direction of this difference is counter-intuitive, as recording
ethnicity before planned care should be easier than in an emergency. One
potential explanation is that hospitals are using previous records to populate
ethnicity data, rather than asking patients. Patients admitted as an emergency
are more likely to be in poorer health, with more frequent previous contacts,
and so have a more complete recording of ethnic group than elective patients.
0%
10%
20%
30%
40%
50%
60%
70%
80%
90%
100%
Figure 10: Ethnicity coding by deprivation decile, inpatient data, 2019/20
Least deprived 10% Most deprived 10%
Perc
enta
ge o
f inp
atie
nt s
pells
‘Any other ethnic group’
‘Other’ ethnic group
Valid ethnic group
Not stated
Not known

34Ethnicity coding in English health service datasets
41 3 5 62
Table 3: Ethnicity coding in HES inpatient spells in 2019/20, by broad admission group
Admission method % not known
% not stated
% with valid ethnic
group
% with ‘other’ ethnic
group
% with ‘any other ethnic
group’
Elective 4.7% 10% 85% 7.0% 1.6%
Emergency 3.2% 6.4% 91% 8.9% 2.0%
Maternity 3.5% 7.3% 89% 17% 3.6%
Other 3.8% 5.9% 90% 17% 2.3%
Independent elective care
Independent providers’ recording of ethnicity was poor, with 10% of records
not known and 27% not stated (see Table 4). The volume of activity in the
independent sector comprised 7% of elective activity overall, with volumes
being more significant for some types of activity.
Table 4: Ethnicity coding for elective inpatient care delivered in independent and NHS
providers, 2019/20
Provider type % not known
% not stated
% with valid ethnic
group
% with ‘other’ ethnic
group
% with ‘any other ethnic
group’
Independent 10% 27% 62% 2.8% 0.5%
NHS 4.3% 9.2% 86% 7.3% 1.7%
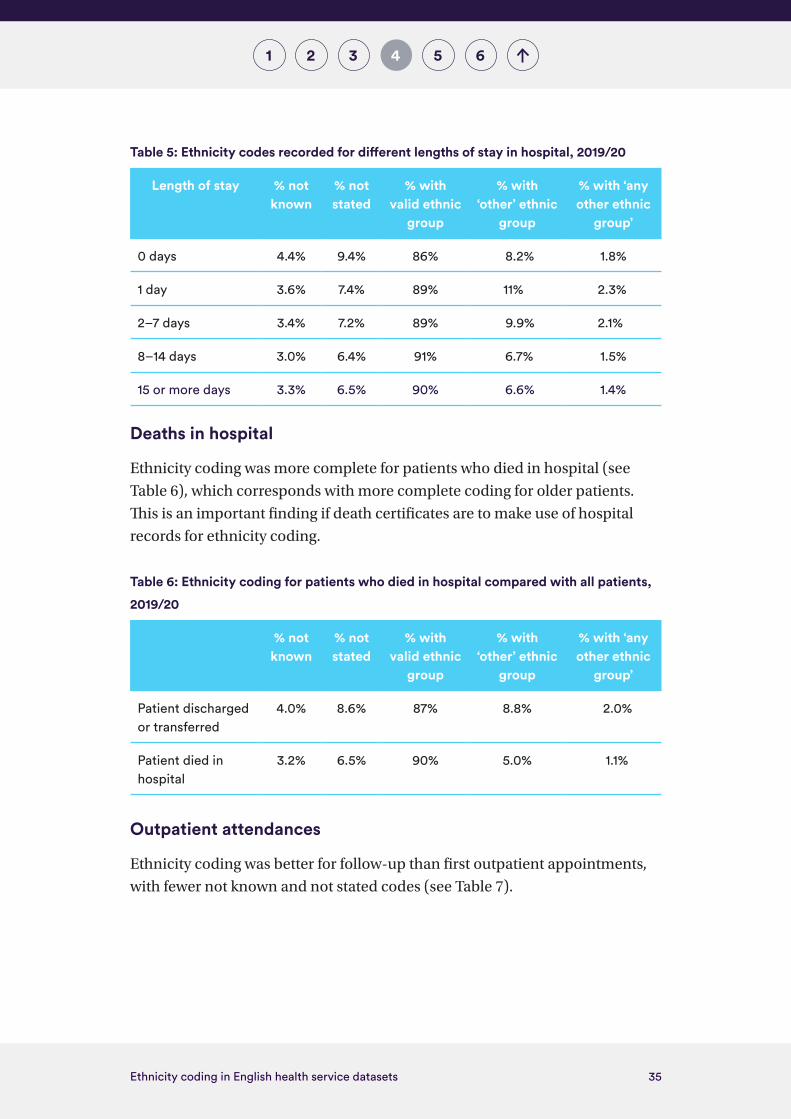
Length of stay in hospital
Shorter hospital stays were least likely to have a valid ethnic group recorded,
with 4.4% of spells recorded as not known and a further 9.4% as not stated
(see Table 5). This partly reflects shorter stays being more likely to be elective
admissions – as we saw earlier, elective admissions were less likely to have a
valid ethnic group. In addition, spells of one day and two to seven days were
more likely to have an ‘other’ ethnic group category than other lengths of stay.
35Ethnicity coding in English health service datasets
41 3 5 62
Table 5: Ethnicity codes recorded for different lengths of stay in hospital, 2019/20
Length of stay % not known
% not stated
% with valid ethnic
group
% with ‘other’ ethnic
group
% with ‘any other ethnic
group’
0 days 4.4% 9.4% 86% 8.2% 1.8%
1 day 3.6% 7.4% 89% 11% 2.3%
2–7 days 3.4% 7.2% 89% 9.9% 2.1%
8–14 days 3.0% 6.4% 91% 6.7% 1.5%
15 or more days 3.3% 6.5% 90% 6.6% 1.4%
Deaths in hospital
Ethnicity coding was more complete for patients who died in hospital (see
Table 6), which corresponds with more complete coding for older patients.
This is an important finding if death certificates are to make use of hospital
records for ethnicity coding.
Table 6: Ethnicity coding for patients who died in hospital compared with all patients,
2019/20
% not known
% not stated
% with valid ethnic
group
% with ‘other’ ethnic
group
% with ‘any other ethnic
group’
Patient discharged or transferred
4.0% 8.6% 87% 8.8% 2.0%
Patient died in hospital
3.2% 6.5% 90% 5.0% 1.1%
Outpatient attendances
Ethnicity coding was better for follow-up than first outpatient appointments,
with fewer not known and not stated codes (see Table 7).

36Ethnicity coding in English health service datasets
41 3 5 62
Table 7: Ethnicity recording for first and follow-up outpatient appointments, 2019/20
Appointment % not known
% not stated
% with valid ethnic
group
% with ‘other’ ethnic
group
% with ‘any other ethnic
group’
First 7.3% 13% 80% 9.6% 2.2%
Follow-up 5.0% 11% 84% 8.9% 2.0%
Coding quality differed according to the referral route, suggesting that
hospital administrative processes impact on data recorded (see Table 8). For
example, patients referred from another specialty had a higher proportion of
not stated codes than GP referrals, referrals from A&E and self-referrals. The
characteristics of patients following different referral pathways may also be a
factor, particularly for patients referred via A&E, for whom there was a higher
proportion of ‘other’ ethnic group coding.
Table 8: Ethnicity recording by the top four referral routes for outpatient appointments,
2019/20
% not known
% not stated
% with valid ethnic
group
% with ‘other’ ethnic
group
% with ‘any other ethnic
group’
GP referral (n = 38.8 million)
4.4% 11% 80% 9.1% 2.1%
Consultant referral, excluding A&E (n = 25.8 million)
6.5% 14% 84% 8.5% 1.9%
Self-referral (n = 4.1 million)
3.6% 7.3% 84% 11.% 2.8%
Referral from an A&E department (n = 3.5 million)
6.9% 9.1% 89% 14% 2.9%
Note: These four referral sources accounted for 75% of outpatient appointments.

37Ethnicity coding in English health service datasets
41 3 5 62
A&E attendances
Patients arriving at A&E by ambulance were more likely than patients arriving
via another route to have a valid ethnic group coded, and less likely to be
recorded in an ‘other’ group (see Table 9). Patients admitted to hospital from
A&E were similarly more likely to have a valid ethnic group than patients
discharged from A&E (see Table 10). Both these differences are consistent with
these patients being older and more acutely unwell.
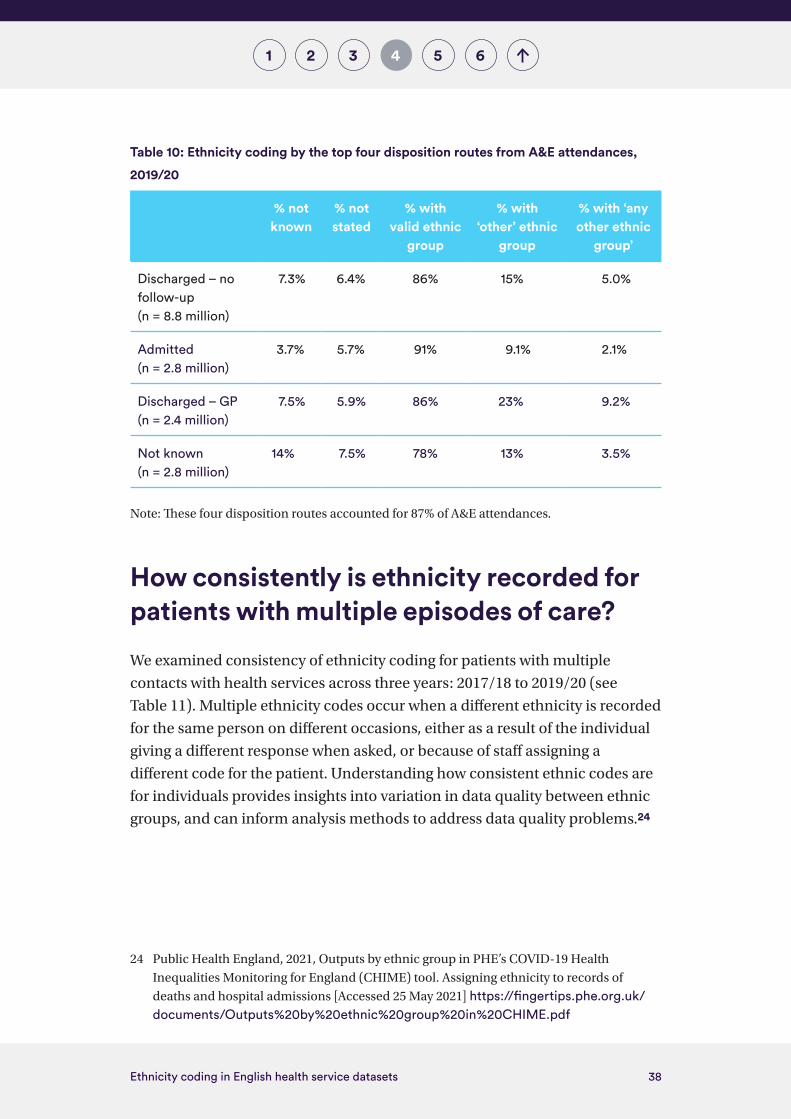
Patients whose disposition from A&E was not known also had a high
proportion of not known ethnicity coding recorded, suggesting overall poor
data quality with these records.
One in six patients discharged without follow-up had an ‘other’ ethnic group,
while the proportion was more than one in four for patients discharged with
GP follow-up. These higher proportions could reflect demographic differences
in patients using these services, as well as differences in the recording of
ethnicity in different service settings, for example between minor and major
A&E departments.
Table 9: Ethnicity coding by mode of arrival for A&E attendances, 2019/20
% not known
% not stated
% with valid ethnic
group
% with ‘other’ ethnic
group
% with ‘any other ethnic
group’
Ambulance 4.7% 6.3% 89% 8.5% 2.1%
Other 8.0% 6.1% 86% 16% 5.2%
38Ethnicity coding in English health service datasets
41 3 5 62
Table 10: Ethnicity coding by the top four disposition routes from A&E attendances,
2019/20
% not known
% not stated
% with valid ethnic
group
% with ‘other’ ethnic
group
% with ‘any other ethnic
group’
Discharged – no follow-up (n = 8.8 million)
7.3% 6.4% 86% 15% 5.0%
Admitted (n = 2.8 million)
3.7% 5.7% 91% 9.1% 2.1%
Discharged – GP (n = 2.4 million)
7.5% 5.9% 86% 23% 9.2%
Not known (n = 2.8 million)
14% 7.5% 78% 13% 3.5%
Note: These four disposition routes accounted for 87% of A&E attendances.
How consistently is ethnicity recorded for patients with multiple episodes of care?
We examined consistency of ethnicity coding for patients with multiple
contacts with health services across three years: 2017/18 to 2019/20 (see
Table 11). Multiple ethnicity codes occur when a different ethnicity is recorded
for the same person on different occasions, either as a result of the individual
giving a different response when asked, or because of staff assigning a
different code for the patient. Understanding how consistent ethnic codes are
for individuals provides insights into variation in data quality between ethnic
groups, and can inform analysis methods to address data quality problems.24
24 Public Health England, 2021, Outputs by ethnic group in PHE’s COVID-19 Health
Inequalities Monitoring for England (CHIME) tool. Assigning ethnicity to records of
deaths and hospital admissions [Accessed 25 May 2021] https://fingertips.phe.org.uk/documents/Outputs%20by%20ethnic%20group%20in%20CHIME.pdf

39Ethnicity coding in English health service datasets
41 3 5 62
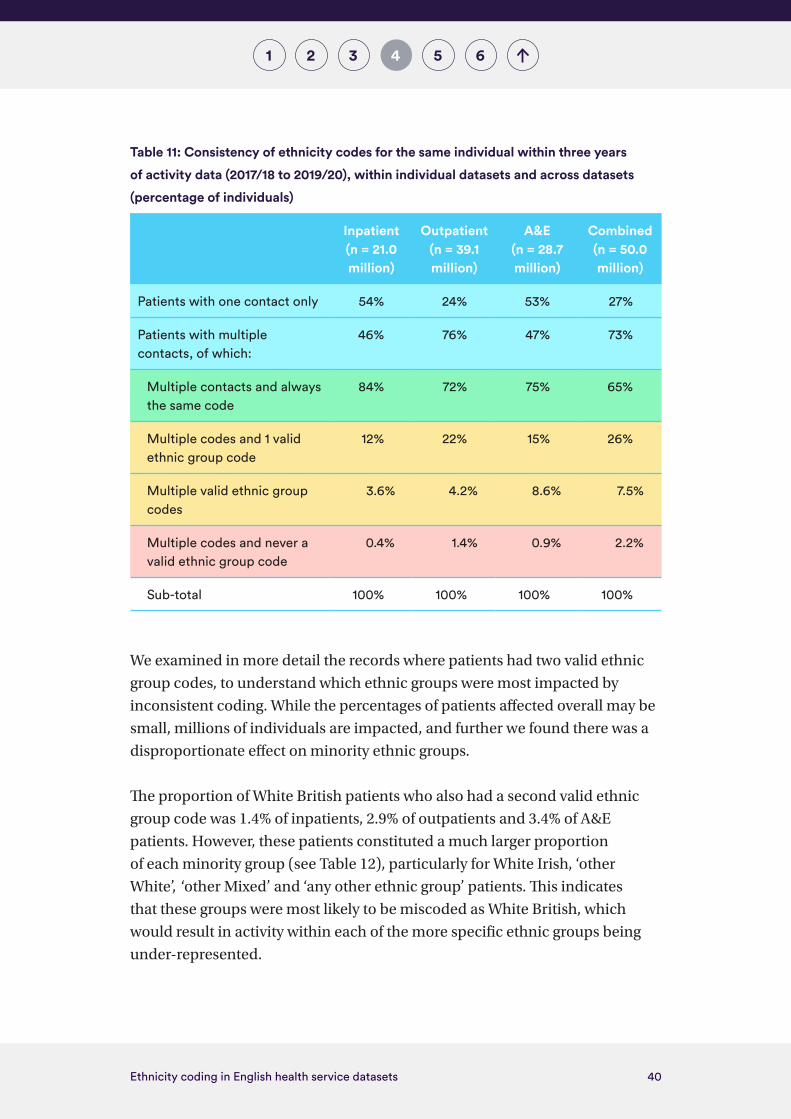
Just over half of inpatients and A&E attendees, and a quarter of outpatients
attendees, had only one contact with services over the three-year period,
so only one ethnicity code was recorded. Overall, almost three quarters of
patients had more than one contact.
Among inpatients with more than one contact, 84% had the same ethnicity
code across all hospital spells in the three years. The proportion of outpatient
and A&E attendees with consistent codes was lower, and across all datasets,
65% of patients had the same ethnicity code for all their contacts. These
levels of consistency were lower than between census returns for the
same individual, but in line with a comparison between NHS and other
data sources.9
In almost over a quarter of cases where patients had multiple codes, these
included multiple codes that contained only one valid ethnic group code
(ranging from 12% of inpatients to 22% of outpatients). More than one valid
code was recorded for between 3.6% (inpatients) and 8.6% (A&E) of patients
who had multiple valid codes.
40Ethnicity coding in English health service datasets
41 3 5 62
Table 11: Consistency of ethnicity codes for the same individual within three years
of activity data (2017/18 to 2019/20), within individual datasets and across datasets
(percentage of individuals)
Inpatient (n = 21.0 million)
Outpatient(n = 39.1 million)
A&E(n = 28.7 million)
Combined(n = 50.0 million)
Patients with one contact only 54% 24% 53% 27%
Patients with multiple contacts, of which:
46% 76% 47% 73%
Multiple contacts and always the same code
84% 72% 75% 65%
Multiple codes and 1 valid ethnic group code
12% 22% 15% 26%
Multiple valid ethnic group codes
3.6% 4.2% 8.6% 7.5%
Multiple codes and never a valid ethnic group code
0.4% 1.4% 0.9% 2.2%
Sub-total 100% 100% 100% 100%
We examined in more detail the records where patients had two valid ethnic
group codes, to understand which ethnic groups were most impacted by
inconsistent coding. While the percentages of patients affected overall may be
small, millions of individuals are impacted, and further we found there was a
disproportionate effect on minority ethnic groups.
The proportion of White British patients who also had a second valid ethnic
group code was 1.4% of inpatients, 2.9% of outpatients and 3.4% of A&E
patients. However, these patients constituted a much larger proportion
of each minority group (see Table 12), particularly for White Irish, ‘other
White’, ‘other Mixed’ and ‘any other ethnic group’ patients. This indicates
that these groups were most likely to be miscoded as White British, which
would result in activity within each of the more specific ethnic groups being
under-represented.
41Ethnicity coding in English health service datasets
41 3 5 62
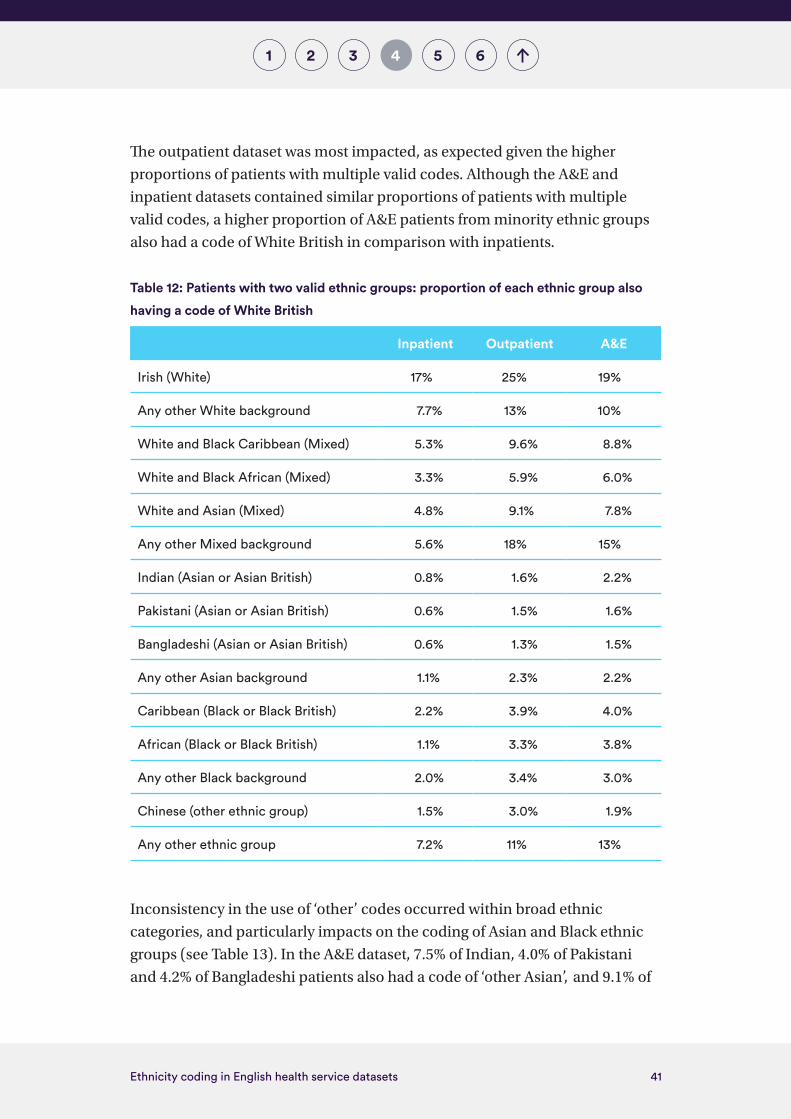
The outpatient dataset was most impacted, as expected given the higher
proportions of patients with multiple valid codes. Although the A&E and
inpatient datasets contained similar proportions of patients with multiple
valid codes, a higher proportion of A&E patients from minority ethnic groups
also had a code of White British in comparison with inpatients.
Table 12: Patients with two valid ethnic groups: proportion of each ethnic group also
having a code of White British
Inpatient Outpatient A&E
Irish (White) 17% 25% 19%
Any other White background 7.7% 13% 10%
White and Black Caribbean (Mixed) 5.3% 9.6% 8.8%
White and Black African (Mixed) 3.3% 5.9% 6.0%
White and Asian (Mixed) 4.8% 9.1% 7.8%
Any other Mixed background 5.6% 18% 15%
Indian (Asian or Asian British) 0.8% 1.6% 2.2%
Pakistani (Asian or Asian British) 0.6% 1.5% 1.6%
Bangladeshi (Asian or Asian British) 0.6% 1.3% 1.5%
Any other Asian background 1.1% 2.3% 2.2%
Caribbean (Black or Black British) 2.2% 3.9% 4.0%
African (Black or Black British) 1.1% 3.3% 3.8%
Any other Black background 2.0% 3.4% 3.0%
Chinese (other ethnic group) 1.5% 3.0% 1.9%
Any other ethnic group 7.2% 11% 13%
Inconsistency in the use of ‘other’ codes occurred within broad ethnic
categories, and particularly impacts on the coding of Asian and Black ethnic
groups (see Table 13). In the A&E dataset, 7.5% of Indian, 4.0% of Pakistani
and 4.2% of Bangladeshi patients also had a code of ‘other Asian’, and 9.1% of

42Ethnicity coding in English health service datasets
41 3 5 62
Black Caribbean and 7.6% of Black African patients also had a code of ‘other
Black’. Analysis for specific ethnic groups risks being incorrect if some activity
for these groups, for example Indians and Black Africans, is miscoded in
other categories.
Table 13: Patients with two valid ethnic group codes: proportion of each ethnic group
also having an ‘other’ code within the same broad ethnic category
Inpatient Outpatient A&E
Other WhiteBritish 0.7% 1.3% 1.3%
Irish 1.8% 3.1% 3.8%
Other Mixed
White and Black Caribbean
2.0% 4.1% 4.6%
White and Black African
1.6% 3.0% 3.9%
White and Asian 1.4% 2.7% 2.8%
Other Asian
Indian 3.2% 6.0% 7.5%
Pakistani 2.2% 4.6% 4.0%
Bangladeshi 2.1% 4.0% 4.2%
Other BlackBlack Caribbean 4.4% 7.5% 9.1%
Black African 3.3% 5.3% 7.6%
The ‘any other ethnic group’ category is a growing proportion of the
population. This group is appropriate for the many people in England who
do not self-identify with any of the specific or broad categories. However,
significant proportions of patients in this group also have an alternative valid
ethnic group code, ranging from a fifth of inpatients, to two-fifths of A&E
patients (see Table 14). Inconsistent coding in this group indicates over-
use of the ‘any other ethnic group’ code within NHS datasets, in line with
previous analysis.8

43Ethnicity coding in English health service datasets
41 3 5 62
Table 14: Patients with two valid ethnic groups: proportion of ‘any other ethnic group’
patients, by alternative ethnic group category
Inpatient Outpatient A&E
British 7.2% 11% 13%
Irish 0.2% 0.4% 0.4%
Any other White background 4.7% 7.8% 8.8%
White and Black Caribbean 0.2% 0.4% 0.4%
White and Black African 0.2% 0.3% 0.3%
White and Asian 0.3% 0.5% 0.3%
Any other Mixed background 0.8% 1.3% 1.7%
Indian 1.3% 2.1% 2.8%
Pakistani 0.9% 1.5% 1.4%
Bangladeshi 0.3% 0.5% 0.4%
Any other Asian background 2.4% 4.0% 4.8%
Caribbean 0.6% 1.0% 1.1%
African 1.2% 1.9% 2.5%
Any other Black background 0.7% 1.1% 1.9%
Chinese (other ethnic group) 0.3% 0.5% 0.4%
Sub-total (any other ethnic group patients with an alternative valid code)
21% 35% 40%
For health events for which there are multiple records for the same patient,
either within the same dataset or other datasets, there are opportunities to
use these data to enhance the analysis of ethnicity. This is discussed further in
Appendix 3.

44Ethnicity coding in English health service datasets
5 641 32
Discussion and conclusion
Our analysis has identified significant shortcomings in ethnicity coding in
widely used health datasets covering hospital inpatients, outpatients and A&E
attendances. We found:
• data quality problems, including incomplete ethnicity coding and invalid
and inconsistent use of codes, which disproportionately affect the records
of minority ethnic patients
• an excessive and growing proportion of patients who have their ethnicity
recorded as not known, not stated or ‘other’
• systemic biases in data quality – for example, data quality is worse in
London, for adults of working age and for patients with short hospital stays.
These, and the other data quality problems identified, will impair the validity
of any epidemiological analyses of ethnic differences. Coding biases will feed
into the results, leading to systematic underestimation or overestimation
of rates for minority ethnic groups. As a result, health issues affecting those
communities may be missed, or their severity underestimated.
We found important differences in ethnicity coding between datasets, by age,
region and deprivation and along patient pathways. These differences could
arise from how different ethnic groups access services. However, unravelling
these factors from data quality issues is complex, particularly because
there are also limitations in current estimates of the ethnic distribution of
the population. Data from the 2021 census, when available, will be vital to
understanding the ethnic composition of local populations, and also improve
assessments of health data quality.
5

45Ethnicity coding in English health service datasets
5 641 32
Our findings have two important implications for the analysis of, and decision-
making about, ethnicity and health, and how data can be used as an enabler to
identify and reduce inequalities in health:
• Making the best use of available data. Given the data quality issues we
have identified, users of data need to be aware that analysis using the
data as released will overcount some categories of patients (particularly
those in ‘other’ ethnic categories) and therefore undercount activity
for those in specific minority ethnic categories. They therefore need to
consider data quality when undertaking analysis by ethnic group (see
Box 2). Understanding and reporting on the quality of ethnicity data are
essential. Analysis should also consider methods to address data quality
issues, including using ethnicity codes from other service contacts for the
same person.
• Looking ahead, improving the underlying quality of data. Urgent action
is also required to address poor data quality in terms of ethnicity coding
at source – when NHS organisations and GPs collect and record data from
patients. This will remove/reduce the need for reassigning ethnicity codes
in health records. Moreover, with legislation expected that will introduce
ethnicity codes at death registration, there is a window of opportunity to
improve coding quality now, which will avoid poor data quality in health
records being transferred to mortality records.
These improvements are essential for enabling ethnic disparities in health to
be understood and addressed in the future.
Our analysis also points to areas for further research, including:
• understanding the barriers for patients and staff at the point at which
ethnic origin is asked of patients, and why ‘other’ categories are used
• identifying and addressing systemic barriers to how ethnicity data are
collected in the NHS, including processes and information systems,
learning from differences identified between patient groups
• learning from organisations that have more complete and accurate data, to
inform best practice in capturing and using ethnicity data

46Ethnicity coding in English health service datasets
5 641 32
• investigating data quality issues in other NHS datasets, including those in
primary care, mental health and social care
• evaluating options to address data quality issues using linked data,
including data from the 2021 census when these are available.
Box 2: Key issues for users of ethnicity data to consider during analysis of the data
1. Completeness of data: check and report on proportions of not stated and ‘other’ categories, as well as missing or not known ethnic group codes.
2. Level of disaggregation: use the most granular ethnic groups possible within your dataset, after taking account of the volume of data. If broad ethnic categories (for example, Black or Asian) are used, discuss the limitations of this approach.
3. ‘Other’ categories: if using specific ethnic groups (for example, Black African, Pakistani), consider the size of the ‘other Black’, ‘other Asian’ and ‘other White’ categories, and whether the miscoding of specific ethnic group categories will distort your analysis.
4. Consider biases in ethnic coding which will affect your results, including age and gender differences, regional differences (especially for London), differences in patient pathways (for example, elective versus emergency pathways) and outcomes, and poor data quality from independent providers.
5. Be cautious in comparing changes over time – as well as increasing proportions of records with not stated and ‘other’ categories, there may have been sudden changes in coding as a result of changes in datasets.
6. Where data for the same individual can be linked (either within or between datasets), investigate the consistency of recording, and whether reassigning ethnicity codes will enhance the analysis (see Appendix 3).

47Ethnicity coding in English health service datasets
6541 32
Recommendations
Responsibility for the coding and quality of ethnicity data in health records is
dispersed across a number of organisations, national and local, including the
Department of Health and Social Care, NHS England and NHS Improvement,
NHS Digital, NHS organisations and GPs. All have a role to play in improving
the quality of the ethnicity data available for analysing and addressing ethnic
inequalities in health.
Our recommendations relate to:
• improving the analytical potential of currently available data,
notwithstanding the associated data quality problems (short term)
• improving the quality of the underlying source data (medium term).
To improve the analysis of ethnicity using existing health data, we recommend
the following:
• NHS Digital regularly publishes data on the quality of ethnicity coding
within the Data Quality Maturity Index and this should also include the
proportion of records coded as not known, not stated, an ‘other’ group and
‘any other ethnic group’.
Action: NHS Digital
• The UK Statistics Authority should review the quality of ethnicity coding
within health statistics, in order to identify and make recommendations for
improving the quality and consistency of data.
Action: UK Statistics Authority
• Analyses of health care activity should routinely include the ethnic
dimension, and consider and report on the quality of coding.
Action: Data analysts and users
• Analysis methods to address data quality issues in analysis of ethnic
differences should be clearly described and, where appropriate and
6

48Ethnicity coding in English health service datasets
6541 32
feasible, the methodology developed by Public Health England for
reassigning ethnicity in health records should be used.
Action: Data analysts and users
To improve the quality of source data on ethnicity in the future, we
recommend the following:
• The Health Inequalities Improvement Programme at NHS England and
NHS Improvement should work with NHS Digital and the NHS Race
and Health Observatory on developing and implementing guidance for
ethnicity coding in the NHS, in keeping with priority 3 of the NHS England
and NHS Improvement operational guidance2. Guidance needs to cover
NHS-funded care, wherever this is provided, and include protocols for
asking patients their ethnicity and recording it in health records, using the
updated 2021 census categories.
Action: NHS England and NHS Improvement
• Integrated care system leaders should use their role to reduce inequalities
to improve the quality of ethnicity coding in health records, ensuring
that the updated guidance on ethnicity coding is implemented, and
learning from local partners and spreading best practice in data quality
and analysis.
Action: Integrated care system leaders
• Boards and leaders of NHS providers and commissioners, and GP
practices, should take ownership of the quality of ethnicity coding for their
patients, ensure that the updated guidance is implemented, routinely
monitor the quality of coding, identify how it can be improved, and put
in place actions to achieve this. Once guidance on ethnicity coding is
available, all health care providers should endeavour to record/update/
correct ethnicity coding in all patient records.
Action: All NHS providers and commissioners, and GP practices
• The Care Quality Commission should incorporate the assessment of the
quality of ethnicity coding in its inspections and ratings, and address
independent providers’ poor-quality coding, taking action where
the data suggest possible shortfalls and a failure to implement the
updated guidance.
Action: Care Quality Commission
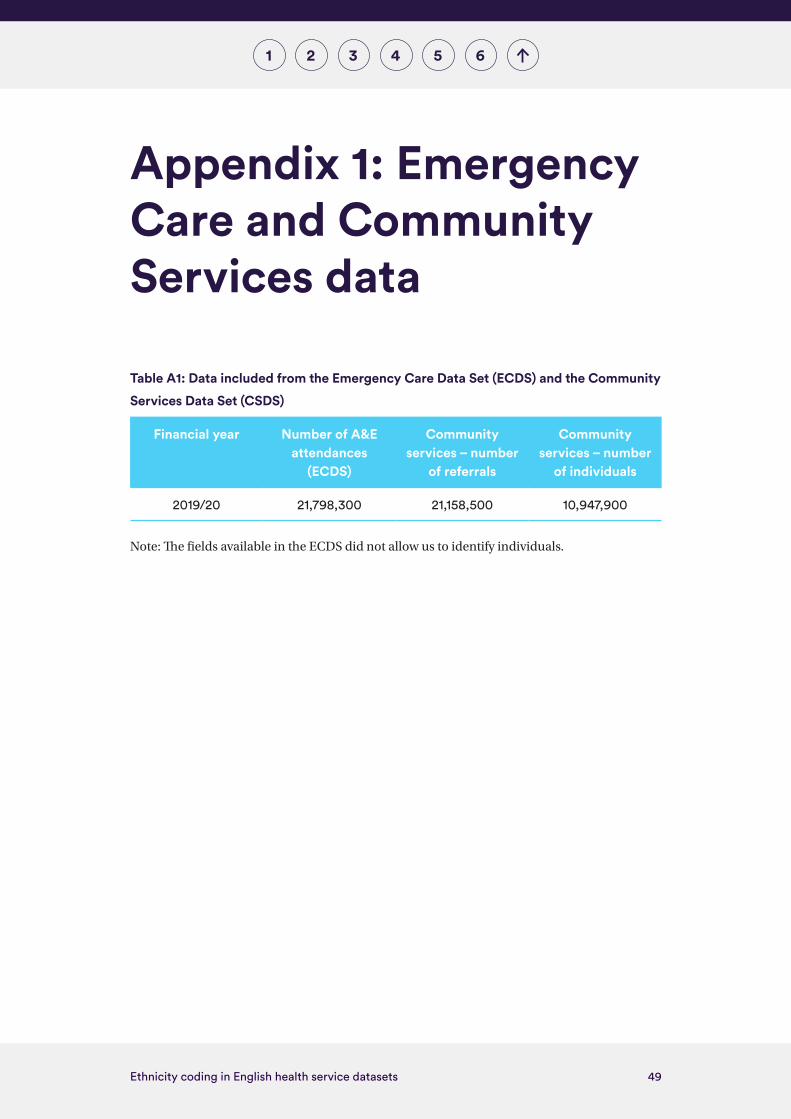
49Ethnicity coding in English health service datasets
1 2 3 4 5 6
Appendix 1: Emergency Care and Community Services data
Table A1: Data included from the Emergency Care Data Set (ECDS) and the Community
Services Data Set (CSDS)
Financial year Number of A&E attendances
(ECDS)
Community services – number
of referrals
Community services – number
of individuals
2019/20 21,798,300 21,158,500 10,947,900
Note: The fields available in the ECDS did not allow us to identify individuals.

50Ethnicity coding in English health service datasets
1 2 3 4 5 6
Appendix 2: Population estimates for ethnic groups
In order to interpret the distribution of ethnicity codes within NHS datasets,
we would ideally compare the distribution with the ethnic composition of the
general population. However, there is currently no ‘gold standard’ for such a
comparison and estimates of the ethnic composition of the population vary
between sources (see Table A2).
The most recent census data are from 2011, so will not reflect significant
migration into and out of England in the past decade, or differential rates of
births and deaths between ethnic groups.
The most recent population estimates by ethnic group published by the ONS,
accounting for the ageing of the population and migration since the 2011
census, are for 2018. We have used these in our analysis because they are
available by age group, and for individual ethnic groups. However, it should
be noted that they show a higher proportion of non-White minority ethnic
population groups than other estimates: the Annual Population Survey, and
estimates from a linked dataset used for analysing Covid-19 mortality.
The Annual Population Survey is not available for individual White, Mixed and
Black ethnic groups.

51Ethnicity coding in English health service datasets
1 2 3 4 5 6
Table A2: Percentage of the population of England, by ethnic group
2011 2018 2020
Census Population estimate
Annual Population
Survey
Population estimate
Annual Population
Survey
Covid-19 linked
dataset
White 86% 84% 89% 85% 87% 86%
Mixed/multiple ethnic group
2.2% 2.8% 0.9% 2.2% 1.5% 2.1%
Indian 2.5% 2.7% 2.9% 2.6% 3.2% 2.6%
Pakistani 2.0% 2.3% 1.3% 2.1% 1.4% 2.1%
Bangladeshi 0.8% 0.9% 0.5% 0.8% 0.6% 0.8%
Chinese 0.7% 0.7% 0.5% 0.7% 0.6% 0.6%
Any other Asian background
1.5% 1.6% 1.1% 1.5% 1.2%
Black/African/Caribbean/Black British
2.9% 3.8% 2.6% 3.5% 3.2% 2.7%
Other ethnic group (including other Black)
2.5% 1.1% 1.5% 1.0% 1.5%
Other ethnic group (including other Black and any other Asian)
2.6%
Sources: 2011 census,25 Annual Population Survey, 26 2018 population estimates22 and a
Covid-19-linked dataset. 27
25 UK Government (2020) ‘Population of England and Wales, 2020’. www.ethnicity-facts-figures.service.gov.uk/uk-population-by-ethnicity/national-and-regional-populations/population-of-england-and-wales/latest#by-ethnicity. Accessed 11 May 2021.
26 NOMIS (2021) ‘Annual population survey – regional – ethnicity by industry’.
www.nomisweb.co.uk/datasets/aps180. Accessed 11 May 2021.
27 Office for National Statistics (2021) ‘Coronavirus (COVID-19) related deaths
by ethnic group, England and Wales methodology’. www.ons.gov.uk/peoplepopulationandcommunity/birthsdeathsandmarriages/deaths/methodologies/coronaviruscovid19relateddeathsbyethnicgroupenglandandwalesmethodology.
Accessed 11 May 2021.
52Ethnicity coding in English health service datasets
1 2 3 4 5 6
Appendix 3: Options to enhance ethnicity coding using linked data
Why might linked data be used?
Linking records for the same person from different health datasets, or with
other sources, can enable analysis of ethnic differences in health to be
undertaken that would otherwise not be possible. The ONS is using census
records to ascribe the ethnicity of people who have died, in order to undertake
analysis of mortality by ethnic group, and. Public Health England routinely
use hospital data to allocate ethnicity to health related datasets. Given the
gaps and biases in ethnic group coding, there is a strong case for taking steps
to address them. Undertaking analysis without doing this will not produce
reliable findings, and will undermine the action needed to address ethnic
disparities in health.
Issues and challenges
However, there are a number of issues and challenges in linking data, both
ethical and practical.
As discussed above, ethnicity is a self-identified characteristic. Individuals
can choose to not state their ethnicity, or identify as an ‘other’ ethnic
category, if this is the option that best represents how they identify at the
time of data collection. Using data for the same person, but a different data
source or health record, could be counter to an individual’s identification
of their ethnicity. However, our analysis strongly suggests evidence of some
miscoding of ethnicity, for example where ethnic codes differ for patients
with multiple contacts with health services or where the over-representation
of ‘other’ groups distorts the results. Where the aims of analysis are to

53Ethnicity coding in English health service datasets
1 2 3 4 5 6
support population health improvement, it could be argued that the public
health benefits support the case for reassigning ethnicity to correct for
such miscoding.
In practical terms, there are significant challenges in deciding how to
approach data linkage and the potential reallocation of ethnic codes. The
most appropriate method will depend on what data sources are available and
the aims of analysis. The ONS is responsible for carrying out the census and
therefore has access to it, and when 2021 census data are available, this will
provide the ‘gold standard’ of comprehensive self-reported ethnicity for the
population. Other organisations without access to personal census records
may have access only to additional health datasets – for example, NHS Digital
has linked inpatient and GP records to obtain additional ethnicity codes.
PHE have recently started using ethnicity from multiple records for the same
person, to reduce the number of cases where ethnic group is not known, not
stated or is categorised as ‘any other ethnic group’. 24

Nuffield Trust is an independent health think tank. We aim to improve the quality of health care in the UK by providing evidence-based research and policy analysis and informing and generating debate.
59 New Cavendish StreetLondon W1G 7LPTelephone: 020 7631 8450www.nuffieldtrust.org.ukEmail: [email protected]
Published by the Nuffield Trust.© Nuffield Trust 2021. Not to be reproduced without permission.ISBN: 978-1-9-10953-88-4
Design by Soapbox: soapbox.co.uk
Related Documents