ETHNICITY AND PAIN: AN EXPLORATION OF THE EXPRESSION OF PAIN AMONG FOUR ETHNIC MINORITY GROUPS IN CANADA by Prinon Rahman Submitted in partial fulfilment of the requirements for the degree of Master of Science at Dalhousie University Halifax, Nova Scotia December 2015 © Copyright by Prinon Rahman, 2015

Welcome message from author
This document is posted to help you gain knowledge. Please leave a comment to let me know what you think about it! Share it to your friends and learn new things together.
Transcript

ETHNICITY AND PAIN AN EXPLORATION OF THE EXPRESSION OF PAIN AMONG FOUR ETHNIC MINORITY GROUPS IN CANADA
by
Prinon Rahman
Submitted in partial fulfilment of the requirements for the degree of Master of Science
at
Dalhousie University Halifax Nova Scotia
December 2015
copy Copyright by Prinon Rahman 2015
ii
DEDICATION
I would like to dedicate this thesis to my mother and father Nazma Rahman and Dr Aminur Rahman
and to my mentors Dr Lucie Brosseau Wilma Jelley and Gisegravele Morin-Labatut
iii
TABLE OF CONTENTS
LIST OF TABLES v
LIST OF FIGURES vi
ABSTRACT vii
LIST OF ABBREVIATIONS USED viii
GLOSSARY ix
ACKNOWLEDGEMENTS x
CHAPTER 1 INTRODUCTION 1
CHAPTER 2 BACKGROUND 3
21 Definition of Terms 3
211 Nature of Pain 3
212 Prevalence of Pain 4
213 Gender Ethnic and Cultural Differences in Pain 4
214 Defining Ethnic Minority and Visible Minority Groups 5
215 The Study Populations and Pain Expression 5
22 Literature Review Chronic Pain and Ethnicity 9
221 Introduction 9
222 Methods 9
223 Inclusion and Exclusion Criteria 9
224 Results 18
23 Analytical Framework 20
24 Objectives and Research Questions 26
241 Objectives 26
242 Research Questions 26
CHAPTER 3 METHODOLOGY 27
31 Study Design Questionnaire and Data Collection 27
32 CCHS Sample Power and Sample Sizes 27
33 Study Variables 28
331 The Dependent Variables 28
332 The Independent Variables 29
34 Data Analysis 32
CHAPTER 4 RESULTS AND ANALYSIS 36
iv
41 Descriptive Statistics about the Four EM Groups 36
42 Clinical Factors 38
43 Psychological Characteristics 38
44 Acculturation Characteristics 39
45 Chronic Pain Prevalence among White Canadians and Four EM Groups (Objective 1) 40
46 The Differences in Pain Expression Pain Intensity and Activity Limitation among the Four EM
Groups (Objective 2) 41
461 Data Quality Assurance 42
462 Acculturation and Chronic Pain Experience 43
47 Bio-Psychosocial Factors and Pain Experience (Objective 3) 44
471 Psychological Factors and Chronic Pain Experience 44
472 Socio-Demographic Factors and Chronic Pain 48
CHAPTER 5 DISCUSSION 56
51 Key Findings and Comparisons with the Extant Literature 56
511 Objective 1 Pain Expression among White Canadians and the Combined four EM Groups 56
512 Objective 2 Pain Expression Among the Four EM Study Groups in Canada 57
513 Objective 3 Psychological and Socio-Demographic Factors Associated with Pain among the our
EM Groups 59
52 Findings in Relation to the Theoretical Framework 61
53 Strengths and Limitations of this Study 62
531 Strengths 62
532 Limitations 62
54 Implications Conclusions and Future Research Directions 63
541 Implications 63
542 Conclusions 64
543 Future Research Directions 64
REFERENCES 65
APPENDICES 83
v
LIST OF TABLES
Table 21 Inclusion and Exclusion Criteria 10
Table 2 2 Cross-sectional Studies on Ethnic Minorities Pain Measurement and Prevalence of Pain 11
Table 2 3 Longitudinal Studies on Ethnic Minorities Pain Measurements and Prevalence of Pain 17
Table 2 4 The Biological Psychological and Socio-environmental Factors Included in Previous Pain
literature based on the 21st century field framework 24
Table 2 5 The biological psychological and socio-environmental factors included in previous pain
Literature Based on the Bio-psychosocial framework 24
Table 31 Grouping of Ethnic Minorities From the Second Variable 31
Table 41 The Socio-Demographic Environmental Characteristics of the Study Sample by
EM Status 37
Table 42 Clinical Factors of the Study Sample by EM status 38
Table 43 Psychological Characteristics of the Study Groups by EM Status 39
Table 44 Acculturation Factors and EM Groups 40
Table 45 EM Groups by Acculturation Levels 40
Table 46 Chronic Pain in the Four Em Groups and White Canadians 40
Table 47 Chronic Pain in the Four Ethnic Minority Groups 41
Table 48 Odds Ratio of Reproting Being Free of Pain Pain Intensity and Activity Limitation by EM
Groups and Accultruration 42
Table 49 Chronic Pain in Four EM Groups Limited to those with Chronic Conditions 42
Table 410 Acculturation and Chronic Pain Intensity and Activity Limitation by each EM Group 43
Table 411 Odds Ratio of Chronic Pain in EM Group when Adjusted for Psychological Factors 45
Table 412 Odds Ratio of Chronic Pain in EM Group when Adjusted for Psychological Factors and
Acculturation 46
Table 413 Odds Ratio of Chronic Pain in EM Group when Adjusted for all Psychological Factors 47
Table 414 Odds Ratio of Chronic Pain in EM Group when Adjusted for Socio-Demographic
Factors 50
Table 415 Odds Ratio of Chronic Pain in EM Groups when Adjusted for Socio-Demographic
Factors and Acculturation 52
Table 416 Odds Ratio of Chronic Pain in EM Groups when Adjusted for all Socio-Demographic
Factors 54
Table 417 The Odds Ratio of Chronic Pain when adjusting for Psychological and
Socio-Demographic Variables 55
vi
LIST OF FIGURES
Figure 2 1 The Determinants of Health Realm of the 21st Century Field Framework 22
Figure 2 2 The Bio-Psychosocial Approach to Chronic Conditions 23
Figure 2 3 Modified Bio-Psychosocial Framework 25
Figure 31 The Pain Outcome Variable from the CCHS 29
Figure 32 The Simple Logistic Regression Models to Test the Association between Chronic Pain
Expression and EM Groups 33
Figure 33 Simple Logistic Regression Models to Test the Association between High vs Low Chronic
Pain Intensity and EM groups 34
Figure 34 Simple Logistic Regression Models to Test the Association between Number of Activities
Affected (preventedcurtailed) due to Chronic Pain and EM groups 34
vii
ABSTRACT Introduction Approximately one in five Canadian adults suffers from chronic pain a condition which has been associated with reduced quality of life reduced psychological adjustment increased disability potential for reduced income and high levels of healthcare utilization A recent review of the literature has shown that the profile of pain reporting appears to be different in ethnic minority (EM) populations As Canada increasingly becomes a multiethnic society with an influx of immigrants from non-European and non-English speaking countries it is important for the healthcare system to consider socio-cultural factors related to diagnosis and treatment in order to optimize health outcomes While much has been done in health and social services to accommodate the diverse needs of the Canadian population as a whole very little research has sought specifically to investigate pain among different EM populations Presently it appears that no research exists investigating the experience of pain in different EM populations This research gap may contribute to differences in pain assessment treatment and outcomes contributing to perceived differences in quality of healthcare and in health status Objectives The three objectives for this study were 1) to report the differences in chronic pain expression between White Canadians and EM Canadians who self-reported as South Asian Middle Eastern East Asian or Black Canadians 2) to investigate whether there were differences in the prevalence of chronic pain (the primary dependent variable) pain intensity and activity limitation (the secondary dependent variables) among Middle Eastern South Asian Black and East Asian EM groups in Canada 3) to explore the association between the bio-psychosocial risk factors (including acculturation) and chronic pain among the members of the four EM groups who reported chronic pain Methods An exploratory secondary data analytical study was conducted using cross-sectional data from Canadian Community Heath Survey (years 2007-2013) The study sample included Canadians who self-reported as Black or with origins in South Asia the Middle East Africa and East Asia Three variables related to being free of pain and discomfort were analysed Chronic pain prevalence pain intensity and pain interference with daily activity were described for Canadian EM and majority (non-Hispanic white) populations Logistic regression models were used to analyse the factors associated with pain expression intensity and interference with normal activity To explore the association between psychological and social factors associated with chronic pain expression the research used a bio-psychosocial framework of pain expression adapted from the Determinants of Health The 21st Century Field Framework and the Bio-psychosocial Framework presented by Gatchel et al 2010 These frameworks have been used in previous pain literature Results Chronic pain was found to be reported significantly more often by White Canadians (193 95CI 169-216) compared to the combined four EM groups (131 95CI 108-154) Severe pain intensity was also reported statistically significantly more often by White Canadians (173 95CI 163-181) compared to all EM groups (130 95CI 106-153) Logistic regression revealed inter-ethnic differences in pain intensity reporting where the odds of the East Asian group experiencing lsquohighrsquo pain intensity was 047 (95CI 031-069) times the odds of the Black Canadians group Even after adjusting for the combination of psychological and socio-demographic factors from the framework this group still had significantly reduced odds of reporting lsquoseverersquo pain intensity (OR 038 95 CI022064) compared to Black Canadians Multivariable analysis found self-reported mental health depression anxiety alcohol frequency sex age and marital status to be associated with pain expression among these four EM groups Conclusion Understanding and accurately measuring pain in EM groups requires high levels of lsquocultural competencersquo in healthcare professionals When assessing chronic pain specific attention should be given when working with highly acculturated EM groups who have immigrated and lived in Canada for more than 10 years
viii
LIST OF ABBREVIATIONS USED
Abbreviation Descriptions
CCHS
EM
Canadian Community Health Survey
Ethnic Minority
mHAQ The Modified Health Assessment Questionnaire
MPI McGill Pain Intensity
MPQ McGill Pain Questionnaire
VAS Visual Analogue Scale
RMDQ Rolland Morris Disability Questionnaire
StatsCan Statistics Canada
WOMAC The Western Ontario and McMaster Universities Arthritis Index
ix
GLOSSARY
Term Definition
Acculturation The process by which the members of a culture may acquire the norms and values
of another (host) culture (Berry 1989)
Chronic Pain
Chronic pain for the purposes of this study is described as pain or bodily hurt
that has lasted for three months or greater Chronic pain is felt from week to week
It may be there all the time come and go from day to day or get worse or better
based on activities Chronic pain can have a significant negative impact on quality
of life
Ethnicity An easily identifiable characteristic that implies a common cultural history with
others possessing the same characteristic The most common ethnic lsquoidentifiersrsquo
are race religion country of origin language andor cultural background
Pain The IASP definition of pain is ldquoan unpleasant sensory and emotional experience
associated with actual or potential tissue damage or described in terms of
such damagerdquo (IASP 2011)
x
ACKNOWLEDGEMENTS
First and foremost I would like to thank my supervisor Dr Swarna Weerasinghe for her
supervision throughout my years in graduate school Thank you Swarna for your dedication
Many thanks must also go to my thesis committee members Dr Jill Hayden has been an
important contributor to my academic and research development Her attention to detail was essential
in shaping this document and her tactful feedback was always appreciated Thanks to Dr Sherry
Stewart for her very helpful feedback on my dissertation Her expertise in psychology was invaluable
to my work
I would like to now take a moment to recognize my mentors they are the reason Irsquom where I am
today My profound gratitude goes to my academic mother Dr Lucie Brosseau ndash I could never have
completed my masterrsquos degree without your constant guidance I must thank you for taking me under
your wing and providing continuous support and encouragement (and lets not forget all the gifts
cards and care packages you sent me during the last two years) I would like to thank my Aunt Gisegravele
Morin-Labatut who spent hours reading and editing my document to help me shape it into something
that I can be proud of Thank you Gisegravele Aunty for supporting me throughout the process of
completing this dissertation I also want to thank my dear friend Roah Merdad for her easy ability to
help me solve my problems and for being there to point out that a lot of my problems were not
problems at all Thank you Roah you have become like a sister to me and I admire the way you can
calm me in any stressful situation
My sincere appreciation to Dr Kathy MacPherson Ms Tina Bowdrige and Ms Jodi Lawrence
you are without a doubt the heroes of what makes this program so great Thanks to my CHampE friends
and colleagues for their support and encouragement I hope that we will continue to keep in touch
throughout the years Thank you to Ms Heather Hobson the research analyst at the ARDC I will
always remember all the hours you sat with me every time I came across a problem over the summer
I would have never been able to analyse my results without your help and support
Finally I want to express my deepest gratitude to my parents for believing in me and supporting
me Amma you are the strongest woman I know and my greatest role model and inspiration
Abba your support and understanding have been crucial throughout my masterrsquos program I love you
both
1
CHAPTER 1 INTRODUCTION
Pain often constitutes the first indication of illness and is a frequent complaint brought to the
attention of healthcare professionals Approximately 20 of Canadians report having experienced
chronic pain a condition which has been associated with reduced quality of life reduced psychological
adjustment increased disability potential for reduced income and high levels of healthcare utilization
(Lynch 2011 Moulin et al 2002 Reitsma et al 2011)
Pain is a complex phenomenon in terms of both sensory and emotional experiences and is
extremely variable even among homogenous populations In 1969 anthropologist Mark Zborowski
who studied pain expression in first and second generation Americans of Jewish Italian and Irish
descent and third and fourth generation White American Protestants put forward the idea that pain is
not only a neurological or physiological experience but it is also a cultural and social one Zborowski
found that each ethnic group had patterns of attitudes and reactions to pain that were particular to that
group A large body of pain literature suggests that diverse biological psychological and socio-cultural
factors are associated with racial and ethnic disparities in pain prevalence and reporting (Campbell et
al 2005 2008 Edwards et al 2001 Green et al 2003 Rahim Williams et al 2007 Moore amp
Brodsgrard 1999)
This literature is complemented by research primarily from the USA that examines the
prevalence of pain amongst different ethnic groups The majority of these studies have considered
African-American and Hispanic populations (Carey et al 2010 Carlisle 2014 Drwecki Moore Ward
amp Prkachin 2011 Meghani amp Cho 2009b Portenoy Ugarte Fuller amp Haas 2004) My own literature
review revealed that both African-Americans and Hispanics reported a greater burden of pain and
pain-related suffering compared to non-Hispanic Whites (Green et al 2003 Green amp Hart-Johnson
2010 Nguyen et al 2005 Parmelee et al 2012 Portenoy et al2004) Three population studies in
the UK suggested differences in pain prevalence among South Asian immigrant men and women and
the general UK population (Ezenwa et al 2006 Fortier et al 2009)
There is also clinical evidence suggesting that African Americans have greater pain sensitivity
For example one systematic review investigating ethnic group differences in pain experience found
consistent evidence indicating that African American populations demonstrate lower pain tolerance
higher pain rating and lower pain threshold than non-Hispanic White Americans (Rahim‐Williams et
al 2012) The differences in pain reporting have been attributed to the rare allele gene OPRM1
A118G SNP which is substantially less frequent in African Americans and has been associated with
reduced pain sensitivity (Rahim‐Williams et al 2012) In spite of this evidence of important cultural
differences in pain experience from studies in the USA it appears that no published studies have
examined pain prevalence among or between Canadian ethnic groups
2
Research Rationale
To develop good healthcare policies and guidelines for chronic pain in Canada studies of pain
expression1 in Canadian ethnic minority groups are sorely needed There is strong clinical evidence to
suggest that raceethnicity contributes significantly to variability in pain response across most pain
stimulus modalities (Campbell et al 2008 Chan et al 2013 Edwards amp Fillingim 1999 Hastie et al
2012 Rahim‐Williams et al 2012) The present study investigated the prevalence of pain among four
Canadian ethnic minority groups to determine whether statistically significant differences in pain
expression and pain severity exist There is also a need to identify and understand the relevant factors
that are associated with pain expression by Canadian ethnic minority groups I examined pain
expression using a bio-psychosocial framework that suggests that the experience of pain is shaped
by interactions among psychological and social variables and that all of these factors vary with an
individualrsquos ethnic status Biological variables were considered only for data quality assurance I also
included an acculturation scale using two variables 1) languages most often spoken at home and 2)
time spent in Canada While other studies have adjusted for certain variables related to acculturation
(eg immigrant status) most have not considered acculturation in when investigating differences in
pain expression among ethnic minority groups My thesis research however included acculturation in
the bio-psychosocial framework and tested whether acculturation was statistically significantly
associated with pain expression among ethnic minority groups To provide optimal treatment to an
ethnically diverse population healthcare practitioners need to understand the bio-psychosocial factors
associated with pain expression among ethnic minority groups Presently there is no published
literature that examines the reporting of different levels of pain (pain intensity) and the bio-
psychosocial factors associated with it for Canadian ethnic minority groups In this study sample data
from the four largest Canadian ethnic minority groups ndash African Canadians South Asian Canadians
Middle Eastern Canadians and East Asians Canadians ndash were analysed in an effort to address the
research gap on the relationships between 1) pain expression pain intensity daily activity limitation
due to pain and ethnic minority status and the 2) factors contributing to reporting differences across
ethnic minority groups
1 Throughout this document the term lsquopain expressionrsquo has been used as it has a more general connotation than the narrower concept of lsquopain reportingrsquo
3
CHAPTER 2 BACKGROUND
This chapter will provide working definitions for pain and ethnic minority status and a description
of the study populations It will also describe the two theoretical frameworks that were combined to
create an lsquoAdjusted Bio-psychosocial Framework of Pain Expressionrsquo for the research This framework
was used to determine the variables needed for the analysis of pain expression and prevalence
among the four ethnic minority groups The section will then present a literature-based discussion of
the prevalence economic burden and psychological cognitive and behavioural aspects of pain
followed by a rationale for the choice of the four ethnic minority groups It will conclude with a
discussion of how gender ethnicity and culture may influence pain prevalence
21 Definition of Terms
211 Nature of Pain
Pain is a complex and multi-dimensional experience (Goulet et al 2013) The International
Association for the Study of Pain (IASP) has defined it as ldquoan unpleasant sensory and emotional
experience associated with actual or potential tissue damage or described in terms of such damagerdquo
(Merskey amp Bogduk 1994) Furthermore pain is considered to be subjective because each individual
learns how to express it through personality cultural variations and previous experiences related to
injuries that occurred earlier in life (Merskey amp Bogduk 1994)
According to the literature a number of mechanisms influence our experience of pain One of
the mechanisms of pain experience is known as lsquonociceptionrsquo ndash the neural process of encoding and
processing a noxious stimulus This afferent activity occurs in the peripheral and central nervous
system when a stimulus has the potential to damage tissue (Green amp Hart-Johnson 2010 Greenwald
1991) When mechanical or chemical change above a certain threshold is detected nociceptors are
initiated which then trigger a variety of automatic responses and may result in the experience of pain
(Green amp Hart-Johnson 2010 Greenwald 1991) However McMahon and Koltzenburg (2006) specify
that our experience of pain ldquodepends on a host of variables including the presence of other somatic
stimuli and psychological factors such as arousal attention and expectation These psychological
factors in turn are influenced by contextual cues that establish the significance of the stimulus and
help determine appropriate responses to itrdquo (p125)
4
212 Prevalence of Pain
Prevalence and Burden of Non-specific Chronic Pain
The point prevalence of non-specific chronic pain in the Canadian general population is
estimated to range from 11 to 44 (C L Edwards et al 2001 R R Edwards amp Fillingim 1999 R
R Edwards et al 2001 R R Edwards et al 2005b Forsythe et al 2011) A recent study by
Reitsma et al (2011) examined the data from seven cross-sectional cycles of the household
component of the National Population Health Survey (NPHS) (199495 199697 and 199899) and the
Canadian Community Health Survey (CCHS) (200001 2003 2005 and 200708) Reitsma et al
found that chronic pain prevalence in the Canadian population varies between 15 and 19
(Reitsma Tranmer Buchanan amp Vandenkerkhof 2011) Chronic pain was found to be more prevalent
among Canadian women (165 to 215) than men (136 to 162) and among the older (65+
years) population (239 to 313) than those 25 to 39 years of age (140 to 270) (Reitsma et al
2011) Furthermore 114 to 133 of those reporting chronic pain also reported that the pain
prevented them from taking part in at least a few activities (Reitsma et al 2011)
Pain is very costly to the Canadian healthcare system According to Lynch (2011) ldquochronic pain
costs more than cancer heart disease and HIV combinedrdquo (p79) In 2010 the Chronic Pain
Association of Canada reported that ldquothe annual cost of chronic pain including medical expenses lost
income and lost productivity but not the social costs is estimated to exceed $10 billionrdquo (p157)
To summarize the prevalence of chronic pain in Canada is high and is placing a significant
burden on Canadian healthcare system
In the present study the prevalence of pain was examined based on self-report to a question
about pain from the CCHS questionnaire The prevalence of pain was investigated from a combined
sample of the four ethnic minority study groups over the last seven years (2007 20092010
20112012 and 2013) of the CCHS The prevalence of pain reflects a negative response to the
question ldquoare you usually free of pain and discomfortrdquo
213 Gender Ethnic and Cultural Differences in Pain
A substantial amount of literature has highlighted gender differences in chronic pain prevalence
Females are more likely to report chronic pain compared to males (Magnusson amp Fennell 2011
Reitsma et al 2011) Ethnic background and culture play an important role in determining how pain is
perceived if and how a person will communicate pain to others and how the person acts or responds
to pain experience The first important source of learning is the family in that pain behaviours are
initially learned by observing other family membersrsquo ways of reporting and expressing pain (Sullivan et
al 2004) It is therefore from a personrsquos ethnic background and culture that they will learn whether
5
their reaction and responses to pain are appropriate and under what circumstances it is appropriate to
report or express pain
214 Defining Ethnic Minority and Visible Minority Groups
Ethnic minority status is defined by Eaton (1986) as ldquoAn easily identifiable characteristic that
implies a common cultural history with others possessing the same characteristic The most common
ethnic lsquoidentifiersrsquo are race religion country of origin language andor cultural backgroundrdquo (p160)
The term ldquoethnic minoritiesrdquo in this study refers to both immigrants and established racialethnic
minorities in Canada
The Canadian Employment Equity Act defines visible minorities as individuals (other than
Aboriginals) who are non-Caucasian in race or non-White in colour The visible minority populations in
Canada consist mainly of South Asians Chinese Blacks (of various geographical origins) Filipinos
Latin Americans Arabs Southeast Asians West Asians Koreans and Japanese (Statistics Canada
2011)
According to Statistics Canadarsquos National Household Survey Canada is reported to have the
highest proportion of foreign-born individuals among the G8 countries In 2011 206 of the total
population was represented by immigrants South Asian East Asian Middle Eastern and African (or
Black) Canadians were the largest ethnic minority groups accounting for 613 of all ethnic minority
groups in Canada (Statistics Canada 2011)
For the purpose of this document the term ldquoethnic minorityrdquo or EM is defined by the race and
ethnicity of the target population (South Asian East Asian Middle Eastern and African (Black)
Canadians) However when citing supporting literature the terminology used in the cited source is
preserved
215 The Study Populations and Pain Expression
Self-ascribed ethnicity from the CCHS was used to classify the participants into four EM categories
Black Canadians
People of African origin make up one of the largest non-European ethnic groups in Canada
(Statistics Canada 2011) This category includes people claiming different ethnic origins In 2001
approximately half (51)2 of the population with origins in Africa self-identified as either Black or
simply African while others were more specific 11 reported their ethnicity as Somali 6 as South
African 6 as Ghanaian and 5 as Ethiopian (Statistics Canada 2011) For the purpose of this
2 The majority (51) have self-identified as Black or African and the remaining 21 identified as having multiple ethnic roots
6
study this population will be referred to as Black Canadians (or simply Black) in keeping with CCHS
terminology
The 2001 Census reported a total of 662200 Black Canadians who represented approximately
2 of the population in the 2011 Census the number was 945700 Black Canadians currently
constitute the third largest visible minority group they make up 151 of the total visible minority
population and 3 of the total Canadian population This group is growing faster than the overall
population For example between 1996 and 2001 the number of individuals identifying themselves as
Black grew by 32 compared to 10 for the overall population (Milan amp Tran 2004)
Presently no known studies have been conducted on the prevalence of chronic pain among
Black Canadians However quite a few studies in the USA have found the disparity in pain prevalence
and ethnicity in African Americans and Hispanics receiving care The literature suggests that African
Americans with chronic pain report higher levels of pain severity and disability due to pain than non-
Hispanic Whites with chronic pain (Carey et al 2010 Green et al 2003 Green amp Hart-Johnson
2010 Tan et al 2005)
South Asian Canadians
South Asians currently constitute the largest visible minority group in Canada the province of
Ontario being one of the top locations of residence for this community (Statistics Canada 2011)
According to Statistics Canada Canadians of South Asian origin include a number of different ethnic
or cultural origins In the 2001 Census 74 of South Asians self-defined as East Indian and the rest
identified with various ethnic roots such as Pakistani Sri Lankan Punjabi and Tamil (Statistics
Canada 2011)
Results from several population-based studies conducted in the United Kingdom report higher
prevalence of pain in ldquomost jointsrdquo amongst South Asians than Europeans (Allison et al 2002 Palmer
et al 2007) Furthermore the prevalence of widespread pain was also greater in the South Asian
populations compared to Europeans (Ezenwa et al 2006) This study also noted that differences in
pain reporting also existed within the South Asian populations The authors identified acculturation as
a factor which may explain the differences in pain reporting among immigrants (Ezenwa et al 2006
Fortier et al 2009)
To date there have been no studies on pain expression by South Asian Canadians
Investigating the prevalence and contributing factors of pain among South Asians living in Canada
would contribute to understanding how bio-psychosocial factors explain the differences in chronic pain
experience
7
East Asian Canadians
In 2006 there were approximately 12 million residents of Chinese ethnicity in Canada and
745 of those were first generation ie foreign-born (Statistics Canada 2011) First generation East
Asians come primarily from the Peoplesrsquo Republic of China (529) Hong Kong (242 ) Taiwan
(74) and Viet Nam (57) (Statistics Canada 2011) The East Asian population in Canada
continues to grow at a fast pace when compared to the general population Between 1996 and 2001
the number of people who identified as Chinese rose by 19 compared to the general population
which rose only by 4 (Statistics Canada 2011)
Historically the Chinese culture has been influenced by Buddhism Confucianism and Taoism
all of which encourage tolerance of pain (Lavernia et al 2011) According to Chin (2005) Chinese
may be more emotionally stoic and therefore more likely to report less pain compared to North
Americans of European extraction (Chin 2005) However very little is known about pain expression
among the East Asian population (Lavernia et al 2012) Therefore an important area of study is to
investigate whether there is a difference in the prevalence of pain expression among East Asians
compared to other minority populations
Middle Eastern Canadians
Canadians of Middle-Eastern origin come from virtually every country of the region ndash Bahrain
Cyprus Egypt Iran Iraq Israel Jordan Kuwait Lebanon Northern Cyprus Oman Palestine Qatar
Saudi Arabia Syria Turkey United Arab Emirates and Yemen For this research individuals tracing
their origins to North Africa have also been included in this category They may be ethnically Arab
Berber Israeli Kurdish Persian or other The 2011 Census reported approximately 381000 people
of Middle Eastern origin living in Canada representing roughly 15 of the total Canadian population
Very few studies have explored pain prevalence or expression within this demographic One report
investigating the provision of healthcare to Middle Eastern patients suggested that pain responses are
considered to be private and reserved for immediate family and not even shared with health
professionals these authors reported that there may often be conflicting perceptions between the
family members and nurses regarding the effectiveness of the clientrsquos pain relief (Sibberman 2012)
To conclude more studies are needed to understand the prevalence of pain and contributing
factors in different ethnic populations This study seeks to help further our knowledge of differences in
the prevalence of pain expression among EM groups in Canada as well as the factors associated with
these differences It is my hope that the results will further health professionalsrsquo understanding of
differences in pain expression and thus support their efforts to provide optimal healthcare services to
these populations
8
Blacks South Asians Middle Easterners and East Asians were chosen as the focus of this
present research as they constitute the four largest ethnic minorities in Canada and have received
very little attention in pain research
9
22 Literature Review Chronic Pain and Ethnicity
221 Introduction
The main objective of this review was to explore the existing literature about the relationships
between EM status and pain expressionperception The research sought to examine the findings
according to study design how pain expression was measured and what biological psychological
and socio-demographic factors had been included in exploring these pain characteristics
222 Methods
A search strategy was developed to investigate the research evidence available about chronic
pain expression among ethnic minorities The relevant literature was examined the flow of studies is
reported using the PRISMA flow chart (see Appendix A) I conducted the literature search in October
2014 in the PubMed database The following free text word and terms were used
Search 1 (epidemiology) AND pain[TW] AND ethnicity[TW]
Search 2 Search pain experience[tw] OR pain perception[tw] AND (((((((((ethnic groups[MeSH
Terms] OR (ethnic[All Fields] AND groups[All Fields]) OR ethnic groups[All Fields] OR ethnic[All
Fields])) OR ethnicity[tiab]) OR Minority Health[Mesh]) OR racial group[tw]) OR minority group[tw])
OR minority health[tw]))
Search 3 Search (((Epidemiologic Studies[Mesh]) OR prevalence)) AND (((((((((ethnic
groups[MeSH Terms] OR (ethnic[All Fields] AND groups[All Fields]) OR ethnic groups[All Fields]
OR ethnic[All Fields])) OR ethnicity[tiab]) OR Minority Health[Mesh]) OR racial group[tw]) OR
minority group[tw]) OR minority health[tw])) AND (((pain[MeSH Terms] OR pain[All Fields])) OR
Pain Perception[Mesh]))
In addition I searched the reference lists of all included studies for additional potentially relevant
papers
223 Inclusion and Exclusion Criteria
The titles and abstracts of identified articles were screened based on the inclusion and exclusion
criteria (Table 21) and an article was included for further assessment if it met all of the selection
criteria I included recent relevant studies published in English between January 1990 and October
2014 The target population included adults 18 years of age or older who experienced chronic pain
(ie pain experienced for more than three or six months) as the outcome The selected articles
included direct comparisons between samples from at least two different EM groups This literature
10
review excluded narrative reviews case reports studies describing surgical post-surgical and labour
pain as well as studies written in a language other than English
Table 21 Inclusion and Exclusion Criteria
Inclusion Criteria Exclusion Criteria
Articles written in English Articles written in languages other than English
Articles published between January 1st 1990 and December 31 2014 (in order to obtain substantial manageable amount of up to date relevant literature)
Articles published prior to January 1st 1990
Target population greater than 18 years Articles assessing pain in pediatrics
Chronic pain measured (cross-sectionally or
longitudinally)
Acute pain surgical pain post-surgical pain and
labour pain
Articles in which pain was not assessed
Articles featuring a comparison between ethnicracial populations
Articles looking at non-ethnic populations
11
3 Biological psychological and socio-demographic factors associated with chronic pain cited from the literature
Table 22 Cross-sectional Studies on Ethnic Minorities Pain Measurement and Prevalence of Pain Authors Date (country)
Study Purpose Study Design (N)
Study Population
How are pain and disability measured
Is there a difference among ethnic groups
Bio-psychosocial factors associated with pain3
Allison et al 2002 (UK)
To assess the prevalence of musculoskeletal symptoms among the major ethnic populations of Greater Manchester
Cross-Sectional Study (N=2117)
South Asian (n=477) African Caribbean (n=145) White (n=912)
The presence of pain in most joints physical function measured by the mHAQ
The adjusted OR with 95 CI for pain in most joints was higher than 1 in all ethnic groups and statistically significant compared to the White populations and ranged from 22 (95 CI 18-26) for African Caribbeanrsquos to 51 (95 CI 46-56) for Pakistanis
Age Gender Area of residence
Ang DC et al 2003 (USA)
To determine if there is a difference in the perception of pain and functional disability between African Americans and Whites at any given radiographic severity of osteoarthritis (OA)
Cross-Sectional Study (N=596)
African Americans (n=262) Whites (n=334)
WOMAC- Index
of pain and functional limitations primary outcome of interest is pain
African Americans and Whites were not different in mean scores for WOMAC-pain plusmn SD (4675 plusmn 1849 vs 4587 plusmn 1813) and WOMAC function (4923 plusmn 1923 vs 4782 plusmn 1998) After controlling for important covariates ethnicity was not a significant predictor of WOMAC pain and function
Age Income Education Employment status Marital status Depression
Carey TS et al 2010 (USA)
To determine whether prevalence of pain and care use varied by patient race or ethnicity
Cross-Sectional Study N=837
Latinos (n=34) Blacks (n=183) Whites (n=620)
RMDQ Scale 0 to 10 scale
Blacks and Latinos reported higher RMDQ pain intensity in the previous 3 months at 77 (95 CI 75-80) and 79 (95 CI 72-86) respectively compared to the White population 63 (95 CI 61-65) The difference was found to be statistically significant
Education Income Employment Insurance
Carlisle et al 2013 (USA)
To examine the ethnic subgroup variation in chronic health by comparing
Cross-sectional study N=5006
Asian-Americans (n=1628)
Pain was measured based on the presence of
Among those reporting chronic pain conditions Asian Americans and Latino Americans had significant
Gender Age Household income Education
11
12
4 The differences in weighted prevalence of chronic pain by race and ethnicity
self-reports of chronic conditions across diverse ethnic subgroups
Latino-American (n=1940) African-Americans (n=1438)
pain conditions such as back pain headache arthritis and ulcer
differences by ethnic subgroups4 Among Asian Americans Filipinos reported the highest level (453) followed by Chinese (374) and Vietnamese (322) X2 (2 n = 1627) 53 ple0001 Finally significant differences in reports of chronic pain conditions by ethnic subgroup emerged for Latino American respondents 48 of Puerto Ricans 47 of Cubans and 364 of Mexicans X2 (2 n=1937) 78 ple0001
Marital status
Edwards RR et al 2005 (USA)
To examine the effects of ethnicity (African American vs White) on experimental pain tolerance and adjustment to chronic pain
Cross-sectional Study N= 291
African Americans (n=97) Hispanics (n=97) Whites (n=97)
Pain Measures MPQ scores MPI Pain Severity scores and VAS ratings of pain intensity
After matching the three groups to reduce potential confounding variables there was no difference in mean pain severity plusmn SD African Americans (50 plusmn09) Hispanics (49plusmn11) Whites (48plusmn10) or pain intensity African Americans (50plusmn09) Hispanic (49plusmn11) and White (48plusmn10)
Age Gender Education Work status
Green et al 2003 (USA)
To address the potential differential effects of chronic pain cross-culturally in younger Americans A retrospective analysis of persons younger than 50 years of age presenting for chronic pain management in a multidisciplinary pain centre was done
Cross-sectional Study N=3669
Black Americans (n=353) White Americans (n=3316)
MPQ Psychosocial factors such as pain severity mood and coping were assessed by using items from the MPI via a 7-point Likert scale (pain 0 no pain 6 excruciating pain mood 0 extremely low 6 extremely high coping0 not at all successful 6 extremely successful)
Black Americans reported significantly higher painplusmn SD (33 plusmn 14 vs 25 plusmn 13 P lt 001) level of suffering (51 plusmn 10 vs 45 plusmn 12 P lt 001) and less control of their pain (13 plusmn 17 vs 15 plusmn 15 P lt 001) than White Americans on a 7-point Likert scale The Black Americans also had higher MPQ scores compared to White Americans (340 plusmn 132 vs 312 plusmn 30 P lt 001) regardless of gender
Gender Marital status Education Alcohol use
12
13
5 A multivariable analysis was conducted to examine the relationships between raceethnicity and pain characteristics (pain severity and diagnosis of chronic pain)
Green CR et al 2010 (USA)
To examine Black (62) and White (938) men presenting for initial assessment at a tertiary care pain centre Racial comparisons utilized analysis of variance
Cross-sectional Study N = 1650
Black America men (n=103) White American men (n=1547)
MPQ Results found Black men with chronic pain to be at risk for more severe pain (Mean plusmn SD = 293plusmn136) and worse outcomes (including more depressive symptoms affective distress PTSD and disability) when compared to White men with chronic pain (264plusmn121)
Race Age Median income Education Health behaviours
Hernandez et al 2006 (USA)
To examine ethnic differences in pain reports between Hispanics and Caucasians with serious health problems
Cross-Sectional study N=1455
Whites (n=1308) Hispanics (n=147)
How much pain they experience because of their health problems 4- Point Likert scale 1 A lot 4 none at all
Ethnicity found to be related to pain reports Hispanics reported more pain then Whites (F(1 1450)=528 p=002 (pr)=-006)
Age Gender Income Ethnicity Depression
Meghani SH et al 2009 (USA)
To investigate differences in reported pain and pain treatment utilization (use of over-the-counter and prescription pain medications seeing a pain specialist and use of complementary and alternative medicine) among minorities and non-minorities in the general population
Cross-Sectional study N= 902
Whites (n=746) Blacks (n=71) Hispanics (n=44) Others (n=41)
Questionnaires to measure pain presence pain severity (0 no pain 10 unbearable pain) Diagnosis of chronic pain
Minorities reported higher pain severity than non-minorities Minorities had daily pain that averaged 0784 points higher than Whites (plt01)5
Age Gender Education Income
13
14
6 Mean pain intensityplusmn SD 7 Mean pain intensityplusmn SD
Nguyen et al 2005 (USA)
To evaluate the influence of race and ethnicity on access to treatment for chronic pain among subjects experiencing pain for 3 or more months
Cross-sectional telephone survey and analysis N=1335
Africans Americans (n=447) Hispanics (n=434) Whites (n=454)
Pain was measured on a Likert scale 0-10 0 no pain 10 the worst pain
African Americans (49plusmn38) and Hispanics (48plusmn38) were less likely to report that pain prevented them from living life to the fullest compared to Whites (52plusmn36)6
Gender Age Marital Status Community Status Employment status Education level Income Language Insurance
Palmer et al 2007 (UK)
To investigate the extent to which differences in the prevalence of muskuloskeletal pain within the South Asian population could be explained by differences in acculturation
Cross-sectional analysis N=2998
European (n=933) Indian (n=1165) Pakistani (n=401) Bangladeshi (n=348)
Pain severity was measured on a Likert scale 0-10 0 no pain 10 the worst pain
Age and gender-adjusted widespread pain prevalence in South Asians is almost 4 times greater (OR 37 95 CI 29-49) than widespread pain prevalence in Europeans Within South Asian subgroups median severity scores ranged from 5 (IQR 4-7) in Gujarati Africans to 8 (IQR 6-9) in Gujarati (P=00007)
Gender Age Acculturation
Parmelee PA et al2012 (USA)
To conduct a cross-sectional study on how race and sex affect associations among osteoarthritis (OA) pain disability and depression in older adults with diagnosed knee OA
Cross-sectional Study N=363)
Blacks (n=94) Whites (n=269)
Pain was assessed with the 6-item Philadelphia Geriatric Center (PGC) Pain Scale
African Americans reported greater disability (F(1 359) = 349 p lt 062)7 and marginally greater pain than non-Hispanic Whites
Age Gender Education Depression
Plesh O et al2011 (USA)
To compare the prevalence of self-reported temporo-mandibular joint and muscle disorders (TMJMD)-type pain headaches and neck and back pains in the 2000 to 2005 USA National Health Interview
Cross-Sectional Study N= 189 992
Whites (n=138 694) Hispanic (n=22 799) Blacks (n=20 899) Other (n=7 599)
Participants were asked ldquoduring the past three months did you have low back pain rdquo and to respond with ldquoyesrdquo or ldquonordquo
White adults (160) were more likely to report neck pain than Hispanic (128 OR 077 plt0001) and Black adults (115 OR 068 plt0001) White adults (295) were more likely to report low back pain than Hispanic (244 OR 077 plt0001) and Black adults (246 OR 078 plt0001)
Age
14
15
Survey (NHIS) by gender and age for non-Hispanic Whites (Whites) Hispanics and non-Hispanic Blacks (Blacks)
Portenoy RK et al 2004 (USA)
To explore relationships between chronic pain and race or ethnicity
Cross-sectional survey and studies N= 1335
Whites (n=454) Blacks (n=447) Hispanics (n=434)
Pain severity was assessed by using 0- to 10-point scales where 0 was defined as ldquono painrdquo and 10 was defined as ldquothe worst you can imaginerdquo Respondents were asked to rate pain severity ldquoon average during the past weekrdquo and ldquoat its worst during the past weekrdquo
On the 0- to 10-point pain severity scale White subjects reported significantly lower severity of pain ldquoon average during the past weekrdquo than African American (meanplusmn SD 56plusmn23 vs 61plusmn27 Plt01) or Hispanic (56plusmn23 vs 64plusmn25 P lt001) subjects MeanplusmnSD severity of worst pain was 76plusmn26 and did not vary by group
Gender Age Marital Status Community residence Employment status Education level Income Language spoken at home
Riskowski JL et al 2014 (USA)
To describe and evaluate prevalence and distribution of pain in the United States
Cross-sectional study N=8270
Blacks (n=1662) Hispanics (n=1604) Whites (n=4730) Other (n=273)
NHANES pain questionnaire ldquoDuring the past three months did you have low back painrdquo
Non-Hispanic White people had higher chronic pain (755 95 CI 692-818) experience than Blacks (105 95 CI 69-140) and Hispanics (100 95 64-135)
Age Gender Marital status Education Employment Health insurance Government sponsored Alcohol intake Smoker
Stanaway FF et al 2011 (Australia)
To investigate differences in back pain characteristics effects and medication use in a population-based sample of Italian-born immigrants and Australian-born
Cross-Sectional study N= 1184
Italian born immigrants (n=335) Australian born (n=849)
Questions on back pain was taken from the MrOS study All men were asked if they had experienced any back pain in the last 12 months
Italian-born men were significantly more likely to report that their back pain was present all or most of the time (p = 0002) and that it was moderate or severe (p lt 0001) They
were also significantly more likely to have chronic back pain ( p = 0020) and to report that they had limited
Age Marital status Education level Occupation history Income Housing status Number of co-morbidities Years lived in Australia
15
16
men aged 70 years and over
their activities because of back pain in the last 12 months (p = 0001)
Language spoken at home
Tan G et al 2005 (USA)
To identify similarities and differences among non-Hispanic Black and White patients in pain appraisal beliefs about pain and ways of coping with pain The study also examined the association between these factors (ie appraisals beliefs coping) and patient perception or subjective experience of their functioning in each ethnic group
Cross-sectional Analysis N=482
Non-Hispanic Blacks (n=128) Non-Hispanic Whites (n=354)
Pain prevalence was measured from the pain self-efficacy (PSE) scale and pain prevalence was measured from multi-dimensional pain inventory (MPI)
Pain severity was higher in Black patients (534plusmn073) compared to White patients (501plusmn091) Black patients reported lower perceived control over pain more external pain-coping strategies and a stronger belief that others should be solicitous when they experience pain
Gender Education Marital status Perceived disability
Notes OR= odds ratio CI= confidence interval SD= standard deviation WOMAC= The Western Ontario and McMaster Universities Arthritis Index mHAQ= the Modified Health Assessment Questionnaire RMDQ= Rolland Morris Disability Questionnaire MPQ= McGill Pain Questionnaire MPI= McGill Pain Intensity scale VAS= visual analogue scale IQR= inter-quartile range MrOS= The Osteoporotic Fractures in Men Study X2= chi square test for categorical variables
16
17
Table 23 Longitudinal Studies on Ethnic Minorities Pain Measurements and Prevalence of Pain Authors Date
(country)
Study Purpose Study
Design(N)
Study
Population
How is pain
measured
(pain
measurements)
Is there a difference among ethnic groups
The bio-
psychosocial
factors
associated with
chronic pain
Bates MS 1993 (USA)
To understand how ethnicity affects the chronic pain experience This was a quantitative study of 372 chronic pain patients in six ethnic groups under treatment at a multidisciplinary pain management centre in New England
Longitudinal Analysis N=372
Hispanics (n=44) Italians (n=50) Irish (n=60) French-Canadians (n= 90) Polish (n=20) Old Americans (n=100)
Questionnaires and standardized instruments for assessing pain intensity and whether ethnic background was significantly related to interethnic or intra-ethnic group variation in pain intensity and response
There was a statistically significant intergroup difference in pain intensity by ethnic identity Hispanics reported higher pain intensity (40plusmn135) compared to all the other groups and Polish and French Canadians reported lower mean pain intensity plusmn SD compared to all the other groups at 29plusmn117 and 293 plusmn 141 respectively
Medical socio-demographic psychological variables
Laguna et al 2014 (USA)
To investigate racial and ethnic differences in pain after an IPC intervention in 385 seriously ill White Black and Latino individuals aged 65 and older
Longitudinal Analysis N=385
Whites (n=179) Blacks (n=96) Latinos (n=110)
Using the 11-point Number Rating Scale the IPC nurse collected pain data before the consultation (baseline) 2 and 24 hours after consultation and at hospital discharge
Latinos were found to be 62 less likely than Whites (RR = 038 95 CI 015ndash097) to report experiencing pain at hospital discharge In addition those with higher baseline pain intensity were more likely to report experiencing pain at hospital discharge (RR = 064 95 CI 055ndash074)
Gender Marital status
Notes RR= relative risk CI= confidence interval SD= standard deviation IPC= Inpatient Palliative Care
17
18
224 Results
Types of Studies
A total of nineteen relevant studies were identified (see Table 22 amp Table 23) all included
studies were conducted in the United Kingdom Australia and the United States Seventeen studies
were cross-sectional (see Table 22) (Allison et al 2002 Ang et al 2003 Carey et al 2010 Carlisle
2014 Chan et al 2011 R R Edwards et al 2005a Green et al 2003 Green amp Hart-Johnson
2010 Hernandez amp Sachs-Ericsson 2006 Meghani amp Cho 2009c Nguyen et al 2005 Palmer et al
2007 Parmelee et al 2012 Plesh et al 2011 Portenoy et al 2004 Riskowski 2014 Stanaway et
al 2011) and two were longitudinal follow-up studies (Bates amp Edwards 1992 Laguna et al 2014)
(see Table 23)
Literature Review Findings
Pain ExpressionPerception Measurement
The measurement of pain expression varied across included studies One study (Allison et al
2002) used the Multiple Health Assessment Questionnaire (MHAQ) one used the Western Ontario
and McMaster Universities Osteoarthritis Index (WOMAC) pain scale and the Roland Disability Score
was used in one study (Ang et al 2003) The McGill Pain Questionnaire (MPQ) the McGill Pain Index
and Visual Analogous Scale (VAS) were used in four of the included studies (Edwards et al 2005
Green et al 2003 Green amp Hart-Johnson 2010 Tan et al 2005) The remaining 13 articles included
questionnaires with Likert scales to explore pain expressionperception
EM Status Considered in the Literature
Six studies included the differences in pain expression between Non-Hispanic Black and Non-
Hispanic White populations Seven studies compared the three biggest EM populations (Hispanics
Blacks and Non-Hispanic Whites) in the USA One study investigated chronic pain prevalence among
Indians Bangladeshi and White Europeans in the UK
Cross-sectional Studies of Pain Expression
EM differences in pain expressionperception have been documented in a variety of different
clinical settings A total of fourteen cross-sectional studies were conducted in the USA looking at
ethnic differences among African Americans Hispanics and Whites A common theme running
19
through the literature was that Blacks and Hispanics reported having more severe intensity of pain
compared to the White population (Carey et al 2010 Carlisle 2014 Meghani amp Cho 2009c
Portenoy et al 2004) Two studies conducted in the UK also found racialethnic differences in pain
expression Both studies compared pain expression in South Asian versus White British participants
with chronic pain and confirmed that South Asians reported higher severity of pain than the
comparison group (Riskowski 2014) One study (Palmer et al 2007) further found that excess pain
prevalence varies in magnitude between population groups of South Asians (Gujrati versus Gujrati
Africans) Another study conducted in Australia (Stanaway et al 2011) investigating the difference in
back pain characteristics in Italian-born men and Australian-born men found the former more likely to
report moderate or severe back pain compared to the latter However the difference was reduced in
magnitude and no longer statistically significant when adjusted for socio-economic factors
Longitudinal Studies of Intra-ethnic Differences in Pain Expression
From the two longitudinal studies in the literature review (Bates amp Edwards 1992 Laguna et al
2014) we can gain insights into intra-ethnic minority differences in pain prognosis and etiology Given
the scarcity of longitudinal studies exploring pain expression among ethnic minorities the results of
these two studies provide valuable information on both between- and within-group variability in pain
reporting over time The results of these longitudinal studies help to identify if there are any factors or
mechanisms that may exist that may be able to explain disparities in pain expression between groups
The first study by Bates et al (1994) found sub-group differences in emotional response to
chronic pain over time as well as pain intensity within a group of individuals classified as Whites The
population that was evaluated for pain included Irish Italian French-Canadian Polish Hispanics and
elderly Americans (at least third generation USA-born non-Hispanic Caucasians who identify with no
other ethnic group) The Hispanic group was found to have significantly higher pain intensity (MPQ
pain ratings) recorded over time in comparison to other populations The Italian group was the second
highest followed by the Polish group The authors attribute the within-group differences in response to
pain as being associated with the patientrsquos heritage (whether they were first or second generation
immigrant) and locus-of-control8 The second study by Laguna et al (2014) investigated the difference
in pain expression by Latinos Blacks and Whites within in-patient palliative care (IPC) interventions
At admission (baseline measurements) Latinos reported higher pain intensity (15plusmn280) compared to
Whites (12 plusmn250) and Blacks (10 plusmn208) The within-group pain differences over time showed that
after IPC interventions there was a reduction in pain from severe to mild The longitudinal analysis
showed Latinos were 62 less likely than Caucasians to report pain at discharge Greater awareness
8 Two types of locus of control (LOC) exist 1) Internal LOC reflects a belief in personal control over behaviour 2) External
LOC is categorized into chance and powerful others
20
of the influence of cultural and religious beliefs on pain expression is needed to understand these
ethnic differences so that effective strategies to address pain management can be developed
Conclusion of the Literature Search
All of the literature reviewed supported the hypothesis that pain expression differs by ethnicity
Although there have been many studies on ethnic minorities and pain in countries such as the USA
and the UK the findings cannot be automatically generalized to Canadian EM populations and there is
still a need to study how the reporting of prevalence and intensity of pain differs among the major
Canadian ethnic population groups The aim of this thesis is to increase our understanding of how
ethnic origin and cultural psychological and social factors are associated with pain expression among
four Canadian EM groups
23 Analytical Framework
To explore the association between biological psychological and social factors associated with
pain expression prevalence two frameworks within the realm of social determinants of health guided
this present research The 21st Century Field Framework (Figure 21) and the Bio-psychosocial
Framework (Figure 22) et al 2011 Leyer 1990)
Pain research traditionally focused only on sensory modalities and neurological transmissions
these components are captured in the biological framework (Leclair et al 2011) More recent theories
integrating the body mind and society have been developed to understand pain One common
framework is the lsquoBio-psychosocial frameworkrsquo (Figure 22) in which pain is viewed as a dynamic
interaction among and within the biological psychological and social factors unique to each individual
The Determinants of Health the 21st Century Field Framework (Figure 21) was adapted from a
framework by Evans and Stoddard known as The Health Field Framework (Evans amp Stoddart 1990
Lipton amp Marbach 1984) and is used as a framework to demonstrate how certain socio-demographic
factors may influence expression of pain resulting from an injury
To investigate the association between psychological and social factors associated with pain
expression prevalence among EM groups I have used an modified bio-psychosocial framework that
combines the 21st Century Field Framework and the Bio-psychosocial Framework (Figure 23) with
biological psychological and socio-demographic factors included in previous literature in pain
characteristics (See Tables 24 and 25) This framework posits that pain expression is best
understood in terms of a combination of biological psychological and social factors and the
association between biological psychological and social factors based on the literature
In addition based on previous literature I have also included a derived acculturation variable by
combining two other variables (languages spoken and time spent in Canada) The biological
21
component included clinical factors such as whether or not the person has reported suffering any
injury during the past 12 months andor experiencing arthritis and back problems9 The psychological
component included self-reported mental health depression and anxiety Lastly the socio-
demographic component was broken into two parts ndash demographic factors and social environmental
factors demographic factors included age sex and social environmental factors included
acculturation education employment status income marital status area of residence (urban or rural)
and household size
9 Arthritis and low back pain were the only two chronic conditions available in the CCHS associated with chronic pain
22
Figure 21 The Determinants of Health Realm of the 21st Century Field Mode
Figure 11 The Determinants of Health The 21st Century Field Model
Global Factors Community and Social
Environment
Health and Well-
Being
Disease and Injury
Physical Environment Family and Individual
Environment
Education
Income
Risk Factors
Vulnerability
Health Care System
Recovery Disability Death
Primary
Prevention
Secondary
Prevention
Tertiary
Prevention
Potential pathway for individual and community action to influence global factors
Risk factors include age nutritional status and genetic makeup among other factors
23
SOCIAL
Activities of Daily Living
Environmental Stressors
Interpersonal Relationships
Family Environment
Social Support Isolation
Social Expectations
Cultural Factors
Medico-legal Insurance Issue
Previous Treatment Experience
Work History
BIO PSYCHO
Figure 2 2 The Bio-psychosocial Approach to Chronic Conditions A conceptual model of the biopsychosocial interactive processes involved in health and illness From ldquoComorbidity of Chronic Mental and Physical Health Conditions The Biopsychosocial Perspectiverdquo by R J Gatchel American Psychologist 59 792ndash 805
24
Table 2 4 The biological psychological and socio-environmental factors included in previous pain literature based on the 21st century field framework
The 21st century
field framework
components
Author(s) Date Factors included in the
literature
Physical Environment Allison et al2002 Area of residence
Family and Individual Environment
Chan A et al2011 and Stanaway FF et al 2011 Housing status
Ang DC et al 2003 Carlisle et al 2013 Green et al 2003 Laguna
et al 2014 Nguyen et al 2005 Portenoy RK et al 2004 Tan G et
al 2005 Riskowski et al 2014 and Stanaway FF et a 2011
Marital status
Community and Social Environment
Nguyen et al 2005 Community status
Portenoy RK et al 2004 Community Residence
Riskowski et al 2014 Government sponsored
Risk Factors Green et al 2003 and Riskowski et al 2014 Alcohol use
Disease and Injury Hernandez et al 2006 and Parmelee PA et al 2012 Depression
Healthcare system
Laguna et al 2014 of chronic conditions
Stanaway FF et al 2011 of co-morbidities
Carey TS et al 2010 and Nguyen et al 2005 and Riskowski et al
2014
Health insurance status
Education Ang DC et al 2003 Carey TS et al 2010 Carlisle et al 2013 Chan A et al 2011 Edwards RR et al 2005 Green et al 2003 Green CR et al 2010 Meghani SH et al 2009 Nguyen et al 2005 Parmelee PA et al 2012 Portenoy RK et al 2004 Riskowski et al 2014 Stanaway FF et al 2011 Bates MS et al 1993 Carey TS et al 2010 Carlisle et al 2013 Green CR et al 2010
Education
Income Hernandez et al 2006 Meghani SH et al 2009 Nguyen et al 2005
Portenoy RK et al 2004 and Stanaway FF et al 2011
Income
Table 2 5 The biological psychological and socio-environmental factors included in previous pain literature based on the Bio-psychosocial framework
The Bio-psychosocial framework components
Author(s) Date Factors considered in the literature
Activities of daily living
No Published Literature
Environmental stressors
Allison et al 2002 Area of residence
Chan A et al 2011 and Stanaway FF et al 2011 Housing status
Interpersonal Relationships
Ang DC et al 2003 Carlisle et al 2013 Green et al 2003 Nguyen et al 2005 Portenoy RK et al 2004 Tan G et al 2005 Riskowski et al 2014 and Stanaway FF et al 2011
Marital status
Family environment
Social support isolation
Nguyen et al 2005 and Portenoy RK et al 2004 Community status
Riskowski et al 2014 Government sponsored
Social expectations
Cultural factors Hernandez et al 2006 Ethnicity
Palmer et al 2007 Acculturation
Portenoy RK et al 2004 Nguyen et al 2005 Stanaway FF et al 2011
Languages spoken at home
Medico-legal insurance issue
Carey TS et al 2010 Nguyen et al 2005 and Riskowski et al 2014 Health insurance status
Previous treatment experiences
Green CR et al 2010 Health Behaviours
Work history Ang DC et al 2003 Carey TS et al 2010 Carlisle et al 2013 Chan A et al 2011 Edwards RR et al 2005 Green et al 2003 Green CR et al 2010 Hernandez et al 2006 Meghani SH et al 2009 Nguyen et al 2005 Parmelee PA et al 2012 Portenoy RK et al 2004 Riskowski et al 2014 and Stanaway FF et al 2011
Education income and Employment status
25
Figure 23 Modified Bio-Psychosocial Framework This modified framework will be used to investigate the associations between bio-psychosocial factors and expression of
pain among South Asian Black Middle Eastern and East Asian Canadians with and without chronic pain conditions Note Biological factors were used to assess data quality assurance on pain reporting
Psychological
Factors Biological factors
Demographic
Factors
Social Environmental
Factors
Reporting of Pain and Discomfort Pain (yesno) Pain Intensity Pain interfering with daily activities
Acculturation
Biological Factors
Psychological Factors
Socio-Environmental Factors
Demographic Factors
Acculturation
Fibromyalgia Self-reported metal health
Area of Residence
Marital Status Language most often spoken at home
Arthritis Depression Employment Gender Time spent in Country
Low back pain Anxiety Household Size Age Country of Birth
Injury Alcohol Frequency
Education
26
24 Objectives and Research Questions
241 Objectives
The three objectives for this study were
1 To report the differences in chronic pain expression between White Canadians and EM
Canadians who self-reported as South Asian Middle Eastern East Asian or Black Canadians
2 To investigate whether there were differences in the prevalence of chronic pain (the primary
dependent variable) pain intensity and activity limitation (the secondary dependent variables)
among Middle Eastern South Asian Black and East Asian EM groups in Canada
3 To explore the association between the bio-psychosocial factors (including acculturation) and
chronic pain among the members of the four EM groups who reported chronic pain
242 Research Questions
The three research questions for this study were
1 Are there differences in prevalence of pain expression pain intensity and activity limitation due
to pain between White Canadians and EM Canadians10 who self-reported as ethnic minorities
2 Are there differences in prevalence of pain expression pain intensity and activity limitation due
to pain among Canadians who self-report origins in Africa (various Black populations) South
Asia the Middle East and East Asia
3 Are the bio-psychosocial factors defined by the selected theoretical framework associated with
expression of pain pain intensity and pain interference with daily activity among these EM
groups
10 The first objective combined all EM Canadians who self-reported origins in Africa (various Black populations) South Asia the Middle East and East Asia
27
CHAPTER 3 METHODOLOGY
This study utilized data from the Canadian Community Health Survey (CCHS) years 2007-2013 and
the following section describes the study design data source study measures and data analysis
31 Study Design Questionnaire and Data Collection
This exploratory secondary data analytic study analysed cross-sectional data from the CCHS
The CCHS survey was administered to a sample of the Canadian population in each year CCHS is a
national cross-sectional survey which collects data at provincial and health region levels The survey
questionnaires were developed by specialists at Health Canada Statistics Canada provincial health
ministries and academic researchers in relevant fields (Statistics Canada 2011) The CCHS survey
was approved by both the Statistics Canada Advisory Committee and expert committees It collects
information about health status healthcare utilization and health determinants The CCHS has a
multi-stage dual frame design to improve coverage The sample for the CCHS is primarily a selection
of dwellings drawn from the Labour Force Survey area sampling frame The samples within the health
regions are selected using random digit-dialling (RDD) method Data are collected through both
structured in-person and telephone interviews administered through a Computer-Assisted Personal
Interviewing (CAPI) and Computer-Assisted Telephone Interviewing (CATI) systems (Statistics
Canada 2011) The sample survey design of the CCHS provides a probability sample with theoretical
basis for drawing statistical inferences about the population with known levels of confidence
In order to have a large enough sample size I combined a sample of data related to pain and
discomfort and other clinical and psychosocial variables from the last seven years (20072008
20092010 20112012 2013) The data were accessed and analysed through the Atlantic Research
Data Centre The combined sample provided us with 18195 EM respondents
32 CCHS Sample Power and Sample Sizes
In this secondary data analysis participants 18 years of age or older have been included The
sample sizes were 131061 participants in 20072008 131486 in 20092010 approximately 130000
participants in 20112012 and 65000 in 2013 (see Appendix B) The CCHS survey excluded residents
of institutions Indian reserves members of the Canadian Forces and some remote areas of the
North Response rates for all cycles used in this study are found to be greater than 77 Appendix B
shows a list of response rates for each year
The sample size for this study is calculated as a difference of proportions because the primary
dependent variable (experiencing chronic pain) is binary We are looking for a significance level (α) of
28
005 and a power to detect difference (1-β) of 08 The percentage of EM groups with chronic pain
based on previous literature is estimated to be 5 (Allison et al 2002) In light of similar studies
(Allison et al 2002 Palmer et al 2007) the best estimate of the magnitude of association between
chronic pain and EM groups is an odds ratio range of 18 to 26 Using this information my sample
size estimate was calculated using OpenEpi (K Sullivan Deanamp Soe 2009) and came out to range
from 274 to 801 participants from each of the four ethic groups
Missing Data
CCHS respondents who declined to answer or were unable to provide information on their EM
background were coded as missing and characteristics of EM groups with and without missing data
were compared on demographic profile and pain characteristics Missing data were excluded from the
analysis
33 Study Variables
331 The Dependent Variables
Pain and Discomfort
In the CCHS questionnaires there are three questions related to pain and discomfort (see
Appendix C) Participants were asked to report on the presence of lsquousual painrsquo to describe the lsquousual
intensityrsquo of pain and to state the number of activities that the pain interfered with The first pain related
question asks ldquoAre you usually free of pain or discomfortrdquo (CCHS 2010) This is a binary response
with a lsquoyesrsquo or lsquonorsquo answer Individuals who reported in the negative were considered to have chronic
pain and those who reported yes were considered to be free of chronic pain For the purposes of this
study we recoded all respondents who reported lsquonorsquo to being free of chronic pain as lsquoyesrsquo to having
chronic pain and considered this to be the primary dependent variable (see Figure 31) Individuals
who reported chronic pain were asked to describe the usual ldquointensity of painrdquo the intensity was rated
as either lsquomildrsquo lsquomoderatersquo or lsquoseverersquo (CCHS 2010) Participants were also asked ldquoHow many
activities does your pain and discomfort preventrdquo Possible answers included none a few some and
most (CCHS 2010) I considered the last two pain related questions to be the secondary dependent
variables See Figure 31 below for a flow diagram of the pain questionnaires in the CCHS
29
332 The Independent Variables
The primary explanatory variables analysed were EM status personal factors clinical factors
psychological factors and social factors (see Appendix D) These variables were identified in the
literature review and the theoretical framework and were restricted to what is available in CCHS
database
EM Status
Figure 31 The Pain Outcome Variable from the CCHS
QUESTION 1 Are you usually free
of pain and discomfort1
(THE PRIMARY DEPENDENT VARIABLE)
QUESTION 2 How would you described the
usual intensity of your pain or discomfort
(THE SECONDARY DEPENDENT VARIABLE)
QUESTION 3 How many activities
does your pain or discomfort prevent
(THE SECONDARY DEPENDENT VARIABLE)
Most
Some
A Few
None
Not Stated
Refused
Donrsquot Know
Not
Applicable
a
Not Applicable
a Donrsquot Know
Refused
Not Stated
No
Yes
Severe
Moderate
Stated
Mild
1All respondents who reported lsquonorsquo to being free of chronic pain were re-coded as having chronic pain
Figure 31 Pain Questions used in the CCHs
Not
Applicable
a Donrsquot Know
Refused
Not Stated
30
For the purpose of this thesis the term ldquoethnic minorityrdquo was defined by the race and ethnicity of the
target population (South Asian East Asian Middle Eastern and Black Canadians) EM status was
determined according to self-identification (see Table 31) ie by whether participants self-report as
Middle Eastern East Asian South Asian or Black Canadian
31
Table 31 Grouping of Ethnic Minorities from the Second Variable Black Canadians South Asians
Blacks South Asians
East Asians Middle Eastern
Chinese
Japanese
Korean
Filipino
Middle Eastern
Arab
West Asia
North African
Acculturation
Two variables were used to construct a variable to measure levels of acculturation of the EM
groups in the study language most often spoken at home and year of arrival in Canada We assigned
a score from 1 to 4 where 1 is low and 4 is very high acculturation An example of how the
acculturation scale was used is provided in Appendix E It is important to note that other scales
developed to measure acculturation have included similar variables Palmer et al 2007 who
investigated widespread chronic pain in EM groups developed a validated scale which included
language as a measurement of acculturation Another measurement tool developed by Benet-
Martinez considered country of birth language and length of time spent in country as measures of
acculturation (Benet‐Martiacutenez amp Haritatos 2005)
Demographic Factors
Personal factors included gender age and area of residence Participants were grouped into
the following six age categories 18-24 25-39 40-54 55-69 70-84 and 85+ Area of residence
included two measures province in which the participants resided and whether they lived in a rural or
urban setting (see Appendix D)
Clinical Factors
Clinical factors included 1) whether the participant self-reported having arthritis andor low
back problems 2) whether the participant had sustained any injuries in the past 12 months and 3)
whether the respondents had taken pain relievers in the past month (see Appendix D)
32
Psychological Factors
Many clinicians and researchers agree that depression and anxiety are associated with
increased prevalence of chronic pain (Louie amp Ward 2011 Lu et al 2013 Luo et al 2003) On this
basis the psychological factors included participantsrsquo self-perceived mental health and self-reported
depression and anxiety For this study self-perceived mental health was coded as ldquoexcellent ldquovery
goodrdquo ldquogoodrdquo ldquofairrdquo or ldquopoorrdquo (see Appendix D) Participants who respond yes to feeling sad blue or
depressed for two weeks or more in a row were considered to have depression Participants who
respond yes to the presence of a diagnosed anxiety disorder including phobia obsessive compulsive
disorder or panic disorder were considered to have anxiety (see Appendix D) (Mailis-Gagnon et al
2007) A study by Katon Egan and Miller (1985) found that two most frequent psychiatric disorders
for patients with chronic pain were depressive disorder and alcohol use disorder This is because
many suffering from chronic pain often use alcohol for temporary pain relief Therefore I included
alcohol use frequency as well This variable was coded based on whether participants consumed
alcohol ldquoless than once a monthrdquo ldquoonce a monthrdquo ldquo2 or 3 times a monthrdquo ldquoonce a weekrdquo or ldquo2 or more
times a weekrdquo
Social Factors
Social factors included education employment status income marital status living
arrangements and household size Education was re-coded into four categories high school non-
university certificate bachelorrsquos or graduate degree Income was categorized into four groups
highest upper middle lower middle and lowest Marital status was re-coded into six categories
(married living common-law widowed separated divorced or single) Lastly household size was re-
coded into four categories (1 person 2 person 3 person and 4 person or more) (see Appendix D)
34 Data Analysis
Statistical analysis was performed using SAS 93 and carried out in four parts In the following
sections I have provided an objective specific data analysis plan that guided this analysis
Data Quality Assurance and Descriptive Analysis
To test the robustness of the pain question used in the survey I cross-tabulated pain
prevalence intensity and interference with daily activity with participants who experienced either
arthritis andor low back pain with the study sample Descriptive statistics were analysed for clinical
psychological and socio-demographic variables for the four EM groups
33
Objective 1 To investigate whether there are differences in pain expression between White
Canadians and the combined four EM groups
I examined differences in chronic pain prevalence pain intensity and pain interference
percentages with normal activity among the combined four groups of self-reported Canadian EM and
majority (White Canadian) groups to address Objective 1 Cross-tabulations were used for descriptive
statistics and confidence intervals were used to determine statistical significance between the two
groups
Objective 2 To investigate whether there are differences in chronic pain expression intensity
and activity limitation due to pain among the four largest EM groups in Canada
Detailed statistical estimates were calculated to compare chronic pain expression pain intensity
and pain interference of daily activity by the four EM groups cross-tabulations and confidence
intervals were used again to determine statistical significance of any differences among these groups
Simple logistic regression models were calculated to analyse inter-ethnic minority differences in pain
expression pain intensity and pain interference of daily activity To allow for efficient estimates of the
regression models I combined the second (moderate intensity) and third (severe intensity) categories
for the pain intensity outcome variable into one category re-coded as lsquohigh intensityrsquo to increase the
number of observations (see Figure 33) For the activity limitation outcome variable I increased the
number of observations by combining the third (some activity limitation) and fourth (most activity
limitation) category The first model tested the association of the probability of reporting lsquomanyrsquo activity
interferences due to pain versus lsquononersquo and the second model tested the association of the probability
of reporting lsquoa fewrsquo activity interferences versus lsquononersquo (see Figure 34) Figures 32-34 show the
regression models used
Figure 32 The Simple Logistic Regression Models to Test the Association between Chronic Pain Expression and EM groups
The difference in pain expression and ethnic minority groups
119949119951 (119953
120783 minus 119953) = 119939120782 + 119939120783119961120783
Where
p = the probability of reporting yes to chronic pain
x1= the categorical explanatory variable ethnic minority status (Black (ref) South Asian East Asian Middle
Eastern)
34
Figure 33 Simple Logistic Regression Models to Test the Association between High vs Low Chronic Pain Intensity and EM groups
Figure 34 Simple Logistic Regression Models to Test the Association between Number of Activities Affected (preventedcurtailed) due to Chronic Pain and EM groups
Objective 3 To explore the association between the bio-psychosocial risk factors (including
acculturation) and chronic pain among the members of the four EM groups who reported
chronic pain
In order to address this question multiple logistic regression models were used to analyse the
relationship among EM groups and pain expression when adjusting for psychological and social
The difference in chronic pain intensity
119949119951 (119953
120783 minus 119953) = 119939120782 + 119939120783119961120783
Where
p = the probability of reporting high intensity versus low intensity chronic pain
x1= the categorical explanatory variable ethnic minority status (Black (ref) South Asian East Asian Middle
Eastern)
The difference in chronic pain interfering with daily activity Model 1
119949119951 (119953
120783 minus 119953) = 119939120782 + 119939120783119961120783
Where
p = the probability of reporting lsquomanyrsquo activity limitations versus none
x1= the categorical explanatory variable ethnic minority status (Black (ref) South Asian East Asian Middle
Eastern)
Model 2
119949119951 (119953
120783 minus 119953) = 119939120782 + 119939120783119961120783
Where
p = the probability of reporting lsquoa fewrsquo activity limitations versus none
x1= the categorical explanatory variable ethnic minority status (Black (ref) South Asian East Asian Middle
Eastern)
35
factors highlighted in the bio-psychosocial theoretical framework Statistical significance was tested
and reported at α = 005 with a confidence interval of 95
Weighting and Bootstrapping
All data were weighted using weights provided by Statistics Canada so that the estimates are
representative of the Canadian population As Statistics Canada surveys use complex stratified cluster
designs variance estimation for these designs cannot be carried out by simple formulas Therefore
Statistics Canada has suggested that users perform re-sampling variance estimation with the
bootstrap weights available in the CCHS master file (StatsCan 2005) The bootstrap re-sampling
weights were incorporated in my analysis In addition both the sample weights and the bootstrap
weights were normalized to represent the Canadian population Normalizing the weights means that
ldquothe survey weight for each member of the sample in the subpopulation being analysed is divided by
the mean of the survey weights for all members of the sample in the subpopulationrdquo (StatsCan 2013)
36
CHAPTER 4 RESULTS AND ANALYSIS
In this chapter the results of the analysis are presented in five parts that i) explore descriptive
statistics about the four EM groups (East Asian South Asian Middle Eastern and Black Canadian) ii)
investigate prevalence of chronic pain experience among White Canadians vs all EM groups
combined using cross-tabulations iii) infer statistical significance of the difference between pain
experience pain intensity and activity limitation among the four EM groups using cross-tabulations
and simple logistic regression models and iv) identify bio-psychosocial factors (see Figure 23
theoretical framework) that are statistically significantly associated with chronic pain experience in the
four EM study groups of interest
All of the estimates are adjusted with bootstrap and survey weights11 (see section 34) and a
significance level of plt005 was used for all analyses Tables 41 42 43 and 44 provide weighted
descriptive statistics for clinical psychological and socio-demographic variables for each of the four
EM groups These statistics are expressed as percentages and the statistical significance of
differences among South Asian East Asian Middle Eastern and Black Canadian are judged using
sample estimates and 95 confidence intervals
Missing Data
I compared the CCHS respondents who declined to answer or were unable to provide
information on their EM background with the included study sample with respect to (1) socio-
demographic characteristics and (2) pain characteristics The results showed no differences between
the respondents who declined to answer and the included sample for any of the socio-demographic
factors and chronic pain Twenty-four thousand six hundred and seventy seven subjects with missing
data about EM status were excluded from my analysis
41 Descriptive Statistics about the Four EM Groups
My analysis included 18195 adults aged 18 years and above The percentages vary by EM
groups 441 (95CI 412-469) to 511 (95CI 490-560) of the sample were males and
490 (95CI 440-540) to 559 (95CI 531-588) females 42 were East Asian 10
Middle Eastern 32 South Asian and 16 Black Canadians (see Table 41)
East Asians (16 95CI 11-21) had a statistically significantly higher percentage of
respondents aged 85 years or older The majority of the four EM groups reported either being married
or single compared to living in common-law being widowed separated or divorced and lived in a
household with an average size of four or more people There was no statistically significant
11 The end of section 35 in Chapter 3 provides details on how we applied sample weights and bootstraps to data
37
differences among the four groups for marital status For household size a higher percentage of
South Asians (50 95CI 475-525) compared to other EM groups reported living in a large
household (4+ members) and this was found to be statistically significant (p lt 005) (see Table 41)
The percentage of respondents with a post-secondary degree ranged from 364 (95 CI 336-
392) to 434 (95 CI 407-461) for bachelorrsquos degree and 73 (95 CI 49-96) to
119 (81-157) for graduate degree The differences in education among the four groups were
not found to be statistically significant 63 (95 CI 583-683) to 673 (95 CI 634-712)
of the EM groups also reported being employed and again the difference among the four groups was
not found to be statistically significant 261 (95CI 236-287) to 424 (95CI 384-
465) of the four EM groups reporting having an income of less than $40 000 (lower middle income)
and 347 (35CI 310-384) to 401 (95CI 374-428) reported having an income
between $40 000-$80 000 (middle income) The differences in household income among the four EM
groups was also not found to be statistically significant (see Table 41)
Table 41 The Socio-demographic and Environmental Characteristics of the Study Sample by EM Status1
EM Groups Variables East Asians
(N=7687) Middle Eastern (N=1718)
South Asians (N=5793)
Black Canadians (N=2997)
Sex (95CI)
Male 441(412-469) 510(460-560) 503(435-571) 449(404-494) Female 559(531-588) 490(440-540) 497(429-565) 551(506-596) Age (95CI)
18-24 176(94-258) 224(122-325) 208(119-296) 178(123-234) 25-39 301(283-319) 388(330-450) 374(335-414) 366(336-397) 40-54 256(212-299) 231(187-276) 207(181-234) 240(204-276) 55-69 160(120-201) 109(63-154) 147(117-177) 149(126-172) 70-84 91(81-100) 43(245-61) 57(41-72) 59(36-82) 85+ 16(11-21) 048(0-10) 07(03-11) 07(03-10)
Marital Status (95CI)
Married 500(345-652) 507(365-650) 555(408-702) 325(241-408) Living common-law 23(13-34) 15(0 -33) 13(01-25) 51(31-70) Widowed 54(42-67) 24(14-35) 42(31-52) 37(26-48) Separated 21(13-29) 29(14-44) 17(08-26) 56(42-70) Divorced 32(26-39) 45(27-64 29(19-38) 75(51-98) Single never married 370(225-515) 379(236-522) 345(200-489) 457(379-535) Household size (95CI)
1 person 203(172-234) 185(152-216) 118(96-140) 263(231-295) 2 person 216(114-318) 172(112-232) 166(115-216) 225(168-283) 3 person 255(159-352) 226(152-299) 216(169-263) 213(146-280) 4 or more person 326(297-355) 419(380-457) 500(475-525) 298(256-341) Community Residence (95CI)
Urban 964(958-970) 971(930-1000) 969(954-984) 953(940-966) Rural 36(30-42) 29(00-70) 31(16-46) 47(34-60) Education level (95CI)
High School 378(355-401) 404(333-475) 409(377-441) 388(21-455) Non-University
certificate 108(95-121) 91(36-146) 110(73-46) 145(96-194)
Bachelorrsquos degree 434(407-461) 386 (335-438) 364(336-392) 395(351-438) Graduate 80(66-94) 119(81-157) 117(83-151) 73(49-96)
38
Income (95CI)
No Income 11(06-16) 10(00-21) 03(0-06) 03(00-09) Lower middle income 288(269-306) 404(361-447) 261(236-287) 424(384-465) Middle income 387(367-407) 347(310-384) 401(374-428) 357(288-425) Upper middle income 279(259-299) 207(167-248) 287(260-315) 194(156-232) Highest income 36(28-43) 31(03-60) 47(26-68) 21(06-37) Has Employment (95CI)
Yes 663(619-707) 633(583-683) 658(619-697) 673(634-712) No 337(293-381) 367(317-417) 342(303-381) 327(288-366) Has a regular doctor (95CI)
Yes 856(844-868) 848(816-880) 850(832-868) 842(819-864) No 144(132-156) 152(120-184) 150(132-168) 158(136-181)
Note Lower Middle less than $40 000 Middle income $40 000 or more but less than $80 000 Upper middle income $80 000 or more but less than $150 000 Highest income $150 000 and over 1Results are weighted to the Canadians population and are representative of most of the population
42 Clinical Factors
Seven and a half percent (95CI 62-88) to 108 (95 CI 73-142) of all EM groups
reported sustaining an injury The difference among EM groups was not found to be statistically
significant Eight point seven percent (95 CI 69-106) to 104 (95CI 80-124) of EM
groups reported lsquoyesrsquo to experiencing arthritis and 133 (95 CI 118-148) to 172 (95 CI
139-205) reported lsquoyesrsquo to low back pain Pain medication use ranged from 379 (95 CI
235-523) to 537 (95CI 197-877) in all EM groups Again these differences among EM
groups were not found to be statistically significant (see Table 42)
Table 42 Clinical Factors of the Study Sample by EM Status1
(95CI) East Asians Middle Eastern South Asians Black Canadians
(N=7687) (N=1718) (N=5793) (N=2997)
Sustaining Injuries
75(6288) 101(54149) 86(66107) 108(73142) Has Arthritis
91(79102) 87(69106) 97(70124) 104(80127) Experiences Low Back Pain
133(118148) 172(139205) 139(123155) 151 (132171) Uses Pain Medication
379(235523) 537(197877) 439(32855) 462(181743) 1Results are weighted to the Canadian population and are representative of most of the population
43 Psychological Characteristics
Compared to Black Canadians (432 95CI 399-465) South Asians (372 95CI
352-392) and Middle Eastern (397 95CI 331-462) 298 (95CI 280-315) of
East Asians reported lsquoexcellentrsquo self-perceived mental health This difference was found to be
statistically significant Among the four EM groups 26 (95CI 20-32) of those in the East
Asian Group compared to Black Canadians (44 95CI 32-56) Middle Eastern (66
95CI 46-86) and South Asian (46 95CI 35-57) reported lsquoyesrsquo to experiencing
depression and this difference was statistically significantly different (p lt 005) A statistically
39
significantly higher percentage of South Asians (229 95CI 206-253) compared to East
Asian (156 95CI 139-172) Canadians reported drinking alcohol two or more times a week
(see Table 43)
Table 43 Psychological Characteristics of the Study Groups by EM Status1
(95CI) EM Groups
East Asians Middle Eastern South Asian Black Canadians (N=7687) (N=1718) (N=5793) (N=2997)
Self-Perceived mental health
Excellent 298(280315) 397(331462) 372(352392) 432(399465) Very Good 388 (370406) 32(282358) 337(302372) 321(29235) Good 261(244277) 23(147314) 241(21127) 198(171224) Fair 47(3954) 42(2361) 38(2947) 42(2362) Poor 07(0411) 12(0221) 12(0817) 07(0311) Experiences Depression
26(2032) 66(4686) 46(3557) 44(3256) Experiences Anxiety
21(1627) 37(2154) 33(2443) 34(2 47) Frequency of Alcohol Use
Less than once a month 388(346430) 242(173310) 269(23308) 31(271350) Once a month 161(133188) 127(52203) 152(127177) 154(125184) 2 to 3 times a month 137(120154) 191(47336) 159(136183) 15(117184) Once a week 159(143175) 225(165286) 19(157223) 173(113233) 2 or more times a week 156(139172) 214(163265) 229(206253) 212(167258)
1Results are weighted to the Canadians populations and are representative of most of the population
44 Acculturation Characteristics
The percentage of EM groups that reported having lived more than 10 years in Canada ranged
from 454 (95CI 415-493) to 506 (95 CI 489-524) For time spent in Canada the
difference among groups was not found to be statistically significant A higher percentage of Black
Canadians (707 95CI 634-780) reported speaking English most often at home compared to
the other three EM groups and this difference was found to be statistically significant (p lt 005) (See
Table 44)
When looking at acculturation levels a higher percentage of Middle Eastern Canadians (390
95CI 330-451) had low levels of acculturation compared to Black Canadians (171 95CI
110-231) East Asians (269 95CI 227-310) and South Asians (273 95CI 244-
303) This difference was found to be statistically significant (p lt 005) A higher percentage of East
Asians (529 95CI486-571 ) compared to Black Canadians had moderate acculturation and
this difference was also found to be statistically significant Lastly a higher percentage of Black
Canadians (486 95CI 414-558) compared to East Asians (203 188-218) South
Asians (273 95CI 244-303) and Middle Eastern (209 95CI 169-249) Canadians
had high acculturation and again this difference was statistically significant (p lt 005) (See Table 45)
40
Table 44 Acculturation factors and EM Groups 1
(95CI) East Asians Middle Eastern South Asians Black Canadians
(N=7687) (N=1718) (N=5793) (N=2997)
Time Spent in Canada
gt10 years 506(489524) 454(415493) 497(456537) 478(438518) lt10 years 494(476511) 546(507585) 503(463544) 522(482562)
Languages Most Often Spoken at Home English 393(367418) 344(277410) 458(396521) 707(634780)
Other 607(582633) 656(590723) 542(479604) 293(220366) 1Results are weighted to the Canadian population and are representative of most of the population
Table 45 EM Groups by Acculturation Levels1
(95CI)
East Asians Middle Eastern South Asians Black Canadians
Acculturation Levels (N=7687) (N=1718) (N=5793) (N=2997)
Low Acculturation 269(227310) 390(330451) 273(244303) 171(110231) Moderate Acculturation 529(486571) 401(354447) 439(413465) 343(305382) High Acculturation 203(188218) 209(169249) 287(252322) 486(414558)
1Results are weighted to the Canadian population and are representative of most of the population
45 Chronic Pain Prevalence among White Canadians and Four EM Groups (Objective 1)
Table 46 shows chronic pain prevalence pain intensity and activity limitation due to chronic
pain among the combined four EM groups and White Canadian respondents Chronic pain (see Table
46) was found to be reported significantly more often in White Canadians (193 95CI 169-
216) compared to the four EM groups combined (131 95CI 108-154) Severe pain
intensity was also reported significantly more often in White Canadians (173 95CI 163-181)
compared to all EM groups combined (130 95CI 106-153) There were no significant
differences between the two groups for the number of activity limitations due to chronic pain
Table 46 Chronic Pain in the Four EM Groups and White Canadians1
(95CI)
EM Groups (East Asians Middle Eastern South Asians and Black Canadians) (N=18 195)
White Canadians (N=320 859)
With Chronic Pain 131(108154) 193(169216)ⱡ
Pain Intensity Mild 443(413473) 290(284358)ⱡ
Moderate 427(400454) 537(527546)ⱡ Severe 130(106153) 173(163181)ⱡ
Activity Limitation None 310(263356) 276(272358)
A Few 327(292363) 293(292358) Some 235(2062537) 234(206257) Most 128(107148) 197(107147)
1Results are weighted to the Canadians populations and are representative of most of the population
41
46 The Differences in Pain Expression Pain Intensity and Activity Limitation among the Four EM Groups (Objective 2)
This section summarizes Objective 2 results Chronic pain experience across the four EM
groups was very similar and no statistically significant difference was found in pain experience The
Middle Eastern and Black Canadian groups had the highest experience of chronic pain at 17
followed by South Asian groups at 16 (see Table 47)
Nine point one percent (95 CI 37145) to 196 (95CI 126-266) of all EM groups
experienced having lsquoseverersquo chronic pain intensity and 92 (95 CI 62-124) to 185 (95 CI
112-259) of EM groups having lsquomostrsquo daily activities limited due to chronic pain (see Table 47)
The group differences for pain intensity and activity limitation were not found to be statistically
significant however
Three simple logistic regression models were run to analyse the odds of reporting lsquoyesrsquo to
experiencing chronic pain experiencing lsquohigh intensityrsquo chronic pain and lsquoa fewrsquo or lsquomanyrsquo activity
limitations due to chronic pain in East Asian Middle Eastern and South Asian compared to Black
Canadians (reference group) (see Table 48) The results show that the odds of the East Asian group
experiencing lsquohigh12rsquo pain intensity is 047 (95CI031-069) times the odds of Black Canadians
group this association was found to be statistically significant
Table 47 Chronic Pain in the Four Ethnic Minority Groups1
EM Groups
(95CI) East Asians Middle Eastern South Asians Black Canadians
(N=7687) (N=1718) (N=5793) (N=2997)
With Chronic Pain 149(137160) 167(115219) 155(133177) 168(148188)
Pain Intensity Mild 529(459599) 401(295507) 388(302473) 359(292425)
Moderate 380(336423) 403(291515) 461(399524) 477(409545) Severe 91(37145) 196(126266) 151(103198) 164(112216)
Activity Limitation None 339(280398) 239(167312) 257(210304) 319(256382)
A Few 342(286397) 312(224401) 305(249361) 336(260411) Some 227(191263) 263(165361) 276(228323) 199(116281) Most 92(60124) 185(112259) 163(124201) 146(106187)
1Results are weighted to the Canadians populations and are representative of most of the population
12 High intensity includes moderate and severe intensity
42
Table 48 Odds Ratio of Experiencing Chronic Pain Pain Intensity and Activity Limitation by EM Groups EM Groups (OR 95 CI)1
Chronic Pain Ref=No Chronic Pain
Pain Intensity Ref=Low Intensity
Activity Limitationsc Many vs None
Activity Limitationsd
Some vs None
Model 1 ln(p(1-p))=b0 +b1x1
Black Canadians (Ref)
100 100 100 100
East Asians 087(070110) 047(031069) 088(055141) 102(055187) Middle Eastern 102(063164) 085(048148) 178(098325) 141(073270) South Asians 093(068127) 090(057142) 160(099259) 109(056211)
1the odds of reporting lsquoyesrsquo to chronic pain lsquohighrsquo to pain intensity and lsquomanyrsquo or `some to activity limitation due to chronic pain x1= the categorical explanatory variable ethnic minority status (Black (ref) South Asian East Asian Middle Eastern) p= the probability of reporting lsquoyesrsquo to chronic pain lsquohigh=moderate + severersquo to pain intensity and lsquomany=most somersquo to activity limitation due to chronic pain c= The probability of reporting `many` activity limitations compared to `none` d= The probability of reporting `some` activity limitations compared to `none` Significant at plt005
461 Data Quality Assurance
Although the pain question used in the CCHS is considered to measure chronic pain the
question did not include a specified duration (eg pain must be persistent for three months) as is
normally done in pain literature I therefore conducted a data quality assurance to test whether the
questions used accurately assessed chronic pain Table 49 shows the results of chronic pain
prevalence in only EM groups who report experiencing arthritis andor low back pain When comparing
the results from table 49 to pain expression in all of the four EM groups (Table 47) the results
consistently show there is no statistically significant difference in reported pain expression pain
intensity or activity limitation among the four groups As the trends between the two samples used for
calculations in table 47 and table 49 are similar we considered that the pain question used in the
CCHS appears to be capturing data on respondents with chronic pain
Table 49 Chronic Pain in Four EM Groups Limited to those with Chronic Conditions1
EM Groups East Asians Middle Eastern South Asians Black Canadians
(N=1420) (N=375) (N=1125) (N=632)
With Chronic Pain (95CI) 411(367454) 447(357538) 474(427521) 442(380505)
Pain Intensity (95CI) Mild 412(348475) 329(192467) 273((149397) 266(187346)
Moderate 464(403525) 451(337565) 543(422664) 521(398644) Severe 125(70179) 220(69370) 185(131239) 213(122304)
Activity Limitation (95 CI) None 253(189316) 171(72269) 190(127253) 242(154330)
A Few 349(268431) 299(130469) 271(208333) 360(267452) Some 276(216336) 310(167453) 329(260397) 200(114286) Most 122(83161) 220(102338) 211(157265) 199(141256)
1Results are weighted to the Canadians populations and are representative of most of the population
43
462 Acculturation and Chronic Pain Experience
Acculturation has been identified in the literature as an important factor to consider when looking
at inter-ethnic minority pain experience Table 410 illustrates the role of acculturation in chronic pain
experience in the four EM groups Table 410 also shows that a significantly (p lt 005) higher
percentage of EM respondents with high acculturation report lsquoyesrsquo to experiencing chronic pain
compared to those with low acculturation This same statistically significant pattern can be observed
for pain intensity and activity limitation A larger percentage of respondents with high acculturation
experienced having severe chronic pain intensity and most of their daily activities were limited by
chronic pain However in both these situations the difference was not found to be statistically
significant In Table 410 I also looked at acculturation levels and pain experience within each
individual EM group and found the same pattern to be apparent in the Black Canadian group A higher
percentage of Black Canadians with high acculturation reported lsquoyesrsquo to experiencing chronic pain and
this difference was found to be statistically significant For the East Asian group chronic pain
experience was highest in the moderate acculturation group (see Table 410) and again this difference
was found to be statistically significant (plt005) when compared to East Asians with low acculturation
Among the South Asian group moderate and high acculturation groups had a higher percentage of
chronic pain compared to those with low acculturation (see Table 410) and these differences were
found to be marginally significant
Table 410 Acculturation and Chronic Pain Intensity and Activity Limitation by each EM Group Acculturation Levels
All Four EM Groups
East Asians Middle Eastern South Asians Black
Canadians (N=7687) (N=1718) (N=5793) (N=2997)
With Chronic Pain (95CI)
Low 130(115 146) 115(91140) 155(97214) 107(56157) 120(68172) Moderate 198(185212) 180(156205) 183(116250) 186(158215) 141(99183) High 234(217252) ⱡ 157(131184) 219(98339) 194(158230) 225(188261) Pain Intensity
(95CI)
Low Mild 472(413531) 572(470673) 345(196494) 509(347670) 366(55677) Moderate 410(324495) 343(198489) 402(242563) 397(263531) 434(172696) Severe 118(53183) ⱡ 85(00211) 253(113392) 94(00188) 200(00582) Moderate Mild 400(361440) 516(426606) 384(192576) 364(287441) 364(204524) Moderate 456(416497) 387(320455) 481(264697) 469(384554) 531(378683) Severe 143(118169) ⱡ 96(24169) 135(39231) 167(103230) 106(27185) High Mild 383(349418) 578(488669) 488(273703) 342(247437) 352(257447) Moderate 462(429496) 342(255428) 343(152535) 494(398591) 468(378558) Severe 154(128180) ⱡ 80(33127) 169(00352) 164(90238) 179(103256)
44
Activity Limitation due to Pain (95CI)
Low None 351(272430) 377(259495) 300(148451) 338(215460) 379(09749) Some 342(234451) 302(144460) 307(76539) 403(191614) 267(96439) A Few 226(173279) 232(144320) 246(104387) 238(88388) 205(00620) Most 81(47115) ⱡ 89(31147) 147(21273) 21(0046) 149(00375) Moderate None 286(249324) 319(250389) 212(100323) 261(178344) 276(75476) Some 330(295366) 352(286418) 322(169475) 273(190356) 396(234557) A Few 245(215275) 247(185309) 295(158432) 284(214355) 197(45348) Most 138(108168) ⱡ 82(23141) 172(63281) 182(117246) 132(37226) High None 284(245323) 325(204446) 156(18294) 212(83340) 330(227432) Some 321(290353) 372(248496) 392(17767) 265(183347) 314(229398) A Few 243(202284) 221(129313) 297(00641) 329(209449) 210(131289) Most 152(128176) ⱡ 82(33131) 155(00346) 194(104284) 146(86207)
1Results are weighted to the Canadians populations and are representative of most of the population ⱡSignificant differences within the four EM groups (plt005) for those marked
47 Bio-Psychosocial Factors and Pain Experience (Objective 3)
This section summarizes results for Objective 3 The results from the multiple logistic regression
models illustrate the relationship among EM groups and pain experience (yes versus no) pain
intensity (high versus low) activity limitation (none versus many and none versus a few) when
adjusted for psychological and social factors from a bio-psychosocial framework (Figure 23) The
results indicate psychological and social factors that are significantly associated with pain experience
in the four EM groups
471 Psychological Factors and Chronic Pain Experience
The association between chronic pain and EM groups after adjusting for psychological factors
are included in Table 411 According to the results East Asians are 077 (95CI 063-096) times
less likely to experience chronic pain compared to Black Canadians The odds of East Asians
experiencing lsquohighrsquo pain intensity were statistically significantly lower than Black Canadians when
adjusting for each psychological factor included in the theoretical framework (Figure 23) separately
The odds of East Asians experiencing lsquohighrsquo pain intensity compared to Black Canadians were 043
(95 Cl 030-064) when adjusted for self-perceived mental health 048 (95 CI 033-070) when
adjusted for depression 048 (95Cl 032-071) when adjusted for anxiety and 036 (95 CI 023-
059) when adjusted for alcohol use frequency
In the next model (see Table 412) even after adjusting for acculturation the East Asians still
had lower odds of experiencing chronic pain compared to Black Canadians For pain intensity East
Asians had lower odds of experiencing lsquohighrsquo pain intensity compared to Black Canadians and the
association remained statistically significant The final model I ran was a multiple logistic regression
adjusting for all of the significant psychological factors (self-perceived mental health depression and
anxiety) and acculturation to determine if the association between East Asian group membership and
chronic pain would remain significant (see Table 413)
45
When adjusting for the three psychological factors and acculturation the odds ratio for the East
Asian group experiencing lower levels of lsquohighrsquo pain intensity relative to Black Canadians was still
statistically significant (OR 037 95CI 021-063) (see Table 414) Therefore the results suggest
that group differences in acculturation and the included psychological factors do not explain the
lowered risk of high pain intensity among the East Asian group compared to the Black Canadian
group High acculturation remained statistically significantly associated with pain expression among
EM groups when adjusted for the three psychological factors separately (see Table 412) and then
altogether (see Table 413) Moderate acculturation remained statistically significantly associated with
pain expression when adjusted for self-perceived mental health (OR 153 95CI 144-221)
depression (OR159 95CI 131-192) and anxiety (OR 172 95CI 141-210) (see Table 412)
Psychological Factors of Chronic Pain
Self-perceived mental health anxiety and depression were strongly associated with reporting
lsquoyesrsquo to chronic pain (see Table 411) EM groups who reported having lsquopoorfairrsquo self-perceived mental
health were 599 (95Cl 426-843) times to report lsquoyesrsquo to having chronic pain compared to those
with lsquoexcellentrsquo self-perceived mental health EM groups who reported suffering depression and
anxiety were 436 (95Cl 323-590) and 450 (95Cl 316-656) times respectively to report lsquoyesrsquo
to having chronic pain compared to those without depression and anxiety (see Table 411)
Table 411 Odds Ratio of Chronic Pain in EM Group when Adjusted for Psychological Factors EM Groups (OR 95 CI)1 Chronic Pain
Ref=No Chronic Pain
Pain Intensity Ref=Low Pain Intensity
Activity Limitationsc
Many vs None Activity Limitationsd
Some vs None
Model 1 ln( (p(1-p))= b0 +b1x1+ b2 (Self-Perceived Mental Health)
Black Canadians (Ref) 100 100 100 100 East Asians 077(063096) 043(030064) 078(049124) 077(063096) Middle Eastern 093(057151) 083(048144) 163(083318) 093(057151) South Asians 085(065112) 090(057140) 160(095268) 085(065112) Self-Perceived Mental Health
Excellent(Ref) 100 100 100 100
Very Good 140(111176) 136(090206) 104(052211) 140(111176) Good 221(170289) 138(094203) 141(081245) 221(170289) PoorFair 599(426843) 246(132459) 328(149720) 599(426843)
Model 2 ln(p(1-p))= b0 +b1x1+ b2(Depression)
Black Canadians (Ref) 100 100 100 100 East Asians 090(071113) 048(032071) 090(057144) 103(056190) Middle Eastern 096(059158) 081(047138) 164(089303) 138(071268) South Asians 091(065129) 088(056138) 157(097254) 108(054215) Depression (Ref=no) 436(323590) 212(107419) 371(179768) 199(078507)
Model 3 ln (p(1-p))= b0 +b1x1+ b2 (Anxiety)
Black Canadians (Ref) 100 100 100 100 East Asians 089(07201107) 048(032071) 092(057147) 101(055186) Middle Eastern 100(06371578) 082(048141) 174(096314) 138(071267) South Asians 092(06821253) 089(054146) 159(099256) 108(055212) Anxiety (Ref=no) 450(316656) 219(068707) 347(152791) 176(073 422)
46
Model 4 ln (p(1-p))= b0 +b1x1+ b2 (Alcohol Use Frequency)
Black Canadians (Ref) 100 100 100 100 East Asians 070(040120) 036(022058) 076(041138) 083(039178) Middle Eastern 107(064179) 057(021153) 219(070679) 150(0211028) South Asians 088(053144) 065(039109) 157(081304) 101(039259) Alcohol Use Frequency Less than once a
month (Ref) 100 100 100 100
Once a month 074 (056097) 080(040159) 108(055211) 133(066267) 2 to 3 times a month 065(046092) 095(016562) 082(009693) 103(030353) Once a week 061(040095) 053(028099) 058(019172) 077(04014) 2 or more times a week 081(054120) 091(046182) 085(033215) 072(039131)
1the odds of reporting lsquoyesrsquo to chronic pain lsquohighrsquo to pain intensity and lsquomanyrsquo or `some to activity limitation due to chronic pain when adjusted for each of the psychological factors separately p= the probability of reporting lsquoyesrsquo to chronic pain lsquohighrsquo to pain intensity and lsquomanyrsquo to activity limitation due to chronic pain when adjusted for each of the factors from the bio-psychosocial model x1= the categorical explanatory variable ethnic minority status (Black (ref) South Asian East Asian Middle Eastern) c= The probability of reporting `many` activity limitation compared to `none` d= The probability of reporting `some` activity limitation compared to `none` Significant at plt005
Table 412 Odds Ratio of Chronic Pain in EM Group when Adjusted for Psychological Factors and Acculturation Chronic Pain
Ref=No Chronic Pain Pain Intensity Ref=Low Pain Intensity
Activity Limitationsc
Many vs None
Model 1 ln (p(1-p))= b0 +b1x1+ b2 (Self-Perceived Mental Health)+ b3
(Acculturation)
Black Canadians (Ref) 100 100 100 East Asians 083(067104) 043(029065) 086(048155) Middle Eastern 106(063177) 087(047157) 200(090441) South Asians 091(068121) 089(055141) 168(091312) Self-Perceived Mental Health Excellent(Ref) 100 100 100 Very Good 140(109181) 140(093212) 109(053221) Good 222(166298) 138(095201) 147(087250) Poor Fair 603(414879) 252(131482) 345(169 708) Acculturation (Ref=low)
Moderate 153(127185) 127(068238) 158(098254) High 179(144221) 120(079184) 185(085404)
Model 2 ln (p(1-p))= b0 +b1x1+ b2 (Depression)+ b3 (Acculturation)
Black Canadians (Ref) 100 100 100 East Asians 094(074120) 048(03307) 098(056173) Middle Eastern 107(064179) 083(048144) 187(095372) South Asians 096(068135) 087(056137) 162(090292) Depression (Ref=no) 425(314575) 211(111403) 366(17875) Acculturation(Ref=low)
Moderate 159(131192) 129(085198) 153(099238) High 170(140206) 118(083169) 166(088312)
Model 3 ln (p(1-p))= b0 +b1x1+ b2 (Anxiety)+ b3 (Acculturation)
Black Canadians (Ref) 100 100 100 East Asians 094(075117) 048 (032071) 099(055178) Middle Eastern 112(071177) 084(049145) 199(102385) South Asians 097(072130) 088(053144) 164(093289) Anxiety (Ref=no) 446(311639) 219(070686) 347(15876) Acculturation (Ref=low)
Moderate 160(131194) 129(086194) 155(100241) High 172(141210) 119(083169) 168(092306)
47
Model 4 ln (p(1-p))= b0 +b1x1+ b2 (Alcohol Use Frequency)+ b3 (Acculturation)
Black Canadians (Ref) 100 100 100 East Asians 076(044131) 037 (022061) 087(045171) Middle Eastern 117(072191) 059(022153) 248(071867) South Asians 090(056145) 064(038109) 161(081318) Alcohol Use Frequency Less than once a month
(Ref) 100 100 100
Once a month 075(057100) 081(040166) 111(055222) 2 to 3 times a month 064 (045091) 099(01855) 082(010699) Once a week 061 (039098) 054(028104) 059(020171) 2 or more times a week 078(052116) 090(046174) 080(033195) Acculturation (Ref=low)
Low 100 100 100 Moderate 136(097191) 131(082208) 135(071258) High 163(115232) 119(073193) 174(085356)
1the odds of reporting lsquoyesrsquo to chronic pain lsquohighrsquo to pain intensity and lsquomanyrsquo or `some to activity limitation due to chronic when adjusted for the psychological factors and acculturation p= the probability of reporting lsquoyesrsquo to chronic pain lsquohighrsquo to pain intensity and lsquomanyrsquo to activity limitation due to chronic pain when adjusted for each of the factors from the bio-psychosocial model x1= the categorical explanatory variable ethnic minority status (Black (ref) South Asian East Asian Middle Eastern) c= The probability of reporting `many` activity limitation compared to `none` Significant at plt005
1the odds of reporting lsquoyesrsquo to chronic pain lsquohighrsquo to pain intensity and lsquomanyrsquo to activity limitation due to chronic when adjusted for the psychological factors and acculturation p= the probability of reporting lsquoyesrsquo to chronic pain lsquohighrsquo to pain intensity and lsquomanyrsquo to activity limitation due to chronic pain when adjusted for each of the factors from the bio-psychosocial model x1= the categorical explanatory variable ethnic minority status (Black (ref) South Asian East Asian Middle Eastern) c= The probability of reporting `many` activity limitation compared to `none` Significant at plt005
Table 413 Odds Ratio of Chronic Pain in EM Group when Adjusted for all Psychological Factors Odds Ratio Estimates Chronic Pain Pain Intensity Activity Limitationsc Ref= No Chronic Pain Ref=Low Pain Intensity Many vs None
Model 1 ln (p(1-p))= b0 +b1x1+ b2 (Self-Perceived Mental Health)+ b3 (Depression)+ b4 (Anxiety)+ b5(Alcohol Use Frequency)
Black Canadians (Ref) East Asians 072(040127) 037(021063) 084(044161) Middle Eastern 106(068165) 055(026119) 221(066740) South Asians 084(047150) 062(036108) 164(070385) Self-Perceived Mental Health
Excellent(Ref) Very Good 132(101174) 122(073202) 091(050165) Good 206(138307) 132(078224) 138(068280) PoorFair 548(335896) 188(080443) 288(091913) Depression (Ref=no) 165(098276) 147(031700) 208(050871) Anxiety (Ref=no) 213(110411) 121(043341) 177(05656) Alcohol Use Frequency Less than once a month
(Ref)
Once a month 075(056100) 074(034158) 099(046211) 2 to 3 times a month 062(044086) 097(018525) 085(010754) Once a week 065(044098) 054(027107) 059(021171) 2 or more times a week 078(055112) 087(044173) 072(027191) Acculturation
Low(Ref) 100 100 100 Moderate 125(088178) 125(077203) 130(070241) High 155(106227) 118(070198) 170(075388)
48
472 Socio-Demographic Factors and Chronic Pain
Table 414 presents the ORs for chronic pain in the four EM groups when adjusted for each
socio-demographic factor separately The odds of East Asians reporting lsquohighrsquo pain intensity were
lower compared to the Black Canadians this difference was found to be statistically significant
(plt005) The odds of East Asians reporting lsquohighrsquo pain intensity compared to Black Canadians when
adjusted for sex age having a regular doctor marital status household size area of residence
income education employment languages and time spent in Canada separately ranged from 040 to
048 When adjusted for sex and household size South Asian groups were 162 (95Cl 101-260)
and 174 (95Cl 101-283) times as likely to experience lsquomanyrsquo activity limitations due to chronic pain
compared to Black Canadians Middle Eastern groups were 190 (95Cl 102-352) 199 (95CI
107- 371) and 194 (95CI105-357) times as likely respectively to experience lsquomanyrsquo activity
limitations compared to Black Canadians when adjusted for age income and time spent in Canada
separately (see Table 414) When the regression model was adjusted for acculturation East Asians
still had lower odds of experiencing lsquohighrsquo pain intensity compared to the Black Canadians at an odds
ratio of 044 (95Cl 032-069) However the odds of experiencing lsquomanyrsquo activity limitations
increased in Middle Eastern groups to 21 (95 CI 104-404) times as likely as Black Canadians
when the model was adjusted for acculturation As in the previous section I ran the regression models
again but adjusting for each socio-demographic variable that was found to be significant and for
acculturation to determine if the latter behaved as confounder (see Table 415) After adjusting for
household size and acculturation the odds of the South Asians group experiencing lsquomanyrsquo activity
limitations compared to Black Canadians was no longer significant (see Table 415) Conversely the
odds of experiencing lsquomanyrsquo activity limitations in Middle Eastern groups compared to Black
Canadians increased from 184 (95 CI 099-342) to 205 (95CI 103-412) ndash a difference that is
statistically significant when adjusted for acculturation and household size The results from a final
multiple regression model adjusting for all of the significant socio-demographic factors (age sex
marital status household size income employment and time spent in Canada) and acculturation
(see Table 416) showed that the OR for East Asians experiencing lsquohighrsquo pain intensity remained
statistically significantly reduced relative to Black Canadians (OR 04 95CI 026-076) As well after
adjusting for all of the significant socio-demographic factors the odds of Middle Eastern Canadians
experiencing lsquoa fewrsquo activity limitations compared to lsquononersquo became statistically significant (OR 28
95CI 109-717 ndash see Table 416)
49
Socio-Demographic Factors of Chronic Pain
Age sex marital status household size employment time spent in Canada and acculturation
were statistically significantly associated with chronic pain in the four EM groups (see Table 414) EM
in the oldest age groups (85+) had the highest odds of reporting lsquoyesrsquo to chronic pain (OR 1281
95CI 715-2295) EM who reported being widowed had the highest experience of chronic pain (OR
54 95CI 386-777) EM who were employed (OR 067 95CI 050-089) had three or more
persons in a household (3 persons OR 066 95CI 052-085 4 persons OR 062 95CI 051-
075) or who had spent fewer than ten years in Canada (OR 052 95CI 044-061) had lower odds
of reporting lsquoyesrsquo to chronic pain Moderate (OR 16 95CI 134-196) or high (OR 178 95CI
146-215) acculturation was a significantly associated with chronic pain experience in the three EM
groups relative to Black Canadians Moderate acculturation was statistically significantly associated
with experiencing lsquomanyrsquo (OR 15 95CI 101-234) activity limitations (see Table 414) relative to
Black Canadians Moderate and high acculturation remained statistically significant when adjusted for
sex (Moderate-OR 164 95CI 136-198 High- OR 178 95CI 147-216) marital status
(Moderate-OR 148 95CI 123-179 High-OR163 95CI 135-198) household size (Moderate-
OR156 95CI 129-189 OR 164 95CI 134-200) and employment (Moderate-OR 154
95CI 126-187 High- OR 182 95CI 149-223) for pain expression among EM groups (see
Table 415) When I adjusted for all of the significant socio-demographic factors (age sex marital
status household size income employment and time spent in Canada) and acculturation in the final
regression model (see Table 416) only age (OR [45 years to 54 years] 330 95CI 205-535 OR
[55years to 69 years] 466 95CI 298-728 OR [70 years to 84 years] 702 95CI 351-1401)
and sex (OR149 95CI 123-180) remained statistically significant
50
Table 414 Odds Ratio of Chronic Pain in EM Group when Adjusted for Socio-Demographic Factors
EM Groups (OR 95 CI)1
Chronic Pain Ref=No Chronic Pain
Pain Intensity Ref=Low Pain Intensity
Activity Limitationsc
Many vs None Activity Limitationsd
Some vs None
Model 1 ln (p(1-p))= b0 +b1x1+ b2 (Sex)
Black Canadians (Ref) 100 100 100 100 East Asians 086(070107) 047(032069) 089(056142) 102(055188) Middle Eastern 105(067165) 086(050149) 181(099329) 142(074272) South Asians 095(072124) 091(056146) 162(101260) 110(057211) Sex (Ref=Male) 160(138186) 117(090152) 112(073170) 109(071169)
Model 2 ln (p(1-p))= b0 +b1x1+ b2 (Age)
Black Canadians (Ref) 100 100 100 100 East Asians 079(063101) 0443(028068) 084(051138) 079(063101) Middle Eastern 116(067202) 0895(048165) 189(102352) 116(067202) South Asians 093(066132) 0867(056132) 155 ( 092260) 093(066132) Age (Ref=18-25) 100 100 100 100 25-39 171(121242) 132(062280) 102(036287) 088(041190) 40-54 323(215487) 144(057363) 119(053269) 075(037153) 55-69 495(329743) 173(087346) 154(055432) 083(032214) 70-84 777(5061193) 228(095546) 194(076490) 099(042229) 85+ 1281(7152295) 276(104731) 305(099939) 095(028319)
Model 3 ln (p(1-p))= b0 +b1x1+ b2 (Has a Regular Doctor)
Black Canadians (Ref) 100 100 100 100 East Asians 087(070109) 047(031069) 088(056140) 102(056186) Middle Eastern 102(063164) 085(048149) 178(098322) 142(074272) South Asians 092(067127) 089(057140) 160(099257) 109(056211) Has a Regular doctor (Ref=no)
089(073110) 094(066134) 133(083213)
Model 4 ln (p(1-p))= b0 +b1x1+ b2 (Marital Status)
Black Canadians (Ref) 100 100 100 100 East Asians 085(065110) 046(029073) 088(054143) 101(057176) Middle Eastern 105 (062177) 084(044158) 178(094337) 141(072274) South Asians 090(062130) 088(058133) 161(098266) 110(058207) Marital Status Single never
married (Ref) 100 100 100 100
Married 183(139242) 104(060181) 086(049151) 079(049127) living common-law 196(118325) 068(023200) 053(015181) 047(018118) Widowed 542(384766) 142(071287) 141(036547) 094(034263) Separated 231(125426) 109(050236) 094(034261) 047(013161) Divorced 291(188451) 146(076281) 134(052342) 078(030204)
Model 5 ln (p(1-p))= b0 +b1x1+ b2 (Household Size)
Black Canadians (Ref) 100 100 100 100 East Asians 091(073112) 047(032070) 090(056146) 103(055193) Middle Eastern 109(068174) 088(048160) 184(099342) 143(074276) South Asians 102(075141) 096(061152) 174(107283) 113(056228) Household Size (Ref=1 Person)
100 100 100 100
2 093(075115) 087(056133) 083(052134) 088(053145) 3 066(052085) 069(045108) 078(046130) 081(031215) 4 061(050075) 065(045095) 064(043096) 082(054124)
` Model 6 ln (p(1-p))= b0 +b1x1+ b2 (Area of Residence)
Black Canadians (Ref) 100 100 100 100 East Asians 087(069110) 047(031069) 088(056140) 101(054189) Middle Eastern 102(063164) 085(049147) 178(098323) 141(074267) South Asians 093(068127) 090(056143) 159(098258) 109(055214) Area of Residence (Ref=Rural)
117(061227) 087(037201) 059(010347)
Model 7 ln (p(1-p))= b0 +b1x1+ b2 (Income)
Black Canadians (Ref) 100 100 100 100 East Asians 095(074122) 047(032071) 091(055150) 105(063175)
51
Middle Eastern 102(058178) 089(053150) 199(107370) 161(082315) South Asians 097(067141) 093(054160) 174(099305) 116(066204) Income (Ref= No Income)
100 100 100 100
Lower-Middle Income
231(065823) 186(0103512) 137(00113465) 231(065823)
Middle Income 155(044543) 148(0073157) 108(00110471) 155(044543) Upper-Middle
Income 138(037517) 146(0073067) 096(0019368) 138(037517)
Highest Income 146(035606) 080(0041575) 074(0019009) 146(035606)
Model 8 ln (p(1-p))= b0 +b1x1+ b2 (Education)
Black Canadians (Ref) 100 100 100 100 East Asians 081(055119) 047(028078) 091(050165) 107(054212) Middle Eastern 094(048184) 101(054189) 236(084663) 224(103486) South Asians 081(057116) 092(052164) 169(068414) 121(058252) Education (Ref=High school)
100 100 100 100
Non-University certificate
078(045136) 127(077211) 127(038430)
Bachelors Degree 078(056109) 114(074177) 113(060211) Graduate 062(045086) 128(067242) 104(045239)
Model 9 ln (p(1-p))= b0 +b1x1+ b2 (Employment)
Black Canadians (Ref) 100 100 100 100 East Asians 081(061109) 047(031071) 081(049133) 105(045246) Middle Eastern 099(057170) 086(048152) 168(086329) 153(072322) South Asians 089(066119) 084(052136) 152(090256) 119(051276) Employment (Ref=no) 050(043064) 065(053092) 062(030123) 052(046064)
Model 10 ln (p(1-p))= b0 +b1x1+ b2 (Languages)
Black Canadians (Ref) 100 100 100 100 East Asians 086(067111) 044(030066) 098(055172) 109(054219) Middle Eastern 101(061166) 079(045141) 193(098377) 153(075314) South Asians 092(067127) 086(055133) 170(096303) 116(052260) Languages (Ref=Other than Eng)
100(086117) 114(086151) 082(048140)
Model 11 ln (p(1-p))= b0 +b1x1+ b2 (Time Spent in Canada)
Black Canadians (Ref) 100 100 100 100 East Asians 088(071110) 047(031070) 090(055147) 102(056184) Middle Eastern 110(068177) 090(051158) 194(105357) 143(074276) South Asians 095(071127) 090(057143) 160(097263)` 110(059205) Time Spent in Canada (Ref=more than 10 yrs)
052(044061) 072(053096) 067(047095) 090(047172)
Model 12 ln (p(1-p))= b0 +b1x1+ b2 (Acculturation)
Black Canadians (Ref) 100 100 100 100 East Asians 092(073117) 046(031068) 096(053172) 104(053203) Middle Eastern 114(070186) 086(048 153) 205(104404) 153(077304) South Asians 098(072132) 088(056139) 166(091302) 114(055238) Acculturation (Ref=Low)
Moderate 162(134196) 129(084197) 154(101234) 127(066244) High 177(146215) 118(082168) 170(094308) 131(075229) 1the odds of reporting lsquoyesrsquo to chronic pain lsquohighrsquo to pain intensity and lsquomanyrsquo or `some to activity limitation due to chronic when adjusted for the socio-demographic factors p= the probability of reporting lsquoyesrsquo to chronic pain lsquohighrsquo to pain intensity and lsquomanyrsquo to activity limitation due to chronic pain when adjusted for each of the factors from the bio-psychosocial model x1= the categorical explanatory variable ethnic minority status (Black (ref) South Asian East Asian Middle Eastern) c= The probability of reporting `many` activity limitation compared to `none` d= The probability of reporting `some` activity limitation compared to `none` Significant at plt005
52
Table 415 Odds Ratio of Chronic Pain in EM Groups when Adjusted for Socio-Demographic Factors and Acculturation
EM Groups (OR 95 CI)1 Chronic Pain Ref=No Chronic Pain
Pain Intensity Ref=Low Pain Intensity
Activity Limitationsc
Many vs None
Model 1 ln (p(1-p))= b0 +b1x1+ b2 (Sex)+ b3(Acculturation)
Black Canadians (Ref) East Asians 092(074114) 047(032069) 097(055166) Middle Eastern 119(075189) 088(050155) 209(107419) South Asians 101(077131) 089(056144) 169(094309) Sex (Ref=Male) 062(053072) 084(065109) 088(059275) Acculturation (Ref=Low)
Moderate 164(136198) 128(084195) 153(101427) High 178(147216) 117(082168) 170(094460)
Model 2 ln (p(1-p))= b0 +b1x1+ b2 (Age)+ b3 (Acculturation)
Black Canadians (Ref) East Asians 081(064103) 044(029065) 091(050166) Middle Eastern 120(070206) 088(047165) 208(104419) South Asians 095(068132) 085(055130) 162(084309) 1 (18-25) (Ref) 25-39 168(117239) 133(062285) 096(034275) 40-54 311(207468) 142(054373) 107(048241) 55-69 473(308726) 170(079369) 132(041427) 70-84 739(4641178) 221(084585) 172(064460) 85+ 1198(6432233) 257(093704) 249(077800) Acculturation (Ref=Low)
Moderate 108(089132) 109(065184) 129(082206) High 114(092142) 101(067151) 144(070296)
Model 3 ln (p(1-p))= b0 +b1x1+ b2 (Marital Status)+ b3 (Acculturation)
Black Canadians (Ref) East Asians 089(068116) 048(029070) 096(053176) Middle Eastern 115(069193) 085(045162) 204(099420) South Asians 093(065134) 087(058132) 168(088320) Marital Status Single never married
(Ref)
Married 187(141248) 104(057190) 048(046155) living common-law 189(113319) 066(022207) 051(017152) Widowed 513(350752) 137(074256) 133(042420) Separated 219(114420) 102(046228) 085(028256) Divorced 278(182417) 141(072280) 120(044330) Acculturation (Ref=Low)
Moderate 148( 123179) 123(079191) 145(093227) High 163(135198) 147(079166) 163(028322)
Model 4 ln (p2(1-p))= b0 +b1x1+ b2 (Household Size)+ b3 (Acculturation)
Black Canadians (Ref) East Asians 095(076118) 046(031068) 097(053175) Middle Eastern 119(074191) 087(047160) 205(103412) South Asians 106(078143) 093(059147) 177(097322) Household Size (Ref= 1 Person)
2 095(076118) 087(059130) 085(051142) 3 070(055090) 070(046108) 083(050135) 4 065(053080) 067(046097) 070(046107) Acculturation (Ref=Low)
Moderate 156(129189) 121(079187) 147(096226) High 164(134200) 106(074153) 158(083300)
Model 5 ln (p2(1-p))= b0 +b1x1+ b2 (Employment)+ b3 (Acculturation)
Black Canadians (Ref) East Asians 089(066120) 047(032070) 091(050164) Middle Eastern 114(065200) 089(050159) 202(097418) South Asians 095(072127) 085(052137) 163(085315) Employment (Ref=no) 055(047065) 068(050091) 063(033121) Acculturation (Ref=Low)
53
Moderate 154(126187) 123(077199) 140(089220) High 182(149223) 118(081171) 170(097298)
Model 6 ln (p2(1-p))= b0 +b1x1+ b2 (Time Spent in Canada)+ b3(Acculturation)
Black Canadians (Ref) East Asians 084(066108) 044(029065) 096(053173) Middle Eastern 105(064173) 083(047148) 204(103405) South Asians 092(068124) 085(055133) 166(091304) Time Spent in Canada (Ref=more than 10 yrs)
044(032061) 058(033103) 092(042199)
Acculturation (Ref=low)
Moderate 083(060116) 081(041159) 143(066310) High 077(052113) 068(034135) 156(051480)
1the odds of reporting lsquoyesrsquo to chronic pain lsquohighrsquo to pain intensity and lsquomanyrsquo activity limitation due to chronic when adjusted for the socio-demographic factors and acculturation p= the probability of reporting lsquoyesrsquo to chronic pain lsquohighrsquo to pain intensity and lsquomanyrsquo to activity limitation due to chronic pain when adjusted for each of the factors from the bio-psychosocial model x1= the categorical explanatory variable ethnic minority status (Black (ref) South Asian East Asian Middle Eastern) c= The probability of reporting `many` activity limitation compared to `none` Significant at plt005
54
Table 416 Odds Ratio of Chronic Pain in EM Groups when Adjusted for all Socio-Demographic Factors Odds Ratio Estimates
Chronic Pain Pain Intensity Activity Limitationsc Ref= no chronic pain
Ref=Low Pain Intensity
Many vs None
Model 1 ln (p(1-p))= b0 +b1x1+ b2 (Sex)+ b3 (Age)+ b4 (Marital Status)+ b5 (Household Size)+ b6
(Employment)+ b7 (Acculturation)
Black Canadians (Ref)
East Asians 081(055120) 044(026076) 104(051213) Middle Eastern 116(057236) 105(055200) 308(0331202) South Asians 090(061134) 089(046174) 191(058633) Sex (Ref=Male) 149(123180) 107(063183) 106(068167) Age 1 (18-25) (Ref) 25-39 177(104301) 165(071381) 170(042659) 40-54 330(205535) 165(069393) 187(056632) 55-69 466(298728) 172(065452) 219(0471013) 70-84 702(3511401) 203(0411007) 220(0441095) Marital Status
Single never married (Ref)
married 112(071179) 098(039243) 060(021169) living common-law 155(069348) 053(018156) 023(005098)
widowed 110(034356) 089(017476) 087(016468) separated 120(065219) 073(018297) 059(006546)
divorced 150(092244) 104(03530) 083(010719) Household Size 1 person (Ref) 2 106(075149) 091(050166) 131(051334) 3 113(080160) 082(043158) 134(065275) 4 092(067128) 072(038135) 118(049282) Employment (Ref=no) 069(056085) 076(035165) 066(040110) Acculturation
Low (Ref) 100 100 100 Moderate 099(072139) 086(040182) 145(047451) High 108(081145) 079(027237) 184(040853)
1the odds of reporting lsquoyesrsquo to chronic pain lsquohighrsquo to pain intensity and lsquomanyrsquo to activity limitation due to chronic when adjusted for the socio-demographic factors and acculturation p= the probability of reporting lsquoyesrsquo to chronic pain lsquohighrsquo to pain intensity and lsquomanyrsquo to activity limitation due to chronic pain when adjusted for each of the factors from the bio-psychosocial model x1= the categorical explanatory variable ethnic minority status (Black (ref) South Asian East Asian Middle Eastern) c= The probability of reporting `many` activity limitation compared to `none` Significant at plt005
473 Adjusting for Psychological and Socio-Demographic Factors
Multiple regression models combining the psychological and socio-demographic factors were
produced to determine whether there existed an association among the four EM groups and chronic
pain experience after these variables were controlled (Table 417) The results show that after
adjusting for the significant psychological and socio-demographic factors the East Asian group still
had statistically significantly lower odds of experiencing lsquohighrsquo pain intensity when compared to Black
Canadians Only self-perceived mental health ( OR [good] 199 95CI 123-323 OR [poorfair]
568 95CI 350-920) anxiety (OR 255 95CI 153-425) and age (OR [40 years to 54 years]
323 95CI 173-603 OR [55years to 69 years] 445 95CI 234-846 OR [70 years to 84 years]
55
541 95CI 210-1393) were statistically significantly associated with pain expression when adjusted
for the other variables from the framework used in this study
Table 417 The Odds Ratio of Chronic Pain when adjusting for Psychological and Socio-Demographic Variables Odds Ratio Estimates Chronic Pain Pain Intensity Activity Limitationsc
Ref= no chronic pain Ref=Low Pain Intensity Many vs None
Model 1ln(p(1-p))= b0 +b1x1+ b2 (Self-Perceived Mental Health)+ b3 (Anxiety)+ b4 (Alcohol Use Frequency)+ b5 (Sex)+ b6
(Age)+ b7 (Employment)+ b8 (Acculturation)
Black Canadians (Ref) East Asians 071(040125) 038(022064) 069(022214) Middle Eastern 119(076187) 061(024155) 130(0111606) South Asians 089(055144) 062(035110) 159(051494) Self-Perceived Mental Health Excellent(Ref) Very Good 132(100176) 127(070228) 063(023173) Good 199(123323) 131(068252) 146(045473) PoorFair 568(350920) 215(101455) 210(0371175) Anxiety (Ref=no) 255(153425) 134(033557) 145(024859) Alcohol Use Frequency Less than once a month
(Ref)
once a month 087(064118) 077(040150) 146(022945) 2 to 3 times a month 082(057118) 108(022540) 065(006686) 2 or more times a week 086(052140) 056(026123) 058(012274) once a week 087(053142) 085(047151) 041(014118) Sex (Ref=Male) 150(094240) 098(050191) 083(029243) Age 18-24 (Ref) 25-39 179(090358) 153(058401) NS 40-54 323(173603) 154(058411) NS 55-69 445(234846) 186(075464) NS 70-84 541(2101393) 241(0421402) NS Employment (Ref=No) 082(062109) 098(049194) 050(020127) Acculturation (Ref=low)
Moderate 093(065133) 109(063187) 142(031646) High 101(071145) 104(060180) 159(039643)
1the odds of reporting lsquoyesrsquo to chronic pain lsquohighrsquo to pain intensity and lsquomanyrsquo to activity limitation due to chronic when adjusted for all the significant psychological and socio-demographic factors p= the probability of reporting lsquoyesrsquo to chronic pain lsquohighrsquo to pain intensity and lsquomanyrsquo to activity limitation due to chronic pain when adjusted for each of the factors from the bio-psychosocial model x1= the categorical explanatory variable ethnic minority status (Black (ref) South Asian East Asian Middle Eastern) c= The probability of reporting `many` activity limitation compared to `none` Significant at plt005 NS The OR reporting for these variables were insignificant therefore not included in the table
56
CHAPTER 5 DISCUSSION
This chapter will summarize the key findings of this thesis including i) key findings and comparison
with the extant literature and findings in relation to the theoretical model used ii) limitations and
strengths of this study and iii) implications conclusions and future research directions
51 Key Findings and Comparisons with Extant Literature
511 Objective 1 Pain Expression among White Canadians and the Combined four EM Groups
The prevalence of chronic pain expression in White Canadians was found to be 193 (95CI
169-216) a result similar to those in previous literature looking at pain prevalence in the general
Canadian population using the CCHS data which ranged from 153 (95CI 142-163) to
195 (95 CI 183-207)13 (Reitsma et al 2010) My own results indicated chronic pain
expression was statistically significantly lower (131 95 CI 108-154) among the combined
four EM groups (Black Canadians South Asians Middle Eastern and East Asians) included in this
study when compared to White Canadians (193 95CI 169-216) The latter also reported
statistically significantly higher pain intensity (173 95CI 163-181) and daily activity limitation
(197 95CI 107-147) due to chronic pain relative to the combined four EM groups (pain
intensity 135 95CI 111-158 activity limitation 127 95CI 107-147)
Previous studies comparing pain expression among White and EM groups have yielded mixed
results (Ang Ibrahim Burant amp Kwoh 2003 Edwards amp Fillingim 1999) However the major body of
the literature has found EM groups (eg African Americans andor Latinos) to usually have higher
pain expression when compared to non-Hispanic Whites and have concluded that EM status is an
important factor to consider in pain expression (Defrin Eli amp Pud 2011 Dhingra et al 2011 Jimenez
Garroutte Kundu Morales amp Buchwald 2011) One possible reason that the findings from my study
contradict the results of the majority of the previous studies investigating pain expression differences
among EM groups and White Canadians may be that all other cross-sectional studies compared pain
expression between each EM group taken separately and White American and Europeans (Allison et
al 2002 Meghani amp Cho 2009 Portenoy Ugarte Fuller amp Haas 2004) whereas my results show
the differences between combined EM groups and White Canadians and my findings did not adjust for
age In this case any variation among the different EM groups might be diluted when I combined all
four EM groups into one comparison group However a study of the difference in temporomandibular
joint and muscle disorders low back and neck pain among White Americans African Americans and
13 The range for the chronic pain expression is for each year of the CCHS from 1994 to 2008
57
Hispanics was conducted using a large national USA database (Plesh et al 2011) Based on the
findings from this study which bears similarities with my own the authors concluded significant
racialethnic differences for pain reporting in chronic low back pain Whites were more likely to report
these pain conditions than African Americans which is broadly similar to my findings of greater
chronic pain among Whites than the four EM groups combined
The four EM groups combined report statistically significantly lower pain expression intensity
and activity limitation compared to White Canadians However it is important to recognize
heterogeneity within minority groups Therefore it is necessary to investigate pain expression in
different EM groups in order to see whether there exists a difference and after adjusting for certain
biological psychological and socio-demographic factors to determine whether that difference is still
evident This is important in understanding pain experience in different ethnic groups (Ang et al 2003
Edwards et al 2005)
512 Objective 2 Pain Expression Among the Four EM Study Groups in Canada
The results from my study indicated that there was no significant difference in chronic pain
expression among the four EM groups Chronic pain expression ranged from 149 (95 CI 137-
160) to 168 (95 CI148-188) with Middle Eastern and Black Canadians reporting the
highest prevalence of pain expression and the other two groups falling in-between with the confidence
intervals overlapping However the odds of reporting severe pain intensity and activity limitations due
to pain did differ by EM group The results indicated that the East Asian group had statistically
significant lower odds (OR 047 95CI 031-069) of reporting lsquoseverersquo pain intensity when
compared to Black Canadians the other two groups were similar to Black Canadians Although not
statistically significant Middle Eastern (OR 178 95CI 098-325) and South Asian (OR160
95CI 099-259) groups had higher odds of reporting lsquomostrsquo daily activities being limited due to
chronic pain activity when compared to Black Canadians
The findings in regards to East Asian groups are consistent with those of previous studies such
as the results from a national survey conducted in Singapore examining self-reported pain intensity in
East Asians by Chan and colleagues (2011) which found that Malaysian and Chinese14 participants
tended to have lower pain intensity reporting compared to East Indians The differences in pain
severity reporting in the East Asian group compared to the other three EM groups may be explained
by the factors included bio-psychosocial framework set out in Chapter 2 Figure 23 According to this
framework differences in pain expression might be linked to social learning and cultural factors In the
14 The Malaysian and Chinese participants belong to the East Asian groups
58
East Asian culture stoicism is highly valued and showing emotions such as anger or expressing pain
are often considered a sign of weakness of character (Giger amp Davidhizar 2004) Thus people
belonging to this ethnic group prefer to endure pain and not report it until it becomes unbearable
(Chen et al 2008 Leininger amp McFarland 2002) Regardless of the cause of the East Asian group
showing significantly lower reporting of pain intensity the inter-ethnic differences in pain perception
and reporting have important implications for assessment and treatment of pain The results from my
study suggest the value of understanding the cultural background and cultural attitudes of patients
towards pain expression and of being even more attentive to non-verbal cues that might contradict
verbal communication
Acculturation and Pain Expression
My findings show the heterogeneity15 that exists in pain intensity reporting and I tested the
possibility of the influence of acculturation to explain the differences The literature (Alisson et al
2007 Palmer et al 2009) indicates that differences in pain expression may be due to cultural
influences for particular ethnic groups I used lsquoacculturationrsquo as a measure quantifying the extent to
which respondents of the survey are likely to embrace the lsquohost culturersquo versus their original culture
My findings also show that the majority of the East Asians (529 95CI 486-571) South
Asians (439 95CI 413-465) and Middle Eastern Canadians (401 95CI 354-447)
were only moderately acculturated whereas the majority of Black Canadians (486 95CI 414-
558) were highly acculturated I considered a moderate level of acculturation as a successful
balance between the culture-of-origin and the Canadian cultural identity (Phiney 2001) When looking
at acculturation and chronic pain unadjusted for other socio demographic variables I found that
chronic pain expression was statistically significantly higher (234 95CI 217-252) in EM
groups with high acculturation I investigated acculturation levels and chronic pain severity within each
EM group and found no consistent uniform pattern of relationship between acculturation levels and
pain severity reporting
My results contradict findings from the Palmer et al (2007) study looking at acculturation and
chronic pain among South Asian groups The results from that study found that low acculturation had
a strong influence on reporting higher pain intensity compared to groups with higher acculturation
levels However a review conducted by Amaro and colleagues (2002) found that more acculturated
EM groups (ie Latinos or Hispanics) were more at risk for depression partner violence and drug
use while less acculturated EM groups experienced fewer health problems but were also less likely to
use healthcare services when they needed them particularly preventative and mental healthcare
services
15 In the context of this study heterogeneity is defined as differences among various EM groups
59
The findings of the literature as well as my own study indicate a correlation between different
levels of acculturation and EM health experience However the direction of this relationship is not
consistent across health experience including chronic pain experience Despite the widespread
acceptance of pain expression disparities among EM groupsrsquo respective cultures the measure of
acculturation is rarely used in heath literature pertaining to them For this reason I included
acculturation as an important factor in my regression models and discussed it further below
513 Objective 3 Psychological and Socio-Demographic Factors Associated with Pain among the Four EM Groups
Psychological Factors
I found self-reported mental health depression anxiety and alcohol dependence were all
associated with chronic pain pain intensity and activity limitation in EM groups in the bi-variable
analysis adjusted for EM status only EM groups with poor self-perceived mental health were 599
(95 CI 46-144) times the odds to report chronic pain compared to those with excellent self-
perceived mental health and EM groups with depression or anxiety were respectively 43 (95CI
32-58) times and 45 (95 CI 32-66) times the odds to do so than those who do not report those
forms of psychological distress Even when adjusted for all other psychological variables and
acculturation these factors remained statically significantly associated with pain expression in EM
groups When adjusted for all significant psychological and socio-cultural variables self-perceived
mental health was still significantly (OR 568 95CI 350-920) associated with higher rates of pain
expression Interestingly when adjusted for self-perceived mental health depression anxiety and
alcohol use separately East Asians were 043 (95CI 029-065) 048 (95CI 033-070) 048
(95CI 032-071) and 037 (95CI 022-061) times less likely to report high pain intensity than
Black Canadians Even after adjusting for all psychological factors and acculturation East Asian
groups were still 037 (95CI 021-063) times the odds to report high pain intensity when compared
to Black Canadians
These findings are consistent with those of the literature on psychological factors in chronic pain
expression A Norwegian study looking at the association between musculoskeletal pain and
psychological distress among five immigrant groups (from Sri Lanka Turkey Pakistan Iran and
Vietnam) found respondents with psychological distress were 75 times (95CI 587-961) the odds
to report musculoskeletal pain than those without distress (French 2009)
To conclude the results indicate that in general EM groups with any psychological distress have
higher odds of pain expression My findings also show these psychological factors did not account for
EM group differences in chronic pain As these EM group differences persisted even after controlling
60
for self-perceived mental health depression anxiety and alcohol frequency in the logistic regression
models
Socio-Cultural Factors
In the EM groups I examined chronic pain expression was higher in women (OR160
95CI138-186) compared to men in people who were 85 years of age or older (OR1281 95CI
715-2295) compared to those aged 18 to 24 years and in those living common-law (OR196
95CI 118-325) married (OR 189 95CI 139-242) widowed (OR 542 95CI 384-766)
divorced (OR 29 95CI 188-451) or separated (OR 231 95CI 125-426) compared to single
EM groups EM groups with employment were 050 (95CI 043-064) times less likely to report
chronic pain expression than those without employment When factors specific to EM status (ie time
spent in Canada languages most often spoken at home and acculturation) were taken into account
the results from my study indicate that both the length of time spent in Canada and acculturation were
associated with chronic pain EM groups who spent fewer than 10 years in Canada had significantly
reduced odds of reporting chronic pain (OR 053 95CI 044-061) pain intensity (OR 072 95CI
053-096) and activity limitation due to pain (OR 067 95CI 047-095) EM groups with moderate
or high acculturation had significantly higher odds of reporting chronic pain (OR 162 95CI 134-
196 OR 177 95CI 146-215) and EM groups with moderate acculturation had increased odds
(OR 154 95CI 101-234) of reporting lsquomanyrsquo activity limitations due chronic pain relative to lsquononersquo
As the acculturation factor took into account both languages spoken most often at home and time
spent in Canada this factor may be a more suitable variable to adjust for than time spent in Canada
and languages spoken most often at home separately when looking at different ethnic groups
My study findings are supported in previous literature by Reitsma (2010) who also found that in
the general Canadian population age marital status and gender were significant factors in predicting
chronic pain For instance Reitsma (2010) reports that Canadian women in the oldest age group
(70+) had the greatest risk of developing chronic pain (OR 224 95CI 137-367) and in my study I
also found that in EM groups the oldest age group also had the greatest risk of both reporting chronic
pain (OR128 95CI 715-2295) and experiencing greater pain intensity (OR276 95CI 104-
731) compared to those aged 25 to 39 years Reitsma (2010) also found that for marital status being
widowed separated or divorced was only significantly associated with chronic pain expression in
Canadian women and they were 161 (95CI 116-223) times as likely to report chronic pain
compared to Canadian men
As very few studies have looked at factors specific to EM status and pain expression in different
EM groups it is very difficult to compare my findings about acculturation with previous literature
61
From my literature review I didnrsquot find any study that considered length of time spent in the host
country when looking at pain expression However I found one Australian study that looked at country
of birth when comparing back pain specifically ethnic Italians born in Italy and those born in Australia
(Stanaway et al 2011) The results from the study indicated that county of birth was an important
factor in chronic pain and that those born in Italy had a significantly higher odds (OR 193 plt005) of
reporting higher pain severity and activity limitation than those both in Australia Palmer and
colleagues (2007) found that acculturation was significantly associated with chronic widespread pain
expression (OR 117 95CI 103-133) amongst South Asian minority groups in the United
Kingdom However unlike my results the authors found that lower levels of acculturation were
correlated with higher pain expression The results of my study suggest a different relationship
between acculturation and chronic pain where higher levels of acculturation were associated with
greater pain This could be due to EM groups experiencing health differently in Canada compared to
EM groups in other countries For instance in Canada we have the healthy-immigrant effect16
(McDonald amp Kennedy 2004) The low acculturated immigrants may be healthier in Canada and this
is why we see lower chronic pain expression in this groups
To conclude I found that some psychological (self-perceived mental health and anxiety) and
socio-cultural (age) factors identified from previous literature and the theoretical framework to be
significantly associated with pain chronic pain expression in the four EM groups for both the
unadjusted and adjusted regression models
52 Findings in Relation to the Theoretical Framework
A bio-psychosocial theoretical framework from the literature was used to guide my study I used
this framework to guide my analysis about factors that are significantly associated with pain
expression within each of the four EM groups This is the first study to examine factors associated with
chronic pain separately for the four EM groups using a holistic approach including psychological
socio-demographic and acculturation factors East Asian groups consistently had significantly lower
odds of reporting chronic pain intensity when adjusted for all of the psychological and socio-
demographic factors from the theoretical framework In the South Asian group being female and living
in a household size with three or more people was significantly associated with reporting lsquomanyrsquo
activity limitations compared to Black Canadians (see Table 414) In the Middle Eastern group
activity limitation due to chronic pain was associated with higher income moderate to higher
acculturation and the length of time (gt10 years) spent in Canada (see Table 414) Interestingly there
16 Healthy Immigrant Effect is a observed time path in which the health of immigrants just after migration is substantially better than that of comparable native-born people (McDonald amp Kennedy 2004)
62
were no psychological factors that were significantly associated with pain expression in the South
Asians and Middle Eastern groups
To conclude among the four EM groups East Asians are significantly different in reporting lower
pain intensity than the other three EM groups Even after controlling for psychological and socio-
demographic factors this group still had significantly reduced odds of reporting lsquoseverersquo pain intensity
when compared to Black Canadians
53 Strengths and Limitations of this Study
531 Strengths
One major strength of this study is that the data came from a large population-based survey of
the Canadian population with a very good response rate thus making available relatively large sample
sizes for the four EM groups it sought to examine The CCHS also provides comprehensive data on
descriptive variables this made it possible to adjust for psychological socio-demographic and
acculturation variables potentially associated with pain experience among the four EM groups
532 Limitations The nature and purpose of a study such as this one is primarily to apply the methods tools and
techniques of epidemiology in order to test a particular hypothesis using secondary data sources as
opposed to data collected in an original field study over time through observation andor
questionnaires Therefore with a cross-sectional study one is able only to describe the association but
not to infer causation
Within the parameters of the CCHS survey data an important limitation comes from the chronic
pain questions used in the survey These questions did not specify a time frame but rather asked
about usual pain Without a specific time frame lsquousualrsquo pain may be interpreted differently by each
individual responding to the questionnaire Another limitation resides in the fact that the CCHS
questions were not validated specifically for each one of the EM groups It should be noted as well that
the CCHS survey was developed within a Canadian (predominantly Western) framework with
questions that may be more or less applicable or relevant andor may be interpreted differently
according to the level of acculturation of each individual as well as the particular ethnic group with
which he or she identifies I sought to address these limitations by conducting a data quality assurance
test where I looked at pain experience in EM groups with arthritis or low back pain This was done to
test the definition of chronic pain used in the survey The results indicated that there still was no
statistical difference in pain expression intensity and activity limitation among the subset EM groups
and pain experience and the general EM group At a more general level which is for the most part
beyond the purview of this study it should be noted that the experience and expression of pain are
63
profoundly linked to a wide and complex assortment of factors only some of which are touched upon
in the primary sources I have used These factors are addressed by a number of social science
disciplines (sociology anthropology gender and labour studies) as well as by health sciences and
psychology (notably pain psychology) How pain is expressed and dealt with may be determined at
least in part by the power relations that feature more or less prominently in an individualrsquos current life
Two examples will illustrate this point EM newcomers often find themselves in low-paying low status
work where they may lose money or in some cases their jobs if they absent themselves from work for
medical treatment (Sikora 2013) This can constitute a powerful motivation for downplaying or even
denying the existence of pain Power relations may also affect the expression of pain within a single
household in some cultures the expression of pain by one individual may elicit anger from another
member of the family leading to suppression of the normal instinctive reaction In other cultures it is
the husband who decides whether or not his wife will be treated when she is ill and may even go to
the clinic or hospital presenting his wifersquos symptoms as his own (Huijnk 2011 Karlsen 2002) This
may cause distortions in the nature of pain expression by the wife to the husband and pain reporting
by the husband to the health professional (Huijnk 2011 Karlsen 2002)
54 Implications Conclusion and Future Research Directions
541 Implications
My results suggest that increased reporting of chronic pain is associated with the following factors with
respect to EM status
lsquoPoorfairrsquo self-perceived mental health and the presence of anxiety when adjusted for other
factors in the theoretical model
Female sex age (55 years or older when adjusted for other factors in the theoretical model
Spending over 10 years in Canada and having moderate or high acculturation when
unadjusted for psychological and social variables
When assessing chronic pain expression in different EM groups it is important for healthcare
professionals to consider their time spent in Canada and cultural factors to properly address chronic
pain Specific attention should be given when working with EM groups who have immigrated and lived
in Canada for more than 10 years Although previous literature investigating health in different EM
groups has looked at acculturation the findings from my study indicate that linear measures of
acculturation may not tap the important cultural-traits and value differences (eg values about health
and illness) between different ethnic groups These are the factors that need to be examined further
as they influence health andor modify health outcomes (eg Pain expression) Given this suggestion
64
of diversity of health experience among different EMs future studies should consider EM
characteristics (eg ethnic background) of their samples
542 Conclusions
A secondary exploratory data analysis investigating pain expression by EM groups using the
Canadian Community Health Survey was conducted One key finding of this study was that after
adjusting for all significant factors from my theoretical framework East Asian groups had statistically
significantly lower pain intensity reporting compared to Black Canadians I also found self-perceived
mental health and age to be statistically significantly associated with pain expression among EM
groups It is important to note that the prevalence estimates for pain expression in all EM groups
across acculturation levels showed that higher levels of acculturation was associated with higher
reporting of pain expression and this trend diapered when adjusted for other variables This study
suggests that pain expression by EM groups in Canada may need more attention by pain researcher
543 Future Research Directions
The assessment and treatment of pain is a universally important healthcare issue but modern
healthcare still has no systematic way of accurately measuring pain beyond verbal reports by patients
and in some cases facial expressions denoting pain (Jensen Karoly amp Braver 1986 Williamson amp
Hoggart 2005) As pain tolerance and how it is experienced as well as its outward expression and
communication are very different across cultures reporting of pain by EMs must be recognized as
culturally bound To understand EMsrsquo pain expression and accurately measure it for appropriate
treatment requires high levels of lsquocultural competencersquo across the entire range of healthcare
professionals It would seem that given the growing presence of EMs in Canada the health system as
a whole would benefit from a better understanding of the cultural dimensions of the experience
expression management and treatment of pain
The mechanisms underlying ethnic differences in pain expression are multi-factorial and
complex and should be tested further with longitudinal anthropological studies These studies should
take into account bio-psychosocial factors that have been associated with pain expression in EM
groups The findings from my own limited study also indicate that more qualitative studies such as
anthropological studies examining pain experience in different EM groups are needed These studies
would help us in understanding differences and perceptions in expressing pain in different EM groups
and contribute to better overall treatment protocols
65
REFERENCES
Alabas O A Tashani O A amp Johnson M I (2013) Effects of ethnicity and gender role
expectations of pain on experimental pain A cross-cultural study European Journal of Pain
(London England) 17(5) 776-786
Allison T R Symmons D P Brammah T Haynes P Rogers A Roxby M amp Urwin M (2002)
Musculoskeletal pain is more generalised among people from ethnic minorities than among white
people in greater Manchester Annals of the Rheumatic Diseases 61(2) 151-156
Ang D C Ibrahim S A Burant C J amp Kwoh C K (2003) Is there a difference in the perception
of symptoms between African Americans and Whites with osteoarthritis The Journal of
Rheumatology 30(6) 1305-1310
Banz V M Christen B Paul K Martinolli L Candinas D Zimmermann H amp Exadaktylos A K
(2012) Gender age and ethnic aspects of analgesia in acute abdominal pain Is analgesia even
across the groups Internal Medicine Journal 42(3) 281-288
Barrero L H Hsu Y H Terwedow H Perry M J Dennerlein J T Brain J D amp Xu X (2006)
Prevalence and physical determinants of low back pain in a rural Chinese population Spine
31(23) 2728-2734
Bates M S amp Edwards W T (1992) Ethnic variations in the chronic pain experience Ethnicity amp
Disease 2(1) 63-83
Beiser M amp Hou F (2014) Chronic health conditions labour market participation and resource
consumption among immigrant and native-born residents of Canada International Journal of
Public Health 59(3) 541-547
66
Beissner K Parker S J Jr C R H Pal A Iannone L amp Reid M C (2012) A cognitive-
behavioral plus exercise intervention for older adults with chronic back pain Raceethnicity
effect Journal of Aging and Physical Activity 20(2) 246-265
Bell C L Kuriya M amp Fischberg D (2011) Pain outcomes of inpatient pain and palliative care
consultations Differences by race and diagnosis Journal of Palliative Medicine 14(10) 1142-
1148
Bener A Dafeeah E E amp Alnaqbi K (2014) Prevalence and correlates of low back pain in primary
care What are the contributing factors in a rapidly developing country Asian Spine Journal 8(3)
227-236
Benet‐Martiacutenez V amp Haritatos J (2005) Bicultural identity integration (BII) Components and
psychosocial antecedents Journal of Personality 73(4) 1015-1050
Bernstein S L Gallagher E J Cabral L amp Bijur P (2009) Race and ethnicity do not affect
baseline self-report of pain severity in patients with suspected long-bone fractures Pain Medicine
(Malden Mass) 10(1) 106-110
Bhopal R S Bansal N Fischbacher C Brown H Capewell S Health S amp Study E L (2012)
Ethnic variations in chest pain and angina in men and women Scottish ethnicity and health
linkage study of 465 million people European Journal of Preventive Cardiology 19(6) 1250-
1257
Boulanger A Clark A J Squire P Cui E amp Horbay G L (2007) Chronic pain in Canada Have
we improved our management of chronic noncancer pain Pain Research amp Management The
Journal of the Canadian Pain Society = Journal De La Societe Canadienne Pour Le Traitement
De La Douleur 12(1) 39-47
67
Broderick J E Schneider S Junghaenel D U Schwartz J E amp Stone A A (2013) Validity and
reliability of patient-reported outcomes measurement information system instruments in
osteoarthritis Arthritis Care amp Research 65(10) 1625-1633
Brumitt J Reisch R Krasnoselsky K Welch A Rutt R Garside L I amp McKay C (2011) Self-
reported musculoskeletal pain in Latino vineyard workers Journal of Agromedicine 16(1) 72-80
Burns R Graney M J Lummus A C Nichols L O amp Martindale-Adams J (2007) Differences of
self-reported osteoarthritis disability and race Journal of the National Medical Association 99(9)
1046-1051
Calvillo E R amp Flaskerud J H (1991) Review of literature on culture and pain of adults with focus
on Mexican-Americans Journal of Transcultural Nursing Official Journal of the Transcultural
Nursing Society Transcultural Nursing Society 2(2) 16-23
Campbell C M Edwards R R amp Fillingim R B (2005) Ethnic differences in responses to multiple
experimental pain stimuli Pain 113(1) 20-26
Campbell C M France C R Robinson M E Logan H L Geffken G R amp Fillingim R B
(2008) Ethnic differences in the nociceptive flexion reflex (NFR) Pain 134(1-2) 91-96
Carey T S Freburger J K Holmes G M Jackman A Knauer S Wallace A amp Darter J
(2010) Race care seeking and utilization for chronic back and neck pain Population
perspectives The Journal of Pain Official Journal of the American Pain Society 11(4) 343-350
Carlisle S K (2014) Disaggregating race and ethnicity in chronic health conditions Implications for
public health social work Social Work in Public Health 29(6) 616-628
Cervero F amp Laird J (1999) Visceral pain The Lancet 353(9170) 2145-2148
68
Chan A Malhotra C Do Y K Malhotra R amp Oslashstbye T (2011) Self reported pain severity among
multiethnic older Singaporeans Does adjusting for reporting heterogeneity matter European
Journal of Pain 15(10) 1094-1099
Chan M Y Hamamura T amp Janschewitz K (2013) Ethnic differences in physical pain sensitivity
Role of acculturation Pain 154(1) 119-123
Creamer P Lethbridge-Cejku M amp Hochberg M C (1999) Determinants of pain severity in knee
osteoarthritis Effect of demographic and psychosocial variables using 3 pain measures The
Journal of Rheumatology 26(8) 1785-1792
Cruz-Almeida Y Sibille K T Goodin B R Petrov M E Bartley E J 3rd J L R Fillingim
R B (2014) Racial and ethnic differences in older adults with knee osteoarthritis Arthritis amp
Rheumatology (Hoboken NJ) 66(7) 1800-1810
Dhingra L Lam K Homel P Chen J Chang V T Zhou J Portenoy R (2011) Pain in
underserved community-dwelling Chinese American cancer patients Demographic and medical
correlates The Oncologist 16(4) 523-533
Dobscha S K Soleck G D Dickinson K C Burgess D J Lasarev M R Lee E S amp
McFarland B H (2009) Associations between race and ethnicity and treatment for chronic pain
in the VA The Journal of Pain Official Journal of the American Pain Society 10(10) 1078-1087
Drwecki B B Moore C F Ward S E amp Prkachin K M (2011) Reducing racial disparities in pain
treatment The role of empathy and perspective-taking Pain 152(5) 1001-1006
Dunn K S amp Horgas A L (2004) Religious and nonreligious coping in older adults experiencing
chronic pain Pain Management Nursing Official Journal of the American Society of Pain
Management Nurses 5(1) 19-28
69
Eaton W W (Ed) (1986) The sociology of mental disorders (2nd ed) New York Praeger
Edwards R R Moric M Husfeldt B Buvanendran A amp Ivankovich O (2005) Ethnic similarities
and differences in the chronic pain experience A comparison of African American Hispanic and
White patients Pain Medicine 6(1) 88-98
Edwards C amp Keefe F (2002) New directions in research on pain and ethnicity A comment on
Riley Wade Myers Sheffield Pappas and Price (2002) Pain 100(3) 211-212
Edwards C L Fillingim R B amp Keefe F (2001) Race ethnicity and pain Pain 94(2) 133-137
Edwards R R Doleys D M Fillingim R B amp Lowery D (2001) Ethnic differences in pain
tolerance Clinical implications in a chronic pain population Psychosomatic Medicine 63(2) 316-
323
Edwards R R amp Fillingim R B (1999) Ethnic differences in thermal pain responses
Psychosomatic Medicine 61(3) 346-354
Edwards R R Moric M Husfeldt B Buvanendran A amp Ivankovich O (2005) Ethnic similarities
and differences in the chronic pain experience A comparison of African American Hispanic and
White patients Pain Medicine (Malden Mass) 6(1) 88-98
Eriksen J Sjoslashgren P Bruera E Ekholm O amp Rasmussen N K (2006) Critical issues in opioids
in chronic non-cancer pain An epidemiological study Pain 125(1) 172-179
Evans R G Barer M L amp Marmor T R (1994) Why are some people healthy and others not
The determinants of health of populations Cambridge UK Cambridge Univ Press
Evans R G amp Stoddart G L (1990) Producing health consuming health care Social Science amp
Medicine 31(12) 1347-1363
70
Ezenwa M O Ameringer S Ward S E amp Serlin R C (2006) Racial and ethnic disparities in pain
management in the United States Journal of Nursing Scholarship An Official Publication of
Sigma Theta Tau International Honor Society of Nursing Sigma Theta Tau 38(3) 225-233
Fishbain D A Goldberg M Robert Meagher B Steele R amp Rosomoff H (1986) Male and
female chronic pain patients categorized by DSM-III psychiatric diagnostic criteria Pain 26(2)
181-197
Fishbain D A Cutler R B Rosomoff H L amp Rosomoff R S (1999) Validity of self-reported drug
use in chronic pain patients The Clinical Journal of Pain 15(3) 184-191
Foley B S (2006) Wall and Melzackrsquos Textbook of Pain
Forsythe L P Thorn B Day M amp Shelby G (2011) Race and sex differences in primary
appraisals catastrophizing and experimental pain outcomes The Journal of Pain Official
Journal of the American Pain Society 12(5) 563-572
Fortier M A Anderson C T amp Kain Z N (2009) Ethnicity matters in the assessment and
treatment of childrens pain Pediatrics 124(1) 378-380
Galdas P Cheater F amp Marshall P (2007) What is the role of masculinity in White and South
Asian mens decisions to seek medical help for cardiac chest pain Journal of Health Services
Research amp Policy 12(4) 223-229
Gatchel R J Peng Y B Peters M L Fuchs P N amp Turk D C (2007) The biopsychosocial
approach to chronic pain Scientific advances and future directions Psychological Bulletin
133(4) 581
71
Goulet J L Brandt C Crystal S Fiellin D A Gibert C Gordon A J Justice A C (2013)
Agreement between electronic medical record-based and self-administered pain numeric rating
scale Clinical and research implications Medical Care 51(3) 245-250
Green C R Anderson K O Baker T A Campbell L C Decker S Fillingim R B Tait R
C (2003) The unequal burden of pain Confronting racial and ethnic disparities in pain Pain
Medicine 4(3) 277-294
Green C R Baker T A Sato Y Washington T L amp Smith E M (2003) Race and chronic pain
A comparative study of young Black and White Americans presenting for management The
Journal of Pain Official Journal of the American Pain Society 4(4) 176-183
Green C R amp Hart-Johnson T (2010) The impact of chronic pain on the health of Black and White
men Journal of the National Medical Association 102(4) 321-331
Hadjistavropoulos T amp Craig K (2002) A theoretical framework for understanding self-report and
observational measures of pain A communications model Behaviour Research and Therapy
40(5) 551-570
Hastie B A 3rd J L R Kaplan L Herrera D G Campbell C M Virtusio K Fillingim R B
(2012) Ethnicity interacts with the OPRM1 gene in experimental pain sensitivity Pain 153(8)
1610-1619
Henry S G amp Eggly S (2013) The effect of discussing pain on patient-physician communication in
a low-income Black primary care patient population The Journal of Pain Official Journal of the
American Pain Society 14(7) 759-766
Hernandez A amp Sachs-Ericsson N (2006) Ethnic differences in pain reports and the moderating
role of depression in a community sample of Hispanic and Caucasian participants with serious
health problems Psychosomatic Medicine 68(1) 121-128
72
Hsieh A Y Tripp D A amp Ji L J (2011) The influence of ethnic concordance and discordance on
verbal reports and nonverbal behaviours of pain Pain 152(9) 2016-2022
Jimenez N Garroutte E Kundu A Morales L amp Buchwald D (2011) A review of the experience
epidemiology and management of pain among American Indian Alaskan Native and Aboriginal
Canadian peoples The Journal of Pain Official Journal of the American Pain Society 12(5)
511-522
Johnson T J Weaver M D Borrero S Davis E M Myaskovsky L Zuckerbraun N S amp
Kraemer K L (2013) Association of race and ethnicity with management of abdominal pain in
the emergency department Pediatrics 132(4) e851-8
Johnson-Umezulike J M (1999) A comparison of pain perception of elderly African Americans and
Caucasians NursingConnections 12(2) 5-12
Jordan J M (1999) Effect of race and ethnicity on outcomes in arthritis and rheumatic conditions
Current Opinion in Rheumatology 11(2) 98-103
Jr R B F Sos J amp McGovern P (1981) Ethnicity as a factor in the expression of pain
Psychosomatics 22(1) 39-40 45 49-50
Kamath A F Horneff J G Gaffney V Israelite C L amp Nelson C L (2010) Ethnic and gender
differences in the functional disparities after primary total knee arthroplasty Clinical Orthopaedics
and Related Research 468(12) 3355-3361
Kett C Flint J Openshaw M Raza K amp Kumar K (2010) Self-management strategies used
during flares of rheumatoid arthritis in an ethnically diverse population Musculoskeletal Care
8(4) 204-214
73
Koopman C Eisenthal S amp Stoeckle J D (1984) Ethnicity in the reported pain emotional distress
and requests of medical outpatients Social Science amp Medicine (1982) 18(6) 487-490
Krupic F Eisler T Garellick G amp Karrholm J (2013) Influence of ethnicity and socioeconomic
factors on outcome after total hip replacement Scandinavian Journal of Caring Sciences 27(1)
139-146
Kwok W amp Bhuvanakrishna T (2014) The relationship between ethnicity and the pain experience of
cancer patients A systematic review Indian Journal of Palliative Care 20(3) 194-200
Laguna J Goldstein R Braun W amp Enguidanos S (2014) Racial and ethnic variation in pain
following inpatient palliative care consultations Journal of the American Geriatrics Society 62(3)
546-552
Lavernia C J Alcerro J C Contreras J S amp Rossi M D (2011a) Ethnic and racial factors
influencing well-being perceived pain and physical function after primary total joint arthroplasty
Clinical Orthopaedics and Related Research 469(7) 1838-1845
Lavernia C J Alcerro J C Contreras J S amp Rossi M D (2011b) Ethnic and racial factors
influencing well-being perceived pain and physical function after primary total joint arthroplasty
Clinical Orthopaedics and Related Research 469(7) 1838-1845
Lavernia C J Contreras J S Parvizi J Sharkey P F Barrack R amp Rossi M D (2012) Do
patient expectations about arthroplasty at initial presentation for hip or knee pain differ by sex and
ethnicity Clinical Orthopaedics and Related Research 470(10) 2843-2853
Leclair C M Zia J K Doom C M Morgan T K amp Edelman A B (2011) Pain experienced
using two different methods of endometrial biopsy A randomized controlled trial Obstetrics and
Gynecology 117(3) 636-641
74
Leyer E M (1990) Hidden interpersonal structures in medical and psychotherapy interaction with
foreign patients--presented and discussed with the example of a Turkish patient with chronic pain
Psychotherapie Psychosomatik Medizinische Psychologie 40(11) 423-431
Lipton J A amp Marbach J J (1984) Ethnicity and the pain experience Social Science amp Medicine
(1982) 19(12) 1279-1298
Lo C M amp Lee P H (2012) Prevalence and impacts of poor sleep on quality of life and associated
factors of good sleepers in a sample of older Chinese adults Health and Quality of Life
Outcomes 10 72
Lopez L Wilper A P Cervantes M C Betancourt J R amp Green A R (2010) Racial and sex
differences in emergency department triage assessment and test ordering for chest pain 1997-
2006 Academic Emergency Medicine Official Journal of the Society for Academic Emergency
Medicine 17(8) 801-808
Louie G H amp Ward M M (2011) Socioeconomic and ethnic differences in disease burden and
disparities in physical function in older adults American Journal of Public Health 101(7) 1322-
1329
Lu Q Zeltzer L amp Tsao J (2013) Multiethnic differences in responses to laboratory pain stimuli
among children Health Psychology Official Journal of the Division of Health Psychology
American Psychological Association 32(8) 905-914
Luo N Chew L H Fong K Y Koh D R Ng S C Yoon K H Thumboo J (2003) Validity
and reliability of the EQ-5D self-report questionnaire in Chinese-speaking patients with rheumatic
diseases in Singapore Annals of the Academy of Medicine Singapore 32(5) 685-690
75
Lynch M E (2011) The need for a Canadian pain strategy Pain Research amp Management The
Journal of the Canadian Pain Society = Journal De La Societe Canadienne Pour Le Traitement
De La Douleur 16(2) 77-80
Magnusson J E amp Fennell J A (2011) Understanding the role of culture in pain Maori practitioner
perspectives of pain descriptors The New Zealand Medical Journal 124(1328) 30-40
Mailis-Gagnon A Yegneswaran B Nicholson K Lakha S F Papagapiou M Steiman A J
Zurowski M (2007) Ethnocultural and sex characteristics of patients attending a tertiary care
pain clinic in Toronto Ontario Pain Research amp Management The Journal of the Canadian Pain
Society = Journal De La Societe Canadienne Pour Le Traitement De La Douleur 12(2) 100-106
Marco C A Nagel J Klink E amp Baehren D (2012) Factors associated with self-reported pain
scores among ED patients The American Journal of Emergency Medicine 30(2) 331-337
Marcus D A (2011) Epidemiology of cancer pain Current Pain and Headache Reports 15(4) 231-
234
Martin M L (2000) Ethnicity and analgesic practice An editorial Annals of Emergency Medicine
35(1) 77-79
Martinelli A M (1987) Pain and ethnicity How people of different cultures experience pain AORN
Journal 46(2) 273-4 276 278 passm
McBeth J amp Jones K (2007) Epidemiology of chronic musculoskeletal pain Best Practice amp
ResearchClinical Rheumatology 21(3) 403-425
McGrath P A (1994) Psychological aspects of pain perception Archives of Oral Biology 39 S55-
S62
76
McNeill J A Sherwood G D amp Starck P L (2004) The hidden error of mismanaged pain A
systems approach Journal of Pain and Symptom Management 28(1) 47-58
Meghani S H Byun E amp Gallagher R M (2012) Time to take stock A meta-analysis and
systematic review of analgesic treatment disparities for pain in the United States Pain Medicine
(Malden Mass) 13(2) 150-174
Meghani S H amp Cho E (2009) Self-reported pain and utilization of pain treatment between
minorities and nonminorities in the United States Public Health Nursing (Boston Mass) 26(4)
307-316
Milan A amp Tran K (2004) Blacks in Canada A long history Ottawa Canada Statistics Canada
Millar W (1996) Chronic pain Health Report 7(4) 47-53
Moldovan I Cooray D Carr F Katsaros E Torralba K Shinada S Nicassio P (2013)
Pain and depression predict self-reported fatigueenergy in lupus Lupus 22(7) 684-689
Monsivais D B amp Engebretson J C (2012) Im just not that sick Pain medication and identity in
Mexican American women with chronic pain Journal of Holistic Nursing Official Journal of the
American Holistic Nurses Association 30(3) 188-194
Moore R Miller M L Weinstein P Dworkin S F amp Liou H H (1986) Cultural perceptions of
pain and pain coping among patients and dentists Community Dentistry and Oral Epidemiology
14(6) 327-333
Moore R A amp Dworkin S F (1988) Ethnographic methodologic assessment of pain perceptions by
verbal description Pain 34(2) 195-204
Mossey J M (2011) Defining racial and ethnic disparities in pain management Clinical Orthopaedics
and Related Research 469(7) 1859-1870
77
Mossey J M amp Gallagher R M (2004) The longitudinal occurrence and impact of comorbid chronic
pain and chronic depression over two years in continuing care retirement community residents
Pain Medicine (Malden Mass) 5(4) 335-348
Moulin D E Clark A J Speechley M amp Morley-Forster P K (2002) Chronic pain in Canada--
prevalence treatment impact and the role of opioid analgesia Pain Research amp Management
Mullersdorf M Zander V amp Eriksson H (2011) The magnitude of reciprocity in chronic pain
management Experiences of dispersed ethnic populations of Muslim women Scandinavian
Journal of Caring Sciences 25(4) 637-645
Nampiaparampil D E Nampiaparampil J X amp Harden R N (2009) Pain and prejudice Pain
Medicine (Malden Mass) 10(4) 716-721
Narayan M C (2010) Cultures effects on pain assessment and management The American Journal
of Nursing 110(4) 38-47 quz 48-9
Nguyen M Ugarte C Fuller I Haas G amp Portenoy R K (2005) Access to care for chronic pain
Racial and ethnic differences The Journal of Pain Official Journal of the American Pain Society
6(5) 301-314
Palit S Kerr K L Kuhn B L Terry E L Delventura J L Bartley E J Rhudy J L (2013)
Exploring pain processing differences in Native Americans Health Psychology 32(11) 1127-
1136
Palmer B Macfarlane G Afzal C Esmail A Silman A amp Lunt M (2007) Acculturation and the
prevalence of pain amongst South Asian minority ethnic groups in the UK Rheumatology
(Oxford England) 46(6) 1009-1014 doi101093rheumatologykem037
78
Parmelee P A Harralson T L McPherron J A DeCoster J amp Schumacher H R (2012) Pain
disability and depression in osteoarthritis Effects of race and sex Journal of Aging and Health
24(1) 168-187
Plesh O Adams S H amp Gansky S A (2011) Racialethnic and gender prevalences in reported
common pains in a national sample Journal of Orofacial Pain 25(1) 25-31
Portenoy R K Ugarte C Fuller I amp Haas G (2004) Population-based survey of pain in the
United States Differences among White African American and Hispanic subjects The Journal of
Pain Official Journal of the American Pain Society 5(6) 317-328
Rahim‐Williams B Riley J L Williams A K amp Fillingim R B (2012) A quantitative review of
ethnic group differences in experimental pain response Do biology psychology and culture
matter Pain Medicine 13(4) 522-540
Ramer L Richardson J L Cohen M Z Bedney C Danley K L amp Judge E A (1999)
Multimeasure pain assessment in an ethnically diverse group of patients with cancer Journal of
Transcultural Nursing Official Journal of the Transcultural Nursing Society Transcultural
Nursing Society 10(2) 94-101
Rashiq S amp Dick B D (2009) Factors associated with chronic noncancer pain in the Canadian
population Pain Research amp Management 14(6) 454-460
Reitsma M Tranmer J Buchanan D amp Vandenkerkhof E (2011) The prevalence of chronic pain
and pain-related interference in the Canadian population from 1994 to 2008 Chronic Dis Inj Can
31(4) 157-164
Riskowski J L (2014) Associations of socioeconomic position and pain prevalence in the United
States Findings from the National Health and Nutrition Examination survey Pain Medicine
(Malden Mass) 15(9) 1508-1521
79
Robinson K M amp Monsivais J J (2011) Acculturation depression and function in individuals
seeking pain management in a predominantly Hispanic southwestern border community The
Nursing Clinics of North America 46(2) 193-9
Rollman G B (2005) The need for ecological validity in studies of pain and ethnicity Pain 113(1-2)
3-4
Rowell L N Mechlin B Ji E Addamo M amp Girdler S S (2011) Asians differ from Non-Hispanic
Whites in experimental pain sensitivity European Journal of Pain (London England) 15(7) 764-
771
Schneider S Randoll D amp Buchner M (2006) Why do women have back pain more than men A
representative prevalence study in the Federal Republic of Germany The Clinical Journal of Pain
22(8) 738-747
Scott K M Kokaua J amp Baxter J (2011) Does having a chronic physical condition affect the
likelihood of treatment seeking for a mental health problem and does this vary by ethnicity
International Journal of Psychiatry in Medicine 42(4) 421-436
Shavers V L Bakos A amp Sheppard V B (2010) Race ethnicity and pain among the US adult
population Journal of Health Care for the Poor and Underserved 21(1) 177-220
Silbermann M Arnaout M Daher M Nestoros S Pitsillides B Charalambous H Oberman
A (2012) Palliative cancer care in Middle Eastern countries Accomplishments and challenges
Annals of Oncology Official Journal of the European Society for Medical Oncology ESMO 23
Suppl 3 15-28 doi101093annoncmds084 101093annoncmds084
Sims E L Keefe F J Kraus V B Guilak F Queen R M amp Schmitt D (2009) Racial
differences in gait mechanics associated with knee osteoarthritis Aging Clinical and Experimental
Research 21(6) 463-469
80
Smith A K Cenzer I S Knight S J Puntillo K A Widera E Williams B A Covinsky K E
(2010) The epidemiology of pain during the last 2 years of life Annals of Internal Medicine
153(9) 563-569
Solomon A Christian B F Woodiwiss A J Norton G R amp Dessein P H (2011) Burden of
depressive symptoms in South African public health care patients with established rheumatoid
arthritis A case-control study Clinical and Experimental Rheumatology 29(3) 506-512
Stanaway F F Blyth F M Cumming R G Naganathan V Handelsman D J Waite L M
Couteur D G L (2011) Back pain in older male Italian-born immigrants in Australia The
importance of socioeconomic factors European Journal of Pain (London England) 15(1) 70-76
Statistics Canada (2011) Immigration and ethnocultural diversity in Canada Retrieved 01-24 2013
from httpwww12statcangccanhs-enm2011as-sa99-010-x99-010-x2011001-engpdf
Sullivan K Dean A amp Soe M (2009) OpenEpi A web-based epidemiologic and statistical
calculator for public health public Health Reports 124 N 3 471-474
Sullivan M J Adams H amp Sullivan M E (2004) Communicative dimensions of pain
catastrophizing Social cueing effects on pain behaviour and coping Pain 107(3) 220-226
Tait R C amp Chibnall J T (2014) Racialethnic disparities in the assessment and treatment of pain
Psychosocial perspectives The American Psychologist 69(2) 131-141
Taloyan M Sundquist J amp Al-Windi A (2008) The impact of ethnicity and self-reported health on
psychological well-being A comparative study of Kurdish-born and Swedish-born people Nordic
Journal of Psychiatry 62(5) 392-398
81
Tamayo-Sarver J H Hinze S W Cydulka R K amp Baker D W (2003) Racial and ethnic
disparities in emergency department analgesic prescription American Journal of Public Health
93(12) 2067-2073
Tan G Jensen M P Thornby J amp Anderson K O (2005) Ethnicity control appraisal coping and
adjustment to chronic pain among Black and White Americans Pain Medicine (Malden Mass)
6(1) 18-28
Taylor B A Casas-Ganem J Vaccaro A R Hilibrand A S Hanscom B S amp Albert T J
(2005) Differences in the work-up and treatment of conditions associated with low back pain by
patient gender and ethnic background Spine 30(3) 359-364
Taylor L J amp Herr K (2003) Pain intensity assessment A comparison of selected pain intensity
scales for use in cognitively intact and cognitively impaired African American older adults Pain
Management Nursing Official Journal of the American Society of Pain Management Nurses
4(2) 87-95
Wall P D amp Melzack R (2006) In McMahon S Koltzenburg M (Eds) Wall and Melzacks
textbook of pain (5th ed) Churchill Livingstone
Woolf C J amp Ma Q (2007) Nociceptorsmdashnoxious stimulus detectors Neuron 55(3) 353-364
Xie F Li S C Fong K Y Lo N N Yeo S J Yang K Y amp Thumboo J (2006) What health
domains and items are important to patients with knee osteoarthritis A focus group study in a
multiethnic urban Asian population Osteoarthritis and Cartilage OARS Osteoarthritis Research
Society 14(3) 224-230
Yosipovitch G Meredith G Chan Y H amp Goh C L (2004) Do ethnicity and gender have an
impact on pain thresholds in minor dermatologic procedures A study on thermal pain perception
thresholds in Asian ethinic groups Skin Research and Technology Official Journal of
82
International Society for Bioengineering and the Skin (ISBS) [and] International Society for Digital
Imaging of Skin (ISDIS) [and] International Society for Skin Imaging (ISSI) 10(1) 38-42
Zaki L R M amp Hairi N N (2014) Chronic pain and pattern of health care utilization among
Malaysian elderly population National health and morbidity survey III (NHMS III 2006) Maturitas
Zborowski M (1969) People in pain San Francisco CA Jossey-Bass
Zettel-Watson L Rutledge D N Aquino J K Cantero P Espinoza A Leal F amp Jones C J
(2011) Typology of chronic pain among overweight Mexican Americans Journal of Health Care
for the Poor and Underserved 22(3) 1030-1047
83
APPENDICES Appendix A The literature search selection of included studies
84
Appendix B Response rates from the Canadian Community Health Survey
Survey Response Rates
CCHS 20072008 Household-level response rate 846 Person-level response rate 917 Combined Response rate 776
CCHS 20092010 Household-level response rate 810 Person-level response rate 893 Combined Response rate 723
CCHS 20102011 Household-level response rate 807 Person-level response rate 886 Combined Response rate 715
CCHS 20112012 Household-level response rate 773 Person-level response rate 867 Combined Response rate 670
CCHS 2013 Household-level response rate 798 Person-level response rate 863 Combined Response rate 689
85
Appendix C Dependent variable and variable coding
Outcome Variable
CCHS Question Variables from CCHS CCHS groups Groups for this study
Pai
n a
nd
Dis
com
fort
Are you usually free of pain or discomfort HUP_01 Yes No
Yes (Ref) No
How would you described the usual intensity of your pain or discomfort
HUP_02 0-100 0no pain 100 Severe pain
No pain (Ref) Mild Moderate Severe
How many activities does your pain or discomfort prevent (both inside the home and outside)
HUP_03 None A Few Some Most
None (Ref) A Few Some Most
Appendix D The independent variables and variable coding
VARIABLE CODED VARIABLES
VARIABLES OF THE CCHS
CCHS QUESTIONS CCHS GROUPS GROUPS FOR THIS STUDY
Sex SEX DHH_SEX
Is respondent male or female
Male=1 Female=2 Male (Ref) Female
Age AGE DHH_AGE
What is your age Years 12-103 18-24 years (Ref) 25-39 years 40-54 years 70-84 years 85+
Province PRV GEO_PRV
Province of residence of respondents
Newfoundland and Labrador =10 Prince Edward Island=11 Nova Scotia=12 New Brunswick=13 Quebec=24 Ontario=35 Manitoba=46 Saskatchewan=47 Alberta=48 British Columbia=59 Yukon=60 Northwest Territories=61 Nunavut=62
British Columbia (Ref) Alberta Saskatchewan Manitoba Ontario Quebec New Brunswick Nova Scotia Prince Edward Island Newfoundland amp Labrador Yukon The Northwest Territories Nunavut
Urban and Rural Areas - 2 levels
AOR GEODUR Based on the respondents postal code and 2001 census geography
Urban=1 Rural=2
Rural (Ref) Urban
Education EDUA EDU_4 What is the highest degree certificate or diploma have you obtained
Less than high school diploma or its equ= 1 High school diploma or its equivalent=2 Trade certificate or diploma from a vocational school or apprenticeship Training =3 Non-university certificate or diploma from a community college CEGEP school of nursing etc=4
High School (Ref) Non-university certificate Bachelor`s degree Graduate
86
University certificate below bachelorrsquos level=5 Bachelorrsquos degree=6 University degree or certificate above bachelorrsquos degree=7 Not Applicable=96 Donrsquot know=97
Income INCM INCEDHH Based on INCE_3A INCE_3B INCE_3C INCE_3D INCE_3E INCE_3F INCE_3G
NO INCOME LESS THAN $5000 $5000 TO $9999 $10000 TO $14999 $15000 TO $19999 $20000 TO $29999 $30000 TO $39999 $40000 TO $49999 $50000 TO $59999 $60000 TO $79999 $80000 TO $99999 $100000 LESS THAN $150000 $150000 OR MORE
No Income (REF) Lowest Income (less than 40 000) Lower Middle Income ($40 000 or more but less than $80 000) Upper Middle Income ($80 000 or more but less than 150000) Highest Income ($150 000 and over)
Employment status
EMPLYMT LBSEDWSS Working status last week - 4 groups - (D)
Had a job-at work last week=1 Had a job-absent from work last week=2 Did not have a job last week=3 Permanently unable to work =4 Not applicable=6 Not stated =9
Did not have a job (Ref) Has a job
Marital Status
MARITASUS DHH_MS What is the respondentrsquos marital status
Married Living common-law Widowed Separated Divorced Single never married
Single never married (Ref) Married Living common-law Widowed Separated Divorced
Household size
HHLDSZ DHHDHSZ What are the names of all persons who usually live here
1-20 1 person (Ref) 2 person 3 person 4+ person
Ethnic Minority Groups
EMSP SDCDCGT Cultural racial background - (D)
White Black Korean Filipino Japanese Chinese South Asian Southeast Asian Arab West Asian Latin American
Black Canadians (Ref) East Asians South Asians Middle Eastern
87
Other racial or cultural origins Multiple Racial Cultural Origins Not Applicable Not Stated
Immigration Status
IMMS SDC_2 Where you born a Canadian citizen
Yes No
Yes (Ref) No
Length of time spent in Canada
ACC SDC_3 In what year did you first come to Canada to live
Min year of birth Max Current year
gt10 years lt10 years
Languages spoken
LPSKN SDC_5AA Language spoken most often at home
English (Ref) Other than English
Health Behaviours
REG_DOC HCU_1AA Has a regular doctor Yes No
No (ref) Yes
Self-perceived health
SPHLTH GEN_01 Would you say your health is
Excellent Very good Fair Poor Donrsquot know
Good (Excellent amp Very good) (Ref) Fair Poor
Depression DEPR CCCE_280 Do you have a mood disorder such as depression
No Yes
No (Ref) Yes
Anxiety ANX CCC_290 Do you have an anxiety disorder such as a phobia obsessive-compulsive disorder or a panic disorder
No Yes
No (Ref) Yes
Alcohol Frequency
ALCHDEP ALC_2 During the past 12 months how often did you drink alcoholic beverages
Less than once a month Once a month 2 to 3 times a month Once a week 2 to 3 times a week 4 to 6 times a week Every day
Once a month or less (Ref) Once a week or less 2 to 3 times a week Everyday
Pain medication
PMED MED_1A In the past month did you take aspirin or other acetylsalicylic acid) medication every day or every second day
Yes No
No (Ref) Yes
Chronic Conditions
CHRONARTH CCC_051 Do you have arthritis excluding fibromyalgia
No Yes
No (Ref) Yes
CHRBCK CCC_061 Do you have back problems excluding fibromyalgia and arthritis
No Yes
No (Ref) Yes
Injuries INJ INJ_01 In the past 12 months that is from [date one year ago] to Yesterday were you injured
No Yes
No (Ref) Yes
88
Appendix E Acculturation Scale
Acculturation Scale 1 (score=2) 2 (score=3) 3 (score=4)
Low Acculturation Moderate Acculturation High Acculturation
Example of Scoring A person who speaks English at home and has lived in Canada for 10 years or more
will receive a score of four (2+2=4) and will be considered as high acculturation
What language do you speak most often at home
English Other
2 1
In what year did you first come to Canada to live
ge10 lt10
2 1


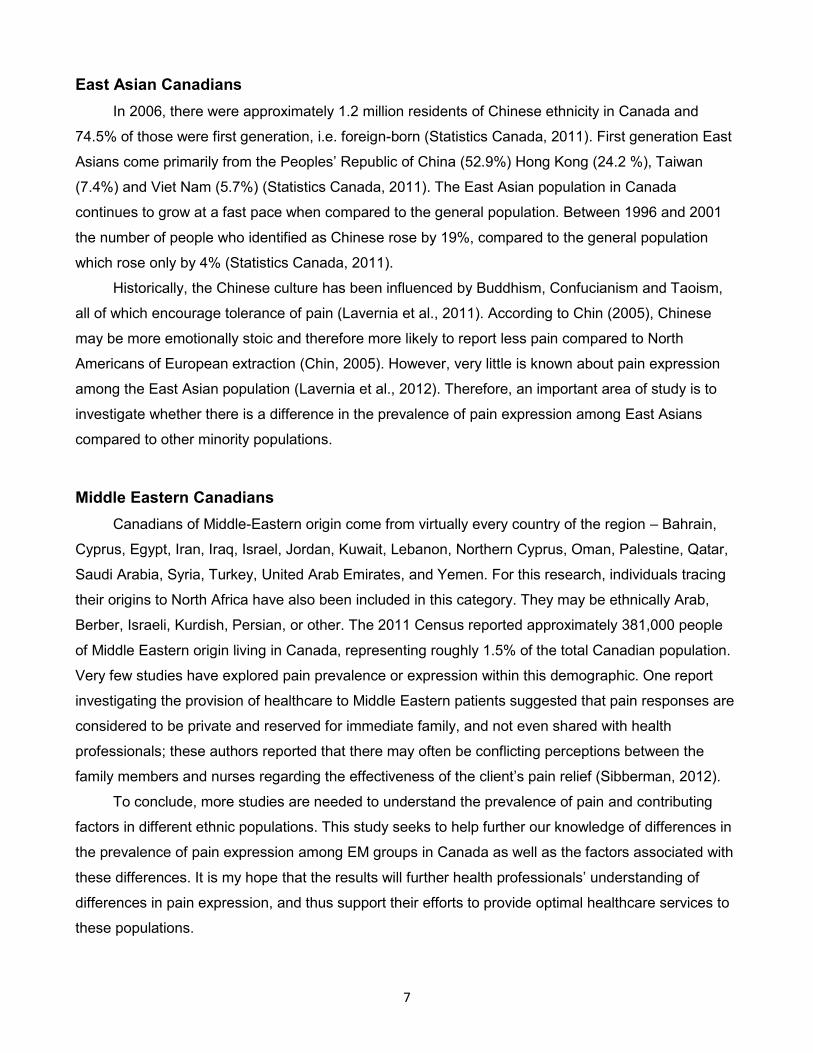


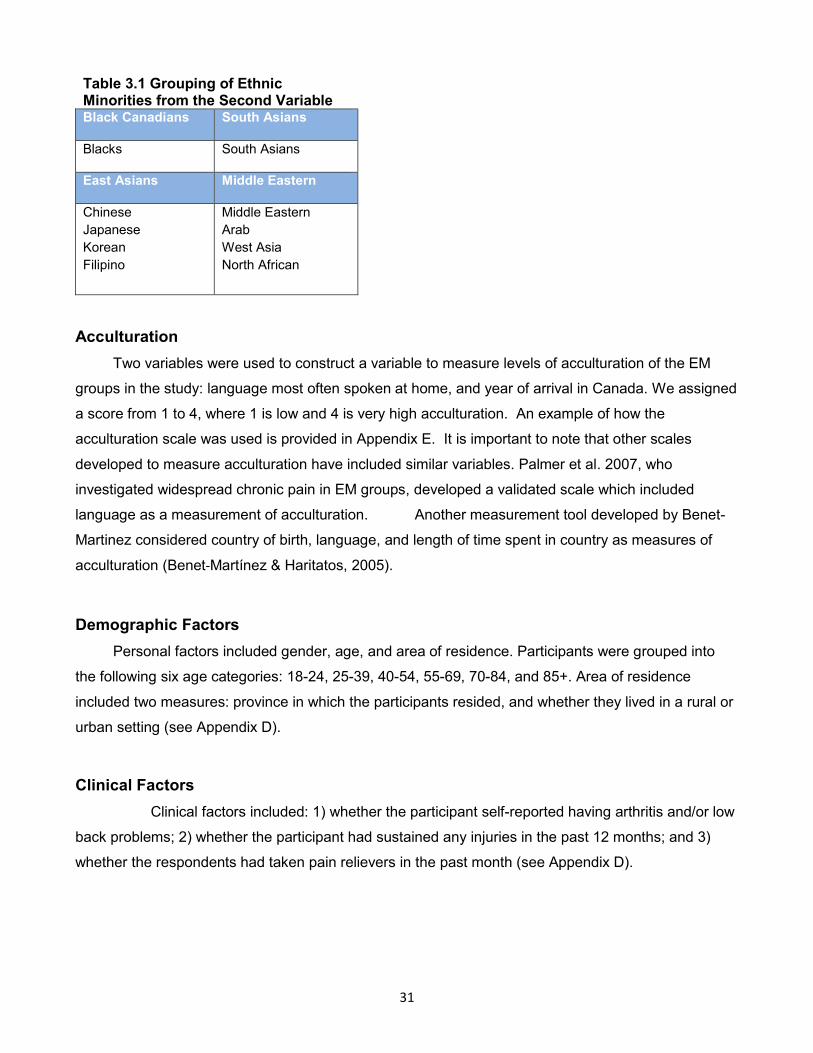


Related Documents