This is the author’s final, peer-reviewed manuscript as accepted for publication. The publisher-formatted version may be available through the publisher’s web site or your institution’s library. This item was retrieved from the K-State Research Exchange (K-REx), the institutional repository of Kansas State University. K-REx is available at http://krex.ksu.edu Ethnic food awareness and perceptions of consumers in Thailand and the United States. Bradon Bell, Koushik Adhikari, Edgar Chambers IV, Panat Cherdchu, and Thongchai Suwonsichon How to cite this manuscript If you make reference to this version of the manuscript, use the following information: Bell, B., Adhikari, K., Chambers, E., Cherdchu, P. & Suwonsichon, T. Ethnic food awareness and perceptions of consumers in Thailand and the United States. Retrieved from http://krex.ksu.edu Published Version Information Citation: Bell, B., Adhikari, K., Chambers, E., Cherdchu, P. & Suwonsichon, T. (2011). Ethnic food awareness and perceptions of consumers in Thailand and the United States. Nutrition & Food Science, 41(4), 268-277. Copyright: Copyright © Emerald Group Publishing Limited© Emerald Group Publishing Li Digital Object Identifier (DOI): doi: 10.1108/00346651111151401 Publisher’s Link: http://www.emeraldinsight.com/journals.htm?articleid=1941547&show=abstract

Welcome message from author
This document is posted to help you gain knowledge. Please leave a comment to let me know what you think about it! Share it to your friends and learn new things together.
Transcript
This is the author’s final, peer-reviewed manuscript as accepted for publication. The publisher-formatted version may be available through the publisher’s web site or your institution’s library.
This item was retrieved from the K-State Research Exchange (K-REx), the institutional repository of Kansas State University. K-REx is available at http://krex.ksu.edu
Ethnic food awareness and perceptions of consumers in Thailand and the United States. Bradon Bell, Koushik Adhikari, Edgar Chambers IV, Panat Cherdchu, and Thongchai Suwonsichon
How to cite this manuscript
If you make reference to this version of the manuscript, use the following information: Bell, B., Adhikari, K., Chambers, E., Cherdchu, P. & Suwonsichon, T. Ethnic food awareness and perceptions of consumers in Thailand and the United States. Retrieved from http://krex.ksu.edu
Published Version Information
Citation: Bell, B., Adhikari, K., Chambers, E., Cherdchu, P. & Suwonsichon, T. (2011). Ethnic food awareness and perceptions of consumers in Thailand and the United States. Nutrition & Food Science, 41(4), 268-277. Copyright: Copyright © Emerald Group Publishing Limited© Emerald Group Publishing Li Digital Object Identifier (DOI): doi: 10.1108/00346651111151401
Publisher’s Link: http://www.emeraldinsight.com/journals.htm?articleid=1941547&show=abstract

1
Bell B, Adhikari K, Chambers E IV, Cherdchu P, Suwonsichon T. 2011. Ethnic food
awareness and perceptions of consumers in Thailand and the United States. Nutr Food Sci
41:268-77.
2
Ethnic food awareness and perceptions of consumers in Thailand and the United States
Brandon Bella, Koushik Adhikari
a,*, Edgar Chambers IV
a, Panat Cherdchu
a, Thongchai
Suwonsichonb
aThe Sensory Analysis Center,
Department of Human Nutrition, Kansas State University,
Manhattan, Kansas 66506, U.S.A. bDepartment of Product Development, Kasetsart University,
50 Phaholyothin Road, Ladyaw Chatujak, BKK 10900, Bangkok, Thailand
*Correspondence to: Koushik Adhikari, Department of Human Nutrition, Kansas State
University, Manhattan, KS 66506-1407, U.S.A.
E-mail: [email protected]
3
Abstract
Purpose – The main purpose of the study was to determine the awareness towards ethnic foods
made with traditional spices among U.S. and Thai consumers.
Design/methodology/approach – Data on the awareness and use of ethnic cuisines and spices
was collected from 100 consumers in a Midwestern university town in the United States and 100
consumers in Bangkok, Thailand. Consumers were also asked to identify ethnic spice blends by
tasting spice blends in rice and they ranked the perceived health benefits of 15 ethnic cuisines.
Findings – The results showed that more Thai consumers (94%) shop at ethnic grocery stores
than US consumers (55%). Also, Thai consumers are more likely to consume ethnic foods from
nearby countries, but US consumers have tried a greater variety of ethnic foods. Neither group
generally was able to identify a cuisines based only on the spice flavors, although, Thai
consumers were slightly better at doing so. Asian cuisines were perceived to have the greatest
health benefits to both American and Thai consumers.
Originality/value – The consumption of ethnic foods is on the rise around the world as
consumers seek new food experiences and diversity in their diets. Manufacturers are using these
traditional spices to convey an “ethnic” and “healthy” profile to their foods.
Keywords Ethnic foods, Consumer test, Health, Thailand, United States
Paper type Research paper
4
Introduction
Marketing research experts have predicted a doubling of ethnic food demand from 2005 to 2015,
with annual sales reaching 75 billion dollars (Howell, 2005) in the United States. Ethnic food
consumption is increasing at a rate of over 7% annually, as the availability of ethnic food
restaurants and ethnic food stores has grown and as consumers aim to balance nutritious diets
(Jones, 1997). Asia is increasingly important to global food manufacturers and is especially
important for marketing unique foods with functional properties (Mun, 2009), many of which are
based on “ethnic” Asian diets.
Consumers are seeking new food experiences and flavor combinations. Much of the transfer of
cuisines around the world has occurred through flavorings from spices, which capture the
“essence” of particular foods (Danhi and Slatkin, 2009). Dietary diversification is an essential
part of maintaining adequate health. Generally, as diets become more simplified, more health
problems arise (Frison et al., 2006). Assantachai and Lekhakula (2007) showed that deficiencies
of certain nutrients in older adults in Thailand were not only from socio-economic problems, but
also from “monotonous food consumption” practices. Diversity of diet can be increased as
ethnic foods become more available and as knowledge of how to prepare such foods is increased.
Different cultures can learn from each other about the effective use of various plant materials
(Frison et al., 2006).
As cultures continue to diversify and evolve, it is expected that food choices also will diversify
as consumers assimilate certain ethnic food cultural habits into their own diets (Tian, 2001). In
fact, some recent studies have shown that individual differences in consumers tend to be more
important than specific ethnicity issues when studying food acceptance for various products
(Neely et al., 2010; Palacios et al., 2009) although some differences by country can still exist
5
(Lee et al., 2010). Ethnic groups vary from each other, often widely, by the cultural context of
their food and diet. According to Guerrero et al. (2008), when defining a “traditional food
product (TFP),” sensory parameters and identifying a particular taste are the best ways.
Evaluation of the sensory attributes of foods is an easy and effective way to distinguish the
authenticity of such products as well as the culture related to it.
The recognition of flavor is a direct link to flavor and memory. Consumers often have difficulty
describing new foods and flavors because they must rely on memory and experience to do so,
even though they haven't tasted the product. “This inability to define, measure, or quantify taste
may contribute to the link between memories and taste” (Varadachari, 2002). It is difficult to
describe new foods or sensations without the prior memory of similar foods or sensations.
Food choice and selection often is based on memory, though consumers often are unaware of
such factors in their decisions. Consumption of products leads to an implicit knowledge of the
specific foods eaten, thus influencing what we eat (Mojet and Koster, 2005). Recent studies
have shown differences in the ability of consumers to identify typical cuisines. For example,
Yusop et al. (2009) found that Europeans were better able to identify various Chinese cuisines
than were Chinese consumers living in Europe. Those authors suggested that "authenticity" may
differ depending on people's experiences and the actual foods used in the test.
Laureati et al. (2008) examined absolute memory by giving custard samples to consumers, along
with a meal to disguise the objective of the test. The consumers returned the next day and had to
identify the sample they ate on the previous day, among distracter foods. Females and high-
likers had a higher recognition index than males and low-likers. The age of the consumer did not
seem to have an effect, as those of all ages performed poorly at the memory recognition
6
(Laureati, 2008). The conclusions from the study suggest that there still are many unknowns
about the role of memory on flavors, liking, and the impact that it has on food choice.
A child‟s dietary diversification and eating habits are molded early on in life as their diets are
generally based on the cultural eating tendencies of their parents (Bril et al., 2001). Children are
more accepting of new foods (more neophilic) than adults 55 years and older who tend to be
more neophobic (Verbeke and Lopez, 2005). Also, exposure to flavors, both prenatally and
through breastmilk feeding, influences the child‟s flavor preferences later in life (Mennela et al.,
2001). The liking for particular foods is increased as repeated exposure occurs (Liem and
deGraaf, 2004).
Research has shown that young children are better able to remember a flavor if the flavor recalls
positive memories about the time it was consumed. This is possibly due to the fact that they are
better able to describe the flavor, engraining it in their memory for future references to repeated
exposures (Lumeng and Cardinal, 2007).
The objectives of the study were to understand (1) the general awareness of ethnic foods
containing traditional spices in two different markets (US and Thailand); (2) the accuracy of
consumer identification of seasonings/spice blends that are traditionally used in various ethnic
foods; (3) and the health-related perceptions and attitudes towards ethnic foods.
Materials and Methods
Sample Preparation
Six spice blends were selected, including: Mexican (Mexican Spice Blend; Spice Barn, Inc., OH,
USA), Cajun (Cajun Seasoning; McCormick & Company, Inc., Hunt Valley, MD, USA), Italian
(Italian Seasoning; McCormick & Company, Inc.), Thai (Tom Yum Soup Powder; Multipro
International Company Ltd., Samultprakarn, Thailand), Indian (Curry Powder; House of Spices
7
(India) Inc., Flushing, NY, USA), and Korean (Korean Kimchi Bowl Noodle Powder; Nongshim
Company, Ltd., Seoul, Korea). Enriched long grain rice (Great Value, Wal-Mart, Bentonville,
AR, USA) was prepared by weighing 375g of rice and rinsing with 2 cups of distilled water. The
water was drained and the rice was placed in a rice cooker (Automatic Rice Cooker, RC-18JM,
Sharp, Japan). Six rice cookers were used, one for every spice blend. Five cups of water were
added to the rice, along with 2g of salt. The rice took approximately 45min to cook. After
cooking, the rice cooker lid was opened to allow the steam to escape. After 5min, the spices
were added to the rice and stirred for 3min to ensure a homogenous sample. For the Korean,
Thai, Cajun, and Mexican blends, 11.0g of spice were added to the pre-weighed cooked rice.
For the Italian and Indian blends, 8.25g of spice were added to the pre-weighed cooked rice.
These blends were the results of a preliminary taste test done to ensure that the levels of the
spices were strong enough to taste, yet still palatable.
Consumers
One hundred US consumers (55% female and 45% male) were recruited at a Midwestern
university town in the United States, and 100 Thai consumers (56% female and 44% male) were
recruited at a large national festival in Bangkok, Thailand. The participants recruited had no
known food allergies, and were selected to span the age range of 18 to 69 years.
Questionnaires and Spice Awareness Test
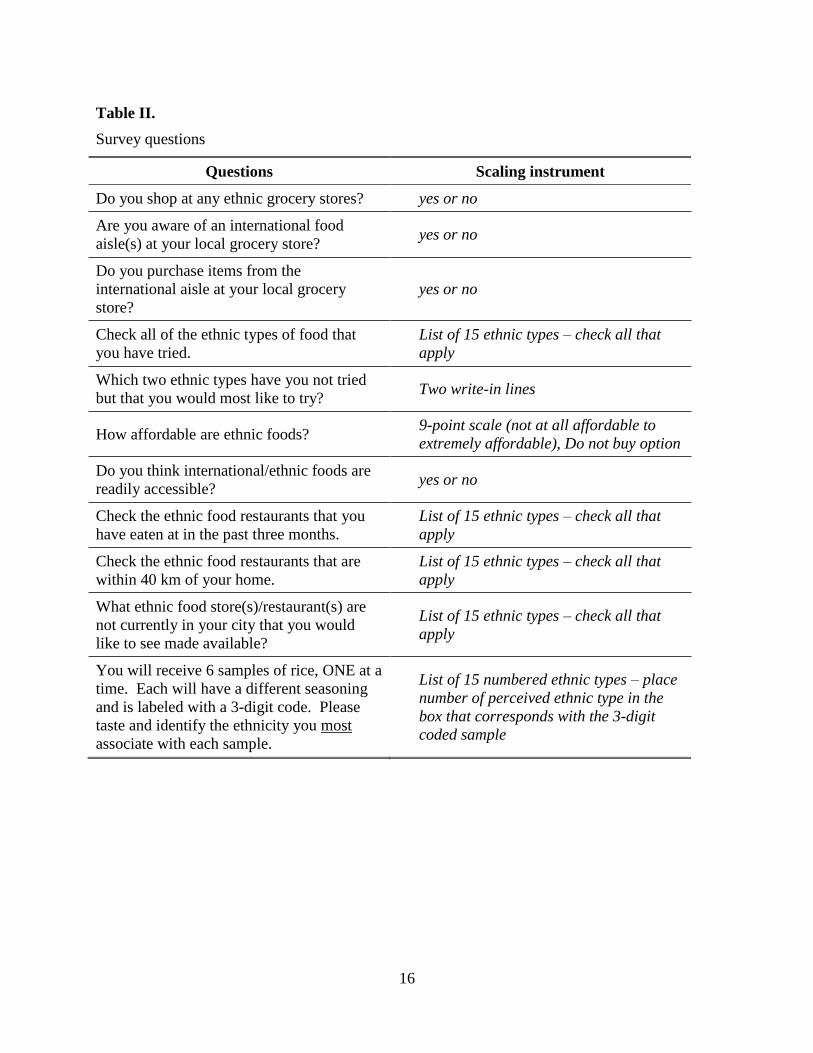
The consumers completed a questionnaire that detailed questions about ethnic food awareness
and health perceptions. The questions (Table 1) were asked prior to the taste test.
The taste portion of the test required consumers to match a particular ethnicity to the ethnic
blended rice samples provided. The samples were served using a sequential monadic
presentation that balanced the order of presentation across the consumers. All of the samples
8
were served in 96-ml (3.25oz.) plastic cups labeled with the appropriate 3-digit code. Each
consumer was given water and unsalted crackers and was encouraged to cleanse his/her palate
between the samples. The only difference in the two tests was that the consumers in Kansas
were given reverse osmosis, deionized, carbon-filtered water and Thai consumers bottled water
(Nestlé, Bangkok, Thailand). The entire test took approximately 45 min to complete.
Data Analysis
Wherever applicable, the percentages and mean values were calculated for the questions.
Pearson‟s correlation coefficients were calculated in Microsoft Excel®.
Results and Discussion
Ethnic food and restaurant awareness
A comparison of attitudes towards ethnic foods identified that more Thai consumers (94%) shop
at ethnic grocery stores than US consumers (55%) (Table 1). There are a number of factors that
might have contributed to this. Bangkok, Thailand is a large metropolitan area of more than
10,000,000 people with many ethnic markets, while the US town is a much smaller market of
less than 60,000 people with only 2 ethnic food stores. Also, typical Thai grocery stores carry a
large assortment of products from other Asian countries and from “western” countries. Thus,
Thai consumers may have labeled their local grocery store an “international/ethnic grocery store”
because the term was undefined. Both sets of consumers are equally aware (Thai – 92%, US –
89%) of an international food aisle at the local grocery store. The Thai consumers and US
consumers purchase items from these aisles at reasonably similar rates, 57% and 65%,
respectively. Of Thai consumers, 61% think ethnic foods are somewhat to very affordable,
compared to 80% of US consumers, and approximately seven out of 10 consumers from each
group thought that ethnic foods are readily accessible. It is important to identify that the average
9
American consumer spends ~ 6% of their disposable income on food (Euromonitor International,
2010a) while the typical Thai spends ~17% of their disposable income on food (Euromonitor
International, 2010b). The additional costs of ethnic foods, coupled with the disparity in percent
disposable incomes spent on food, possibly explains why 20% fewer Thai and US consumers
consider the foods affordable.
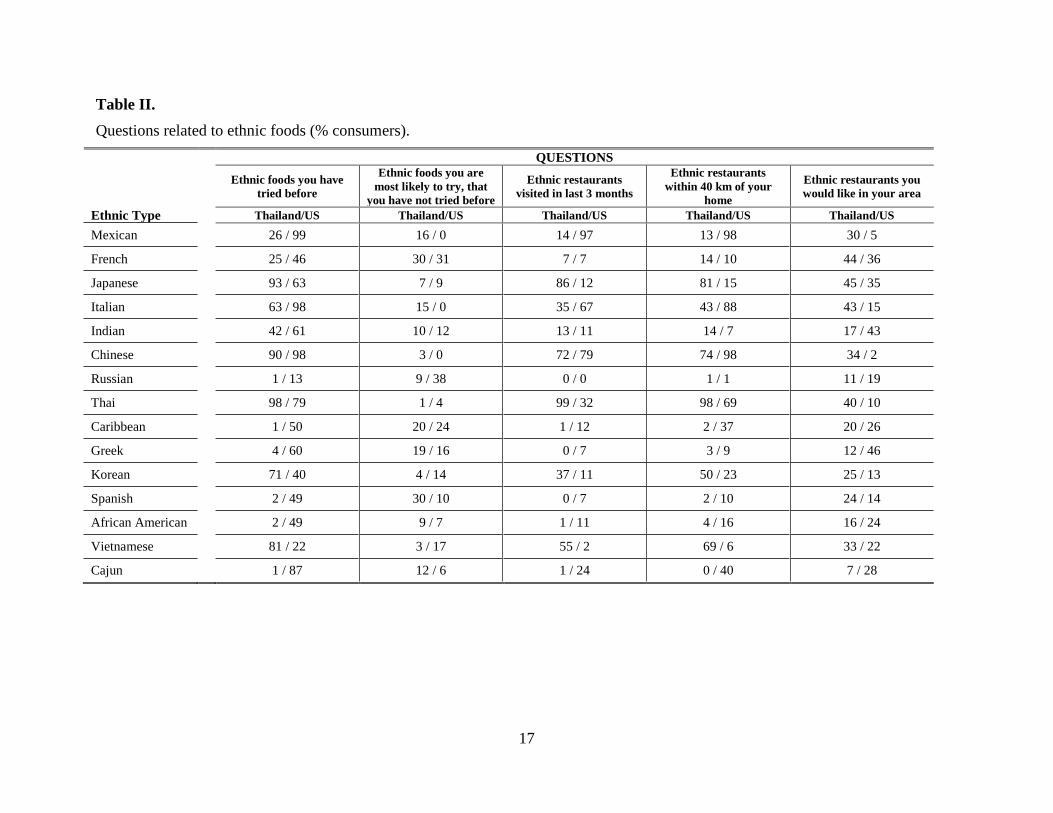
Thai consumers are more likely to consume ethnic foods from nearby countries (Table 2). A
majority of the Thai consumers have consumed Thai (98%), Japanese (93%), Chinese (90%),
Vietnamese (81%), and Korean (71%) ethnic foods. US consumers have tried a greater variety
of ethnic foods, suggesting that a wider variety of ethnic food restaurants are available in the US,
even in a smaller town. The US consumers have tried more ethnic foods that are not available
within 40 kilometers of their home, suggesting the US consumers we tested either are willing to
drive farther to get to restaurants or that they travel more than the Thai consumers we tested.
This finding is derived by comparing the ethnicities in which a low number of consumers
identified the ethnic food within 40 km of their home (French, Indian, Russian, Greek, and
Spanish) to the ethnic foods they had tried (Table 2), in which the US percentages are always
higher. This finding could be because of more ease of traveling, more knowledge or interest in
ethnic foods, or more ethnic restaurant options in nearby larger cities in the United States. The
ethnic foods that consumers have tried positively correlates with ethnic restaurants within 40
kilometers of the home (Thai R2= 0.939, US R
2= 0.957).
Identification of various ethnic spice blends
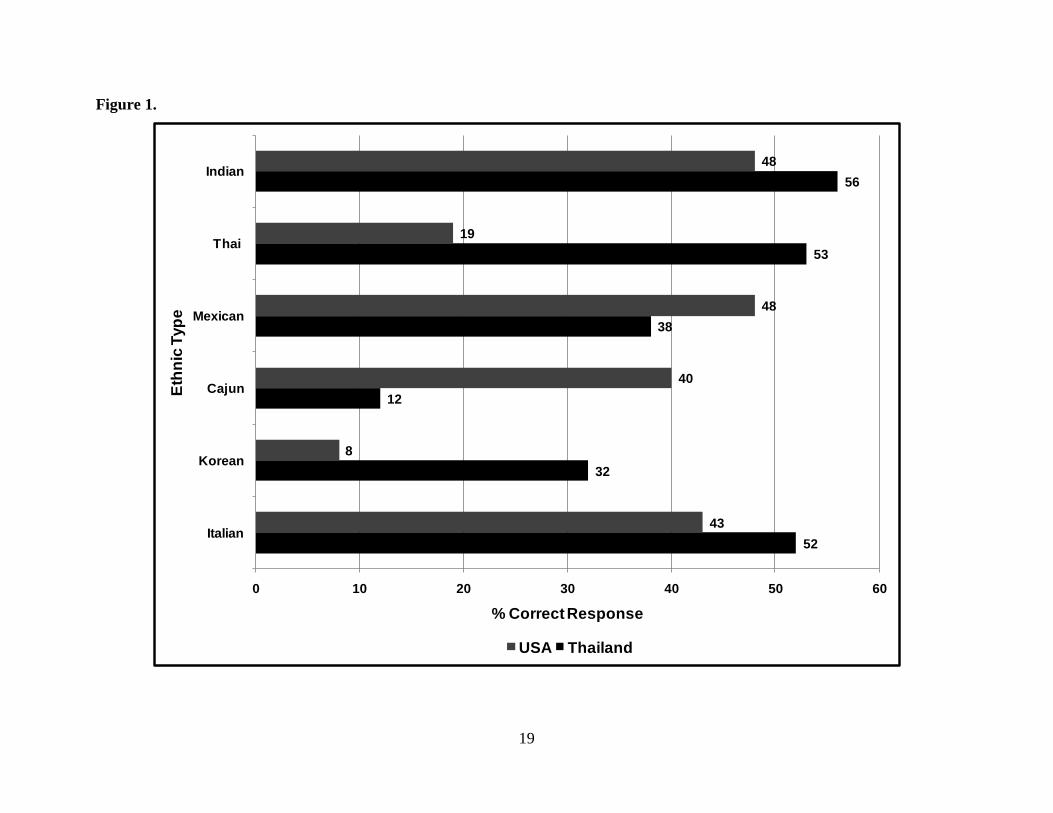
The accuracies of consumer identification of ethnic types of food in the consumer test are shown
in Figure 1. Less than 60% of all the consumers were able to accurately identify the ethnicity of
10
the specific cuisine based on tasting alone. In general, Thai consumers were more able to
accurately identify a flavor associated with a particular ethnicity than US consumers.
Interestingly, only 53% of Thais identified the Thai spice sample as Thai. The Thai spice blend
used was a generic “Tom Yum” soup blend, which, although it was made by a Thai company,
may not have conveyed the right flavor perception to some Thai consumers because they ate it
on rice. There is not a single spice that is synonymous with Thai culture, which made it difficult
to select a spice blend that was the gold standard for Thai taste for use on rice. The US
consumers did very poorly with the Thai spice blend, with only 19% correctly identifying the
sample. Cajun, the ethnic American cuisine chosen for this study, was identified correctly by
only 40% of US consumers and by 12% of Thai consumers. The relatively low number of
Americans that identified the Cajun spice correctly confirms the regional diversity of food in
America. Cajun food is a Southern cuisine and, it is not overly popular (only 24 consumers had
eaten at a Cajun restaurant in the past 3 months) in the Midwest. Only 40 US consumers
identified a Cajun restaurant within 40 km of their home, though there are two Cajun restaurants
in the Midwestern town in this study. The fact that Thais did not recognize this regional ethnic
American cuisine is not surprising because few Thais were familiar with it. It also is possible
that both the Thai cuisine for Thais and the Cajun cuisine for the US consumers did not capture
the "authentic" flavor expected by targeted users, something also found by Yosup et al., (2009).
Interestingly, 97% of US consumers noted that they had been to a Mexican restaurant in the last
3 months, but less than 50% of all consumers could identify it by taste. Only 26% of the Thai
consumers had ever tried Mexican food and 38% identified it correctly. The same trend held
true with Italian food. Many more Americans had consumed it recently and had tried it overall,
but the Thai consumers outperformed them on the flavor identification test (52% correct to 43%
11
correct). This suggests there might be some memory confusion when dealing with ethnic foods
or that the consumption of flavors on products that may be less typical of the cuisine (e.g. rice
instead of pasta) confuses consumers.
Consumers might have been able to identify whether or not they had tasted the spice blend
before but may have been confused when identifying it by tasting it. This is in line with other
research, suggesting memory is better at detecting changes in flavor and texture rather than
identifying previously tasted foods (Dijksterhuis et al., 2006). Also, Italian spice blends are not
normally used in rice, so the carrier of the spice might have confused the consumers. A majority
of the US consumers who misidentified the Italian blend indicated they thought it was “Greek,” a
different Mediterranean country and cuisine. It was probably because of the presence of oregano
in the Italian Seasoning. Neither group was able to identify the Korean spice sample. Again,
the Korean blend was a “Kimchi Bowl Noodle Powder,” which might not have been an exclusive
characteristic of Korean food as there are numerous flavors associated with Korean food. About
50% from each group identified the Indian, Italian, and Mexican blends.
This data suggests that TFPs cannot be characterized by a sensory parameter, namely flavor,
alone, which contrasts with the suggestion by Guerrero et al., (2008). It is possible that some
consumers never had the flavor memory experiences necessary to correctly identify the blends.
Alternatively, the consumers may have tried the ethnic food before but had not had enough
repeated exposure to adequately instill memory recall for the given blends (Mojet and Koster,
2005).
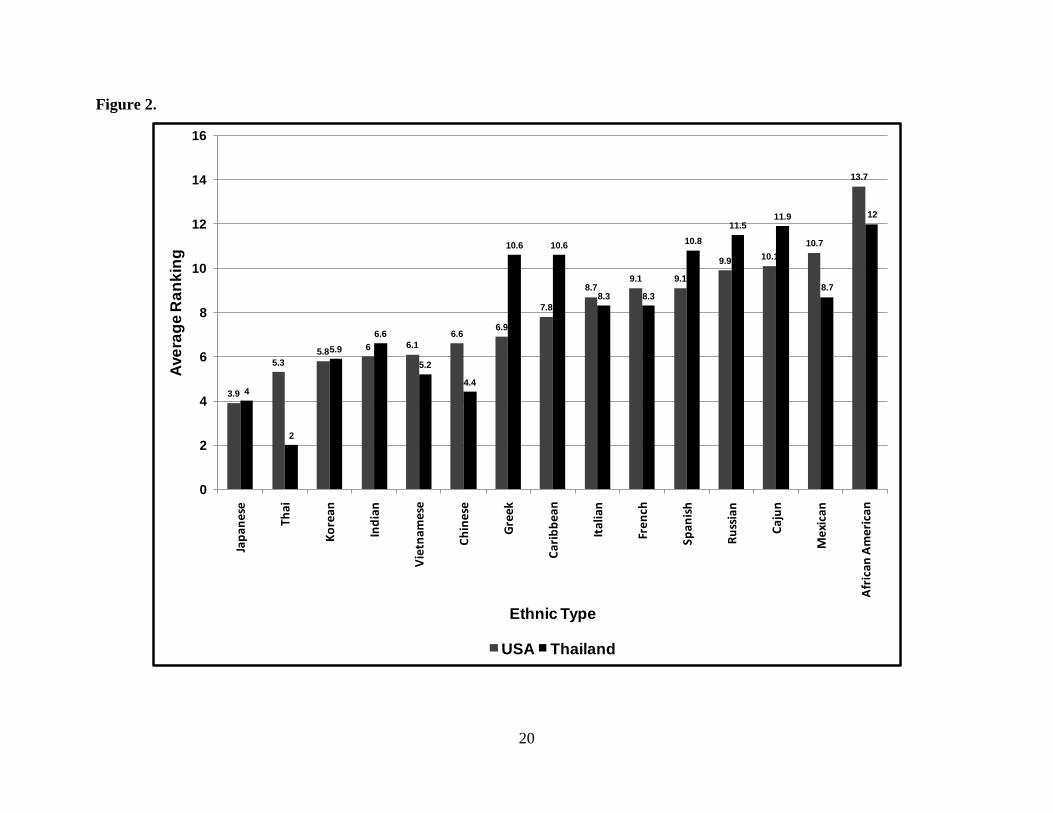
Health-related perceptions of various ethnic spice blends
All six Asian ethnic food types (Thai, Japanese, Chinese, Vietnamese, Korean, and Indian) that
were listed on the questionnaire were perceived as healthier than all other listed ethnic types for
12
both sets of consumers. Also, African American, Cajun, Russian, and Spanish were ranked in
the bottom 5, meaning they were seen as offering the least health benefits by both sets of
consumers. It is interesting that the two American cuisines (African American and Cajun) were
not viewed as offering much health benefits. This identification as less healthful may explain
why Americans are branching out and trying other ethnic cuisines that have more perceived
health benefits.
Ethnic foods with the most perceived health benefits could expect more growth than the ethnic
foods with fewer perceived health benefits, should this trend continue. According to Niva
(2007), foods that are perceived as healthy are often natural, unprocessed, fresh, low-fat,
nutritious, and high in vitamin and mineral contents. Perhaps Asian ethnic foods are perceived
to have more of these health attributes. More research needs to be conducted correlating specific
health perceptions to ethnic and cultural food categories to identify which claims are driving the
perceived health benefits.
Another factor that could be driving the willingness to try and use ethnic functional foods is the
perceived rewards the diets provide (Urala and Lahteenmaki, 2004). A functional food is
defined as a food that provides health benefits above and beyond basic nutrition (Roberfroid,
2000). Poulsen (1999) identified that Americans are much more inclined, compared to
Europeans, to accept functional foods as the solution to the problem between health and eating
habits. These international differences in health perceptions do not seem to differ between the
Thai and US consumers as the health perception rankings are very similar. Evidently, both sets
of consumers associate the health perceptions of ethnic foods comparably.

13
Conclusions
The overall awareness of ethnic foods and spices among the Thai and US consumers we tested is
relatively high as consumers frequently visit and purchase ethnic foods from culturally diverse
restaurants and grocery stores. Overall, consumers are „slightly to moderately‟ able to identify
the ethnicity of some spice blends based on flavor alone. Spice selection for similar studies in
the future needs to be carefully analyzed as it is difficult to pick out a representative spice blend
that accurately characterizes the flavor associated with a particular culture, evidenced by the
confusion of natives with their own foods. Finally, Asian cuisines are perceived to have the
greatest health benefits to both US and Thai consumers.
14
References
Assantachai, P. and Lekhakula, S. (2007), “Epidemiological survey of vitamin deficiencies in
older Thai adults: Implications for national policy planning” Public Health Nutrition,
Vol. 10, pp. 65-70.
Bril, B., Hombessa-Nkounkou, E., Bouville, J.-F. and Ocampo, C. (2001), “From milk to adult
diet: a comparative study on the socialization of food”, Food and Foodways, Vol. 9 No.
3-4, pp. 155-86.
Danhi, R. and Slatkin, A. (2009), “Capturing the essence of Southeast Asia”, Prepared Foods,
Vol. 178 No. 1, pp. 84-6.
Dijksterhuis, G., Mojet, J., Koster, E.P., Moller, P., Hausner, H., Issanchou, S., Sulmont-Rosse,
C. and Zandstra, E.H. (2006), “Workshop: the role of memory in food choice and liking”,
Food Quality and Preference, Vol. 17, pp. 650-7.
Euromonitor International (2010a), “Country factile: USA”, available at:
http://www.euromonitor.com/factfile.aspx?country=US (accessed 29 September 2010).
Euromonitor International (2010a), “Country factile: Thailand”, available at:
http://www.euromonitor.com/factfile.aspx?country=TH (accessed 29 September 2010).
Frison, E.A., Smith, I.F., Johns, T., Cherfas, J. and Eyzaguirre, P.B. (2006), “Agricultural
biodiversity, nutrition, and health: making a difference to hunger and nutrition in the
developing world”, Food and Nutrition Bulletin, Vol. 27, pp. 167-79.
Guerrero, L., Guardia, M.D., Xicola, J., Verbeke, W., Vanhonacker, F., Zakowska-Biemans, S.,
Sajdakowska, M., Sulmont-Rosse, C., Issanchou, S., Contel, M., Scalvedi, M.L., Granli,
B.S. and Hersleth, M. (2009), “Consumer-driven definition of traditional food products
and innovation in traditional foods. A qualitative cross-cultural study”, Appetite, Vol. 52,
pp. 345-54.
Howell, D. (2005), “Retails must keep pace with evolving palates”, DSN Retailing Today,
http://findarticles.com/p/articles/mi_m0FNP/is_14_44/ai_n14868156/ (accessed 15
October 2009).
Jones, L. (1997), “Ethnic foods launch growing market”, Food Processing, Vol. 58 No. 8, pp.
63.
Laureati, M., Morin-Audebrand, L., Pagliarini, E., Sulmont-Rosse, C., Koster, E.P. and Mojet, J.
(2008), “Food memory and its relation with age and liking: an incidental learning
experiment with children, young and elderly people”, Appetite, Vol. 51, pp. 273-82.
Lee, C-H. (2004), “Funcitonal food of interest to ASEAN: from traditional experience to modern
production and trading”, Food Science and Biotechnology, Vol. 13, pp. 390-5.
Lee, J. Chambers, E. IV, Chambers, D.H., Chun, S.S., Oupadissakoon, C. and Johnson, D.E.
(2010), “Consumer acceptance for green tea by consumers in the United States, Korea
and Thailand”, Journal of Sensory Studies, Vol. 25, pp. 109-32.
15
Liem, D.G. and deGraaf, C. (2004), “Sweet and sour preferences in young children and adults:
role of repeated exposure”, Physiology & Behavior, Vol. 83, pp. 421-9.
Lumeng, J.C. and Cardinal, T.M. (2007), “Providing information about a flavor to preschoolers:
effects on liking and memory for having tasted it”, Chemical Senses, Vol. 32, pp. 505-13.
Mennela, J.A., Jagnow, C.P., and Beauchamp, G.K. (2001), “Prenatal and postnatal flavor
learning by human infants”, Pediatrics, Vol. 107, pp. E88-93.
Mojet, J. and Koster, E.P. (2005), “Sensory memory and food texture”, Food Quality and
Preference, Vol. 16, pp. 251-66.
Mun, P. W. (2009), “Marketing functional foods with claims in Asia”, Agro Food Industry Hi-
tech, Vol. 20 No. 5, pp. 16-8.
Neely, E.A., Lee, Y. and Lee, S.-Y. (2010), “Cross-cultural comparison of acceptance of soy-
based extruded snack foods by U.S. and Indian consumers”, Journal of Sensory Studies,
Vol. 25, pp. S87-108.
Niva, M. (2007), “All foods affect health: understandings of functional foods and healthy eating
among health-oriented Finns”, Appetite, Vol. 48, pp. 384-93.
Palacios, O.M., Badran, J., Drake, M.A., Reisner, M. and Moskowitz, H.R. (2009), “Consumer
acceptance of cow's milk versus soy beverages: impact of ethnicity, lactose tolerance and
sensory preference segmentation”, Journal of Sensory Studies, Vol. 24, pp. 731-48.
Poulsen, J. (1999), “Danish consumers‟ attitudes towards functional foods”, working paper no
62, The MAPP Centre, Aarhus School of Business, Denmark, available at:
http://130.226.203.239/pub/mapp/wp/wp62.pdf (accessed 1 July 2010).
Roberfroid, M.B. (2000), “Defining functional foods”, Gibson, G. and Williams, C.M. (Eds.),
Functional Foods; Concept to product, Woodhead, Cambridge, pp. 9-29.
Tian, R.G. (2001), “Cultural awareness of the consumers at a Chinese restaurant: an
anthropological descriptive analysis” Journal of Food Products Marketing, Vol. 7, pp.
111-30.
Urala, N. and Lahteenmaki, L. (2004), “Attitudes behind consumers‟willingness to use
functional foods”, Food Quality and Preference, Vol. 15, pp. 793-803.
Varadachari, S. (2002), “The science of creating a memorable flavor”, Cereal Foods World, Vol.
47, pp. 84-8.
Verbeke, W. and Lopez, G.P. (2005), “Ethnic food attitudes and behavior among Belgians and
Hispanics living in Belgium”, British Food Journal, Vol. 107, pp. 823-40.
Yusop, S.M., O'sullivan, M.G., Kerry, J.F. and Kerry, J.P. (2009), “Sensory evaluation of
Chinese-style marinated chicken by Chinese and European naïve assessors”, Journal of
Sensory Studies, Vol. 24, pp. 512-33.
16
Table II.
Survey questions
Questions Scaling instrument
Do you shop at any ethnic grocery stores? yes or no
Are you aware of an international food
aisle(s) at your local grocery store? yes or no
Do you purchase items from the
international aisle at your local grocery
store?
yes or no
Check all of the ethnic types of food that
you have tried.
List of 15 ethnic types – check all that
apply
Which two ethnic types have you not tried
but that you would most like to try? Two write-in lines
How affordable are ethnic foods? 9-point scale (not at all affordable to
extremely affordable), Do not buy option
Do you think international/ethnic foods are
readily accessible? yes or no
Check the ethnic food restaurants that you
have eaten at in the past three months.
List of 15 ethnic types – check all that
apply
Check the ethnic food restaurants that are
within 40 km of your home.
List of 15 ethnic types – check all that
apply
What ethnic food store(s)/restaurant(s) are
not currently in your city that you would
like to see made available?
List of 15 ethnic types – check all that
apply
You will receive 6 samples of rice, ONE at a
time. Each will have a different seasoning
and is labeled with a 3-digit code. Please
taste and identify the ethnicity you most
associate with each sample.
List of 15 numbered ethnic types – place
number of perceived ethnic type in the
box that corresponds with the 3-digit
coded sample
17
Table II.
Questions related to ethnic foods (% consumers).
QUESTIONS
Ethnic foods you have
tried before
Ethnic foods you are
most likely to try, that
you have not tried before
Ethnic restaurants
visited in last 3 months
Ethnic restaurants
within 40 km of your
home
Ethnic restaurants you
would like in your area
Ethnic Type Thailand/US Thailand/US Thailand/US Thailand/US Thailand/US
Mexican 26 / 99 16 / 0 14 / 97 13 / 98 30 / 5
French 25 / 46 30 / 31 7 / 7 14 / 10 44 / 36
Japanese 93 / 63 7 / 9 86 / 12 81 / 15 45 / 35
Italian 63 / 98 15 / 0 35 / 67 43 / 88 43 / 15
Indian 42 / 61 10 / 12 13 / 11 14 / 7 17 / 43
Chinese 90 / 98 3 / 0 72 / 79 74 / 98 34 / 2
Russian 1 / 13 9 / 38 0 / 0 1 / 1 11 / 19
Thai 98 / 79 1 / 4 99 / 32 98 / 69 40 / 10
Caribbean 1 / 50 20 / 24 1 / 12 2 / 37 20 / 26
Greek 4 / 60 19 / 16 0 / 7 3 / 9 12 / 46
Korean 71 / 40 4 / 14 37 / 11 50 / 23 25 / 13
Spanish 2 / 49 30 / 10 0 / 7 2 / 10 24 / 14
African American 2 / 49 9 / 7 1 / 11 4 / 16 16 / 24
Vietnamese 81 / 22 3 / 17 55 / 2 69 / 6 33 / 22
Cajun 1 / 87 12 / 6 1 / 24 0 / 40 7 / 28

18
FIGURE CAPTIONS
Figure 1. Consumer responses for identification of six ethnic spice blends (rice was used as the carrier food)
Figure 2. Average consumer ranking (from most healthy to least healthy) of the perception of health benefits for each ethnic type
19
Figure 1.
52
32
12
38
53
56
43
8
40
48
19
48
0 10 20 30 40 50 60
Italian
Korean
Cajun
Mexican
Thai
Indian
% Correct Response
Eth
nic
Typ
e
USA Thailand
20
Figure 2.
3.9
5.3
5.86 6.1
6.66.9
7.8
8.79.1 9.1
9.910.1
10.7
13.7
4
2
5.9
6.6
5.2
4.4
10.6 10.6
8.3 8.3
10.8
11.511.9
8.7
12
0
2
4
6
8
10
12
14
16
Jap
anes
e
Thai
Ko
rean
Ind
ian
Vie
tnam
ese
Ch
ines
e
Gre
ek
Car
ibb
ean
Ital
ian
Fre
nch
Span
ish
Ru
ssia
n
Caj
un
Me
xica
n
Afr
ican
Am
eri
can
Ave
rag
e R
an
kin
g
Ethnic Type
USA Thailand
Related Documents