Munich Personal RePEc Archive Ethnic Diversity and Inequality in sub-Saharan Africa: Do Institutions Reduce the Noise? Ajide, Kazeem and Alimi, Olorunfemi and Asongu, Simplice January 2019 Online at https://mpra.ub.uni-muenchen.de/94015/ MPRA Paper No. 94015, posted 19 May 2019 09:13 UTC

Welcome message from author
This document is posted to help you gain knowledge. Please leave a comment to let me know what you think about it! Share it to your friends and learn new things together.
Transcript
Munich Personal RePEc Archive
Ethnic Diversity and Inequality in
sub-Saharan Africa: Do Institutions
Reduce the Noise?
Ajide, Kazeem and Alimi, Olorunfemi and Asongu, Simplice
January 2019
Online at https://mpra.ub.uni-muenchen.de/94015/
MPRA Paper No. 94015, posted 19 May 2019 09:13 UTC

1
A G D I Working Paper
WP/19/018
Ethnic Diversity and Inequality in sub-Saharan Africa: Do Institutions
Reduce the Noise? 1
Forthcoming: Social Indicators Research
Kazeem B. Ajide
Department of Economics, University of Lagos
E-mail: [email protected]
OlorunfemiY. Alimi
Department of Economics, University of Lagos
E-mail: [email protected]
Simplice A. Asongu
Development Finance Centre Graduate School of Business,
University of Cape Town, Cape Town, South Africa. E-mail: [email protected]
1 This working paper also appears in the Development Bank of Nigeria Working Paper Series.
2
2019 African Governance and Development Institute WP/19/018
Research Department
Ethnic Diversity and Inequality in sub-Saharan Africa: Do Institutions Reduce the
Noise?
Kazeem B. Ajide, Olorunfemi Y. Alimi & Simplice A. Asongu
January 2019
Abstract
Studies on the causes of income differences between the rich and the poor have received an
extensive attention in the inequality empirics. While ethnic diversity hasalso been identified
as one of the fundamental causes of income inequality, the role of institutions as a mediating
factor in the ethnicity-inequality nexus has not received the scholarly attention it deserves. To
this end, this study complements the existing literature by investigating the extent to which
institutional framework corrects the noisy influence originating from the nexus between
“ethnic diversity” and inequality in 26 sub-Saharan African countries for the period 1996-
2015. The empirical evidence is based on pooled OLS, fixed effects and system GMM
estimators. The main findings reveal that the mediating influences of institutional
settingsaredefective, thus making it extremely difficult to modulatethe noisy impacts of
ethno-linguistic and religious heterogeneity on inequality. In addition, the negative
influencesorchestrated by ethnolinguistic and religious diversities on inequality fail
toattenuate the impact of income disparityeven when interacted with institutions. On the
policy front, institutional reforms tailored toward economic, political and institutional
governances should be targeted.
Keywords: Linguistic, religious, ethnicity, inequality, Institutions, Kuznets curve.
JEL Classification: C23, D02, D63, E02.
3
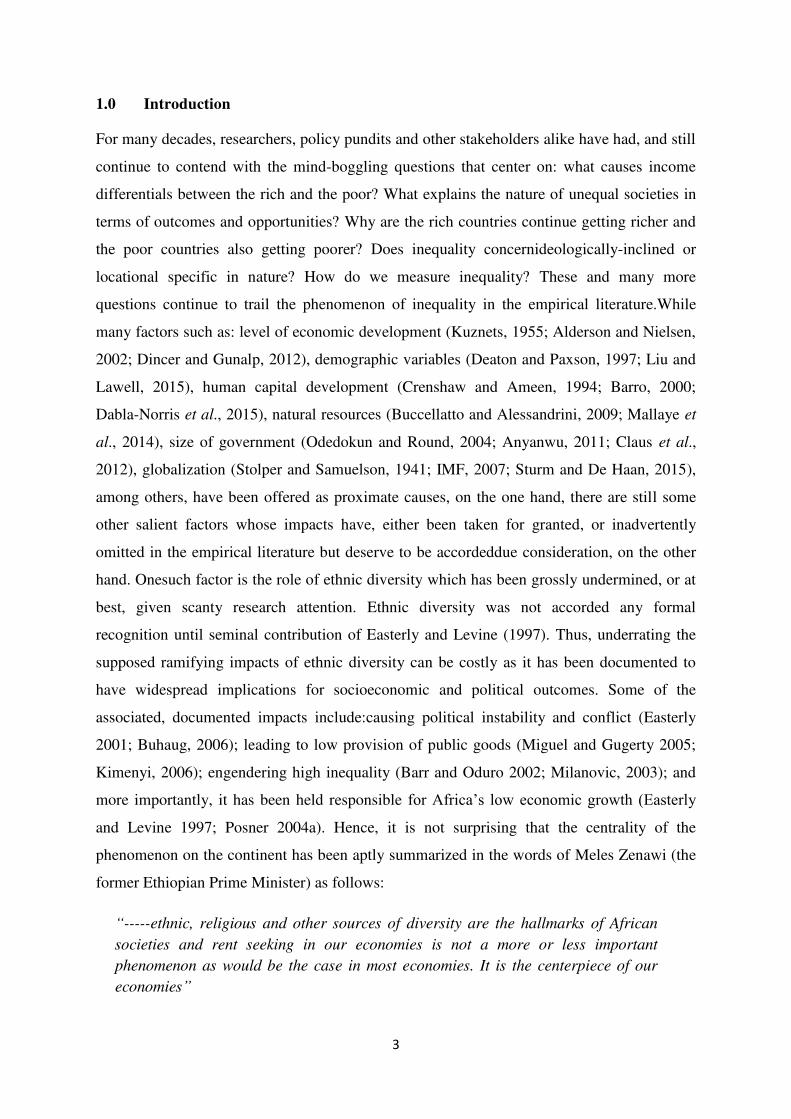
1.0 Introduction
For many decades, researchers, policy pundits and other stakeholders alike have had, and still
continue to contend with the mind-boggling questions that center on: what causes income
differentials between the rich and the poor? What explains the nature of unequal societies in
terms of outcomes and opportunities? Why are the rich countries continue getting richer and
the poor countries also getting poorer? Does inequality concernideologically-inclined or
locational specific in nature? How do we measure inequality? These and many more
questions continue to trail the phenomenon of inequality in the empirical literature.While
many factors such as: level of economic development (Kuznets, 1955; Alderson and Nielsen,
2002; Dincer and Gunalp, 2012), demographic variables (Deaton and Paxson, 1997; Liu and
Lawell, 2015), human capital development (Crenshaw and Ameen, 1994; Barro, 2000;
Dabla-Norris et al., 2015), natural resources (Buccellatto and Alessandrini, 2009; Mallaye et
al., 2014), size of government (Odedokun and Round, 2004; Anyanwu, 2011; Claus et al.,
2012), globalization (Stolper and Samuelson, 1941; IMF, 2007; Sturm and De Haan, 2015),
among others, have been offered as proximate causes, on the one hand, there are still some
other salient factors whose impacts have, either been taken for granted, or inadvertently
omitted in the empirical literature but deserve to be accordeddue consideration, on the other
hand. Onesuch factor is the role of ethnic diversity which has been grossly undermined, or at
best, given scanty research attention. Ethnic diversity was not accorded any formal
recognition until seminal contribution of Easterly and Levine (1997). Thus, underrating the
supposed ramifying impacts of ethnic diversity can be costly as it has been documented to
have widespread implications for socioeconomic and political outcomes. Some of the
associated, documented impacts include:causing political instability and conflict (Easterly
2001; Buhaug, 2006); leading to low provision of public goods (Miguel and Gugerty 2005;
Kimenyi, 2006); engendering high inequality (Barr and Oduro 2002; Milanovic, 2003); and
more importantly, it has been held responsible for Africa’s low economic growth (Easterly
and Levine 1997; Posner 2004a). Hence, it is not surprising that the centrality of the
phenomenon on the continent has been aptly summarized in the words of Meles Zenawi (the
former Ethiopian Prime Minister) as follows:
“-----ethnic, religious and other sources of diversity are the hallmarks of African
societies and rent seeking in our economies is not a more or less important
phenomenon as would be the case in most economies. It is the centerpiece of our
economies”
4
Following the above quotation, it is doubtless that ethnic heterogeneity2 has a profound
impact on the African continent. Specifically, it has been argued to limit the tendency to
redistribute income (See, Glaeser, 2005). The assertion has been further buttressed by Alesina
and Glaeser (2004) who averred that individuals who belong to one ethnic group are less
willing to support redistribution helping other ethnic groups. This is particularly so, as
members of different ethnic groups simply view one another as direct competitors for scarce
economic resources (Bobo and Kluegel, 1993; Bobo and Hutchings, 1996). Alesina and
Ferrara’s (2005) hypothesis also stressed that the members of the non-majority ethnic groups
tend to derive positive utility from interacting with the members of the same ethnic group and
negative utility from interacting with the members of the majority ethnic group. Going
forward, other forms of diversity like language, race and religion have equally been
documented to exacerbating inequality problems as recent research have suggested. Desmet
et al.(2012)have attributedcross-country differences in income redistribution to ethno-
linguistic and religious fractionalization. According to Becker (1957), individuals tend to
have stronger feelings of empathy toward their own group. This implicatively suggests
countries with strong fractionalization often exhibit lower levels of redistribution.
In another strand of literature, Acemoglu (2003) have specially crafted roles for geography
and institutions as fundamental causes of differences in prosperity between countries. While
the import of the former has been floored on the ground of not necessarily suggesting
causation in spite of its higher correlational value with country’s prosperity on the one hand,
the latter factoris considered as having a critical causal relation with country’s prosperity on
the other hand.This, he defended by arguing that having good institutions encourage
investment in machinery, human capital, and better technologies, whichcould consequently
launch countries on the trajectory of prosperity. As a consequence, sound institutions that
give legal protection to minorities, guarantee freedom from expropriation, grant freedom
from repudiation of contracts, and facilitate cooperation for public services might possibly
constrain the amount of damage that one ethnic group3 ordiversity of any form could do to
another. In this light, institutions offer an environment that helps facilitate effective
interaction between ethno-lingustic and religious fractionalization and inequality if well
structured. It is startling, however, to note that whilestudies still exist in the empirical
literature on the ethnic diversity-inequality linkage, on the one hand (Milanovic, 2003;
2 Ethnic diversity and ethnic heterogeneity is being used interchangeably. 3 This is well exposited in Easterly (2001).
5
Glaeser, 2005; and Dincer and Lambert, 2006), the moderating role of a sound institutional
framework on its identified adverse consequences has hardly been given the priorityit
deserves on the other hand. To this end, the pertinent questions then remain: To what extent
caninstitutional infrastructure corrects the noisy influence originating from ethnic diversity-
inequality nexus for a developing region like the sub-Saharan Africa (SSA)? Are there causal
connections in their relationship? Proffering answers to foregoing questions remain the focal
targets the paper seeks to unveil.
This paper specifically focuses on SSA as a candidate region based onthe following
considerations. (i)Many of the countries in the region are ethnically heterogeneousin nature.
For instance, Nigeria alone has over 250 ethnic groups. It is instructive to state that empirical
findings have shown an African dummy variableregarding ethnic diversity to be statistically
significant (see Michalopoulos 2008; Ahlerup and Olsson 2009). It has been further
confirmed thatAfrica’s standard deviation in the number of ethnic groups per country is more
than 35% higher than any other region. (ii)The region has been confirmed as having the
highest levels of inequality both in terms of income and gender (see, Regional Economic
Outlook: sub-Saharan Africa, 20164). (iii) The sub-region is also largely characterized by
dysfunctional institutions (Ajide and Raheem, 2016). This has largely manifested on the
negative values of each component of institutional index at least for the region as noted in
World Governance Indicators’ Database.
In the light of the above apparent policy syndrome of inequality and the established role of
institutions in reducing poverty, income inequality and ethnic inequality, it is policy relevant
to complement existing literature by assessing how institutions modulate the effect ethnic
diversity on inequality. The position of the study departs from recent literature on inclusive
development which has focused on inter alia: wage inequality and employment protection
(Perugini and Pompei, 2016); views on sustainable and inclusive development in emerging
markets (Stiglitz, 2016); optimal redistribution and economic inequality via taxation (Yunker,
2016); gender equality (Baliamoune-Lutz and McGillivray, 2009; Anyanwu, 2013a; Elu and
Loubert, 2013; Baliamoune-Lutz, 2007; Anyanwu, 2014a), the redistributive effect of
regulation in developing nations (Atsu and Adams, 2015); rural-urban inequality
(Baliamoune-Lutz and Lutz, 2005), poverty nexuses (Anyanwu, 2013b, 2014b), relationships
between finance, poverty, employment and economic growth (Odhiambo, 2009, 2011),
4 Regional Economic Outlook: Sub-Saharan Africa (REO) was prepared by a team led by Céline Allard under the direction of AbebeAemro Selassie.
6
nexuses between human development, information technology and inclusive development
(Gosavi, 2017; Minkoua Nzie et al., 2017; Asongu and Nwachukwu, 2018) and the
relevance of finance in poverty mitigation (Odhiambo, 2010a, 2010b, 2013).
Apart from the introductory section in one, the remaining sections are structured as follows.
Section 2 covers stylized facts on ethnic diversity and inequality, while Section 3 discusses
the relevant literature. The data and methodology are presented in Section 4. The results are
disclosed and discussed in Section 5 while Section 6 concludes with implications and future
research directions.
2.0 Conceptual Relationship Between Ethnic Diversity and Inequality
This section focuses on the interrelationships in ethnic diversity-inequality and institutional
infrastructurediscourse for ease of appreciation of the conceptual linkages underlying the trio.
It also discusses the key indices of ethnic diversity as well as the measure of inequality (Gini
coefficients) of countries within the SSA region.
2.1 Conceptual Framework for analyzing linkages between Ethnic Diversity,
Inequality and Institutions
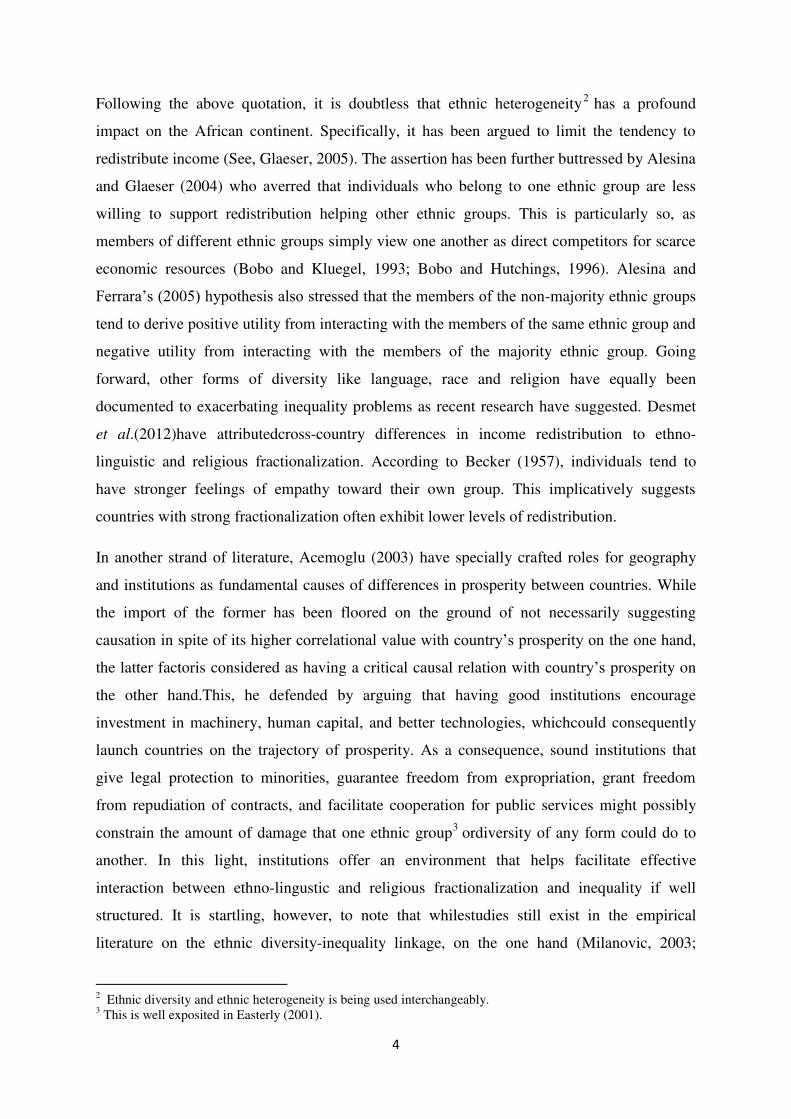
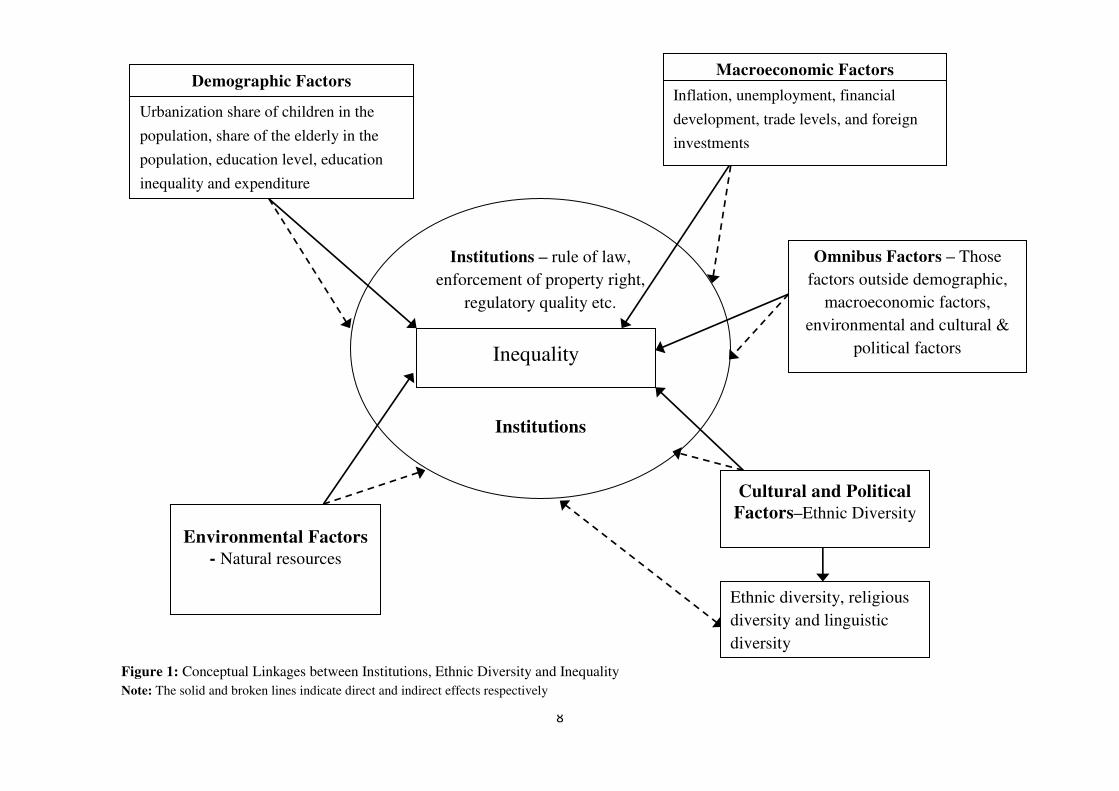
The flowchart below (Figure 1) depicts conceptual linkages underpining ethnic diversity-
inequality and institutional frameworkrelationships in a typical economic system. From the
chart, it can be discerned that various factors seemed to affect inequality but in somewhat
varying degrees. These factors include: demographic factors (e.g. like urbanization share of
children in the population, share of elderly in the population, education levels, education
inequality etc); macroeconomic factors (inflation, unemployment, financial development,
foreign investments etc); environmental factors (natural resources); cultural and political
factors (ethnic diversity, racial diversity, language and religious diversity) as well as omnibus
factors (those of other factors outside the earlier mentioned ones). As indicated by solid and
broken lines, while the impact of the former can directlyimpact on inequality on the one
hand, the effect of the latter can be transmitted indirectlyvia institutions thus justifying the
useful role of institutions as a modulator in the set-up, on the other hand.
Of a particular concern however, is the impact of ethnic diversity–a byproduct of cultural and
political factors- on inequality. As can be observed from the diagram, diversityis capable of
influencing the distribution of income among the various competitors, who are, often time,
divided along racial, ethnic, language and religion dimensions. However, the question of who
7
gets what or how the pie is being shared and distributed appeared to be largely moderated by
the institutional framework in existence. On the diagram, the institutional framework
occupies the center stage where all other originating arrows from other sources are indirectly
impacted. The inequality might end up skewing toward one direction than the other if the
quality of institutions appears to be weak or poor as the case may be. Conversely, a sound
institutional infrastructure generates less resentments among the competing ethnic groups if
fairness and equity are allowed to thrive in such a multiethnic setting.
A reverse situation may equally applyor envisageas indicated by the bi-directional arrows
moving from institutions to ethnic diversity. The simple interpretationis that institutions may
as well exacerbate inequality concerns if such institutions are constituted by individuals who
have stronger empathy toward his/her group only. This sounds plausible as institutions in an
ethnically diverse society comprising of people who may have come from majority or
minority group that are being marginalized. The need to recognize and taking account of this
type of concern underpin the use of an estimator like a system GMM estimator that is
specifically designed to addressing any simultaneity biases and endogeneity issues that are
known to characterize the ordinary least squares (OLS) method.
8
Figure 1: Conceptual Linkages between Institutions, Ethnic Diversity and Inequality
Note: The solid and broken lines indicate direct and indirect effects respectively
Institutions – rule of law,
enforcement of property right,
regulatory quality etc.
Institutions
Inequality
Demographic Factors
Urbanization share of children in the
population, share of the elderly in the
population, education level, education
inequality and expenditure
Macroeconomic Factors
Inflation, unemployment, financial
development, trade levels, and foreign
investments
Environmental Factors
- Natural resources
Omnibus Factors – Those
factors outside demographic,
macroeconomic factors,
environmental and cultural &
political factors
Cultural and Political
Factors–Ethnic Diversity
Ethnic diversity, religious
diversity and linguistic
diversity
9
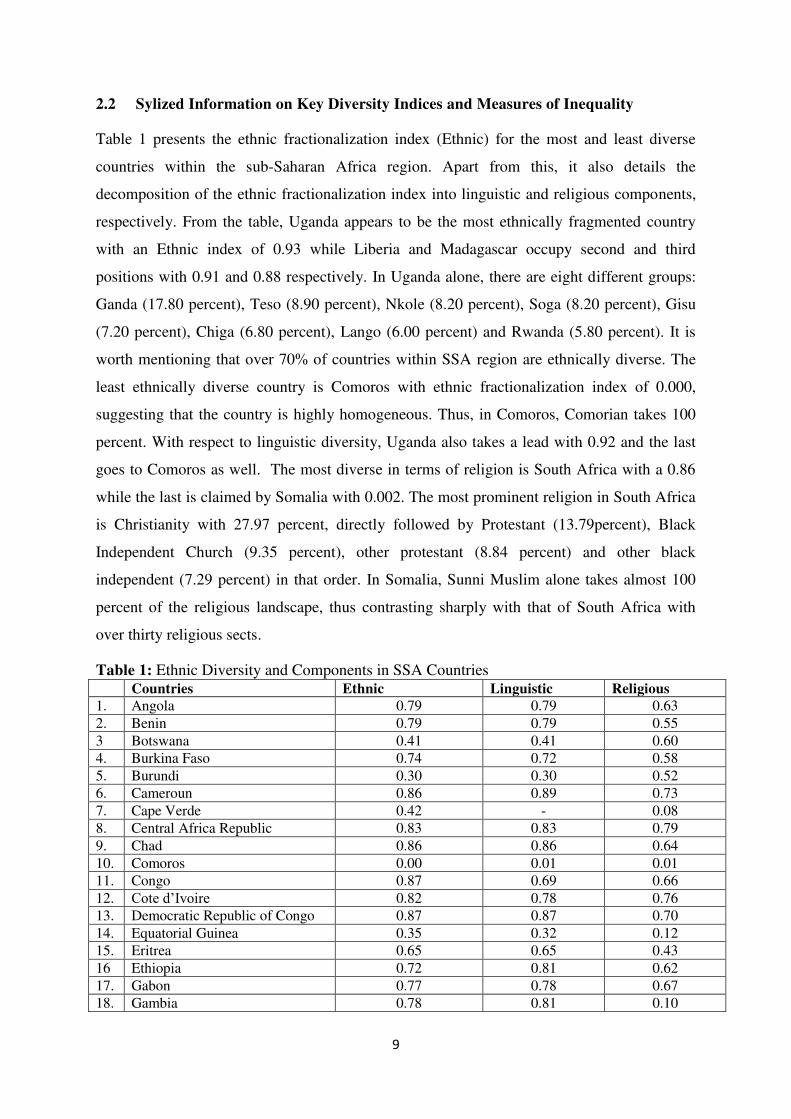
2.2 Sylized Information on Key Diversity Indices and Measures of Inequality
Table 1 presents the ethnic fractionalization index (Ethnic) for the most and least diverse
countries within the sub-Saharan Africa region. Apart from this, it also details the
decomposition of the ethnic fractionalization index into linguistic and religious components,
respectively. From the table, Uganda appears to be the most ethnically fragmented country
with an Ethnic index of 0.93 while Liberia and Madagascar occupy second and third
positions with 0.91 and 0.88 respectively. In Uganda alone, there are eight different groups:
Ganda (17.80 percent), Teso (8.90 percent), Nkole (8.20 percent), Soga (8.20 percent), Gisu
(7.20 percent), Chiga (6.80 percent), Lango (6.00 percent) and Rwanda (5.80 percent). It is
worth mentioning that over 70% of countries within SSA region are ethnically diverse. The
least ethnically diverse country is Comoros with ethnic fractionalization index of 0.000,
suggesting that the country is highly homogeneous. Thus, in Comoros, Comorian takes 100
percent. With respect to linguistic diversity, Uganda also takes a lead with 0.92 and the last
goes to Comoros as well. The most diverse in terms of religion is South Africa with a 0.86
while the last is claimed by Somalia with 0.002. The most prominent religion in South Africa
is Christianity with 27.97 percent, directly followed by Protestant (13.79percent), Black
Independent Church (9.35 percent), other protestant (8.84 percent) and other black
independent (7.29 percent) in that order. In Somalia, Sunni Muslim alone takes almost 100
percent of the religious landscape, thus contrasting sharply with that of South Africa with
over thirty religious sects.
Table 1: Ethnic Diversity and Components in SSA Countries Countries Ethnic Linguistic Religious
1. Angola 0.79 0.79 0.63
2. Benin 0.79 0.79 0.55
3 Botswana 0.41 0.41 0.60
4. Burkina Faso 0.74 0.72 0.58
5. Burundi 0.30 0.30 0.52
6. Cameroun 0.86 0.89 0.73
7. Cape Verde 0.42 - 0.08
8. Central Africa Republic 0.83 0.83 0.79
9. Chad 0.86 0.86 0.64
10. Comoros 0.00 0.01 0.01
11. Congo 0.87 0.69 0.66
12. Cote d’Ivoire 0.82 0.78 0.76
13. Democratic Republic of Congo 0.87 0.87 0.70
14. Equatorial Guinea 0.35 0.32 0.12
15. Eritrea 0.65 0.65 0.43
16 Ethiopia 0.72 0.81 0.62
17. Gabon 0.77 0.78 0.67
18. Gambia 0.78 0.81 0.10
10
19. Ghana 0.67 0.67 0.80
20. Guinea 0.74 0.77 0.26
21. Guinea Bisau 0.81 0.81 0.61
22. Kenya 0.86 0.89 0.78
23. Lesotho 0.26 0.25 0.72
24. Liberia 0.91 0.90 0.49
25. Madagascar 0.88 0.02 0.52
26. Malawi 0.67 0.60 0.82
27. Mali 0.69 0.84 0.18
28. Mozambique 0.69 0.81 0.68
29. Namibia 0.63 0.70 0.66
30. Niger 0.65 0.65 0.20
31. Nigeria 0.85 0.85 0.74
32. Rwanda 0.32 - 0.51
33. Sao Tome and Principe - 0.23 0.19
34. Senegal 0.69 0.70 0.15
35. Seychelles 0.20 0.16 0.23
36. Sierra Leone 0.82 0.76 0.54
37. Somalia 0.81 0.03 0.002
38. South Africa 0.75 0.87 0.86
39. Swaziland 0.06 0.17 0.44
40. Togo 0.71 0.90 0.66
41. Uganda 0.93 0.92 0.63
42. Tanzania 0.74 0.90 0.63
43. Zambia 0.78 0.87 0.74
44. Zimbabwe 0.39 0.45 0.74 Source:EncyclopediaBritannica
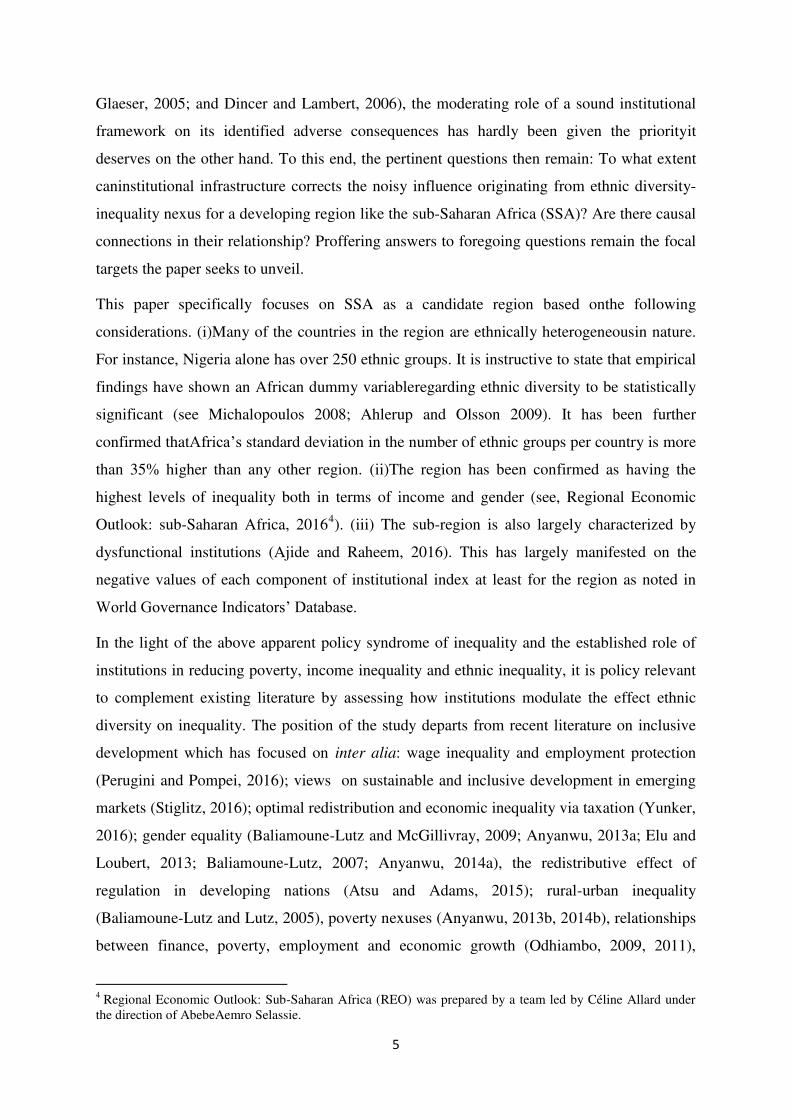
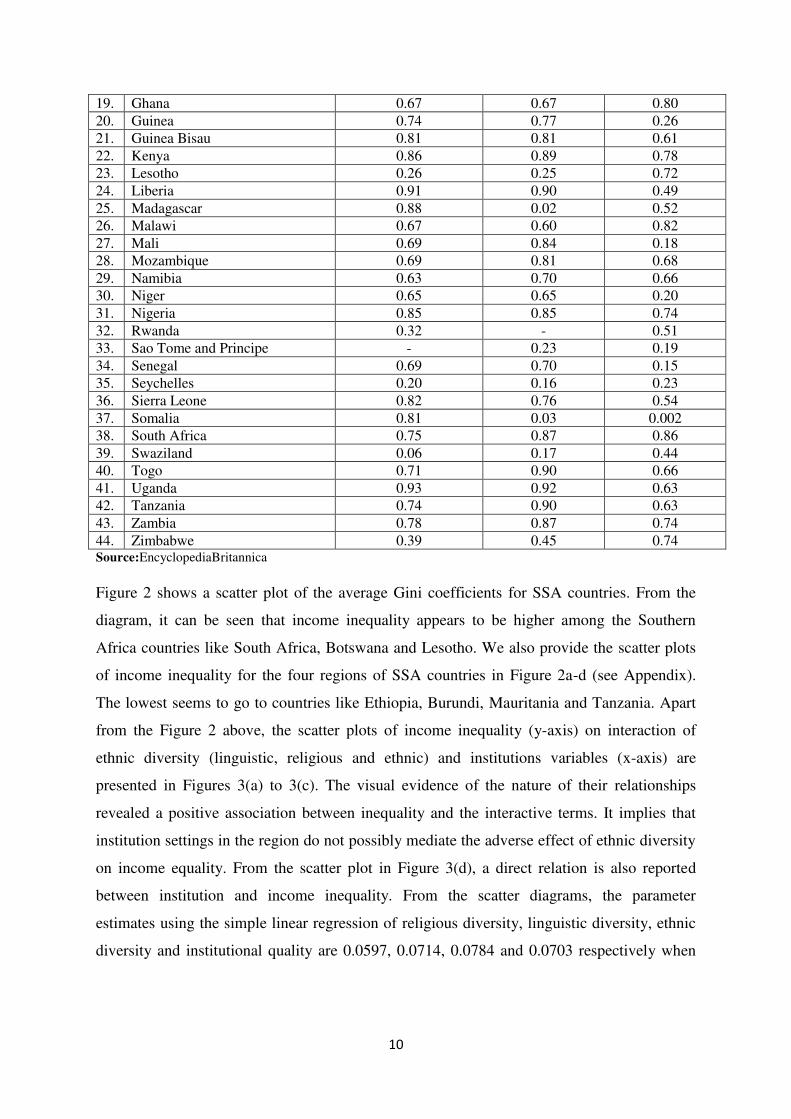
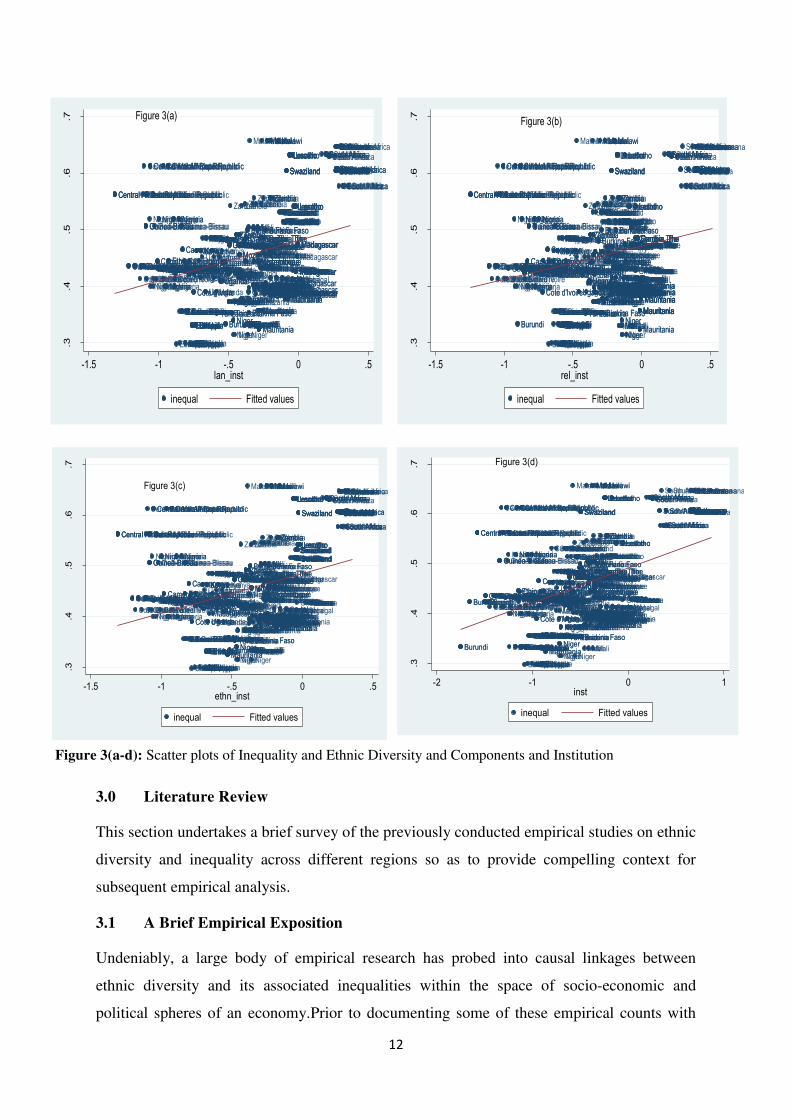
Figure 2 shows a scatter plot of the average Gini coefficients for SSA countries. From the
diagram, it can be seen that income inequality appears to be higher among the Southern
Africa countries like South Africa, Botswana and Lesotho. We also provide the scatter plots
of income inequality for the four regions of SSA countries in Figure 2a-d (see Appendix).
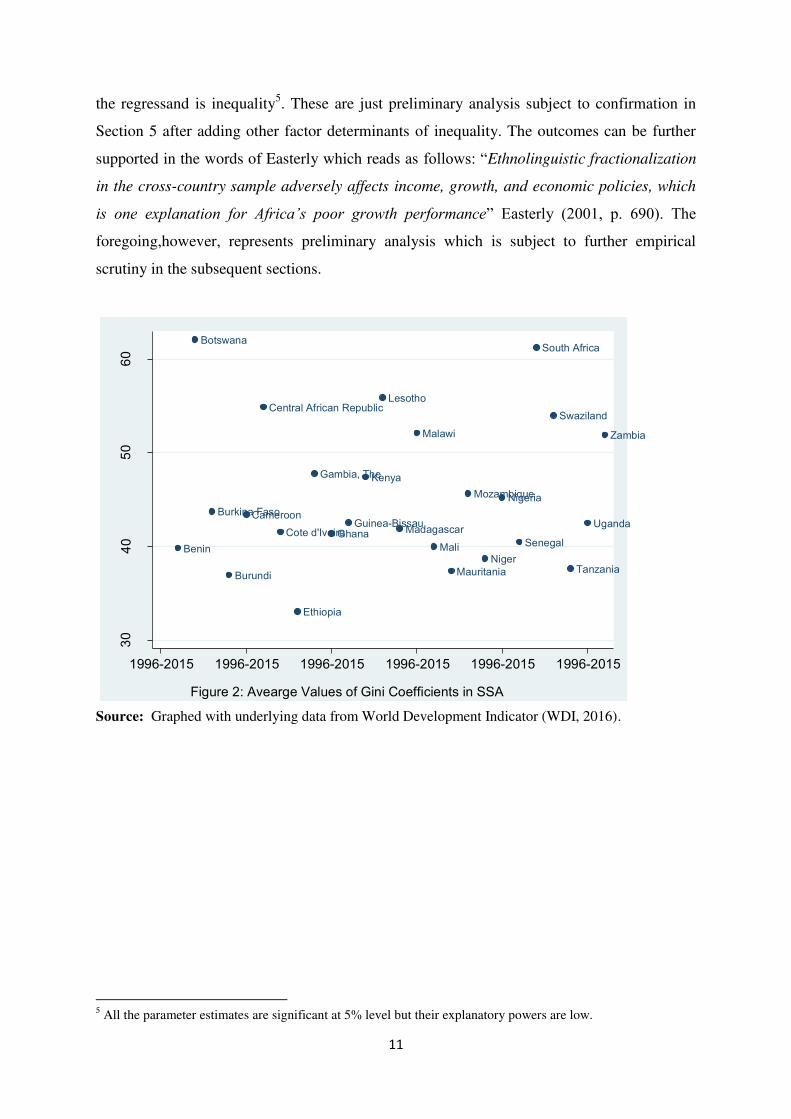
The lowest seems to go to countries like Ethiopia, Burundi, Mauritania and Tanzania. Apart
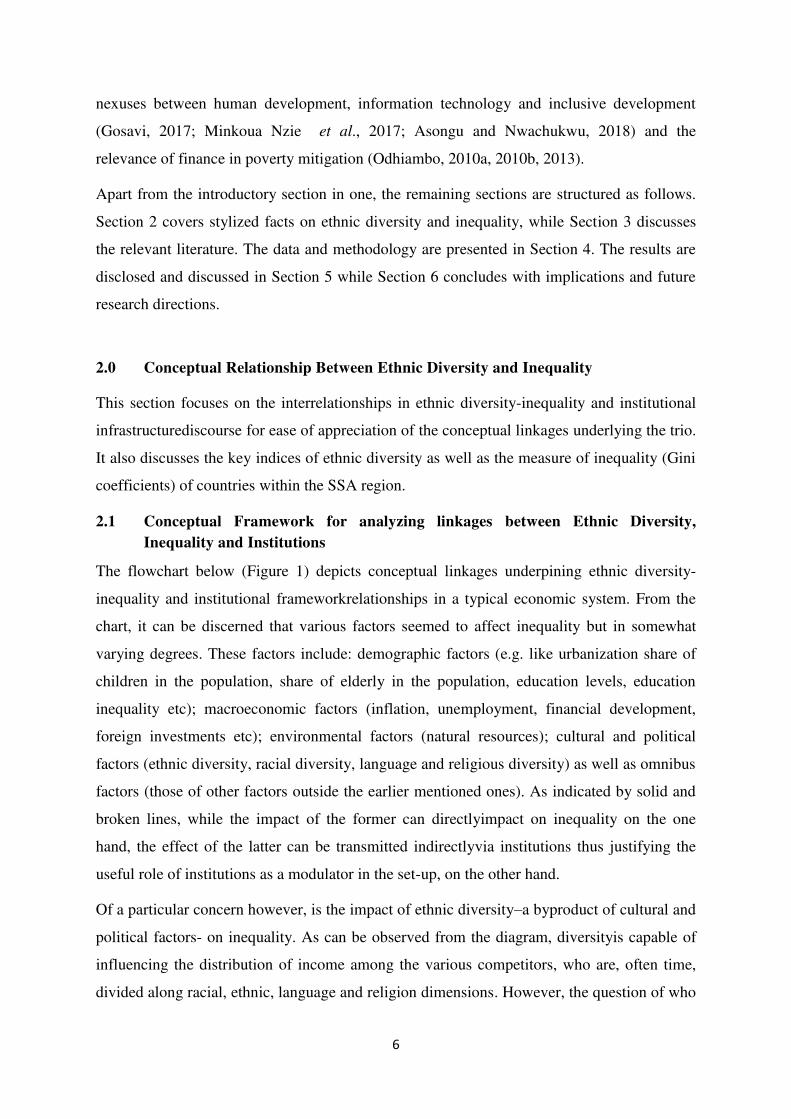
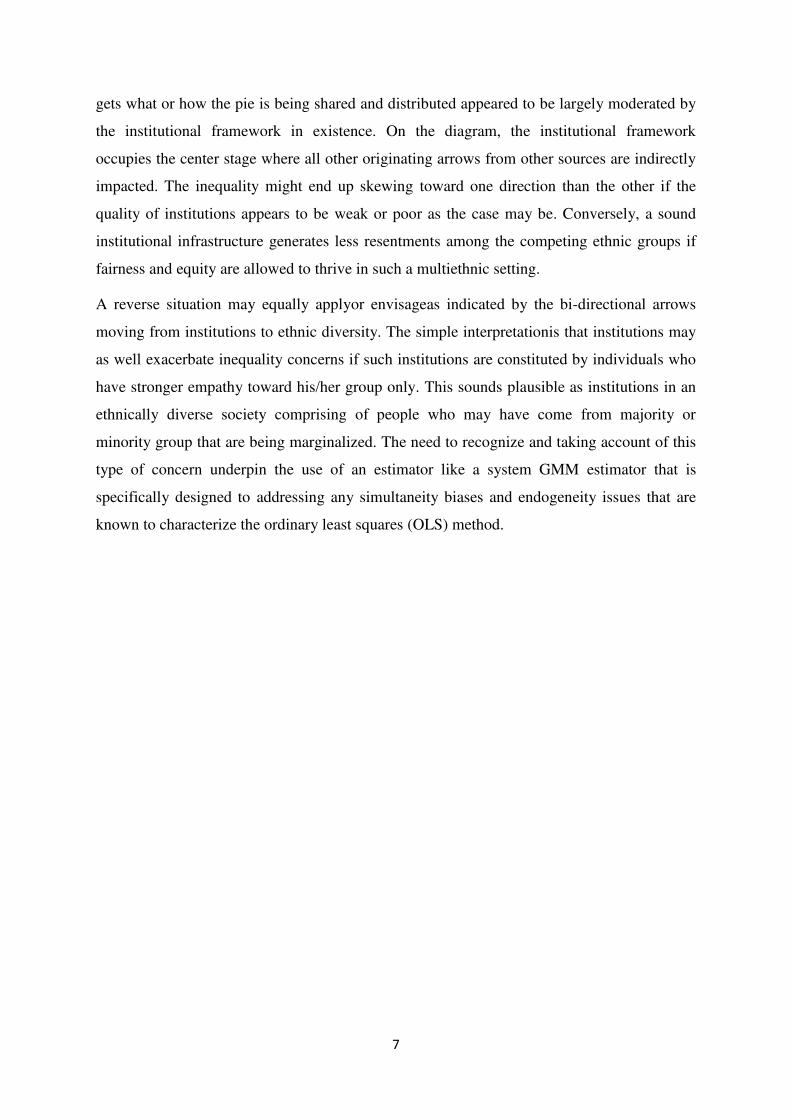
from the Figure 2 above, the scatter plots of income inequality (y-axis) on interaction of
ethnic diversity (linguistic, religious and ethnic) and institutions variables (x-axis) are
presented in Figures 3(a) to 3(c). The visual evidence of the nature of their relationships
revealed a positive association between inequality and the interactive terms. It implies that
institution settings in the region do not possibly mediate the adverse effect of ethnic diversity
on income equality. From the scatter plot in Figure 3(d), a direct relation is also reported
between institution and income inequality. From the scatter diagrams, the parameter
estimates using the simple linear regression of religious diversity, linguistic diversity, ethnic
diversity and institutional quality are 0.0597, 0.0714, 0.0784 and 0.0703 respectively when
11
the regressand is inequality5. These are just preliminary analysis subject to confirmation in
Section 5 after adding other factor determinants of inequality. The outcomes can be further
supported in the words of Easterly which reads as follows: “Ethnolinguistic fractionalization
in the cross-country sample adversely affects income, growth, and economic policies, which
is one explanation for Africa’s poor growth performance” Easterly (2001, p. 690). The
foregoing,however, represents preliminary analysis which is subject to further empirical
scrutiny in the subsequent sections.
Source: Graphed with underlying data from World Development Indicator (WDI, 2016).
5 All the parameter estimates are significant at 5% level but their explanatory powers are low.
Benin
Botswana
Burkina Faso
Burundi
Cameroon
Central African Republic
Cote d'Ivoire
Ethiopia
Gambia, The
GhanaGuinea-Bissau
Kenya
Lesotho
Madagascar
Malawi
Mali
Mauritania
Mozambique
Niger
Nigeria
Senegal
South Africa
Swaziland
Tanzania
Uganda
Zambia
30
40
50
60
1996-2015 1996-2015 1996-2015 1996-2015 1996-2015 1996-2015
Figure 2: Avearge Values of Gini Coefficients in SSA
12
Figure 3(a-d): Scatter plots of Inequality and Ethnic Diversity and Components and Institution
3.0 Literature Review
This section undertakes a brief survey of the previously conducted empirical studies on ethnic
diversity and inequality across different regions so as to provide compelling context for
subsequent empirical analysis.
3.1 A Brief Empirical Exposition
Undeniably, a large body of empirical research has probed into causal linkages between
ethnic diversity and its associated inequalities within the space of socio-economic and
political spheres of an economy.Prior to documenting some of these empirical counts with
BeninBeninBeninBeninBeninBeninBeninBeninBeninBenin BeninBeninBeninBeninBenin
BeninBeninBeninBeninBenin
BotswanaBotswanaBotswanaBotswanaBotswanaBotswana
BotswanaBotswanaBotswanaBotswanaBotswanaBotswanaBotswana
BotswanaBotswanaBotswanaBotswanaBotswanaBotswanaBotswana
Burkina FasoBurkina Faso
Burkina FasoBurkina FasoBurkina FasoBurkina FasoBurkina Faso
Burkina FasoBurkina FasoBurkina FasoBurkina FasoBurkina FasoBurkina Faso
Burkina FasoBurkina FasoBurkina FasoBurkina FasoBurkina Faso
Burkina FasoBurkina Faso
BurundiBurundi
BurundiBurundiBurundiBurundiBurundiBurundiBurundiBurundi
BurundiBurundiBurundiBurundiBurundiBurundiBurundiBurundiBurundiBurundi
CameroonCameroonCameroonCameroonCameroon
CameroonCameroonCameroonCameroonCameroonCameroonCameroonCameroonCameroonCameroonCameroonCameroonCameroon
CameroonCameroon
Central African RepublicCentral African RepublicCentral African RepublicCentral African RepublicCentral African RepublicCentral African RepublicCentral African Republic
Central African RepublicCentral African RepublicCentral African RepublicCentral African RepublicCentral African Republic
Central African RepublicCentral African RepublicCentral African RepublicCentral African RepublicCentral African RepublicCentral African RepublicCentral African RepublicCentral African Republic
Cote d'IvoireCote d'IvoireCote d'IvoireCote d'IvoireCote d'IvoireCote d'Ivoire
Cote d'IvoireCote d'IvoireCote d'IvoireCote d'IvoireCote d'IvoireCote d'IvoireCote d'IvoireCote d'IvoireCote d'IvoireCote d'IvoireCote d'IvoireCote d'IvoireCote d'IvoireCote d'Ivoire
EthiopiaEthiopia Ethiopia
EthiopiaEthiopiaEthiopiaEthiopiaEthiopiaEthiopiaEthiopiaEthiopiaEthiopiaEthiopiaEthiopia
EthiopiaEthiopiaEthiopiaEthiopiaEthiopiaEthiopia
Gambia, TheGambia, TheGambia, TheGambia, TheGambia, TheGambia, TheGambia, TheGambia, TheGambia, TheGambia, TheGambia, TheGambia, TheGambia, TheGambia, TheGambia, TheGambia, TheGambia, TheGambia, TheGambia, TheGambia, The
GhanaGhanaGhanaGhanaGhanaGhanaGhanaGhanaGhana
GhanaGhanaGhanaGhanaGhanaGhanaGhanaGhanaGhanaGhanaGhanaGuinea-BissauGuinea-BissauGuinea-BissauGuinea-Bissau Guinea-BissauGuinea-Bissau
Guinea-BissauGuinea-BissauGuinea-BissauGuinea-BissauGuinea-BissauGuinea-BissauGuinea-BissauGuinea-Bissau
Guinea-BissauGuinea-BissauGuinea-BissauGuinea-BissauGuinea-BissauGuinea-Bissau
Kenya
KenyaKenyaKenyaKenyaKenyaKenyaKenyaKenya
KenyaKenyaKenyaKenyaKenyaKenyaKenyaKenyaKenyaKenyaKenya
LesothoLesothoLesothoLesothoLesothoLesotho
LesothoLesothoLesothoLesothoLesothoLesothoLesothoLesotho
LesothoLesothoLesothoLesothoLesothoLesotho
Madagascar
MadagascarMadagascarMadagascarMadagascar
MadagascarMadagascarMadagascarMadagascar
MadagascarMadagascarMadagascarMadagascarMadagascarMadagascarMadagascar
MadagascarMadagascarMadagascarMadagascar
MalawiMalawiMalawiMalawiMalawiMalawiMalawiMalawi
MalawiMalawiMalawiMalawiMalawiMalawi
MalawiMalawiMalawiMalawiMalawiMalawi
MaliMaliMaliMaliMali
Mali MaliMaliMaliMaliMaliMaliMali
MaliMaliMaliMaliMaliMaliMali
MauritaniaMauritaniaMauritaniaMauritaniaMauritaniaMauritaniaMauritaniaMauritania
MauritaniaMauritaniaMauritaniaMauritania
MauritaniaMauritaniaMauritaniaMauritaniaMauritaniaMauritania
MauritaniaMauritania
MozambiqueMozambiqueMozambiqueMozambiqueMozambiqueMozambique
MozambiqueMozambiqueMozambiqueMozambiqueMozambiqueMozambiqueMozambiqueMozambiqueMozambiqueMozambiqueMozambiqueMozambiqueMozambiqueMozambique
NigerNigerNigerNiger NigerNigerNigerNigerNiger
NigerNiger
NigerNigerNigerNiger
NigerNigerNiger
NigerNiger
NigeriaNigeriaNigeriaNigeriaNigeriaNigeriaNigeria
NigeriaNigeriaNigeriaNigeriaNigeriaNigeria
NigeriaNigeriaNigeriaNigeriaNigeriaNigeriaNigeriaSenegalSenegalSenegalSenegalSenegalSenegalSenegalSenegalSenegal
SenegalSenegalSenegalSenegalSenegalSenegalSenegalSenegalSenegalSenegalSenegal
South AfricaSouth AfricaSouth AfricaSouth Africa
South AfricaSouth AfricaSouth AfricaSouth AfricaSouth AfricaSouth Africa
South AfricaSouth AfricaSouth AfricaSouth AfricaSouth AfricaSouth AfricaSouth AfricaSouth AfricaSouth AfricaSouth Africa
SwazilandSwazilandSwazilandSwaziland
SwazilandSwazilandSwazilandSwazilandSwazilandSwazilandSwazilandSwazilandSwazilandSwazilandSwazilandSwazilandSwazilandSwazilandSwazilandSwaziland
TanzaniaTanzaniaTanzaniaTanzania
TanzaniaTanzaniaTanzaniaTanzaniaTanzaniaTanzaniaTanzania
TanzaniaTanzaniaTanzaniaTanzania
TanzaniaTanzaniaTanzaniaTanzaniaTanzaniaUgandaUgandaUganda
UgandaUgandaUganda
UgandaUgandaUganda
UgandaUgandaUgandaUgandaUgandaUgandaUganda
UgandaUgandaUgandaUganda
ZambiaZambiaZambiaZambiaZambiaZambia
ZambiaZambia
ZambiaZambiaZambiaZambiaZambiaZambiaZambiaZambiaZambiaZambiaZambiaZambia
Figure 3(a)
.3.4
.5.6
.7
-1.5 -1 -.5 0 .5lan_inst
inequal Fitted values
BeninBeninBeninBeninBeninBeninBeninBeninBeninBeninBeninBeninBeninBeninBenin
BeninBeninBeninBeninBenin
BotswanaBotswanaBotswanaBotswanaBotswanaBotswana
BotswanaBotswanaBotswanaBotswanaBotswanaBotswanaBotswana
BotswanaBotswanaBotswanaBotswanaBotswanaBotswanaBotswana
Burkina FasoBurkina Faso
Burkina FasoBurkina FasoBurkina FasoBurkina FasoBurkina Faso
Burkina FasoBurkina FasoBurkina FasoBurkina FasoBurkina FasoBurkina Faso
Burkina FasoBurkina FasoBurkina FasoBurkina FasoBurkina Faso
Burkina FasoBurkina Faso
BurundiBurundi
BurundiBurundiBurundiBurundiBurundiBurundiBurundi Burundi
BurundiBurundiBurundiBurundiBurundiBurundiBurundiBurundiBurundiBurundi
CameroonCameroonCameroonCameroonCameroon
CameroonCameroonCameroonCameroonCameroonCameroonCameroonCameroonCameroonCameroonCameroonCameroonCameroon
CameroonCameroon
Central African RepublicCentral African RepublicCentral African RepublicCentral African RepublicCentral African RepublicCentral African RepublicCentral African Republic
Central African RepublicCentral African RepublicCentral African RepublicCentral African RepublicCentral African Republic
Central African RepublicCentral African RepublicCentral African RepublicCentral African RepublicCentral African RepublicCentral African RepublicCentral African RepublicCentral African Republic
Cote d'IvoireCote d'IvoireCote d'IvoireCote d'IvoireCote d'IvoireCote d'Ivoire
Cote d'IvoireCote d'IvoireCote d'IvoireCote d'IvoireCote d'IvoireCote d'IvoireCote d'IvoireCote d'IvoireCote d'IvoireCote d'IvoireCote d'IvoireCote d'IvoireCote d'IvoireCote d'Ivoire
EthiopiaEthiopiaEthiopia
EthiopiaEthiopiaEthiopiaEthiopiaEthiopiaEthiopiaEthiopiaEthiopiaEthiopiaEthiopiaEthiopia
EthiopiaEthiopiaEthiopiaEthiopiaEthiopiaEthiopia
Gambia, TheGambia, TheGambia, TheGambia, TheGambia, TheGambia, TheGambia, TheGambia, TheGambia, TheGambia, TheGambia, TheGambia, TheGambia, TheGambia, TheGambia, TheGambia, TheGambia, TheGambia, TheGambia, TheGambia, The
GhanaGhanaGhanaGhanaGhanaGhanaGhanaGhanaGhana
GhanaGhanaGhanaGhanaGhanaGhanaGhanaGhanaGhanaGhanaGhanaGuinea-BissauGuinea-BissauGuinea-BissauGuinea-BissauGuinea-BissauGuinea-Bissau
Guinea-BissauGuinea-BissauGuinea-BissauGuinea-BissauGuinea-BissauGuinea-BissauGuinea-BissauGuinea-Bissau
Guinea-BissauGuinea-BissauGuinea-BissauGuinea-BissauGuinea-BissauGuinea-Bissau
Kenya
KenyaKenyaKenyaKenyaKenyaKenyaKenyaKenya
KenyaKenyaKenyaKenyaKenyaKenyaKenyaKenyaKenyaKenyaKenya
LesothoLesothoLesothoLesothoLesothoLesotho
LesothoLesothoLesothoLesothoLesothoLesothoLesothoLesotho
LesothoLesothoLesothoLesothoLesothoLesotho
Madagascar
MadagascarMadagascarMadagascarMadagascar
MadagascarMadagascarMadagascarMadagascar
MadagascarMadagascarMadagascarMadagascarMadagascarMadagascarMadagascar
MadagascarMadagascarMadagascarMadagascar
MalawiMalawiMalawiMalawiMalawiMalawiMalawiMalawi
MalawiMalawiMalawiMalawiMalawiMalawi
MalawiMalawiMalawiMalawiMalawiMalawi
MaliMaliMaliMaliMali
MaliMaliMaliMaliMaliMaliMaliMali
MaliMaliMaliMaliMaliMaliMali
MauritaniaMauritaniaMauritaniaMauritaniaMauritaniaMauritaniaMauritaniaMauritaniaMauritaniaMauritaniaMauritaniaMauritania
MauritaniaMauritaniaMauritaniaMauritaniaMauritaniaMauritania
MauritaniaMauritania
MozambiqueMozambiqueMozambiqueMozambiqueMozambiqueMozambique
MozambiqueMozambiqueMozambiqueMozambiqueMozambiqueMozambiqueMozambiqueMozambiqueMozambiqueMozambiqueMozambiqueMozambiqueMozambiqueMozambique
NigerNigerNigerNigerNigerNigerNigerNigerNiger
NigerNiger
NigerNigerNigerNiger
NigerNigerNiger
NigerNiger
NigeriaNigeriaNigeriaNigeriaNigeriaNigeriaNigeria
NigeriaNigeriaNigeriaNigeriaNigeriaNigeria
NigeriaNigeriaNigeriaNigeriaNigeriaNigeriaNigeriaSenegalSenegalSenegalSenegalSenegalSenegalSenegalSenegalSenegal
SenegalSenegalSenegalSenegalSenegalSenegalSenegalSenegalSenegalSenegalSenegal
South AfricaSouth AfricaSouth AfricaSouth Africa
South AfricaSouth AfricaSouth AfricaSouth AfricaSouth AfricaSouth Africa
South AfricaSouth AfricaSouth AfricaSouth AfricaSouth AfricaSouth AfricaSouth AfricaSouth AfricaSouth AfricaSouth Africa
SwazilandSwazilandSwazilandSwaziland
SwazilandSwazilandSwazilandSwazilandSwazilandSwazilandSwazilandSwazilandSwazilandSwazilandSwazilandSwazilandSwazilandSwazilandSwazilandSwaziland
TanzaniaTanzaniaTanzaniaTanzania
TanzaniaTanzaniaTanzaniaTanzaniaTanzaniaTanzaniaTanzania
TanzaniaTanzaniaTanzaniaTanzania
TanzaniaTanzaniaTanzaniaTanzaniaTanzaniaUgandaUgandaUganda
UgandaUgandaUganda
UgandaUgandaUganda
UgandaUgandaUgandaUgandaUgandaUgandaUganda
UgandaUgandaUgandaUganda
ZambiaZambiaZambiaZambiaZambiaZambia
ZambiaZambia
ZambiaZambiaZambiaZambiaZambiaZambiaZambiaZambiaZambiaZambiaZambiaZambia
Figure 3(b)
.3.4
.5.6
.7
-1.5 -1 -.5 0 .5rel_inst
inequal Fitted values
BeninBeninBeninBeninBeninBeninBeninBeninBeninBenin BeninBeninBeninBeninBenin
BeninBeninBeninBeninBenin
BotswanaBotswanaBotswanaBotswanaBotswanaBotswana
BotswanaBotswanaBotswanaBotswanaBotswanaBotswanaBotswana
BotswanaBotswanaBotswanaBotswanaBotswanaBotswanaBotswana
Burkina FasoBurkina Faso
Burkina FasoBurkina FasoBurkina FasoBurkina FasoBurkina Faso
Burkina FasoBurkina FasoBurkina FasoBurkina FasoBurkina FasoBurkina Faso
Burkina FasoBurkina FasoBurkina FasoBurkina FasoBurkina Faso
Burkina FasoBurkina Faso
BurundiBurundi
BurundiBurundiBurundiBurundiBurundiBurundiBurundiBurundi
BurundiBurundiBurundiBurundiBurundiBurundiBurundiBurundiBurundiBurundi
CameroonCameroonCameroonCameroonCameroon
CameroonCameroonCameroonCameroonCameroonCameroonCameroonCameroonCameroonCameroonCameroonCameroonCameroon
CameroonCameroon
Central African RepublicCentral African RepublicCentral African RepublicCentral African RepublicCentral African RepublicCentral African RepublicCentral African Republic
Central African RepublicCentral African RepublicCentral African RepublicCentral African RepublicCentral African Republic
Central African RepublicCentral African RepublicCentral African RepublicCentral African RepublicCentral African RepublicCentral African RepublicCentral African RepublicCentral African Republic
Cote d'IvoireCote d'IvoireCote d'IvoireCote d'IvoireCote d'IvoireCote d'Ivoire
Cote d'IvoireCote d'IvoireCote d'IvoireCote d'IvoireCote d'IvoireCote d'IvoireCote d'IvoireCote d'IvoireCote d'IvoireCote d'IvoireCote d'IvoireCote d'IvoireCote d'IvoireCote d'Ivoire
EthiopiaEthiopia Ethiopia
EthiopiaEthiopiaEthiopiaEthiopiaEthiopiaEthiopiaEthiopiaEthiopiaEthiopiaEthiopiaEthiopia
EthiopiaEthiopiaEthiopiaEthiopiaEthiopiaEthiopia
Gambia, TheGambia, TheGambia, TheGambia, TheGambia, TheGambia, TheGambia, TheGambia, TheGambia, TheGambia, TheGambia, TheGambia, TheGambia, TheGambia, TheGambia, TheGambia, TheGambia, TheGambia, TheGambia, TheGambia, The
GhanaGhanaGhanaGhanaGhanaGhanaGhanaGhanaGhana
GhanaGhanaGhanaGhanaGhanaGhanaGhanaGhanaGhanaGhanaGhanaGuinea-BissauGuinea-BissauGuinea-BissauGuinea-Bissau Guinea-BissauGuinea-Bissau
Guinea-BissauGuinea-BissauGuinea-BissauGuinea-BissauGuinea-BissauGuinea-BissauGuinea-BissauGuinea-Bissau
Guinea-BissauGuinea-BissauGuinea-BissauGuinea-BissauGuinea-BissauGuinea-Bissau
Kenya
KenyaKenyaKenyaKenyaKenyaKenyaKenyaKenya
KenyaKenyaKenyaKenyaKenyaKenyaKenyaKenyaKenyaKenyaKenya
LesothoLesothoLesothoLesothoLesothoLesotho
LesothoLesothoLesothoLesothoLesothoLesothoLesothoLesotho
LesothoLesothoLesothoLesothoLesothoLesotho
Madagascar
MadagascarMadagascarMadagascarMadagascar
MadagascarMadagascarMadagascarMadagascar
MadagascarMadagascarMadagascarMadagascarMadagascarMadagascarMadagascar
MadagascarMadagascarMadagascarMadagascar
MalawiMalawiMalawiMalawiMalawiMalawiMalawiMalawi
MalawiMalawiMalawiMalawiMalawiMalawi
MalawiMalawiMalawiMalawiMalawiMalawi
MaliMaliMaliMaliMali
MaliMaliMaliMaliMaliMaliMaliMali
MaliMaliMaliMaliMaliMaliMali
MauritaniaMauritaniaMauritaniaMauritaniaMauritaniaMauritaniaMauritaniaMauritania
MauritaniaMauritaniaMauritaniaMauritania
MauritaniaMauritaniaMauritaniaMauritaniaMauritaniaMauritania
MauritaniaMauritania
MozambiqueMozambiqueMozambiqueMozambiqueMozambiqueMozambique
MozambiqueMozambiqueMozambiqueMozambiqueMozambiqueMozambiqueMozambiqueMozambiqueMozambiqueMozambiqueMozambiqueMozambiqueMozambiqueMozambique
NigerNigerNigerNiger NigerNigerNigerNigerNiger
NigerNiger
NigerNigerNigerNiger
NigerNigerNiger
NigerNiger
NigeriaNigeriaNigeriaNigeriaNigeriaNigeriaNigeria
NigeriaNigeriaNigeriaNigeriaNigeriaNigeria
NigeriaNigeriaNigeriaNigeriaNigeriaNigeriaNigeriaSenegalSenegalSenegalSenegalSenegalSenegalSenegalSenegalSenegal
SenegalSenegalSenegalSenegalSenegalSenegalSenegalSenegalSenegalSenegalSenegal
South AfricaSouth AfricaSouth AfricaSouth Africa
South AfricaSouth AfricaSouth AfricaSouth AfricaSouth AfricaSouth Africa
South AfricaSouth AfricaSouth AfricaSouth AfricaSouth AfricaSouth AfricaSouth AfricaSouth AfricaSouth AfricaSouth Africa
SwazilandSwazilandSwazilandSwaziland
SwazilandSwazilandSwazilandSwazilandSwazilandSwazilandSwazilandSwazilandSwazilandSwazilandSwazilandSwazilandSwazilandSwazilandSwazilandSwaziland
TanzaniaTanzaniaTanzaniaTanzania
TanzaniaTanzaniaTanzaniaTanzaniaTanzaniaTanzaniaTanzania
TanzaniaTanzaniaTanzaniaTanzania
TanzaniaTanzaniaTanzaniaTanzaniaTanzaniaUgandaUgandaUganda
UgandaUgandaUganda
UgandaUgandaUganda
UgandaUgandaUgandaUgandaUgandaUgandaUganda
UgandaUgandaUgandaUganda
ZambiaZambiaZambiaZambiaZambiaZambia
ZambiaZambia
ZambiaZambiaZambiaZambiaZambiaZambiaZambiaZambiaZambiaZambiaZambiaZambia
Figure 3(c)
.3.4
.5.6
.7
-1.5 -1 -.5 0 .5ethn_inst
inequal Fitted values
BeninBeninBeninBeninBeninBeninBeninBeninBeninBeninBeninBeninBeninBeninBenin
BeninBeninBeninBeninBenin
BotswanaBotswanaBotswanaBotswanaBotswanaBotswana
BotswanaBotswanaBotswanaBotswanaBotswanaBotswanaBotswana
BotswanaBotswanaBotswanaBotswanaBotswanaBotswanaBotswana
Burkina FasoBurkina Faso
Burkina FasoBurkina FasoBurkina FasoBurkina FasoBurkina Faso
Burkina FasoBurkina FasoBurkina FasoBurkina FasoBurkina FasoBurkina Faso
Burkina FasoBurkina FasoBurkina FasoBurkina FasoBurkina Faso
Burkina FasoBurkina Faso
BurundiBurundi
BurundiBurundiBurundiBurundiBurundiBurundiBurundi Burundi
BurundiBurundiBurundiBurundiBurundiBurundiBurundiBurundiBurundiBurundi
CameroonCameroonCameroonCameroonCameroon
CameroonCameroonCameroonCameroonCameroonCameroonCameroonCameroonCameroonCameroonCameroonCameroonCameroon
CameroonCameroon
Central African RepublicCentral African RepublicCentral African RepublicCentral African RepublicCentral African RepublicCentral African RepublicCentral African Republic
Central African RepublicCentral African RepublicCentral African RepublicCentral African RepublicCentral African Republic
Central African RepublicCentral African RepublicCentral African RepublicCentral African RepublicCentral African RepublicCentral African RepublicCentral African RepublicCentral African Republic
Cote d'IvoireCote d'IvoireCote d'IvoireCote d'IvoireCote d'IvoireCote d'Ivoire
Cote d'IvoireCote d'IvoireCote d'IvoireCote d'IvoireCote d'IvoireCote d'IvoireCote d'IvoireCote d'IvoireCote d'IvoireCote d'IvoireCote d'IvoireCote d'IvoireCote d'IvoireCote d'Ivoire
EthiopiaEthiopiaEthiopia
EthiopiaEthiopiaEthiopiaEthiopiaEthiopiaEthiopiaEthiopiaEthiopiaEthiopiaEthiopiaEthiopia
EthiopiaEthiopiaEthiopiaEthiopiaEthiopiaEthiopia
Gambia, TheGambia, TheGambia, TheGambia, TheGambia, TheGambia, TheGambia, TheGambia, TheGambia, TheGambia, TheGambia, TheGambia, TheGambia, TheGambia, TheGambia, TheGambia, TheGambia, TheGambia, TheGambia, TheGambia, The
GhanaGhanaGhanaGhanaGhanaGhanaGhanaGhanaGhana
GhanaGhanaGhanaGhanaGhanaGhanaGhanaGhanaGhanaGhanaGhanaGuinea-BissauGuinea-BissauGuinea-BissauGuinea-Bissau Guinea-BissauGuinea-Bissau
Guinea-BissauGuinea-BissauGuinea-BissauGuinea-BissauGuinea-BissauGuinea-BissauGuinea-BissauGuinea-Bissau
Guinea-BissauGuinea-BissauGuinea-BissauGuinea-BissauGuinea-BissauGuinea-Bissau
Kenya
KenyaKenyaKenyaKenyaKenyaKenyaKenyaKenya
KenyaKenyaKenyaKenyaKenyaKenyaKenyaKenyaKenyaKenyaKenya
LesothoLesothoLesothoLesothoLesothoLesotho
LesothoLesothoLesothoLesothoLesothoLesothoLesothoLesotho
LesothoLesothoLesothoLesothoLesothoLesotho
Madagascar
MadagascarMadagascarMadagascarMadagascar
MadagascarMadagascarMadagascarMadagascar
MadagascarMadagascarMadagascarMadagascarMadagascarMadagascarMadagascar
MadagascarMadagascarMadagascarMadagascar
MalawiMalawiMalawiMalawiMalawiMalawiMalawiMalawi
MalawiMalawiMalawiMalawiMalawiMalawi
MalawiMalawiMalawiMalawiMalawiMalawi
MaliMaliMaliMaliMali
MaliMaliMaliMaliMaliMaliMaliMali
MaliMaliMaliMaliMaliMaliMali
MauritaniaMauritaniaMauritaniaMauritaniaMauritaniaMauritaniaMauritaniaMauritania
MauritaniaMauritaniaMauritaniaMauritania
MauritaniaMauritaniaMauritaniaMauritaniaMauritaniaMauritania
MauritaniaMauritania
MozambiqueMozambiqueMozambiqueMozambiqueMozambiqueMozambique
MozambiqueMozambiqueMozambiqueMozambiqueMozambiqueMozambiqueMozambiqueMozambiqueMozambiqueMozambiqueMozambiqueMozambiqueMozambiqueMozambique
NigerNigerNigerNiger NigerNigerNigerNigerNiger
NigerNiger
NigerNigerNigerNiger
NigerNigerNiger
NigerNiger
NigeriaNigeriaNigeriaNigeriaNigeriaNigeriaNigeria
NigeriaNigeriaNigeriaNigeriaNigeriaNigeria
NigeriaNigeriaNigeriaNigeriaNigeriaNigeriaNigeriaSenegalSenegalSenegalSenegalSenegalSenegalSenegalSenegalSenegal
SenegalSenegalSenegalSenegalSenegalSenegalSenegalSenegalSenegalSenegalSenegal
South AfricaSouth AfricaSouth AfricaSouth Africa
South AfricaSouth AfricaSouth AfricaSouth AfricaSouth AfricaSouth Africa
South AfricaSouth AfricaSouth AfricaSouth AfricaSouth AfricaSouth AfricaSouth AfricaSouth AfricaSouth AfricaSouth Africa
SwazilandSwazilandSwazilandSwaziland
SwazilandSwazilandSwazilandSwazilandSwazilandSwazilandSwazilandSwazilandSwazilandSwazilandSwazilandSwazilandSwazilandSwazilandSwazilandSwaziland
TanzaniaTanzaniaTanzaniaTanzania
TanzaniaTanzaniaTanzaniaTanzaniaTanzaniaTanzaniaTanzania
TanzaniaTanzaniaTanzaniaTanzania
TanzaniaTanzaniaTanzaniaTanzaniaTanzaniaUgandaUgandaUganda
UgandaUgandaUganda
UgandaUgandaUganda
UgandaUgandaUgandaUgandaUgandaUgandaUganda
UgandaUgandaUgandaUganda
ZambiaZambiaZambiaZambiaZambiaZambia
ZambiaZambia
ZambiaZambiaZambiaZambiaZambiaZambiaZambiaZambiaZambiaZambiaZambiaZambia
Figure 3(d)
.3.4
.5.6
.7
-2 -1 0 1inst
inequal Fitted values
13
respect to ethnic divert-inequality relations, attempt will be made to x-ray the groundwork for
the theoretical arguments into the issue. Gary Becker (1957) was one of the pioneer
researchers who laid out the argument concerning ethnic diversity and inequality around
racial prejudice and discrimination. According to him, if a person has a “taste for
discrimination” he must act as if he were willing to forfeit income in order to be associated
with some persons or groups instead of others. As a means of validating Becker’s analysis, a
substantial body of empirical research has trailed the theoretical conjectures of racial
prejudice in a wide variety of contexts.Such studies like Alesina and La Ferrara (2000, 2002),
Alesina and Glaeser (2004), and Luttmer (2001) have lent credence to the arguments. Using a
model of group participation, Alesina and La Ferrara (2000)found that the members of non-
majority group derive positive utility from interacting with the members of the same group
and negative utility from interactions with members of the majority group. A similar
conclusion was reached by the same authors when they submitted that the level of trust
seemed higher in racially homogeneous communities (see, Alesina & La Ferrara, 2002).
We commerce an overview of the empirical literature with Dincer and Lambert (2006) who
set out to analyze both the direct and indirect effects of ethnic and religious heterogeneity on
income inequality and on welfare programs across US states using a seemingly unrelated
regression (SUR) method.They employed two measures of ethnic diversity,namely the
polarization index (PI) and the fractionalization index (FI) and they assessed the relationship
between ethnic diversity and income inequality as captured by the Gini coefficient. For PI,
they are able to establish a positive and linear relationship between ethnic and religious
heterogeneity and Gini coefficient on the one hand, with a negative and linear relationship
between ethnic and religious heterogeneity and AFDC/TANF6 payments on the other hand.
The results appear to chart a different path with the use of fractionalization index. With FI, an
inverse-U shaped relationship is obtained between ethnic and religious heterogeneity and the
Gini coefficient and a U-shaped relationship between ethnic and religious heterogeneity and
AFDC/TANF payments. Statistically speaking, the ethnicand religious polarization index
explained about 37% of the variation in the Gini coefficient across states in the US (increases
to about 75% when control variables are well accounted for) and close to 10% in
AFDC/TANF (up to 65% when other explanatory variables are included). Similarly, FI
explains almost 40% of the variation in Gini coefficients (about 80% with the inclusion of
other control variables) and almost 20% in AFDC/TANF payments (rises to about 65% when
6 Refers to Aid to the Families with Dependent Children/Temporary Assistance to Needy Families.
14
other conditioning variables are taken into consideration). The outcomes of the follow up
research by Dincer and Hotard (2011) do not significantly differ from the above reported
results. In their study, they explore the relationship between ethnic and religious diversity and
income inequality spanning over a 10-year period for 58 countries. In the final analysis, they
discovered a positive relationship between ethnic and religious polarization and income
inequality and an inverse U-shaped relationship between ethnic and religious fractionalization
and income inequality. They also established that transiting from homogeneous position (that
is, polarization index of zero) with respect to ethnic (religion) to heterogeneous stance
(polarization index of one) would increase the Gini coefficient by almost 6 for ethnic and 3
percentage points for religious fractionalization respectively. Using a pooled ordinary least
squares (OLS), Hotard (2008) tested the relationship between income inequality and ethnic
heterogeneity on a panel of 58 countries.His results showed that ethnic polarization exerts a
positive and significant effect on income inequality, even after controlling for country
characteristics and regional differences. Similar in spirit with the present inquiry were studies
by Easterly (2001) and Madni (2018). Easterly (2001) was able to establish that ethnic
diversity exerts a more adverse effect on economic policy and growth when institutions are
poor. Conversely, in countries with sufficiently good institutions, ethnic diversity does not
seem to lower growth or worsen economic policies. More recently was a study by Madni
(2018) that probed into institutional quality through ethnic diversity, income inequality and
public spending for Pakistan over the period, 1984-2015. Using ARDL approach, he found
out that ethnic diversity and income inequality caused deterioration to institutional structures
of the country at one end, while public spendingimproved the quality on the other end.
In light of the brief expositions, it is apparent that the particular literature that crafts a role for
institutions in ethnic diversity-inequality relation is still at its infancy. It is in recognition of
this fact that the present study draws its strength.
4.0 Methodolgy, Empirical Modelling and Data
4.1 Methodology
The paper employs a panel data analysis since it allows for the control of variables that are
unobservable as well as immensurable. Basically, the panel OLS, fixed effects (FE) and
system generalized method of moments (GMM) estimation methods are adopted in this study.
The panel OLS combines the subscript of time series (t) and cross-sectional unit (i) to
15
accommodate the properties of both time series and cross-section data. This is summarily
given as:
tititi Xy ,
'
,, ;,...,1 Ni Tt ,...,1 (1)
The cross-section dimension such as country is represented by i subscript and the time series
dimension denoted by t subscript. More so, is a scalar; is a row vector 1K ; '
,tiX is the
ith observation on K explanatory variables; ti , is the stochastic term. The one-way error
component panel fixed effect split the error term )( ,ti into two components as:
tititi vu ,,, ;,...,1 Ni Tt ,...,1 (2)
where itu is the unobservable individual specific effect accounting for any individual-specific
effect that is not included in the regression; and ti , is idiosyncratic disturbance varying with
individuals and time (Baltagi, 2008). Using the fixed effects method, ti , denotes fixed
parameters that is estimated; ti , is independent and identically distributed [IID(2,0 v )] (the
normality and heteroskedasticity assumption); and '
,tiX isassumed to be independent of tiv , for
all country (i) and time (t) (endogeneity assumption). In addition, we assume the unobserved
effects vary between countries (i.e. heterogeneous) rather than a random term that
assumesusage ofthe random effects technique. We further used the cross section weights (a
feasible Generalized Least Squares (GLS) specification assuming the presence of cross-
section heteroskedasticity) to correct for cross-section heteroskedasticity and autocorrelation
of idiosyncratic disturbance. The reason for employing the cross section weights is to ensure
that the fixed estimator is efficient and consistent for our analyses as used by earlier studies
such as Hammoris and Kai (2004); Guordon, Maystre and Melo (2006); and Heinrich (2009).
The Hausman test resultisalso computed to confirm the efficiency of the fixed effects
estimator.
We further applied the system GMM method to establish the relationship among our
variables based on five motivational reasons in its use as documented in Asongu and De
Moor (2017). Thesereasons are: (a) The estimation process is a good fit for addressing the
issue of high persistence in the dependent variable. The result of correlation coefficient of
income inequality and its lagged of one value is 0.956 which supersedes the value of the rule
of thumb threshold (0.800) (Tchamyou, 2019a). (b) The process is good for a study that has
16
lower number of years per country (T) than the number of countries (N), thus, our T(20) <
N(26). (c) It is capable of controlling for potential endogeneity in all regressors. (d) The
approach does not eliminate cross-country variation (e) Based on the fourth merit, Bond,
Hoeffler and Tample (2001) suggested the system GMM estimator by Arellano and
Bover(1995) and Blundell and Bond (1998) as a better fit compared to the difference
estimator by Arellano and Bond (1991). The requirements for adopting the approach is based
on the first-two reasons (Tchamyou & Asongu, 2017) while the last three stressed the
associated merits for its adoption (Tchamyou, 2019b).
The study used the forward orthogonal deviations instead of first differences adopted by
Roodman (2009a,b) which is an extension of Arellano and Bover (1995). According to Love
andZicchino (2006) and Baltagi (2008), the estimation method can control for cross-country
dependence and check over identification and control the proliferation of instruments. The
two-step approach is employed in the specification since it controls for heteroskedasticity as
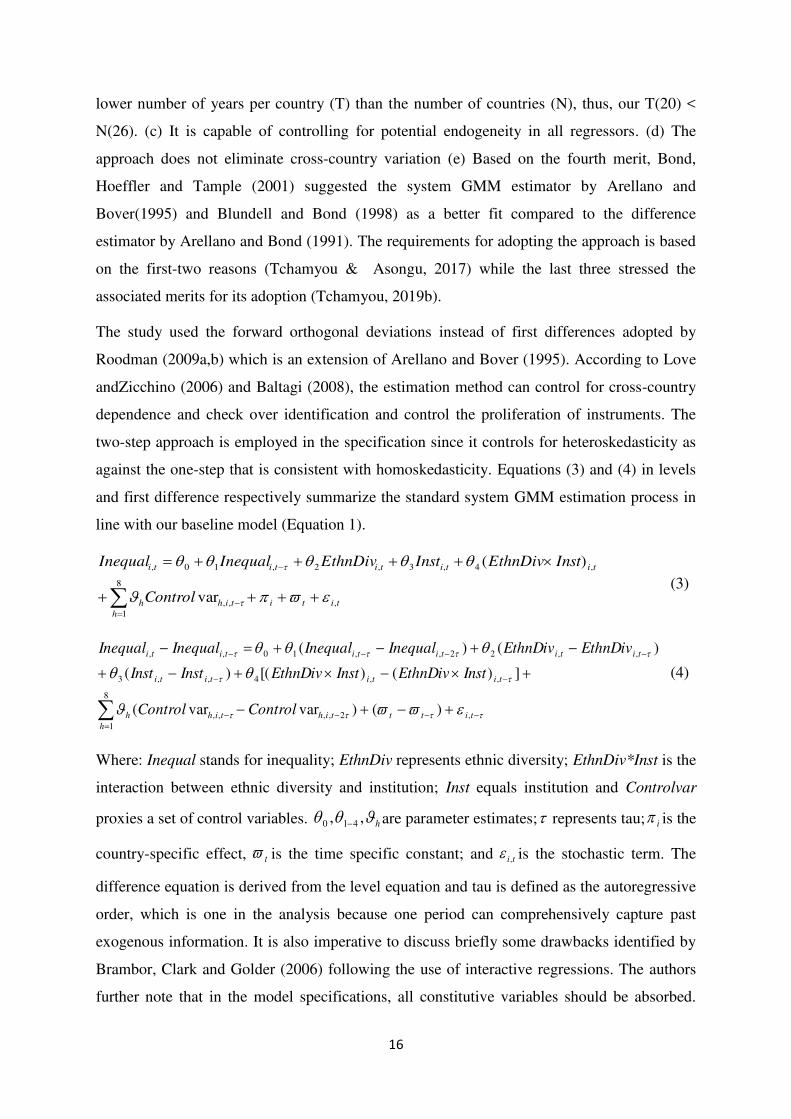
against the one-step that is consistent with homoskedasticity. Equations (3) and (4) in levels
and first difference respectively summarize the standard system GMM estimation process in
line with our baseline model (Equation 1).
tititih
h
h
tititititi
Control
InstEthnDivInstEthnDivInequalInequal
,,,
8
1
,4,3,2,10,
var
)(
(3)
titttihtih
h
h
titititi
titititititi
ControlControl
InstEthnDivInstEthnDivInstInst
EthnDivEthnDivInequalInequalInequalInequal
,2,,,,
8
1
,,4,,3
,,22,,10,,
)()varvar(
])()[()(
)()(
(4)
Where: Inequal stands for inequality; EthnDiv represents ethnic diversity; EthnDiv*Inst is the
interaction between ethnic diversity and institution; Inst equals institution and Controlvar
proxies a set of control variables. h ,, 410 are parameter estimates; represents tau; i is the
country-specific effect, t is the time specific constant; and ti , is the stochastic term. The
difference equation is derived from the level equation and tau is defined as the autoregressive
order, which is one in the analysis because one period can comprehensively capture past
exogenous information. It is also imperative to discuss briefly some drawbacks identified by
Brambor, Clark and Golder (2006) following the use of interactive regressions. The authors
further note that in the model specifications, all constitutive variables should be absorbed.
17
The estimated coefficients should be interpreted as conditional marginal impacts for them to
make economic sense (Asongu and Nwachukwu, 2016c).
We further conducted some post-estimation diagnostic tests to establish the consistency of the
system GMM coefficients. The presence of second-order serial correlation is confirmed based
on the value of AR (2) which denotes the absence of autocorrelation in the error terms should
not be rejected. If the probability value is not rejected, therefore, the problem of second-order
autocorrelation exists.Furthermore, the null hypotheses of the Sargan and Hansen over-
identification restriction test should not also be rejected, implying that the instruments are
valid that is that are not correlated with the error terms. Summary, the Sargan (Hansen) over-
identification restriction tests implies not robust but not weakened by instruments (is robust
but weakened by instruments). We address this conflict by prioritizing the Hansen test and
ensuring that the number of instruments in each specification is less than the corresponding
number of countries in order to avoid instrument proliferation.The jointly validity of our
estimated parameters was confirmed from the statistical value of Fisher test.
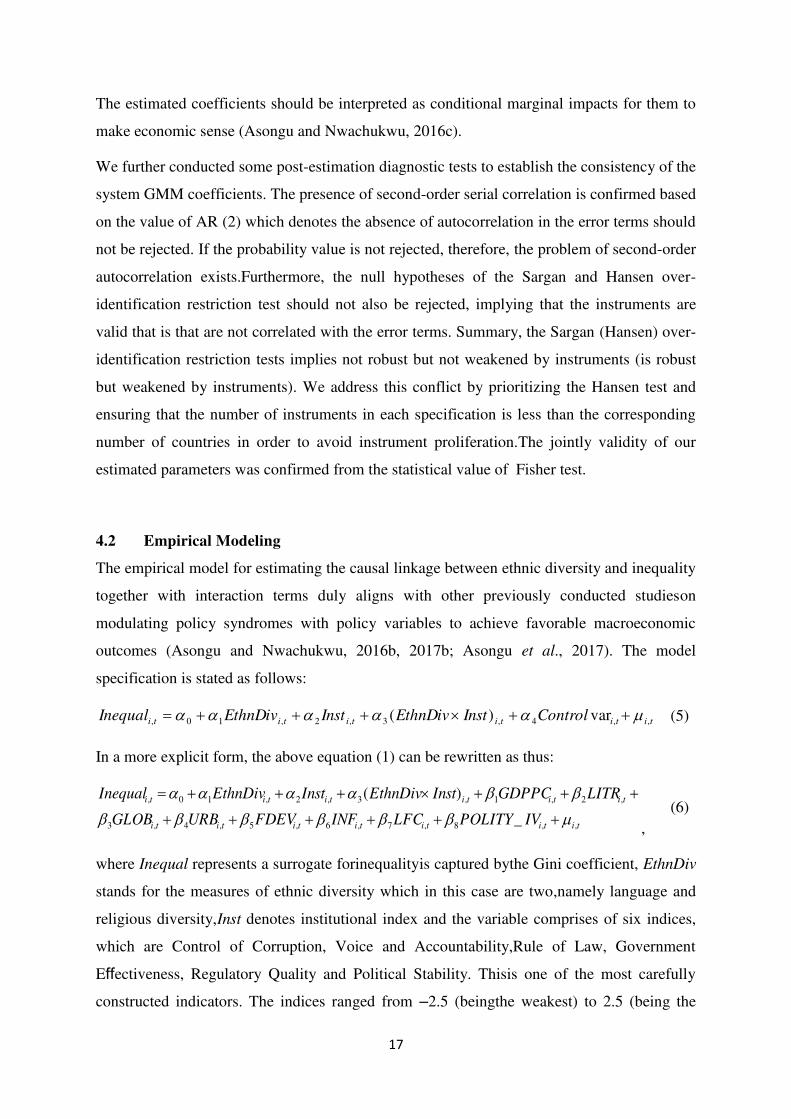
4.2 Empirical Modeling
The empirical model for estimating the causal linkage between ethnic diversity and inequality
together with interaction terms duly aligns with other previously conducted studieson
modulating policy syndromes with policy variables to achieve favorable macroeconomic
outcomes (Asongu and Nwachukwu, 2016b, 2017b; Asongu et al., 2017). The model
specification is stated as follows:
titititititi ControlInstEthnDivInstEthnDivInequal ,,4,3,2,10, var)( (5)
In a more explicit form, the above equation (1) can be rewritten as thus:
tititititititi
titititititi
IVPOLITYLFCINFFDEVURBGLOB
LITRGDPPCInstEthnDivInstEthnDivInequal
,,8,7,6,5,4,3
,2,1,3,2,10,
_
)(
,
(6)
where Inequal represents a surrogate forinequalityis captured bythe Gini coefficient, EthnDiv
stands for the measures of ethnic diversity which in this case are two,namely language and
religious diversity,Inst denotes institutional index and the variable comprises of six indices,
which are Control of Corruption, Voice and Accountability,Rule of Law, Government
Effectiveness, Regulatory Quality and Political Stability. Thisis one of the most carefully
constructed indicators. The indices ranged from –2.5 (beingthe weakest) to 2.5 (being the

18
strongest), while the percentile ranking ranged from 0(weakest) to 100(strongest). i is
country, t is time and is the error or disturbance term with expected mean zero and
constant variance. In addition, the error term isboth identically and independently distributed.
EthnicDiv×Inst constitutes the interactive term between ethnic diversity and institution and
Controlvar is an omnibus variable for a set of control variables capable of influencing
inequality. These are carefully selected variables in the inequality literature(see
Asongu&Asongu, 2018; Asongu & Odhiambo, 2018). The variables include gross domestic
product per capita (GDPPC), literacy rates (LITR), globalization (GLOB), urbanization rates
(URB), financial development (FDEV), inflation (INF), labour force participation rates (LFC)
and political regime types (POLITY_IV) respectively.
In terms of a priori expectations, irrespective of ethnic diversity measures (whether linguistic
or religious as the case may be) used, a positive relationship is hypothesized between ethnic
diversity and inequality. By implication, the higher the ethnic diversity, the higher the
incidence of inequality. Many studies (e.g. like Alesina & Glaeser, 2004; Dincer & Lambert,
2006; Dincer & Hotard, 2011) have offered empirical support to this. A reverse outcome is
expected between institutions and inequality. That is, an inverse relationship is posited in the
sense that a sound institutional framework is expected to mitigate the impacts of inequality.
Conversely, a bad institutional infrastructure may help deepen the effects of inequality on the
economy. The interactive term is also expected to be inversely correlated with a measure of
inequality. Thus, an ethnically fractionalized country that is being adorned with sound
institutions would help minimize the effects of inequality and vice versa. This explains why a
developed country like the US has a comparatively high level of income inequality, though
having a high racial and religious heterogeneous society.
Apart from the core variables of interest, the control variables also have some theoretical
relationships with inequality. For instance, the relationship between per capita GDP and
income inequality is conjectured to be ambiguous according to the Simon Kuznets hypothesis.
This is confirmed to be true given the level and stage of development of the country
concerned. According to Kuznets, a country’s level of income inequality is affected by the
state of economic development. That is, as an economy develops, market forces first increase
then decrease the overall economic inequality. Hence, the existence of an inverted U-shaped
relationship between income inequality and economic growth. In terms of educational
variables, literacy rates arealso assumed to have a negative causal relationship with ethnic
diversity. This can be explained to mean that increased literacy rates tend to narrow down the
19
extent of ethnic diversity. A reduced level of literacy might end up widening inequality.The
effect of globalization forces on inequality can be said to be ambiguous. On the one hand, the
level of integration of a country can help lift people of that country from poverty due to
exposure to state-of-the-art technology, thus reducing inequality; it can also be argued, on the
other hand, that globalization may end up enriching the few privileged individuals thereby
widening the gap between them and the poor. The degree of urbanization is hypothesized to
bear a negative relationship with inequality. The higher the urbanization rate, the lower the
level of inequality. The more a country’s financial system deepens, the better the financial
services become, with the overall consequence being reduction in inequality. Thus, a negative
causal relationship is envisaged.Macroeconomic stability (surrogated by inflation rates)
equally goes along way in determining the level of inequality in an economy. Inequality
worsens in an environment that ismacroeconomically unstable. In this case, a positive
relationship is posited. The variable of labour force participation is expected to have a
negative correlation with inequality. Hence, the higher the labour force participation rates, the
lower the inequality level and vice versa. Lastly, the type of political regime is another
determinant of inequality in the empirical literature. If a democratic system of governance
prevails,reduced inequality is expected to manifest, while a reverse condition will be
envisaged in case of an autocratic governance type. Hence, the use of polity IV (that is the
difference between the two regimes) and the coefficient is assumed to be negative under an
autocratic system while it becomes positive for a democratic rule.
4.3 Data Source
The data spanning from 1996 to 2015 were obtained from the following sources: Easterly and
Levine (1997), The Ethnic Power Relations (EPR) core dataset 2015, World Governance
Indicators (WGI) CD-ROM and World Development Indicators (WDI). The 26 Sub-Saharan
African countries are Benin, Botswana, Burkina Faso, Burundi, Cameroon, Central African
Republic, Cote d’Ivoire, Ethiopia, Gambia, Ghana, Guinea-Bissau, Kenya, Lesotho,
Madagascar, Malawi, Mali, Mauritania, Mozambique, Niger, Nigeria, Senegal, South Africa,
Swaziland, Tanzania, Uganda and Zambia. The sources of our data as well as their definitions
are presented in Table 2. The choice of the periodicity and sampled countries is motivated by
data availability constraints. Moreover, data on institutions from WGI is only available from
1996.
20
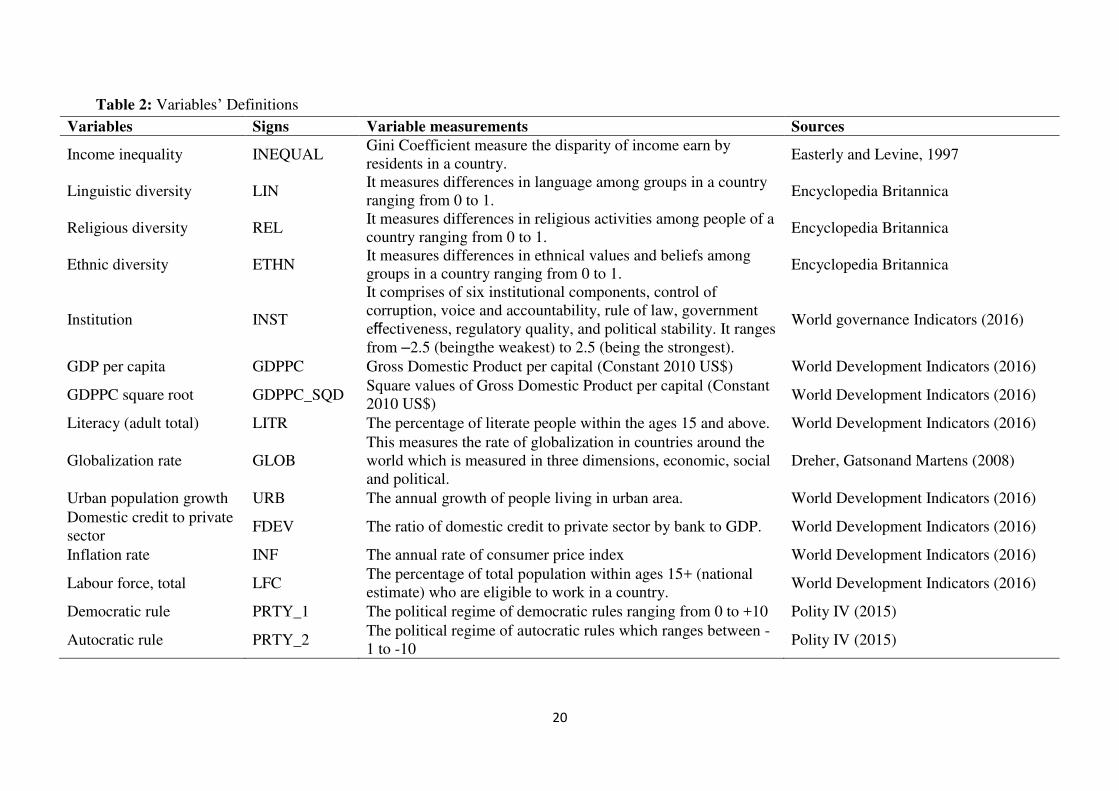
Table 2: Variables’ Definitions
Variables Signs Variable measurements Sources
Income inequality INEQUAL Gini Coefficient measure the disparity of income earn by residents in a country.
Easterly and Levine, 1997
Linguistic diversity LIN It measures differences in language among groups in a country ranging from 0 to 1.
Encyclopedia Britannica
Religious diversity REL It measures differences in religious activities among people of a country ranging from 0 to 1.
Encyclopedia Britannica
Ethnic diversity ETHN It measures differences in ethnical values and beliefs among groups in a country ranging from 0 to 1.
Encyclopedia Britannica
Institution INST
It comprises of six institutional components, control of corruption, voice and accountability, rule of law, government effectiveness, regulatory quality, and political stability. It ranges from –2.5 (beingthe weakest) to 2.5 (being the strongest).
World governance Indicators (2016)
GDP per capita GDPPC Gross Domestic Product per capital (Constant 2010 US$) World Development Indicators (2016)
GDPPC square root GDPPC_SQD Square values of Gross Domestic Product per capital (Constant 2010 US$)
World Development Indicators (2016)
Literacy (adult total) LITR The percentage of literate people within the ages 15 and above. World Development Indicators (2016)
Globalization rate GLOB This measures the rate of globalization in countries around the world which is measured in three dimensions, economic, social and political.
Dreher, Gatsonand Martens (2008)
Urban population growth URB The annual growth of people living in urban area. World Development Indicators (2016)
Domestic credit to private sector
FDEV The ratio of domestic credit to private sector by bank to GDP. World Development Indicators (2016)
Inflation rate INF The annual rate of consumer price index World Development Indicators (2016)
Labour force, total LFC The percentage of total population within ages 15+ (national estimate) who are eligible to work in a country.
World Development Indicators (2016)
Democratic rule PRTY_1 The political regime of democratic rules ranging from 0 to +10 Polity IV (2015)
Autocratic rule PRTY_2 The political regime of autocratic rules which ranges between -1 to -10
Polity IV (2015)

21
5.0 Empirical Result and Discussion
5.1 Analysis ofPreliminary Statistics
The descriptive statistics of the panel datasets is presented in Table 3. The mean value of
income inequality is 0.4534. The average values of linguistic, religion and ethnic diversities
are 0.673, 0.568 and 0.687 respectively. This indicates high heterogeneous nature of religion,
linguistic and ethnicity in the region. The negative mean values of institutional index of -
0.5367 further accentuates the level of the region’s infrastructure decadence. The average
value of domestic credit to the private sector by financial institutions to the size of the SSA
economy stand at 19.0%. The democratic system of governance has the highest mean value
of 3.725 compared to the average value of the autocratic rule which is 1.383 making the mean
value of polity IV index to be 2.3423. By implication this is suggestive that most of the
countries in the region have embraced democracy as their system of governance. The region
also has an average labour force size and literacy level of 65.23% and 54.74% respectively,
representing those that are within the age bracket of 15 years and above, while the urban
population grows at an annual rate of 3.98%. The average value of GDP per capita of the
region is US$1,277 indicating that the region falls within the lower middle-income
economies according to the recent classification of the World Bank Atlas method.
Table 3: Descriptive statistics
Variables Mean Max. Min. Std. Dev.
Income inequality 0.4534 0.6576 0.2981 0.0860
Linguistic diversity 0.6732 0.9226 0.0204 0.2529
Religion diversity 0.5682 0.8603 0.0149 0.2383
Ethnic diversity 0.6867 0.9302 0.0582 0.2054
Institution -0.5357 0.8677 -1.7500 0.4864
GDP per capita 1277 7611 187 1605
GDP per capita (ln) 6.7007 8.9373 5.2307 0.8598
GDPPC square root (ln) 45.637 79.876 27.360 12.189
Literacy (adult total) 54.738 94.598 12.848 20.846
Globalization rate (ln) 3.7230 4.1784 3.0559 0.2094
Urban population growth 3.9794 6.7261 -0.0466 1.1988
Domestic credit to private sector by banks 19.003 160.13 0.4104 24.625
Inflation rate 7.7397 50.734 -9.6162 8.1734
Labour force, total 65.226 92.700 6.1700 16.852
Democratic rule (A) 3.7250 9.0000 -8.0000 3.9221
Autocratic rule (B) 1.3837 9.0000 -8.0000 3.0754
Political regime types (A–B) 2.3423 9.0000 -9.0000 5.0860
7 The high value of this variable could have been due to perception-based nature of the institutional variables obtained from World Governance Indicators database.
22
Number of observation is 520. STD. DEV. is standard deviation.
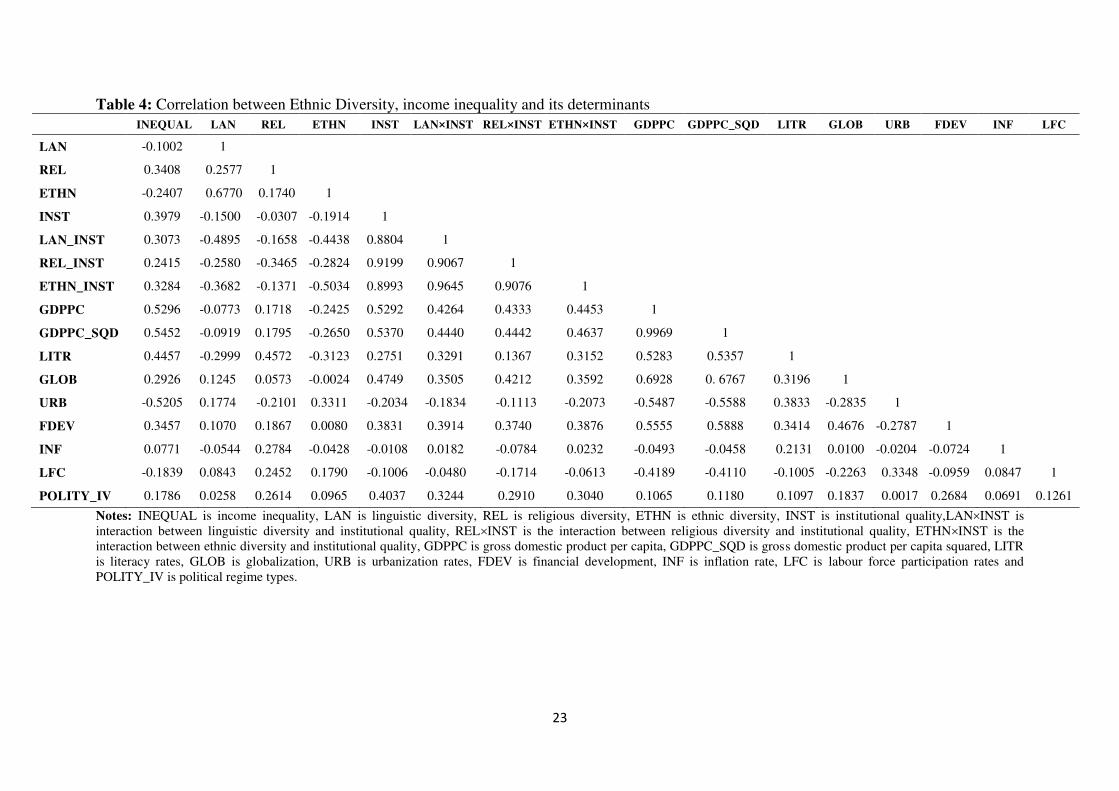
The correlation coefficients of the relationship between the measures of ethnic diversities
(linguistic, religion and ethnic), institutions, other covariates and income inequality are
presented in Table 4. Themeasures of linguistic and ethnic diversities are found to be
negatively correlated with income inequality while religious diversity has a contrary sign. Of
the diversity measures, religion has the highest correlation coefficient followed by ethnic
diversity and linguistic diversity. From the table, institutional variableappears to be
moderately and positively correlated with income inequality. The results are in tandem with
the directions of the scatter plots presented in Figures 2(a-d). All other variables convey
positive correlation coefficients with the exception of urban population growth and labour
force. Literacy rate is negatively correlated with linguistic diversity while urban population
growth is indirectly correlated with religion diversity. Conversely, literacy rate, GDP per
capita and its squared value are very much correlated with ethnic diversity. The interactive
terms of institution and the diversity measures are inversely correlated with ethnic, religion
and language diversities. Thus, other correlation coefficients of the indicators are further
reported in the table at varying degrees and magnitudes.
23
Table 4: Correlation between Ethnic Diversity, income inequality and its determinants
INEQUAL LAN REL ETHN INST LAN×INST REL×INST ETHN×INST GDPPC GDPPC_SQD LITR GLOB URB FDEV INF LFC
LAN -0.1002 1
REL 0.3408 0.2577 1
ETHN -0.2407 0.6770 0.1740 1
INST 0.3979 -0.1500 -0.0307 -0.1914 1
LAN_INST 0.3073 -0.4895 -0.1658 -0.4438 0.8804 1
REL_INST 0.2415 -0.2580 -0.3465 -0.2824 0.9199 0.9067 1
ETHN_INST 0.3284 -0.3682 -0.1371 -0.5034 0.8993 0.9645 0.9076 1
GDPPC 0.5296 -0.0773 0.1718 -0.2425 0.5292 0.4264 0.4333 0.4453 1
GDPPC_SQD 0.5452 -0.0919 0.1795 -0.2650 0.5370 0.4440 0.4442 0.4637 0.9969 1
LITR 0.4457 -0.2999 0.4572 -0.3123 0.2751 0.3291 0.1367 0.3152 0.5283 0.5357 1
GLOB 0.2926 0.1245 0.0573 -0.0024 0.4749 0.3505 0.4212 0.3592 0.6928 0. 6767 0.3196 1
URB -0.5205 0.1774 -0.2101 0.3311 -0.2034 -0.1834 -0.1113 -0.2073 -0.5487 -0.5588 0.3833 -0.2835 1
FDEV 0.3457 0.1070 0.1867 0.0080 0.3831 0.3914 0.3740 0.3876 0.5555 0.5888 0.3414 0.4676 -0.2787 1
INF 0.0771 -0.0544 0.2784 -0.0428 -0.0108 0.0182 -0.0784 0.0232 -0.0493 -0.0458 0.2131 0.0100 -0.0204 -0.0724 1
LFC -0.1839 0.0843 0.2452 0.1790 -0.1006 -0.0480 -0.1714 -0.0613 -0.4189 -0.4110 -0.1005 -0.2263 0.3348 -0.0959 0.0847 1
POLITY_IV 0.1786 0.0258 0.2614 0.0965 0.4037 0.3244 0.2910 0.3040 0.1065 0.1180 0.1097 0.1837 0.0017 0.2684 0.0691 0.1261
Notes: INEQUAL is income inequality, LAN is linguistic diversity, REL is religious diversity, ETHN is ethnic diversity, INST is institutional quality,LAN×INST is interaction between linguistic diversity and institutional quality, REL×INST is the interaction between religious diversity and institutional quality, ETHN×INST is the interaction between ethnic diversity and institutional quality, GDPPC is gross domestic product per capita, GDPPC_SQD is gross domestic product per capita squared, LITR is literacy rates, GLOB is globalization, URB is urbanization rates, FDEV is financial development, INF is inflation rate, LFC is labour force participation rates and POLITY_IV is political regime types.

24
5.2 Empirical Estimates of the Panel Regression Models
The discussion of empirical results for income inequality is presented in Tables 5 and 6.
5.2.1 Baseline Pooled and Fixed Effects Regressions8
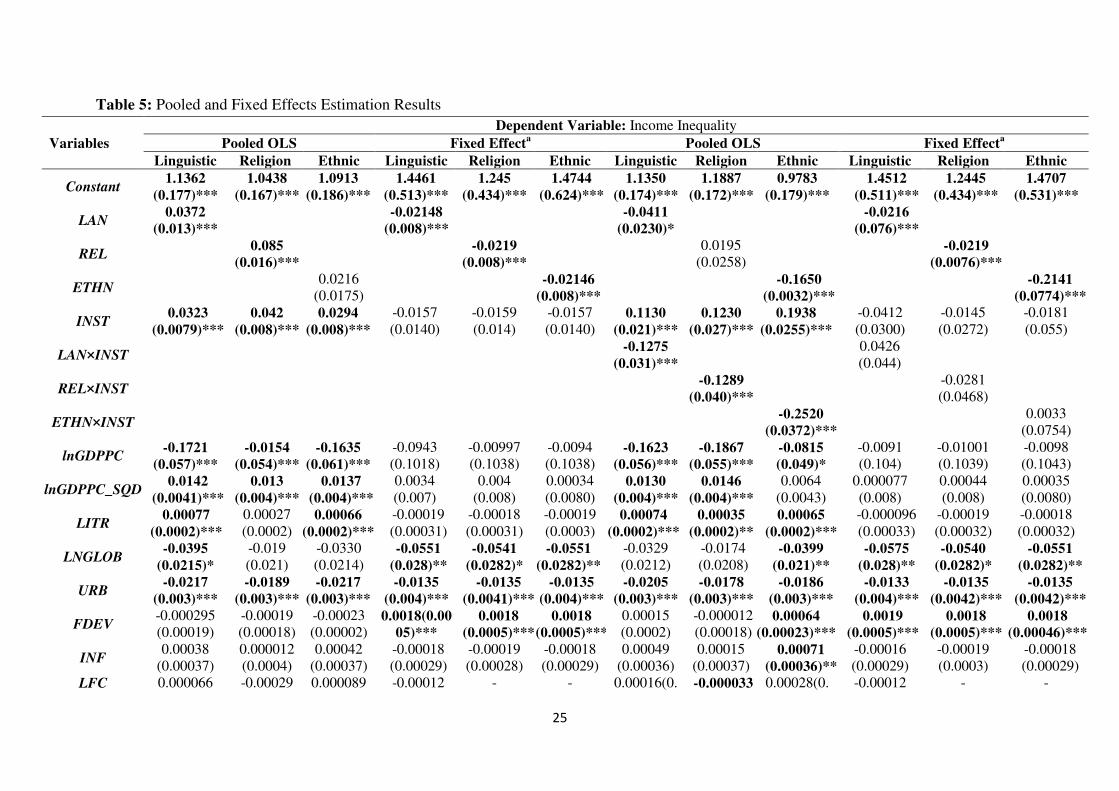
Table 5 reports the results of pooled OLS and panel fixed effects which controls for
unobserved country characteristics. The Hausman test statistics presented in the table reveal
the appropriateness of the panel fixed effects as the results reject the null hypotheses for all
the considered models at 5% significance levels based on the calculated Chi-Square
values.The models are first estimated without the interactive terms of institutions and ethnic
diversity composition, and these are shown in the first six columns. The last six columns
present the estimated regression results with the interactive terms of the key variables of
interest. The results of our coefficients are not consistent in terms of signs with respect to the
two baseline estimators, namely OLS and fixed effects. The findings from the pooled OLS
established that: (a) linguistic, religious and ethnic diversity increase the level of inequality in
the region and (b) the interaction terms of institutional quality and linguistic, religious and
ethnic diversity reduce inequality, while institutions still maintain a direct relationship with
inequality. From panel fixed effects, the results reveal that (a) an inverse relationships exist
between linguistic, religious and ethnic diversity and income inequality and (b) the impact of
the interactive terms of institutional quality, together with linguistic, religious and ethnic
diversity respectively on inequality are insignificant at their conventional levels. A system
GMM is equally deployed to increase the bite on endogeneity, notably by: (a) controlling for
time invariant omitted variables in order to further account for the unobserved heterogeneity
and cross sectional dependence and (b) accounting for simultaneity or reverse causation by
means of the instrumentation process. This is discussed in what follows.
8 Much efforts are not expended expantiating on these baseline regression results because of their inherent econometrical problems. Hence, justify our spending more time and space explaining in details the results of the system GMM.
25
Table 5: Pooled and Fixed Effects Estimation Results
Variables
Dependent Variable: Income Inequality
Pooled OLS Fixed Effecta Pooled OLS Fixed Effect
a
Linguistic Religion Ethnic Linguistic Religion Ethnic Linguistic Religion Ethnic Linguistic Religion Ethnic
Constant 1.1362
(0.177)***
1.0438
(0.167)***
1.0913
(0.186)***
1.4461
(0.513)***
1.245
(0.434)***
1.4744
(0.624)***
1.1350
(0.174)***
1.1887
(0.172)***
0.9783
(0.179)***
1.4512
(0.511)***
1.2445
(0.434)***
1.4707
(0.531)***
LAN 0.0372
(0.013)***
-0.02148
(0.008)***
-0.0411
(0.0230)*
-0.0216
(0.076)***
REL 0.085
(0.016)***
-0.0219
(0.008)***
0.0195 (0.0258)
-0.0219
(0.0076)***
ETHN 0.0216
(0.0175)
-0.02146
(0.008)***
-0.1650
(0.0032)***
-0.2141
(0.0774)***
INST 0.0323
(0.0079)***
0.042
(0.008)***
0.0294
(0.008)***
-0.0157 (0.0140)
-0.0159 (0.014)
-0.0157 (0.0140)
0.1130
(0.021)***
0.1230
(0.027)***
0.1938
(0.0255)***
-0.0412 (0.0300)
-0.0145 (0.0272)
-0.0181 (0.055)
LAN×INST -0.1275
(0.031)***
0.0426 (0.044)
REL×INST -0.1289
(0.040)***
-0.0281 (0.0468)
ETHN×INST -0.2520
(0.0372)***
0.0033 (0.0754)
lnGDPPC -0.1721
(0.057)***
-0.0154
(0.054)***
-0.1635
(0.061)***
-0.0943 (0.1018)
-0.00997 (0.1038)
-0.0094 (0.1038)
-0.1623
(0.056)***
-0.1867
(0.055)***
-0.0815
(0.049)*
-0.0091 (0.104)
-0.01001 (0.1039)
-0.0098 (0.1043)
lnGDPPC_SQD 0.0142
(0.0041)***
0.013
(0.004)***
0.0137
(0.004)***
0.0034 (0.007)
0.004 (0.008)
0.00034 (0.0080)
0.0130
(0.004)***
0.0146
(0.004)***
0.0064 (0.0043)
0.000077 (0.008)
0.00044 (0.008)
0.00035 (0.0080)
LITR 0.00077
(0.0002)***
0.00027 (0.0002)
0.00066
(0.0002)***
-0.00019 (0.00031)
-0.00018 (0.00031)
-0.00019 (0.0003)
0.00074
(0.0002)***
0.00035
(0.0002)**
0.00065
(0.0002)***
-0.000096 (0.00033)
-0.00019 (0.00032)
-0.00018 (0.00032)
LNGLOB -0.0395
(0.0215)*
-0.019 (0.021)
-0.0330 (0.0214)
-0.0551
(0.028)**
-0.0541
(0.0282)*
-0.0551
(0.0282)**
-0.0329 (0.0212)
-0.0174 (0.0208)
-0.0399
(0.021)**
-0.0575
(0.028)**
-0.0540
(0.0282)*
-0.0551
(0.0282)**
URB -0.0217
(0.003)***
-0.0189
(0.003)***
-0.0217
(0.003)***
-0.0135
(0.004)***
-0.0135
(0.0041)***
-0.0135
(0.004)***
-0.0205
(0.003)***
-0.0178
(0.003)***
-0.0186
(0.003)***
-0.0133
(0.004)***
-0.0135
(0.0042)***
-0.0135
(0.0042)***
FDEV -0.000295 (0.00019)
-0.00019 (0.00018)
-0.00023 (0.00002)
0.0018(0.00
05)***
0.0018
(0.0005)***
0.0018
(0.0005)***
0.00015 (0.0002)
-0.000012 (0.00018)
0.00064
(0.00023)***
0.0019
(0.0005)***
0.0018
(0.0005)***
0.0018
(0.00046)***
INF 0.00038
(0.00037) 0.000012 (0.0004)
0.00042 (0.00037)
-0.00018 (0.00029)
-0.00019 (0.00028)
-0.00018 (0.00029)
0.00049 (0.00036)
0.00015 (0.00037)
0.00071
(0.00036)**
-0.00016 (0.00029)
-0.00019 (0.0003)
-0.00018 (0.00029)
LFC 0.000066 -0.00029 0.000089 -0.00012 - - 0.00016(0. -0.000033 0.00028(0. -0.00012 - -
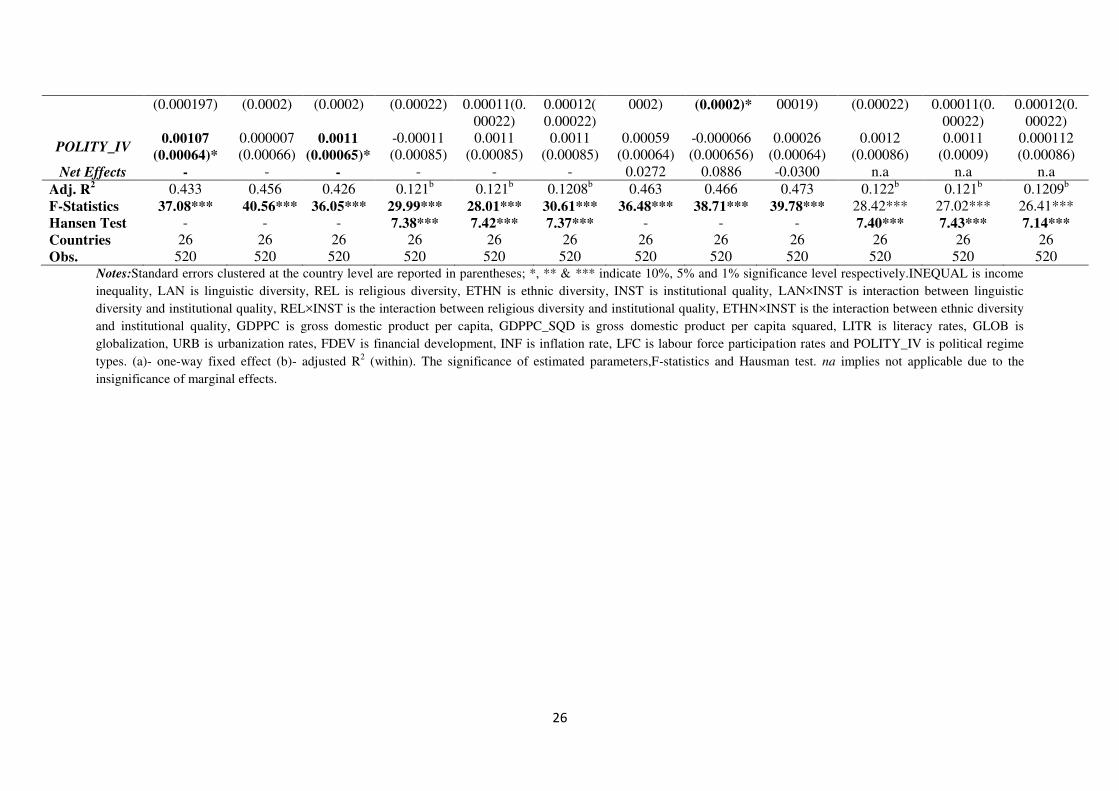
26
(0.000197) (0.0002) (0.0002) (0.00022) 0.00011(0.00022)
0.00012(0.00022)
0002) (0.0002)* 00019) (0.00022) 0.00011(0.00022)
0.00012(0.00022)
POLITY_IV 0.00107
(0.00064)*
0.000007 (0.00066)
0.0011
(0.00065)*
-0.00011 (0.00085)
0.0011 (0.00085)
0.0011 (0.00085)
0.00059 (0.00064)
-0.000066 (0.000656)
0.00026 (0.00064)
0.0012 (0.00086)
0.0011 (0.0009)
0.000112 (0.00086)
Net Effects - - - - - - 0.0272 0.0886 -0.0300 n.a n.a n.a
Adj. R2 0.433 0.456 0.426 0.121b 0.121b 0.1208b 0.463 0.466 0.473 0.122b 0.121b 0.1209b
F-Statistics 37.08*** 40.56*** 36.05*** 29.99*** 28.01*** 30.61*** 36.48*** 38.71*** 39.78*** 28.42*** 27.02*** 26.41*** Hansen Test - - - 7.38*** 7.42*** 7.37*** - - - 7.40*** 7.43*** 7.14***
Countries 26 26 26 26 26 26 26 26 26 26 26 26 Obs. 520 520 520 520 520 520 520 520 520 520 520 520
Notes:Standard errors clustered at the country level are reported in parentheses; *, ** & *** indicate 10%, 5% and 1% significance level respectively.INEQUAL is income
inequality, LAN is linguistic diversity, REL is religious diversity, ETHN is ethnic diversity, INST is institutional quality, LAN×INST is interaction between linguistic
diversity and institutional quality, REL×INST is the interaction between religious diversity and institutional quality, ETHN×INST is the interaction between ethnic diversity
and institutional quality, GDPPC is gross domestic product per capita, GDPPC_SQD is gross domestic product per capita squared, LITR is literacy rates, GLOB is
globalization, URB is urbanization rates, FDEV is financial development, INF is inflation rate, LFC is labour force participation rates and POLITY_IV is political regime
types. (a)- one-way fixed effect (b)- adjusted R2 (within). The significance of estimated parameters,F-statistics and Hausman test. na implies not applicable due to the
insignificance of marginal effects.
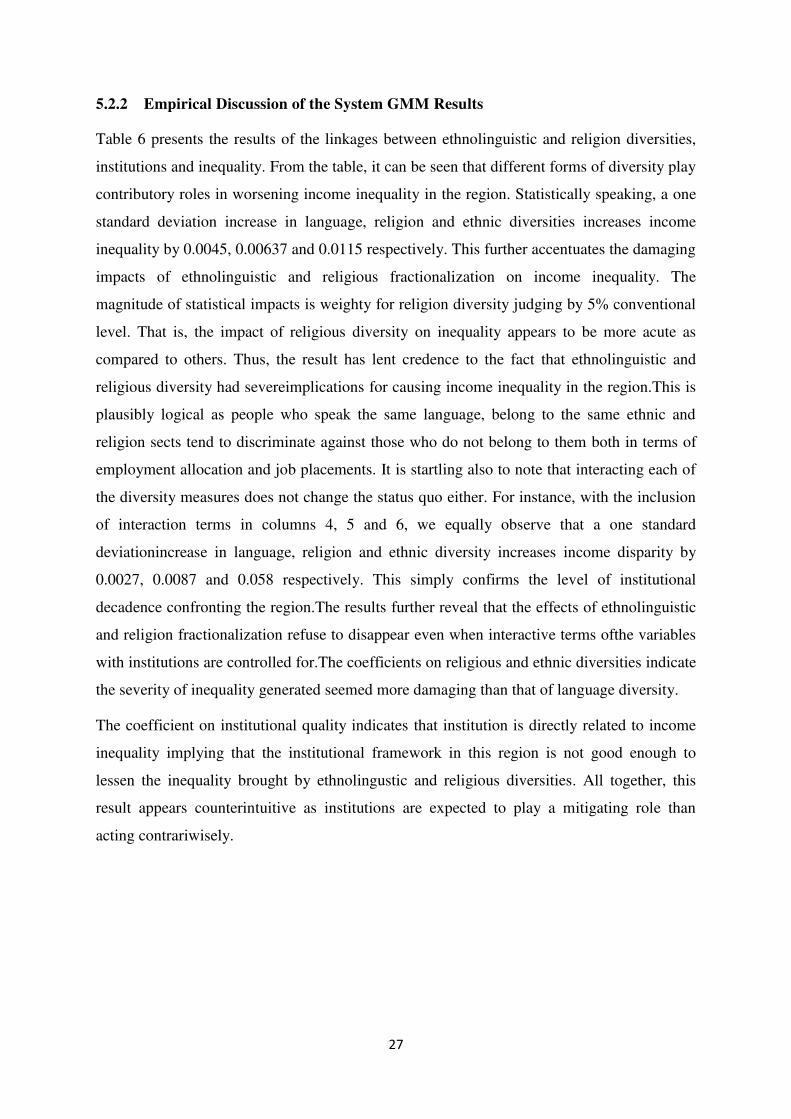
27
5.2.2 Empirical Discussion of the System GMM Results
Table 6 presents the results of the linkages between ethnolinguistic and religion diversities,
institutions and inequality. From the table, it can be seen that different forms of diversity play
contributory roles in worsening income inequality in the region. Statistically speaking, a one
standard deviation increase in language, religion and ethnic diversities increases income
inequality by 0.0045, 0.00637 and 0.0115 respectively. This further accentuates the damaging
impacts of ethnolinguistic and religious fractionalization on income inequality. The
magnitude of statistical impacts is weighty for religion diversity judging by 5% conventional
level. That is, the impact of religious diversity on inequality appears to be more acute as
compared to others. Thus, the result has lent credence to the fact that ethnolinguistic and
religious diversity had severeimplications for causing income inequality in the region.This is
plausibly logical as people who speak the same language, belong to the same ethnic and
religion sects tend to discriminate against those who do not belong to them both in terms of
employment allocation and job placements. It is startling also to note that interacting each of
the diversity measures does not change the status quo either. For instance, with the inclusion
of interaction terms in columns 4, 5 and 6, we equally observe that a one standard
deviationincrease in language, religion and ethnic diversity increases income disparity by
0.0027, 0.0087 and 0.058 respectively. This simply confirms the level of institutional
decadence confronting the region.The results further reveal that the effects of ethnolinguistic
and religion fractionalization refuse to disappear even when interactive terms ofthe variables
with institutions are controlled for.The coefficients on religious and ethnic diversities indicate
the severity of inequality generated seemed more damaging than that of language diversity.
The coefficient on institutional quality indicates that institution is directly related to income
inequality implying that the institutional framework in this region is not good enough to
lessen the inequality brought by ethnolingustic and religious diversities. All together, this
result appears counterintuitive as institutions are expected to play a mitigating role than
acting contrariwisely.
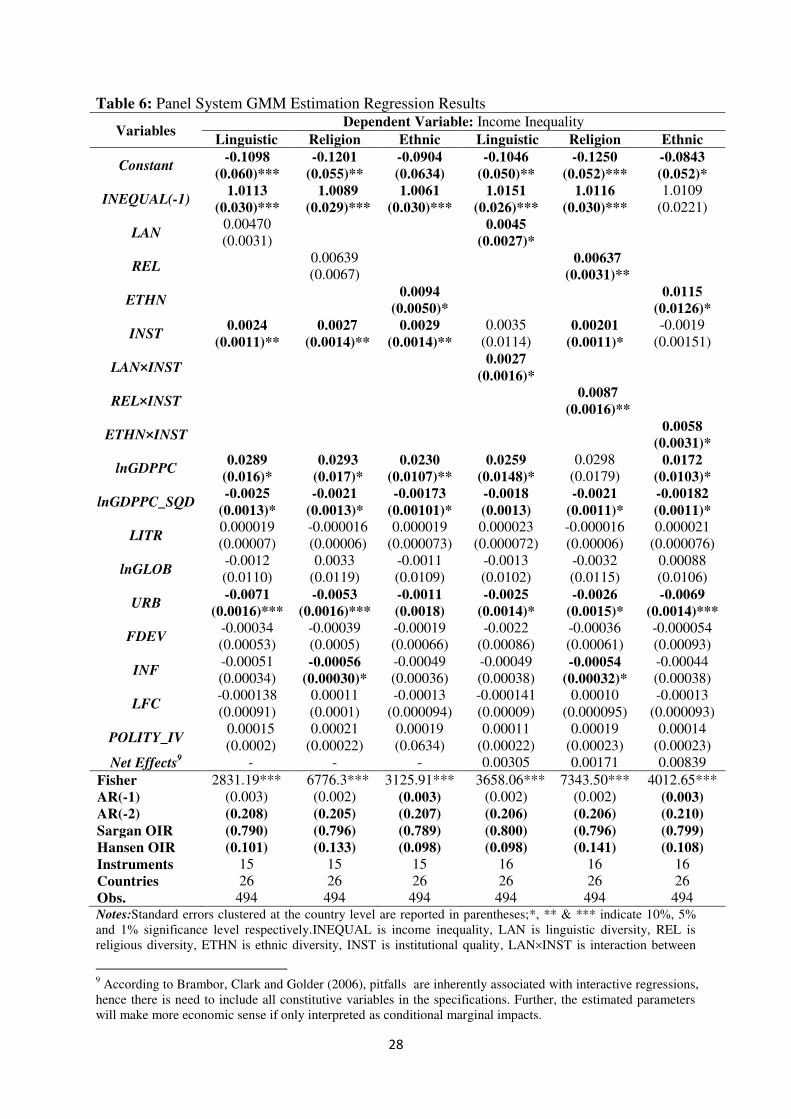
28
Table 6: Panel System GMM Estimation Regression Results
Variables Dependent Variable: Income Inequality
Linguistic Religion Ethnic Linguistic Religion Ethnic
Constant -0.1098
(0.060)***
-0.1201
(0.055)**
-0.0904
(0.0634)
-0.1046
(0.050)**
-0.1250
(0.052)***
-0.0843
(0.052)*
INEQUAL(-1) 1.0113
(0.030)***
1.0089
(0.029)***
1.0061
(0.030)***
1.0151
(0.026)***
1.0116
(0.030)***
1.0109 (0.0221)
LAN 0.00470 (0.0031)
0.0045
(0.0027)*
REL 0.00639
(0.0067) 0.00637
(0.0031)**
ETHN 0.0094
(0.0050)*
0.0115
(0.0126)*
INST 0.0024
(0.0011)**
0.0027
(0.0014)**
0.0029
(0.0014)**
0.0035 (0.0114)
0.00201
(0.0011)*
-0.0019 (0.00151)
LAN×INST 0.0027
(0.0016)*
REL×INST 0.0087
(0.0016)**
ETHN×INST 0.0058
(0.0031)*
lnGDPPC 0.0289
(0.016)*
0.0293
(0.017)*
0.0230
(0.0107)**
0.0259
(0.0148)*
0.0298 (0.0179)
0.0172
(0.0103)*
lnGDPPC_SQD -0.0025
(0.0013)*
-0.0021
(0.0013)*
-0.00173
(0.00101)*
-0.0018
(0.0013)
-0.0021
(0.0011)*
-0.00182
(0.0011)*
LITR 0.000019 (0.00007)
-0.000016 (0.00006)
0.000019 (0.000073)
0.000023 (0.000072)
-0.000016 (0.00006)
0.000021 (0.000076)
lnGLOB -0.0012 (0.0110)
0.0033 (0.0119)
-0.0011 (0.0109)
-0.0013 (0.0102)
-0.0032 (0.0115)
0.00088 (0.0106)
URB -0.0071
(0.0016)***
-0.0053
(0.0016)***
-0.0011
(0.0018)
-0.0025
(0.0014)*
-0.0026
(0.0015)*
-0.0069
(0.0014)***
FDEV -0.00034 (0.00053)
-0.00039 (0.0005)
-0.00019 (0.00066)
-0.0022 (0.00086)
-0.00036 (0.00061)
-0.000054 (0.00093)
INF -0.00051 (0.00034)
-0.00056
(0.00030)*
-0.00049 (0.00036)
-0.00049 (0.00038)
-0.00054
(0.00032)*
-0.00044 (0.00038)
LFC -0.000138 (0.00091)
0.00011 (0.0001)
-0.00013 (0.000094)
-0.000141 (0.00009)
0.00010 (0.000095)
-0.00013 (0.000093)
POLITY_IV 0.00015 (0.0002)
0.00021 (0.00022)
0.00019 (0.0634)
0.00011 (0.00022)
0.00019 (0.00023)
0.00014 (0.00023)
Net Effects9 - - - 0.00305 0.00171 0.00839
Fisher 2831.19*** 6776.3*** 3125.91*** 3658.06*** 7343.50*** 4012.65*** AR(-1) (0.003) (0.002) (0.003) (0.002) (0.002) (0.003)
AR(-2) (0.208) (0.205) (0.207) (0.206) (0.206) (0.210)
Sargan OIR (0.790) (0.796) (0.789) (0.800) (0.796) (0.799)
Hansen OIR (0.101) (0.133) (0.098) (0.098) (0.141) (0.108)
Instruments 15 15 15 16 16 16 Countries 26 26 26 26 26 26 Obs. 494 494 494 494 494 494 Notes:Standard errors clustered at the country level are reported in parentheses;*, ** & *** indicate 10%, 5% and 1% significance level respectively.INEQUAL is income inequality, LAN is linguistic diversity, REL is religious diversity, ETHN is ethnic diversity, INST is institutional quality, LAN×INST is interaction between
9 According to Brambor, Clark and Golder (2006), pitfalls are inherently associated with interactive regressions, hence there is need to include all constitutive variables in the specifications. Further, the estimated parameters will make more economic sense if only interpreted as conditional marginal impacts.
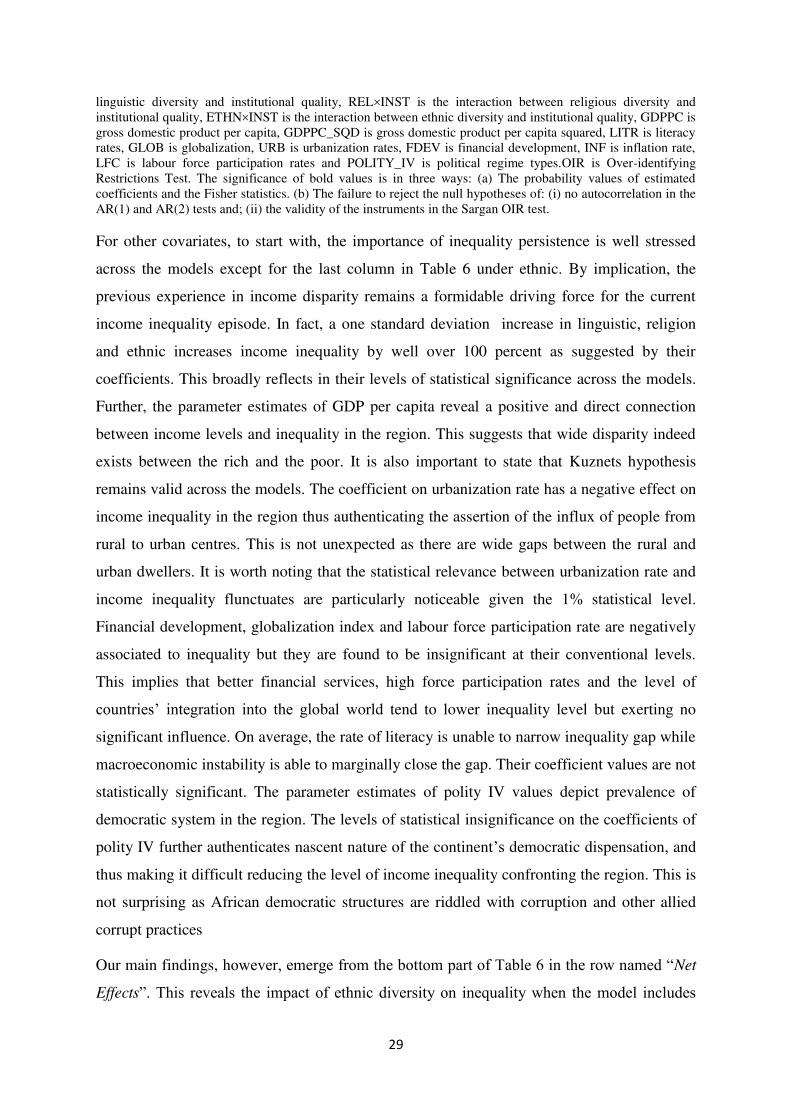
29
linguistic diversity and institutional quality, REL×INST is the interaction between religious diversity and institutional quality, ETHN×INST is the interaction between ethnic diversity and institutional quality, GDPPC is gross domestic product per capita, GDPPC_SQD is gross domestic product per capita squared, LITR is literacy rates, GLOB is globalization, URB is urbanization rates, FDEV is financial development, INF is inflation rate, LFC is labour force participation rates and POLITY_IV is political regime types.OIR is Over-identifying Restrictions Test. The significance of bold values is in three ways: (a) The probability values of estimated coefficients and the Fisher statistics. (b) The failure to reject the null hypotheses of: (i) no autocorrelation in the AR(1) and AR(2) tests and; (ii) the validity of the instruments in the Sargan OIR test.
For other covariates, to start with, the importance of inequality persistence is well stressed
across the models except for the last column in Table 6 under ethnic. By implication, the
previous experience in income disparity remains a formidable driving force for the current
income inequality episode. In fact, a one standard deviation increase in linguistic, religion
and ethnic increases income inequality by well over 100 percent as suggested by their
coefficients. This broadly reflects in their levels of statistical significance across the models.
Further, the parameter estimates of GDP per capita reveal a positive and direct connection
between income levels and inequality in the region. This suggests that wide disparity indeed
exists between the rich and the poor. It is also important to state that Kuznets hypothesis
remains valid across the models. The coefficient on urbanization rate has a negative effect on
income inequality in the region thus authenticating the assertion of the influx of people from
rural to urban centres. This is not unexpected as there are wide gaps between the rural and
urban dwellers. It is worth noting that the statistical relevance between urbanization rate and
income inequality flunctuates are particularly noticeable given the 1% statistical level.
Financial development, globalization index and labour force participation rate are negatively
associated to inequality but they are found to be insignificant at their conventional levels.
This implies that better financial services, high force participation rates and the level of
countries’ integration into the global world tend to lower inequality level but exerting no
significant influence. On average, the rate of literacy is unable to narrow inequality gap while
macroeconomic instability is able to marginally close the gap. Their coefficient values are not
statistically significant. The parameter estimates of polity IV values depict prevalence of
democratic system in the region. The levels of statistical insignificance on the coefficients of
polity IV further authenticates nascent nature of the continent’s democratic dispensation, and
thus making it difficult reducing the level of income inequality confronting the region. This is
not surprising as African democratic structures are riddled with corruption and other allied
corrupt practices
Our main findings, however, emerge from the bottom part of Table 6 in the row named “Net
Effects”. This reveals the impact of ethnic diversity on inequality when the model includes
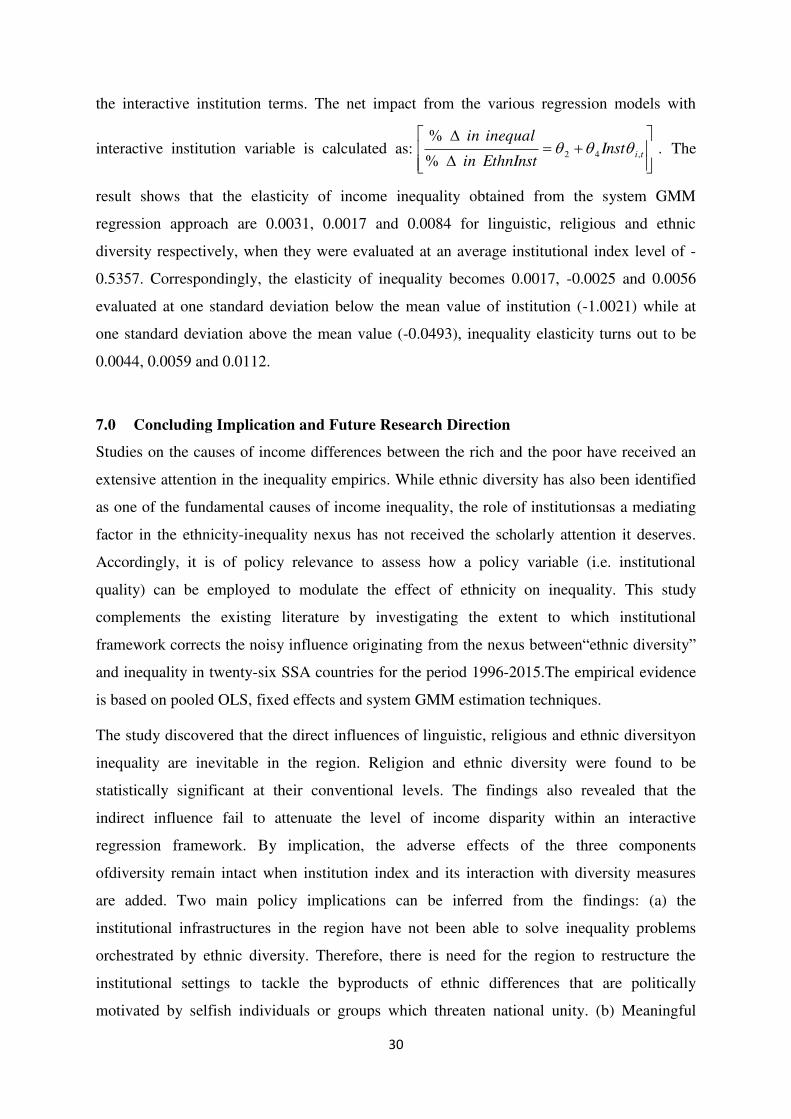
30
the interactive institution terms. The net impact from the various regression models with
interactive institution variable is calculated as:
tiInst
EthnInstin
inequalin,42
%
% . The
result shows that the elasticity of income inequality obtained from the system GMM
regression approach are 0.0031, 0.0017 and 0.0084 for linguistic, religious and ethnic
diversity respectively, when they were evaluated at an average institutional index level of -
0.5357. Correspondingly, the elasticity of inequality becomes 0.0017, -0.0025 and 0.0056
evaluated at one standard deviation below the mean value of institution (-1.0021) while at
one standard deviation above the mean value (-0.0493), inequality elasticity turns out to be
0.0044, 0.0059 and 0.0112.
7.0 Concluding Implication and Future Research Direction
Studies on the causes of income differences between the rich and the poor have received an
extensive attention in the inequality empirics. While ethnic diversity has also been identified
as one of the fundamental causes of income inequality, the role of institutionsas a mediating
factor in the ethnicity-inequality nexus has not received the scholarly attention it deserves.
Accordingly, it is of policy relevance to assess how a policy variable (i.e. institutional
quality) can be employed to modulate the effect of ethnicity on inequality. This study
complements the existing literature by investigating the extent to which institutional
framework corrects the noisy influence originating from the nexus between“ethnic diversity”
and inequality in twenty-six SSA countries for the period 1996-2015.The empirical evidence
is based on pooled OLS, fixed effects and system GMM estimation techniques.
The study discovered that the direct influences of linguistic, religious and ethnic diversityon
inequality are inevitable in the region. Religion and ethnic diversity were found to be
statistically significant at their conventional levels. The findings also revealed that the
indirect influence fail to attenuate the level of income disparity within an interactive
regression framework. By implication, the adverse effects of the three components
ofdiversity remain intact when institution index and its interaction with diversity measures
are added. Two main policy implications can be inferred from the findings: (a) the
institutional infrastructures in the region have not been able to solve inequality problems
orchestrated by ethnic diversity. Therefore, there is need for the region to restructure the
institutional settings to tackle the byproducts of ethnic differences that are politically
motivated by selfish individuals or groups which threaten national unity. (b) Meaningful

31
gains from liberalization within and across the region, financial supports to the less-
privileged, high literacy and guaranteeing fair playing ground to all citizens will go a long
way to dampen uneven wealth distribution in the region.
It may not be surprising if institutions in SSA cannot effectively modulate the effect of ethnic
diversity on inequality. This is essentially because institutions instead of playing the role of
policy variables may reflect policy syndromes. In other words, institutions may reflect
negative signals instead of positive signals. This is essentially the case when the institutional
variables are negatively skewed. This narrative on the assimilation of negative skewness to a
policy syndrome is consistent with Asongu and Nwachukwu (2016d) who have predicted the
occurrence of the 2011 Arab Spring from institutional indicators in Africa that are negatively
skewed. In the light of this clarification, the role of institutions in modulating the effect of
ethnicity on inequality can be tailored to effectively reduce inequality by improving the
following factors that are not mutually exclusive: (a) the election and replacement of political
leaders (i.e. voice & accountability and political stability); (b) the formulation and
implementation of sound policies that deliver public commodities (i.e. government
effectiveness and regulation quality) and (c) the respect by the State and citizens of
institutions that govern interactions between them (i.e. corruption-control and the rule of law).
Future studies can use alternative measures of the variables of interest (i.e. institutional
quality, inequality and ethnic diversity) to assess whether the established findings withstand
further empirical scrutiny. Moreover, comparative studies within an intercontinental
framework would provide lessons from best performers to their least-performing counterparts.
Country-specific studies are also worthwhile for more targeted policy implications.
32
References
Ahlerup, P. & Olsson, O. (2009). The roots of ethnic diversity. Department of Economics,
Goteborg University.
Ajide,K.B.& Raheem, I. D. (2016). The institutional quality on remittances in the
ECOWASsub-region.African Development Review, 28(4), pp.462-481.
Alderson, A. S. & Nielsen, F. (2002). Globalization and the Great U-turn: Income inequality
trends in 16 OECD countries. American Journal of Sociology, 107, pp. 1244–99.
Alesina A., & La Ferrara, E., (2002). Who trust others?Journal of Public Economics, 85(2),
pp. 207-234.
Alesina, A. & La Ferrara, E. (2005). Ethnic diversity and economic performance.Journal of
Economic Literature, 63, 762-800.
Alesina, A., &Glaeser, E., (2004). Fighting poverty in the US and Europe. Oxford: Oxford
University Press.
Alesina, A., & La Ferrara, E., (2000). Participation in heterogeneous communities.Quarterly
Journal of Economics, 115(3), pp. 847-904.
Alesina, A., Devleeschauwer, A., Easterly, W., Kurlat, S. & Wacziarg, R. (2003).
Fractionalization. Journal of Economic Growth,8(2), pp.155-194.
Anyanwu, J. C. (2011). International remittances and income inequality in Africa.Review of
Economic and Business Studies, IV(1), pp. 117–48.
Anyanwu, J. C. (2013a). Gender equality in employment in Africa: Empirical analysis and
policy implications. African Development Review, 25(4), pp. 400-420.
Anyanwu, J. C. (2013b). The correlates of poverty in Nigeria and policy implications.African
Journal of Economic and Sustainable Development, 2(1), pp. 23-52.
Anyanwu, J. C., (2014a). Marital status, household size and poverty in Nigeria: Evidence
from the 2009/2010 survey data.African Development Review, 26(1), pp. 118-137.
Anyanwu, J. C. (2014b). Determining the correlates of poverty for inclusive growth in
Africa.European Economics Letters, 3(1), pp. 12-17.
Arellano, M., & Bond, S. (1991). Some tests of specification for panel data: Monte Carlo
evidence and an application to employment equations. The Review of Economic
Studies, 58, pp. 277–297.
Arellano, M., & Bover, O. (1995). Another look at the instrumental variable estimation of
error components models.Journal of Econometrics, 68(1), 29–52.
Asongu, S. A. & De Moor, L. (2017). “Financial globalisation dynamic thresholds for financial development: evidence from Africa”, The European Journal of Development
Research. 29(1), pp. 192-212.
Asongu, S. A. & Nwachukwu, J. C. (2016c). The mobile phone in the diffusion of knowledge
for institutional quality in Sub-Saharan Africa.World Development, 86, pp. 133–147.
Asongu, S. A. & Nwachukwu, J. C. (2016d). Revolution empirics: predicting the Arab Spring.
Empirical Economics, 51(2), pp. 439–482.
Asongu, S. A., &Asongu, N. (2018). The Comparative Exploration of Mobile Money
Services in Inclusive Development. International Journal of Social Economics, 45(1),
pp. 124-139.
33
Asongu, S. A., & Kodila-Tedika, O., (2018). Institutions and poverty: A critical comment
based on evolving currents and debates. Social Indicators Research. DOI:
10.1007/s11205-017-1709-y.
Asongu, S. A., & Nwachukwu, J. C. (2016a). The role of governance in mobile phones for
inclusive human development in sub-Saharan Africa. Technovation, 55-
56(September-October), pp. 1-13.
Asongu, S. A., & Nwachukwu, J. C. (2016b). Conditional linkages between iron ore exports,
foreign aid and terrorism.Mineral Economics, 29(2-3), pp. 57-70.
Asongu, S. A., & Nwachukwu, J. C. (2017a). ScienceDirectQuality of growth empirics:
Comparative gaps, benchmarking and policy syndromes.Journal of Policy Modeling,
39(2017), pp. 861-882.
Asongu, S. A., &Nwachukwu, J. C. (2017b). Fuel exports, aid and terrorism.Multinational
Business Review, 25(3), pp. 239-267.
Asongu, S. A., &Nwachukwu, J. C., (2018). Comparative human development thresholds for
absolute and relative pro-poor mobile banking in developing countries. Information
Technology & People. DOI: 10.1108/ITP-12-2015-0295.
Asongu, S. A., & Odhiambo, N. M., (2018). Mobile banking usage, quality of growth,
inequality and poverty in developing countries. Information Development. DOI:
10.1177/0266666917744006.
Asongu, S. A., Le Roux, S., & Biekpe, N. (2017). Environmental degradation, ICT and
inclusive development in sub-Saharan Africa. Energy Policy, 111(December), pp.
353–361.
Atsu, S., & Adams, F., (2015). Assessing the distributional effects of regulation in developing
countries.Journal of Policy Modeling, 37(5), pp. 713-725.
Baliamoune-Lutz, M., & Lutz, S., (2005). Rural-urban inequality in Africa: A panel study of
the effects of trade liberalization and financial deepening.Journal of African
Development, 7(1), 1-19.
Baliamoune-Lutz, M., & McGillivray, M., (2009). Does gender inequality reduce growth in
Sub-Saharan Africa and Arab countries?African Development Review, 21(2), pp. 224-
242.
Baliamoune-Lutz, M., (2007). Globalisation and gender inequality: Is Africa
different?Journal of African Economies, 16(2), pp. 301-348. 39.
Baltagi, B. H. (2008). Forecasting with panel data. Journal of Forecasting, 27(2), pp. 153–173.
Barr, A. & Oduro, A., (2002). Ethnic Fractionalization in an African Labour Market. Journal
of Development Economics, 68, pp. 355-379.
Barro, R. J. (2000). Inequality and growth in a panel of countries.Journal of Economic
Growth, 5(1),pp. 5–32.
Becker, G. S., (1957). The economics of discrimination: University of Chicago press.
Blundell, R., & Bond, S., (1998). Initial conditions and moment restrictions in dynamic panel
data models.Journal of Econometrics, 87(1), pp. 115–143.
34
Bobo, L. & Hutchings, V.L. (1996). Perceptions of racial group competition: extending
Blumer’s theory of group position to a multiracial social context. American
Sociological Review, 61(6), pp. 951-72.
Bobo, L. & Kluegel, J.R. (1993). Opposition to race targeting: self interest, stratification
ideology, or racial attitudes.American Sociological Review, 58(4), pp. 443-64.
Bond, S., Hoeffler, A., & Tample, J. (2001). GMM estimation of empirical growth models.
University of Oxford.
Brambor, T., Clark, W. M., & Golder, M., (2006). Understanding interaction models:
Improving empirical analyses.Political Analysis, 14(1), pp. 63–82.
Buccellato, T. & Alessandrini, M. (2009). Natural resources: A blessing or a curse? The role
of inequality. Discussion Paper 98, SOAS, University of London, October.
Buhaug, H., (2006). Relative capability and Rebel objective in Civil War”, Journal of Peace
Research, 43(6), pp. 691-708.
Claus, I., J. Martinez-Vazquez & Vulovic, V. (2012). Government fiscal policies and
redistribution in Asian countries. ADB Economics Working Paper Series No. 310,
Asian Development Bank, Manila.
Crenshaw, E. & Ameen, A. (1994). The distribution of income across national populations:
Testing multiple paradigms. Social Science Research, 23, pp. 1–22.
Dabla-Norris, E., Kochhar, K., Suphaphiphat, N., Ricka, F., & Tsounta, E. (2015). Causes
and consequences of income inequality: A global perspective. IMF Staff Discussion
Note SDN/15/13, June.
Deaton, A. & Paxson, C. (1997). The effects of economic and population growth on national
saving and inequality. Demography, 34, pp. 97–114.
Desmet, K., Ortuño-Ortín, I. & Wacziarg, R. (2012). The political economy of linguistic
cleavages. Journal of Development Economics, 97(2), pp. 322–338.
Dincer, O. C. & Gunalp, B. (2012). Corruption and income inequality in the United
States.Contemporary Economic Policy, 30(2), pp. 283–92.
Dincer, O. C., & Hotard, J. M. (2011). Ethnic and religious diversity and income
inequality.Eastern Economic Journal, 37, pp. 417-430.
Dincer, O. C., & Lambert, P. J. (2012). Taking care of your own: ethnic and religious
heterogeneity and income inequality. Journal of Economic Studies, 39(3), pp. 290-313.
Dreher, A., Gaston, N., & Martens, P., (2008). Measuring globalisation: Gauging its
consequences. Springer Science & Business Media.
Easterly, W. (2001). Can institutions resolve ethnic conflicts? Economic Development and
Cultural Change, 49, 687-706.
Easterly, W., & Levine, R. (1997). Africa’s growth tragedy: Policies and ethnic
divisions.Quarterly Journal of Economics, 112(4), pp. 1203-50.
Elu, J., & Loubert, L. (2013).Earnings inequality and the intersectionality of gender and
ethnicity in Sub-Saharan Africa: The case of Tanzanian manufacturing.American
Economic Review, Papers and Proceedings 04/2013, 103(103), pp. 289-292.
Fosu, A. K., (2010b). Does inequality constrain poverty reduction programs? Evidence from
Africa. Journal of Policy Modeling, 32(6), pp. 818-827.
35
Fosu, A. K., (2010c). Inequality, income and poverty: Comparative global evidence.Social
Sciences Quarterly, 91(5), pp. 1432-1446.
Fosu, A. K., (2011). Growth, inequality and poverty reduction in developing countries:
Recent Global evidence. UNU WIDER Working Paper No. 2011/01, Helsinki.
Glaeser, E.L.(2005). Inequality.HIER Discussion Paper 2078.
Gosavi, A., (2017). Can mobile money help firms mitigate the problem of access to finance
in Eastern sub-Saharan Africa. Journal of African Business. DOI:
10.1080/15228916.2017.1396791.
Guordon, J., Maystre, N. &Melo J., (2006). Openness, inequality and poverty: Endowment
matter” EUND/WP 2006-12.
Hammoris, S. & Kai, H., (2004). Globalisation, financial depth and inequality in Sub-
Saharan Africa. Working Paper Series 67, Department of Economics, University of
Ethiopia.
Heinrich, A., (2009). National symbol, globalisation and the well-being of nations. MPRA
Paper No 14882. Available online at http://mpra.ub.uni-muenchen.de/14882/
Hotard, M. (2008). Differences Lead to Differences: Diversity and Income Inequality Across
Countries (2008). Master’s Thesis-Economics, Paper 13.
IMF (2007). World Economic Outlook: Globalization and inequality. October, IMF,
Washington DC.
Kimenyi, M. S., (2006). Ethnicity, governance and the provision of public goods. Journal of
African Economies, 15(Suppl. 1), pp 62-99.
Kuznets, S. (1955). Economic growth and income inequality.American Economic Review,
Vol. 45, (March), pp. 1–28.
Liu, Q. &Lawell, C-Y. C. L. (2015). The effects of innovation on income inequality in
China.Available athttp://www.des.ucdavis.edu/faculty/Lin/China_innovation_
inequality_paper.pdf
Love, I., & Zicchino, L. (2006). Financial development and dynamic investment behaviour:
Evidence from panel VAR. The Quarterly Review of Economics and Finance, 46(2),
pp. 190–210.
Luttmer, E. F. P., (2001). Group loyalty and the taste for redistribution.Journal of Political
Economy, 109(3), pp. 500-528.
Mallaye, D., Yogo, T. U., & Timba, G. T. (2014). Oil rent and income inequality in
developing economies: Are they friends or foes?Available at
https://editorialexpress.com/cgibin/conference/download.cgi?db_name¼CSAE2014&
paper_id¼197
Michalopoulos, S. (2008). The origins of ethnolinguistic diversity: Theory and evidence.
Department of Economics, Tufts University.
Miguel, E., &Gugerty, M. K. (2005). Ethnic diversity, social sanctions, and public goods in
Kenya.Journal of Public Economics, 89(11–12), pp. 2325-2368.
Milanovic, B. (2003). Is inequality in Africa really different? World Bank Policy Research
Working Paper No. WPS3169.
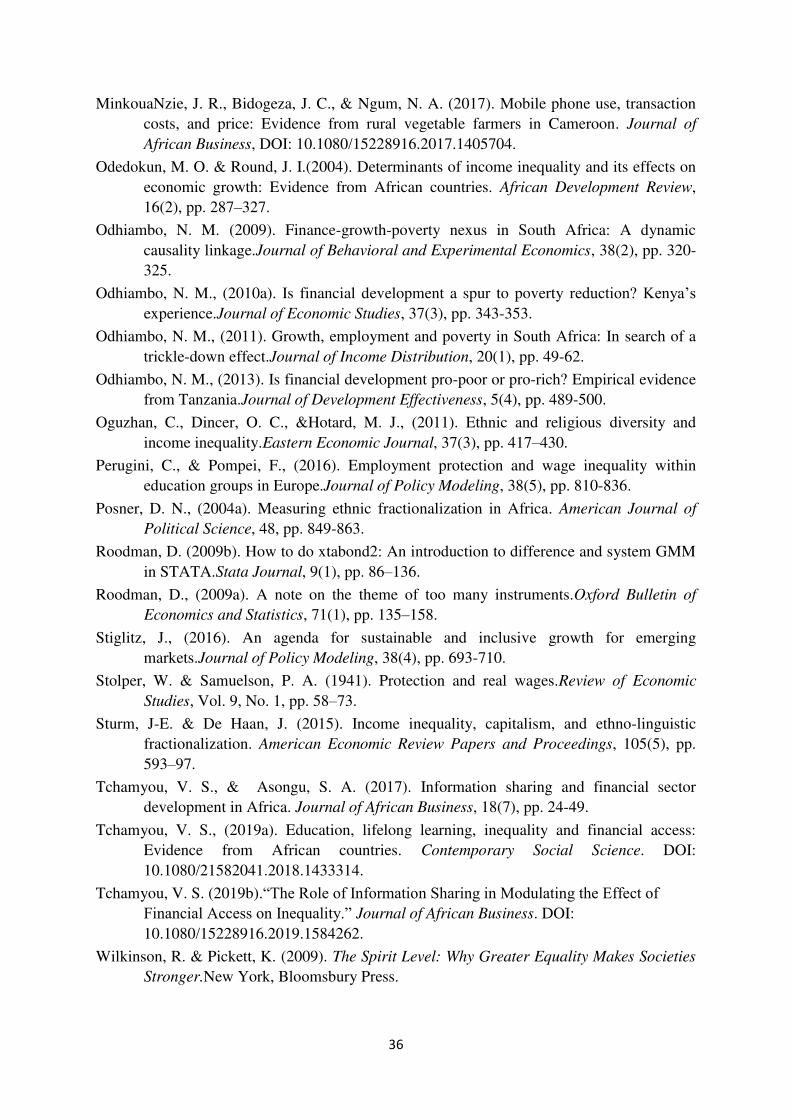
36
MinkouaNzie, J. R., Bidogeza, J. C., & Ngum, N. A. (2017). Mobile phone use, transaction
costs, and price: Evidence from rural vegetable farmers in Cameroon. Journal of
African Business, DOI: 10.1080/15228916.2017.1405704.
Odedokun, M. O. & Round, J. I.(2004). Determinants of income inequality and its effects on
economic growth: Evidence from African countries. African Development Review,
16(2), pp. 287–327.
Odhiambo, N. M. (2009). Finance-growth-poverty nexus in South Africa: A dynamic
causality linkage.Journal of Behavioral and Experimental Economics, 38(2), pp. 320-
325.
Odhiambo, N. M., (2010a). Is financial development a spur to poverty reduction? Kenya’s experience.Journal of Economic Studies, 37(3), pp. 343-353.
Odhiambo, N. M., (2011). Growth, employment and poverty in South Africa: In search of a
trickle-down effect.Journal of Income Distribution, 20(1), pp. 49-62.
Odhiambo, N. M., (2013). Is financial development pro-poor or pro-rich? Empirical evidence
from Tanzania.Journal of Development Effectiveness, 5(4), pp. 489-500.
Oguzhan, C., Dincer, O. C., &Hotard, M. J., (2011). Ethnic and religious diversity and
income inequality.Eastern Economic Journal, 37(3), pp. 417–430.
Perugini, C., & Pompei, F., (2016). Employment protection and wage inequality within
education groups in Europe.Journal of Policy Modeling, 38(5), pp. 810-836.
Posner, D. N., (2004a). Measuring ethnic fractionalization in Africa. American Journal of
Political Science, 48, pp. 849-863.
Roodman, D. (2009b). How to do xtabond2: An introduction to difference and system GMM
in STATA.Stata Journal, 9(1), pp. 86–136.
Roodman, D., (2009a). A note on the theme of too many instruments.Oxford Bulletin of
Economics and Statistics, 71(1), pp. 135–158.
Stiglitz, J., (2016). An agenda for sustainable and inclusive growth for emerging
markets.Journal of Policy Modeling, 38(4), pp. 693-710.
Stolper, W. & Samuelson, P. A. (1941). Protection and real wages.Review of Economic
Studies, Vol. 9, No. 1, pp. 58–73.
Sturm, J-E. & De Haan, J. (2015). Income inequality, capitalism, and ethno-linguistic
fractionalization. American Economic Review Papers and Proceedings, 105(5), pp.
593–97.
Tchamyou, V. S., & Asongu, S. A. (2017). Information sharing and financial sector
development in Africa. Journal of African Business, 18(7), pp. 24-49.
Tchamyou, V. S., (2019a). Education, lifelong learning, inequality and financial access:
Evidence from African countries. Contemporary Social Science. DOI:
10.1080/21582041.2018.1433314.
Tchamyou, V. S. (2019b).“The Role of Information Sharing in Modulating the Effect of Financial Access on Inequality.” Journal of African Business. DOI:
10.1080/15228916.2019.1584262.
Wilkinson, R. & Pickett, K. (2009). The Spirit Level: Why Greater Equality Makes Societies
Stronger.New York, Bloomsbury Press.
37
Yunker, J. A., (2016). Economic inequality and optimal redistribution: A theoretical and
empirical analysis. Journal of Policy Modeling, 38(3), pp. 528-552.
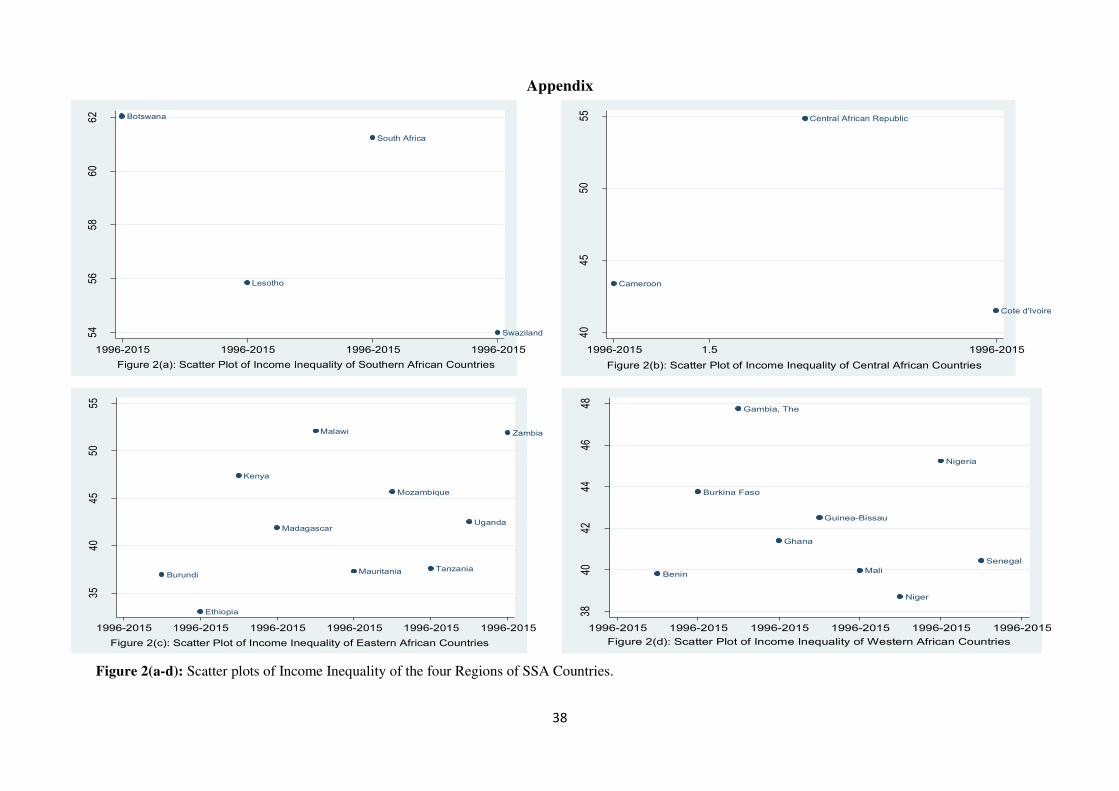
38
Appendix
Figure 2(a-d): Scatter plots of Income Inequality of the four Regions of SSA Countries.
Botswana
Lesotho
South Africa
Swaziland54
56
58
60
62
1996-2015 1996-2015 1996-2015 1996-2015
Figure 2(a): Scatter Plot of Income Inequality of Southern African Countries
Cameroon
Central African Republic
Cote d'Ivoire
40
45
50
55
1996-2015 1996-20151.5
Figure 2(b): Scatter Plot of Income Inequality of Central African Countries
Burundi
Ethiopia
Kenya
Madagascar
Malawi
Mauritania
Mozambique
Tanzania
Uganda
Zambia
3540
4550
55
1996-2015 1996-2015 1996-2015 1996-2015 1996-2015 1996-2015
Figure 2(c): Scatter Plot of Income Inequality of Eastern African Countries
Benin
Burkina Faso
Gambia, The
Ghana
Guinea-Bissau
Mali
Niger
Nigeria
Senegal
3840
4244
4648
1996-2015 1996-2015 1996-2015 1996-2015 1996-2015 1996-2015
Figure 2(d): Scatter Plot of Income Inequality of Western African Countries
Related Documents