Ethnic diversity and economic development Jose G. Montalvo a, * , Marta Reynal-Querol b a Department of Economics, Universitat Pompeu Fabra and IVIE, C/ Ramon Trias Fargas 25–27, Barcelona 08005, Spain b The World Bank and IAE, Barcelona, Spain Received 1 January 2002; accepted 1 January 2004 Abstract This paper analyzes the role that different indices and dimensions of ethnicity play in the process of economic development. Firstly, we discuss the advantages and disadvantages of alternative data sources for the construction of indices of religious and ethnic heterogeneity. Secondly, we compare the index of fractionalization and the index of polarization. We argue that an index of the family of discrete polarization measures is the adequate indicator to measure potential conflict. We find that ethnic (religious) polarization has a large and negative effect on economic development through the reduction of investment and the increase of government consumption and the probability of a civil conflict. D 2004 Published by Elsevier B.V. JEL classification: O11; Z12; O55 Keywords: Polarization indices; Conflict; Religious and ethnic diversity; Economic growth 1. Introduction In recent years, there has been increasing interest in the economic consequences of ethnic heterogeneity. In many situations, ethnic polarization generates conflicts that could eventually lead to political instability and civil wars (CW), with long-lasting economic effects. In other cases, the potential conflict represented by an ethnically polarized society 0304-3878/$ - see front matter D 2004 Published by Elsevier B.V. doi:10.1016/j.jdeveco.2004.01.002 * Corresponding author. Tel.: +34 93 5422509; fax: +34 93 5421746. E-mail address: [email protected] (J.G. Montalvo). Journal of Development Economics 76 (2005) 293 – 323 www.elsevier.com/locate/econbase

Welcome message from author
This document is posted to help you gain knowledge. Please leave a comment to let me know what you think about it! Share it to your friends and learn new things together.
Transcript
Journal of Development Economics 76 (2005) 293–323
www.elsevier.com/locate/econbase
Ethnic diversity and economic development
Jose G. Montalvoa,*, Marta Reynal-Querolb
aDepartment of Economics, Universitat Pompeu Fabra and IVIE, C/ Ramon Trias Fargas 25–27,
Barcelona 08005, SpainbThe World Bank and IAE, Barcelona, Spain
Received 1 January 2002; accepted 1 January 2004
Abstract
This paper analyzes the role that different indices and dimensions of ethnicity play in the process of
economic development. Firstly, we discuss the advantages and disadvantages of alternative data
sources for the construction of indices of religious and ethnic heterogeneity. Secondly, we compare the
index of fractionalization and the index of polarization. We argue that an index of the family of discrete
polarization measures is the adequate indicator to measure potential conflict. We find that ethnic
(religious) polarization has a large and negative effect on economic development through the reduction
of investment and the increase of government consumption and the probability of a civil conflict.
D 2004 Published by Elsevier B.V.
JEL classification: O11; Z12; O55
Keywords: Polarization indices; Conflict; Religious and ethnic diversity; Economic growth
1. Introduction
In recent years, there has been increasing interest in the economic consequences of
ethnic heterogeneity. In many situations, ethnic polarization generates conflicts that could
eventually lead to political instability and civil wars (CW), with long-lasting economic
effects. In other cases, the potential conflict represented by an ethnically polarized society
0304-3878/$ -
doi:10.1016/j.
* Corresp
E-mail add
see front matter D 2004 Published by Elsevier B.V.
jdeveco.2004.01.002
onding author. Tel.: +34 93 5422509; fax: +34 93 5421746.
ress: [email protected] (J.G. Montalvo).
J.G. Montalvo, M. Reynal-Querol / Journal of Development Economics 76 (2005) 293–323294
can affect negatively the rate of investment and induce rent-seeking behavior that increases
public consumption. These situations—armed conflicts, reduced investment, or higher
government consumption—have been shown to have a negative effect on economic
development (Barro, 1991; Tavares and Wacziarg, 2001).
This paper analyzes the effects of ethnic heterogeneity on economic development. For
this purpose, we compare the empirical performance of different dimensions of ethnicity
as well as alternative indices to measure diversity and potential conflict. There is a
growing body of literature on the relationship between ethnic diversity, the quality of
institutions, and economic growth. Mauro (1995) shows that a high level of ethno-
linguistic diversity implies a lower level of investment. Easterly and Levine (1997) show
that ethnic diversity has a direct negative effect on economic growth. La Porta et al. (1999)
suggest that ethnic diversity is one of the factors explaining the quality of government.
Bluedorn (2001), based on the study of Easterly and Levine (1997), presents empirical
evidence of democracy’s positive role in ameliorating the negative growth effects of ethnic
diversity. All these studies use the index of ethnolinguistic fractionalization (ELF), also
called ELF, calculated using the data of the Atlas Narodov Mira (Taylor and Hudson,
1972).
More recently, the economic research agenda on ethnic diversity has studied the
relationship between religious diversity, democracy, and economic development. Barro
(1997a,b) includes the proportion of population affiliated to each religious group as
explanatory variables for the level of democracy. Tavares and Wacziarg (2001) use the
index of ethnolinguistic fractionalization and religious dummies to examine the indirect
channels for the effect of democracy on growth. With a few exceptions, they find that
the religious dummies have no effect on the basic channels. Collier and Hoeffler
(2002) find that religious fractionalization has no effect on the risk of conflict. Alesina
et al. (2003) argue that while ethnic and linguistic fractionalization have a negative
effect on the quality of government, religious fractionalization has no effect. They also
find that religious diversity has no effect on growth, using the basic regression of
Easterly and Levine (1997). Therefore, the general result is that religious diversity,
measured as a fractionalization index, has no effect on economic growth or quality of
government.
However, both ethnolinguistic and religious diversity can potentially have a strong
conflict dimension. For this reason, we propose a new measure of potential conflict in
heterogeneous societies based on an index of polarization instead of the traditional
fractionalization index. Several authors have argued theoretically in terms of bpolarizationQbut used as an empirical proxy the index of fractionalization. We argue that polarization
and fractionalization are two different, and on occasion, conflicting concepts. We also
show how to derive our polarization index as the representation of the total resources
devoted to lobbying in a simple rent-seeking model.
Given the importance of the conflict dimension of ethnic and religious diversity, we
explore empirically the indirect effects of ethnolinguistic and religious polarization on
growth through their impact on civil wars, investment, and government consumption.
Civil wars are tragic events for economic development having a long-run impact on
income per capita. Consistent with previous research, we find that religious fractionaliza-
tion has no direct effect on economic growth, while ethnolinguistic fractionalization does.
J.G. Montalvo, M. Reynal-Querol / Journal of Development Economics 76 (2005) 293–323 295
However, we find no strong empirical evidence to argue that the negative effect of
fractionalization on growth is due to its impact on the indirect channels above mentioned.
By contrast, we do find an important effect of polarization in the explanation of economic
development, through its impact on civil wars, the rate of investment, and the proportion
of government consumption over GDP. In fact, the indirect effect of polarization on
economic growth is as large as the direct effect of fractionalization.
The paper is organized as follows. Section 2 describes the sources for the data on
ethnolinguistic and religious diversity. Section 3 introduces the indices of fractionalization
and polarization and compares their basic properties. Section 3 also shows how to derive
the discrete polarization index from a simple rent-seeking model. Section 4 reports the
empirical results obtained by using the alternative indices and dimensions of ethnicity.
Section 5 concludes.
2. The measurement of religious and ethnic diversity
In this section, we present the criteria for the selection of the basic data on religious and
ethnic diversity for a large sample of countries. We describe the alternative sources
available as well as their differences and relative strengths and weaknesses. We should
initially notice that the measurement of ethnic diversity is a very difficult task.
Characteristics like braceQ or bcolorQ are, to some extent, socially constructed. For
instance, Williamson (1984)1 points out that in the antebellum South bthere were some
people that were significantly black, visibly black, known to be black, but by the law of
the land and the rulings of the courts had the privileges of whitesQ. We do agree that racial
and ethnic identities are, to some extent, fluid. However, there are not good data on the
degree of bfluidityQ of races and ethnic groups with the exception of a few countries and
cases. Because we want to study the effect of ethnic diversity in a large set of countries,
we adopt a definition of ethnicity based on a purely biological or genetic point of
view.2
2.1. Sources for the measurement of religious diversity
One of the most cited sources of data for religious diversity across countries is Barret’s
(1982) World Christian Encyclopedia (WCE), which provides information for a large
cross-section of countries in 1970, 1975, and 1980. The WCE has several well-known
shortcomings when dealing with data on religion.3 For instance, this source does not
compute the followers of Syncretic cults4 in Latin American countries. In addition, it
underreports, by comparison with national sources, the followers of Animist cults and
1 Quote taken from Bodenhorn and Ruebeck (2003).2 Even using this definition of ethnicity, it is very difficult to find good estimates of the size of ethnic groups
in many countries.3 See L’Etat des Religions dans le Monde (1987) pages 7–9.4 Syncretic cults combine elements from different cults like Yourba, baKongo, and Catholic rites. These
religions include Santeria, Voodoo, or Espiritismo.
J.G. Montalvo, M. Reynal-Querol / Journal of Development Economics 76 (2005) 293–323296
primitive religions5 in Sub-Saharan African countries. In some countries, particularly in
Latin America and Sub-Saharan Africa, part of the population is affiliated with a large
religion although they practice another religion. This is because the WCE counts as
Christians people who follow authocton religions, like animism or syncretic cults, possibly
because they have received baptism or because they live in a region with missions.
However, this treatment is not consistent with Wilson (1972): magical ideas persist among
some people of long-settled Christian areas. Following this approach, the followers of
primitive religions should not be counted as Christians because primitive religions also
identify a particular group.6
When compared to other sources of information on religions affiliation, the WCE data
seem clearly biased, not surprisingly, toward Christian religion. For example, in the case of
Zaire, the WCE reports a distribution of religions very similar to that of Spain or Italy. The
distribution of religious groups reported by the WCE between 1970 and 1980 is quite
stable in many countries. The countries where there is a change coincide with those with a
high proportion of Animists, as reported by national sources, and the change usually
implies an increase in the percentage of Christians. For all these reasons, we believe that
the data from the WCE has to be cross-checked with other sources before using it to
construct a religious indicator.
A second source for data on religious affiliation by countries is the Encyclopedia
Britannica (EB) and, in particular, the Britannica World Data (BWD). The EB provides
statistical information on 220 countries including data on population, social indicators,
agriculture, labor, manufacturing, trade, finance, transportation, etc. It also includes, as
part of the social indicators, the religious distribution of the society. The BWD uses the
bbest available figures, which can be census data, membership figures of the churches
concerned, or estimates by external analystsQ. However, it uses as the basic source the
WCE and, therefore, it is subject to most of the same biases. There are several examples in
the economic literature where the EB is used as the source to construct religious variables.
Tavares and Wacziarg (2001) rely on it to construct dummy variables for the largest
religion in each country. Recently, Alesina et al. (2003) used the EB data to construct an
index of religious fractionalization.
A third source of data on religious diversity is ’l’Etat des Religions Dans le
MondeQ(ET). The ET contains information from the World Christian Encyclopedia, and
then corrected using national sources. The ET considers explicitly the proportion of
Animist followers (mainly in Sub-Saharan African countries) and the proportion of
Syncretic cult followers (specially in Latin American countries).
There are two other sources of religious diversity that provide limited information on
religious followers based on national sources: The Statesman’s Yearbook, and the World
Factbook. The proportions of Animist and Syncretic cults followers reported by these two
5 Many primitive religions are associated with animism, the belief that everything (rocks, rivers, plants,
animals, and so forth) has an banimaQ, or spirit, that can help or hurt people, including the souls of the dead.
Animists frequently convert animals or stars in Gods and practice astrology and witchcraft using magic,
talismans, or charms.6 In fact, as discussed later, other data sources are very careful about categorizing followers of primitive
religions.
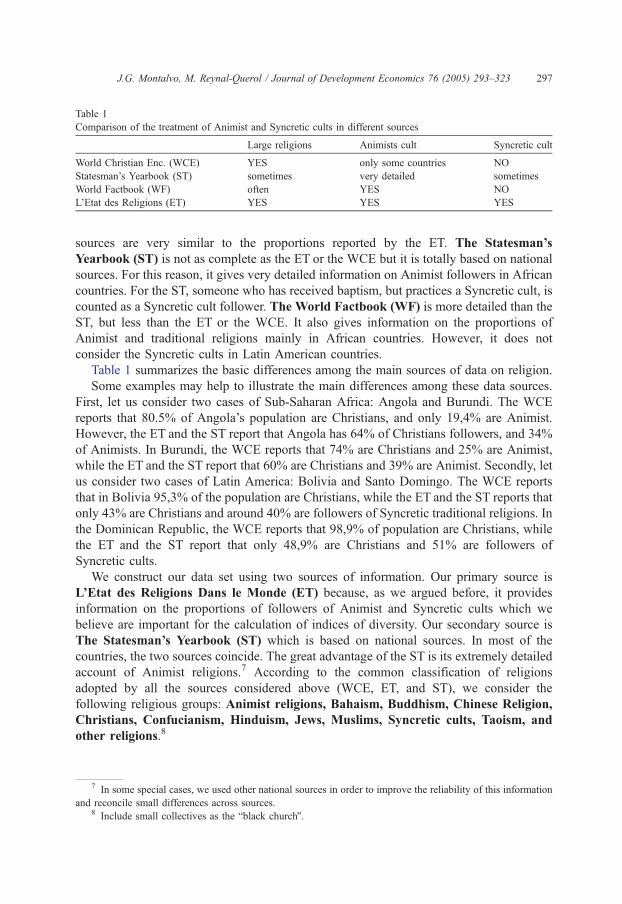
Table 1
Comparison of the treatment of Animist and Syncretic cults in different sources
Large religions Animists cult Syncretic cult
World Christian Enc. (WCE) YES only some countries NO
Statesman’s Yearbook (ST) sometimes very detailed sometimes
World Factbook (WF) often YES NO
L’Etat des Religions (ET) YES YES YES
J.G. Montalvo, M. Reynal-Querol / Journal of Development Economics 76 (2005) 293–323 297
sources are very similar to the proportions reported by the ET. The Statesman’s
Yearbook (ST) is not as complete as the ET or the WCE but it is totally based on national
sources. For this reason, it gives very detailed information on Animist followers in African
countries. For the ST, someone who has received baptism, but practices a Syncretic cult, is
counted as a Syncretic cult follower. The World Factbook (WF) is more detailed than the
ST, but less than the ET or the WCE. It also gives information on the proportions of
Animist and traditional religions mainly in African countries. However, it does not
consider the Syncretic cults in Latin American countries.
Table 1 summarizes the basic differences among the main sources of data on religion.
Some examples may help to illustrate the main differences among these data sources.
First, let us consider two cases of Sub-Saharan Africa: Angola and Burundi. The WCE
reports that 80.5% of Angola’s population are Christians, and only 19,4% are Animist.
However, the ET and the ST report that Angola has 64% of Christians followers, and 34%
of Animists. In Burundi, the WCE reports that 74% are Christians and 25% are Animist,
while the ET and the ST report that 60% are Christians and 39% are Animist. Secondly, let
us consider two cases of Latin America: Bolivia and Santo Domingo. The WCE reports
that in Bolivia 95,3% of the population are Christians, while the ET and the ST reports that
only 43% are Christians and around 40% are followers of Syncretic traditional religions. In
the Dominican Republic, the WCE reports that 98,9% of population are Christians, while
the ET and the ST report that only 48,9% are Christians and 51% are followers of
Syncretic cults.
We construct our data set using two sources of information. Our primary source is
L’Etat des Religions Dans le Monde (ET) because, as we argued before, it provides
information on the proportions of followers of Animist and Syncretic cults which we
believe are important for the calculation of indices of diversity. Our secondary source is
The Statesman’s Yearbook (ST) which is based on national sources. In most of the
countries, the two sources coincide. The great advantage of the ST is its extremely detailed
account of Animist religions.7 According to the common classification of religions
adopted by all the sources considered above (WCE, ET, and ST), we consider the
following religious groups: Animist religions, Bahaism, Buddhism, Chinese Religion,
Christians, Confucianism, Hinduism, Jews, Muslims, Syncretic cults, Taoism, and
other religions.8
7 In some special cases, we used other national sources in order to improve the reliability of this information
and reconcile small differences across sources.8 Include small collectives as the bblack churchQ.
J.G. Montalvo, M. Reynal-Querol / Journal of Development Economics 76 (2005) 293–323298
2.2. Data on ethnolinguistic diversity
From a descriptive perspective, there are six distinct characteristics of an individual that
matter for ethnolinguistic classification. Two of them (race and color) are inherited
whereas two (culture and language) are learned. The fifth characteristic (the ethnic origin)
is more difficult to define and refers to the main name by which people are known. Finally,
the sixth component (nationality) may be inherited or acquired and, by contrast with the
other characteristics, can be changed. From these six characteristics, the ones that are
clearly defined and more useful for classification purposes are race and language.9
However, the fact that language and race overlap in many instances complicates the
task of generating an uncontrovertible classification.
As in the case of religion, there are several possible sources of data for ethnolinguistic
diversity across countries. One of the most detailed sources of data on ethnic diversity is
the World Christian Encyclopedia (WCE) which presents a classification that is neither
purely racial nor linguistic nor cultural, but ethnolinguistic. The WCE classification is
based on the various extant schemes of nearness of languages plus nearness of racial,
ethnic, cultural, and cultural-area characteristics.10 It combines race, language, and culture
in a single classification, denominated ethnolinguistic, that includes several progressively
more detailed levels: 5 major races, 7 colors, 13 geographical races and 4 subraces, 71
ethnolinguistic families11, 432 major peoples12, 7010 distinct languages, 8990 subpeoples,
and 17,000 dialects. It is difficult to be consistent in the classification of ethnic groups at
the global scale because in different countries their respective censuses have different
emphasis on each dimension of ethnicity. The main criteria adopted by the WCE in
ambiguous situations is the answer of each person to the question: bWhat is the first, or
main, or primary ethnic or ethnolinguistic term by which persons identify themselves, or
are identified by people around them?Q.The WCE details for each country the most diverse classification level. In some
countries, the most diverse classification may coincide with races, while in others, could
be subpeoples. Vanhanen (1999) argues that it is important to take into account only the
most important ethnic divisions and not all the possible ethnic differences or groups. He
uses an informal measure of genetic distance to separate different degrees of ethnic
cleavage. The proxy for genetic distance is bthe period of time that two or more compared
groups have been separated from each other, in the sense that intergroup marriage has been
very rare. The longer the period of endogamous separation the more groups have had time
to differentiate.Q Following Vanhanen (1999) and most of the literature, we consider the
ethnolinguistic families as the relevant level of disaggregation. Therefore, for the countries
9 Notice that, strictly speaking, when we described in the previous section the classification of religions, we
already considered a cultural characteristic.10 For more information, see the World Christian Encyclopedia (1982), pages 107–115. Because the
ethnolinguistic classification is not based on religion, there is less concern than in the case of religious diversity
about possible biases of the WCE in the proportion of different groups.11 An ethnolinguistic family refers to an ethnic or racial group speaking its own language or mother (primary)
tongue, excluding near variants and dialect.12 These correspond to subfamilies or ethnic cultural areas.
J.G. Montalvo, M. Reynal-Querol / Journal of Development Economics 76 (2005) 293–323 299
in which the WCE reports proportions of groups of peoples or subpeoples, we aggregate
them into ethnolinguistic families.13
Another source of data on ethnic diversity is the Encyclopedia Britannica (EB) which
uses the concept of geographical race.14 However, the EB does not provide a precise
explanation of the criteria to separate the different groups, nor does it describe any concept
of cultural distance. A third source of data on ethnolinguistic diversity is provided by the
Atlas Narodov Mira (1964), the result of a large project of the Department of Geodesy and
Cartography of the State Geological Committee of the old USSR. The classification
adopted by the Atlas is based on geographical ethnolinguistic groups. For this reason, in
some countries, the Atlas classifies at the same level what we have called ethnolinguistic
families and subgroups of those families (what the WCE refers as peoples), which are
separated geographically.
2.3. Other sources of data on ethnic heterogeneity
Recently, several authors have proposed specific combination of basic sources on
ethnic heterogeneity to construct indices of fractionalization. Fearon (2003) discusses
conceptual and practical problems involved in constructing a cross-national list of ethnic
groups and presents a database of ethnic and cultural fractionalization. His basic sources
are the CIA’s World Factbook that he compares with the figures in the Encyclopedia
Britannica (EB) and the Library of Congress Country Study (LCCS). Fearon (2003)
notices significant discrepancies between these sources, especially with the figures of the
World Factbook for Latin American and African countries. He proposes to overcome these
problems using national sources. This strategy is similar to the role of the WCE, which is
totally based on national sources, in our own dataset.
Fearon (2003) goes one step forward and constructs a measure of cultural diversity,
introducing measures of distances among groups. It is reasonable to think that the distance
across all ethnic groups is not the same. However, the measurement of such distances is
very difficult and, at times, somehow arbitrary. For these reasons, Fearon (2003) points out
that the list he offers should be seen as a continual work in progress to be improved with
more country specific expertise. As we argued before, we do not consider specific
distances across groups in out dataset. We believe that the measurement error can be
reduced by following Vanhanen’s (1999) criterion which identifies the relevant ethnic
divisions.
Alesina et al.(2003) distinguish between ethnic, linguistic, and religious groups. The
descriptive statistics of the ethnic measure of Alesina et al. (2003) look broadly similar to
the ethnic measure of Fearon (2003) despite the different criteria in data gathering and
index construction. The data on languages and religions of Alesina et al. (2003) are based
exclusively on the information in the Encyclopedia Britannica. The main criterion in their
13 We cross-checked the proportion of the largest ethnolinguistic families with Vanhanen (1999) and the
World Factbook when there was need for aggregation of ethnolinguistic peoples into ethnolinguistic families.14 In the next section, we show that the indices constructed using the EB and the WCE have a high
correlation and produce similar results.
J.G. Montalvo, M. Reynal-Querol / Journal of Development Economics 76 (2005) 293–323300
construction of the list of ethnic groups is to reach the highest level of disaggregation15,
which requires the use of multiple sources of data. Alesina et al. (2003) used the
information in the Encyclopedia Britannica (2001), the CIA (2000), Levinson (1998), and
Minority Rights Group International (1997). The main differences between these data and
our data have to do with the level of disaggregation of ethnic groups. While we follow
Vanhaven in order to identify the relevant level of disaggregation, Alesina et al. (2003)
capture the more disaggregated level.16
3. Measuring ethnic diversity: polarization versus fractionalization
We have identified different dimensions or concepts of ethnicity and sources of data.
Once a researcher has decided what dimension, or dimensions, of ethnicity to analyze, the
next step is to decide what kind of indicator to use. One way to summarize the information
is to construct a dummy that captures the largest ethnic group in each country, or the
percentage of the largest ethnic group or the percentage of the largest ethnic minority in the
country. However, if we are interested in measuring religious and ethnic heterogeneity
within countries, these measures are far from perfect. Researchers have generally used two
types of synthetic indices in order to capture religious and ethnic diversity: indices of
fractionalization and indices of polarization. The choice of the most appropriate index
depends on the purpose of the study, the dimension analyzed, and the effect that one wants
to capture. In this section, we discuss the selection of a single index to capture religious
and ethnic heterogeneity in order to analyze the relationship between potential ethnic
conflict and economic development.
3.1. The index of fractionalization
Most of the empirical literature on ethnic diversity uses the index of fractionalization.
Perhaps the most famous and widely used is the index of ethnolinguistic fractionalization,
also called ELF, constructed by Taylor and Hudson (1972) using the data of the Atlas
Nadorov Mira. A fractionalization index, FRAC, is defined as
FRAC ¼ 1�XNi¼1
p2i ð1Þ
where, if we consider religious (or ethnic) diversity, pi is the proportion of people who
professes religion i (or belongs to ethnic group i). Basically, this indicator can be
interpreted as measuring the probability that two randomly selected individuals in a
country will belong to different ethnolinguistic groups. Therefore, FRAC increases when
the number of groups increases.
15 Alesina et al. (2003), page 160.16 The next section compares the correlation of indices of fractionalization and polarization constructed using
alternative sources of data.
J.G. Montalvo, M. Reynal-Querol / Journal of Development Economics 76 (2005) 293–323 301
3.2. Polarization indices
Another class of indices is the family of polarization measures. Montalvo and Reynal-
Querol (2002) used an index that measured the normalized distance of a particular
distribution of ethnic and religious groups from a bimodal distribution, originally
constructed in Reynal-Querol (1998).
Q ¼ 1�XNi¼1
0:5� pi
0:5
� �2
pi ¼ 4XNi¼1
Xjpi
p2i pj
There are at least two different approaches to justify the appropriateness of the Q index
in the context of polarization and conflict. The Q index can be seen as a polarization
measure related to the class of measures proposed by Esteban and Ray (1994). The basic
idea of the axiomatic approach in Esteban and Ray (1994) is to conceptualize an index
closely related to the concept of social tensions. This is useful in our context because, as
we argued before, ethnic and religious differences may generate very conflictive situations.
The measure of polarization of Esteban and Ray (1994) is
P p; y; k; að Þ ¼ kXNi¼1
Xjpi
p1þai pjjyi � yjj
where the pVs are the sizes of each group in proportion to the total population, the term
|yi�yj| measures the distance between two groups, i and j, and a and k are two parameters.
If we want to calculate ethnic (religious) polarization using the index P, we need to
calculate the distance between different ethnic (religious) groups, which is a very difficult
task compared to what happens in the case of income or wealth. For this reason, in order to
obtain a measure of ethnic (religious) polarization, Montalvo and Reynal-Querol (2002)
assume that the absolute distance between two groups is equal. Therefore, because
distances are equal among all groups, the polarization measures only depend on the size of
the groups.17 The discrete polarization measure can be written as:
DP a; kð Þ ¼ kXNi¼1
Xjpi
p1þai pj
Therefore, for each possible a, we have a different DP measure. For this measure to be
a proper indicator of polarization, it has to fulfil two basic properties18:
(a) If we merge the two smallest groups into a new group, the new distribution is more
polarized than the original one.
17 The fractionalization index with distances across groups measured in R is simply the traditional Gini index
(see Montalvo and Reynal-Querol, 2002).18 These conditions are obtained by analogy with the ones exposed in Esteban and Ray (1994). See Montalvo
and Reynal-Querol (2002) for a detailed explanation of these conditions.
J.G. Montalvo, M. Reynal-Querol / Journal of Development Economics 76 (2005) 293–323302
(b) If we shift population mass for one group equally to other two groups, which have
equal size, then polarization increases.
Montalvo and Reynal-Querol (2002) have shown that the only value of a admissible if
the DP measure has to satisfy the basic properties of polarization is a=1, and, therefore,DP(1,k). Notice that when a=1, the only k that normalize DP between 0 (minimum) and 1
(maximum) is k=419. Given these conditions the only discrete polarization measure that
satisfies the properties of polarization and is normalized between 0 and 1 is DP(1,4). This
index coincides with the Q measure of polarization used by Montalvo and Reynal-Querol
(2002).
Rent-seeking models provide a second justifications for using the Q index in the
context of conflicts. From a theoretical perspective, rent-seeking models point out that
social costs are higher and social tensions emerge more easily when the population is
distributed in two groups of equal size. In this section, we show that the Q index can be
derived from a simple model of rent-seeking. Let us assume that the society is composed
by N individuals distributed in M groups. Let us normalize Ani=N=1. Then, pi, the
proportion of individuals in group i, will be equal to ni, pi=ni. Society chooses an
outcome over the M possible issues. We identify issue i as the outcome most preferred by
group i. We think of each outcome as a pure public good for the group members. Define
uij as the utility derived by a member of group i if issue j is chosen by society. As we want
to describe a pure contest case, then uiiNuij=0 for all i, j with ipj. Therefore, individualswill only spend resources in their most preferred outcome, i.
Because of the rent-seeking nature of the model we assume that agents can try to alter
the outcome by spending resources in favor of their preferred outcome. Therefore, there
will be M possible outcomes depending on the resources spend by each of the M groups.
Let us define xi as the effort or the resources expended by an individual or group i20. The
total resources devoted to lobbying are R ¼PM
i¼1 pixi. Following this interpretation, R
can be thought of as a measure of the intensity of social conflict. The cost of resources, or
effort, x for each individual is c(x). We are going to assume that the cost function, or effort
disutility, is quadratic21, c(x)=(1/2)x2.
The basic element of any rent-seeking model is the contest success function, which
defines the probability of success. We are going to use the traditional ratio form for the
contest success function and define pj as the probability that issue j is chosen, which
depends on the resources spent by each group in favor of each outcome j=1, . . ., M,
provided that RN0.
pj ¼pjxjXM
j¼1
pjxj
¼ pjxj
R
19 The fractionalization index ranges between 0 (minimum) and 1 (maximum).20 We assume, as in Esteban and Ray (1999), that the individuals in each group act in a coordinated fashion.
Therefore, we ignore the possibility of free riding within each group.21 As in Esteban and Ray (1999).
J.G. Montalvo, M. Reynal-Querol / Journal of Development Economics 76 (2005) 293–323 303
This is a particular case of the ratio form of the contest success function22. Then, each
member of group i has to decide the amount of resources s/he wants to expend in order to
maximize the expected utility function taken into account that s/he does not care about
nonpreferred outcomes and the contest success function is of the ratio form.
Eui ¼XMj¼1
pjuij � cðxiÞ ¼XMj¼1
pjuij � 1=2ð Þx2i ¼ piuii � 1=2ð Þx2i
subject to pj=pjxj/R. As we assume a pure contest case and, uij=0 for all jpi, and at least
one group expend positive resources, xjN0, for some jpi, the first-order conditions that
solve the problem are
p2i uii � uiipið Þ ¼ pixiR
Adding all the first-order conditions, we obtain the following expression:
XMi¼1
p2i uii � uiipið Þ ¼ R2
In the pure contest case, the individuals only have a positive utility from their most
preferred issue. Say that the utility uii=k
Therefore
R2 ¼XMi¼1
p2i k � kpið Þ
Proposition 1. If there are only two groups the normalize (squared) total cost can be
written as R2 ¼ 1�P2
i¼10:5�pi
0:5
� �which is the Q index of polarization.
Proof. It is easy to show that if M=2 then the resources spend by each individual of any
group are the same, x1=x2, therefore, pi=pi.
Therefore
R2 ¼X2i¼1
p2i k � kpið Þ ¼
X2i¼1
pi kpi � kp2i
� �¼
X2i¼1
pi 1� 1þ kpi � kp2i
� �
¼X2i¼1
pi 1� 1� kpi þ kp2i
� �� �¼
X2i¼1
pi 1� k1
k� pi þ p2
i
� �� �
¼X2i¼1
pi �X2i¼1
k1
k� pi þ p2
i
� �pi ¼ 1�
X2i¼1
k1
k� pi þ p2
i
� �pi
22 In general, the ratio form of the contest success function takes the form p1/p2=(x1/x2)z where z defines if
there are diminishing returns (zV1) to competitive efforts (x) or there are increasing returns (zN1). In our case, we
set z=1.
J.G. Montalvo, M. Reynal-Querol / Journal of Development Economics 76 (2005) 293–323304
As R is a measure of the total resources spent, or effort, for lobbying purposes, then it
can be interpreted as an index of (potential) conflict. Notice that, for k=4, this index is
normalized between 0 and 1, and can be rewritten as
R2 ¼ 1�X2i¼1
41
4� pi þ p2
i
� �pi ¼ 1�
X2i¼1
0:5� pi
0:5
� �2
pi
which is precisely the Q index. 5
Proposition 2. If there are M groups of equal size23 n1=....=nM, the normalized (squared)
total cost can be written as R2 ¼ 1�PM
i¼10:5�pi
0:5
� �2pi
Proof. Because all the groups have the same size then pi=pi.
Therefore
R2 ¼XNi¼1
p2i k � kpið Þ ¼
XNi¼1
pi kpi � kp2i
� �¼
XNi¼1
pi 1� 1þ kpi � kp2i
� �
For k=4 the index is normalized between 0 and 1.
R2 ¼XNi¼1
pi 1� 1þ 4pi � 4p2i
� �¼
XNi¼1
pi 1� 1� 4pi þ 4p2i
� �� �
¼XNi¼1
pi 1� 1� 2pið Þ2� �
¼ 1�XNi¼1
0:5� pi
0:5
2pi
which is again the Q index. 5
We should notice that this derivation is constrained by many assumptions (pure contest
and equal size groups) and, therefore, should be taken as an application that illustrates the
relationship between the Q index and the rent-seeking literature. However, we should also
point out that the usual derivation of Herfindahl’s index24 in the industrial organization
literature uses a very constrained setup and relies strongly on the symmetry of the
participants.
3.3. Fractionalization versus polarization
The relationship between social heterogeneity and social conflict is not an easy one.
Initially, one could think that the increase in diversity increases the likelihood of social
conflicts. However, this does not have to be the case. In fact, many researchers agree that
the increase in ethnic heterogeneity initially increases potential conflict but, after some
point, more diversity implies potential conflict. Horowitz (1985) argues that the
relationship between ethnic diversity and civil wars is not monotonic: there is less
violence in highly homogeneous and highly heterogeneous societies. Horowitz (1985)
24 Herfindahl’s index is equal to one minus the index of fractionalization.
23 Notice that, in the case of two groups, this condition was not needed.
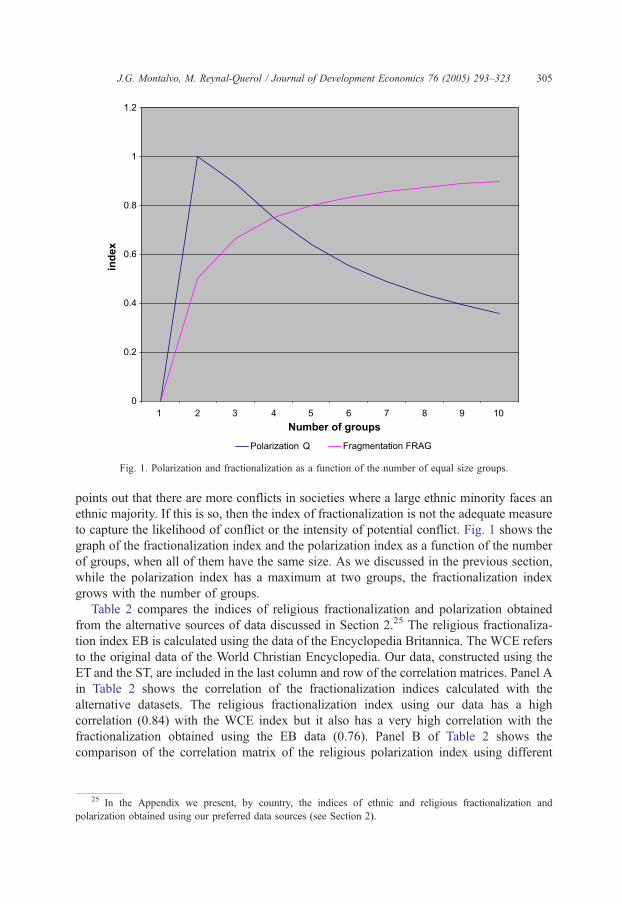
Fig. 1. Polarization and fractionalization as a function of the number of equal size groups.
J.G. Montalvo, M. Reynal-Querol / Journal of Development Economics 76 (2005) 293–323 305
points out that there are more conflicts in societies where a large ethnic minority faces an
ethnic majority. If this is so, then the index of fractionalization is not the adequate measure
to capture the likelihood of conflict or the intensity of potential conflict. Fig. 1 shows the
graph of the fractionalization index and the polarization index as a function of the number
of groups, when all of them have the same size. As we discussed in the previous section,
while the polarization index has a maximum at two groups, the fractionalization index
grows with the number of groups.
Table 2 compares the indices of religious fractionalization and polarization obtained
from the alternative sources of data discussed in Section 2.25 The religious fractionaliza-
tion index EB is calculated using the data of the Encyclopedia Britannica. The WCE refers
to the original data of the World Christian Encyclopedia. Our data, constructed using the
ET and the ST, are included in the last column and row of the correlation matrices. Panel A
in Table 2 shows the correlation of the fractionalization indices calculated with the
alternative datasets. The religious fractionalization index using our data has a high
correlation (0.84) with the WCE index but it also has a very high correlation with the
fractionalization obtained using the EB data (0.76). Panel B of Table 2 shows the
comparison of the correlation matrix of the religious polarization index using different
25 In the Appendix we present, by country, the indices of ethnic and religious fractionalization and
polarization obtained using our preferred data sources (see Section 2).
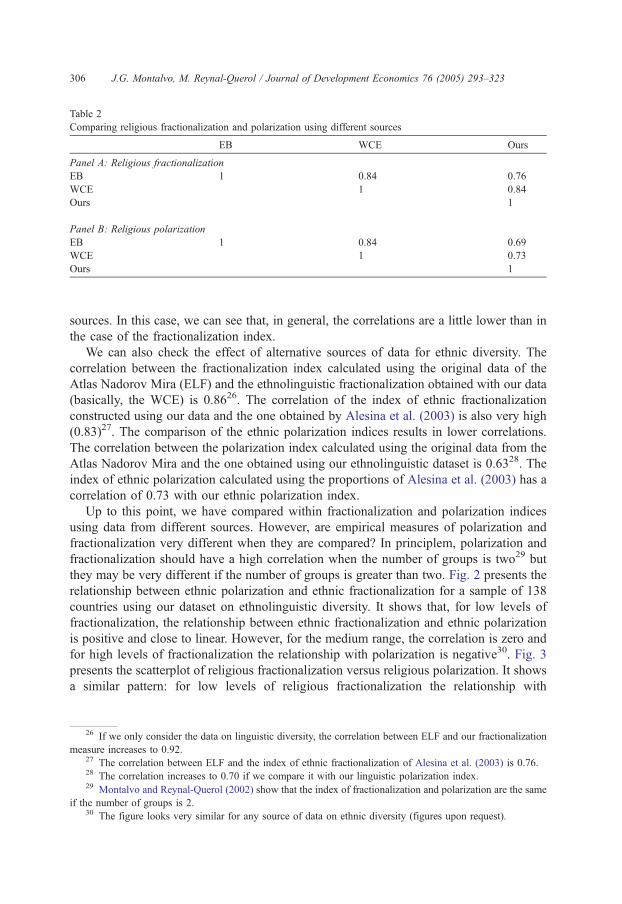
Table 2
Comparing religious fractionalization and polarization using different sources
EB WCE Ours
Panel A: Religious fractionalization
EB 1 0.84 0.76
WCE 1 0.84
Ours 1
Panel B: Religious polarization
EB 1 0.84 0.69
WCE 1 0.73
Ours 1
J.G. Montalvo, M. Reynal-Querol / Journal of Development Economics 76 (2005) 293–323306
sources. In this case, we can see that, in general, the correlations are a little lower than in
the case of the fractionalization index.
We can also check the effect of alternative sources of data for ethnic diversity. The
correlation between the fractionalization index calculated using the original data of the
Atlas Nadorov Mira (ELF) and the ethnolinguistic fractionalization obtained with our data
(basically, the WCE) is 0.8626. The correlation of the index of ethnic fractionalization
constructed using our data and the one obtained by Alesina et al. (2003) is also very high
(0.83)27. The comparison of the ethnic polarization indices results in lower correlations.
The correlation between the polarization index calculated using the original data from the
Atlas Nadorov Mira and the one obtained using our ethnolinguistic dataset is 0.6328. The
index of ethnic polarization calculated using the proportions of Alesina et al. (2003) has a
correlation of 0.73 with our ethnic polarization index.
Up to this point, we have compared within fractionalization and polarization indices
using data from different sources. However, are empirical measures of polarization and
fractionalization very different when they are compared? In principlem, polarization and
fractionalization should have a high correlation when the number of groups is two29 but
they may be very different if the number of groups is greater than two. Fig. 2 presents the
relationship between ethnic polarization and ethnic fractionalization for a sample of 138
countries using our dataset on ethnolinguistic diversity. It shows that, for low levels of
fractionalization, the relationship between ethnic fractionalization and ethnic polarization
is positive and close to linear. However, for the medium range, the correlation is zero and
for high levels of fractionalization the relationship with polarization is negative30. Fig. 3
presents the scatterplot of religious fractionalization versus religious polarization. It shows
a similar pattern: for low levels of religious fractionalization the relationship with
26 If we only consider the data on linguistic diversity, the correlation between ELF and our fractionalization
measure increases to 0.92.
30 The figure looks very similar for any source of data on ethnic diversity (figures upon request).
29 Montalvo and Reynal-Querol (2002) show that the index of fractionalization and polarization are the same
if the number of groups is 2.
28 The correlation increases to 0.70 if we compare it with our linguistic polarization index.
27 The correlation between ELF and the index of ethnic fractionalization of Alesina et al. (2003) is 0.76.
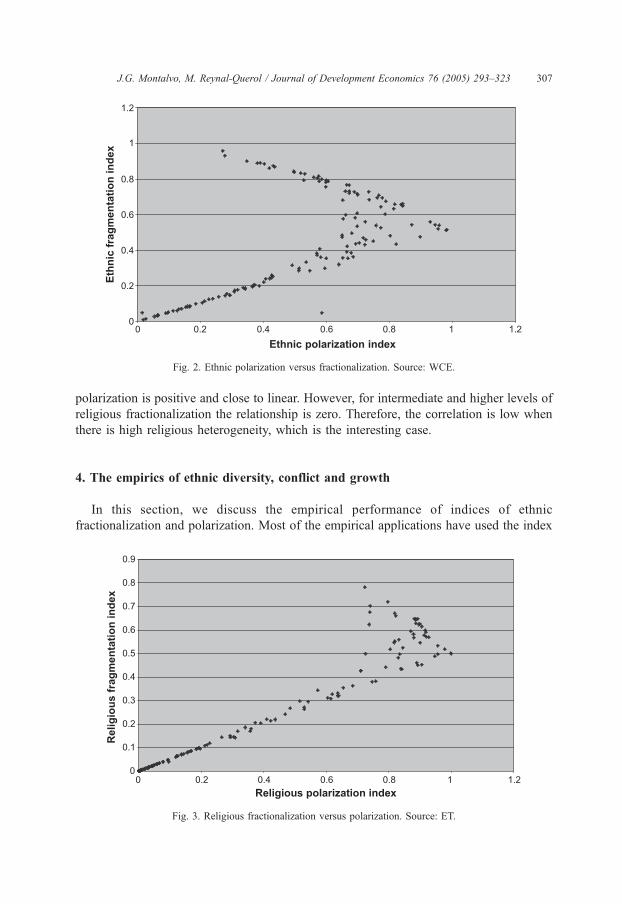
Fig. 2. Ethnic polarization versus fractionalization. Source: WCE.
J.G. Montalvo, M. Reynal-Querol / Journal of Development Economics 76 (2005) 293–323 307
polarization is positive and close to linear. However, for intermediate and higher levels of
religious fractionalization the relationship is zero. Therefore, the correlation is low when
there is high religious heterogeneity, which is the interesting case.
4. The empirics of ethnic diversity, conflict and growth
In this section, we discuss the empirical performance of indices of ethnic
fractionalization and polarization. Most of the empirical applications have used the index
Fig. 3. Religious fractionalization versus polarization. Source: ET.
J.G. Montalvo, M. Reynal-Querol / Journal of Development Economics 76 (2005) 293–323308
of fractionalization as a measure of ethnic and religious diversity. In particular, the use of
ELF is widespread in recent empirical studies on the relationship between ethnic diversity
and growth. Mauro (1995) finds a negative and significant correlation between ELF and
institutional efficiency and, in particular, corruption. Easterly and Levine (1997) use this
variable to show how African nations’ unusually high linguistic fractionalization explains
a significant part of their poor policies and slow growth. The inclusion of ethnolinguistic
fractionalization in growth regressions modestly weakens the significance of the dummy
for Africa. Collier and Hoeffler (1998, 2002) include ELF to capture the level of ethnic
diversity of a country and analyze its effect on civil wars. Alesina et al. (1999) construct a
measure of ethnic divisions based on color differences as an ethnic variable. The
functional form of the index is the same as the index of ethnolinguistic fractionalization
but using data on color31. More recently, Alesina et al. (2003) construct ethnic and
linguistic fractionalization indices and show that, opposite to what happen with religious
fractionalization, they are likely to belong to the set of determinants of economic success
defined in terms of output, the quality of policies, and the quality of institutions. Vigdor
(2002) derives an interpretation for ethnic fractionalization effects based on a model of
differential altruism, and reports the implications for empirical specifications.
Only very recently have several studies used a polarization index to measure ethnic
heterogeneity. Reynal-Querol (2002) analyzes the religious dimension of ethnicity and its
effect on ethnic civil war. The results show that religious polarization is a very important
ethnic dimension in explaining ethnic civil wars. Montalvo and Reynal-Querol (2003),
using the empirical specification of Mankiw et al. (1992), show that religious polarization
is statistically significant while religious fractionalization turns out to be insignificant.
The purpose of this section is to analyze the effect of different dimension of ethnic
diversity on economic development and to compare the empirical performance of
fractionalization indices versus polarization. An increasing body of economic literature
identifies a high degree of ethnic heterogeneity as a negative factor on growth. When there
are social cleavages, there are frictions among social groups. When the society is divided
by religious, ethnolinguistic, or race differences, tensions emerge along these divisions.
Rent-seeking models show that the resources spent by the groups in order to obtain
political influence (time, labor, etc.) can be considered as a social cost with a negative
effect on economic growth because it implies a nonproductive use of these inputs. This
clearly would reduce investment in the productive sector. Secondly, because religious and
ethnic differences are important social cleavages, the social response to this heterogeneity
could generate violence and civil war. In addition, even if this heterogeneity creates only
the potential for conflict, it can affect growth negatively because instability and uncertainty
also reduce investment. Moreover, the government will increase government consumption
in order to mitigate potential conflict, which also has a negative effect on growth. As we
argued before, the social cost generated by the rent-seeking behavior is maximum under a
bimodal distribution. Mauro (1995) points out that ethnolinguistic fractionalization is a
proxy for ethnic conflict and argues that this conflict may lead to political instability and,
in extreme cases, to civil war. We believe that this effect cannot be captured by the index
31 They argue that color fractionalization in U.S. cities, metropolitan areas, and urban counties reduces
expenditure in productive public services and increases rent-seeking expenditures.
J.G. Montalvo, M. Reynal-Querol / Journal of Development Economics 76 (2005) 293–323 309
of fractionalization and that it should be empirically calculated using the index of
polarization Q. In order to support this claim, we should show that the polarization index
explains better than the fractionalization index the effect of ethnic (religious) heterogeneity
on investment, public consumption, and the likelihood of violent conflicts and civil wars.
For all the empirical exercises, we consider a sample of 138 countries and data from
1960 to 1989 organized in 5-year intervals.32 To analyze the direct effect of religious and
ethnic diversity on growth, we adopt the standard specification (Barro 1991)
GROWTHit ¼ a þ bLNGDP0it þX
cjXjit þ d1CWit þ d2POLi þ d3FRACi þ uit
ð2Þ
where GROWTH is the growth rate of GDP per capita and LNGDP0 is the log of gross
domestic product per capita in the initial year of each subperiod. The set of X values
includes the ratio of real government consumption to real GDP (GOV), the number of
revolutions (REVOLT) or coups (COUP) per year, the proportion of assassinations per
million population (ASSASS), the absolute deviation of the PPP value of the investment
deflator from the sample mean (PPDEV), the ratio of real domestic investment to GDP
(INV), secondary-school enrollment rate (SEC) and primary-school enrollment (PRI). The
sample covers the 138 countries in Barro-Lee (1994). They are organized in 5-year
intervals from 1960 to 1989.
We add three variables to the basic growth regression: civil wars (CW), ethnic
(religious) fractionalization (FRAC) and ethnic (religious) polarization (POL). Civil wars
(CW) are traumatic episodes with a long-lasting effect on growth. Data on civil wars come
from Doyle and Sambanis (2000). Doyle and Sambanis (2000) define civil war as an
armed conflict with the following characteristics: b(a) it caused more than one thousand
deaths; (b) it challenged the sovereignty of an internationally recognized state; (c) it
occurred within the recognized boundary of that state; (d) it involves the state as a
principal combatant; (e) it included rebels with the ability to mount organized armed
opposition to the state; and (f) the parties were concerned with the prospects of living
together in the same political unit after the end of the warQ.Additionally, we include in the regression different variables to measure religious and/
or ethnic diversity using fractionalization (FRAC) and polarization (POL) indices. In all
the empirical exercises, we use the Barro and Lee (1994) dataset for the standard variables
and our data for the ethnic and religious heterogeneity indices.
We also consider three indirect channels: the effect of ethnic/religious heterogeneity on
investment, public consumption, and the incidence of civil wars. In order to avoid
bvariables fishingQ, we adopt the most common specifications in the literature for each of
these variables.33 The investment equation is specified as in Barro (1991) including civil
wars (CW) among the political instability variables. The specification for government
consumption follows Persson and Tabellini (1999) and includes the log of GDP per capita
and ethnic diversity variables. The regression could also include the proportion of
33 This was also the reason for choosing Barro’s specification for the growth regression.
32 There are many recent examples of estimation of growth regressions that consider each period as a
different equation in a SURE. See for instance Barro (1997a,b). Easterly and Levine (1997) and Alesina et al.
(2003) pool three decades and use also the SUR estimator.
J.G. Montalvo, M. Reynal-Querol / Journal of Development Economics 76 (2005) 293–323310
population over 65, openness or some measures related with the electoral system (Milesi-
Ferretti et al., 2002). Because these variables are only available for a limited set of
countries, we decided to avoid a large reduction in the sample size and use the level of
democracy (DEMP3).34
Finally, to analyze the effect of ethnic diversity on civil wars, we adopt a specification
that contains the set of common variables in recent studies on the causes of civil war
(Collier and Hoeffler 1998; Montalvo and Reynal-Querol 2002; Fearon and Laitin, 2003).
Following this criterion, the explanatory variables in the civil war equation include the
initial log of GDP per capita, the log of population (LNPOP), an index of ethnic (religious)
heterogeneity and the index of democracy (DEMP3). The inclusion of real GDP per capita
captures the opportunity cost of rebellion. The population is interpreted as a measure of
taxable capacity and a proxy for the cost of coordination. In addition, the common
specification for civil wars includes ethnic heterogeneity as a measure of coordination
problems. We argue that what matters for civil wars is ethnolinguisticc (religious)
polarization and not fractionalization35. More diversity (fractionalization) could decrease
the probability of conflict while polarization should increase it because coordination
problems are smaller than with many groups. In fact, Collier and Hoeffler (1998)
acknowledge that bthe coordination cost would be at their lowest when the population is
polarized between an ethnic group identified as the government and a second similarly
sized ethnic group, identified with the rebelsQ. However, they use as a proxy for ethnic
heterogeneity the index of fractionalization instead of an index of polarization.
The estimation procedure for the direct channel (growth equation) and the indirect
channels (investment, government consumption over GDP and civil wars) is the seemingly
unrelated regression estimator (SURE)36 common in recent empirical research on
growth37. There is at least one issue that can potentially affect the estimation of the
standard deviation of the parameters. The specification of civil wars follows a linear
probability model which implies that at least the residuals from that regression will be
heteroskedastic38. In order to deal with the issue of heteroskedasticity we calculate the
standard errors using the sandwich formula instead of the usual estimator of the asymptotic
variance of the seemingly unrelated regression estimates.
Table 3 shows the comparison of the effect of religious polarization (RELPOL) and
religious fractionalization (RELFRAC) on growth, investment, the probability of civil
36 Notice that not instrumenting the endogeneous variables in the estimation of the growth regression could
generate inconsistent estimates. However, as pointed out by one referee, the SURE procedure is potentially less
sensitive to specification mistakes than the three stages least-squares estimator, which we used in the working
paper version of this article.
35 Montalvo and Reynal-Querol (2002) show that the effect of polarization on civil wars is robust to the
inclusion of fractionalization and its square as well as the inclusion of a variable for ethnic dominance (the largest
group larger than 45% and smaller than 90%).
37 See, for instance, Easterly and Levine (1997).38 The possibility that the predicted values of the variable civil war lie outside the unit interval is of less
concern if we are interested in hypothesis testing. Heckman and MaCurdy (1985) propose a simultaneous
equation linear probability model. They argue that, although it is possible to impose the constraint that predicted
probabilities always lie in the unit interval, the procedure is unattractive in practice and only important if the final
objetive is forecasting. See also Heckman and Snyder (1997).
34 See Appendix I for a definition of this variable and the source.
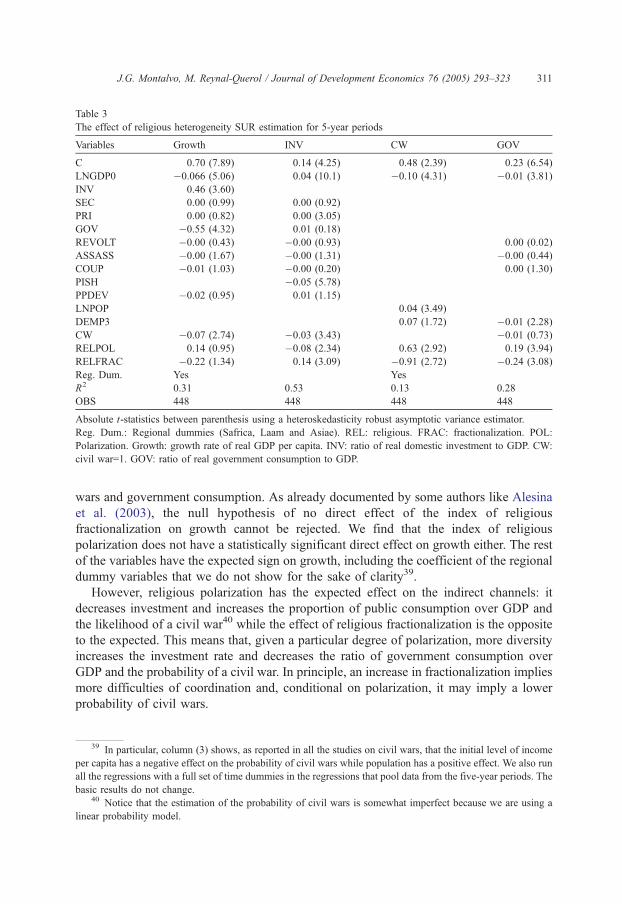
Table 3
The effect of religious heterogeneity SUR estimation for 5-year periods
Variables Growth INV CW GOV
C 0.70 (7.89) 0.14 (4.25) 0.48 (2.39) 0.23 (6.54)
LNGDP0 �0.066 (5.06) 0.04 (10.1) �0.10 (4.31) �0.01 (3.81)
INV 0.46 (3.60)
SEC 0.00 (0.99) 0.00 (0.92)
PRI 0.00 (0.82) 0.00 (3.05)
GOV �0.55 (4.32) 0.01 (0.18)
REVOLT �0.00 (0.43) �0.00 (0.93) 0.00 (0.02)
ASSASS �0.00 (1.67) �0.00 (1.31) �0.00 (0.44)
COUP �0.01 (1.03) �0.00 (0.20) 0.00 (1.30)
PISH �0.05 (5.78)
PPDEV �0.02 (0.95) 0.01 (1.15)
LNPOP 0.04 (3.49)
DEMP3 0.07 (1.72) �0.01 (2.28)
CW �0.07 (2.74) �0.03 (3.43) �0.01 (0.73)
RELPOL 0.14 (0.95) �0.08 (2.34) 0.63 (2.92) 0.19 (3.94)
RELFRAC �0.22 (1.34) 0.14 (3.09) �0.91 (2.72) �0.24 (3.08)
Reg. Dum. Yes Yes
R2 0.31 0.53 0.13 0.28
OBS 448 448 448 448
Absolute t-statistics between parenthesis using a heteroskedasticity robust asymptotic variance estimator.
Reg. Dum.: Regional dummies (Safrica, Laam and Asiae). REL: religious. FRAC: fractionalization. POL:
Polarization. Growth: growth rate of real GDP per capita. INV: ratio of real domestic investment to GDP. CW:
civil war=1. GOV: ratio of real government consumption to GDP.
J.G. Montalvo, M. Reynal-Querol / Journal of Development Economics 76 (2005) 293–323 311
wars and government consumption. As already documented by some authors like Alesina
et al. (2003), the null hypothesis of no direct effect of the index of religious
fractionalization on growth cannot be rejected. We find that the index of religious
polarization does not have a statistically significant direct effect on growth either. The rest
of the variables have the expected sign on growth, including the coefficient of the regional
dummy variables that we do not show for the sake of clarity39.
However, religious polarization has the expected effect on the indirect channels: it
decreases investment and increases the proportion of public consumption over GDP and
the likelihood of a civil war40 while the effect of religious fractionalization is the opposite
to the expected. This means that, given a particular degree of polarization, more diversity
increases the investment rate and decreases the ratio of government consumption over
GDP and the probability of a civil war. In principle, an increase in fractionalization implies
more difficulties of coordination and, conditional on polarization, it may imply a lower
probability of civil wars.
40 Notice that the estimation of the probability of civil wars is somewhat imperfect because we are using a
linear probability model.
39 In particular, column (3) shows, as reported in all the studies on civil wars, that the initial level of income
per capita has a negative effect on the probability of civil wars while population has a positive effect. We also run
all the regressions with a full set of time dummies in the regressions that pool data from the five-year periods. The
basic results do not change.
J.G. Montalvo, M. Reynal-Querol / Journal of Development Economics 76 (2005) 293–323312
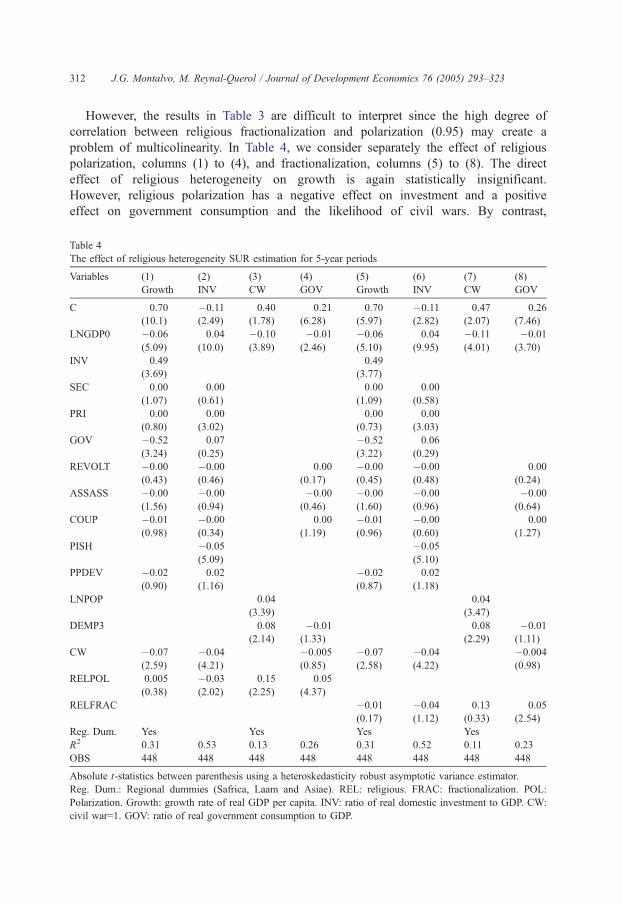
However, the results in Table 3 are difficult to interpret since the high degree of
correlation between religious fractionalization and polarization (0.95) may create a
problem of multicolinearity. In Table 4, we consider separately the effect of religious
polarization, columns (1) to (4), and fractionalization, columns (5) to (8). The direct
effect of religious heterogeneity on growth is again statistically insignificant.
However, religious polarization has a negative effect on investment and a positive
effect on government consumption and the likelihood of civil wars. By contrast,
Table 4
The effect of religious heterogeneity SUR estimation for 5-year periods
Variables (1) (2) (3) (4) (5) (6) (7) (8)
Growth INV CW GOV Growth INV CW GOV
C 0.70
(10.1)
�0.11
(2.49)
0.40
(1.78)
0.21
(6.28)
0.70
(5.97)
�0.11
(2.82)
0.47
(2.07)
0.26
(7.46)
LNGDP0 �0.06
(5.09)
0.04
(10.0)
�0.10
(3.89)
�0.01
(2.46)
�0.06
(5.10)
0.04
(9.95)
�0.11
(4.01)
�0.01
(3.70)
INV 0.49
(3.69)
0.49
(3.77)
SEC 0.00
(1.07)
0.00
(0.61)
0.00
(1.09)
0.00
(0.58)
PRI 0.00
(0.80)
0.00
(3.02)
0.00
(0.73)
0.00
(3.03)
GOV �0.52
(3.24)
0.07
(0.25)
�0.52
(3.22)
0.06
(0.29)
REVOLT �0.00
(0.43)
�0.00
(0.46)
0.00
(0.17)
�0.00
(0.45)
�0.00
(0.48)
0.00
(0.24)
ASSASS �0.00
(1.56)
�0.00
(0.94)
�0.00
(0.46)
�0.00
(1.60)
�0.00
(0.96)
�0.00
(0.64)
COUP �0.01
(0.98)
�0.00
(0.34)
0.00
(1.19)
�0.01
(0.96)
�0.00
(0.60)
0.00
(1.27)
PISH �0.05
(5.09)
�0.05
(5.10)
PPDEV �0.02
(0.90)
0.02
(1.16)
�0.02
(0.87)
0.02
(1.18)
LNPOP 0.04
(3.39)
0.04
(3.47)
DEMP3 0.08
(2.14)
�0.01
(1.33)
0.08
(2.29)
�0.01
(1.11)
CW �0.07
(2.59)
�0.04
(4.21)
�0.005
(0.85)
�0.07
(2.58)
�0.04
(4.22)
�0.004
(0.98)
RELPOL 0.005
(0.38)
�0.03
(2.02)
0.15
(2.25)
0.05
(4.37)
RELFRAC �0.01
(0.17)
�0.04
(1.12)
0.13
(0.33)
0.05
(2.54)
Reg. Dum. Yes Yes Yes Yes
R2 0.31 0.53 0.13 0.26 0.31 0.52 0.11 0.23
OBS 448 448 448 448 448 448 448 448
Absolute t-statistics between parenthesis using a heteroskedasticity robust asymptotic variance estimator.
Reg. Dum.: Regional dummies (Safrica, Laam and Asiae). REL: religious. FRAC: fractionalization. POL:
Polarization. Growth: growth rate of real GDP per capita. INV: ratio of real domestic investment to GDP. CW:
civil war=1. GOV: ratio of real government consumption to GDP.
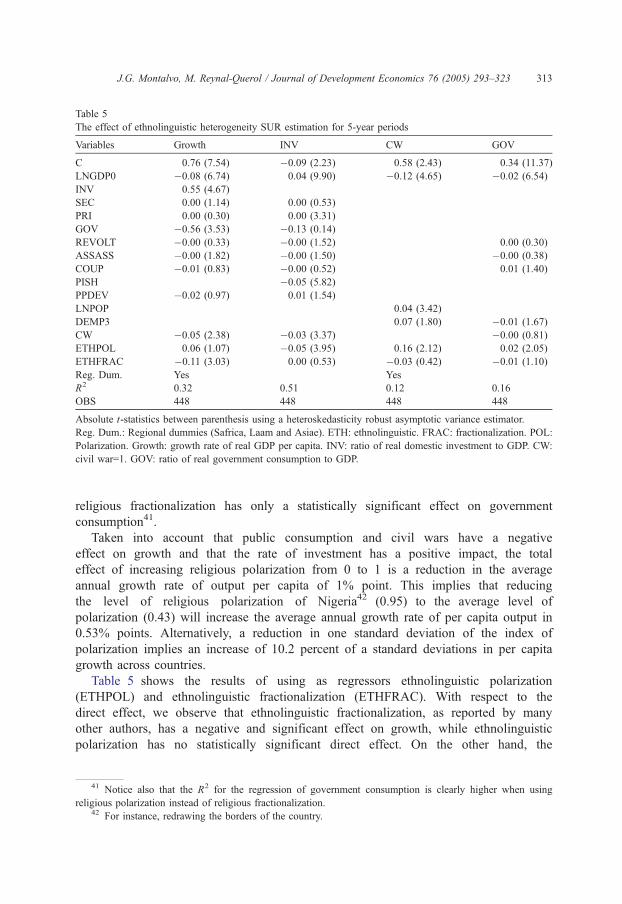
Table 5
The effect of ethnolinguistic heterogeneity SUR estimation for 5-year periods
Variables Growth INV CW GOV
C 0.76 (7.54) �0.09 (2.23) 0.58 (2.43) 0.34 (11.37)
LNGDP0 �0.08 (6.74) 0.04 (9.90) �0.12 (4.65) �0.02 (6.54)
INV 0.55 (4.67)
SEC 0.00 (1.14) 0.00 (0.53)
PRI 0.00 (0.30) 0.00 (3.31)
GOV �0.56 (3.53) �0.13 (0.14)
REVOLT �0.00 (0.33) �0.00 (1.52) 0.00 (0.30)
ASSASS �0.00 (1.82) �0.00 (1.50) �0.00 (0.38)
COUP �0.01 (0.83) �0.00 (0.52) 0.01 (1.40)
PISH �0.05 (5.82)
PPDEV �0.02 (0.97) 0.01 (1.54)
LNPOP 0.04 (3.42)
DEMP3 0.07 (1.80) �0.01 (1.67)
CW �0.05 (2.38) �0.03 (3.37) �0.00 (0.81)
ETHPOL 0.06 (1.07) �0.05 (3.95) 0.16 (2.12) 0.02 (2.05)
ETHFRAC �0.11 (3.03) 0.00 (0.53) �0.03 (0.42) �0.01 (1.10)
Reg. Dum. Yes Yes
R2 0.32 0.51 0.12 0.16
OBS 448 448 448 448
Absolute t-statistics between parenthesis using a heteroskedasticity robust asymptotic variance estimator.
Reg. Dum.: Regional dummies (Safrica, Laam and Asiae). ETH: ethnolinguistic. FRAC: fractionalization. POL:
Polarization. Growth: growth rate of real GDP per capita. INV: ratio of real domestic investment to GDP. CW:
civil war=1. GOV: ratio of real government consumption to GDP.
J.G. Montalvo, M. Reynal-Querol / Journal of Development Economics 76 (2005) 293–323 313
religious fractionalization has only a statistically significant effect on government
consumption41.
Taken into account that public consumption and civil wars have a negative
effect on growth and that the rate of investment has a positive impact, the total
effect of increasing religious polarization from 0 to 1 is a reduction in the average
annual growth rate of output per capita of 1% point. This implies that reducing
the level of religious polarization of Nigeria42 (0.95) to the average level of
polarization (0.43) will increase the average annual growth rate of per capita output in
0.53% points. Alternatively, a reduction in one standard deviation of the index of
polarization implies an increase of 10.2 percent of a standard deviations in per capita
growth across countries.
Table 5 shows the results of using as regressors ethnolinguistic polarization
(ETHPOL) and ethnolinguistic fractionalization (ETHFRAC). With respect to the
direct effect, we observe that ethnolinguistic fractionalization, as reported by many
other authors, has a negative and significant effect on growth, while ethnolinguistic
polarization has no statistically significant direct effect. On the other hand, the
41 Notice also that the R2 for the regression of government consumption is clearly higher when using
religious polarization instead of religious fractionalization.42 For instance, redrawing the borders of the country.
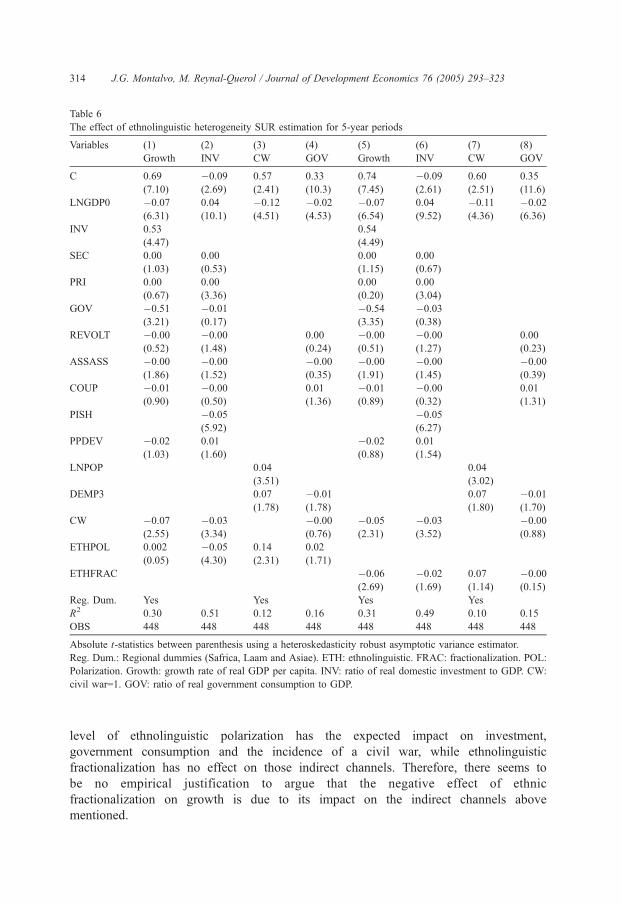
Table 6
The effect of ethnolinguistic heterogeneity SUR estimation for 5-year periods
Variables (1) (2) (3) (4) (5) (6) (7) (8)
Growth INV CW GOV Growth INV CW GOV
C 0.69
(7.10)
�0.09
(2.69)
0.57
(2.41)
0.33
(10.3)
0.74
(7.45)
�0.09
(2.61)
0.60
(2.51)
0.35
(11.6)
LNGDP0 �0.07
(6.31)
0.04
(10.1)
�0.12
(4.51)
�0.02
(4.53)
�0.07
(6.54)
0.04
(9.52)
�0.11
(4.36)
�0.02
(6.36)
INV 0.53
(4.47)
0.54
(4.49)
SEC 0.00
(1.03)
0.00
(0.53)
0.00
(1.15)
0.00
(0.67)
PRI 0.00
(0.67)
0.00
(3.36)
0.00
(0.20)
0.00
(3.04)
GOV �0.51
(3.21)
�0.01
(0.17)
�0.54
(3.35)
�0.03
(0.38)
REVOLT �0.00
(0.52)
�0.00
(1.48)
0.00
(0.24)
�0.00
(0.51)
�0.00
(1.27)
0.00
(0.23)
ASSASS �0.00
(1.86)
�0.00
(1.52)
�0.00
(0.35)
�0.00
(1.91)
�0.00
(1.45)
�0.00
(0.39)
COUP �0.01
(0.90)
�0.00
(0.50)
0.01
(1.36)
�0.01
(0.89)
�0.00
(0.32)
0.01
(1.31)
PISH �0.05
(5.92)
�0.05
(6.27)
PPDEV �0.02
(1.03)
0.01
(1.60)
�0.02
(0.88)
0.01
(1.54)
LNPOP 0.04
(3.51)
0.04
(3.02)
DEMP3 0.07
(1.78)
�0.01
(1.78)
0.07
(1.80)
�0.01
(1.70)
CW �0.07
(2.55)
�0.03
(3.34)
�0.00
(0.76)
�0.05
(2.31)
�0.03
(3.52)
�0.00
(0.88)
ETHPOL 0.002
(0.05)
�0.05
(4.30)
0.14
(2.31)
0.02
(1.71)
ETHFRAC �0.06
(2.69)
�0.02
(1.69)
0.07
(1.14)
�0.00
(0.15)
Reg. Dum. Yes Yes Yes Yes
R2 0.30 0.51 0.12 0.16 0.31 0.49 0.10 0.15
OBS 448 448 448 448 448 448 448 448
Absolute t-statistics between parenthesis using a heteroskedasticity robust asymptotic variance estimator.
Reg. Dum.: Regional dummies (Safrica, Laam and Asiae). ETH: ethnolinguistic. FRAC: fractionalization. POL:
Polarization. Growth: growth rate of real GDP per capita. INV: ratio of real domestic investment to GDP. CW:
civil war=1. GOV: ratio of real government consumption to GDP.
J.G. Montalvo, M. Reynal-Querol / Journal of Development Economics 76 (2005) 293–323314
level of ethnolinguistic polarization has the expected impact on investment,
government consumption and the incidence of a civil war, while ethnolinguistic
fractionalization has no effect on those indirect channels. Therefore, there seems to
be no empirical justification to argue that the negative effect of ethnic
fractionalization on growth is due to its impact on the indirect channels above
mentioned.
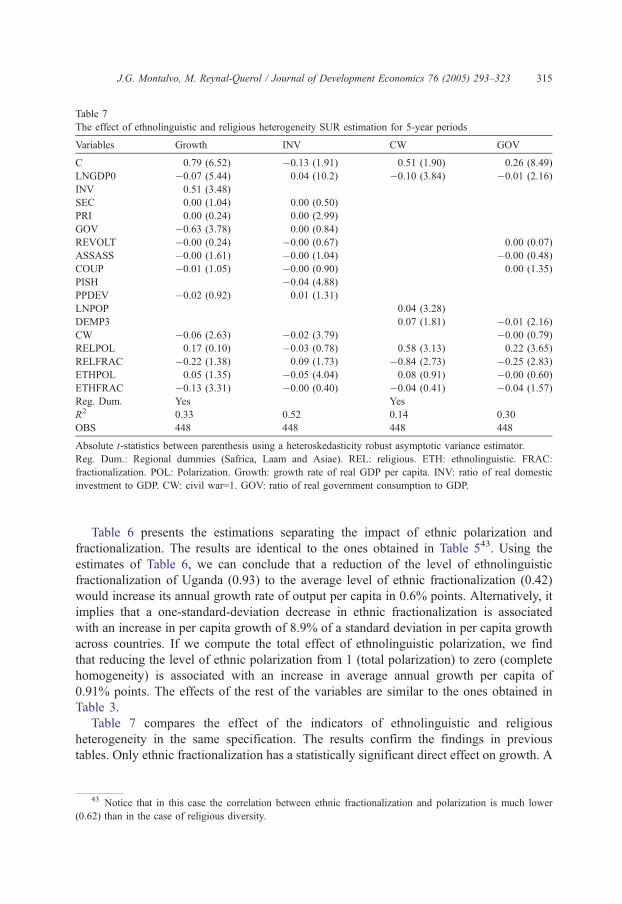
Table 7
The effect of ethnolinguistic and religious heterogeneity SUR estimation for 5-year periods
Variables Growth INV CW GOV
C 0.79 (6.52) �0.13 (1.91) 0.51 (1.90) 0.26 (8.49)
LNGDP0 �0.07 (5.44) 0.04 (10.2) �0.10 (3.84) �0.01 (2.16)
INV 0.51 (3.48)
SEC 0.00 (1.04) 0.00 (0.50)
PRI 0.00 (0.24) 0.00 (2.99)
GOV �0.63 (3.78) 0.00 (0.84)
REVOLT �0.00 (0.24) �0.00 (0.67) 0.00 (0.07)
ASSASS �0.00 (1.61) �0.00 (1.04) �0.00 (0.48)
COUP �0.01 (1.05) �0.00 (0.90) 0.00 (1.35)
PISH �0.04 (4.88)
PPDEV �0.02 (0.92) 0.01 (1.31)
LNPOP 0.04 (3.28)
DEMP3 0.07 (1.81) �0.01 (2.16)
CW �0.06 (2.63) �0.02 (3.79) �0.00 (0.79)
RELPOL 0.17 (0.10) �0.03 (0.78) 0.58 (3.13) 0.22 (3.65)
RELFRAC �0.22 (1.38) 0.09 (1.73) �0.84 (2.73) �0.25 (2.83)
ETHPOL 0.05 (1.35) �0.05 (4.04) 0.08 (0.91) �0.00 (0.60)
ETHFRAC �0.13 (3.31) �0.00 (0.40) �0.04 (0.41) �0.04 (1.57)
Reg. Dum. Yes Yes
R2 0.33 0.52 0.14 0.30
OBS 448 448 448 448
Absolute t-statistics between parenthesis using a heteroskedasticity robust asymptotic variance estimator.
Reg. Dum.: Regional dummies (Safrica, Laam and Asiae). REL: religious. ETH: ethnolinguistic. FRAC:
fractionalization. POL: Polarization. Growth: growth rate of real GDP per capita. INV: ratio of real domestic
investment to GDP. CW: civil war=1. GOV: ratio of real government consumption to GDP.
J.G. Montalvo, M. Reynal-Querol / Journal of Development Economics 76 (2005) 293–323 315
Table 6 presents the estimations separating the impact of ethnic polarization and
fractionalization. The results are identical to the ones obtained in Table 543. Using the
estimates of Table 6, we can conclude that a reduction of the level of ethnolinguistic
fractionalization of Uganda (0.93) to the average level of ethnic fractionalization (0.42)
would increase its annual growth rate of output per capita in 0.6% points. Alternatively, it
implies that a one-standard-deviation decrease in ethnic fractionalization is associated
with an increase in per capita growth of 8.9% of a standard deviation in per capita growth
across countries. If we compute the total effect of ethnolinguistic polarization, we find
that reducing the level of ethnic polarization from 1 (total polarization) to zero (complete
homogeneity) is associated with an increase in average annual growth per capita of
0.91% points. The effects of the rest of the variables are similar to the ones obtained in
Table 3.
Table 7 compares the effect of the indicators of ethnolinguistic and religious
heterogeneity in the same specification. The results confirm the findings in previous
tables. Only ethnic fractionalization has a statistically significant direct effect on growth. A
43 Notice that in this case the correlation between ethnic fractionalization and polarization is much lower
(0.62) than in the case of religious diversity.
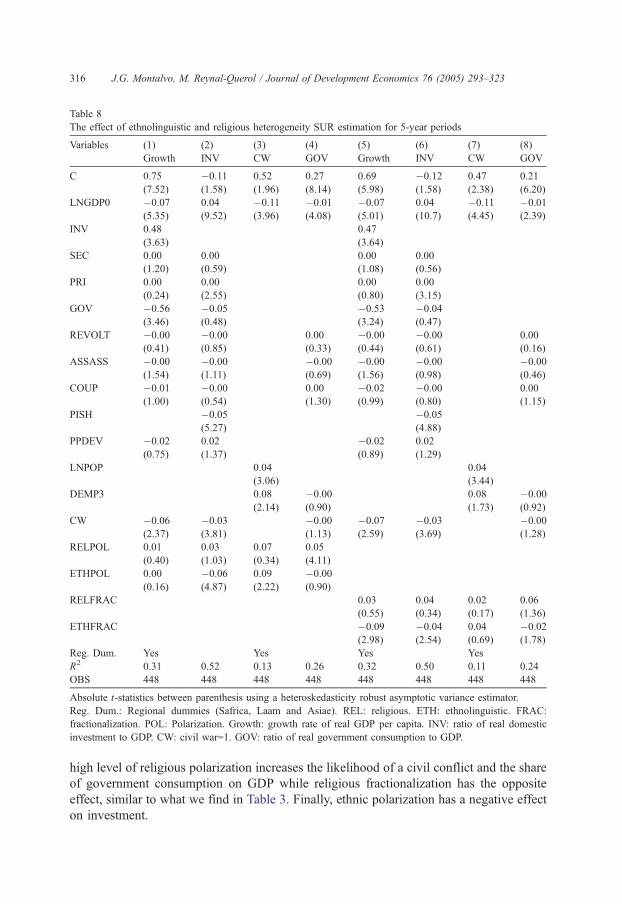
Table 8
The effect of ethnolinguistic and religious heterogeneity SUR estimation for 5-year periods
Variables (1) (2) (3) (4) (5) (6) (7) (8)
Growth INV CW GOV Growth INV CW GOV
C 0.75
(7.52)
�0.11
(1.58)
0.52
(1.96)
0.27
(8.14)
0.69
(5.98)
�0.12
(1.58)
0.47
(2.38)
0.21
(6.20)
LNGDP0 �0.07
(5.35)
0.04
(9.52)
�0.11
(3.96)
�0.01
(4.08)
�0.07
(5.01)
0.04
(10.7)
�0.11
(4.45)
�0.01
(2.39)
INV 0.48
(3.63)
0.47
(3.64)
SEC 0.00
(1.20)
0.00
(0.59)
0.00
(1.08)
0.00
(0.56)
PRI 0.00
(0.24)
0.00
(2.55)
0.00
(0.80)
0.00
(3.15)
GOV �0.56
(3.46)
�0.05
(0.48)
�0.53
(3.24)
�0.04
(0.47)
REVOLT �0.00
(0.41)
�0.00
(0.85)
0.00
(0.33)
�0.00
(0.44)
�0.00
(0.61)
0.00
(0.16)
ASSASS �0.00
(1.54)
�0.00
(1.11)
�0.00
(0.69)
�0.00
(1.56)
�0.00
(0.98)
�0.00
(0.46)
COUP �0.01
(1.00)
�0.00
(0.54)
0.00
(1.30)
�0.02
(0.99)
�0.00
(0.80)
0.00
(1.15)
PISH �0.05
(5.27)
�0.05
(4.88)
PPDEV �0.02
(0.75)
0.02
(1.37)
�0.02
(0.89)
0.02
(1.29)
LNPOP 0.04
(3.06)
0.04
(3.44)
DEMP3 0.08
(2.14)
�0.00
(0.90)
0.08
(1.73)
�0.00
(0.92)
CW �0.06
(2.37)
�0.03
(3.81)
�0.00
(1.13)
�0.07
(2.59)
�0.03
(3.69)
�0.00
(1.28)
RELPOL 0.01
(0.40)
0.03
(1.03)
0.07
(0.34)
0.05
(4.11)
ETHPOL 0.00
(0.16)
�0.06
(4.87)
0.09
(2.22)
�0.00
(0.90)
RELFRAC 0.03
(0.55)
0.04
(0.34)
0.02
(0.17)
0.06
(1.36)
ETHFRAC �0.09
(2.98)
�0.04
(2.54)
0.04
(0.69)
�0.02
(1.78)
Reg. Dum. Yes Yes Yes Yes
R2 0.31 0.52 0.13 0.26 0.32 0.50 0.11 0.24
OBS 448 448 448 448 448 448 448 448
Absolute t-statistics between parenthesis using a heteroskedasticity robust asymptotic variance estimator.
Reg. Dum.: Regional dummies (Safrica, Laam and Asiae). REL: religious. ETH: ethnolinguistic. FRAC:
fractionalization. POL: Polarization. Growth: growth rate of real GDP per capita. INV: ratio of real domestic
investment to GDP. CW: civil war=1. GOV: ratio of real government consumption to GDP.
J.G. Montalvo, M. Reynal-Querol / Journal of Development Economics 76 (2005) 293–323316
high level of religious polarization increases the likelihood of a civil conflict and the share
of government consumption on GDP while religious fractionalization has the opposite
effect, similar to what we find in Table 3. Finally, ethnic polarization has a negative effect
on investment.
J.G. Montalvo, M. Reynal-Querol / Journal of Development Economics 76 (2005) 293–323 317
Table 8 presents the results when polarization and fractionalization are included in the
system separately44. Ethnic fractionalization continues having an important direct effect
on growth. Ethnic polarization has a negative effect on investment, column (2), and a
positive effect on the likelihood of a civil war, column (3), while religious polarization
has a positive effect on government consumption, column (4). Using the estimates in
Table 8, columns (1) to (4), we can calculate the total effect of polarization on growth.
Reducing the degree of polarization (ethnic and religious) from 1 to 0 implies an
increase of 1.20% points in the average growth rate of GDP per capita. In addition, a
one-standard-deviation decrease in ethnic and religious polarization is associated with
an increase in per capita growth of 12.5% of a standard deviation in per capita growth
across countries. Columns (5) shows the negative direct effect of ethnic fractionaliza-
tion on growth. The size of that coefficient implies that reducing the degree of
ethnolinguistic fractionalization of Uganda (0.93) to the average (0.42) would increase
the average growth of Uganda’s GDP per capita in 0.93% points. The only significant
effect of fractionalization on the indirect channels is the negative impact of ethnic
fractionalization on investment. However, we already showed that, if we do not include
religious fractionalization in the specification45, ethnic fractionalization has no
significant effect on investment. In addition, the R2 of the investment regression is
significantly higher if we use ethnic polarization instead of ethnic fractionalization.
5. Conclusions
This paper presents a measurement of religious and ethnic diversity and their effects on
economic development. The first part of the paper discusses the construction of a database
of religious and ethnic diversity for a large sample of countries. We consider the impact of
different data sources and indicators on the measurement of heterogeneity. We also analyze
the effect of alternative synthetic indices for religious and ethnic diversity. We argue that the
index of polarization is better suited to capture the potential for conflict in a society than the
traditional index of fractionalization. We show that polarization and fractionalization
indices have positive and close relationship in homogeneous countries. However, for high
levels of heterogeneity, the correlation between fractionalization and polarization indices is
close to zero or even negative.
The second part of the paper analyzes the effect of religious and ethnic diversity on
economic development. Several papers have documented the negative effect of ethnic
fractionalization on economic development. Many authors argue that the reason for that
negative effect is that a high degree of ethnic fractionalization the increase potential
conflict, which has negative effects on investment and increases rent seeking activities.
Our results confirm that ethnolinguistic fractionalization has a direct negative effect on
growth. However, we find no strong empirical justification to argue that the negative
effect of fractionalization on growth is due to its impact on the indirect channels above
45 Which in any case it is statistically insignificant.
44 As we see in Table 7, including religious polarization and fractionalization in the same specification leads
again to signs of multicollinearity.
J.G. Montalvo, M. Reynal-Querol / Journal of Development Economics 76 (2005) 293–323318
mentioned. By contrast, our results suggest that an increase in social polarization has a
negative effect on growth because it reduces the rate of investment and increases
public consumption and the incidence of civil wars.
Acknowledgement
We would like to thank Tim Besley, Robin Burgess, Debraj Ray, Joan Esteban and,
specially, two anonymous referees for many valuable comments. Jose G. Montalvo thanks
the hospitality of the Public Services Group of the Research Department (DECRG) of the
World Bank where most of the revision of this paper was done. Financial support by the
Spanish Ministerio de Ciencia y Tecnologia (projects SEC2001-0792 and SEC2003-
04429) is kindly acknowledged. We would like to thank also seminar participants at LSE,
The World Bank, Toulouse, and Universitat Pompeu Fabra for helpful comments and
discussions. The findings, interpretations, and conclusions expressed in this paper are
entirely those of the authors. They do not necessarily represent the views of the World
Bank, its Executive Board, or the countries they represent.
Appendix A. Definition of the variables
GROWTH Growth rate of real GDP per capita of the period (Summers and Heston).
INV Average of the ration of real domestic investment for the period (private plus
public) to real GDP. SH.
LNGD0 Log of real GDP per capita of the initial period (1985 international prices) from
SH v.5.5.
SEC Percentage of secondary school attained in the total population. Taken at the
beginning of the period. Source: Barro and Lee.
PRI Percentage of bPrimary school attainedQ in the total population. Taken at the
beginning of the period. Source: Barro and Lee.
GOV Average period of the ratio of real government bconsumptionQ expenditure net ofspending on defense and on education to real GDP.
REVOLT Number of revolutions per year, averaged over the period (Banks).
ASSAS Number of assassination per million population per year, average period. Source:
Banks.
COUP Number of coups per year, average period.
PISH Price level of investment (PPP I/Xrate relative to U.S.) at the beginning of the
period. (U.S.=1.0). Source: SH v.5.5.
PPDEV Magnitude of the absolute deviation of PISH from the sample mean.
LNPOP Log of the population al the beginning of the period.
DEMP3 Democracy score: general openness of the political institutions (0=low; 10=high).
Source: Polity III data set. (http://www.colorado.edu/IBS/GAD/spacetime/data/
Polity.html). We transform the score in a dummy variable that takes value 1 if the
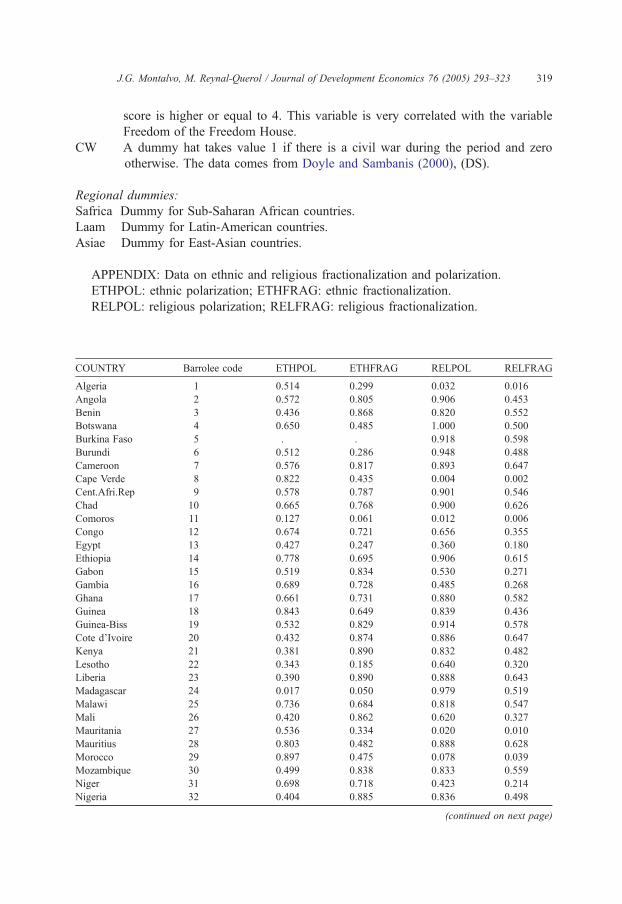
J.G. Montalvo, M. Reynal-Querol / Journal of Development Economics 76 (2005) 293–323 319
score is higher or equal to 4. This variable is very correlated with the variable
Freedom of the Freedom House.
CW A dummy hat takes value 1 if there is a civil war during the period and zero
otherwise. The data comes from Doyle and Sambanis (2000), (DS).
Regional dummies:
Safrica Dummy for Sub-Saharan African countries.
Laam Dummy for Latin-American countries.
Asiae Dummy for East-Asian countries.
APPENDIX: Data on ethnic and religious fractionalization and polarization.
ETHPOL: ethnic polarization; ETHFRAG: ethnic fractionalization.
RELPOL: religious polarization; RELFRAG: religious fractionalization.
COUNTRY Barrolee code ETHPOL ETHFRAG RELPOL RELFRAG
Algeria 1 0.514 0.299 0.032 0.016
Angola 2 0.572 0.805 0.906 0.453
Benin 3 0.436 0.868 0.820 0.552
Botswana 4 0.650 0.485 1.000 0.500
Burkina Faso 5 . . 0.918 0.598
Burundi 6 0.512 0.286 0.948 0.488
Cameroon 7 0.576 0.817 0.893 0.647
Cape Verde 8 0.822 0.435 0.004 0.002
Cent.Afri.Rep 9 0.578 0.787 0.901 0.546
Chad 10 0.665 0.768 0.900 0.626
Comoros 11 0.127 0.061 0.012 0.006
Congo 12 0.674 0.721 0.656 0.355
Egypt 13 0.427 0.247 0.360 0.180
Ethiopia 14 0.778 0.695 0.906 0.615
Gabon 15 0.519 0.834 0.530 0.271
Gambia 16 0.689 0.728 0.485 0.268
Ghana 17 0.661 0.731 0.880 0.582
Guinea 18 0.843 0.649 0.839 0.436
Guinea-Biss 19 0.532 0.829 0.914 0.578
Cote d’Ivoire 20 0.432 0.874 0.886 0.647
Kenya 21 0.381 0.890 0.832 0.482
Lesotho 22 0.343 0.185 0.640 0.320
Liberia 23 0.390 0.890 0.888 0.643
Madagascar 24 0.017 0.050 0.979 0.519
Malawi 25 0.736 0.684 0.818 0.547
Mali 26 0.420 0.862 0.620 0.327
Mauritania 27 0.536 0.334 0.020 0.010
Mauritius 28 0.803 0.482 0.888 0.628
Morocco 29 0.897 0.475 0.078 0.039
Mozambique 30 0.499 0.838 0.833 0.559
Niger 31 0.698 0.718 0.423 0.214
Nigeria 32 0.404 0.885 0.836 0.498
(continued on next page)
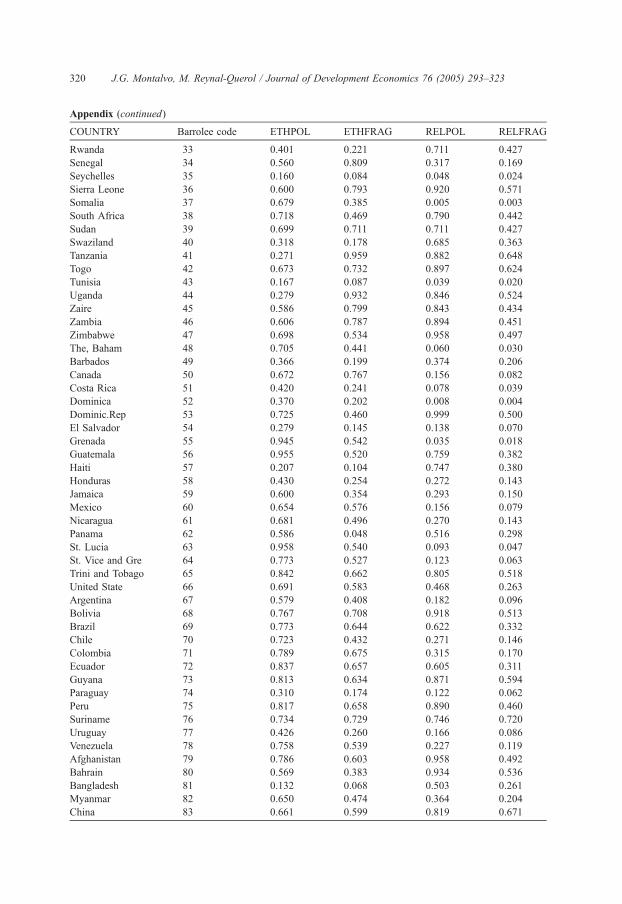
Appendix (continued)
COUNTRY Barrolee code ETHPOL ETHFRAG RELPOL RELFRAG
Rwanda 33 0.401 0.221 0.711 0.427
Senegal 34 0.560 0.809 0.317 0.169
Seychelles 35 0.160 0.084 0.048 0.024
Sierra Leone 36 0.600 0.793 0.920 0.571
Somalia 37 0.679 0.385 0.005 0.003
South Africa 38 0.718 0.469 0.790 0.442
Sudan 39 0.699 0.711 0.711 0.427
Swaziland 40 0.318 0.178 0.685 0.363
Tanzania 41 0.271 0.959 0.882 0.648
Togo 42 0.673 0.732 0.897 0.624
Tunisia 43 0.167 0.087 0.039 0.020
Uganda 44 0.279 0.932 0.846 0.524
Zaire 45 0.586 0.799 0.843 0.434
Zambia 46 0.606 0.787 0.894 0.451
Zimbabwe 47 0.698 0.534 0.958 0.497
The, Baham 48 0.705 0.441 0.060 0.030
Barbados 49 0.366 0.199 0.374 0.206
Canada 50 0.672 0.767 0.156 0.082
Costa Rica 51 0.420 0.241 0.078 0.039
Dominica 52 0.370 0.202 0.008 0.004
Dominic.Rep 53 0.725 0.460 0.999 0.500
El Salvador 54 0.279 0.145 0.138 0.070
Grenada 55 0.945 0.542 0.035 0.018
Guatemala 56 0.955 0.520 0.759 0.382
Haiti 57 0.207 0.104 0.747 0.380
Honduras 58 0.430 0.254 0.272 0.143
Jamaica 59 0.600 0.354 0.293 0.150
Mexico 60 0.654 0.576 0.156 0.079
Nicaragua 61 0.681 0.496 0.270 0.143
Panama 62 0.586 0.048 0.516 0.298
St. Lucia 63 0.958 0.540 0.093 0.047
St. Vice and Gre 64 0.773 0.527 0.123 0.063
Trini and Tobago 65 0.842 0.662 0.805 0.518
United State 66 0.691 0.583 0.468 0.263
Argentina 67 0.579 0.408 0.182 0.096
Bolivia 68 0.767 0.708 0.918 0.513
Brazil 69 0.773 0.644 0.622 0.332
Chile 70 0.723 0.432 0.271 0.146
Colombia 71 0.789 0.675 0.315 0.170
Ecuador 72 0.837 0.657 0.605 0.311
Guyana 73 0.813 0.634 0.871 0.594
Paraguay 74 0.310 0.174 0.122 0.062
Peru 75 0.817 0.658 0.890 0.460
Suriname 76 0.734 0.729 0.746 0.720
Uruguay 77 0.426 0.260 0.166 0.086
Venezuela 78 0.758 0.539 0.227 0.119
Afghanistan 79 0.786 0.603 0.958 0.492
Bahrain 80 0.569 0.383 0.934 0.536
Bangladesh 81 0.132 0.068 0.503 0.261
Myanmar 82 0.650 0.474 0.364 0.204
China 83 0.661 0.599 0.819 0.671
J.G. Montalvo, M. Reynal-Querol / Journal of Development Economics 76 (2005) 293–323320
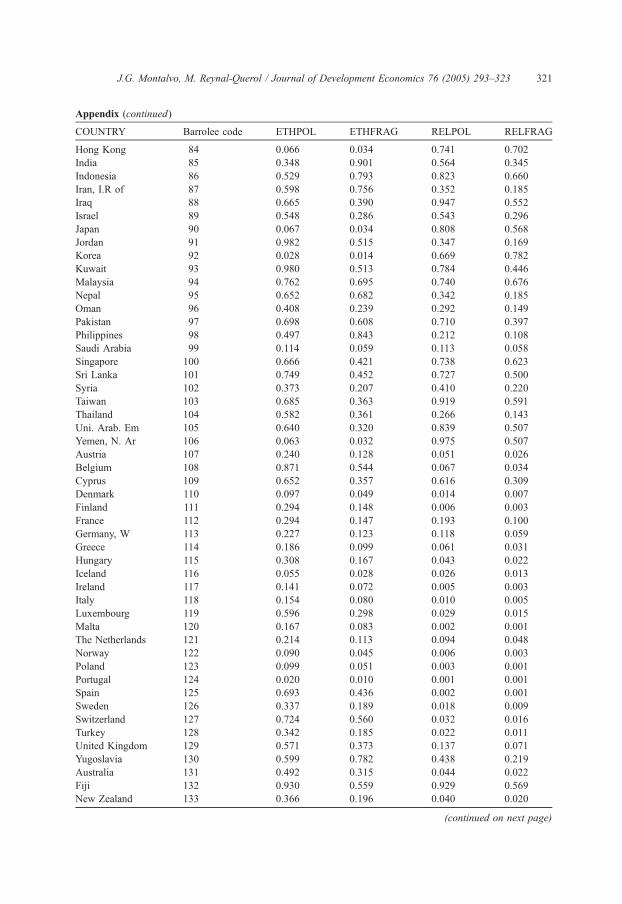
Appendix (continued)
COUNTRY Barrolee code ETHPOL ETHFRAG RELPOL RELFRAG
Hong Kong 84 0.066 0.034 0.741 0.702
India 85 0.348 0.901 0.564 0.345
Indonesia 86 0.529 0.793 0.823 0.660
Iran, I.R of 87 0.598 0.756 0.352 0.185
Iraq 88 0.665 0.390 0.947 0.552
Israel 89 0.548 0.286 0.543 0.296
Japan 90 0.067 0.034 0.808 0.568
Jordan 91 0.982 0.515 0.347 0.169
Korea 92 0.028 0.014 0.669 0.782
Kuwait 93 0.980 0.513 0.784 0.446
Malaysia 94 0.762 0.695 0.740 0.676
Nepal 95 0.652 0.682 0.342 0.185
Oman 96 0.408 0.239 0.292 0.149
Pakistan 97 0.698 0.608 0.710 0.397
Philippines 98 0.497 0.843 0.212 0.108
Saudi Arabia 99 0.114 0.059 0.113 0.058
Singapore 100 0.666 0.421 0.738 0.623
Sri Lanka 101 0.749 0.452 0.727 0.500
Syria 102 0.373 0.207 0.410 0.220
Taiwan 103 0.685 0.363 0.919 0.591
Thailand 104 0.582 0.361 0.266 0.143
Uni. Arab. Em 105 0.640 0.320 0.839 0.507
Yemen, N. Ar 106 0.063 0.032 0.975 0.507
Austria 107 0.240 0.128 0.051 0.026
Belgium 108 0.871 0.544 0.067 0.034
Cyprus 109 0.652 0.357 0.616 0.309
Denmark 110 0.097 0.049 0.014 0.007
Finland 111 0.294 0.148 0.006 0.003
France 112 0.294 0.147 0.193 0.100
Germany, W 113 0.227 0.123 0.118 0.059
Greece 114 0.186 0.099 0.061 0.031
Hungary 115 0.308 0.167 0.043 0.022
Iceland 116 0.055 0.028 0.026 0.013
Ireland 117 0.141 0.072 0.005 0.003
Italy 118 0.154 0.080 0.010 0.005
Luxembourg 119 0.596 0.298 0.029 0.015
Malta 120 0.167 0.083 0.002 0.001
The Netherlands 121 0.214 0.113 0.094 0.048
Norway 122 0.090 0.045 0.006 0.003
Poland 123 0.099 0.051 0.003 0.001
Portugal 124 0.020 0.010 0.001 0.001
Spain 125 0.693 0.436 0.002 0.001
Sweden 126 0.337 0.189 0.018 0.009
Switzerland 127 0.724 0.560 0.032 0.016
Turkey 128 0.342 0.185 0.022 0.011
United Kingdom 129 0.571 0.373 0.137 0.071
Yugoslavia 130 0.599 0.782 0.438 0.219
Australia 131 0.492 0.315 0.044 0.022
Fiji 132 0.930 0.559 0.929 0.569
New Zealand 133 0.366 0.196 0.040 0.020
(continued on next page)
J.G. Montalvo, M. Reynal-Querol / Journal of Development Economics 76 (2005) 293–323 321
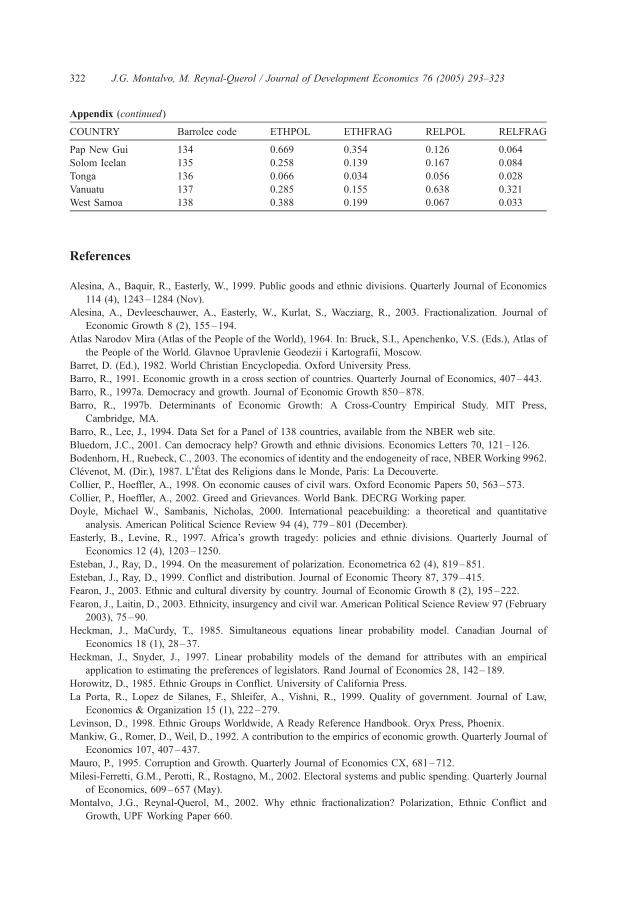
Appendix (continued)
COUNTRY Barrolee code ETHPOL ETHFRAG RELPOL RELFRAG
Pap New Gui 134 0.669 0.354 0.126 0.064
Solom Icelan 135 0.258 0.139 0.167 0.084
Tonga 136 0.066 0.034 0.056 0.028
Vanuatu 137 0.285 0.155 0.638 0.321
West Samoa 138 0.388 0.199 0.067 0.033
J.G. Montalvo, M. Reynal-Querol / Journal of Development Economics 76 (2005) 293–323322
References
Alesina, A., Baquir, R., Easterly, W., 1999. Public goods and ethnic divisions. Quarterly Journal of Economics
114 (4), 1243–1284 (Nov).
Alesina, A., Devleeschauwer, A., Easterly, W., Kurlat, S., Wacziarg, R., 2003. Fractionalization. Journal of
Economic Growth 8 (2), 155–194.
Atlas Narodov Mira (Atlas of the People of the World), 1964. In: Bruck, S.I., Apenchenko, V.S. (Eds.), Atlas of
the People of the World. Glavnoe Upravlenie Geodezii i Kartografii, Moscow.
Barret, D. (Ed.), 1982. World Christian Encyclopedia. Oxford University Press.
Barro, R., 1991. Economic growth in a cross section of countries. Quarterly Journal of Economics, 407–443.
Barro, R., 1997a. Democracy and growth. Journal of Economic Growth 850–878.
Barro, R., 1997b. Determinants of Economic Growth: A Cross-Country Empirical Study. MIT Press,
Cambridge, MA.
Barro, R., Lee, J., 1994. Data Set for a Panel of 138 countries, available from the NBER web site.
Bluedorn, J.C., 2001. Can democracy help? Growth and ethnic divisions. Economics Letters 70, 121–126.
Bodenhorn, H., Ruebeck, C., 2003. The economics of identity and the endogeneity of race, NBERWorking 9962.
Clevenot, M. (Dir.), 1987. L’Etat des Religions dans le Monde, Paris: La Decouverte.
Collier, P., Hoeffler, A., 1998. On economic causes of civil wars. Oxford Economic Papers 50, 563–573.
Collier, P., Hoeffler, A., 2002. Greed and Grievances. World Bank. DECRG Working paper.
Doyle, Michael W., Sambanis, Nicholas, 2000. International peacebuilding: a theoretical and quantitative
analysis. American Political Science Review 94 (4), 779–801 (December).
Easterly, B., Levine, R., 1997. Africa’s growth tragedy: policies and ethnic divisions. Quarterly Journal of
Economics 12 (4), 1203–1250.
Esteban, J., Ray, D., 1994. On the measurement of polarization. Econometrica 62 (4), 819–851.
Esteban, J., Ray, D., 1999. Conflict and distribution. Journal of Economic Theory 87, 379–415.
Fearon, J., 2003. Ethnic and cultural diversity by country. Journal of Economic Growth 8 (2), 195–222.
Fearon, J., Laitin, D., 2003. Ethnicity, insurgency and civil war. American Political Science Review 97 (February
2003), 75–90.
Heckman, J., MaCurdy, T., 1985. Simultaneous equations linear probability model. Canadian Journal of
Economics 18 (1), 28–37.
Heckman, J., Snyder, J., 1997. Linear probability models of the demand for attributes with an empirical
application to estimating the preferences of legislators. Rand Journal of Economics 28, 142–189.
Horowitz, D., 1985. Ethnic Groups in Conflict. University of California Press.
La Porta, R., Lopez de Silanes, F., Shleifer, A., Vishni, R., 1999. Quality of government. Journal of Law,
Economics & Organization 15 (1), 222–279.
Levinson, D., 1998. Ethnic Groups Worldwide, A Ready Reference Handbook. Oryx Press, Phoenix.
Mankiw, G., Romer, D., Weil, D., 1992. A contribution to the empirics of economic growth. Quarterly Journal of
Economics 107, 407–437.
Mauro, P., 1995. Corruption and Growth. Quarterly Journal of Economics CX, 681–712.
Milesi-Ferretti, G.M., Perotti, R., Rostagno, M., 2002. Electoral systems and public spending. Quarterly Journal
of Economics, 609–657 (May).
Montalvo, J.G., Reynal-Querol, M., 2002. Why ethnic fractionalization? Polarization, Ethnic Conflict and
Growth, UPF Working Paper 660.
J.G. Montalvo, M. Reynal-Querol / Journal of Development Economics 76 (2005) 293–323 323
Montalvo, J.G., Reynal-Querol, M., 2003. Religious polarization and economic development. Economic Letter
80, 201–210.
Persson, T., Tabellini, G., 1999. The size and scope of government: comparative politics with rational politicians.
European Economic Review 43, 699–735.
Reynal-Querol, M., 1998. Religious Conflict and Growth, mimeo, LSE.
Reynal-Querol, M., 2002. Ethnicity, political systems, and civil wars. Journal of Conflict Resolution 46 (1), 29–54.
Tavares, J., Wacziarg, R., 2001. How democracy affects growth. European Economic Review, 1341–1378
(August).
Taylor, C., Hudson, M.C., 1972. The World Handbook of Political and Social Indicators. (2nd ed.)Yale University
Press, New Haven, CT.
Vanhanen, T., 1999. Domestic ethnic conflict and ethnic nepotism: a comparative analysis. Journal of Peace
Research 36 (1), 55–73.
Vigdor, J.L., 2002. Interpreting ethnic fragmentation effects. Economic Letter 75, 271–276.
Williamson, J., 1984. New People: Miscegenation and Mulattoes in the United States. New York University
Press, New York.
Wilson, S., 1972. International Encyclopedia of The Social Sciences vol. 13–14. , pp. 441.
Related Documents