Ethnic Discrimination in the Greek Labour Market: Occupational Access, Insurance Coverage, and Wage Offers Nick Drydakis b* Minas Vlassis a* Abstract: The paper investigates whether low skilled male Albanians face unequal treatment in the Greek labour market, two years after the national adoption of the European anti- discrimination employment legislation. By means of a Correspondence Test we have estimated that Albanians face 43.5% net discrimination of access to occupations. Concentrating on the equal chance cases, we subsequently found that Albanians face 36.5% less chance of being registered with insurance coverage, while their potential wage contracts are on the average 8.8% below those of Greeks, and 5.3% below the legal minimum wage. As it comes to the reasons for wage discrimination, using an indirect approach we interestingly found that the employers themselves “put the blame” on profit strategies (84.4%), on statistical discrimination (9.6%), and on taste discrimination (7.8%). Key words: Field Experiment, Ethnic Discrimination., Hiring Discrimination, Insurance Coverage, Wage Inequality. JEL classification: J7, J16, J31, J42, J64, J71, J82. a. Corresponding Author. Department of Economics, University of Crete, University Campus at Gallos, Rethymno 74100. Tel: 28310 77396; Fax:2831077406 E-mail: [email protected] b. Department of Economics, University of Crete *We acknowledge benefit from comments and suggestions made during the presentation of an earlier version of this paper in the Economics Seminars Series of the Department of Economics at the University of Crete. The usual disclaimer applies. 1

Welcome message from author
This document is posted to help you gain knowledge. Please leave a comment to let me know what you think about it! Share it to your friends and learn new things together.
Transcript

Ethnic Discrimination in the Greek Labour Market:
Occupational Access, Insurance Coverage, and Wage Offers
Nick Drydakisb* Minas Vlassisa*
Abstract: The paper investigates whether low skilled male Albanians face unequal treatment in the Greek labour market, two years after the national adoption of the European anti-discrimination employment legislation. By means of a Correspondence Test we have estimated that Albanians face 43.5% net discrimination of access to occupations. Concentrating on the equal chance cases, we subsequently found that Albanians face 36.5% less chance of being registered with insurance coverage, while their potential wage contracts are on the average 8.8% below those of Greeks, and 5.3% below the legal minimum wage. As it comes to the reasons for wage discrimination, using an indirect approach we interestingly found that the employers themselves “put the blame” on profit strategies (84.4%), on statistical discrimination (9.6%), and on taste discrimination (7.8%). Key words: Field Experiment, Ethnic Discrimination., Hiring Discrimination, Insurance Coverage, Wage Inequality. JEL classification: J7, J16, J31, J42, J64, J71, J82. a. Corresponding Author. Department of Economics, University of Crete, University
Campus at Gallos, Rethymno 74100. Tel: 28310 77396; Fax:2831077406 E-mail: [email protected] b. Department of Economics, University of Crete *We acknowledge benefit from comments and suggestions made during the presentation of an earlier version of this paper in the Economics Seminars Series of the Department of Economics at the University of Crete. The usual disclaimer applies.
1

1. Introduction
There is significant literature across social sciences, which analyzes
discrimination in labour markets on the grounds of race and ethnicity. In Greece,
however, little work has been done in measuring discrimination and what we do know
comes mainly from national observatories. The scope of this paper is to measure the
existence of racial discrimination in the Greek private market, two years after the
national adoption of the European anti-discrimination employment legislation
(2005/3304).
Racial/ethnic discrimination has been a particular focus of recent efforts by
European lawmakers, at least in part to the dramatic growth of racism in Europe
following the end of Communism. We are particularly interested in investigating
whether male Albanians 1 face discriminatory treatment in the labour market,
compared to Greeks, and to evaluate whether stereotypes prejudice the Greek
employers’ screening processes.
Due to the absence of standardized economic data we employ the
Correspondence Test method in order to isolate the ethnic discrimination trend for a
specific period. The correspondence test is used for detecting discrimination in the
preliminary stage of the selection process, which for the ethnic minorities is seen to be
the most crucial barrier to the labour market. A typical correspondence test entails that
the researcher sends two equal - in human capital- applications (CV’s), to advertised
job openings. The only characteristic that differs between the two (pseudo)
applications is the ethnicity of the candidates. Ethnic discrimination is then measured
by the difference in the number of call backs for interview between the two ethnic
groups. The main advantage of this approach is that one can get direct measurements
of the employers’ attitudes2.
In our study we extend this test by gathering data concerning insurance
coverage registrations to the Social Security Organization (IKA) as well as wage
1It was not until the collapse of the communist Albanian government in 1991 that Greece experienced the first flows of immigration. Ten years later around the 60% of immigrants in Greece are from Albania (Greek Census, 2001). 2Following Adam Barry (1981), we assume that employers by offering an interview are indicative of their willingness to consider applicants employable.
2

offers, in cases of positive responses. At this instance, in contrast to the customary
methods of interview data and wage decomposition, we choose the correspondence
test for two reasons: First, because interview data is a rather biased method, since
native (migrant) workers may overstate (understate) their position in the labour
market. Whilst, researchers can with the correspondence test themselves act as
workers and record the reality. Second, because Census data concerning migrant
wages are not available, in Greece. While, even in countries where such data are
available,3 wage decomposition has been subject to considerable criticism as it is
thought to be a biased method for discrimination tests4.
Thus, our study examines labour market discrimination by essentially using
experimental data. Concentrating on low skilled workers our sample particularly
refers to: (a) office jobs, (b) factory jobs, (c) café and restaurant services and (d) shop
sales. Our findings provide strong evidence for discrimination against Albanians in all
three dimensions. Albanians face 43.5% less chance of access to occupations. More
interestingly, concentrating on the 49.7% equal chance cases of access to occupations,
we found that Albanians face 36.5% less chance of being registered with insurance
coverage, while their potential wage contracts are 8.8% below those of Greeks, and
5.3% below the legal minimum wage. Last, but not least, in order to evaluate the
reasons for wage discrimination, we appealed to the most appropriate group to judge:
The employers who defined the outcome. Using an indirect method, we found that the
factors contributing to wage inequality are the firms’ profit strategies (accounting for
the 84.4% of the total), followed by ambiguities concerning Albanians’ productivity
(9.6%), whilst a “dislike” against Albanians accounts only for the 7.8%.
The rest of the paper is organized as follows. In the next section we sketch out
the phenomenon of ethnic discrimination in the European labour market, as well as
the recent anti-discrimination legislation, and we briefly review the theoretical
explanations of labour market discrimination. In the third section we report various
forms of discriminatory contracts in the Greek labour market and we present the
3Various economists have attempted to offer economic explanations for the phenomenon of ethnic discrimination in wages, drawing largely on the U.S. Black and White experiences (Altonji and Black, 1999; Cain, 1986; Oaxaca, 1973; Blinder, 1973). Regressions show that ethnic minority groups earn less than the majority native workers. 4Wage decomposition combines the estimated coefficients for national wages and the values of the explanatory variables for ethnic workers. The criticism involves around the specifications of the model and the choice of independent variables. There is no conclusive proof of discrimination as long as all other possible relevant variables have not been identified (Bovenkerk, 1992).
3

model encapsulating our investigating relationships. In the fourth section we describe
the methodology and the application structure of our investigation. In the fifth section
we present and evaluate the field results of our correspondence test, regarding
occupational access for Greek and Albanian workers, as well as regarding wage
discrimination. In the sixth section we present the methodology, application, and
results of our second experiment concerning the factors which account for wage
discrimination.The last section concludes.
2. Ethnic Discrimination, Legislation, and Theoretical Explanations
Discrimination is complex, multifaceted and deeply ingrained in behaviour,
and difficult to measure or quantify5. Discrimination is understood to exist when
some superficial characteristic is used in an attempt to restrict individuals’ access to
the available economic, political, and social opportunities for advancement (D’Amico,
1987). The targeted discrimination groups may vary, across locations, but in general
include: women, immigrants, roma, youth, elderly, children, disabled, gay and
lesbian, bisexual, transgender and transsexual people6.
In the European labour market most vulnerable to racial/ethnic discrimination
seem to be Third World nationals, migrants, asylum seekers, undocumented migrants
and Geneva Convention refugees. Complaints concerning employment refer mainly to
wages, payments of overtime, recruitment, contracts, racial harassment, and
promotions 7 . Migrants from non-European Union (EU) countries, and certain
autochthonous minority groups, display much lower participation and employment
rates than the natives’ or the migrants’ from the E.U.8 On the other hand, however,
anti-discrimination policy is an important part of the Union’s approach to
immigration, inclusion, integration and employment. The inclusion of Article 13 in
the European Community Treaty, following the entry into force of the 1997
Amsterdam Treaty, empowered the Union to deal with discrimination on a range of
5See McConnell, Brue and Macpherson (2006). 6According to the Eurobarometer survey based on questionnaire covered by the Community Action Programme against Discrimination (57.0, 2003), in the 15 Member States, the most often cited for witnessed discrimination is racial or ethnic 22%, followed by learning difficulties or mental illness 12%, physical disability 11%, religion or beliefs 9%, age and sexual orientation each 6%. 7According to a questionnaire conducted by the European Trade Union Confederation (2003), almost twenty-one, out of twenty-four, national trade unions surveyed agreed that migrants and ethnic minorities face higher levels of unemployment, lower pay and slower promotion. 8For the year 2005 the share of non EU 25 nationals in population is 6%. The unemployment rate of non EU 25 nationals is 17% against 9% for the EU nationals and their employment rate is 55% against 65% (Eurostat Labour Force Participation).
4

grounds, including racial/ethnic origin, religion or belief, age, disability and sexual
orientation. That development in turn led, in 2000, to the unanimous adoption by the
Council of two directives, the Racial Directive (2000/43), and the Employment
Equality Directive (2000/78), both aiming to ensure that everybody living in the E.U.
can benefit from effective legal protection against discrimination 9 . Greece, as an
instance, by adopting the two Directives in January 2005 (2005/3304), made labour
market discrimination a legally prohibited act.
The theoretical explanations of labour market discrimination are concerned
with how and why productively irrelevant characteristics influence the labour market
behavior of employers and workers (Swinton, 1977). There is not, however, a
generally accepted economic theory of discrimination, while there are a variety of
reasons for it:
The taste hypothesis (Becker, 1957; 1971) envisions discrimination as a
preference (or taste) for which the discriminator is willing to pay. In particular, the
employers’ taste for discrimination is based on the idea that they want to maintain a
physical or social distance from certain groups. Employers are then willing to
sacrifice profits, by paying higher wages than they need to, or by accepting workers
less qualified than others they could recruit at the same wage. The trouble with this
explanation is that it contradicts in a direct way the usual view of employers as profit-
maximizers10.
The Marxist approach (Baran and Sweezy, 1966) views racism as a tactic used
by employers to introduce class cleavages within the working class. Economic gain
rather than psychic preference is then the main motive for discrimination. Wage
discrimination simply pays in terms of maximizing profits. Jobs are organized to take
wage advantage of ethnic workers, and the tactic is intended to minimize labour costs,
9In particular, Directive 78 applies to a range of grounds, including racial or ethnic origin, religion or belief, age, disability and sexual orientation (regarding both the public and private sectors), in relation to: (a) Conditions for access to employment, to self-employment and to occupation, selection criteria and recruitment conditions, whatever is the branch of activity and the level of the professional hierarchy (including promotion). (b) Access to all types and to all levels of vocational guidance, vocational training, advanced vocational training and retraining, including practical work experience. (c) Employment and working conditions, including dismissals and pay, (d) Membership of and involvement in an organization of workers or employers, or any organization whose members carry on a particular profession, including the benefits provided for by such organizations. Directive 43 applies only to racial or ethnic origin and includes all the above cases (a)-(d) and further it enforcement to: (e) Social protection, including social security and health care. (f) Social advantages. (g) Education. (h) Access to the supply of goods and services which are available to the public (including housing). 10In a perfectly competitive market, each worker is paid the marginal revenue product of his/her labour. If a worker is paid less implies discrimination.
5

by weakening the workers’ bargaining position, or perhaps to stall the worker-
stemming long-run threat to the capitalistic system. Employers’ well being is
therefore improved as they are able to raise their expected incomes through
discrimination.
The idea that competition may eventually eliminate discrimination led to the
development of the statistical discrimination hypothesis (Arrow, 1972, 1973; Phelps,
1972; Aigner and Clain, 1977). Discrimination results from the profit maximizing
response of employers to uncertainty about the quality of individual workers, while
the real or subjective distributions favour the group which receives preferences.
Stereotyping plays the major role in this approach. Statistical models of
discrimination predict that if employers perceive minorities as being generally less
productive than majorities, and if it is difficult to measure the actual workers’
productivity, then minorities with above-average productivity may receive below-
average returns.
Finally, an alternative explanation for wage discrimination is more recently
given, in a Union-Oligopoly context (Drydakis and Vlassis, 2006). If union members
possess different reservation wages, unions may offer to firms the option to
discriminate firm-specific wages across equally-skilled employees and by that to
achieve lower costs which lead to higher profits.
3. Uninsured Employment and Ethnic Discrimination in the Greek Labour Market 3.1 Various forms of discriminatory contracts
The main task of social security is to offer insurance coverage to its members
through benefits. In Greece, compulsory insurance formally starts on the very first day
of employment, in the country’s largest Social Security Organization (IKA), which
covers in general those in dependent employment. It meets the needs of its insured
members in medical care and benefit payments, such as old age pensions, disability
pensions, maternity aid, sickness-accident allowance etc.
Employee registration with IKA implies mandatory contribution payments for
both the employer and the employee based on employee wage levels, which cannot be
lower than the legal minimum wage in proportion to employee characteristics.
Uninsured employment or insured employment with inaccurate data constitute illegal
treatment and are penalized by fines. In practice, however, illegal treatment takes the
form of ″silent″ (or, tacit) agreements between employers and employees: Either
6

employees agree to be registered with IKA only after they have certified their
productiveness, or they are registered on condition that they have to deposit a fraction
or the total employers’ contributions to IKA for a period. In all cases, the employers
exploit the employees’ need for income, while firms’ costs and employees’ net
receipts decrease with insurance contributions. Moreover, employees may be often
registered as being less human-capital-endowed with less work experience and in
general with few characteristics than they actually possess. Thereafter, wage level
depends on the tacit agreement’s terms. On the other hand, those employers who
refuse to register employees have a wider range of discriminatory wage contracts to
offer. Immigrants are hereby most affected, as they typically face higher statistical
discrimination.11
3.2 Pair-wise Modeling
The above practices imply that ethnic (or other) discrimination in the Greek
labour market may take various forms, while its reasoning seems to fit well with any
of the profit maximization - compatible explanations reviewed in the previous
section. Nonetheless, our field experiment investigates for all possible source of
discrimination, as follows.
First, to allow for a taste for discrimination, we want to examine whether
ethnicity affects an applicant’s probability of receiving a job interview [ ]. To
particularly measure whether Greek employers have a taste for discrimination against
Albanians, following Neumark et al (1996), we define the following relationship:
ISP
uaP ISIS +Ε+= β (1)
Where: P is the latente regression explaining the probability of receiving a job
interview, and has a value of one (zero) when applicants receive an interview
(otherwise); I refers to the interview stage; S refers to the sectors; a is the
constant; β is the parameter of the ethnic variable; E refers to the ethnicity and has a
value of one (zero) when the candidate is a Greek (Albanian); u is the disturbance
term. We can estimate equation (1) as a Probit model. If 0=β then the Greek and
Albanian have the same probability of receiving an interview. If 0<β then the
Albanian candidate has a higher probability of receiving an interview than the Greek
11 See, e.g. Psimmenos and Kassimati (2004).
7

one. If 0>β then the Greek candidate has a higher probability of receiving an
interview than the Albanian one. Our field experiment is designed so as, based on
application forms, observable differences between the Greek and the Albanian
candidate do not exist. The two candidates are identical in every respect except their
ethnicity. Hence, E is not correlated withu .
Second, we are interested in whether ethnicity affects an applicant’s
probability of being registered with insurance coverage [ ]. Here, our Probit model
is defined by the following estimable relationship.
BSP
uaP BSBS +Ε+= β (2)
Where B refers to the insurance coverage stage.
Last, but not least, we are interested in whether ethnicity affects employee
wage offers. For that we analogously define the following relationship.
uW SHSH +Ε+= βα (3)
WhereW refers to the monthly wage offers and H refers to the wage offer stage.
Note that in all three equations no other control variables are necessary since
the applicants are matched in all characteristics other than ethnicity.
4. Correspondence Test: Methodology and Application Structure
4.1 Methodology
Descending the seminal paper of Riach and Rich (2002), different forms of
field experiments have been used to test for discrimination in hiring. Due to their
simplicity and controllability, these real-life experiments have become quite popular
and they have been carried out in at least fifteen countries. In such an experiment, the
term Correspondence Test particularly refers to the technique of written approaches
for interview access to advertised vacancies12.
Our field experiment was conducted between May 2006 to January 2007 and
the geographical parameters involved the major city of Greece, Athens. We had
concentrated on low skilled vacancies, because 78% of male Albanians in Greece are
low skilled (Greek Census, 2001). The four occupations to which we had focused on
were: office jobs, factory jobs, café and restaurant services and shop sales. They have
12There are two other procedures that had been previously used to measure the extent of discrimination in labour market. These methods involve personal approaches, in which individuals either apply over telephone (Brown and Gay, 1985; Hubbuck and Carter, 1980) or they attend job interviews (Daniel, 1968; McIntosh and Smith, 1974).
8
been chosen because, while there are many low skilled vacancies in agriculture,
construction, cleaning, and delivery, in most those cases only telephone contact was
available.
Our correspondence testing is structured into three stages. At the first stage we
are interested in measuring occupational access for Greek and Albanian workers. We
fabricated two imaginary, equal human-capital workers, applying to the same job by
written applications (CV’s). The two applications were posted simultaneously, within
one day of the advertisement appearing, using fax devices. If a firm was interested
about any of the applicants, he could be contacted, either through an available
address, or by telephone contact. At the second stage, we are interested in gathering
insurance coverage registrations (IKA), whilst at the third stage in gathering monthly
wage offers. Two of our associates were trained in what to say, in the case of a
positive call back, in order to respond equally. Taking advantage of the low status
vacancies and the naive portfolio of employees we were enabled to address relevant
questions directly.
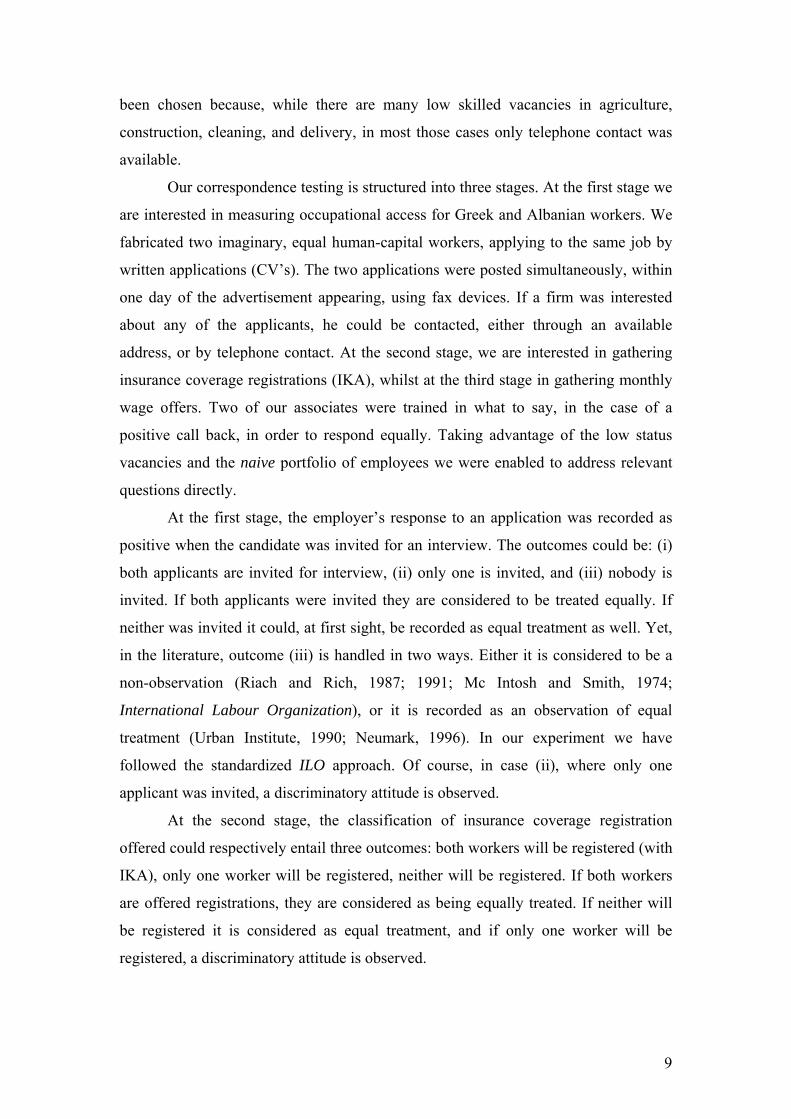
At the first stage, the employer’s response to an application was recorded as
positive when the candidate was invited for an interview. The outcomes could be: (i)
both applicants are invited for interview, (ii) only one is invited, and (iii) nobody is
invited. If both applicants were invited they are considered to be treated equally. If
neither was invited it could, at first sight, be recorded as equal treatment as well. Yet,
in the literature, outcome (iii) is handled in two ways. Either it is considered to be a
non-observation (Riach and Rich, 1987; 1991; Mc Intosh and Smith, 1974;
International Labour Organization), or it is recorded as an observation of equal
treatment (Urban Institute, 1990; Neumark, 1996). In our experiment we have
followed the standardized ILO approach. Of course, in case (ii), where only one
applicant was invited, a discriminatory attitude is observed.
At the second stage, the classification of insurance coverage registration
offered could respectively entail three outcomes: both workers will be registered (with
IKA), only one worker will be registered, neither will be registered. If both workers
are offered registrations, they are considered as being equally treated. If neither will
be registered it is considered as equal treatment, and if only one worker will be
registered, a discriminatory attitude is observed.
9

As in turn regards the third stage, an employer’s response could comprise of
only two it may outcomes. Either both workers are offered equal wages, or the wage
offers vary across ethnicities.
4.2 Application Structure
The vacancies in our four occupations were found in website newspapers. We
applied to vacancies where there was a specific demand for low skilled male workers
for, eight-hour and five-day, employment. The qualifications and presentation style of
the two (pseudo) applicants were matched as closely as possible, so that they were
identical in all employment relevant characteristics but ethnicity. In each application
we provided all the necessary information, to eliminate the possibility of statistical
discrimination, at the preliminary stage of the hiring process. Each application was
designed to equally convey the type of experience that might make an applicant
attractive.
The fictitious applications consisted of a name and last name, a mobile
telephone number, and a postal address. In the candidates’ CVs there was a specific
ethnicity reference. The addresses were chosen so that to be recognized as similar as
possible, in order to indicate the same social class. Applications showed the same
level of schooling and job experience. Both candidates have finished Greek high
schools, approximately twelve years ago, so for the Albanian candidate the Greek
language couldn’t be an effective constraint. Furthermore, the applicants were 29
years old, unmarried and had carried out military service. Both had nine years of work
experience in the same position as each vacancy applied for. To avoid detection,
candidates’ high schools and previous workplaces were located at different areas in
Athens. Similarly, the candidates had carried out military service in different areas.
Finally, both had similar hobbies/interests and personal characteristics. The styles of
CVs and cover letters were, however, different for each pair. Whereas, in order to
control for the possibility the style of an application to influence an employer’s
response, the application forms were allocated equally between the Greek and
Albanian applicant. For the same reason, the applications were sent alternately to each
vacancy. Of course, in all cases applications were sent from different fax numbers.
10

5. Field Results
5.1 Interview Invitation
At the first stage, by pairs of candidates and by type of jobs, six events are
defined: nobody is invited , at least one is invited (usable test) , both are
invited (equal treatment) , discrimination against Albanians , discrimination
against Greeks , and net discrimination . Where,
][ IN ][ IU
][ IE ][ IDA
][ IDG ][ IND =I refers to the
interview stage. Let the probabilities of these events be respectively indicated by:
INP , , , , , . Where, IUP
IEPIDAP
IDGPINDP nzPz /= , with },{ II UNz = ; job
openings, and , with .
=n
If UfP /= },,,{ IIII NDDGDAEf =
The International Labour Organization defines net (ethnic) discrimination as:
.Accordingly, ifIIIND UDGDAPILO
/)( −= 0=INDP the Greek and Albanian candidates
receive equal treatment. While, if , the Albanian candidate faces lower access
in the labour market than his Greek counterpart. The opposite occurs if .
0>INDP
0<INDP
The last row of Table 1 displays our total probability results. Column (1)
shows that in 50.8% cases neither candidate is invited. Column (2) shows that
in 49.1% cases at least one candidate is invited. Column (3) shows that in
49.7% cases Greeks and Albanians face equal treatment . Column (4) shows that
Albanians face 46.9% discrimination , while column (5) shows that Greeks face
3.3% discrimination as well . Nonetheless, column (6) shows that net
discrimination (as defined by ILO) is 43.5% for the Albanian candidates .
][INP
][IUP
][IEP
][IDAP
][IDGP
][INDP
11

Table 1 Invitation to Interviews - Probability Results (%) -
Outcomes Occupations Job Opening
(1)
INP
(2)
IUP
(3)
IEP
(4)
IDAP
(5)
IDGP
(6)
INDP
(7) χ2
test
Office Jobs 173
42.77 57.22 30.30 67.67 2.020 65.65 61.23*
Factories 217
59.44 40.55 53.40 43.18 3.409 39.77 29.87*
Restaurant and Café Services 241
48.54 51.45 67.74 28.22 4.032 24.19 22.50*
Shop Sales 158
51.26 48.73 41.55 54.54 3.896 50.64 33.80*
Total 789
50.82 49.17 49.74 46.90 3.350 43.55 146.46*
Note: Statistically significant at 1% (*).
More importantly, net discrimination , as tested by the criterion for
differences in attributes, is found to be statistically significant at the 1% level of
significance
][ IND 2x
13 (Column 7): The high value of the test shows that ethnic origin and
discrimination are highly correlated. Hence, our data can not support the hypothesis of
the independence of the two attributes.
2x
Moreover, we are interested in examining the sign pattern of our sample, and
we have therefore performed the conditional sign test for symmetry14: Under the null
hypothesis (symmetry), it can be:
Either,
%,50)/(0 =+= III DGDADGH
Or,
%50)/(0 =+= III DGDADAH .
In our case, the pattern outcome was always found to be in the same direction, i.e., the
Greek favored proportion is always bigger than the Albanian favored proportion and
we can thus reject symmetry (Table B, Appendix 1).
Thereafter, we are interested in examining whether our four samples come
from the same binomial population. Using pooled estimators, we have thus tested for,
and accepted homogeneity, since:
13We had first to examine whether the , and distributions are normal. We had therefore performed the -goodness of fit Kolmogorov-Smirnov test- and accepted the (null) hypothesis of normality (Table A, Appendix 1).
][ IDA ][ IDG ][ IND
14For extensive discussions see Heckman and Siegelman (1993).
12

%7.6)/( =+ III DGDADG ; %3.93)/( =+ III DGDADA
(Table C, Appendix 1).
Turning to Table 1, in office jobs Albanians were found to face 30.3%
(65.6%) equal treatment (net discrimination), which were the lower (higher) bounds
across occupations: They respectively face 41.5% (50.6%), in shop sales, 53.4%
(39.7%), in factory jobs, and 67.7% (24.1%), in restaurant and café services. Hence,
regarding office vacancies, which can be considered as the white collar ingredient of
our reference occupations, we may conclude that Albanians face higher occupational
discrimination. However, regarding factory vacancies (which can be respectively seen
as the blue collar occupation), Albanians seem to face higher net discrimination
compared to restaurant and café vacancies.
5.2 Insurance Coverage Registration
At the second stage, discrimination is assigned whenever an employer refuses
to register a potential employee with insurance coverage, on the first employment day.
In order to identify discrimination, at this stage, we have concentrated on the equal
treatment cases, as assigned at the first stage. Similarly, we have defined five
outcomes: , , , , , where now BU BE BDA BDG BND =B refers to the insurance coverage
stage. Moreover, we now need to define the outcome where firms refuse to inform
whether they would register one, or both, candidate(s) with insurance coverage .
Also, we need to define the outcome where firms refuse to register both
candidates .
][ BN
][ BR 15
In Table 2 we report our relevant probability results. Column (1) shows that in
37.8% cases firms refused to inform whether they would register (with IKA), either
one, or both, worker(s) . Column (2) shows that in 19.6% cases firms refused
to register both workers . Column (3) shows that in 42.4% cases at least one
candidate would be registered . Column (4) shows that in 63.4% cases both
][BNP
][BRP
][BUP
15Let the probabilities of events indicated by: , , , , , , . We
assume that ; andBNP
BRPBUP
BEPBDAP
BDGPBNDP
Ir ErP /= },,,{ BBB URNr = Bh UhP /= ; },,,{ BBBB NDDGDAEh = .
Then, if the Greek and Albanian candidates receive equal treatment. If , the Albanian candidates face lower probability of being registered with IKA. The opposite occurs if
.
0=BNDP 0>
BNDP
0<BNDP
13

candidates would be registered . Column (5) shows that discrimination against
Albanians is 36.5%, which is also the net discrimination (since
discrimination against Greek is 0%). Net discrimination was found to be
statistically significant at the 1% level of significance (Table D, Appendix 1).
][BEP
][BDAP ][
BNDP
][BDGP ][ BND
Table 2 Insurance Coverage Registrations - Probability Results (%) -
Outcomes
Occupations Stage’s One Equal Treatment Outcome
(1)
BNP
(2)
BRP
(3)
BUP
(4)
BEP
(5)
BDAP
(6)
BDGP
(7)
BNDP
(8) χ2
Test
Office Jobs 30
36.66 23.33 40.00 83.33 16.66 0 16.66 2
Factories 47
19.14 8.510 72.34 73.52 26.47 0 26.47 9**
Restaurant and Café Services 84
48.80 22.61 28.57 45.83 54.16 0 54.16 13*
Shop Sales 32
37.50 25.00 37.50 50.00 50.00 0 50.00 6**
Total 193
37.82 19.68 42.48 63.41 36.58 0 36.58 30*
Note: Statistically significant at 1% (*), 5% (**).
Note that, while at the first stage, in 49.7% cases both candidates faced equal
access to interview calls , at the second stage both workers are offered insurance
coverage by 63.4%. This finding highlights that the outcome: equal chance of
access to occupations, is by no means discrimination free. On the contrary, as it turns
out, it obscures discriminatory treatment. To this end, interestingly, Greek candidates
were also found to face uninsured employment, yet in only 19.6% cases.
][IEP
][BEP
16
As it comes to occupations, in office jobs Albanians faced the lowest net
discrimination rate 16.6%, while that rate was 26.4% in factories, 50.0% in shop sales,
and 54.1% in restaurant and café services. At the same time office jobs faced the
highest equal treatment (83.3%), followed by factories (73.5%), restaurant and café
services (45.8%), and shop sales (50.0%). Consequently, even in low skilled
vacancies, more prestigious jobs entailed lower insurance coverage discrimination,
even though Albanians faced lower occupational access there. Also, in factories where
accident risk is higher, insurance coverage discrimination was, as expected, lower
compared to restaurant-café services and shop sales.
16 In most cases employers stated that employees must first accredit their skills, for a period, before they would be registered.
14

5.3 Wage Offers
At the third stage we are interested in measuring differences in wages offered,
across potential employees, and we similarly concentrate on the equal treatment
outcomes assigned at the first stage. As it is reported in Table 3, we found that
Albanians receive monthly wage contracts 8.8% below those of Greeks: Employers
are willing to pay the Greek (Albanian) candidate 641.06€ (584.04€). It therefore
seems that an ethnic penalty, of 57.02€ per month, applies. In order to further evaluate
our measurements, we subsequently compare the wages offered with the (legally
binding) minimum wages, as the latter are defined by the National General Collective
Employment Agreement (N.G.C.E.A.).
In Table 4 we present the minimum wages for unmarried employees and
workers, in proportion to their work experience. Our candidates were unmarried and
each had nine years of work experience. Minimum wage records were however
available for two periods, January to September 2006, and September 2006 to May
2007, and because our experiment was conducted from May 2006 to January 2007,
we used the average (minimum) wage rates of these two periods as a base of
comparison.
Table 3.Employers Wage Offers (€) – Discrimination Coefficient – Wage Measures Occupations Observations
(1)
Greek Mean Wage
GW
(2)
Albanian Mean Wage
AW
(3)
Difference in Ethnic Mean
Wages
AG WW −
(4)
Discrimination Coefficient
(%)
GAG WWWd /)( −=
(5)
ANOVA F – statistic
Office Jobs 16
716.87 629.37 87.50 =d 12.20 13.35*
Factories 23
673.91 607.39 66.52 =d 9.870 12.00*
Restaurant and Café Services 38
599.21 562.89 36.31 =d 6.060 6.086*
Shop Sales 17
618.82 557.00 61.82 =d 9.990 3.958*
Total 94
641.06 584.04 57.02 =d 8.890 24.55*
Note: Statistically Significant at 1 %(*).
15

Table 4.Minimum Wages (€) for Unmarried Employees & Workers as defined by the N.G.C.E.A.
Work Experiences Periods
No Experience Three Year Experiences
Six Year Experiences
Nine Year Experiences
I. January to September 2006 608.32 659.00 718.91 778.82
II. September 2006 to May 2007 625.97 678.11 739.76 801.41
Average I & II 617.14 668.55 729.33 790.11
As it can be noted from the last rows of Tables 3 and 4, the mean wage offer
for the Albanian candidates is found to be 5.3% below the no-experience minimum
wage rate. Whilst, the Greek mean wage offer is found to fall between the no-
experience and the three years of work-experience minimum wage rate. More
importantly, we have estimated a variety of occupation-specific discrimination
coefficients, ranging from 12.2%, in office jobs, to 6.0%, in restaurant and café
services. Whilst, as our performed ANOVA F-statistic test assures, in all occupations
the outcomes are found to be statistically significant at the 1% level (column 5 of
Table 3).
5.4 Regression Results
Finally, we evaluate the effect of ethnicity on labour market discrimination, by
means of our pair-wise (OLS) regressions (1)-(3) reported in Table 5. The equation’s
(1) estimations show that the Greek candidates face a higher probability of being
invited to an interview, which is a statistically significant outcome, in all occupations,
at the 1% level (column 5). Moreover, the equation’s (2) estimations show that the
Greek candidates face a higher probability of being registered with IKA, which, apart
from office jobs and shop sales, is statistically significant at the1% level (column 5).
Whilst, the equation’s (3) estimations show that the Greek candidates are also offered
higher wage contracts, which, apart from shop sales, is a statistically significant
outcome at the 1% level (Column 5).
16

Table 5 Equation Estimations – Paired Difference -
Occupations
Equations
(1)
Office Jobs
(2)
Factories
(3)
Restaurant and Café Services
(4)
Shop Sales
(5)
Total
(1)
β)
z-statistic Observations
1.049 (7.174)*
346
0.462 (3.625)*
434
0.318 (2.757)*
482
0.687 (4.603)*
316
0.577 (8.806)*
1578 (2)
β)
z-statistic Observations
0.270 (0.656)
38
0.2307 (2.432)*
76
0.802 (2.844)*
86
0.777 (1.901)
40
0.240 (3.853)*
240 (3)
β)
t-statistic Observations
87.50 (3.653)*
32
66.52 (3.464)*
46
36.31 (2.467)*
76
61.76 (1.989)
34
57.02 (4.955)*
188 Note: Statistically Significant at 1 %(*).
6. Employers Elucidate Wage Discrimination
In this section we report the findings of our second experiment, conducted in
order to evaluate to which extent the taste, statistical, and profit maximization-
compatible hypotheses, may consistently interpret our correspondence test’s results
regarding wage discrimination. For that experiment, we have utilized an indirect
approach as follows.
Those employers who had invited both candidates for interview were
telephoned, we told them that we are engaged in a research project, and they were
asked to rationalize (if they wish so) the factors which were responsible for wage
discrimination, already evidenced in their sector, by choosing among alternative
(proposed) causations. Since the interviewed employers had themselves already
decided the outcome of our correspondence test regarding wage discrimination, our
aim at this instance was to implicitly make them bring in to light the scope of reasons
they did so. Of course, our interviews were applied without revealing to employers
either their participation in the correspondence test or in the current experiment.
Specifically, after we had introduced to them the “fact”: based on a current
university research conducted to your sector, regarding male Greeks and Albanians,
having the same age, equal qualifications and experience, Albanians were found to
face wage discrimination, employers were asked to confirm or not the following
propositions (see, e.g., Appendix 2).
17

Proposition 1: Do you believe that the Greeks’ higher wages come from dislike
against Albanians?
Proposition 2: Do you believe that the Albanians’ lower wages come from ambiguities
concerning their productivity?
Proposition 3: Do you believe that the Albanians’ lower wages is a firms’ profit
maximization strategy, apart from what it is entailed in Proposition 2?
In Table A (Appendix 2) we report the received probability results regarding
proposition 1. While the “dislike” against Albanians is found to account for the 24.2%
(column 2), it had nothing to do with wage discrimination in all other (75.5%) cases
(column 3). As tested by the criterion for differences in percentages, this difference
is found to be statistically significant at the 1% level (column 4).
z
In Table B (Appendix 2) we respectively report the probability results for
Proposition 2. Although, based on our introductory “fact,” Greeks and Albanians had
equal human capital, there were still beliefs amongst employers (19.6%) that
ambiguities’ concerning Albanians’ productivity can be a factor for wage
discrimination (column 2). However, the employers’ vast majority (84.3%) does not
seem to believe that (column 3). This difference is similarly found to be statistically
significant (column 4).
In Table C we report the probability results assigned for Proposition 3.
Interestingly, approximately three out of four employers (73.6%) seem to believe that
wage discrimination is a firms’ profit strategy, apart from what is entailed in
propositions 2 (column 2). That difference as well found to be statistically significant
(column 4).
In Table D we report the probability results concerning how employers (as
they had effectively been asked to) weigh the three hypotheses/explanations of wage
discrimination. Employers were found to “put the blame” on taste discrimination by
7.8% (column 1), on statistical discrimination by 9.6% (column 2), while their vast
majority, on profit strategies by 84.4% (column 3). Focusing on the two most
preferable, we have subsequently tested their significance. We conclude that profit
strategies, rather than statistical discrimination, is the factor which employers accuse
most for wage discrimination (column 4).
Last, but not least, in Table E we report the probability results concerning how
employers weigh their second best choice. To that end, employers were found to “put
the blame” on statistical discrimination, by 82.8% (column 2), on profit strategies, by
18

15.9% (column 3), and on taste discrimination, by only 2.4% (column 1). Hence,
interestingly, the statistical hypothesis of wage discrimination was found to be the
employers’ (statistically significant) second best explanation (column 4). Moreover,
for robustness, employers were asked by “how much” prefer their first best choice
(Table D), to their second best one (Table E). Table F displays that the employers’
vast majority (88.4%) prefers by “very much” their first best choice, while only
11.5% prefers it by “quite a lot,” a difference which is also found to be statistically
significant (Table 4).
7. Conclusions
In January 2005 Greece adopted the two European anti-discrimination
Directives. The purpose of those directives was to lay down a framework for
combating discrimination, as regards employment and occupation, on the grounds of
religion or beliefs, disability, age or sexual orientation. The Directives make clear that
people affected by discrimination should have adequate means of legal protection and
an effective right of redress in order to be able to get things put rights. Presumably,
therefore, workplace equality has currently the backing of the law. However, a history
of discrimination can’t turn overnight. The law on its own can chance very little of it.
In this study we investigate the extent of ethnic discrimination in the labour
market using field data. We have used correspondence testing to examine directly
whether ethnic discrimination currently exists in the Greek labour market. In
particular, we are interested in whether low skilled Albanians face discriminatory
treatment compared to -equal human capital endowed- Greeks. In previous studies,
field experiments have been also used to test for discrimination in hiring. In this
paper, while we also focus on the hiring process, we have extended the scope of
analysis by gathering information on insurance coverage registrations, as well as on
wage offers. Moreover, we have conducted a second experiment, by indirectly asking
those who are effectively deciding the discriminatory outcomes (i.e., the employers)
to “put the blame” on particular reasons.
The conclusion of our both experiments is that ethnic discrimination in the
Greek labour market is still significant. According to the International Labour
Organization measurement standards, we have estimated that Albanians face 43.5%
less chance of access to occupations. Moreover, concentrating on the 49.7% equal
chance (of access to occupations) cases, we argue that Albanians face 36.5% less
19

chance of being registered with insurance coverage, while their potential wage
contracts are 8.8% below those of Greeks and 5.3% below the legal minimum wage.
Interestingly, employers themselves “put the blame” for that, on profit strategies (by
84.4%), on statistical discrimination (by 9.6%), and on taste discrimination (by 7.8%).
References Adam, B. D., (1981): “Stigma and Employability: Discrimination by Sex and Sexual Orientation in the Ontario Legal Profession”, Canadian Review of Sociology and Anthropology, 18(2). Aigner, D. and Cain, C., (1977): “Statistical Theories of Discrimination”, in Discrimination in the Labor Markets, edited by O. Ashenfelter O. and Rees A., Princeton University Press. Altonji, J. G. and Blank, R. M., (1999): “Race and Gender in the Labour Market”, in the Handbook of Labour Economics, Volume 3C, edited by Ashenfelter O. and Card D. New York: Elsevier, 3143-3259. Arrow, K. J.,(1973): “The Theory of Discrimination”, in Discrimination in Labour Markets, edited by Ashenfelter O. and Rees A., Princeton: Princeton University Press, 3-33. Baran, P. and Sweezy, P., (1966): “Monopoly Capital”, New York: Monthly Review Press. Becker, G.S., (1957): “The Economics of Discrimination”, Chicago: University of Chicago Press. Bergmann, B.F., (1971): “The Effects on White Incomes of Discrimination in Employment”, Journal of Political Economy, vol 79. Brown, C. and Gay, P., (1985): “Racial Discrimination 17 Years After the Act”, London: Policy Studies Institute. Blinder, A.S., (1973): “Wage Discrimination: Reduced Form and Structural Estimates”, Journal of Human Resources, 436-455. Bovenkerk, F., (1992): “Testing Discrimination in Natural Experiments. A Manual for International Comparative Research on Discrimination on the Grounds of Race and Ethnic Origin”, Geneva: International Labour Organization.
20

Bovenkerk, F., Gras, M. and Ramsoedh D., (1995): “Discrimination Against Migrant Workers and Ethnic Minorities in Access to employment in the Netherlands”, International Migration Papers 4, Geneva, International Labour Office. Bozani, V., (2003): “Women Participation in the U.S. Labour Market for 1975”, Essay for the Department Seminar Applied Economics, Department of Economics, University of Crete. Cain, G., (1986): “The Economic Analysis of Labour Market Discrimination”, edited by A in Ashenfelter O. and Card D., Handbook of Labour Economics 694-785. Carlsson, M. and Rooth, D. O., (2006): “Evidence of Ethnic Discrimination in the Swedish Labour Market Using Experimental Data”, Baltic Business School, Kalmar University College, Sweden. Coate, S. and Loury, G., (1993): “Will Affirmative Action Eliminate Negative Stereotypes?”, American Economic Review 83, 1220-1240. Council Directive 2000/43/EC of June, 29, 2000: “Implementing the Principle of Equal Treatment Between Persons Irrespective of Racial or Ethnic Origin, 2000”, Official Journal of the European Communities. Council Directive 2000/78/EC of November, 27, 2000: “Establishing a General Framework for Treatment in Employment and Occupation, 2000”, Official Journal of the European Communities. D’ Amico, F. T., (1987): “The Conceit of Labour Market Discrimination”, American Economic Review, Vol. 77, No. 2. Daniel, W., (1968): “Racial Discrimination in England”, Middlesex: Penguin Books. Darity, A. W. and Mason, L. P., (1998): “Evidence on Discrimination in Employment: Codes of Color, Codes of Gender”, Journal of Economic Perspectives, Vol. 12, No.2, 63-90. Drydakis, N. and Vlassis, M., (2006): “A Union-Oligopoly Model of Endogenous Discrimination: Should it be Wage Discrimination Taxed or Discriminated Employment Subsidized?”, Department of Economics, University of Crete, Working Paper Series, 14. Dizelos, T., (1999): “The Plus and the Minuses for the Economy, Special Issue: Refugees-Immigrants: 100 Million Victims of Poverty-War in the Planet”, Eleftherotypia. Employment and Social Affairs: “Equal Community Initiative Results”. Eurobarometer 57.0, (2003): “Discrimination in Europe”. European Trade Union Confederation, (2003): “Migrant and ethnic minority workers: Challenging Trade Unions”.
21

Commission of the European Communities, (2004): “Equality and Non-Discrimination in an Enlargement Union”, Green Paper. Firth, M., (1981): “Racial Discrimination in the British Labour Market”, Industrial and Labour Relations Review, 265-272. Fix, M., Galster, G. C., and Struyck R. J., (1993): “An Overview of Auditing for Discrimination”, in Clear and Convincing Evidence, Measurement of Discrimination in America, edited by Fix M. and Stryk, Washington DC: Urban Institute Press, 1-68. Heckman, J. J., Siegelman P., (1993): “The Urban Institute Audit Studies: their Methods and Findings”, in Fix and Struyk. Heckman, J. J., (1998): “Detecting Discrimination”, Journal of Economic Perspectives, 101-116. Hubbuck, J. and Carter, S., (1980): “Half a Chance? A Report on Job discrimination against Young Blacks in Nottingham”, London: Commission for Racial Equality. Jomo, K. S.: “Ethnic Discrimination: A Critical Survey of Economic Explanations”, Department of Applied Economics, University of Malaya, Malaysia. McIntosh, N. and Smith, D., (1974): “The Extent of Racial Discrimination, Political and Economic Planning Broadsheet”, London: Political and Economic Planning, no 547. Macpherson, D., McConnell, and Brue, S., (2006): Contemporary Labour Economics, McGraw – Hill. Neumark, D., Bank, R.J., and Van Nort, K. D., (1996): “Sex Discrimination in Restaurant Hiring: An Audit Study”, Quarterly Journal of Economics, 915 – 941. Oaxaca, R., (1973): “Male-Female Wage Differentials in Urban Labour Markets”, International Economic Review, 693-709. Petit, P., (2004): “Hiring Discrimination: A Field Experiment in the French Financial Sector”, EUREQua, University of Paris / Pantheon – Sorbonne. Phelps, E. S., (1972): “The Statistical Theory of Racism and Sexism”, American Economic Review, 659-661. Psimmenos, I. and Kassimati, K., (2004): “Shifting Work Identities and Oppositional Work Narratives: The Case of Albanian Domestic and Construction Workers in Greece”, in Chrissi Inglessi, Immigration in Northern Versus Southern Europe Athens: Netherlands Institute at Athens. Rees, A., (1979): The Economics of Work and Pay, Harper and Row Publishers.
22

Reitz, G. Jeffery and Verma, (2004): “A. Immigration, Race and Labour: Unionization and Wage in the Canadian Labour Market”, Industrial Relations, Vol. 43, No.4. Riach, P. A. and Rich, J., (2002): “Field Experiments of Discrimination in the Market Place”, The Economic Journal, Vol. 112, F480-F518. Swinton, D.H.A., (1977): “Labor Force Competition Theory of Discrimination in the Labor Market”, American Economic Review: Paper and Proceedings 67:400-404. Weichselbaumer, D., (2204): “Is it Sex or Personality? The Impact of Sex Stereotypes on Discrimination in Applicant Selection,” Eastern Economic Journal 159-186.
23

Appendix 1
Table (A) Invitation to Interviews - Goodness of fit Kolmogorov-Smirnov Test - Test Value Outcomes
Kolmogorov – Smirnov test
IE 0.269
IDA 0.344
IDG 0.329
IND 0.332
Note: Statistically insignificant.
Table (B) Invitation to Interviews - Conditional Sign Test -
Conditional Discrimination
II DGDA +
Greek Favored Sign Proportion
Conditional Sign test
69 + 41 + 40 + 45 +
0.0625
Note: The conditional event is the no discrimination outcome of only one tester.
Table (C) Invitation to Interviews - Test of Homogeneity with Pooled Estimator -
Occupations Ethnic Discrimination
Pooled Estimators Homogeneity test
IDA 0.933
IDG 0.067
4.471
Table (D) Insurance Coverage Registration - Goodness of fit Kolmogorov-Smirnov Test - Test Value Outcomes
Kolmogorov – Smirnov test
BE 0.251
BDA 0.131
BND 0.131
Table (E) Insurance Coverage Registration – Conditional Sign Test - Conditional
Discrimination
BB DGDA +
Greek Favored Sign Proportion
Conditional Sign Test
2 + 9 + 13 + 6 +
0.0625
Note: The conditional event is the no discrimination outcome of only one tester.
23

Appendix 2
Experiment 2 – Questionnaire – Propositions - Fact
Based on a current university research conducted to your sector, regarding male Greeks and Albanians, having the same age, equal qualifications and experiences, Albanians were found to face wage discrimination.
Proposition1. Do you believe Greeks higher wages come from dislike against Albanians? (a) I don’t know (b) Yes (c) No Proposition2. Do you believe Albanians’ lower wages come from ambiguities concerning their productivity? (a) I don’t know (b) Yes (c) Proposition3. Do you believe Albanians’ lower wages is a firms’ profit maximization strategy, apart from what it is entailed in proposition 2? (a) I don’t know (b) Yes (c) Conclusive Remarks: I. Wage discrimination against Albanians is due to: (a) I don’t know (b) Dislike? (c) Ambiguities concerning their productivity? (d) Firms’ profit strategy, apart from (c)? II. Which is your second best choice: (a)? (b) ? (c) ? (d)? III. Would you prefer your first to the second best choice by: (a) I don’t know (b) A small amount? (c) Quite a lot? (d) Very much?
Table (A) Employers Interview Probability Results - Proposition 1 - Outcomes Occupations Correspondence’s Test Equal Treatment Cases
(1)
I Don’t Know %
(2)
Yes
%
(3)
No
%
(4) z
Test
Office Jobs 24
0 45.83 11
54.16 13
0.590
Factories 39
0 7.80 5
87.17 34
7.017*
Restaurant and Café Services 77
0 20.77 16
79.22 61
7.551*
Shop Sales 25
0 32.00 8
68.0 17
2.553**
Total 165
0 24.24 40
75.75 125
8.73*
Note: The z test is carried out between the "yes" and "no" outcomes. Statistically significant at 1% (*) , 5% (**).
24

Table (B) Employers Interview Probability Results - Proposition 2 – Outcomes Occupations Correspondence’s Test Equal Treatment Cases
(1)
I Don’t Know %
(2)
Yes %
(3)
No %
(4) z
Test
Office Jobs 24
0 37.5 9
62.5 15
1.773
Factories 39
2.564 1
15.78 6
84.21 32
6*
Restaurant and Café Services 77
6.493 5
6.944 5
93.05 67
11.181*
Shop Sales 25
0 40.0 10
60.0 15
1.418
Total 165
3.636 6
19.6 30
84.31 129
11.981*
Note: The z test is carried out between the "yes" and "no" outcomes.Statistically significant at 1% (*).
Table (C) Employers Interview Probability Results – Proposition 3 – Outcomes Occupations Correspondence’s Test Equal Treatment Cases
(1)
I Don’t Know %
(2)
Yes %
(3)
No %
(4) z
Test
Office Jobs 24
12.5 3
66.66 14
33.33 7
2.205**
Factories 39
10.25 4
57.14 20
42.85 15
1.211
Restaurant and Café Services 77
7.799 6
80.28 57
19.71 14
7.297*
Shop Sales 25
16.00 4
85.71 18
14.28 3
4.730*
Total 165
10.3 17
73.64 109
26.35 39
8.296*
Note: The z test is carried out between the "yes" and "no" outcomes.Statistically significant at 1% (*), statistically significant at 5% (**).
Table (D) Employers Interview Probability Results – Conclusive Remark I -
Outcomes Occupations Correspondence’s Test Equal Treatment Cases
(1)
Taste
%
(2)
Statistical %
(3)
Profit Max %
(4) z
Test
Office Jobs 24
8.333 2
16.66 4
75.0 18
4.225*
Factories 39
5.128 2
12.82 5
82.05 32
6.285*
Restaurant and Café Services 77
3.896 3
2.599 2
93.5 72
11.330*
Shop Sales 25
24.0 6
20.0 5
56.0 14
2.756*
Total 165
7.878 13
9.696 16
82.42 136
13.964*
Note: The ″I don’t know″ outcome is zero in all occupations. The z test is carried out between the most preferable outcomes.Statistically significant at 1% (*).
25
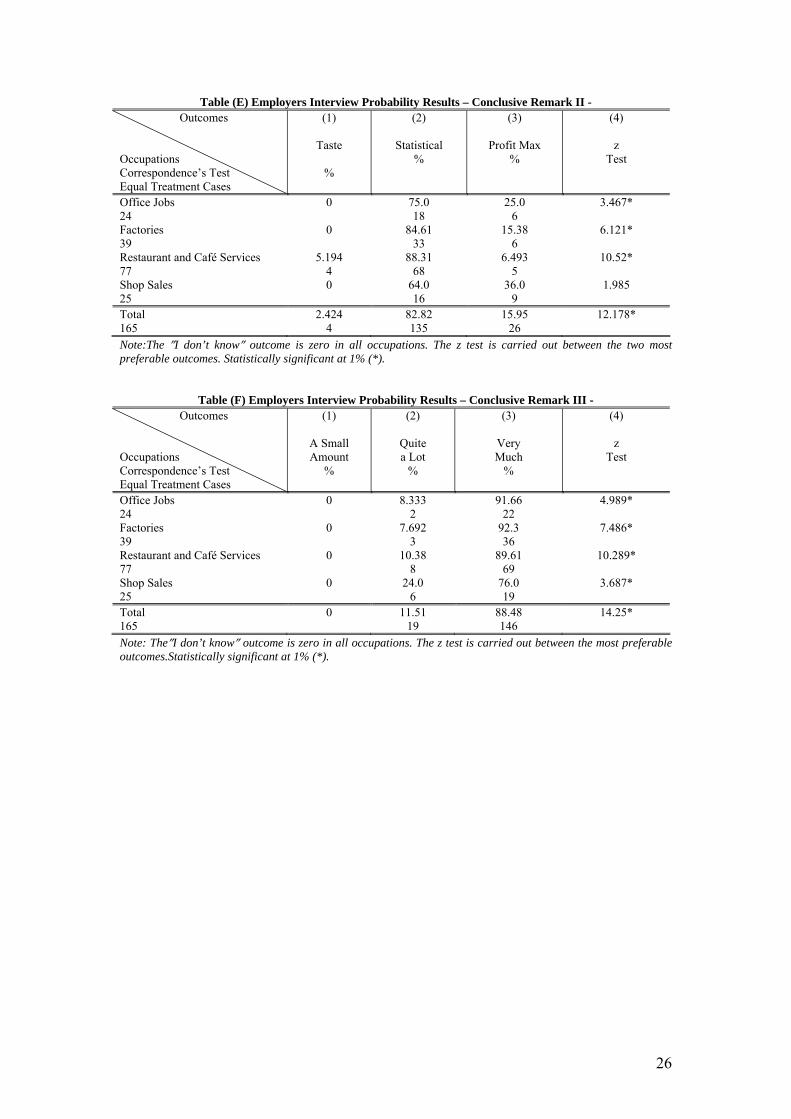
Table (E) Employers Interview Probability Results – Conclusive Remark II - Outcomes Occupations Correspondence’s Test Equal Treatment Cases
(1)
Taste
%
(2)
Statistical %
(3)
Profit Max %
(4) z
Test
Office Jobs 24
0
75.0 18
25.0 6
3.467*
Factories 39
0
84.61 33
15.38 6
6.121*
Restaurant and Café Services 77
5.194 4
88.31 68
6.493 5
10.52*
Shop Sales 25
0
64.0 16
36.0 9
1.985
Total 165
2.424 4
82.82 135
15.95 26
12.178*
Note:The ″I don’t know″ outcome is zero in all occupations. The z test is carried out between the two most preferable outcomes. Statistically significant at 1% (*).
Table (F) Employers Interview Probability Results – Conclusive Remark III - Outcomes Occupations Correspondence’s Test Equal Treatment Cases
(1)
A Small Amount
%
(2)
Quite a Lot
%
(3)
Very Much
%
(4) z
Test
Office Jobs 24
0
8.333 2
91.66 22
4.989*
Factories 39
0
7.692 3
92.3 36
7.486*
Restaurant and Café Services 77
0 10.38 8
89.61 69
10.289*
Shop Sales 25
0
24.0 6
76.0 19
3.687*
Total 165
0 11.51 19
88.48 146
14.25*
Note: The″I don’t know″ outcome is zero in all occupations. The z test is carried out between the most preferable outcomes.Statistically significant at 1% (*).
26

Figure 1
Access to Occupations Discrimination Coefficient
67,6
43,128,2
54,4 46,9
2 3,4 4 3,8 3,30
20406080
Office Jobs Factories Cafe &Restaurants
Services
Shop Sales Total
Occupations
%
Albanian Discrimination Coefficient Greek Discrimination Coefficient
Figure 2
Insurance Coverage RegistrationAlbanian Discrimination Coefficient
16,626,4
54,1 50
36,5
0102030405060
Office Jobs Factories Cafe & RestaurantsServices
Shop Sales Total
Occupations
%
Albanian Discrimination Coefficient
Figure 3
Wage Offers
629 607 562 557 584716 673
599 618 641
0100200300400500600700800
Office Jobs Factories Cafe &Restaurants
Services
Shop Sales Total
Occupations
Euro
Albanian Wage Offers Greek Wage Offers
27

Figure 4
Ethnic Wage Penalty
87,5
66,52
36,3
61,8 57
020406080
100
Office Jobs Factories Cafe &Restaurants
Services
Shop Sales Total
Occupations
Euro
Albanian Penalty
Figure 5
Wage Discrimination Coefficient
12,29,8
6
9,9 8,8
02468
101214
Office Jobs Factories Cafe &Restaurants
Services
Shop Sales Total
Occupations
%
Albanian Discrimination Coefficient
28

Curriculum Vitaes by Pair of Applicants – Synopses
Applicant A Curriculum Vitae First Name: Greek/Albanian Last Name: Greek/Albanian Ethnicity: Greek/Albanian Marital Status: Unmarried Date of Birth: .../.../1978 Address: Location Telephone: Mobile Military Services: Location, Carried Out in 1998 Education: Certificate of Greek high school in 1996 - Location Basic Knowledge of English and P/C Driving License Professional Experience: From August 1998 to January 2000 Appointment/ Firm From March 2000 to March 2003 Appointment/ Firm From April 2003 to …2006/7 Appointment/ Firm Interests: Travels and Sports. Personal Characteristics: Productive and Associable. Applicant B
Curriculum Vitae
First Name Albanian/Greek Last Name Albanian/Greek Date of Birth .../.../1978 Marital Status Unmarried Ethnicity Albanian/Greek Address Location Telephone Mobile
Experience
Appointment/ Firm February1998- November1999 Appointment/ Firm December1999-July 2004 Appointment/ Firm August2004-…2006/7
Education
Certificate of Greek high school in 1996 - Location English Basic Knowledge P/C Basic Knowledge
Personal
Military Services Carried Out in 1998 Hobbies Music, Cinema, Sports Personality Industrious, Efficient Driving License
29
Related Documents