Ethiopian Journal of Animal Production Volume: 16 Official Journal of the Ethiopian Society of Animal Production (ESAP)

Welcome message from author
This document is posted to help you gain knowledge. Please leave a comment to let me know what you think about it! Share it to your friends and learn new things together.
Transcript
Ethiopian Journal of
Animal Production
Volume: 16
Official Journal of the
Ethiopian Society of Animal Production (ESAP)

Ethiopian Journal of Animal Production An Official Journal of the Ethiopian Society of Animal Production (ESAP) Aims and Scope: The Ethiopian Journal of Animal Production is a peer reviewed journal publishing original basic and applied research articles, short communications, technical notes, and review articles dealing with livestock and livestock related issues. Although the journal focuses on livestock production in Ethiopia, papers from similar agro-ecological regions of the world are welcomed.
EDITORIAL BOARD Editor-in-Chief: Adugna Tolera, School of Animal and Range Sciences, Hawassa
University, P.O. Box 5, Hawassa, Ethiopia Section Editors: Animal Feeds and Nutrition: Ajebu Nurfeta, School of Animal and Range Sciences, Hawassa
University, P.O.Box 05, Hawassa, Ethiopia Animal Genetics and Breeding: Solomon Gizaw, International Livestock Research Institute, P.O.Box
5986, Addis Ababa, Ethiopia Animal Production and Health: Fekede Feyissa, Ethiopian Institute of Agricultural Research, Addis
Ababa, Ethiopia Livestock Socio Economics: Solomon Desta, MARIL, Addis Ababa, Ethiopia
Assistant Editors: Diriba Geleti, Ethiopian Institute of Agricultural Research, P.O. Box 2003, Addis Ababa,
Ethiopia Tesfaye Alemu, Oromia Agricultural Research Institute, Adami Tullu Research Center, Adami
Tullu, Ethiopia Mestawet Taye, School of Animal and Range Sciences, Hawassa University, P.O.Box 05,
Hawassa, Ethiopia
EDITORIAL ADVISORY BOARD
Azage Tegegne ILRI, Addis Ababa, Ethiopia
Alemayehu Mengistu Addis Ababa, Ethiopia
Alemu Gebre Wold Addis Ababa, Ethiopia
A. Pearson University of Edinburgh, UK
Beyene Chichaibelu, Debre Zeit, Ethiopia
Bekele Shiferaw ICRISAT, Nairobi, Kenya
C. Peacock FARM Africa, London, UK
E. Rege Nairobi, Kenya
J. Reed University of Wisconsin, USA
K. Peters Humboldt University, Berlin, Germany
K. W. Entwistle Australia
K. Zessin Free University Berlin, Germany
S. Ehui World Bank, Washington DC, USA
Tilahnu Sahlu Langston University, Oklahoma, USA
Tefera GebreMeskel Addis Ababa, Ethiopia
Tsegaye Habtemariam Tuskegee University, Alabama, USA
EJAP is published by the Ethiopian Society of Animal Production (ESAP)
©Ethiopian Society of Animal Production (ESAP) EJAP ISSN: 1607–3835 Volume 16, Number 1, 2016
No part of this publication may be reproduced, stored in a retrieval system or transmitted in any form or by any means, electronic, mechanical, photocopying, recording or other- wise, without prior permission of the publisher.
Cover page by Wossene Abay
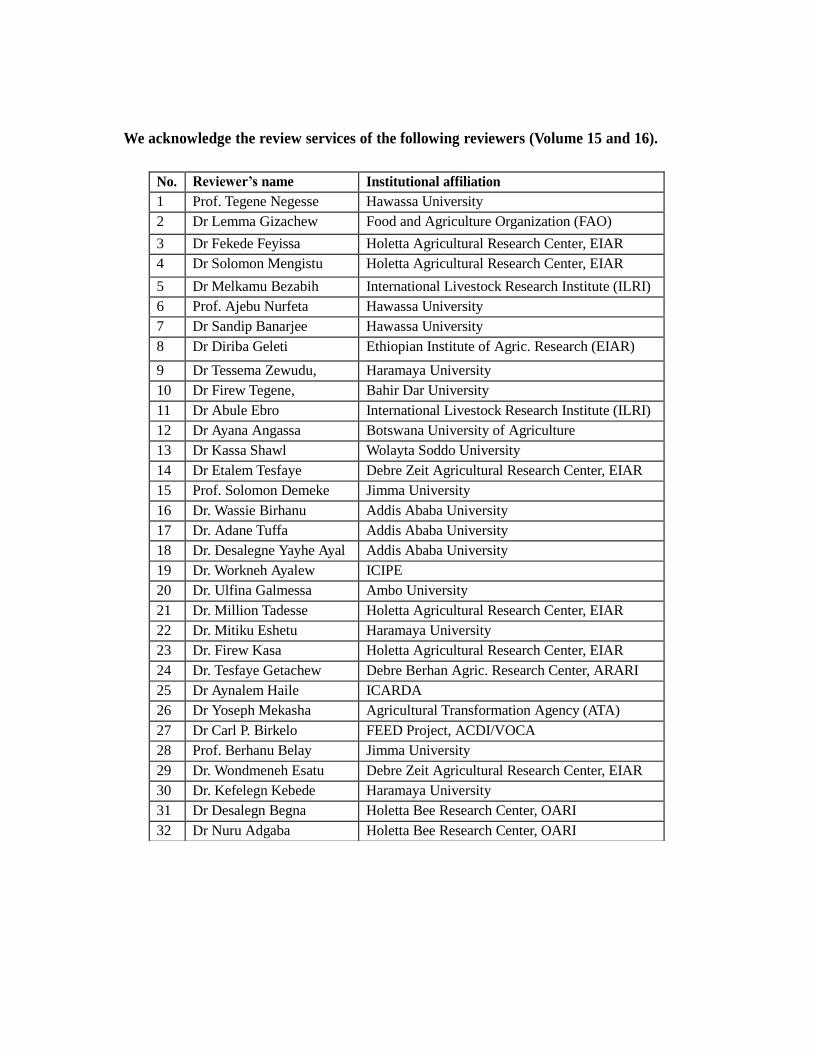
We acknowledge the review services of the following reviewers (Volume 15 and 16).
No. Reviewer’s name Institutional affiliation
1 Prof. Tegene Negesse Hawassa University
2 Dr Lemma Gizachew Food and Agriculture Organization (FAO)
3 Dr Fekede Feyissa Holetta Agricultural Research Center, EIAR
4 Dr Solomon Mengistu Holetta Agricultural Research Center, EIAR
5 Dr Melkamu Bezabih International Livestock Research Institute (ILRI)
6 Prof. Ajebu Nurfeta Hawassa University
7 Dr Sandip Banarjee Hawassa University
8 Dr Diriba Geleti Ethiopian Institute of Agric. Research (EIAR)
9 Dr Tessema Zewudu, Haramaya University
10 Dr Firew Tegene, Bahir Dar University
11 Dr Abule Ebro International Livestock Research Institute (ILRI)
12 Dr Ayana Angassa Botswana University of Agriculture
13 Dr Kassa Shawl Wolayta Soddo University
14 Dr Etalem Tesfaye Debre Zeit Agricultural Research Center, EIAR
15 Prof. Solomon Demeke Jimma University
16 Dr. Wassie Birhanu Addis Ababa University
17 Dr. Adane Tuffa Addis Ababa University
18 Dr. Desalegne Yayhe Ayal Addis Ababa University
19 Dr. Workneh Ayalew ICIPE
20 Dr. Ulfina Galmessa Ambo University
21 Dr. Million Tadesse Holetta Agricultural Research Center, EIAR
22 Dr. Mitiku Eshetu Haramaya University
23 Dr. Firew Kasa Holetta Agricultural Research Center, EIAR
24 Dr. Tesfaye Getachew Debre Berhan Agric. Research Center, ARARI
25 Dr Aynalem Haile ICARDA
26 Dr Yoseph Mekasha Agricultural Transformation Agency (ATA)
27 Dr Carl P. Birkelo FEED Project, ACDI/VOCA
28 Prof. Berhanu Belay Jimma University
29 Dr. Wondmeneh Esatu Debre Zeit Agricultural Research Center, EIAR
30 Dr. Kefelegn Kebede Haramaya University
31 Dr Desalegn Begna Holetta Bee Research Center, OARI
32 Dr Nuru Adgaba Holetta Bee Research Center, OARI
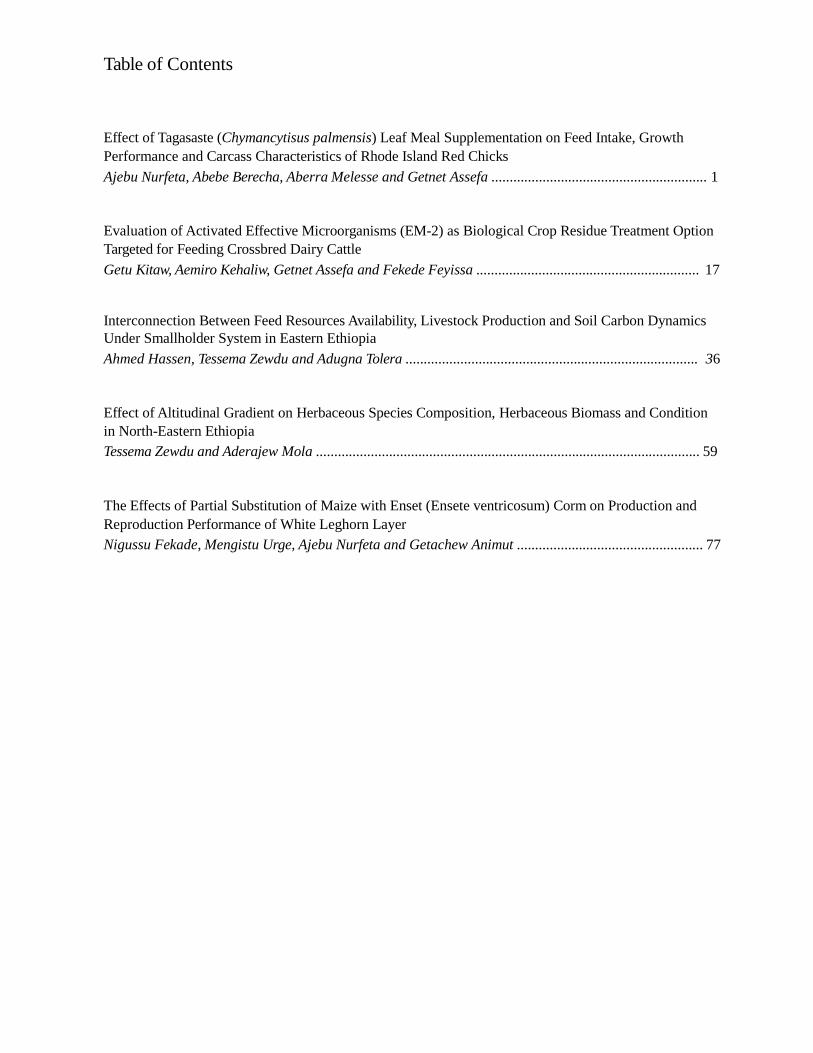
Table of Contents
Effect of Tagasaste (Chymancytisus palmensis) Leaf Meal Supplementation on Feed Intake, Growth
Performance and Carcass Characteristics of Rhode Island Red Chicks
Ajebu Nurfeta, Abebe Berecha, Aberra Melesse and Getnet Assefa ........................................................... 1
Evaluation of Activated Effective Microorganisms (EM-2) as Biological Crop Residue Treatment Option
Targeted for Feeding Crossbred Dairy Cattle
Getu Kitaw, Aemiro Kehaliw, Getnet Assefa and Fekede Feyissa ............................................................. 17
Interconnection Between Feed Resources Availability, Livestock Production and Soil Carbon Dynamics
Under Smallholder System in Eastern Ethiopia
Ahmed Hassen, Tessema Zewdu and Adugna Tolera ................................................................................ 36
Effect of Altitudinal Gradient on Herbaceous Species Composition, Herbaceous Biomass and Condition
in North-Eastern Ethiopia
Tessema Zewdu and Aderajew Mola ......................................................................................................... 59
The Effects of Partial Substitution of Maize with Enset (Ensete ventricosum) Corm on Production and
Reproduction Performance of White Leghorn Layer
Nigussu Fekade, Mengistu Urge, Ajebu Nurfeta and Getachew Animut ................................................... 77

Ajebu Nurfeta et al, /Eth. J. Anim. Prod. 16(1)-2016:1-16
Effect of Tagasaste (Chymancytisus palmensis) Leaf Meal Supplementation on
Feed Intake, Growth Performance and Carcass Characteristics of Rhode
Island Red Chicks
Ajebu Nurfetaa* Abebe Berecha
b, Aberra Melesse
a and Getnet Assefa
c
a School of Animal and Range Sciences, College of Agriculture, Hawassa University,
P.O. Box 222, Hawassa, Ethiopia bOffice of Agriculture and Rural Development, Limu Kosa Agriculture Office, Jimma Zone, Ethiopia
c Ethiopian Institute of Agricultural Research, Addis Ababa
*Corresponding author: Tel: +251916032359, Fax: +251462206711; e-mail: [email protected]
Abstract
Feed intake, growth performance and carcass characteristics of mixed sex Rode Island Red
chicks supplemented with varying levels of tagasaste leaf meal were evaluated in this study. One
hundred sixty day-old chicks with an average initial weight of 65.5 ± 8.9 g were allocated to 16
pens, with 10 chicks each in a completely randomized design. Four isonitrogenous and
isocaloric diets were formulated to contain tagasaste leaf meal at the rate of 0% (T1), 5% (T2),
10% (T3) and 15% (T4) of the total diet dry matter (DM). The amounts of feed offered and
refused were measured daily to determine feed intake. Body weights were taken on weekly basis.
At the beginning of the trial, 8 chicks were selected (excluding the 160 chicks) and slaughtered
for chemical analyses to determine nutrient retention. At the end of the trial, a male and a female
from each replicate were slaughtered for chemical analysis and carcass trait measurement. The
average daily DM intake for T4 (48.9 g) was higher (P<0.05) than that of T1 (45.9 g). The
highest (P<0.05) ash, calcium and crude fiber intake was observed in chicks fed T4 diets. The
crude protein intake was higher (P<0.05) in chicks supplemented with tagasaste leaf meal
compared to the non-supplemented one. The metabolizable energy intake was similar (P>0.05)
among treatment groups. The protein, energy and calcium retention decreased (P<0.05) as the
level of tagasaste leaf meal increased in the diet. The average daily gain was highest (P<0.05)
for chicks subjected to T1 while there were no significant difference (P>0.05) among the other
treatments. The slaughter, drumstick, thigh, back, breast and carcass weights were highest
(P<0.05) for T1 than the other treatments. The dressing percentage was similar (P>0.05) among
treatments. Tagasaste leaf meal could be considered as a good source of both protein and energy
for smallholder farmers where such supplements are not available. However, further study is
recommended aimed at increasing the efficiency of nutrient utilization.
Keywords: Growth performance, Carcass characteristics, Tagasaste leaf meal, RIR chicks.
1
Ajebu Nurfeta et al, /Eth. J. Anim. Prod. 16(1)-2016:1-16
Introduction
The dietary nutrient intake from egg and poultry meat is low in developing countries. According
to FAO (2011) the daily intake of animal protein in developing countries was 15 g which is very
low compared with 60 g for developed countries. The per capita consumption of meat in Ethiopia
was as low as 11-12 kg (Zewdu and Peacock, 2003) which is even lower currently. This indicates
that there is considerable potential for increasing the consumption of meat. Chicken play a
significant role in human nutrition and as income source and are one of the most suitable
resources to improve the livelihood of the poor. However, productivity of indigenous chicken in
Ethiopia is low (Fassil et al., 2010) which may be attributed to the poor feeding and management
practices coupled with poor genetic potential (Aberra et al., 2011a). In Ethiopia, there are about
56.87 million chicken populations of which 95.86% are indigenous breeds (CSA, 2014/15),
which are managed under scavenging systems where conventional concentrate supplement is
very little or non-existent.
There are shortages of protein supplements required for the preparation of balanced ration.
The feedstuffs used for poultry are often of a quality that could be fed directly to humans which
makes it difficult for poultry production especially under smallholder production system.
Conventional protein supplements are rarely available under such systems. Where available the
price of the conventional protein sources has steadily increased in recent times (Adugna, 2007).
As a result their use as poultry feed is limited (Messeret et al., 2011).
Therefore, feeding an alternative protein supplement which is not consumed by human being
could reduce competition and is expected to be sustainable. One of such sources of cheap protein
sources are the leaf meal of some tropical legumes and browse plants (Iheukwumere et al., 2008;
Aberra et al., 2009) which serves not only as a protein source but also supply vitamins, minerals
and caretenoids which are essential for chickens (Aberra et al., 2011b).
Tagasaste (Chamaencytisuse palmensis) is highly productive and extensively used as wilted,
dried and green fodder (Getnet et al., 2012). It is accepted as a cultivated commercial leguminous
browse species as a supplement in ruminant feeding in Australia (Lefroye et al., 1992). The
latest study by Feleke (2016) showed that tagasaste could grow at an altitude ranging from 750
masl to 1400 masl in Ethiopia. The leaf of tagasaste is highly palatable and it has been fed for
sheep, cattle and goats (Getnet et al., 2012). The level of hydrolysable tannin, condensed tannin
and alkaloids in tagasaste were below the level that causes toxicity in ruminants (Getnet et al.,
2008). Tagasaste leaves contain 16 to 22% crude protein, highly productive (11 t DM/ha) and
stays green during dry season (Getnet, 1998). So far there are no reports in literature which
evaluates the feeding value of tagasaste leaf meal as feed in poultry diet. Therefore, the objective
of this study was to evaluate the effect of feeding different levels of tagasate leaf meal on
nutrient utilization, growth rate and carcass characteristics of growing RIR chicks.
2
Ajebu Nurfeta et al, /Eth. J. Anim. Prod. 16(1)-2016:1-16
Materials and Methods
Experimental diets
The green fresh leaves of tagasaste (Chymaencytisus palmensis) were harvested after 6th month
of re-growth during dry season from Holleta Agricultural Research Centre (09oN; 38
oE). The
leaves were manually collected and spread on floor for sun drying for 3 to 4 days until it
becomes crispy while still retaining the greenish color. The dried leaves were ground by hand
mortar to produce the leaf meal. Maize, soybean, wheat bran, premixes and noug seed (Guizotia
abyssinica) cake were purchased from local market. Soybean was roasted until it assumes a
brown colour to deactivate trypsin inhibitor. The coarse feed ingredients were milled and mixed.
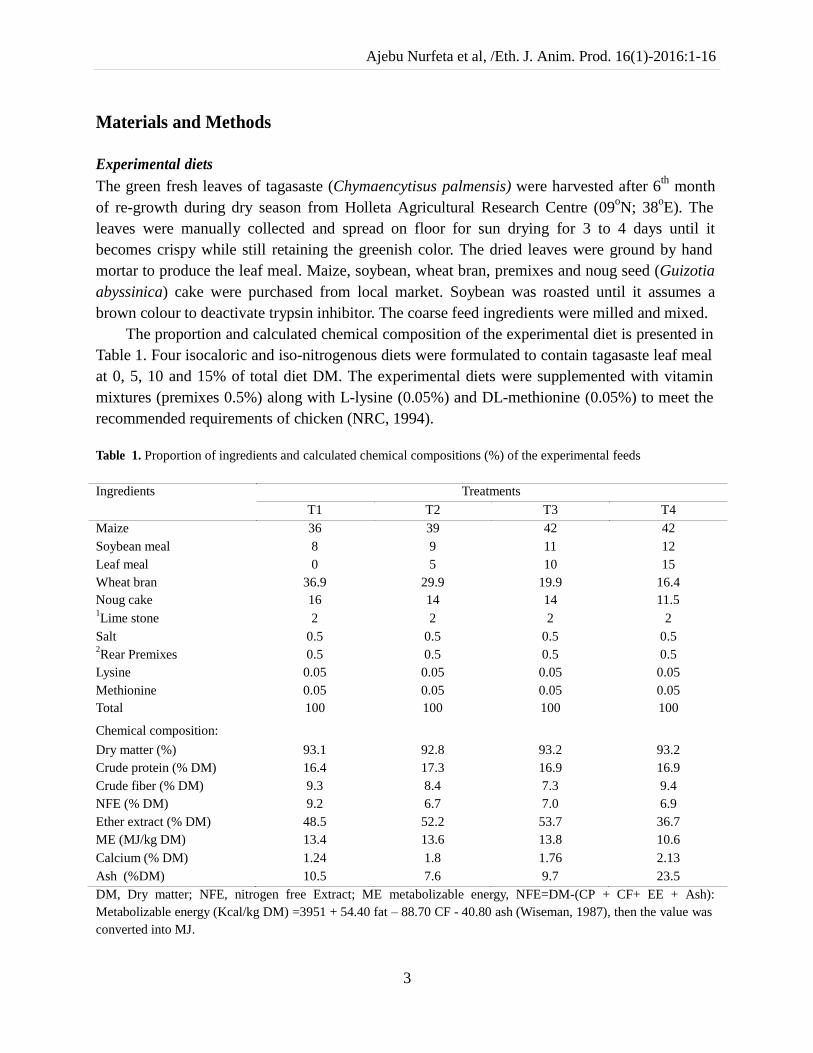
The proportion and calculated chemical composition of the experimental diet is presented in
Table 1. Four isocaloric and iso-nitrogenous diets were formulated to contain tagasaste leaf meal
at 0, 5, 10 and 15% of total diet DM. The experimental diets were supplemented with vitamin
mixtures (premixes 0.5%) along with L-lysine (0.05%) and DL-methionine (0.05%) to meet the
recommended requirements of chicken (NRC, 1994).
Table 1. Proportion of ingredients and calculated chemical compositions (%) of the experimental feeds
Ingredients Treatments
T1 T2 T3 T4
Maize 36 39 42 42
Soybean meal 8 9 11 12
Leaf meal 0 5 10 15
Wheat bran 36.9 29.9 19.9 16.4
Noug cake 16 14 14 11.5 1Lime stone 2 2 2 2
Salt 0.5 0.5 0.5 0.5 2Rear Premixes 0.5 0.5 0.5 0.5
Lysine 0.05 0.05 0.05 0.05
Methionine 0.05 0.05 0.05 0.05
Total 100 100 100 100
Chemical composition:
Dry matter (%) 93.1 92.8 93.2 93.2
Crude protein (% DM) 16.4 17.3 16.9 16.9
Crude fiber (% DM) 9.3 8.4 7.3 9.4
NFE (% DM) 9.2 6.7 7.0 6.9
Ether extract (% DM) 48.5 52.2 53.7 36.7
ME (MJ/kg DM) 13.4 13.6 13.8 10.6
Calcium (% DM) 1.24 1.8 1.76 2.13
Ash (%DM) 10.5 7.6 9.7 23.5
DM, Dry matter; NFE, nitrogen free Extract; ME metabolizable energy, NFE=DM-(CP + CF+ EE + Ash):
Metabolizable energy (Kcal/kg DM) =3951 + 54.40 fat – 88.70 CF - 40.80 ash (Wiseman, 1987), then the value was converted into MJ.
3

Ajebu Nurfeta et al, /Eth. J. Anim. Prod. 16(1)-2016:1-16
Experimental chicks and design
One hundred and sixty day-old unsexed Rhode Island Red (RIR) chicks with an average body
weight of 65.5 ± 8.9 g (mean ± SD) were used in the experiment. They were initially brooded
together and fed a standard starter diet for two weeks. After 14 days of adaptation, the chicks
were divided into 4 treatment groups of 40 chicks each and randomly assigned to the 4
treatments in a completely randomized design (CRD). Each treatment group was further sub-
divided into 4 replicates of 10 chicks per replicates and kept in a 1.25 m × 1.25 m wire mesh
partitioned pens. The concrete floor was covered with wood shavings of 4 to 5 cm depth. Before
the commencement of the experiment, the pens were properly cleaned and disinfected with 37%
formalin solution. Feed was offered ad libitum using horizontal feeders. Chicks had free access
to water at all times. The chicks were vaccinated against Newcastle disease at 7th and 21
st day
through the ocular route. The feeding trial lasted for 84 days.
Measurements of performance parameters
The chicks were weighed at weekly intervals to determine their average daily gain. Feed intake
was calculated as the difference between the amount of feed offered and the amount refused. Dry
matter conversion was calculated as the ratio between feed consumed and body weight gain
during the trial (g feed consumed/g weight gain). Body weight gain was calculated as the
difference between the final and initial weight during the trial. Nutrient conversion efficiency
ratio was determined from the amount of body weight gain of the chicks per unit of nutrient
consumed.
For carcass trait evaluation 32 chicks, a male and a female from each replicate group that
represent the mean body weight were randomly selected at the end of the feeding trial. The
chicks to be slaughtered were kept off feed and drinking water over night to ensure empty crop.
Chicks were killed by cervical dislocation, exsanguinated and de-feathered. Data on slaughter
weight, weight of blood, shank, neck, head, breast meat, drumstick, thigh, digestive tract, and
wings, gastrointestinal and reproductive organs, the visceral organs including heart, kidney,
spleen, lung, and liver weight) were recorded. Gizzard, liver, skin and neck under Ethiopian
context are included in total edible offals (TEO). The TEO was calculated by adding gizzard,
liver, neck and skin to the commercial carcass (back, drumsticks, thighs, wings and breast).
Dressing percentage was calculated from carcass weight as a percentage of slaughter weight.
Determination of nutrient retention
At the beginning of the experiment, 8 chicks were randomly selected and killed by dislocation of
neck after starving for 12 hours. In the same manner at the end of the experiment two chicks (a
male and a female) from each replicate were selected at random, starved for 12 hours, weighed,
leg banded and killed by cervical dislocation. For the determination of nutrient retention, the
slaughtered chicks were placed in the plastic bags and kept in a deep freezer (-200C). The frozen
whole body was then cut into small sections by using machetes and minced thoroughly using
mincer (Crypto peerless, IC 32 M) to get a homogenous sample. After uniformly mixing the
4
Ajebu Nurfeta et al, /Eth. J. Anim. Prod. 16(1)-2016:1-16
minced material, samples were taken and dried at 105oC for 12 hours for DM determination. In
the same manner, for chemical analysis, samples were taken and dried at 60oC for 100 hours and
finely ground to pass through 1mm mesh screen and taken to Debrezeit National Veterinary
Laboratory for proximate analysis. After determination of each nutrient in the sample, the
amount of each nutrient deposited in the whole body was determined by multiplying the obtained
values with their respective slaughter weight. The amount of each nutrient retained during the
experimental period was calculated from the difference between the initial and final nutrient
composition of the chick. The percent of nutrient retained in the whole body was calculated as
the mount of nutrient in the whole body/amount of nutrient consumed × 100.
Chemical analysis of the feeds and minced carcass
The feed offered and refusals were weighed and sampled daily and bulked over the 84 days for
each treatment. Sub samples were dried in an oven at 60oC for 48 hours and ground to pass
through 1mm mesh screen and were taken to Debrezeit National Veterinary Laboratory for
determination of DM, CP, ether extract (EE), crude fiber (CF) and ash following the methods of
AOAC (1990). Nitrogen was analyzed using Leco nitrogen analyzer (Leco FP-528, Leco
Corporation, USA) according to AOAC (1990). Then CP was obtained by multiplying the N
content by 6.25. Calcium was determined by atomic absorption spectrophotometer. Phosphorus
was analyzed by continuous flow auto-analyzer (Chemlab, 1978). Metabolizable energy (ME) of
the experimental diets was calculated by indirect method according to Wiseman (1987). The ME
content of minced carcass was predicted using the energy values of 23.68 MJ/kg for protein and
39.12 MJ/kg for fat as described by Okumara and Mori (1979).
Data analysis
The effect of tagasaste leaf meal inclusion on feed intake, body weight gain, feed conversion
ratio and carcass characteristics were analyzed using a single factor ANOVA of SAS software
version 9 (SAS, 2004) using the following model: Yij = µ + Ti + Eij, where, Yij = is the
response variable, µ = over all mean, Ti = the treatment effect, Eij = random error. Duncan
multiple range tests were used to compare the treatment means.
Results
Chemical composition of the feeds
Chemical compositions of the feed ingredients are presented in Table 2. Tagasaste leaf meal had
similar CP content with that of noug seed (Guizotia abyssinica) cake but lower than that of
soybean. The high CP content of tagasaste leaf indicates its potential as a source of protein
supplement. The calcium content was also higher in tagasaste leaf meal than in the other feeds.
Similarly, the CF content was higher in tagasaste leaf. There was a slight decrease in ME content
with increasing levels of tagasaste leaf meal.
5

ME, meteabolizable energy; Kcal, kilocalories; : NFE= DM- (CP+ CF+ EE + Ash),
Ajebu Nurfeta et al, /Eth. J. Anim. Prod. 16(1)-2016:1-16
Table 2. Chemical composition (% DM, unless specified) of feed ingredients tagasaste leaf meal
used for ration formulation
Nutrient Ingredients and chemical Composition
Leaf meal Maize Wheat bran Soybean Noug cake
Dry matter (%) 94 94 93 95 96
Crude protein 24 8.1 18 30 25
Crude fiber 20 0.85 8.6 16.2 15
Ether extract 4.3 6.4 4.4 12.1 7.8 1 Nitrogen free extract 46 59 56 29 28 2 ME (MJ/kg DM) 9.1 14.6 13.7 12.1 9.6
Calcium 2.2 0.8 0.9 1.7 0.8
Ash 5.3 18 4 6.9 18 1
2 :Metabolizable energy (Kcal/kg DM) = 3951 + 54.40 crude fat – 88.70 CF - 40.80 ash (Wiseman, 1987), then value converted to MJ.
Feed intake and weight gain
The data on nutrient intake is shown in Table 3. The intake of DM, CP and Ca in T4 were higher
(P<0.05) compared with T1. Those chicks fed with T2, T3 and T4 diets had higher (P<0.05) CP
intake than those fed on T1. There were no significant differences (P>0.05) in ME intake among
treatments. The average daily gain was highest (P<0.05) for chicks subjected to T1 while there
were no significant difference (P>0.05) among the other treatments.
Table 3. Daily feed intake and weight gain of chicks (g/chick/day, unless specified) fed
different levels of tagasaste leaf meal
Intake Treatments
T1 T2 T3 T4 SEM
DM 45.9c 47.9
ab 46.2 bc 48.6
a 5.6
CF 4.3b 4.04
b 3.4 c 4.6
a 0.26
CP 7.6b 8.3
a 7.8 ab 8.2
a 0.49
EE 4.2a 3.2
b 3.3 b 3.4
b 0.24
NFE 22.3b 24.9
a 24.9
a 17.8
c 1.41
ME (MJ/day) 6.1a 6.4
a 6.2 a 6.5
a 0.39
Ca 0.57c 0.86
b 0.81 b 1.03
a 0.05
Ash 4.8b 3.6
c 4.5 b 11.4
a 0.44
Average daily gain 6.2a 5.5
b 5.3 b 4.6
b 3.3 abc Means in the same row with different subscript letters are significantly different (P<0.05).
DM= Dry matter; CF=crude fiber; CP= crude protein; EE= ether extract; NFE= nitrogen free
6
Ajebu Nurfeta et al, /Eth. J. Anim. Prod. 16(1)-2016:1-16
extract; ME= metabolizable energy; MJ= mega joule; Ca = calcium; SEM= standard error of the
mean; T1 = 0% leaf meal; T2 =5% leaf meal; T3 =10% leaf meal; T4=15% leaf meal.
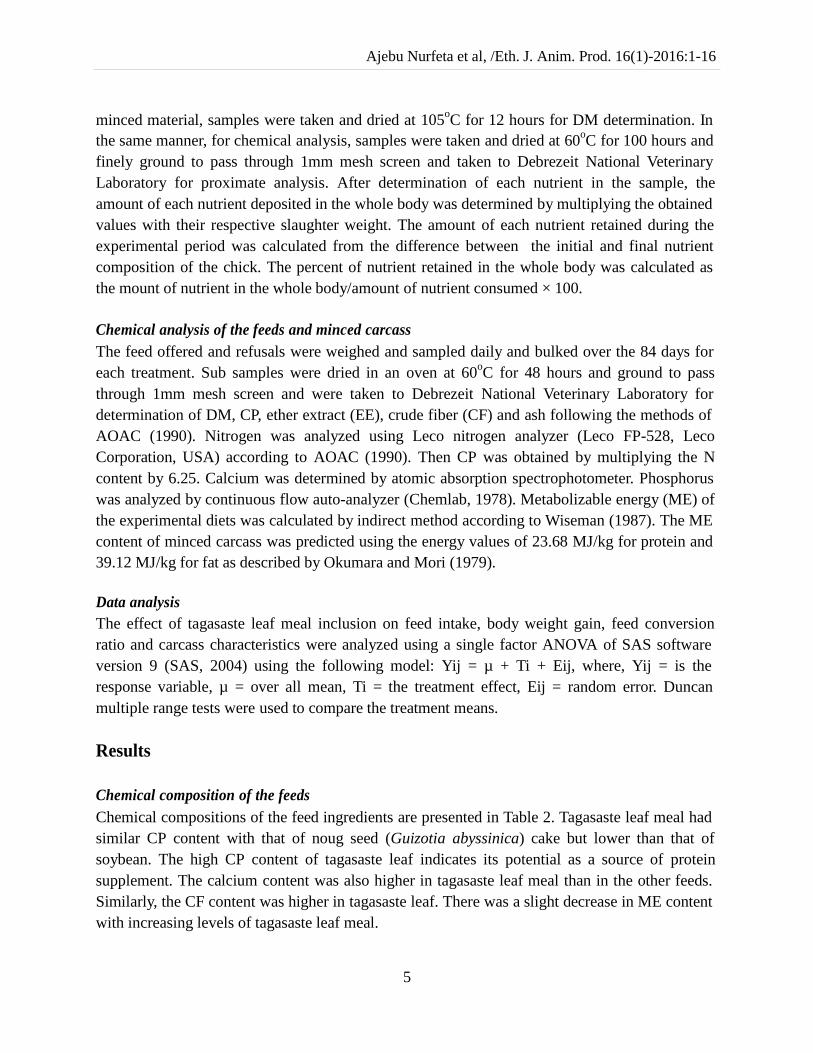
Feed conversion and nutrient efficiency ratio
The DM conversion ratio appeared to increase with increasing levels of tagasaste leaf meal in the
diet (Table 4). The highest mean total DM conversion ratio of 7.8 was obtained for T4 diet, but it
was not significantly (P<0.05) different from that of T2 and T3 diets. In general, chicks required
more feed per unit of weight gain in T4 diets compared with the control diet (T1).
The protein efficiency ratio was highest (P<0.05) for the chicks fed on T1 diet. Chicks fed
on T2, T3 and T4 diets required higher (P<0.05) CP per unit of body weight gain than the chicks
fed on T1 diet. The protein efficiency ratio was lower in the tagasate supplemented group
indicating that CP is less efficiently utilized at higher levels of the leaf meal inclusion. Similarly,
calcium efficiency ratio declined (P<0.05) with increasing levels of leaf meal inclusion.
Consequently, the amount of Ca required per unit of body weight gain increased as the dietary
level of the leaf meal increased.
Table 4. Dry matter conversion ratio (g feed/g weight gain) and nutrient efficiency ratio (g
gain/g feed) of chicks fed different dietary levels of tagasaste leaf meal
Efficiency Treatments
T1 T2 T3 T4 SEM
DM 0.045a 0.035
b 0.036 b 0.032
b 0.007
CP 0.144a 0.110
b 0.119 b 0.101
b 0.022
EE 0126a 0.094
b 0.088 b 0.099
b 0.023
NFE 0.006c 0.009
cb 0.011 ab 0.014
a 0.003
ME (MJ/day) 0.007a 0.005
b 0.005 b 0.005
b 0.001
Ca 0.085a 0.062
a 0.038 b 0.023
c 0.019
Ash 0.066a 0.065
a 0.039 b 0.012
c 0.012
DM conversion ratio 5.6b 6.5
ab 6.4 ab 7.8 a
abc: Means in the same row with different subscript letters are significantly different (P<0.05).
DM= dry matter; CP= crude protein; EE = ether extract; NFE= nitrogen free extract; ME=
metabolizable energy, MJ= Mega joule; Ca = calcium; SEM = standard error of the mean; T1 = 0%
leaf meal; T2 =5% leaf meal; T3 =10% leaf meal; T4=15% leaf meal.
Nutrient retention of chicks fed on different dietary levels of tagasaste leaf meal
The CP retention tended to decrease with increasing dietary level of tagasaste leaf meal (Table 5).
The chicks fed on T1, T2 and T3 diets retained similar (P>0.05) CP, while those chicks fed on T4
diets had lower (P<0.05) CP retention compared with that of T1.
Ether extract and ME retained in the carcass was found to be the highest (P<0.05) for T1
compared with other treatments. There was no significant (P>0.05) difference in CP, EE, NFE
7
Ajebu Nurfeta et al, /Eth. J. Anim. Prod. 16(1)-2016:1-16
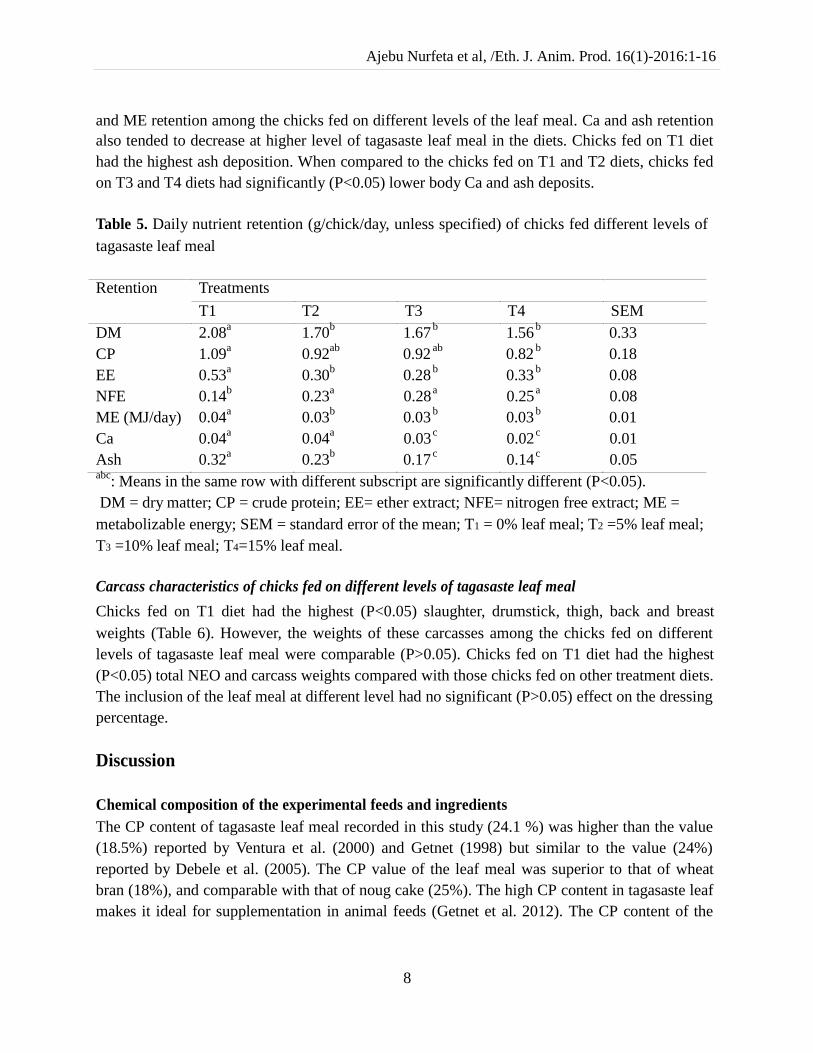
and ME retention among the chicks fed on different levels of the leaf meal. Ca and ash retention
also tended to decrease at higher level of tagasaste leaf meal in the diets. Chicks fed on T1 diet
had the highest ash deposition. When compared to the chicks fed on T1 and T2 diets, chicks fed
on T3 and T4 diets had significantly (P<0.05) lower body Ca and ash deposits.
Table 5. Daily nutrient retention (g/chick/day, unless specified) of chicks fed different levels of
tagasaste leaf meal
Retention Treatments
T1 T2 T3 T4 SEM
DM 2.08a 1.70
b 1.67
b 1.56
b 0.33
CP 1.09a 0.92
ab 0.92 ab 0.82
b 0.18
EE 0.53a 0.30
b 0.28 b 0.33
b 0.08
NFE 0.14b 0.23
a 0.28 a 0.25
a 0.08
ME (MJ/day) 0.04a 0.03
b 0.03 b 0.03
b 0.01
Ca 0.04a 0.04
a 0.03 c 0.02
c 0.01
Ash 0.32a 0.23
b 0.17 c 0.14
c 0.05 abc
: Means in the same row with different subscript are significantly different (P<0.05).
DM = dry matter; CP = crude protein; EE= ether extract; NFE= nitrogen free extract; ME =
metabolizable energy; SEM = standard error of the mean; T1 = 0% leaf meal; T2 =5% leaf meal;
T3 =10% leaf meal; T4=15% leaf meal.
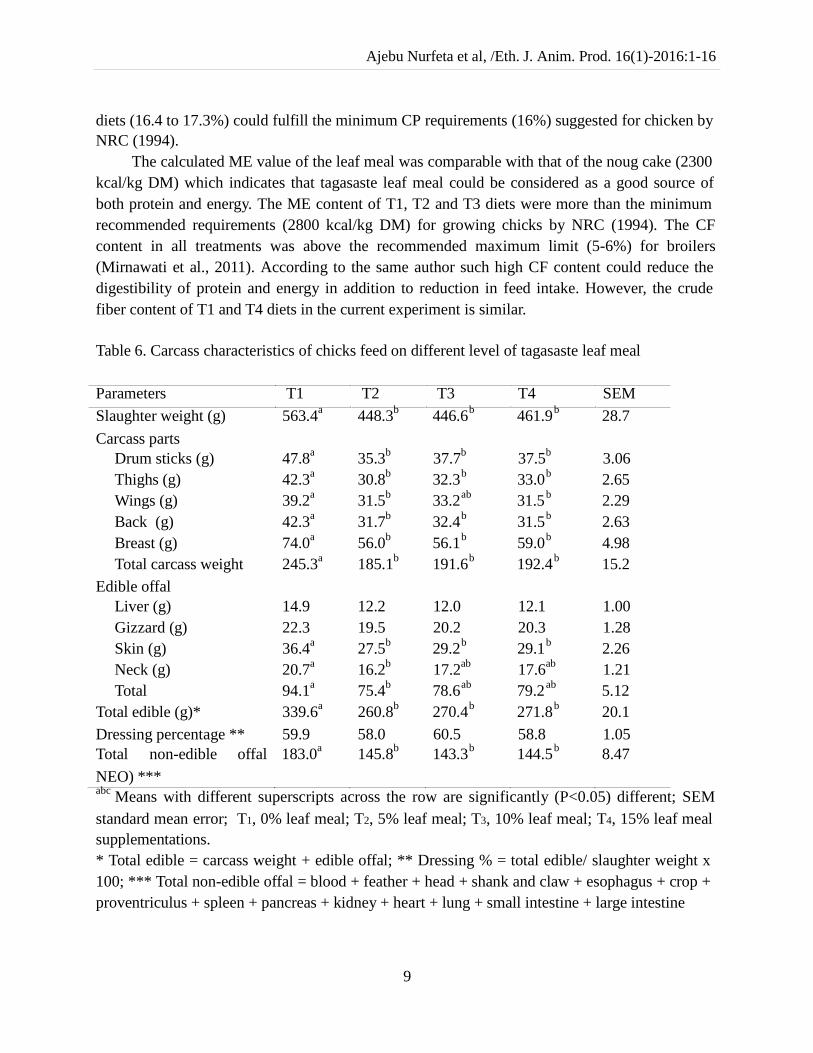
Carcass characteristics of chicks fed on different levels of tagasaste leaf meal
Chicks fed on T1 diet had the highest (P<0.05) slaughter, drumstick, thigh, back and breast
weights (Table 6). However, the weights of these carcasses among the chicks fed on different
levels of tagasaste leaf meal were comparable (P>0.05). Chicks fed on T1 diet had the highest
(P<0.05) total NEO and carcass weights compared with those chicks fed on other treatment diets.
The inclusion of the leaf meal at different level had no significant (P>0.05) effect on the dressing
percentage.
Discussion
Chemical composition of the experimental feeds and ingredients
The CP content of tagasaste leaf meal recorded in this study (24.1 %) was higher than the value
(18.5%) reported by Ventura et al. (2000) and Getnet (1998) but similar to the value (24%)
reported by Debele et al. (2005). The CP value of the leaf meal was superior to that of wheat
bran (18%), and comparable with that of noug cake (25%). The high CP content in tagasaste leaf
makes it ideal for supplementation in animal feeds (Getnet et al. 2012). The CP content of the
8
Ajebu Nurfeta et al, /Eth. J. Anim. Prod. 16(1)-2016:1-16
diets (16.4 to 17.3%) could fulfill the minimum CP requirements (16%) suggested for chicken by
NRC (1994).
The calculated ME value of the leaf meal was comparable with that of the noug cake (2300
kcal/kg DM) which indicates that tagasaste leaf meal could be considered as a good source of
both protein and energy. The ME content of T1, T2 and T3 diets were more than the minimum
recommended requirements (2800 kcal/kg DM) for growing chicks by NRC (1994). The CF
content in all treatments was above the recommended maximum limit (5-6%) for broilers
(Mirnawati et al., 2011). According to the same author such high CF content could reduce the
digestibility of protein and energy in addition to reduction in feed intake. However, the crude
fiber content of T1 and T4 diets in the current experiment is similar.
Table 6. Carcass characteristics of chicks feed on different level of tagasaste leaf meal
Parameters T1 T2 T3 T4 SEM
Slaughter weight (g) 563.4a 448.3
b 446.6 b 461.9
b 28.7 Carcass parts
Drum sticks (g) 47.8a 35.3
b 37.7
b 37.5
b 3.06
Thighs (g) 42.3a 30.8
b 32.3 b 33.0
b 2.65
Wings (g) 39.2a 31.5
b 33.2 ab 31.5
b 2.29
Back (g) 42.3a 31.7
b 32.4 b 31.5
b 2.63
Breast (g) 74.0a 56.0
b 56.1 b 59.0
b 4.98
Total carcass weight 245.3a 185.1
b 191.6 b 192.4
b 15.2 Edible offal
Liver (g) 14.9 12.2 12.0 12.1 1.00
Gizzard (g) 22.3 19.5 20.2 20.3 1.28
Skin (g) 36.4a 27.5
b 29.2 b 29.1
b 2.26
Neck (g) 20.7a 16.2
b 17.2
ab 17.6
ab 1.21
Total 94.1a 75.4
b 78.6 ab 79.2
ab 5.12
Total edible (g)* 339.6a 260.8
b 270.4 b 271.8
b 20.1 Dressing percentage ** 59.9 58.0 60.5 58.8 1.05
Total non-edible offal 183.0a 145.8
b 143.3 b 144.5
b 8.47 NEO) *** abc Means with different superscripts across the row are significantly (P<0.05) different; SEM
standard mean error; T1, 0% leaf meal; T2, 5% leaf meal; T3, 10% leaf meal; T4, 15% leaf meal
supplementations.
* Total edible = carcass weight + edible offal; ** Dressing % = total edible/ slaughter weight x
100; *** Total non-edible offal = blood + feather + head + shank and claw + esophagus + crop +
proventriculus + spleen + pancreas + kidney + heart + lung + small intestine + large intestine
9
Ajebu Nurfeta et al, /Eth. J. Anim. Prod. 16(1)-2016:1-16
Effect of feeding tagasaste leaf meal on feed intake and growth of RIR chicks
The high intake of CP, NFE and ash in the supplemented chicks and the high DM intake in T4
diets compared with T1 is consistent with previous report of higher DM and CP intake (Aberra et
al., 2011) and DM intake (Egbewande et al., 2011) in chicks supplemented with Moringa
stenopetala and Tapinanthus bangwensis (neem tree) leaf meal, respectively. No significant
effect on feed intake was observed in chicks supplemented with different levels of chaya leaf
meal (Donkoh et al., 1999). Moreover, Ng‟ambi et al. (2009) observed no effect on feed intake,
digestibility and live weight in broilers fed Acacia Karroo leaf meal despite its high tannin
content. On the contrary, reduction in nutrient intake was observed in broilers, pullets and layers
fed different levels of neem tree (Azadirachta indica) (Onyimonyi et al., 2009), sweet potato
(Berhan and Wude , 2010), Centrosema pubescens (Nworgu and Fasogbon, 2007) and Gliricidia
sepium (Odunsi et al., 2002), respectively, compared to the control diet.
The reduced weight gain for chicks fed on T2, T3 and T4 diets despite higher DM intake
suggest poor utilization of nutrients. Similar to the current experiment, reduction in growth
without affecting intake was also reported in chicks fed on other leaf meals. Onyimonyi et al.
(2009), Ekenyem and Madubuike (2006) reported reduction in weight gain in chicks fed on
neem tree, Ipomoea asarifolia and S. grandiflora leaf meal, respectively, compared with the
control. Moreover, Odunsi et al. (2002) fed Gliricida leaf in the diet of layers and observed
weight loss at 10 and 15% of supplementation. Whereas Berhan and Wude (2010) observed
improved body weight gain at 5 and 10% sweet potato leaf meal supplementation where as there
was reduction in body weight gain at 15 and 20% supplementation. Ekenyem and Madubuike
(2006) implicated high crude fiber content with increasing levels of leaf meal for the reduction in
weight gain. In the current experiment, though there was weight loss at high level, the weight
change was positive for all treatments. To the contrary, Aberra et al. (2011) and Nworgu and
Fasogbon (2007) observed higher average daily gain in chicks supplemented with Moringa
stenopetla and Centrosema pubescens leaf meal compared to the control. Abou-Elezz et al.
(2011) observed no significant effect on body weight change in RIR hens‟ fed on 0, 5, 10 and 15%
of Leucaena leucocephala and Moringa oleifera leaf meal.
In general, the average weight gain of chicks on the T1 diet was higher than chicks fed on
T2, T3 and T4 diets. Despite higher intake in chicks supplemented with tagasaste leaf meal, they
could not be able to utilize the feed efficiently for growth. The low performance experienced by
chicks fed tagasaste leaf meal may be due to the bulkiness and anti-nutritional factors (Togun et
al., 2006) which makes it difficult for the chicken to satisfy the protein and energy requirements.
According to Nworgu et al. (2000) fiber was reported to absorb amino acids and peptide as well
as preventing their absorption from the intestine. Another possible drawback is the anti-
nutritional factors noticeably tannins and alkaloids. High concentration of tannin can bind with
protein and form strong complexes which lead to reduction in intake and digestibility (Makkar,
2003). According to the same author the formation of complexes inhibits a number of digestive
enzymes in the GIT such as pepsin, trypsin and chymotrypsin there by reducing the digestibility
of proteins and amino acids. Medugu et al. (2012) from their review work indicated several
10
Ajebu Nurfeta et al, /Eth. J. Anim. Prod. 16(1)-2016:1-16
options such as physical and chemical methods (eg. use of wood ash, addition of tallow, use of
tannin binding agents, and use of enzymes) which reduce the impact of anti-nutritional
substances in poultry feeds. However, the best method to be adopted will depend on their
effectiveness and cost of processing.
Nutrient retention and nutrient conversion efficiency
Protein deposition in the carcass showed a decreasing trend with increased level of tagasaste leaf
meal in the diet. This might be due to the effect of anti-nutritional factors which results in the
loss of endogenous protein rich sulphur-containing amino acids. It is this depletion of critical
amino acids which might results in depression in growth and protein accretion (Liener, 1989).
The decreasing trend in CP retention with the increase of leaf meal inclusion observed in this
study might be associated with the effect of anti-nutritional factors and fiber loading of the diets.
Adverse effects of tannin on feed efficiency were reported by Makkar (2003). However, Adugna
et al. (1997) reported low level of condensed tannin (4.66%) in tagasaste. An improved carcass
protein accretion was observed in chicks fed on T1 diets. D`Mello and Acamovic (1989)
reported that chicks fed on 15% L. leucocephela leaf meal diets showed low energy and protein
retention.
High dietary energy levels are often claimed for excessive fat accumulation (Saleh et al.,
2004). However, in the current study even though chicks fed on T2 and T3 diets had higher ME
intakes which was more than the recommended level (2800 kcal/kg DM) by NRC (1994), they
accumulated the lowest fat as compared with the chicks fed on T1 diet. From this experiment, it
was observed that the chicks fed on the leaf meal diets grew slower, which indicates inferior CP
retention and decreased whole body fat deposition as compared with the chicks fed on T1 diets.
Ng‟ambi et al. (2009) reported that broiler chickens fed on tanniferous Acacia karroo leaf meal
had lower fat content compared with the unsupplemented ones.
Chicks required more feed per unit of weight gain in T4 diets than the control diet which is
consistent with the report of Donkoh et al. (1999) in chicks fed chaya leaf meal in which the
efficiency with which feed is converted to gain decreased with increasing levels of leaf meal.
The results (Table 4) indicated that the DM efficiency ratio, protein efficiency ratio and energy
efficiency ratio were low in chicks fed on tagasaste leaf meal supplemented diets. This indicated
that the feed was utilized less efficiently when tagasaste leaf meal is used which lead to reduction
in live weight gain. Chicks at higher level of tagasaste leaf meal required higher CP and ME per
unit of body weight gain compared with the control. Increased feed conversion ratio was
reported in broilers when the level of Leucaena leucocephala (Okonkwo et al., 1995) and sweet
potato (Berhan and Wude, 2010) exceeded 10% in the diet. This shows that the feed was less
efficiently utilized with increased level of leaf meal.
The effects of feeding tagasaste leaf meal on the carcass characteristics of RIR chicks
According to Bamgbose and Niba (1998) carcass yield is an indication of the quality and
utilization of the ration. Therefore, it appeared that chicks fed on the T4 diets poorly utilized
11
Ajebu Nurfeta et al, /Eth. J. Anim. Prod. 16(1)-2016:1-16
their feed as evidenced by lower dressed carcass, breast muscle, thigh, back, and breast and
drumstick weights. Similarly, Togun et al. (2006) observed significant reduction in live and
carcass weight with increased level of leaf meal inclusion. Low nutrient utilization which results
in poor tissue growth and fat deposition were suggested to be the cause for low carcass yield in
broilers (Berhan and Wude , 2010). Meseret et al. (2011) reported similar response in carcass
yield characteristics except drumstick weight in chicks fed on graded levels of Prosopis juliflora
leaf meal.
The lack of an increase in the weight and length of GIT is consistent with the result of
Berhan and Wude (2010) who indicated that the inclusion of sweat potato leaf meal at different
dietary level did not increase the weight and length of GIT as the level of the leaf meal increased.
The weight of the liver was similar among treatments which were not consistent with other
studies in chicks fed on leaf meal supplemented diets. Ekenyem and Madubuike (2006) observed
low weight of liver and heart at high level of leaf meal inclusion which was probably due to the
stress effect on the organs caused by high intake of fiber. To the contrary, Togun et al. (2006)
observed increased liver weight in broiler cocks fed on wild sunflower leaf meal compared with
the control.
The low growth rate, body weight gain, drumsticks thigh and breast meat weight in tagasaste
supplemented group might be due to the poor nutrient utilization of chicks possibly due to
inadequacy in certain essential amino acids required for optimum growth (Berhan and Wude ,
2010). In agreement to the present study, Ekenyem and Madubuike (2006) observed a significant
decrease in carcass, gizzard, and kidney weights, when broilers were fed above 5% Ipomoea
asarifolia leaf meal. However, Berhan and Wude (2010) fed different levels of Ipomoea batatas
and observed no effect on drumstick, thigh and breast meat up to 15% of inclusion level
compared with the control. In agreement with the current study Togun et al. (2006) reported no
effect of increased level of leaf meal on dressing percentage in broiler chickens.
Conclusion
There were no toxic effects observed throughout the feeding period of tagasaste leaf meal as
mortality was very minimal. The result also showed that there was no problem of
acceptability/palatability by chickens as evidenced from high DM intake. Therefore, it is possible
to use tagassaste leaf meal as an alternative source of supplementation in diets deficient in
protein to formulate a feed for chickens in areas where it grows. However, there is a need for
further research which evaluates the mechanism of reducing anti-nutritional substances through
the use of chemical and physical methods for efficient utilization of nutrients.
Acknowledgement
We would like to thank the Rural Capacity Building for sponsoring the research work.
12
Ajebu Nurfeta et al, /Eth. J. Anim. Prod. 16(1)-2016:1-16
References
Aberra Melesse, Bulang, M., Kluth, H., 2009. Evaluating the nutritive values and in vitro
degradability characteristics of leaves, seeds and seedpods from M. stenopetala. The Journal
of Science of Food and Agriculture 89: 281-287.
Aberra Melesse, Maak, S., Schmidt, R., vonLengerken, G., 2011a. Effect of long-term heat stress
on some performance traits and plasma enzyme activities in Naked-neck chickens and their
F1 crosses with commercial layer breeds. Livestock Science 141: 227-231.
Aberra Melesse, Tirunesh, W., Tegene Negesse, 2011b. Effects of feeding Moringa stenopetala
leaf meal on nutrient intake and growth performance of Rhode Island Red chicks under
tropical climate. Tropical and Subtropical Agroecosystems 14: 485-492.
Abou-Elezz, F.M.K., Sarmiento-Franco, L., Santos-Ricalde, Solorio, F., 2011. Nutritional effects
of dietary inclusion of Leucaena leucocephala and Moringa oleifera leaf meal on Rhode
Island Red hens‟ performance. Cuban Journal of Agricultural Science 45: 163-169.
Adugana Tolera, 2007. Feed resources for producing export quality meat and livestock in
Ethiopia. Ethiopia Sanitary and Phytosanitary Standards and Livestock and Meat Marketing
Program (SPS-LMM), Texas Agricultural Experiment Station (TAES)/Texas A&M
University System, Addis Ababa, Ethiopia.
Adugna Tolera, Khazaal, K., Ørskov, E.R., 1997. Nutritive evaluation of some browse species.
Animal Feed Science and Technology 67: 181-195.
AOAC, Association of Official Analytical Chemists, 1990. Official Method of Analysis, 13th ed.,
(Arlington, Virginia, USA), pp12-18.
Bamgbose, A.M. and Niba A.T., 1998. Performance of broiler chickens fed cotton seed cake in
starter and finisher rations. In: Ologhobo A.D. and Iyayi E.A. (editors), The Nigerian
Livestock‟s in the 21st century, proceeding of 3
rd annual conference of Animal Sciences
Association of Nigeria, September 22-24 1998, Lagos, pp 84-87.
Berhan Tamir, and Wude Tesga, 2010. Effect of different levels of dried sweet potato (Ipomoea
batatas) leaf inclusion in finisher ration on feed intake, growth, and carcass yield
performance of Ross broiler chicks. Tropical Animal Health and Production 42: 687-695.
Chemlab, 1978. Continuous flow analysis method sheet no. CW2-0.75.01. Determination of
orthophosphate in water and waste water. Chemlab Instrument, Homchurch, Essex.
CSA (Central Statistical Agency). 2014/15. Federal Democratic Republic of
Ethiopia.Agricultural Sample Survey, Volume 2, Livestock and Livestock Characteristics.
Statistical Bulletin 578, Addis Ababa, Ethiopia.
Debele Becholie, Brhan Tamir, Terrill, T.H., Singh, B.P., Hailemariam Kassa, 2005. Suitability
of tagasaste (Chamecytisus palmensis L.) as a source of protein supplement to a tropical
grass hay fed to lambs. Small Ruminant Research 56: 55-64.
D‟Mello, J.P.F., and Acamovic, T., 1989. Leacaenae leacocephala in poultry nutrition:– A
Review. Animal Feed Science and Technology 26: 1-28.
13
Ajebu Nurfeta et al, /Eth. J. Anim. Prod. 16(1)-2016:1-16
Donkoh, A., Atuahene, C.C., Poku-Prempeh, Y.B., Twum, I.G., 1999. The nutritive value of
chaya leaf meal (Cnidoscolus aconitifolius (Mill) Johnston): studies with broliler chickens.
Animal Feed Science and Technology 77: 163-172.
Egbewande, O.O., Jimoh, A.A., Ibitoye, E.B., Olorede, B.R., 2011. Utilization of African
Milstletoe (Tapinanthus bangwensis) leaf meal by broiler chickens. Pakistan Journal of
Nutrition 10: 19-22.
Ekenyem, B.U., Madubuike, F.N., 2006. An assessment of Ipomoea asarifolia meal as feed
ingredient in broiler chick production. Pakistan Journal of Nutrition 5: 46-50
FAO (Food and Agriculture Organization of the United Nations), 2011. Preservation and
Processing Technologies to Improve Availability and Safety of Meat and Meat Products
in Developing Countries. World Animal Review. Rome, Italy.
Fassil Bekele, Ådnoy T.,Gjøen, H.M., Kathele, J., Abebe, G., 2010. Production performance of
dual purpose crosses of two indigenous with two exotic chicken breeds in sub-tropical
environment. International Journal of Poultry Science 7: 702-710.
Feleke Tadesse, 2016. Growth performance and nutritive quality of tree lucerne (Chamaecytisus
palmensis) fodder under different management conditions in the high lands of Ethiopia.
MSc thesis, Hawassa University, College of Agriculture, Hawassa, Ethiopia
Getnet Assefa, 1998. Biomass yield, botanical fraction and quality of tagasaste (C. palmensis) as
affected by harvesting intervals in the high lands of Ethiopia. Agroforestry Systems 42: 13-
23.
Getnet Assefa, Sondere, K, Wink, M., Kijora, C., Stienmueller, N., Peters K.J., 2008. Effect of
variety, harvesting management on the concentration of tannins and alkaloids in tagsasaste
(Chamaecytisus palmensis). Animal Feed Science and Technology 144: 242-256.
Getnet Assefa, Kijora, C., Kehalew, A., Sondere, K., Peters K.J.,.2012. Effet of pre-feeding
forage treatments, harvesting stage, and animal type on preference of tagassaste (C.
palmensis). Agroforestry System 84: 25-34.
Iheukwumere, F.C., Ndubuisi, E.C., Mazi, E.A., Onyekwere, M.U., 2008. Performance, nutrient
utilization and organ characteristics of broilers fed cassava leaf meal (Mahinot esculenta
Crantz). Pakistan Journal of Nutrition 7: 13-16.
Lefroy, E.C., Dann, P.R., Wildin, J.H., Wesley-Smith, R.N., McGowan, A.A., 1992. Trees and
shrubs as sources of fodder in Australia. Agroforestry Systems 20: 117-139.
Liener, I.E., 1989, Antinutritional factors in legume seeds, state of the art., In: Huisman, J., van
der poel, T.F.B. and Liener, I. E., (eds). Recent advances of research in antinutritional
factors legume seeds, PUDOC, Wagenningen, pp.6-13.
Makkar, H.P.S, 2003. Effects and fate of tannins in ruminant animals, adaptation to tannin and
strategies to overcome detrimental effects of feeding tannin rich feeds. Small Ruminants
Research 49: 241-256.
Meseret Girma, Mengistu Urge and Getachew , 2011. Ground Prosopis juliflora pods as feed
ingredient in poultry diet: Effects on growth and carcass characteristics of broilers.
International Journal of Poultry Science 10: 970-976.
14
Ajebu Nurfeta et al, /Eth. J. Anim. Prod. 16(1)-2016:1-16
Mirnawati, Y. Rizal, Marlida, Y. and Kompiang, I. P., 2011. Evaluation of palm kernel
cake fermentted by Aspergillus niger as substitute for soybean meal protein in the diet of
broiler. International Journal of Poultry Science 10 (7): 537-541.
Medugu, C.I., Saleh, B., Igwebuike, J.U. and Ndirmbita, R.L. 2012. Strategies to improve the
utilization of tannin-rich feed materials by poultry. International Journal of Poultry
Science 11(6): 417-423.
Ng‟ambi, J.W., Nakalebe, P.M., Norris, D., Malatje, M.S., Mbajiorgu, C.A., 2009. Effects of
dietary energy level and tanniferous Acacia karroo leaf meal level of supplementation at
finisher stage on performance and carcass characteristics of Ross 308 broiler chickens in
South Africa. International Journal of Poultry Science 8: 40-46.
NRC, National Research Council, 1994. Nutrition Requirements of Poultry, National Research
Council, National Academy Press, Washington D.C.
Nworgu, F. C., Egbunke, G. N., and Ogundola F .I., 2000. Performance and nitrogen utilization
of broiler chicks fed full fat extruded Soya bean meal and full fat Soya bean. Tropical
Animal Production Investigation 3: 47-54.
Nworgu, F.C. and Fasogbon, F.O., 2007. Centrosema (Centrosema pubescens) leaf meal as
protein supplement for pullet chicks and growing pullets. International Journal of Poultry
Science 6: 255-260.
Odunsi, A.A., Ogunleke, M.O., M.O., Alagbe, O.S., Ajani, T.O., 2002. Effect of feeding
Gliricidia sepium leaf meal on the performance and egg quality of layers. International
Journal of Poultry Sciences 1: 26-28.
Okonkwo, A.C., Wamagi, I.T., Okon, B.I., Umoh, B.I., 1995. Effects of Leucaena leucocephala
seed meal on the performance and carcass characteristics of broilers. Nigerian Journal of
Animal Production 22: 44-48.
Okumara, J.I., Mori, S.,1979. Effect of deficiency of single essential amino acids on nitrogen and
energy utilization in chicks. British Poultry Science 20: 61-68.
Onyimonyi, A.E., Olabode, A., Okeke, G.C., 2009. Performance and economic characteristice of
broilers fed varying levels of neem leaf meal (Azadirachta indica). International Journal of
Poultry Science 8: 256-259.
Saleh, E. A.,Watkins, S.E., Waldroup, A.L. and Waldroup, P.W., 2004. Effects of dietary
nutrients density on performance and carcass quality of male broilers grown for further
processing. International Journal of Poultry Science 3 (1): 1-10.
SAS, Statistical Analysis Systems Institutes Inc., 2004. Users guide: statistics, version 9
Statistical Analysis Systems Institutes Inc. Cary, NC, U.S.A.
Togun, V.A. Farinu, G.O., Olabanji, R., 2006. Effect of graded levels of wild sunflower
(Tithonia diversifolia Hemsl A.Gray) meal inprepubertal diets on the morphometric
characterstics of the Genitalia and some organs of the Isa Brown cocks at the pubertal age.
American-Eurasian Journal of Scientific Research 1(1): 61-67.
15
Ajebu Nurfeta et al, /Eth. J. Anim. Prod. 16(1)-2016:1-16
Ventura, H.R., Cast anon, J.J.R., Rey, L., Flores, M.P., 2000. Chemical composition and
digestibility of tagasaste (Chamaencytisus palmensis), subspecies for goats. Animal Feed
Science Technology 46: 207-210.
Wiseman, J., 1987. Meeting nutritional requirement from available resources. pp.129-132, In: J.
Wiseman (Ed.), Feeding of None Ruminant Animal, Butterworth, London.
Zewdu Ayele, Peacock, C., 2003. Improving access to and consumption of animal sources of
foods in rural households: the experience of a woman focused on goat development
program in the highlands of Ethiopia. Journal of Nutrition 133: 3981S-3986S.

16
(T2); 0.7 kg lt-1(T3) and untreated barley straw basal diet plus 0.5 kg lt-1
milk yield (T4: control groups).
Getu Kitaw et al, /Eth. J. Anim. Prod. 16(1)-2016:17-35
Evaluation of Activated Effective Microorganisms (EM-2) as Biological Crop
Residue Treatment Option Targeted for Feeding Crossbred Dairy Cattle
Getu Kitaw, Aemiro Kehaliw, Fekede Feyissa and Getnet Assefa
Ethiopian Institute of Agricultural Research, Addis Abeba, Ethiopia
Corresponding author: [email protected]
Abstract
The study was conducted at Holetta Agricultural Research Center with the objective to evaluate the effect
of ensiling crop residues (wheat, barley and oat straws) with activated effective micro-organism solution
(EM2) on the chemical compositions, in-vitro digestibility and performances of mid lactating Boran-
Fresian crossbred cows fed four dietary treatments. These were: ad libtum EM2 treated barley straw
basal diet plus on-station formulated dairy concentrate mix supplemented @ 0.3 kg lt-1
(T1); 0.5 kg lt-
1
Crude protein (CP), digestible organic matter in the dry matter (DOMD), estimated metabolizable energy
(EME), total ash, neutral detergent fiber (NDF), acid detergent fiber (ADF) and lignin (P<0.05) were
significantly (P<0.05) increased by EM2 treatment as compared to the untreated straws. Dry matter
(DM) and organic matter (OM) losses as a result of EM-2 treatment were substantial (P<0.05) for all the
three crop residues studied. Except for the ash content, interaction effects between the type of crop
residue, rate of application and incubation durations were non-significant (P>0.05). Daily intake of
EM2 treated barley straw was significantly higher (P<0.05) for all experimental cows compared to cows
receiving the untreated residue. Similarly, daily total DM intake followed the same trend as for the basal
feed intake. In general, daily intakes and apparent digestibility of all nutrients except DM & OM were
higher (P<0.05) for cows fed the EM2 treated barley straw as a basal diet. Daily milk yield and
compositions other than milk lactose and total solids were significantly different (P<0.05) among cows
receiving the treated barley straw diet. On the other hand, due to high cost of straw treatment, compared
to cows on the control diet, the gross and net profit obtained from intervention diets were marginal. In
conclusion, EM2 can serve as an alternative biological treatment option for crop residues and thus, can
be used on a wider scale among the livestock farming community to alleviate the inherent problems (low
intake and digestibility) of most crop residues under local conditions in Ethiopia.
Key words: Effective Microorganism, Activated EM (EM2), barley, wheat and oat straws Introduction
With a total production of about 50 million tonnes per annum (CSA, 2014) and estimated relative
contribution exceeding 50%, the role of crop residues as a basal diet to ruminant livestock under
Ethiopian context will continue to dominate the basal feed resource base even in the years to
come. Despite their production potential and long history of utilization, the animal industry in
17

Getu Kitaw et al, /Eth. J. Anim. Prod. 16(1)-2016:17-35
Ethiopia have not maximally benefited from this vast feed resources owning to their inherently
poor nutritional value and associated negative effects on feed intake and digestibility. Thus,
upgrading of straw quality should be a focal point of research strategy for improving ruminant
livestock production in the country. In this regard, during the last two to three decades both
scientists and extension workers have shown great interest in chemical and physical treatment of
straw (Sundstol and Owen, 1984). The ammoniation method using urea has received major
attention as an appropriate system in the developing countries (Owen and Jayasuriya, 1989a).
However, the success with regard to on-farm application of ammonia treatment as well as other
chemical methods has generally been disappointing. Consequently, many attempts have been
made by scientists to find other efficient approaches to address the problems. A promising
alternative to chemical treatment is a microbial fermentation method. This method is simple in
application and is of low cost, and the farmer can use the same urea-ammonia treatment facilities
to carry out the process.
The technology of Effective Microorganisms (EM) as biological inoculants was developed
in the 1970‟s at the University of the Ryukyus, Okinawa, Japan. The inception of the technology
was based on blending a multitude of microbes, and was subsequently refined to include three
principal types of organisms commonly found in all ecosystems, namely Lactic Acid Bacteria,
Yeast Actinomycets and Photosynthetic bacteria (Higa, 1996). A variety of dry crop residues
have been successfully ensiled with addition of microorganisms. Being organic in nature,
microbial ensilage of crop residues increases daily gains, feed intake and feed conversion, and
decreases feed cost per unit gain in growing ruminants (Zhang and Meng, 1995; Ma and Zhu,
1997; Konoplya and Higa, 2000; Hanekonet al., 2001).
Although the possibility of biological method of straw treatment has a great appeal as an
alternative to the use of expensive (in terms of money and energy) chemicals and environmental
pollution, many aspects need further investigation under local conditions. The objective of this
study was to evaluate activated microbial inoculant EM2 solution as a technologically and
biologically feasible alternative crop residue treatment and feeding options for dairy cattle in
Ethiopia.
Materials and Methods
Description of study area
The study was carried out on-station at Holeta Agricultural Research Center. The center is
located about 35 km West of Addis Ababa along the main road to Ambo. The study area has an
altitude of 2400 meters above sea level (m.a.s.l) and receives an average annual rainfall of about
1055 mm. The mean minimum and maximum temperatures are 6.1oC and 22.2
oC, respectively.
Experimental feed preparation and designing treatment protocols
This laboratory trial has focused on ensiling three cereal crop residues, i.e., wheat, barley and oat
straw with EM2 (extended EM solution). EM2 was prepared according to the procedure of
18
Getu Kitaw et al, /Eth. J. Anim. Prod. 16(1)-2016:17-35
EMROSA (2004) by mixing EM1 with molasses and chlorine free water in the ratio of 1:1:18
respectively. 10% molasses was added to the solution to provide nutrients specifically sufficient
soluble carbohydrates to the microbes in the EM2 solution and thereby to facilitate the ensiling
process. EM2 solution was then applied to the residues at the rate of 0, 1 and 1.5 lt, kg-1 DM of
the residues. Except for the untreated crop residue the materials were then incubated for 30 and
40 days using airtight plastic containers. Straws of wheat, barley and oat samples from known
varieties were collected from on-station plots and subjected to chopping to an approximate size
of 3-5cm. At the end of the incubation period part of the silage mass was subjected to oven
drying at 65oC for about 72hours for partial DM determinations and further processing to 1-mm
sieve size grinding for laboratory chemical compositions and in-vitro OM digestibility studies.
Experimental animal selection and management
A total of four lactating F1 crossbred cows (Boran x Friesian) were used for this experiment.
Experimental cows with similar lactation performance (8-10 lt,d-1), same stage of lactation (mid-
lactating i.e., three months after calving), and body weight of 393±25kg but differing in parities
(two through five) were selected from the total dairy herd available on station. All the cows were
weighed and drenched with broad-spectrum anti-helminthics (Albendazole 500mg) prior to the
start of the experiment. The cows were individually stall-fed in a well-ventilated barn with
concrete floor and appropriate drainage slope and gutters.
Experimental design, treatments and measurements
At the beginning of the experiment, four cows were randomly blocked in a simple 4X4 Latin
Square Design. There were, in general, 4 experimental cows, 4 treatment diets and 4 periods. The
length of each period was 28 days, out of which 21 days were allocated for adaptation while the
remaining seven days were used for actual data collections and analysis. In total, the feeding trial
has taken about 112 days. All cows were hand- milked twice a day and milk yield was recorded
daily. Aliquot samples of morning and evening milk was collected weekly to analyze milk
chemical composition. Water was available at all times free of choice. The experimental animals
were randomly receiving one of the four dietary treatments indicated below.
1. EM2 treated barley straw basal diet adlibitum + 0.3kg concentrate mix, lt-1 of milk
produced
2. EM2 treated barley straw basal diet ad libitum + 0.5kg concentrate mix, lt-1 of milk
produced
3. EM2 treated barley straw basal diet ad libitum + 0.7kg concentrate mix, lt-1 of milk
produced
4. Untreated barley straw ad libitum + 0.5 kg concentrate mix, lt-1 of milk produced
(control diet)
The cows were offered the supplements twice a day with a standard on-station formulated dairy
concentrate mixture (76% wheat bran, 23% noug seed cake and 1% salt). The mix was assumed
19

Getu Kitaw et al, /Eth. J. Anim. Prod. 16(1)-2016:17-35
to fully meet the daily requirement for protein (16%) in the total ration of lactating crossbred
cows with milk yield of 8-10 lt, d-1 and a butter fat content of 4.5% as described in ARC (1990)
when fed as supplement at the rate of 0.5 kg/liter of milk. Barley straw collected from Holetta
Agricultural Research Center was harvested by combine harvester, immediately baled and stored
in hay shed until it was ready to be chopped to a size of 3-5cm using electrical chopper. The
process of ensilage begins with spraying of EM2 solution to the barley straw at the rate of 1lt per
kg straw mass. The treated barley straw was compacted and then allowed to ferment for one
month in an air tight plastic barrel of (250 lt) capacity before it was being fed to the animals.
Feed offer and refusals were measured and recorded for each cow to determine daily feed
and nutrient intake. Feed offer and refusal samples were taken daily and weighed per cow,
bulked on a period bases and oven dried at 650C for 72h. Samples were then ground using Cyclo-
Tec sample mills to pass 1 mm sieve size for DM analysis to calculate feed intake.
Diet apparent digestibility
Apparent digestibility was determined for the total ration in each treatment using the procedures
of total fecal collection method for a period of five consecutive days at around the end of each
experimental period. To minimize error in faces collections, farm personnel were assigned
around the clock to scoop feces into plastic buckets when the animals were defecating. Urinal
contamination was minimized by frequent washing of the concrete floor with high pressure
running water using a plastic water hose. Individual cow‟s feces were weighed every morning
before 8:00am and before feeds were given to the animals. The feces from each cow were
thoroughly mixed and a sample of 1% were taken and placed in polyethylene bag. Composite
samples of the daily collected samples were mixed and stored in a deep freezer (-20oC) until the
end of the collection period. At the end of the collection period, the pooled samples were thawed
and mixed thoroughly and samples were oven dried at 65oC for 72 hours, ground to pass a 1-mm
sieve and stored in sample bottles at room temperature. Apparent digestibility of DM and
nutrients was determined using the formula: Milk yield and composition
The cows were hand- milked twice a day at 5:00am in the morning and 16:00pm in the afternoon
and milk yield was recorded individually for each animal. 100ml of milk Aliquot samples from
the morning and evening milking were taken at each period on a weekly basis for laboratory
determination of major milk components (milk fat, protein, lactose and total solids). The
sampling bottle was properly cleaned and sanitized before samples were taken to Holetta
Agricultural Research Center dairy laboratory.
20
Getu Kitaw et al, /Eth. J. Anim. Prod. 16(1)-2016:17-35
Chemical analysis
All samples of feeds from laboratory trial in phase one, feed offer and refusals samples from the
feeding trial in phase two and feces samples from digestibility trial were analyzed for DM, ash,
N (Kjeldahl-N) according to the procedures of AOAC (1990). Neutral detergent fiber (NDF),
Acid Detergent fiber (ADF) and permanganate lignin were determined by the method of Van
Soest and Robertson (1985). In-vitro OM digestibility of feeds offered was determined according
to the procedures outlined by Tilley and Terry (1963). Hemi-cellulose was calculated as a
difference between NDF and ADF. Metabolizable energy (ME) value was estimated from the in-
vitroOM digestibility (IVOMD): EME (MJ/kg) =0.16(IVOMD) according to McDonald et al.
(2002). Gerber method (AOAC, 1980) was used for milk fat analysis, while the formaldehyde
titration method (Pyne, 1932) was used to analyze milk protein. Total solids in the milk were
determined using the procedures described by Richardson (1985). Lacto scope milk product
analyzer (Users manual ver. 1.1., 2000) was used for lactose determination.
Cost-benefit analysis
Economic returns were calculated for the different groups of animals based on current price data
collected for each input and out price from local markets around Holetta town. A partial budget
analysis has been employed to analyze those items of income and expenses that change.
Therefore, the costs of EM2 treatment per kg straw mass, concentrate feed ingredients and the
cost for treated barely straw consumed by the animals in the different treatment group were
considered as varying costs while all other costs (wedge, medications, electricity, water etc.)
were ignored since they remained constant over all the dietary treatments.
Statistical analysis
Analysis of variance was made using a statistical package SAS (SAS, 2002). Data from the first
laboratory trial was analyzed using CRD model in 3x3x2 factorial arrangements. All data from
the feeding and digestibility trial was analyzed using a simple 4X4 Latin Square Design.
Treatment means were separated using Least Squares Significant difference (LSD). The models
for both designs are indicated below:
1. Model for CRD in factorial arrangement
Yijk = + Ci +Lj + CLij + eijkWhere; = Overall mean, Ci= Effect of type of crop
residue,Lj =Effect of level of application of EM2,CLij = Interaction effect,eijk =Random
error
2. Model for simple 4X4 Latin Square Design
Yijk = + Ci +Pj + Tk + Eijk,Where: = Overall mean,Ci = Cow effect (parity), Pj =
Period effect,Tk = Treatment effect,Eijk = Experimental error
21
Getu Kitaw et al, /Eth. J. Anim. Prod. 16(1)-2016:17-35
Results and Discussion
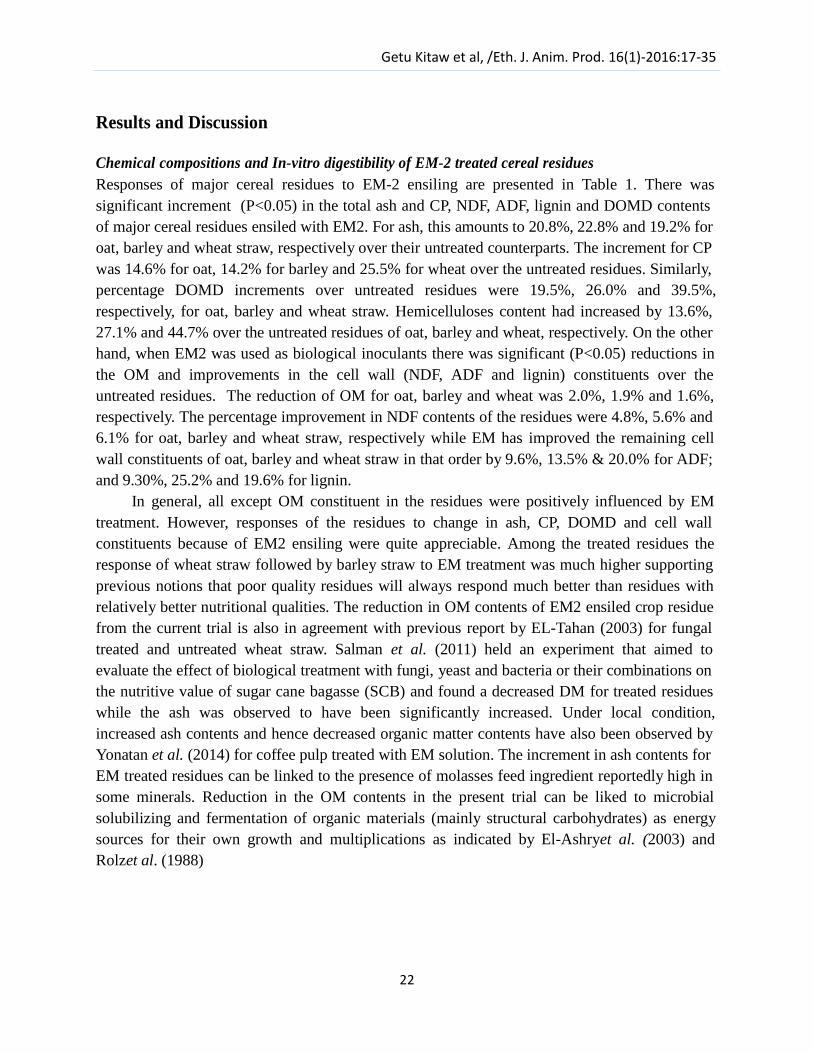
Chemical compositions and In-vitro digestibility of EM-2 treated cereal residues
Responses of major cereal residues to EM-2 ensiling are presented in Table 1. There was
significant increment (P<0.05) in the total ash and CP, NDF, ADF, lignin and DOMD contents
of major cereal residues ensiled with EM2. For ash, this amounts to 20.8%, 22.8% and 19.2% for
oat, barley and wheat straw, respectively over their untreated counterparts. The increment for CP
was 14.6% for oat, 14.2% for barley and 25.5% for wheat over the untreated residues. Similarly,
percentage DOMD increments over untreated residues were 19.5%, 26.0% and 39.5%,
respectively, for oat, barley and wheat straw. Hemicelluloses content had increased by 13.6%,
27.1% and 44.7% over the untreated residues of oat, barley and wheat, respectively. On the other
hand, when EM2 was used as biological inoculants there was significant (P<0.05) reductions in
the OM and improvements in the cell wall (NDF, ADF and lignin) constituents over the
untreated residues. The reduction of OM for oat, barley and wheat was 2.0%, 1.9% and 1.6%,
respectively. The percentage improvement in NDF contents of the residues were 4.8%, 5.6% and
6.1% for oat, barley and wheat straw, respectively while EM has improved the remaining cell
wall constituents of oat, barley and wheat straw in that order by 9.6%, 13.5% & 20.0% for ADF;
and 9.30%, 25.2% and 19.6% for lignin.
In general, all except OM constituent in the residues were positively influenced by EM
treatment. However, responses of the residues to change in ash, CP, DOMD and cell wall
constituents because of EM2 ensiling were quite appreciable. Among the treated residues the
response of wheat straw followed by barley straw to EM treatment was much higher supporting
previous notions that poor quality residues will always respond much better than residues with
relatively better nutritional qualities. The reduction in OM contents of EM2 ensiled crop residue
from the current trial is also in agreement with previous report by EL-Tahan (2003) for fungal
treated and untreated wheat straw. Salman et al. (2011) held an experiment that aimed to
evaluate the effect of biological treatment with fungi, yeast and bacteria or their combinations on
the nutritive value of sugar cane bagasse (SCB) and found a decreased DM for treated residues
while the ash was observed to have been significantly increased. Under local condition,
increased ash contents and hence decreased organic matter contents have also been observed by
Yonatan et al. (2014) for coffee pulp treated with EM solution. The increment in ash contents for
EM treated residues can be linked to the presence of molasses feed ingredient reportedly high in
some minerals. Reduction in the OM contents in the present trial can be liked to microbial
solubilizing and fermentation of organic materials (mainly structural carbohydrates) as energy
sources for their own growth and multiplications as indicated by El-Ashryet al. (2003) and
Rolzet al. (1988)
22
Getu Kitaw et al, /Eth. J. Anim. Prod. 16(1)-2016:17-35
Table1. Response of major cereal residues to EM2 ensiling
Treatment DM
(%)
Average nutritive value expressed as % DM
Ash CP NDF ADF H-cell Lignin DOMD
UOS 93.1 b
8.81 c e
1.92 e
80.7 d
63.9 16.8 c
9.68 b
38.89 d
UBS 93.5a
7.59 d b
2.74 d
79.6 d
64.1 15.4 d
10.9bc
38.94 d
UWS 93.8a
7.70 d f
1.65 f
83.0 e
65.2 17.8 bc
11.9 c
29.64 e
TOS 91.4 d
10.6 a c
2.20 b
76.8 c
57.8 19.0 b
8.8 ab
46.46 b
TBS 92.9 b
9.32 b a
3.13 a
75.1 b
55.5 19.6 b
8.18 a
48.67 a
TWS 92.2 c
9.18 bc d
2.07 c
77.9 a
52.2 25.7a
9.55 b
41.36 c
Mean
+SEM
92.8
±0.32
8.87
±0.42
2.29
±0.20
78.9±1
.05
59.8±
2.01
19.1
±1.34
9.84
±0.51
40.66
±2.50 CV% 1.07 7.08 1.56 2.17 10.12 14.82 7.26 6.16 abc Means with different superscripts along column are significantly different (P=0.05); UOS=
untreated oat straw; UBS= untreated barley straw; UWS= untreated wheat straw; TOS= treated oat
straw; TBS= treated barley straw; TWS= treated wheat straw; DM=dry matter; OM= organic
matter; CP= crude protein; NDF=neutral detergent fiber; ADF=acid detergent fiber; H-cell=hemi- cellulose; DOMD =digestible organic matter in the dry matter
The average CP improvement over the untreated residues (i.e., 17%) from the current trial can
fairly be compared with previous research findings of 19.2% for various microbial treated
fibrous basal diets by Nahla et al. (2015) and El-Marakby (2003). Improvements in CP contents
of EM2 treated residues may be due to one of the following reasons: the presence of
microorganisms, extracellular enzymes and residual media ingredients in the treated materials
(Khattabet al.,2013), the capture of access nitrogen by aerobic fermentation by fungus
(Akinfemi, 2010), and the proliferation of fungi during degradation (Akinfemi and Ogunwole,
2012).The increments in CP contents due to EM treatment, however, were so much marginal
compared to progress made with biological treatments earlier for other fibrous diets (El-Bannaet
al., 2010b;Akinfemi and Ogunwole, 2012).
The observed increment in in-vitro OM digestibility of the residues ensiled with EM could
be attributed to the improvements in major cell wall constituents (NDF, ADF and lignin). The
yeasts and bacterial species present in the EM might have positively induced the change that was
reflected by improvement in the corresponding in-vitro DM digestibility values of the treated
residues. Especially the role of yeast in the EM solution is quite indispensable since yeasts have
been reported to utilize feeds with high structural components (Maurya, 1993). The maximum
improvement in DOMD brought about by EM2 treatment over untreated residue from the current
trial was the one that was recorded for wheat straw (39.5%). The average improvement over the
untreated residue (i.e., 28%) was close to the figure (30%) reported earlier for EM ensiled coffee
pulp by Yonatan (2014). IVOMD figure as high as 57.02% was reported for rice straw treated
with different strains of fungi earlier by Akinfemi and Ogunwole (2012).
23
Getu Kitaw et al, /Eth. J. Anim. Prod. 16(1)-2016:17-35
Application of EM inoculates on fibrous feedstuffs have been previously reported to have
increased the quality of the silage by decreasing fibrous contents of the silage (NDF and ADF)
(Higa and Wididana, 2007). Possible rationale behind a reduction in NDF and ADF content of
the ensiled residues in the current trial according to Fayed et al.(2009) could be due to the
addition of molasses to the silage which in effect can increase the number of anaerobic bacteria
(lactic acid bacteria: Lactobacillus plantarum; L.casei; Streptococcus lactis) and yeast
(Cercomycaecervicae) capable of degrading the lingo-cellulotic complexes in the cell wall
fractions of the silage material through their oxidizing and solublizing effects. The current result
is also in pare with the findings of El-Marakby (2003) who found a great decrease in content of
neutral detergent fiber (NDF- 45.1%), acid detergent fiber (ADF- by 31.5%), cellulose (by
53.7%) and hemi-cellulose (by 96.3%) for wheat straw treated with white rot fungus,
Agaricusbisporous. All disparities with previous findings can be speculated to the difference in
the type of microbes and/or microbial strains used, quantities applied, straw type and quality and
above all luck of reconstituting the residues with water prior to EM applications.
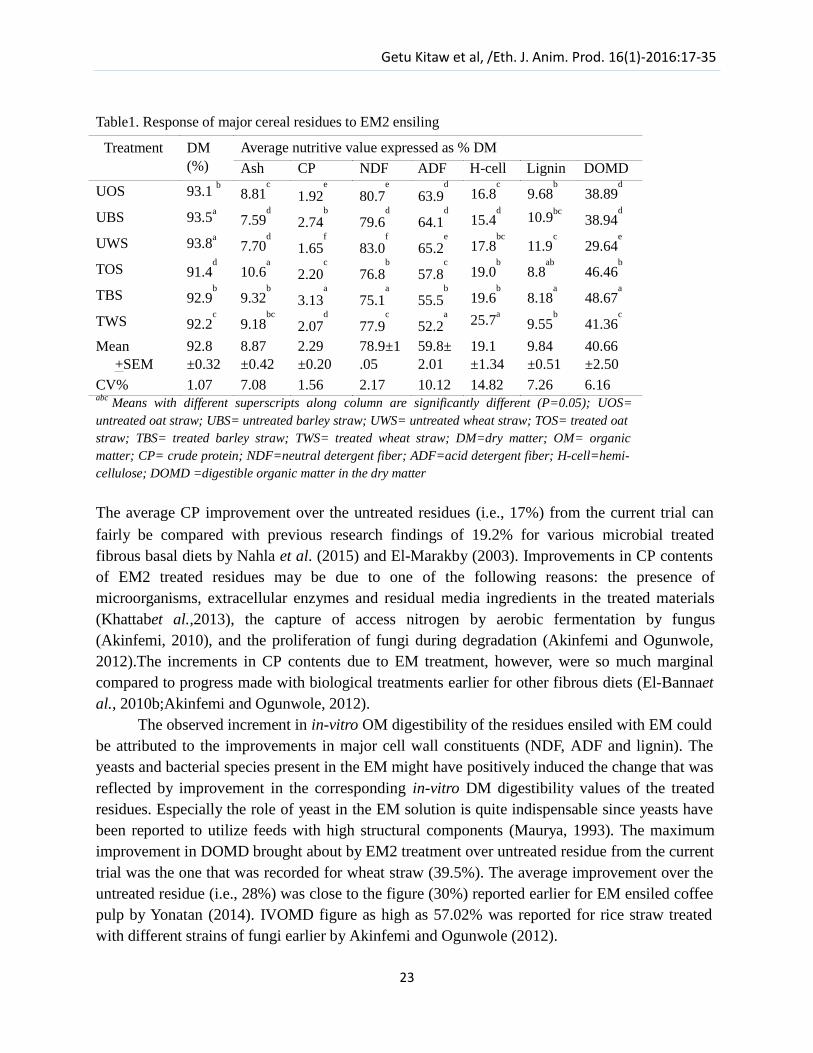
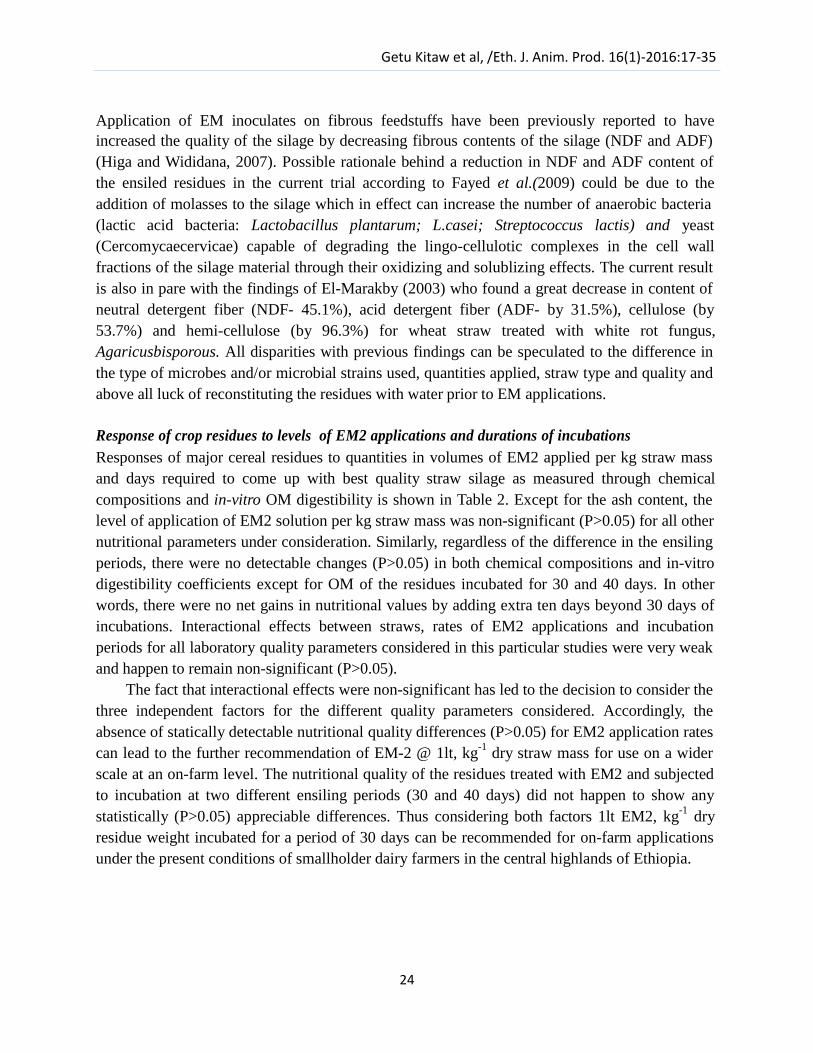
Response of crop residues to levels of EM2 applications and durations of incubations
Responses of major cereal residues to quantities in volumes of EM2 applied per kg straw mass
and days required to come up with best quality straw silage as measured through chemical
compositions and in-vitro OM digestibility is shown in Table 2. Except for the ash content, the
level of application of EM2 solution per kg straw mass was non-significant (P>0.05) for all other
nutritional parameters under consideration. Similarly, regardless of the difference in the ensiling
periods, there were no detectable changes (P>0.05) in both chemical compositions and in-vitro
digestibility coefficients except for OM of the residues incubated for 30 and 40 days. In other
words, there were no net gains in nutritional values by adding extra ten days beyond 30 days of
incubations. Interactional effects between straws, rates of EM2 applications and incubation
periods for all laboratory quality parameters considered in this particular studies were very weak
and happen to remain non-significant (P>0.05).
The fact that interactional effects were non-significant has led to the decision to consider the
three independent factors for the different quality parameters considered. Accordingly, the
absence of statically detectable nutritional quality differences (P>0.05) for EM2 application rates
can lead to the further recommendation of EM-2 @ 1lt, kg-1 dry straw mass for use on a wider
scale at an on-farm level. The nutritional quality of the residues treated with EM2 and subjected
to incubation at two different ensiling periods (30 and 40 days) did not happen to show any
statistically (P>0.05) appreciable differences. Thus considering both factors 1lt EM2, kg-1 dry
residue weight incubated for a period of 30 days can be recommended for on-farm applications
under the present conditions of smallholder dairy farmers in the central highlands of Ethiopia.
24
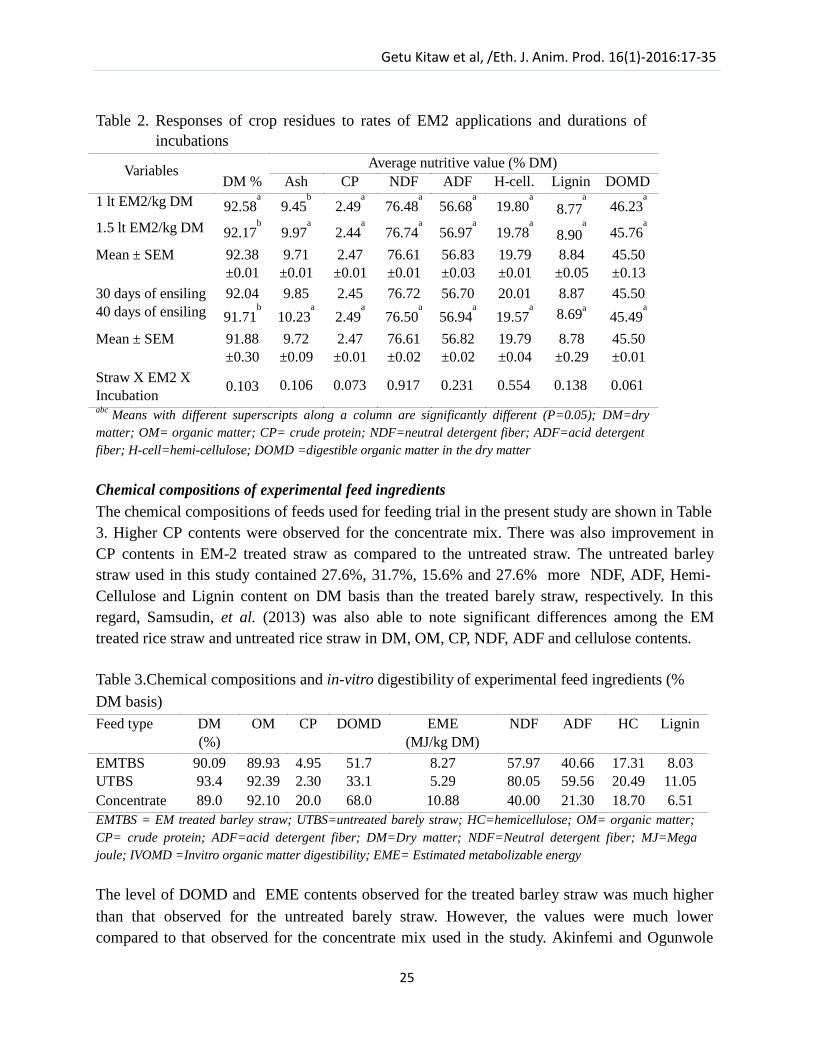
Getu Kitaw et al, /Eth. J. Anim. Prod. 16(1)-2016:17-35
Table 2. Responses of crop residues to rates of EM2 applications and durations of
incubations
Variables DM %
Average nutritive value (% DM)
Ash CP NDF ADF H-cell. Lignin DOMD
1 lt EM2/kg DM 92.58 a
9.45 b
2.49 a
76.48 a
56.68 a
19.80 a a
8.77 46.23 a
1.5 lt EM2/kg DM 92.17 b
9.97 a
2.44 a
76.74 a
56.97 a
19.78 a a
8.90 45.76 a
Mean ± SEM 92.38
±0.01
9.71
±0.01
2.47
±0.01
76.61
±0.01
56.83
±0.03
19.79
±0.01
8.84
±0.05
45.50
±0.13 30 days of ensiling 92.04 9.85 2.45 76.72 56.70 20.01 8.87 45.50
40 days of ensiling 91.71 b
10.23 a
2.49 a
76.50 a
56.94 a
19.57 a
8.69a
45.49 a
Mean ± SEM 91.88
±0.30
9.72
±0.09
2.47
±0.01
76.61
±0.02
56.82
±0.02
19.79
±0.04
8.78
±0.29
45.50
±0.01 Straw X EM2 X
Incubation 0.103
0.106 0.073 0.917 0.231 0.554 0.138 0.061
abc Means with different superscripts along a column are significantly different (P=0.05); DM=dry matter; OM= organic matter; CP= crude protein; NDF=neutral detergent fiber; ADF=acid detergent
fiber; H-cell=hemi-cellulose; DOMD =digestible organic matter in the dry matter
Chemical compositions of experimental feed ingredients
The chemical compositions of feeds used for feeding trial in the present study are shown in Table
3. Higher CP contents were observed for the concentrate mix. There was also improvement in
CP contents in EM-2 treated straw as compared to the untreated straw. The untreated barley
straw used in this study contained 27.6%, 31.7%, 15.6% and 27.6% more NDF, ADF, Hemi-
Cellulose and Lignin content on DM basis than the treated barely straw, respectively. In this
regard, Samsudin, et al. (2013) was also able to note significant differences among the EM
treated rice straw and untreated rice straw in DM, OM, CP, NDF, ADF and cellulose contents.
Table 3.Chemical compositions and in-vitro digestibility of experimental feed ingredients (%
DM basis) Feed type DM
(%)
OM CP DOMD EME
(MJ/kg DM)
NDF ADF HC Lignin
EMTBS 90.09 89.93 4.95 51.7 8.27 57.97 40.66 17.31 8.03
UTBS 93.4 92.39 2.30 33.1 5.29 80.05 59.56 20.49 11.05
Concentrate 89.0 92.10 20.0 68.0 10.88 40.00 21.30 18.70 6.51
EMTBS = EM treated barley straw; UTBS=untreated barely straw; HC=hemicellulose; OM= organic matter;
CP= crude protein; ADF=acid detergent fiber; DM=Dry matter; NDF=Neutral detergent fiber; MJ=Mega
joule; IVOMD =Invitro organic matter digestibility; EME= Estimated metabolizable energy
The level of DOMD and EME contents observed for the treated barley straw was much higher
than that observed for the untreated barely straw. However, the values were much lower
compared to that observed for the concentrate mix used in the study. Akinfemi and Ogunwole
25
Getu Kitaw et al, /Eth. J. Anim. Prod. 16(1)-2016:17-35
(2012) also reported higher EME for the fungal treated rice straw than the untreated residue. On
the other hand, treatment with EM2 has almost doubled the CP contents over the untreated
residue. The improvement made in cell wall fraction over the untreated residue of barley straw
was also remarkably higher. Since intake and digestibility limitation with untreated residue can
somehow be improved with EM treatment (Table 4&5) it is natural to expect additional saving
from daily concentrate allowance of lactating crossbred cows maintained on EM-2 treated crop
residue based diet.
Daily feed and nutrients intake
The values for voluntarily feed and nutrient intakes of experimental cows are presented in Table
4. There were considerable changes (P<0.05) in the daily basal feed intakes between the groups
that fed with the treated and untreated barley straw residues. Difference in the daily allowance of
concentrate were non-significant (P>0.05) for cows under dietary treatments receiving the treated
barley straw. Experimental cows receiving the treated barely straw as a basal diet consumed on
average 6.62 kg,d-1 while those on the untreated residue consumed 1.76 kg less barley straw on a
daily basis. Daily allowance for concentrate and total dry matter intakes were significantly
differing (P<0.05) both among the groups that were receiving the treated residues and when
these same groups were compared with cows receiving the control diet.
Daily Nutrient intakes followed same trend as for the total DM intake. In general, DM
intake differences were significant (P<0.05) both among and between dietary treatments with
cows on dietary T3, consuming considerably higher daily nutrient intakes followed by cows on
dietary T2 and T1. Except for ADF intakes the increasing trend for all nutrient intakes followed
the increasing trend in the daily allowance of concentrate intakes among cows receiving the
treated residue. Because of the response of ADF residue to EM2 treatment was so marginal
(Table 3), average daily intake of ADF fraction by cows receiving the untreated residue as a
basal diet was higher by 0.13kg than those cows receiving the treated barely straw residue.
Metabolizable energy (MJ,d-1
) intake differences were highly significant among all dietary
treatments (P <0.05) with cows on dietary treatment 3 consuming considerably higher daily ME
per day of 15.07, 30.08 and 47.04 compared to that of cows in T2 ,T1 and T4, respectively.
Cows on all treatments were on the negative energy balance for the targeted daily milk yield of
8-10 kg according to ARC (1990) presumably because the total ration was not fortified with
adequate energy sources both quantitatively and qualitatively taking the quality of the basal diet
in to account.
Using wheat straw and other different crop residues that are microbially treated and fed to
different class of animals in China, Menget al. (1999) reported similar improvements in the daily
basal and nutrient intakes for DM, OM, CP, NDF and ADF. These changes according to same
authors were related to the fact that ensiled crop residues with microbial agents usually have
good palatability for ruminants, and thus would be responsible for higher intake. More over
according to Yosephet al. (2002) lower fiber and relatively higher CP contents in the treated
residue may be responsible for the improved DM and total DM intakes by ruminants. On the
26
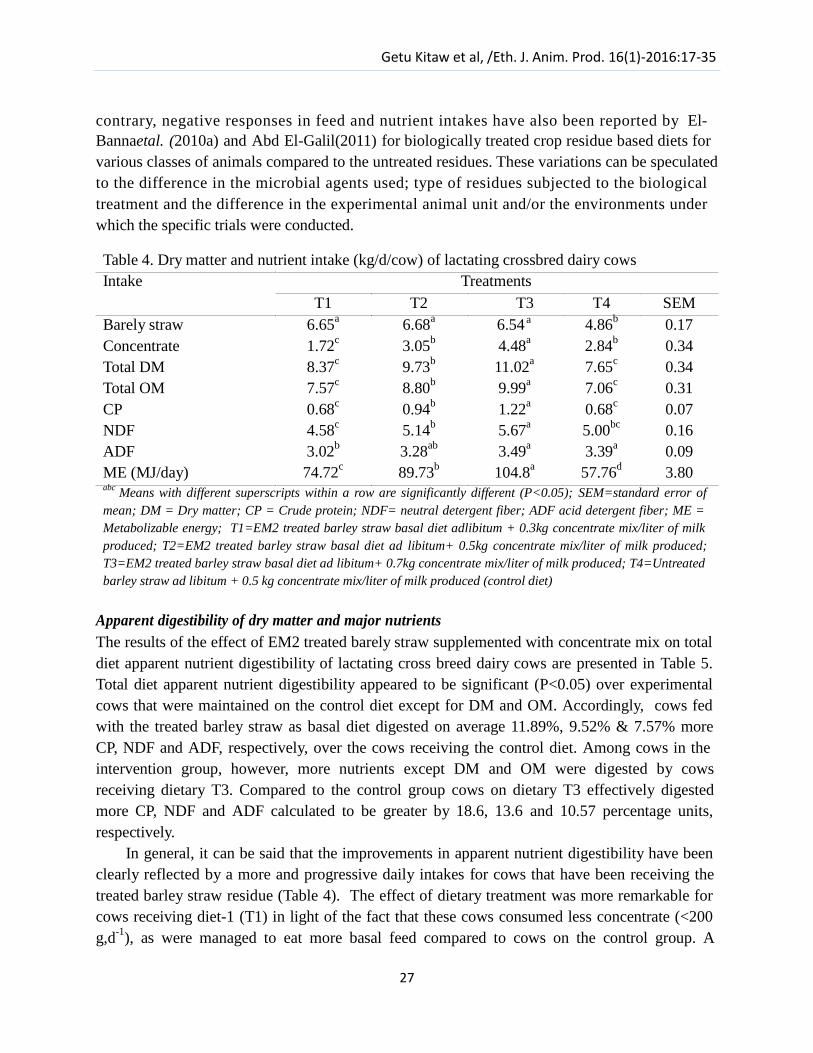
Getu Kitaw et al, /Eth. J. Anim. Prod. 16(1)-2016:17-35
contrary, negative responses in feed and nutrient intakes have also been reported by El-
Bannaetal. (2010a) and Abd El-Galil(2011) for biologically treated crop residue based diets for
various classes of animals compared to the untreated residues. These variations can be speculated
to the difference in the microbial agents used; type of residues subjected to the biological
treatment and the difference in the experimental animal unit and/or the environments under
which the specific trials were conducted.
Table 4. Dry matter and nutrient intake (kg/d/cow) of lactating crossbred dairy cows
Intake Treatments
T1 T2 T3 T4 SEM
Barely straw 6.65a 6.68
a 6.54 a 4.86b 0.17
Concentrate 1.72c 3.05
b 4.48
a 2.84
b 0.34
Total DM 8.37c 9.73
b 11.02
a 7.65
c 0.34
Total OM 7.57c 8.80
b 9.99
a 7.06
c 0.31
CP 0.68c 0.94
b 1.22
a 0.68
c 0.07
NDF 4.58c 5.14
b 5.67
a 5.00
bc 0.16
ADF 3.02b 3.28
ab 3.49
a 3.39
a 0.09
ME (MJ/day) 74.72c 89.73
b 104.8
a 57.76
d 3.80
abc Means with different superscripts within a row are significantly different (P<0.05); SEM=standard error of
mean; DM = Dry matter; CP = Crude protein; NDF= neutral detergent fiber; ADF acid detergent fiber; ME = Metabolizable energy; T1=EM2 treated barley straw basal diet adlibitum + 0.3kg concentrate mix/liter of milk
produced; T2=EM2 treated barley straw basal diet ad libitum+ 0.5kg concentrate mix/liter of milk produced;
T3=EM2 treated barley straw basal diet ad libitum+ 0.7kg concentrate mix/liter of milk produced; T4=Untreated barley straw ad libitum + 0.5 kg concentrate mix/liter of milk produced (control diet)
Apparent digestibility of dry matter and major nutrients
The results of the effect of EM2 treated barely straw supplemented with concentrate mix on total
diet apparent nutrient digestibility of lactating cross breed dairy cows are presented in Table 5.
Total diet apparent nutrient digestibility appeared to be significant (P<0.05) over experimental
cows that were maintained on the control diet except for DM and OM. Accordingly, cows fed
with the treated barley straw as basal diet digested on average 11.89%, 9.52% & 7.57% more
CP, NDF and ADF, respectively, over the cows receiving the control diet. Among cows in the
intervention group, however, more nutrients except DM and OM were digested by cows
receiving dietary T3. Compared to the control group cows on dietary T3 effectively digested
more CP, NDF and ADF calculated to be greater by 18.6, 13.6 and 10.57 percentage units,
respectively.
In general, it can be said that the improvements in apparent nutrient digestibility have been
clearly reflected by a more and progressive daily intakes for cows that have been receiving the
treated barley straw residue (Table 4). The effect of dietary treatment was more remarkable for
cows receiving diet-1 (T1) in light of the fact that these cows consumed less concentrate (<200
g,d-1
), as were managed to eat more basal feed compared to cows on the control group. A
27
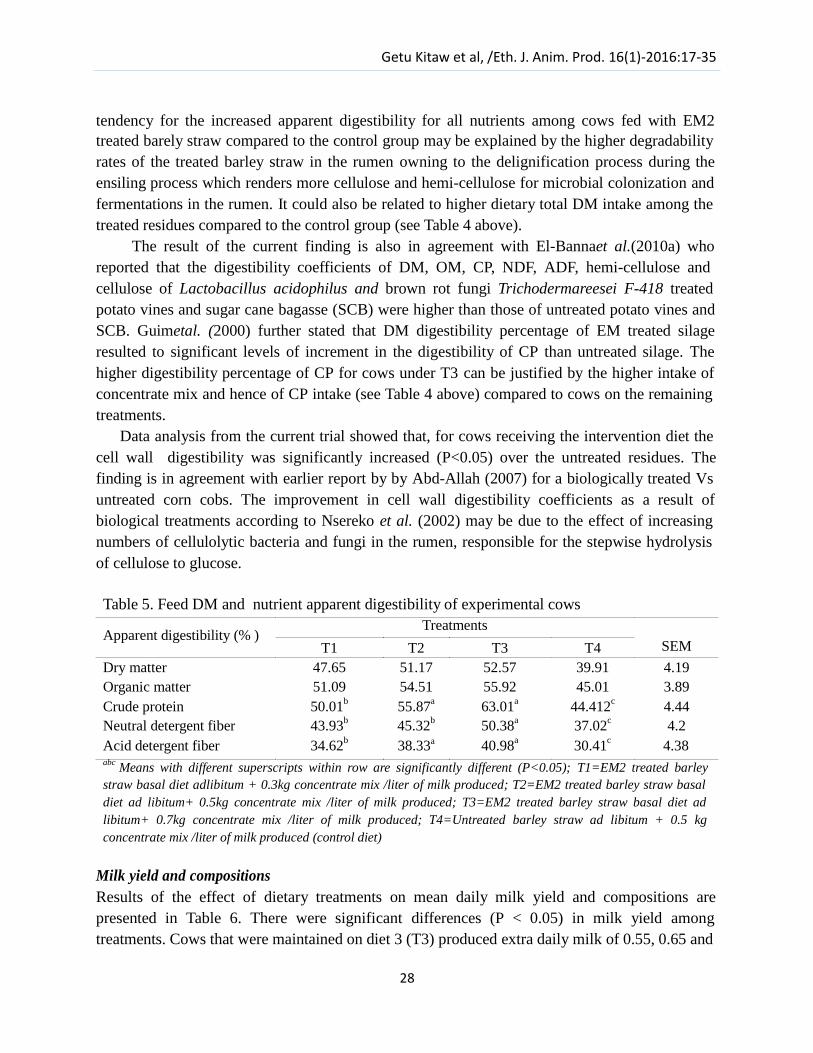
Getu Kitaw et al, /Eth. J. Anim. Prod. 16(1)-2016:17-35
tendency for the increased apparent digestibility for all nutrients among cows fed with EM2
treated barely straw compared to the control group may be explained by the higher degradability
rates of the treated barley straw in the rumen owning to the delignification process during the
ensiling process which renders more cellulose and hemi-cellulose for microbial colonization and
fermentations in the rumen. It could also be related to higher dietary total DM intake among the
treated residues compared to the control group (see Table 4 above).
The result of the current finding is also in agreement with El-Bannaet al.(2010a) who
reported that the digestibility coefficients of DM, OM, CP, NDF, ADF, hemi-cellulose and
cellulose of Lactobacillus acidophilus and brown rot fungi Trichodermareesei F-418 treated
potato vines and sugar cane bagasse (SCB) were higher than those of untreated potato vines and
SCB. Guimetal. (2000) further stated that DM digestibility percentage of EM treated silage
resulted to significant levels of increment in the digestibility of CP than untreated silage. The
higher digestibility percentage of CP for cows under T3 can be justified by the higher intake of
concentrate mix and hence of CP intake (see Table 4 above) compared to cows on the remaining
treatments.
Data analysis from the current trial showed that, for cows receiving the intervention diet the
cell wall digestibility was significantly increased (P<0.05) over the untreated residues. The
finding is in agreement with earlier report by by Abd-Allah (2007) for a biologically treated Vs
untreated corn cobs. The improvement in cell wall digestibility coefficients as a result of
biological treatments according to Nsereko et al. (2002) may be due to the effect of increasing
numbers of cellulolytic bacteria and fungi in the rumen, responsible for the stepwise hydrolysis
of cellulose to glucose.
Table 5. Feed DM and nutrient apparent digestibility of experimental cows
Apparent digestibility (% ) Treatments
T1 T2 T3 T4
SEM
Dry matter 47.65 51.17 52.57 39.91 4.19
Organic matter 51.09 54.51 55.92 45.01 3.89
Crude protein 50.01b 55.87
a 63.01
a 44.412
c 4.44
Neutral detergent fiber 43.93b 45.32
b 50.38
a 37.02
c 4.2
Acid detergent fiber 34.62b 38.33 a 40.98
a 30.41c 4.38
abc Means with different superscripts within row are significantly different (P<0.05); T1=EM2 treated barley straw basal diet adlibitum + 0.3kg concentrate mix /liter of milk produced; T2=EM2 treated barley straw basal
diet ad libitum+ 0.5kg concentrate mix /liter of milk produced; T3=EM2 treated barley straw basal diet ad
libitum+ 0.7kg concentrate mix /liter of milk produced; T4=Untreated barley straw ad libitum + 0.5 kg concentrate mix /liter of milk produced (control diet)
Milk yield and compositions
Results of the effect of dietary treatments on mean daily milk yield and compositions are
presented in Table 6. There were significant differences (P < 0.05) in milk yield among
treatments. Cows that were maintained on diet 3 (T3) produced extra daily milk of 0.55, 0.65 and
28
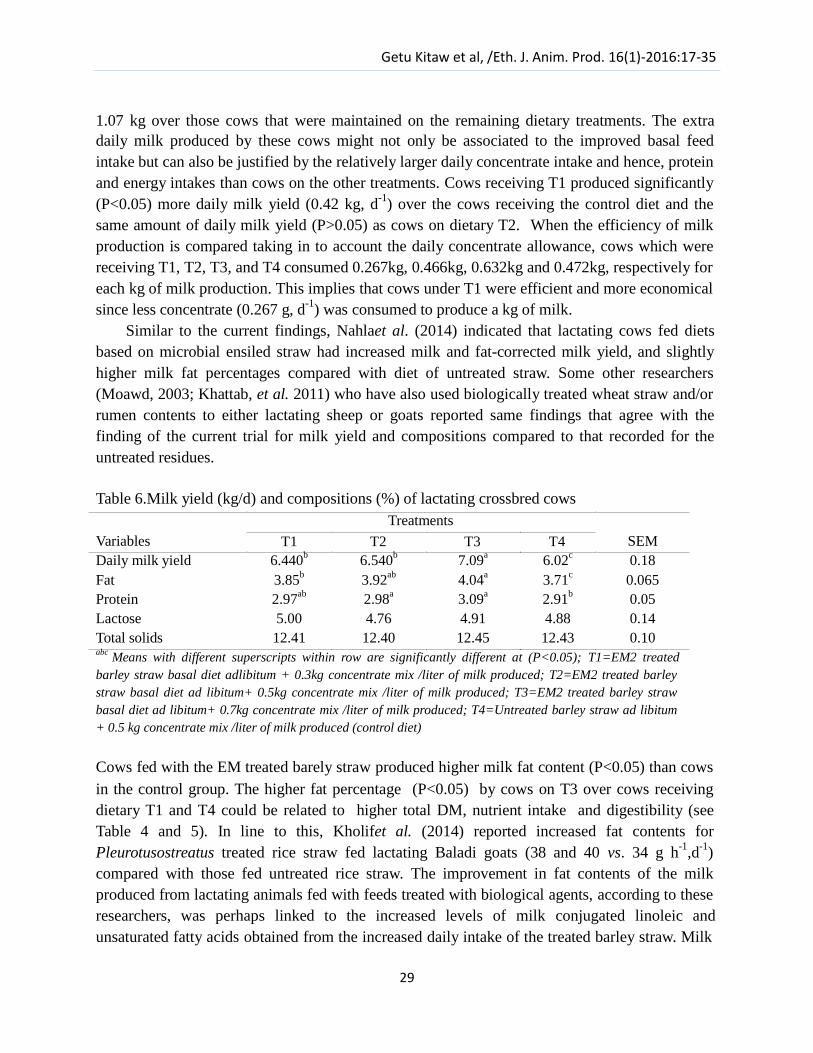
Getu Kitaw et al, /Eth. J. Anim. Prod. 16(1)-2016:17-35
1.07 kg over those cows that were maintained on the remaining dietary treatments. The extra
daily milk produced by these cows might not only be associated to the improved basal feed
intake but can also be justified by the relatively larger daily concentrate intake and hence, protein
and energy intakes than cows on the other treatments. Cows receiving T1 produced significantly
(P<0.05) more daily milk yield (0.42 kg, d-1) over the cows receiving the control diet and the
same amount of daily milk yield (P>0.05) as cows on dietary T2. When the efficiency of milk
production is compared taking in to account the daily concentrate allowance, cows which were
receiving T1, T2, T3, and T4 consumed 0.267kg, 0.466kg, 0.632kg and 0.472kg, respectively for
each kg of milk production. This implies that cows under T1 were efficient and more economical
since less concentrate (0.267 g, d-1) was consumed to produce a kg of milk.
Similar to the current findings, Nahlaet al. (2014) indicated that lactating cows fed diets
based on microbial ensiled straw had increased milk and fat-corrected milk yield, and slightly
higher milk fat percentages compared with diet of untreated straw. Some other researchers
(Moawd, 2003; Khattab, et al. 2011) who have also used biologically treated wheat straw and/or
rumen contents to either lactating sheep or goats reported same findings that agree with the
finding of the current trial for milk yield and compositions compared to that recorded for the
untreated residues.
Table 6.Milk yield (kg/d) and compositions (%) of lactating crossbred cows
Treatments
Variables T1 T2 T3 T4 SEM
Daily milk yield 6.440b 6.540
b 7.09
a 6.02
c 0.18
Fat 3.85b 3.92
ab 4.04
a 3.71
c 0.065
Protein 2.97ab
2.98a 3.09
a 2.91
b 0.05
Lactose 5.00 4.76 4.91 4.88 0.14
Total solids 12.41 12.40 12.45 12.43 0.10 abc Means with different superscripts within row are significantly different at (P<0.05); T1=EM2 treated
barley straw basal diet adlibitum + 0.3kg concentrate mix /liter of milk produced; T2=EM2 treated barley straw basal diet ad libitum+ 0.5kg concentrate mix /liter of milk produced; T3=EM2 treated barley straw
basal diet ad libitum+ 0.7kg concentrate mix /liter of milk produced; T4=Untreated barley straw ad libitum
+ 0.5 kg concentrate mix /liter of milk produced (control diet)
Cows fed with the EM treated barely straw produced higher milk fat content (P<0.05) than cows
in the control group. The higher fat percentage (P<0.05) by cows on T3 over cows receiving
dietary T1 and T4 could be related to higher total DM, nutrient intake and digestibility (see
Table 4 and 5). In line to this, Kholifet al. (2014) reported increased fat contents for
Pleurotusostreatus treated rice straw fed lactating Baladi goats (38 and 40 vs. 34 g h-1
,d-1
)
compared with those fed untreated rice straw. The improvement in fat contents of the milk
produced from lactating animals fed with feeds treated with biological agents, according to these
researchers, was perhaps linked to the increased levels of milk conjugated linoleic and
unsaturated fatty acids obtained from the increased daily intake of the treated barley straw. Milk
29
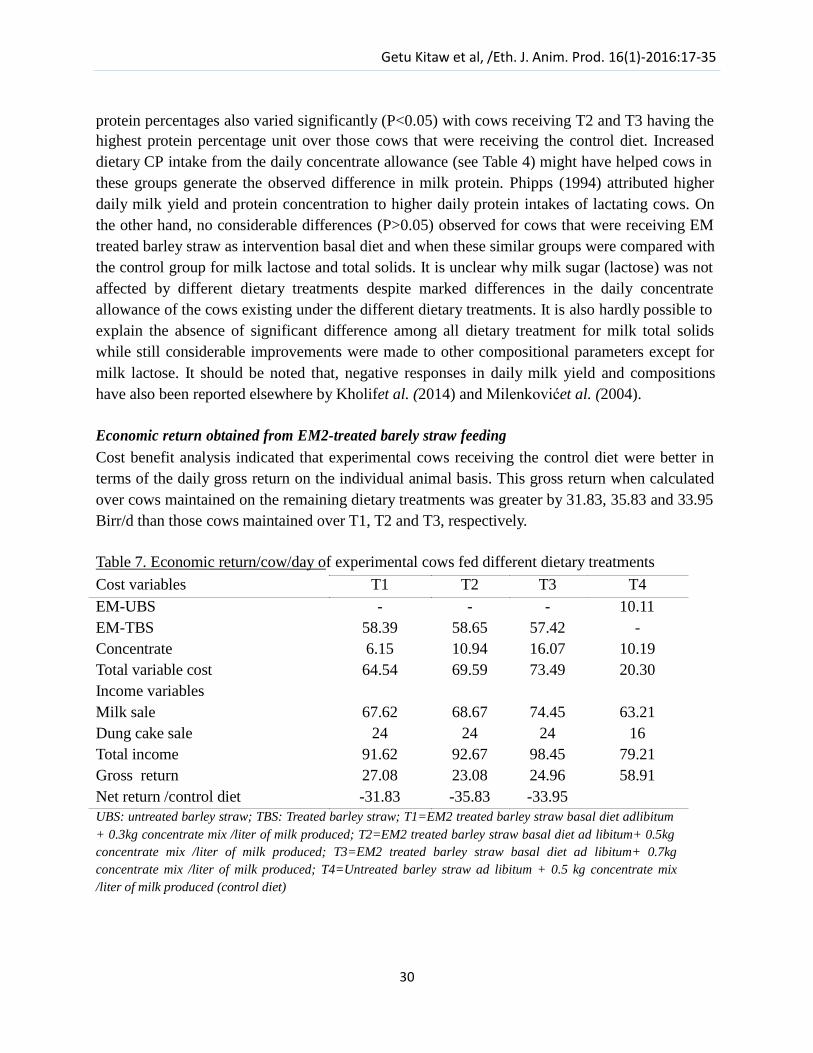
Getu Kitaw et al, /Eth. J. Anim. Prod. 16(1)-2016:17-35
protein percentages also varied significantly (P<0.05) with cows receiving T2 and T3 having the
highest protein percentage unit over those cows that were receiving the control diet. Increased
dietary CP intake from the daily concentrate allowance (see Table 4) might have helped cows in
these groups generate the observed difference in milk protein. Phipps (1994) attributed higher
daily milk yield and protein concentration to higher daily protein intakes of lactating cows. On
the other hand, no considerable differences (P>0.05) observed for cows that were receiving EM
treated barley straw as intervention basal diet and when these similar groups were compared with
the control group for milk lactose and total solids. It is unclear why milk sugar (lactose) was not
affected by different dietary treatments despite marked differences in the daily concentrate
allowance of the cows existing under the different dietary treatments. It is also hardly possible to
explain the absence of significant difference among all dietary treatment for milk total solids
while still considerable improvements were made to other compositional parameters except for
milk lactose. It should be noted that, negative responses in daily milk yield and compositions
have also been reported elsewhere by Kholifet al. (2014) and Milenkovićet al. (2004).
Economic return obtained from EM2-treated barely straw feeding
Cost benefit analysis indicated that experimental cows receiving the control diet were better in
terms of the daily gross return on the individual animal basis. This gross return when calculated
over cows maintained on the remaining dietary treatments was greater by 31.83, 35.83 and 33.95
Birr/d than those cows maintained over T1, T2 and T3, respectively.
Table 7. Economic return/cow/day of experimental cows fed different dietary treatments
Cost variables T1 T2 T3 T4
EM-UBS - - - 10.11
EM-TBS 58.39 58.65 57.42 -
Concentrate 6.15 10.94 16.07 10.19
Total variable cost 64.54 69.59 73.49 20.30
Income variables
Milk sale 67.62 68.67 74.45 63.21
Dung cake sale 24 24 24 16
Total income 91.62 92.67 98.45 79.21
Gross return 27.08 23.08 24.96 58.91
Net return /control diet -31.83 -35.83 -33.95
UBS: untreated barley straw; TBS: Treated barley straw; T1=EM2 treated barley straw basal diet adlibitum
+ 0.3kg concentrate mix /liter of milk produced; T2=EM2 treated barley straw basal diet ad libitum+ 0.5kg concentrate mix /liter of milk produced; T3=EM2 treated barley straw basal diet ad libitum+ 0.7kg concentrate mix /liter of milk produced; T4=Untreated barley straw ad libitum + 0.5 kg concentrate mix
/liter of milk produced (control diet)
30
Getu Kitaw et al, /Eth. J. Anim. Prod. 16(1)-2016:17-35
Cows on dietary T1, however, generated more gross and net return over the remaining cows
other than those on the control diet. More economic return by control cows can be justified to the
rising cost of straw treatment with EM2 than it was originally anticipated. Moreover, the
difference in the daily basal feed intake and the resulting produce in the daily milk of cows
receiving the intervention diet were not large enough to offset the costs for straw treatment
compared to cows in the control group. On the other hand, the relatively higher gross and net
return per cow per day of cows in T1 group compared to same cows receiving treated straw
based diet in T2 and T3 might have something to do with the reduction in the daily allowance of
concentrate feed by 0.2 and 0.4 kg,d-1 over same treatments, respectively. In addition to the
economic returns, biological responses to EM based diet would need to be judged by their long-
term positive impact on general body conditions and reproduction responses of lactating dairy
cows. Furthermore, considering the present cost of straw treatment with EM and the market price
of milk, feeding EM treated straw would be economically much attractive if cows with higher
milk production potential in early lactations are fed with EM treated straws of relatively poorer
quality and cheaper price.
Assumptions
Estimated labor cost per day was 70 Birr
Cost of 1kg treated barley straw was 8.78 Birr
An average fecal dry matter output of 4.01kg & 5.04kg for the control and cows on the
intervention diets. With that assumption a cow on the control diet produced around 8
dung cakes/day while cows on the intervention diet produced around 12 dung cakes on
same date.
Sale price for a dung cake was 2 Birr while it was 10 Birr for a liter of milk
Current exchange rate of Ethiopian Birr for 1 US dollar = 22.85
Conclusion
Nutritive value, intake and digestibility of cereal residues were considerably improved when a
liter of EM2 solution was applied against a kg of crop residues on DM basis. Moreover, daily
milk production response among the cows fed with EM2 treated barley straw based diet was
substantially improved when the cows were supplemented with a dairy concentrate amounting
to and/or above 0.3 kg,lt-1
,d-1
. Future research work shall focus on minimizing cost of straw
treatment mainly through reconstituting the residues with water prior to EM treatment. That way,
the amount and cost of EM2 used kg-1 straw mass can be drastically reduced. The cost of
treatment and hence of feeding can further be cut to a significant level if the initial purchase
price of the preferred residue for EM2 treatment and ensiling is relatively cheaper. So under local
condition, it could be more worthy to consider wheat straw than barley and teff straws.
31
Getu Kitaw et al, /Eth. J. Anim. Prod. 16(1)-2016:17-35
Acknowledgement
This research work was financed by East African Agricultural Productivity Project (EAAPP).
The animal nutrition and dairy research program staffs at Holetta Agricultural Research Center
should be acknowledged for their overall support during the entire course of the research work.
References
Abd El-Galil, Etab, R. and Ebtehag, I. M.,Abou-Elenin. 2011. Role of Bacterial Treatments for
Upgrading NutritiveValue of Bean Straw and Native Goats Performance. Journal of
American Science 7(5): 1-9.
Abd-Allah, S.A.S. 2007.Biological treatments of some by-products in ruminants‟
feeding.MScThesis, Animal Production Department, Faculty of Agriculture, Al-Azhar
University.
Akinfemi, A. 2010. Bioconversion of peanut husk with white rot fungi: Pleurotusostreatusand
Pleurotuspulmonarius. LivestockResearch for RuralDevelopment 22(3).
Akinfemi, A., Ogunwole, O.A. 2012. Chemical Composition and in vitro digestibility of rice
straw treated with Pleurotusostreatus, PleurotusPulmonariusandPleurotus tuber-regium.
Slovak Journal of Animal Science 45:14-20.
AOAC (Association of Analytical Chemists). 1980. Official methods of Analysis.AOAC,
Washington D.C.
AOAC (Association of Official Analytical Chemists). 1990.Methods of analysis, 15th ed.;
AOAC.INC., Arlington, Virgina, USA.
ARC (Agricultural Research Council). 1990. The nutrient requirement of ruminant
livestock.Common Wealth Agricultural Bureaux.Slough, England, UK.
CSA (Central Statistical Agency). 2014.Livestock and Livestock Characteristics, Agricultural
Sample Survey.Volume II, Statistical Bulletin, 570 pp.
El-Ashry, M.A., Kholif, A., Fadel, M., El-Alamy, H.A., El-Sayed, H.M. and Kholif, S.M.
2003.Effect of biological treatments on chemical composition, in-vitro and in-vivo nutrients
digestibility of poor quality roughages.Egyptian Journal of Nutrition and Feeds 6(2): 113-
126.
El-Banna, H. M., Shalaby, A. S., Abdul-Aziz, G.M., Fadel, M., Ghoneem, W. A. 2010a. Effect
of diets containing some biologically treated crop residues on performance of growing
sheep. Egyptian Journal of Nutrition and Feeds13: 21-26.
El-Banna, H. M., El-Manylawi, M. A., Zaza, G. H., Salama, W. A., 2010b. Performance of New
Zealand rabbits fed on biologically treated potato vines. Egyptian Journal of Rabbits
Science20(3): 15-30.
32

Getu Kitaw et al, /Eth. J. Anim. Prod. 16(1)-2016:17-35
El-Marakby, K.M.A. 2003.Biological treatments of poor quality roughage and its effect on
productive performance of ruminants.MSc.Thesis. Animal Production Department, Faculty
of Agriculture, Zagazig University, Egypt.
El-Tahan, A. A. 2003.Utilization of mushroom by-products for feeding ruminants.1- Effect of
feeding rations containing different level of mushroom by-products on performance of
lactating buffaloes.Egyptian Journal of Nutrition and Feeds6: 867-877.
EMROSA (Effective Microorganisms Research Organization of South Africa). 2004.
Usersmanual. Emrosa, inc. South Africa.
Fayed Afaf, M.,El-Ashry, M.A. & Aziz Hend, A.2009.Effect of feeding olive tree pruning by-
products on sheep performance in Sinai.World Journal of Agricultural Science 5 (4): 436-
445.
Guim, A., Andrade de, P. and Malheiros, E.B. 2000.Effect of EM on the consumption, nutritive
value and digestibility of corn silage by ruminant animals.FCAVJ, UNESP aboticabal SP
Brazil.
Hanekon, D., Prinsloo, J.F. and Schoonbee, H.J. 2001. A comparison of the effect of anolyte and
EM on the fecal bacterial loads in the water and on fish produced in pig cum fish integrated
production units Y.D.A. Senanayake and U.R. Sangakkara (eds). Proceedings of the 6th
International Conference on Kyusei Nature Farming 1999, South Africa.
Higa, T. 1996. Effective Microorganisms: Their role in Kyusei nature Farming and Sustainable
Agriculture. InJ.F. Parr, S.B. Hornick and M.E. Simpson (ed). Proceedings of the 3rd
InternationalConference on Kyusei Nature Farming.US Department of Agriculture,
Washington DC, USA.
Higa, T. and Wididana, G.N. 2007.The Concept and theory of Effective Microorganism.
Khattab, H.M., Gado, H.M., Kholif, A.E., Mansour, A.M., Kholif, A. M. 2011. The potential of
feeding goats sun dried rumen contents with or without bacterial inoculums as replacement
for berseem clover and the effects on milk production and animal health. International
Journal of Dairy Science 6: 267-277.
Khattab, H.M., Gado, H.M., Salem, A.Z.M., Camacho, L.M., El-Sayed, M.M., Kholif, A. M., El-
Shewy, A.A., Kholif, A.E. 2013.Chemical composition and in-vitro digestibility of
Pleurotusostreatusspent rice straw.Animal Nutrition and Feed Technology 13: 173-182.
Kholif, A. E., Khattab, H. M., El-Shewy, A. A., Salem, A. Z. M., Kholif, A. M., El-Sayed, M.
M., Gado, H. M., Mariezcurrena, M. D. 2014. Nutrient digestibility, ruminal fermentation
activities, serum parameters and milk production and composition of lactating goats fed
diets containing rice straw treated with Pleurotusostreatus. Asian Australasian Journal of
Animal Science27(5): 357-364.
Konoplya, E.F. and Higa, T. 2000.EM application in animal husbandry: - Poultry farming and
itsaction mechanisms. Paper presented at the International Conference on EM Technology
and Nature Farming, October 2000, Pyongyang, DPR Korea.
Lactoscope Cn-2.1.Users manual Ver. 1.1., 2000, Mid-infrared milk product analyzer.
33
Getu Kitaw et al, /Eth. J. Anim. Prod. 16(1)-2016:17-35
Ma, Y. S., Zhu, G. S. 1997.Comparison of ammoniation and silage fermentation of corn stovers
and feeding lactating cows.China Dairy Cattle2 (1):26-27.
Maurya, M.S. 1993. Effect of Feeding Live Yeast Culture (Saccharomyces cerevisiae) on rumen
fermentation and nutrient digestibility in goats. PhD Thesis.Indian Veterinary Research
Institute, Deemed University, Izotnager. India.
McDonald, P., Edwards, R.A., Greenhalgh, J.F.D., Morgan, C.A. 2002.Animal Nutrition (6th
edition). Pearson Educational Limited. Edinburgh, Great Britain.
YosefMekasha,AzageTegegn, AlemuYami, Umunna, N.N. 2002. Evaluation of non-
conventional agro-industrial by-products as supplementary feeds for ruminants: In-vitro
and metabolism study with sheep. Small Ruminant Research 44(6): 25–35.
Meng, Q.X., Xiano, X.J., Yu, H., Zhou, W.S. and Qiano, Z.G. 1999. Treatment of wheat straw
with microorganisms and the nutritive value of treated straw as feed for growing beef
cattle. Chinese Journal of Animal Science 35(6): 3-5.
Milenković, I., Adamović, O., Adamović, M. 2004.Pleurotusostreatussubstrata in dairy cows
feeding.Retrieved January 3, 2014, from http://www.scizeri-nm.org/ ZERI/ mushrooms3
.asp.
Moawd, R. I. 2003. Effect of feeding mushroom cultivating by- products on performance of
pregnant and suckling ewes.Journal of Agricultural Science of Mansoura University 28
(3):5985 – 5997.
Nahla, A., Abdel-AzizAbdelfattah, Z. M., Salem Mounir, M., El-Adawy, Luis Miguel Camacho,
Ahmed, E.,Kholif, Mona, M. Y., Elghandour and Borhami, E Borhami,
2014.Biological Treatments and Feeding Sugarcane Bagasse in Agriculture Animals–An
Overview.
Nahla, A. Abdel-Aziz, Abdelfattah, Z. M. Salem, Mounir, M. El-Adawy, Luis, M. Camacho,
Ahmed, E.,Kholif, M., Elghandour, M. Y., Borhami, E. 2015. Biological treatments as a
mean to improve feed utilization in agriculture animals-An overview.Journal of Integrative
Agriculture 14(3): 534–543.
Nsereko, V.L., Morgavi, D.P., Rode, L.M., Beauchemin, K.A. and McAllister, T.A. 2002. Effect
of fungal enzyme preparations on hydrolysis and subsequent degradation of Alfaalfa hay
f iber by mixed rumen microorganism‟sin-vitro.Animal Feed Science and
Technology88(2):153-170.
Owen, E. and Jayasuriya, M. C. N. 1989a.Use of crop residues as animal feeds in Developing
countries.Journal of Research and Development in Agriculture 6(3):129-138.
Pyne, G. T. 1932. The determination of milk protein by formaldehyde titration.Biochemistry
Journal 26(4): 1006-1014.
Richardson, G.H. 1985. Standard Methods for Examination of Dairy Products.AmericanPublic
Health Association , Washington D.C.
Rolz, C., Delno, R. and Arriola, C. 1988.Biological pretreatment of coffee pulp.Journal of
Biological Wastes 26(1): 97-114.
34
Getu Kitaw et al, /Eth. J. Anim. Prod. 16(1)-2016:17-35
Salman, F. M.,Salama, R., Khattab, A. E., Soliman, S. M., El-Nomeary, Y. A. 2011. Chemical,
biological and biochemical treatments to improve the nutritive values of sugarcane bagasse
(SCB): 1- Chemical composition, scanning electron microscopy, in-vitro evaluation,
nutrients digestibility and nitrogen utilization of untreated or treated SCB. Journal of Life
Science8(2): 361-363.
Samsudin, A.A, Masori, M.F. and Ibrahim, A. 2013.The Effects of Effective Microorganisms
(EM) on the Nutritive Values of Fungal Treated Rice Straw.Malaysian Journal of Animal
Science16(1): 97-105.
SAS (Statistical Analysis System). 2002. SAS Institute, Inc, NC, USA.
Sundstøl, F. and Owen, E. (eds). 1984. Straw and other Fibrous By-Products as Feed.Elsevier,
Amsterdam. Pp. 32-75.
Tilley, J. M. A. and Terry, R. A. 1963.A two-stage technique for in-vitro digestion of forage
crops.Journal of the British Grassland Society 18: 104 - 111.
Van Soest, P. J.and Robertson, J. B. 1985.Analysis of forage and fibrous foods.Alaboratory
manual for Animal Science 613, Cornell University, Ithaca, New York, USA.
YonatanKasu. 2014. Chemical Composition and in-vitroDigestibilityof Coffee Pulp and Coffee
Husk Ensiled with Grass (Hyperhenniahirta) Hay and Effective Microorganism. MSc
Thesis,Jima University, Ethiopia.
Zhang, Y. and Meng, D.L. 1995. Use of microbial ensiled wheat straw to feed dairy
cattle.Chinese Journal of Dairy Cattle 6(4): 18-19.
35
Ahmed Hassen et al, /Eth. J. Anim. Prod. 16(1)-2016:36-58
Interconnection Between Feed Resources Availability, Livestock Production
and Soil Carbon Dynamics Under Smallholder System in Eastern Ethiopia
Ahmed Hassena,b*
,Tessema Zewdub and Adugna Tolera
c
a School of Animal and Range Sciences, Haramaya University, PO Box 138, Dire Dawa, Ethiopia b Department of Animal Science, Debre Berhan University, PO Box 445, Debre Berhan, Ethiopia
c School of Animal and Range Sciences, Hawassa University, PO Box 222, Hawassa, Ethiopia
*Corresponding author: [email protected]
Abstract
Availability of feed resources, herd size and soil fertility status of grazing lands limit livestock
production under smallholder condition in Ethiopia. Therefore, we studied the relationship
between feed resources availability, livestock production and soil carbon (SC) balance under
smallholder conditions in Mieso district of eastern Ethiopia. The JAVA model procedure was
used to calculate the maximum number of animals in tropical livestock units (TLU) that can be
maintained per unit area. The available feed resources were ranked based on their
metabolizable energy contents. Feed balance was calculated based on DM availability and
nutrient requirement of livestock in the study area. The SC balance was determined based on
carbon inputs from manure, grazing and/or harvesting losses, residues of crop and roots, and
soil organic matter decomposition. The JAVA model calculated the optimum level of feed use,
livestock performances and soil carbon balance (dynamics), Moreover, monetary values of live
weight gain (LWG) and/or loss, manure and draught power were calculated. The analysis of the
JAVA model revealed that mean daily LWG and milk production (MP) per TLU increased
linearly with decreasing herd size (HS), whereas, annual total LWG and total MP increased with
increasing HS at 40% level of best use of feed use and HS of 722 TLU during the study.
However, the SC balance at 40% of feed use was negative and decreased with increasing feed
use. Moreover, the model estimated that maximum monetary value of LWG, manure and draught
power were achieved at 60% feed use. Our study suggested that meat and/or milk production
and SC balance could be increased by selective utilization of best feeds available at farmer level
under the changing climate and global warming in the study area.
Keywords: Body weight gain; Feed quality; Herd size, Java model; Milk and meat yield; Soil
carbon balance
Introduction
In Ethiopia, the livestock sector provides 12 - 16% of the total gross domestic product (GDP)
and 47% of the agricultural GDP (IGAD, 2010). The sector also supports about 60 - 70% of the
36
Ahmed Hassen et al, /Eth. J. Anim. Prod. 16(1)-2016:36-58
livelihoods of the population in the country (Gebremariam et al., 2010). In addition, livestock
makes an immense contribution in the smallholder economy as a source of food, cash income,
draft power for cultivation of arable lands, and source of manure for soil fertility and fuel.
Moreover, they are used as living assets, and social and cultural values and year round
employment. Livestock as well confer a certain degree of security in times of crop failure, as
they are a near cash capital stock (Negassa et al., 2011). Despite all these functions, the sector
remained under-developed and difficult to perform the above functions satisfactorily (Negassa et
al., 2015; Shapiro et al., 2015). Feed problems in both quality and quantity are one of the major
factors that hinder the development and expansion of livestock production. To sustain livestock
production as a major livelihood to livestock herders, adequate supply of quality feed is a basic
requirement; as low quality roughage diets alone do not satisfy both the maintenance and
production requirement of farm animals (Murthy et al., 2011; Shenkute et al., 2012).
Natural pasture and crop residues are the main feed resources for livestock under
smallholder farming systems, which are low in quality for sustainable livestock production
(Murthy et al., 2011; Adugna et al., 2012). Moreover, crop residues alone cannot satisfy the
nutritional requirement of livestock under smallholder condition. However, browse trees are
becoming major feed resources under smallholder conditions for supplying protein and energy to
maintain livestock production (Anele et al., 2009; Shenkute et al., 2012), as browse trees reduce
seasonal limitation of feed resources (Njidda, 2010; Belachew et al., 2013), and they are more
nutritious than natural pasture and crop residues (Gemedo-Dalle, 2004; Yaynishet et al., 2010;
Adugna et al. 2012). In general, availability of feed resources throughout the year is a major
problem for sustainable livestock production under smallholder condition in Ethiopia and this is
influenced by soil nutrient status (Abule et al., 2005; Tessema et al., 2011), grazing pressure and
stage of harvesting (Henkin et al., 2011). According to Tennigkeit et al. (2008), the status of
nutrients in the soils of grazing lands affect the quality and quantity of feed resources, and thus
reduce the livestock performances as low quality feeds result in low body weight gain, low milk
yield, and high mortality of ruminants under smallholder conditions.
The status of soil organic carbon (SOC) is of local importance because it affects on agro-
ecosystem functions through mitigation of greenhouse gases at the atmospheric level since
climate change and global warming lies on the amount of carbon dioxide (CO2) in the
atmosphere (IPCC, 2007). Accordingly, grazing lands remove CO2 from the atmosphere through
the process of photosynthesis, as it makes a large contribution to reduce atmospheric carbon (C)
and increase SOC, which are very important in increasing soil fertility, water holding capacity
(Abera and Wolde-Meskel, 2013), biomass production potential and nutritive value of pastures
(Yihalem et al., 2005; Tessema et al., 2010). On the other hand, human activities such as
rangeland degradation through continuous heavy grazing reduces soil C stocks in grazing lands
(Tessema et al., 2011; Bikila et al., 2016) and greatly increase atmospheric CO2 (IPCC, 2007;
Bikila et al., 2016). Hence, the production and productivity of livestock depends on the quality of
feed resources and organic matter content of the soil (Assefa et al., 2007). To achieve optimum
production of livestock with the available feed resources, smallholder farmers should give
37
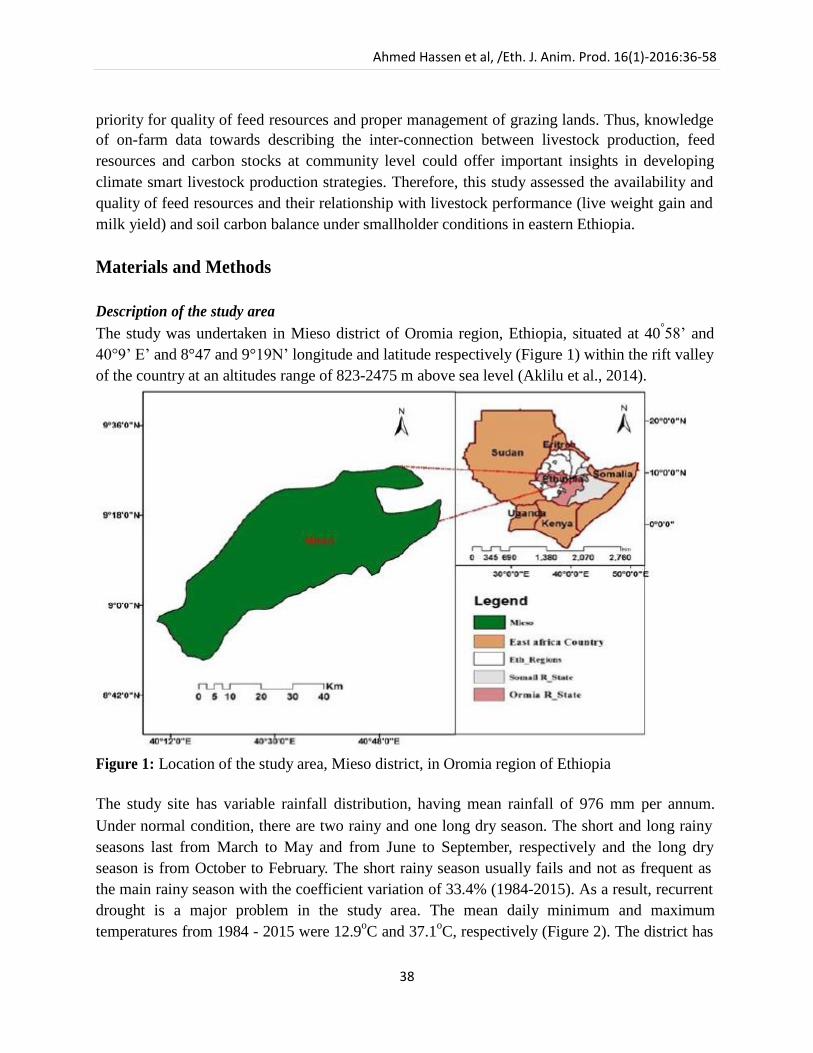
Ahmed Hassen et al, /Eth. J. Anim. Prod. 16(1)-2016:36-58
priority for quality of feed resources and proper management of grazing lands. Thus, knowledge
of on-farm data towards describing the inter-connection between livestock production, feed
resources and carbon stocks at community level could offer important insights in developing
climate smart livestock production strategies. Therefore, this study assessed the availability and
quality of feed resources and their relationship with livestock performance (live weight gain and
milk yield) and soil carbon balance under smallholder conditions in eastern Ethiopia.
Materials and Methods
Description of the study area
The study was undertaken in Mieso district of Oromia region, Ethiopia, situated at 40°58‟ and
40°9‟ E‟ and 8°47 and 9°19N‟ longitude and latitude respectively (Figure 1) within the rift valley
of the country at an altitudes range of 823-2475 m above sea level (Aklilu et al., 2014).
Figure 1: Location of the study area, Mieso district, in Oromia region of Ethiopia
The study site has variable rainfall distribution, having mean rainfall of 976 mm per annum.
Under normal condition, there are two rainy and one long dry season. The short and long rainy
seasons last from March to May and from June to September, respectively and the long dry
season is from October to February. The short rainy season usually fails and not as frequent as
the main rainy season with the coefficient variation of 33.4% (1984-2015). As a result, recurrent
drought is a major problem in the study area. The mean daily minimum and maximum
temperatures from 1984 - 2015 were 12.9oC and 37.1
oC, respectively (Figure 2). The district has
38
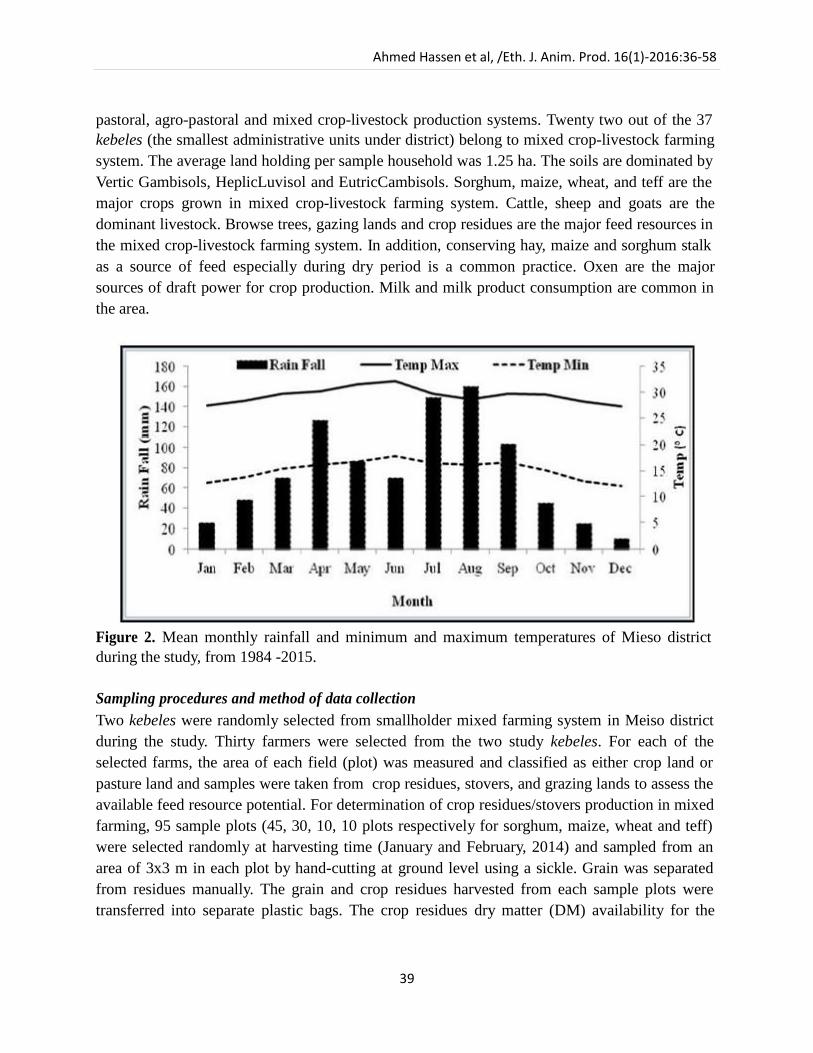
Ahmed Hassen et al, /Eth. J. Anim. Prod. 16(1)-2016:36-58
pastoral, agro-pastoral and mixed crop-livestock production systems. Twenty two out of the 37
kebeles (the smallest administrative units under district) belong to mixed crop-livestock farming
system. The average land holding per sample household was 1.25 ha. The soils are dominated by
Vertic Gambisols, HeplicLuvisol and EutricCambisols. Sorghum, maize, wheat, and teff are the
major crops grown in mixed crop-livestock farming system. Cattle, sheep and goats are the
dominant livestock. Browse trees, gazing lands and crop residues are the major feed resources in
the mixed crop-livestock farming system. In addition, conserving hay, maize and sorghum stalk
as a source of feed especially during dry period is a common practice. Oxen are the major
sources of draft power for crop production. Milk and milk product consumption are common in
the area.
Figure 2. Mean monthly rainfall and minimum and maximum temperatures of Mieso district
during the study, from 1984 -2015.
Sampling procedures and method of data collection
Two kebeles were randomly selected from smallholder mixed farming system in Meiso district
during the study. Thirty farmers were selected from the two study kebeles. For each of the
selected farms, the area of each field (plot) was measured and classified as either crop land or
pasture land and samples were taken from crop residues, stovers, and grazing lands to assess the
available feed resource potential. For determination of crop residues/stovers production in mixed
farming, 95 sample plots (45, 30, 10, 10 plots respectively for sorghum, maize, wheat and teff)
were selected randomly at harvesting time (January and February, 2014) and sampled from an
area of 3x3 m in each plot by hand-cutting at ground level using a sickle. Grain was separated
from residues manually. The grain and crop residues harvested from each sample plots were
transferred into separate plastic bags. The crop residues dry matter (DM) availability for the
39

Ahmed Hassen et al, /Eth. J. Anim. Prod. 16(1)-2016:36-58
village was estimated per crop type and per farm by adding the yields of crop residues from each
plot for a particular crop.
To determine the DM content of grazing lands four pasture sites representative for the two
Kebeles were selected randomly (September, 2014). At each pasture site, three sample sites were
identified randomly. Furthermore, in each sample site, along each transect line; five regularly
spaced quadrates (0.5 x 0.5m) were clipped at ground level using sickle at 50% flowering stage
to determine standing herbage. Sixty samples were collected for DM determination from the two
study kebeles. Pasture availability from grazing lands for the kebeles was estimated by
multiplying the pasture area by the estimated DM yield of the sample plots in late September
when animals were grazing natural pasture. Farmers also harvest part of their grazing lands for
hay making. Farmers also used considerable amount of tree leaves. The biomass of trees/shrubs
was estimated by using regression equations model developed by Brown et al. (1989): Y =
34.4703 – 8.0671 (DBH) + 0.6589 (DBH2), where Y is aboveground biomass, DBH is diameter
at breast height (D≥5cm). Then, the total number of browse trees on-farm was estimated by
multiplying the respective mean values by the number of farmers in the two kebeles. The detail
of browse species collected during the study is found in Ahmed et al. (2017). Finally, after
collecting triplicate samples of browse species, herbaceous species and crop residues, the
samples were weighed immediately and transferred into plastic bags and fastened at the top and
transported to Haramaya University for chemical analyses. Then, the samples were oven dried at
65˚C for 72 hours for DM determination, and ground to pass through 1mm screen of a Wiley
mill for chemical analysis (ILCA, 1990). The total DM of each forage types was estimated by
subtracting 25% as unavoidable grazing from the total yield (ILCA 1990; Zemmelink, 1995).
Chemical analyses of feed resources
The prepared samples were analyzed for DM, ash and Nitrogen (N) using the standard
procedures of AOAC (1990). Neutral detergent fiber (NDF) and acid detergent fiber (ADF) were
determined following the methods of Van Soest and Robertson (1985). Metabolisable energy
(ME) was estimated using the equation for tropical forages: ME (MJ/kg DM) = DOM (g/kg
DM) x 18.5 x 0.81, where digestible organic matter (DOM) was calculated as 0.95IVDMD% - 2
(AAC, 1990).
Animal performance data
To assess the actual live weight gain and milk production of the herds of each kebele using the
available feed resources, 30 farms were randomly selected from the three study kebeles and the
livestock population, age, milk yield (for a lactation length of 6 months) and live weight gain
was measured and monitored based monthly visit for one year during 2013/14 crop season. Live
weight gain was estimated from heart girth circumference measurements. Cattle, sheep, goats,
and camels were included in the study. Moreover, the total live weight gain (TLWG) of animals
of the selected farms was estimated from study herd average LWG per animal multiplied by
observed kebeles herd size (HS). To determine the feed requirement of each herbivore animal,
40
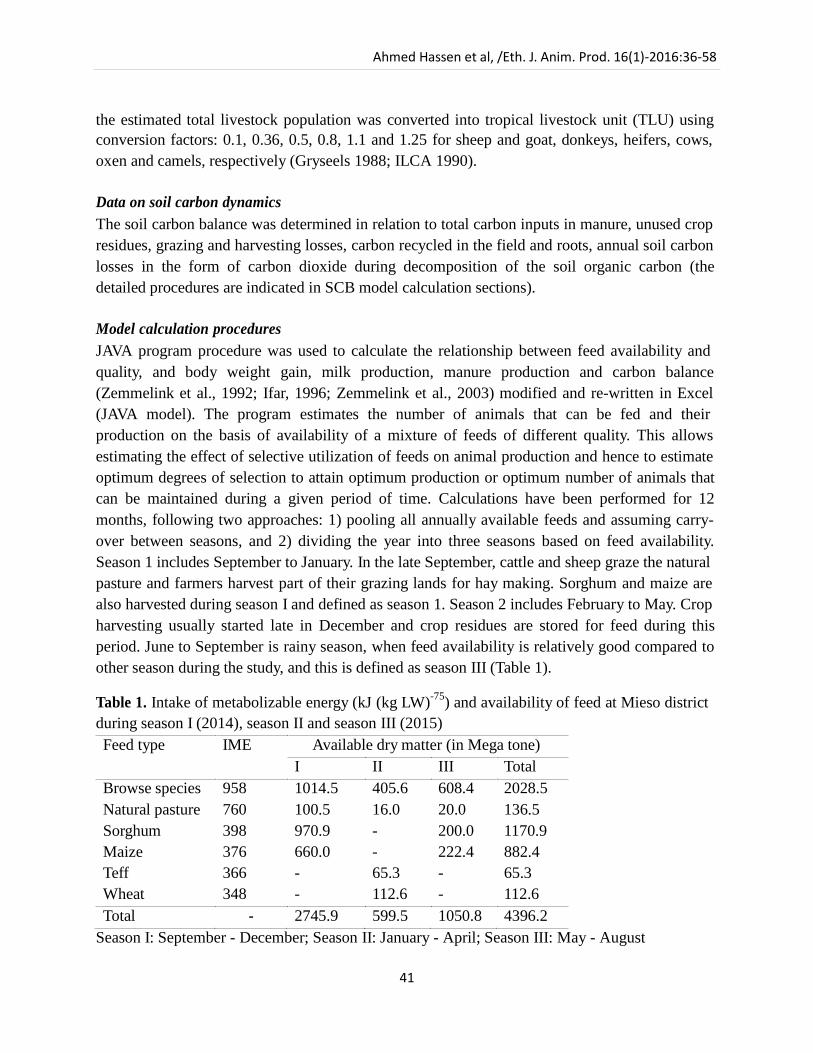
Ahmed Hassen et al, /Eth. J. Anim. Prod. 16(1)-2016:36-58
the estimated total livestock population was converted into tropical livestock unit (TLU) using
conversion factors: 0.1, 0.36, 0.5, 0.8, 1.1 and 1.25 for sheep and goat, donkeys, heifers, cows,
oxen and camels, respectively (Gryseels 1988; ILCA 1990).
Data on soil carbon dynamics
The soil carbon balance was determined in relation to total carbon inputs in manure, unused crop
residues, grazing and harvesting losses, carbon recycled in the field and roots, annual soil carbon
losses in the form of carbon dioxide during decomposition of the soil organic carbon (the
detailed procedures are indicated in SCB model calculation sections).
Model calculation procedures
JAVA program procedure was used to calculate the relationship between feed availability and
quality, and body weight gain, milk production, manure production and carbon balance
(Zemmelink et al., 1992; Ifar, 1996; Zemmelink et al., 2003) modified and re-written in Excel
(JAVA model). The program estimates the number of animals that can be fed and their
production on the basis of availability of a mixture of feeds of different quality. This allows
estimating the effect of selective utilization of feeds on animal production and hence to estimate
optimum degrees of selection to attain optimum production or optimum number of animals that
can be maintained during a given period of time. Calculations have been performed for 12
months, following two approaches: 1) pooling all annually available feeds and assuming carry-
over between seasons, and 2) dividing the year into three seasons based on feed availability.
Season 1 includes September to January. In the late September, cattle and sheep graze the natural
pasture and farmers harvest part of their grazing lands for hay making. Sorghum and maize are
also harvested during season I and defined as season 1. Season 2 includes February to May. Crop
harvesting usually started late in December and crop residues are stored for feed during this
period. June to September is rainy season, when feed availability is relatively good compared to
other season during the study, and this is defined as season III (Table 1).
Table 1. Intake of metabolizable energy (kJ (kg LW)-75
) and availability of feed at Mieso district
during season I (2014), season II and season III (2015)
Feed type IME Available dry matter (in Mega tone)
I II III Total
Browse species 958 1014.5 405.6 608.4 2028.5
Natural pasture 760 100.5 16.0 20.0 136.5
Sorghum 398 970.9 - 200.0 1170.9
Maize 376 660.0 - 222.4 882.4
Teff 366 - 65.3 - 65.3
Wheat 348 - 112.6 - 112.6
Total - 2745.9 599.5 1050.8 4396.2
Season I: September - December; Season II: January - April; Season III: May - August
41

Ahmed Hassen et al, /Eth. J. Anim. Prod. 16(1)-2016:36-58
In the first step of the analysis, the feeds were ranked according to their individual values of
metabolizable energy (ME), since the JAVA model consider feed resources in ME as a default
value. After this ranking, the JAVA program run a stepwise analyses (procedures), as in step 1, a
certain fraction (e.g. 1%) of the total available feed DM was taken, in step 2 the next 1% was
added, and it was continued until all feeds are included.
Model calculations
Intake of organic matter
Total available OM was calculated from total annual DM production per forage type by
multiplication with its OM content. Intake of OM was estimated from OM digestibility (OMD,
g/100 g) and concentration of N in the OM (N, g/100 g OM), using the transfer function
developed for sheep by Ketelaars and Tolkamp (1991) multiplied by 1.33 to account for the
higher metabolizable energy requirements of cattle (ARC, 1980). Intake of OM was multiplied
by OMD to arrive at intake of digestible organic matter (IDOM). Intake of digestible OM was
converted to IME by assuming 1 g IDOM to be equivalent to 15.8 kJ ME (Ifar, 1996; Zemmelink
et al., 2003). Available feeds are assumed to be consumed in order of decreasing IME.
IOM = -42.78 + 2.3039 × OMD - 0.0175 × OMD2 - 1.8872 × N2 + 0.2242×OMD×N … (eq. 1)
Herd size
Optimum herd size (HS) in tropical livestock units (TLU) was computed on the basis of annually
available feed resources as: HS =TOMafu/TIOMHS……………………………………….(eq. 2)
where, TOMafu is total available feed OM at a given proportion of feed use (Mega tone yr−1
) and
TIOM is annual OM intake (Mg TLU−1 yr
−1).
Mean live weight gain (MLWG)
Animal weight gain was estimated from IDOM, as an indicator of IME. Although ME
requirements for weight gain vary with the quality of the ration, under ad libitum feeding, live
weight gain tends to be proportional to IME minus maintenance requirements (Ketelaars and
Tolkamp, 1991; Zemmelink et al., 1992). MLWG is computed as:
MLWG = [(IME – MEm) /MEg] × (LWTLU0.75
) ..…………………………………….. (eq. 3)
where MEm is average maintenance energy requirement (kJ (kg LW) −0.75
d−1
); MEg is ME
needed per unit of live weight gain (kJ g−1
) and LWTLU is live weight of a TLU. MEm was set
512KJ (kg LW-0.75
d-1
) (Ifar, 1996; Zemmelink et al., 2003). MEg was also set to 38.1 MJ g-1
LWG (Ifar, 1996; Zemmelink et al., 2003).
Mean milk production (MMP)
MMP was estimated; a lactation period of 180 days was assumed with a calving interval of 2
years and IME in excess of maintenance being used for milk production:
42
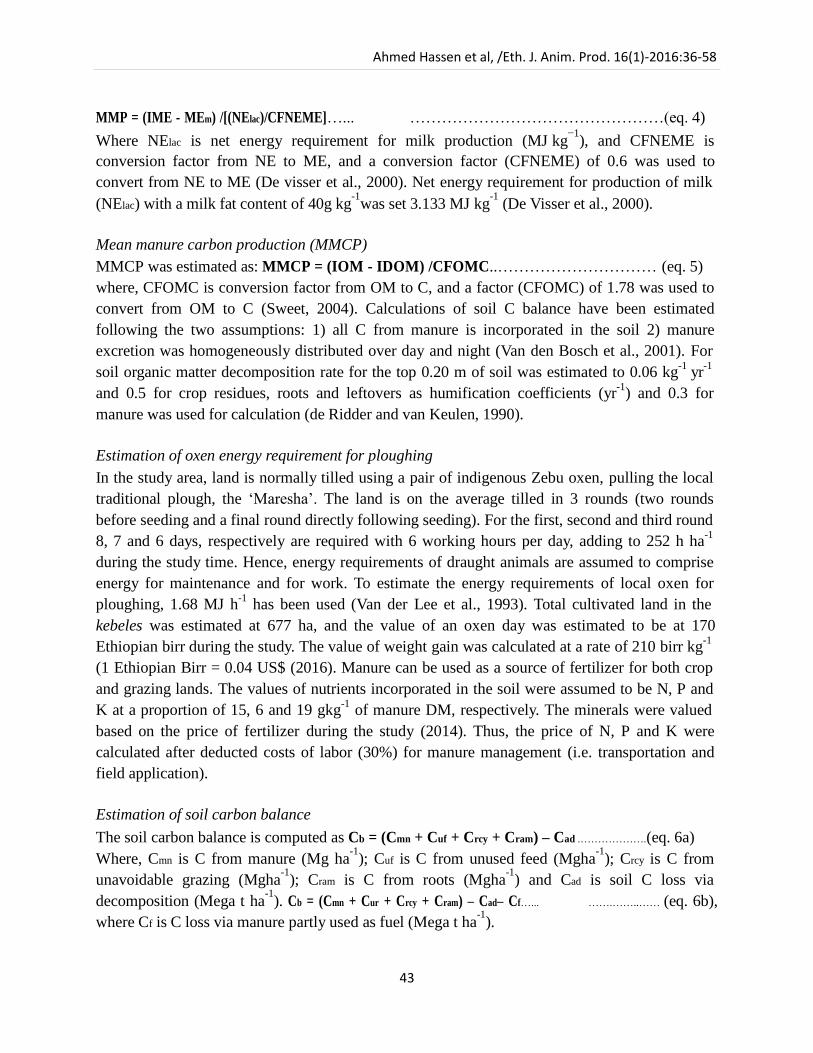
Ahmed Hassen et al, /Eth. J. Anim. Prod. 16(1)-2016:36-58
MMP = (IME - MEm) /[(NElac)/CFNEME]…... …………………………………………(eq. 4)
Where NElac is net energy requirement for milk production (MJ kg−1
), and CFNEME is
conversion factor from NE to ME, and a conversion factor (CFNEME) of 0.6 was used to
convert from NE to ME (De visser et al., 2000). Net energy requirement for production of milk
(NElac) with a milk fat content of 40g kg-1
was set 3.133 MJ kg-1
(De Visser et al., 2000).
Mean manure carbon production (MMCP)
MMCP was estimated as: MMCP = (IOM - IDOM) /CFOMC..………………………… (eq. 5)
where, CFOMC is conversion factor from OM to C, and a factor (CFOMC) of 1.78 was used to
convert from OM to C (Sweet, 2004). Calculations of soil C balance have been estimated
following the two assumptions: 1) all C from manure is incorporated in the soil 2) manure
excretion was homogeneously distributed over day and night (Van den Bosch et al., 2001). For
soil organic matter decomposition rate for the top 0.20 m of soil was estimated to 0.06 kg-1
yr-1
and 0.5 for crop residues, roots and leftovers as humification coefficients (yr-1
) and 0.3 for
manure was used for calculation (de Ridder and van Keulen, 1990).
Estimation of oxen energy requirement for ploughing
In the study area, land is normally tilled using a pair of indigenous Zebu oxen, pulling the local
traditional plough, the „Maresha‟. The land is on the average tilled in 3 rounds (two rounds
before seeding and a final round directly following seeding). For the first, second and third round
8, 7 and 6 days, respectively are required with 6 working hours per day, adding to 252 h ha-1
during the study time. Hence, energy requirements of draught animals are assumed to comprise
energy for maintenance and for work. To estimate the energy requirements of local oxen for
ploughing, 1.68 MJ h-1 has been used (Van der Lee et al., 1993). Total cultivated land in the
kebeles was estimated at 677 ha, and the value of an oxen day was estimated to be at 170
Ethiopian birr during the study. The value of weight gain was calculated at a rate of 210 birr kg-1
(1 Ethiopian Birr = 0.04 US$ (2016). Manure can be used as a source of fertilizer for both crop
and grazing lands. The values of nutrients incorporated in the soil were assumed to be N, P and
K at a proportion of 15, 6 and 19 gkg-1 of manure DM, respectively. The minerals were valued
based on the price of fertilizer during the study (2014). Thus, the price of N, P and K were
calculated after deducted costs of labor (30%) for manure management (i.e. transportation and
field application).
Estimation of soil carbon balance
The soil carbon balance is computed as Cb = (Cmn + Cuf + Crcy + Cram) – Cad .……………….(eq. 6a)
Where, Cmn is C from manure (Mg ha-1
); Cuf is C from unused feed (Mgha-1
); Crcy is C from
unavoidable grazing (Mgha-1
); Cram is C from roots (Mgha-1
) and Cad is soil C loss via
decomposition (Mega t ha-1
). Cb = (Cmn + Cur + Crcy + Cram) – Cad– Cf…... …….……..…… (eq. 6b),
where Cf is C loss via manure partly used as fuel (Mega t ha-1
).
43

Ahmed Hassen et al, /Eth. J. Anim. Prod. 16(1)-2016:36-58
Parameterization of sensitivity of the model
The model estimates the overall mean production of animals and carbon balance. For the model
all animals are converted into tropical Livestock Unit (TLU). Then, the model recognizes that
feeds differ with respect to ME as well as voluntary intake by the animals. Intake of OM was
calculated from OM digestibility and N concentration of the feed (eq. (1) which is a key factor
controlling MLWG eq. (3) and MMP eq. (4). Higher estimate of IME lead to higher estimate of
MLWG and MMP which is partly compensated by associated lower estimates of the number of
HS (Eq.2) and hence, TLWG and TMP of the herd are not affected. For a given IME, calculated
MLWG and MMP are affected by the assumed MEm, because this affects the amount of ME
available for production above maintenance. To convert NE to ME the model used 0.6
(CFNEME) (De Visser et al., 2000) and factor of 1.78 to convert from OM to C (Sweet, 2004).
MEm and MEg were set to 512kJ (kg LW_0.75
d_1
) (Zemmelik et al., 2003) and 38.1 kJ g_1 live
weight gain (Ifar, 1996; Zemmelink et al., 2003) respectively. The NE requirement for
production of milk with butter fat content of 40 g kg-1 was set to 3.133 MJ kg
-1 (De Visser et al.,
2000). Differences in the amount of MEg required per unit of live weight gain and NElac per unit
of milk production affect calculated MLWG and MMP, but not optimum HS and optimum level
of feed utilization. For a given IOM, over estimates of IDOM lead to under-estimates of MMCP
and vice versa, but optimum HS and optimum level of feed utilizations is not affected. The
number of feeds distinguished in the model calculations should be reasonably in relation to
farmers‟ practices (Zemmelink et al., 2003).
Statistical analyses
The JAVA model calculated the optimum level of feed use, livestock performances and soil
carbon balance (dynamics), and SAS soft ware (SAS, 2008) was used to analyze the data of
quality and availability of feed resources, livestock performances (meat and milk yield) and soil
carbon balance during the study after the JAVA model calculations.
Results
Feed availability and chemical composition
In our study areas, the major feed resources for livestock were browse species, grazing lands, hay
harvested from natural pastures, stovers and crop residues (Table 1 and 2). The number of
ruminant livestock in the study areas was 1418 TLU. There was a specific time in some areas to
utilize some enclosed grazing lands in the study area according to their traditional management,
which is from late August to November whereas the access to sorghum and maize stovers occurs
from October to December. Farmers in the study area store straws and hay for supplementary
feeding for lean season. Crop residues feeding mostly begin soon after threshing (December) and
extend up to February to supplement the limited supplies from grazing lands. Though hay
making is not a common practice, few farmers keep parts of their grazing lands aside during the
rainy season to harvest and temporarily store it as hay. The total feed availability during season I
44
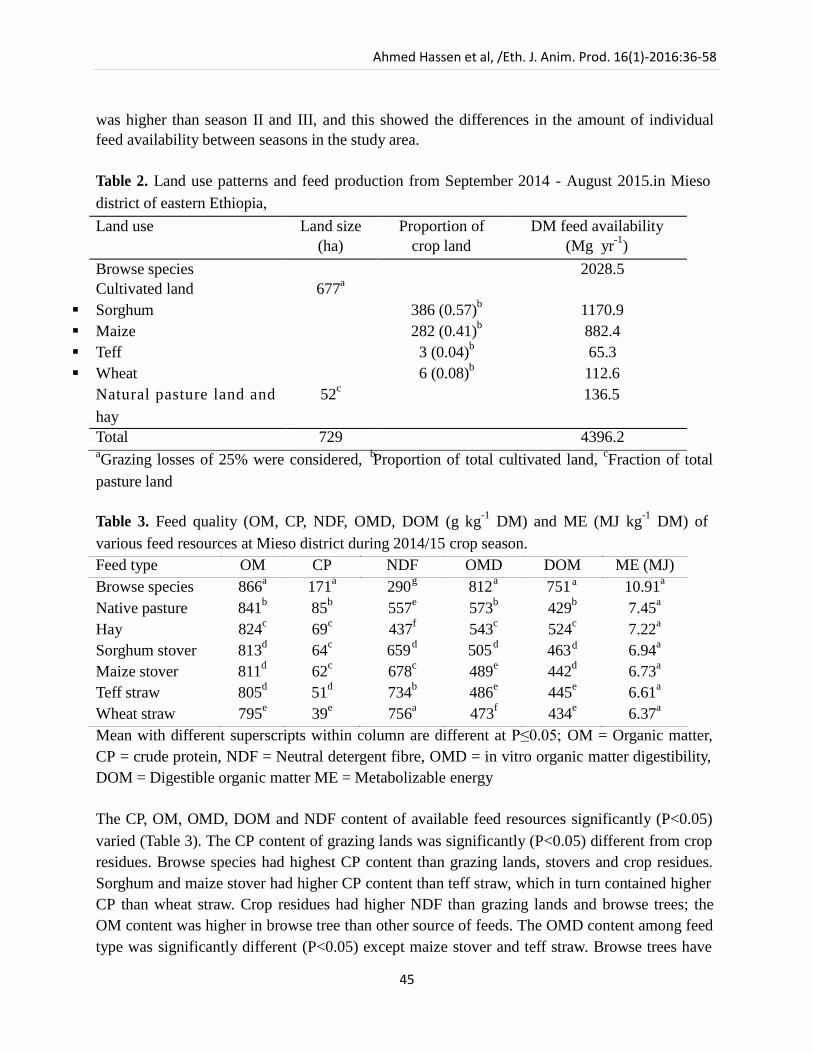
Grazing losses of 25% were considered, Proportion of total cultivated land, cFraction of total
Ahmed Hassen et al, /Eth. J. Anim. Prod. 16(1)-2016:36-58
was higher than season II and III, and this showed the differences in the amount of individual
feed availability between seasons in the study area.
Table 2. Land use patterns and feed production from September 2014 - August 2015.in Mieso
district of eastern Ethiopia, Land use Land size
(ha)
Proportion of
crop land
DM feed availability
(Mg yr-1
)
Browse species 2028.5
Cultivated land 677a
Sorghum 386 (0.57)b 1170.9
Maize 282 (0.41)b 882.4
Teff 3 (0.04)b 65.3
Wheat 6 (0.08)b 112.6
Natural pasture land and 52c 136.5
hay
Total 729 4396.2 a b
pasture land
Table 3. Feed quality (OM, CP, NDF, OMD, DOM (g kg-1 DM) and ME (MJ kg
-1 DM) of
various feed resources at Mieso district during 2014/15 crop season.
Feed type OM CP NDF OMD DOM ME (MJ)
Browse species 866a 171
a 290 g 812
a 751 a 10.91a
Native pasture 841b 85
b 557
e 573
b 429
b 7.45
a
Hay 824c 69
c 437
f 543
c 524
c 7.22
a
Sorghum stover 813d 64
c 659 d 505
d 463 d 6.94a
Maize stover 811d 62
c 678
c 489
e 442
d 6.73
a
Teff straw 805d 51
d 734
b 486
e 445
e 6.61
a
Wheat straw 795e 39
e 756
a 473
f 434
e 6.37
a
Mean with different superscripts within column are different at P≤0.05; OM = Organic matter,
CP = crude protein, NDF = Neutral detergent fibre, OMD = in vitro organic matter digestibility,
DOM = Digestible organic matter ME = Metabolizable energy
The CP, OM, OMD, DOM and NDF content of available feed resources significantly (P<0.05)
varied (Table 3). The CP content of grazing lands was significantly (P<0.05) different from crop
residues. Browse species had highest CP content than grazing lands, stovers and crop residues.
Sorghum and maize stover had higher CP content than teff straw, which in turn contained higher
CP than wheat straw. Crop residues had higher NDF than grazing lands and browse trees; the
OM content was higher in browse tree than other source of feeds. The OMD content among feed
type was significantly different (P<0.05) except maize stover and teff straw. Browse trees have
45
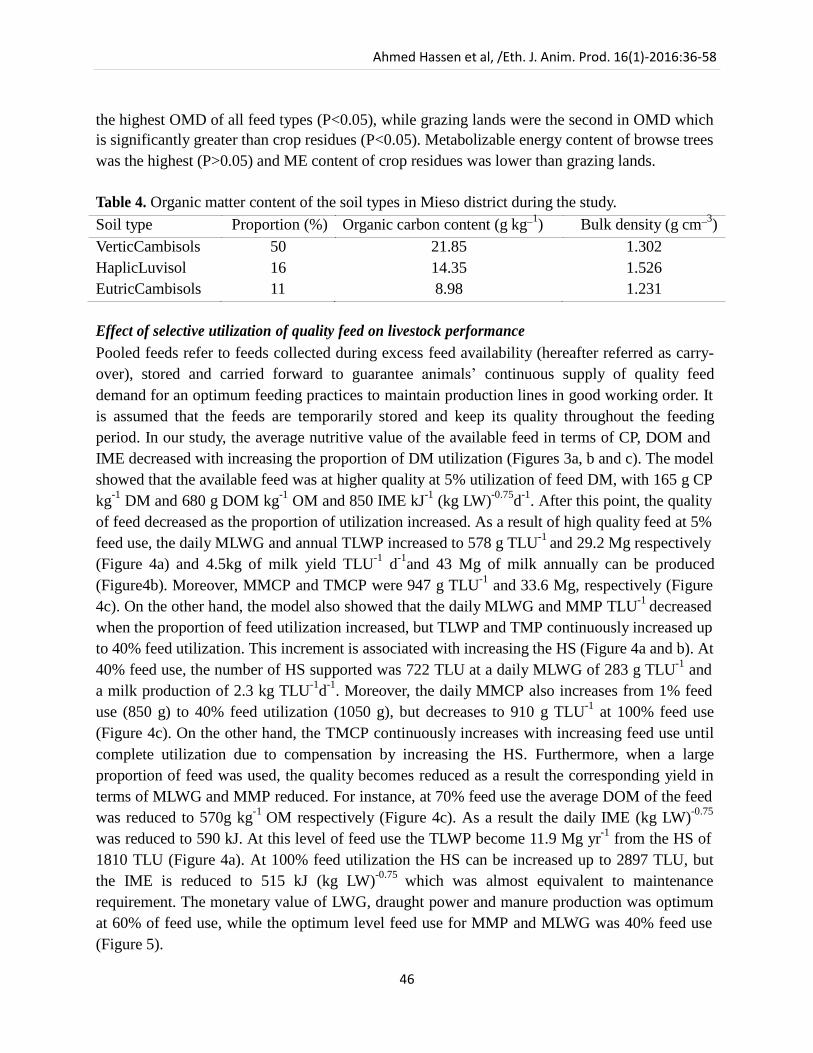
Ahmed Hassen et al, /Eth. J. Anim. Prod. 16(1)-2016:36-58
the highest OMD of all feed types (P<0.05), while grazing lands were the second in OMD which
is significantly greater than crop residues (P<0.05). Metabolizable energy content of browse trees
was the highest (P>0.05) and ME content of crop residues was lower than grazing lands.
Table 4. Organic matter content of the soil types in Mieso district during the study.
Soil type Proportion (%) Organic carbon content (g kg_1
) Bulk density (g cm_3
)
VerticCambisols 50 21.85 1.302
HaplicLuvisol 16 14.35 1.526
EutricCambisols 11 8.98 1.231
Effect of selective utilization of quality feed on livestock performance
Pooled feeds refer to feeds collected during excess feed availability (hereafter referred as carry-
over), stored and carried forward to guarantee animals‟ continuous supply of quality feed
demand for an optimum feeding practices to maintain production lines in good working order. It
is assumed that the feeds are temporarily stored and keep its quality throughout the feeding
period. In our study, the average nutritive value of the available feed in terms of CP, DOM and
IME decreased with increasing the proportion of DM utilization (Figures 3a, b and c). The model
showed that the available feed was at higher quality at 5% utilization of feed DM, with 165 g CP
kg-1 DM and 680 g DOM kg
-1 OM and 850 IME kJ-1 (kg LW)
-0.75d
-1. After this point, the quality
of feed decreased as the proportion of utilization increased. As a result of high quality feed at 5%
feed use, the daily MLWG and annual TLWP increased to 578 g TLU-1 and 29.2 Mg respectively
(Figure 4a) and 4.5kg of milk yield TLU-1 d
-1and 43 Mg of milk annually can be produced
(Figure4b). Moreover, MMCP and TMCP were 947 g TLU-1 and 33.6 Mg, respectively (Figure
4c). On the other hand, the model also showed that the daily MLWG and MMP TLU-1 decreased
when the proportion of feed utilization increased, but TLWP and TMP continuously increased up
to 40% feed utilization. This increment is associated with increasing the HS (Figure 4a and b). At
40% feed use, the number of HS supported was 722 TLU at a daily MLWG of 283 g TLU-1 and
a milk production of 2.3 kg TLU-1
d-1
. Moreover, the daily MMCP also increases from 1% feed
use (850 g) to 40% feed utilization (1050 g), but decreases to 910 g TLU-1 at 100% feed use
(Figure 4c). On the other hand, the TMCP continuously increases with increasing feed use until
complete utilization due to compensation by increasing the HS. Furthermore, when a large
proportion of feed was used, the quality becomes reduced as a result the corresponding yield in
terms of MLWG and MMP reduced. For instance, at 70% feed use the average DOM of the feed
was reduced to 570g kg-1 OM respectively (Figure 4c). As a result the daily IME (kg LW)
-0.75
was reduced to 590 kJ. At this level of feed use the TLWP become 11.9 Mg yr-1 from the HS of
1810 TLU (Figure 4a). At 100% feed utilization the HS can be increased up to 2897 TLU, but
the IME is reduced to 515 kJ (kg LW)-0.75 which was almost equivalent to maintenance
requirement. The monetary value of LWG, draught power and manure production was optimum
at 60% of feed use, while the optimum level feed use for MMP and MLWG was 40% feed use
(Figure 5).
46
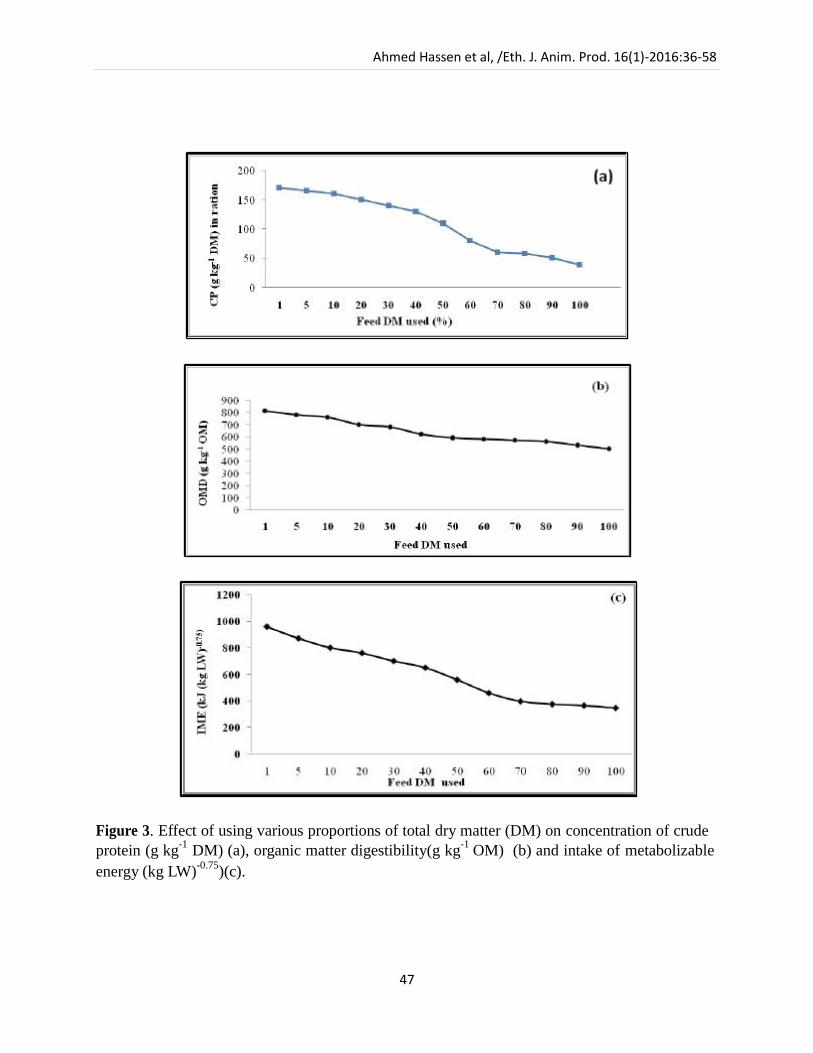
Ahmed Hassen et al, /Eth. J. Anim. Prod. 16(1)-2016:36-58
Figure 3. Effect of using various proportions of total dry matter (DM) on concentration of crude
protein (g kg-1 DM) (a), organic matter digestibility(g kg
-1 OM) (b) and intake of metabolizable
energy (kg LW)-0.75
)(c).
47
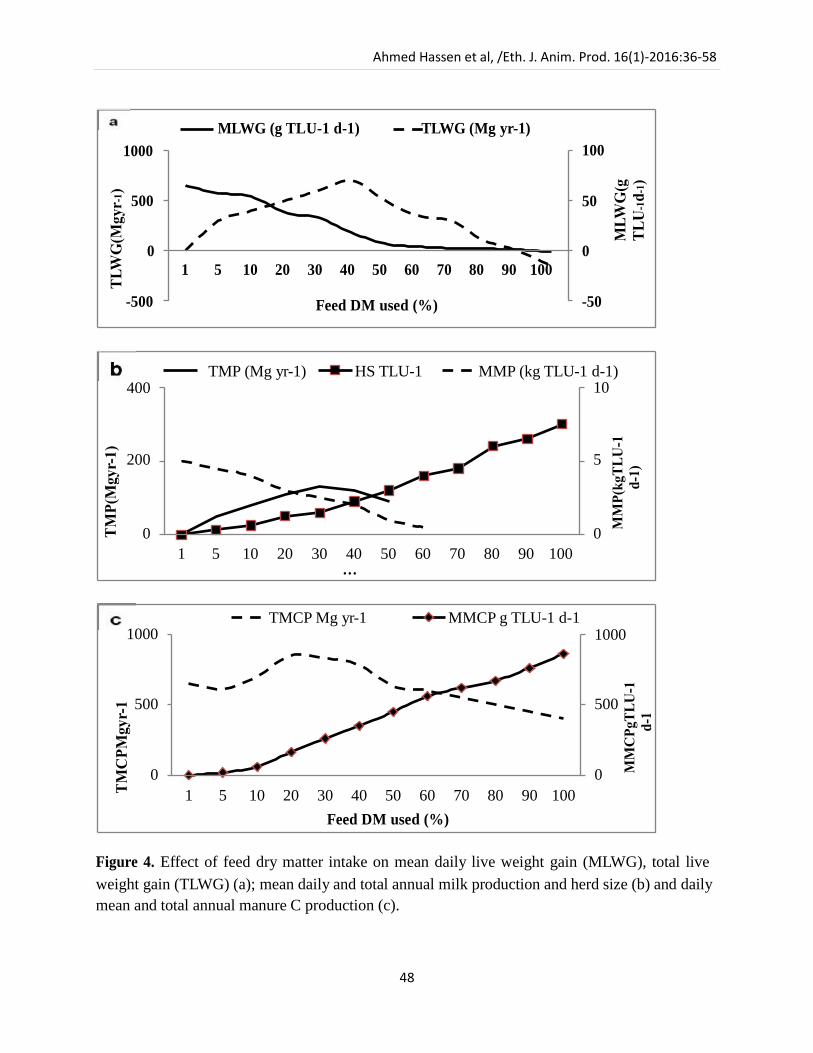
1000
500
0
Ahmed Hassen et al, /Eth. J. Anim. Prod. 16(1)-2016:36-58
MLWG (g TLU-1 d-1) TLWG (Mg yr-1)
100
50
0
1 5 10 20 30 40 50 60 70 80 90 100
-500 Feed DM used (%) -50
400
200
0
1000
500
0
TMP (Mg yr-1) HS TLU-1 MMP (kg TLU-1 d-1) 10
5
0
1 5 10 20 30 40 50 60 70 80 90 100 …
TMCP Mg yr-1 MMCP g TLU-1 d-1 1000
500
0
1 5 10 20 30 40 50 60 70 80 90 100
Feed DM used (%)
Figure 4. Effect of feed dry matter intake on mean daily live weight gain (MLWG), total live
weight gain (TLWG) (a); mean daily and total annual milk production and herd size (b) and daily
mean and total annual manure C production (c).
48
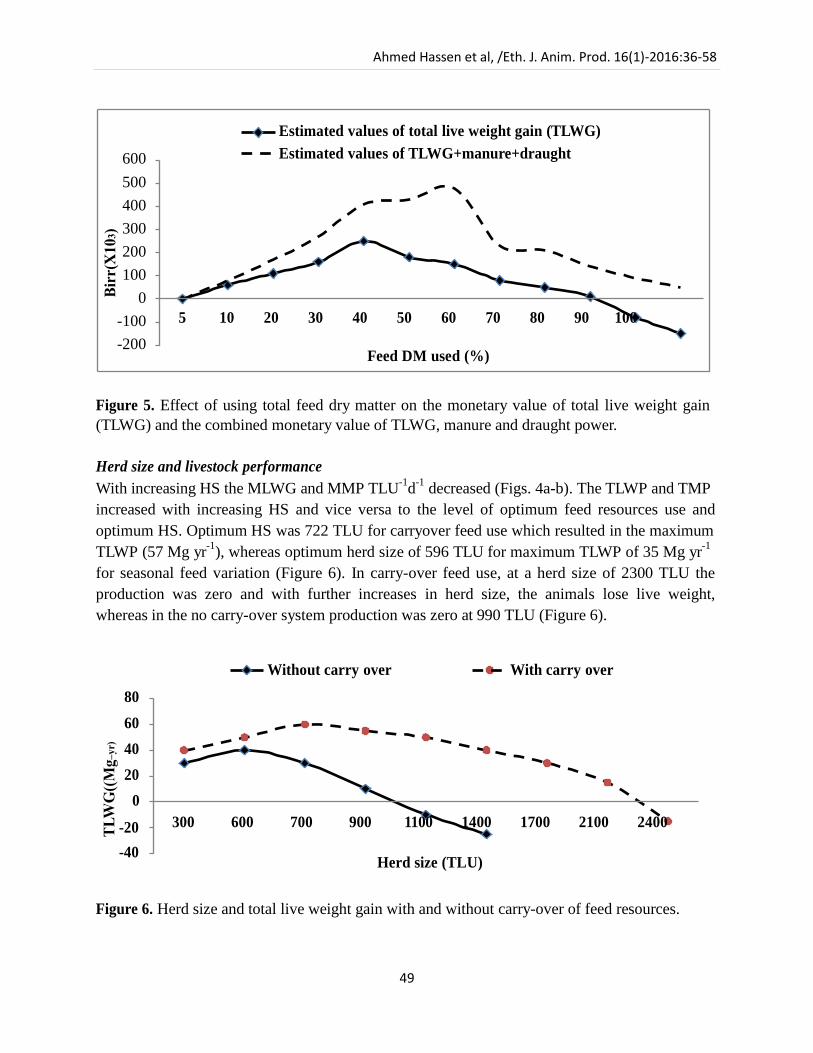
600
500
400
300
200
100
0
-100
-200
Ahmed Hassen et al, /Eth. J. Anim. Prod. 16(1)-2016:36-58
Estimated values of total live weight gain (TLWG)
Estimated values of TLWG+manure+draught
5 10 20 30 40 50 60 70 80 90 100
Feed DM used (%)
Figure 5. Effect of using total feed dry matter on the monetary value of total live weight gain
(TLWG) and the combined monetary value of TLWG, manure and draught power.
Herd size and livestock performance
With increasing HS the MLWG and MMP TLU-1
d-1 decreased (Figs. 4a-b). The TLWP and TMP
increased with increasing HS and vice versa to the level of optimum feed resources use and
optimum HS. Optimum HS was 722 TLU for carryover feed use which resulted in the maximum
TLWP (57 Mg yr-1
), whereas optimum herd size of 596 TLU for maximum TLWP of 35 Mg yr-1
for seasonal feed variation (Figure 6). In carry-over feed use, at a herd size of 2300 TLU the
production was zero and with further increases in herd size, the animals lose live weight,
whereas in the no carry-over system production was zero at 990 TLU (Figure 6).
Without carry over With carry over
80
60
40
20
0
-20
-40
300 600 700 900 1100 1400 1700 2100 2400
Herd size (TLU)
Figure 6. Herd size and total live weight gain with and without carry-over of feed resources.
49
Ahmed Hassen et al, /Eth. J. Anim. Prod. 16(1)-2016:36-58
The feed quality and availability varied from season to season. For instance, during season I
(September – December) feed quality was better than season II (January – April). As a result in
season II MLW losses of 164 g TLU-1
d-1 and TLW loss of 142.1 Mg was observed. Similarly, in
season III, 75g TLU-1
d-1 and 6.3 TLW losses were also reported. Moreover, IME varied between
792 in season I and 441kJ (kg LW)-0.75
d-1 in season II (Table 5). The availability of feed and the
number of animals supported per season also varied from season to season. Herd size varied
between 1312 in season I and 631 in season III. When feed availability, selection and maximum
LWP per season were aimed, optimum HS varied between1312 TLU and 277 in seasons I and III
respectively. When the HS increased, the productivity of animals decreased. In season II and III,
productivity decreased with increasing HS, beyond 451 and 277 TLU respectively. In this
situation the MMCP is 0.95, 0.76 and 0.80 kg TLU-1
d-1
in season I, II and III respectively. The
TMCP was the highest in season I as the contribution of season I in terms of availability and
quality is higher than season II and season III. Use of 100% of the pooled feeds resulted in less
loss of total annual live weight than adjusting herd size each season to complete use of
seasonally available feed as there is relatively continuous supply of feed throughout the feeding
period. At 40% feed use, maximum total milk production was 120.5 Mg when all feed are
pooled. On the other hand, when HS was adjusted seasonally to realize optimum feed utilization
(no carry over situation) the maximum total milk was 112.1 Mg yr-1. The MMP was 2.5, 0.5 and
0.65 in season I, II and III respectively in pooled feed situation. In the seasonal feed situation, it
was 2.0, 0.25 and 0.35 in season I, II and III respectively.
Soil carbon balance (dynamics)
Figure 7 showed selective feed utilization practices on the soil carbon balance through carbon
inputs in manure, unused crop residues, 25% grazing and harvesting losses, recycled in the field
and roots and annual soil carbon losses in the form of CO2 during decomposition of soil organic
matter during our study. Accordingly, the model showed that the annual carbon loss via
decomposition at depth of 0.20 m soil was estimated at 2.76 Mg ha-1
, whereas total carbon input
was 0.97 Mg at 100% feed utilization, which resulted in the reduction of soil carbon balance
(1.79 Mg C ha-1 yr
-1).Total carbon input at 40% feed utilization (optimum LWP and MMP) was
higher than at 100% feed use. To maintain the current soil carbon balance, application of 18 Mg
of manure OM yr-1 is required, however, the total soil carbon balance was negative at all levels
of feed use in the present study (Figure 7).
50

Ahmed Hassen et al, /Eth. J. Anim. Prod. 16(1)-2016:36-58
Table 5. Feed use and some production parameters if all available feeds in each season are used and if the use of available feed is optimized. Feed use Season Production parameters
IME (kJ (kg LW)
-0.75 d
-1)
HS (TLU)
MLWG (gTLU
-1d
-1)
TLWG (Mg season
-1)
MMP (kg TLU
-1d
-1)
TMP (Mg season
-1)
MMCP (kg TLU
-1d
-1)
TMCP (Mg season
-
All feeds
used
Optimum
feed use
1)
Season I 792 1312 378 55.5 2.00 101.2 0.90 160.9
Season II 441 568 -164 -142.1 0.25 16.5 0.65 40.2
Season III 507 631 -75 -6.3 0.35 14.2 0.70 64.2
%DM used
Season I (100) 792 1312 378 55.5 2.50 101.2 0.95 160.9
Season II (12.4) 638 451 95 6.0 0.50 6.8 0.76 30.4 Season III (25.1) 661 277 16 3.0 0.65 11.2 0.80 18.4
Season I: September to December (2013); Season II: January to April (2014); Season III: May to August (2014); IME= intake of
metabolizable energy; HS =herd size; MLWG= mean live weight gain; TLWG= total live weight gain; MMP= mean milk production;
TMP= total milk production; MMCP= mean manure carbon production; TMCP = total manure carbon production.
Total C input (Mg ha -1)
2
1
0
C balance (total C-soil C loss via decomposition) 0 -0.5 -1 -1.5
0 1 5 10 20 30 40 50 60 70 80 90 100
Feed DM used (%)
Figure 7. Effect of using proportion of total feed dry matter on soil C balance.
51
Ahmed Hassen et al, /Eth. J. Anim. Prod. 16(1)-2016:36-58
Discussion
Feed resources availability and quality
Our study indicated that animal production in the form of milk and meat would be increased by
reducing the HS at the level of optimum feed use in addition to increasing production of quality
feed. According to Assefa et al. (2007) and Basha et al. (2015) livestock performance indicators
such as LWG and milk production are a function of feed availability and nutrient concentration.
In this study, the CP, DOM and ME values of browse trees were significantly higher than other
feed resources, indicating that browse species are the outstanding feeds which could provide high
CP and energy above maintenance. Similarly, Abebe et al. (2012) reported that .browse species
are one of the major feed resources, which are characterized by higher nutrient content than
grazing lands and crop residues. However, crop residues had a lower CP (nearly ≤7%) that could
limit intake and microbial function in the rumen (Van Soest 1994)). The results of this study
revealed that cereal straws have low CP content and are composed of more insoluble components
than browse trees. The decrease in CP, DOM and ME and an increase in NDF contents in crop
residues could be due to their increased lignifications as a result of differences in stage of
maturity at harvest as well as differences in soil fertility of the farm (Yayneshet et al., 2009;
Belachew et al., 2013). Wheat and teff straws are low in quality, with 39 and 51 g CP kg-1 DM
respectively and high NDF contents that is only less digestible. This is associated with the
availability of less nitrogen, and higher proportion of fibre fraction (Belachew et al., 2013).
Seasonal (pooled/carry-over) feed availability on livestock performance
Seasonal variation in the availability and quality of feed is a serious constraint in our study area.
Thus, during September to December (season I) livestock use browse species, stovers, natural
pastures and hay as a source of feed. These feeds have high CP contents and relatively low
content of NDF than teff and wheat residues. In addition, the amount of feed availability was
higher than other seasons, which might be due to the time of harvesting for stovers, and hay from
natural grazing lands. In season II, crop residues and browse species were the dominant available
feed resources. Cereal straws provide CP and energy below maintenance requirements, whereas
browse species result in above-maintenance energy levels. Based on our chemical composition
result, wheat straw was the lowest quality feed that provides below the maintenance
requirements of animals. The reduced quality of feed in terms of CP during the dry season is
associated with moisture stress, advanced age and slow rate of photosynthesis. The findings
conform to the reports of previous studies (Hassen et al., 2007; Yayneshet et al., 2009; Abebe et
al., 2012). In season III (May to August), less amount of feed resources were available, which
contribute for reduction of meat and milk production. Thus, the inability of farmers to feed
animals uniformly throughout the year remained the main constraint for increasing meat and
milk production. In this study areas, where most feeds are of low quality, maximum LWG and
MMP can be obtained if livestock herders selectively use better feeds and all feeds are pooled
and made available throughout the year. In our study, MMP and MLWG increased up to the
52
Ahmed Hassen et al, /Eth. J. Anim. Prod. 16(1)-2016:36-58
optimum level of feed use (40% of DM), whereas, beyond the optimum feed use, both MMP and
MLWG decreased.
Herd size and livestock performance
The decrease in LWG and MMP with increasing HS could be due to inclusion of low quality
feed that could not satisfy the requirement of animals in the ration. On the contrary, the TLWP
and TMP were small at a smaller HS and increase with increasing HS up to the optimum level of
feed resource use (40% of DM) due to compensation by increasing the HS. Beyond this level,
both individual LWG and TLWP decreased. The result of this model study is in agreement with
the farm scale study on live weight dynamics in the northern highlands of Ethiopia (Assefa et al.,
2007). The Ethiopian livestock master plan projections for the year 2028 show a deficit of 53%
and 24% for meat and cow milk, respectively, due to rapid population growth and rising per
capita income (Shapiro et al., 2015). This could be achieved by adjusting the number of animals
with the available feed resources. Increasing HS beyond the optimum level would also create
overgrazing and leads to reduction of rangeland resources and soil carbon stocks (Tessema et al.,
2011). Moreover, in most cases, increasing HS may be associated with high risks of large losses
of animals, reduction of soil carbon balance and livestock productivity.
In our study, livestock herders in the study area do not want to adjust their herd size based
on feed availability. One of the aims of keeping livestock in the semiarid area is to promote
savings and capital asset. So reducing herd size may conflict with these objectives. However,
optimum feed resource use can be maintained for possible maximum meat and milk production
and reduced land degradation. In this study, livestock herders used to practice seasonal mobility
as an adaptation strategy during shortage of rainfall to reduce the negative effect of feed
shortage, but these days, it was not possible to practice this option due to shortage of pastures
and water resources in most of their neighboring areas. The actual HS in the study area was 1418
TLU, however, the estimated optimum HS for maximum TLWP, TMP and soil carbon inputs
were obtained at optimum feed use suggesting that in areas where most feeds are of low quality,
optimum benefits from livestock can be obtained by selective utilization of quality feeds, through
proper storage and carry-over systems. These results agreed with the findings of Assefa et al.
(2007). Environmentally friendly development of livestock production can be maintained by
increasing production per animal for optimum HS and not through increasing numbers.
Individual animal productivity decreased with increasing HS as low quality feeds were included
in the feed ration. On the contrary, at a smaller HS, TLWG and TMP were lower and increased
with increasing HS up to the optimum level of feed use. Beyond optimum level DM feed use
both individual animal and herd productivity decreased.
Soil carbon balance (dynamics)
In our study, the soil carbon balance was negative at all levels of feed use, as the balance at
optimum feed use for TLWP and TMP is 40% smaller than at 100% feed use. This is due to
inclusion of low quality feed at 100% feed use. Moreover, the lower SOC might be due to lower
53

Ahmed Hassen et al, /Eth. J. Anim. Prod. 16(1)-2016:36-58
rainfall distribution that affects rate of decomposition of litter falls and biomass (Chibsa and
Ta‟a, 2009) as moisture is vital to incorporate residues or litter to soils. In addition, the lower
SOC might be associated with soil disturbance (Abera and Wolde-Meskel, 2013). According to
Bikila et al. (2016), greater soil C stock was exhibited under enclosure pastures than communal
grazing lands, indicating more new microbial biomass formation and low C loss through
respiration than unprotected/degraded soils (Saggar et al., 2004). On the other hand, optimum
feed resource use can maintain the SOC balance and reduce land degradation. Thus,
environmentally harmony production could be attained increasing production per animal at
optimum HS not at increasing number.
Conclusions
Our study revealed that optimum benefit from livestock could be obtained through adjusting the
herd size with increasing the quality of available feed resources vis-à-vis proper storage and
carry-over system. However, intensity of grazing was responsible for reducing the soil carbon
balance but it could be managed by adjusting herd size close to optimum level of feed use, since
at optimum level of feed use (40% DM use), the number of HS supported was 722 TLU at a
daily MLWG of 283 g TLU-1 and a milk production of 2.3 kg TLU
-1 d-1. In our study, browse
species and grazing lands were found as major feed sources as well as carbon sinks. However,
erratic rainfall distribution a result of climate variability reduced the vegetation cover,
herbaceous biomass and crop residues, leading to low carbon stocks in the soils of the study
areas. Hence, proper land management would be important for increasing the performances of
livestock and soil carbon dynamics as well as for better economic gains and ecological stability
of the farming systems. Therefore, capacity building of communities engaged in livestock
production how to properly utilize the available feed resources to satisfy either the maintenance
and/or production requirement of their livestock without affecting the soil carbon stock balance
is crucial to safeguard the livelihoods of livestock dependent people in semi-arid environments
the changing climate and global warming.
Acknowledgements
The authors would like to acknowledge Haramaya University (HU) of Ethiopia Deutsche
Gesellschaft fur Internationale Zusammenarbeit (GIZ) Ethiopia, Pastoral, and Agro-pastoral
Research and Capacity Building Directorate (PARCBD) and Somali Region Pastoral and Agro-
pastoral Research Institute (SORPARI) of Ethiopia or the financial and material support during
the field and laboratory studies. We also acknowledge the Holeta Agricultural Research Center
and HU Animal Nutrition Laboratory for providing the analytical services.
54
Ahmed Hassen et al, /Eth. J. Anim. Prod. 16(1)-2016:36-58
References
AAC. 1990. Feeding standard: Australian Livestock, Ruminants Sub-committee. Australian
Agricultural Council, CSIRO (Australia).
Abera G, and Wolde-Meskel E. 2013. Soil properties and soil organic carbon stocks of tropical
Andosol under different land uses. Journal of Soil Science 3: 153-162.
Adugna Tolera, AlemuYami and Dawit Alemu 2012. Livestock Feed resources in Ethiopia:
Challenges, Opportunities and the Need for Transformation. Ethiopian Animal Feed
Industry Association, Addis Ababa, Ethiopia.
Ahmed Hassen, Tessema Zewdu and Tolera Adugna 2017. Seasonal variations in chemical
composition, in vitro digestibility and ruminal degradation of browse species in the Rift
Valley of Ethiopia. Livestock Research for Rural Development. Volume 29, Article #112.
http://www.lrrd.org/lrrd29/6/tess29112.html
Aklilu Mekasha, Bruno G., Kindie Tesfaye, Lisanework Nigatu, and Alan, D. 2014.
Interconnection between land use/land cover change and herders‟/farmers‟ livestock feed
resources management strategies: a case study from three Ethiopian eco-environments.
Agriculture Ecosystem Environment 188: 150-162.
Anele, U., Arigbedea, O., Südekumb, K., Onic, A., Jolaoshoa, J., Olanitea, A., Adeosuna, P.,
Delea, K., and Ike, K.A. and Akinolad, O.B. 2009. Seasonal chemical composition, in
vitro fermentation and in sacco dry matter degradation of four indigenous multipurpose
tree species in Nigeria. Animal Feed Science Technology 154: 47–57.
AOAC (Association of Official Analytical Chemists).1990. Feeding Standard: Australian
Livestock, Ruminants Subcommittee. CSIRO, Australia.
ARC (Agricultural Research Council). 1980. The nutrient requirement of ruminant Livestock.
Common Wealth Agricultural Bureoux, Slough.
Assefa Abegaz, van Keulen, H.and Oosting, S.J. 2007. Feed resources, livestock production and
soil carbon dynamics in Teghane, Northern Highlands of Ethiopia. Agriculture Systems
94:391- 404.
Aster Abebe,Adugna Tolera, Holand, O., Tormod, Å. and Lars, O.E. 2012. Seasonal variation in
nutritive value of some browse and grass species in Borana rangeland, southern Ethiopia.
Tropicaland Subtropical Agro-ecosystem 15: 261-271.
Basha, N., Scogings, F., Fon, F., Ahmed, M. and Nsahlai, I. 2015. Effect of season and species
on in sacco degradability of forages in the sub-humid subtropical savannah. Africa Journal
of Agricultural Research 10:1312-1319.
Belachew Shenkute, Hassen A, Assafa A, Amen N, and Abule Ebro 2012. Identification and
nutritive value of potential of fodder trees and shrubs in the mid rift valley of Ethiopia.
Journal of Animal and Plant Science 22:1126-1132.
55
Ahmed Hassen et al, /Eth. J. Anim. Prod. 16(1)-2016:36-58
Belachew Z, Yisehak Kechero, Taye T. and Janssens, G. 2013. Chemical composition in- sacco
ruminal degradation of tropical trees rich in condensed tannin. Czech Journal of Animal
Science 58:176-192.
Bikila Negasa, Tessema Zewdu and Abule Ebro. 2016. Carbon sequestration potentials of semi-
arid rangelands under traditional management practices in Borana, Southern Ethiopia.
Agriculture Ecosystem and Environment 223: 108-114.
Brown, S., Gillespie, A.R. and Lugo, A.E. 1989. Biomass estimation Methods for Tropical
Forests with Application to Forest Inventory Data. Forest Science 35: 881-902.
Chibsa, T. and Taa, A. 2009.Assessment of soil organic matter under four land use systems in
the major soils of Bale highlands, Southeast Ethiopia. World Journal of Agricultural
Science 6:1506-1512.
De Ridder, N. and Van Keulen, H. 1990. Some aspects of the role of organic matter in
sustainable intensified arable farming systems in the West-African semi-arid tropics
(SAT). Fertilizer Research 26:299-310.
De Visser, P., Van Ittersum, M., De Ridder, N. and Van Keulen, H. 2000.Plant and Animal
Production Module of Quantitative analysis of Agro-ecosystems. Plant Production
Systems group, Wageningen University, Wageningen.
Gebremariam, S., Amare, S., Baker, D., and Solomon, A. 2010. Diagnostic study of live cattle
and beef production and marketing: Constraints and opportunities for enhancing the
system. Constraint to International Food Policy Research Institute. Addis Ababa, Ethiopia.
Gemedo Dale. 2004. Vegetation Ecology, Rangeland Condition and Forage Resources
Evaluation in the Borana Lowlands, Southern Oromia, Ethiopia. A PhD Thesis Presented
to the University of Gottingen, Germany.
Gryseels, G. 1988. Role of livestock on a mixed smallholder farms in the Woredas near Debre
Birhan. PhD Thesis. Agricultural University, Wageningen, The Netherlands.
Hassen, A., Rethman, N., van Niekerk, W. and Tjelele, T. 2007. Influence of season/year and
species on chemical composition and in vitro digestibility of five Indigofera accessions.
Animal Feed Science Technology 136: 312–322.
Henkin, N., Ungar, L., Dvash, A., Perevolotsky, Y., Yehuda, M., Sternbergs, H., Voet, H. and
Landau, S.Y. 2011. Effects of cattle grazing on herbage quality in a herbaceous
Mediterranean rangeland. Grass and Forage Science 66: 516-525.
Ifar, S. 1996. Relevance of ruminants in Upland Mixed farming systems in East Java, Indonesia.
PhD Thesis,Wagningen Agricultural University, Wageningen, The Netherlands.
IGAD (Intergovernmental Authority on Development).2009. The Contribution of Livestock to
The Ethiopian Economy. IGAD Center for Pastoral Areas & Livestock Development
(ICPALD) Policy brief series. IGAD LPI Working Paper No. 02-10.
IPCC (Intergovernmental Panel on Climate Change).2007. The Physical Science Basis.
Contribution of Working Group I to the Fourth Assessment Report of the
Intergovernmental Panel on Climate Change [Solomon, S., D. Qin, M. Manning, Z.
56
Ahmed Hassen et al, /Eth. J. Anim. Prod. 16(1)-2016:36-58
Chen, M. Marquis, K.B. Averyt, M.Tignor and H.L. Miller. United Kingdom and New
York, NY, USA. Cambridge University Press, Cambridge.
Ketelaars, J. andTolkamp, B.J. 1991. Towards a new Theory of Feed Intake regulation in
Ruminants. PhD. Thesis, Wageningen Agricultural University, Wageningen, The
Netherlands.
Murthy, K.S.R. 2011.Nutritional potential and biochemical compounds in Cajanus albicans
(Wight & Arn) van der maesan for food and agriculture. Journal of Agriculture
Technology 7:161-171.
Negassa, A., Berhanu Gebremedhin, Getachew Gebru, Desta, S., Nigussie, K., Negassa, B.I.,
Dutilly-Diane, C. and Tegegne, A. 2015. Integrated bio-economic simulation model for
traditional cattle production systems in Ethiopia: Ex-ante evaluation of policies and
investments. LIVES Working Paper 6. Nairobi, Kenya: ILRI.
Negassa, A., Rashid, S. and Gebremedhin, B. 2011. Livestock Production and Marketing.
Development Strategy and Governance Division, International Food Policy Research
Institute - Ethiopia Strategy Support Program II, Ethiopia. 40p.
Njidda.2010. Chemical Composition, Fibre Fraction and Anti-Nutritional Substances of Semi-
arid Browse Forages of North-Eastern Nigeria. Journal of Basic Applied Science 18: 181-
188
Saggar, S., Andrew, R.M., Tate, K.R., Hedley, C.B., Rodda, N.J. and Townsend, A. 2004.
Modeling Nitrous Oxide Emission From New Zealand Dairy Grazed Pastures. Nutrient
Cycling in Agro-ecosystem 68: 243-255.
SAS (statistical Analysis System)., 2008. Statistical Alalysis system. Users Guide: statistics
version 9.1, SAS institute INc, Cary, NC, USA.
Seyoum Bedye, Zenash Sileshi, and Dereje F. 2007.Chemical Composition and Nutritive Value
of Ethiopian Feeds.Research Report 73.Ethiopian Institute of Agricultural Research,
Addis Ababa, Ethiopia.
Shapiro, B.I., Getachew Gebru, Solomon Desta, Asfaw Negassa, Kidus Negussie, Gezahegn
Aboset and Henok Mechal. 2015. Ethiopia Livestock Master Plan. ILRI Project Report.
Nairobi, Kenya: International Livestock Research Institute (ILRI). 127p.
Shenkute, B., Hassen, A., Assafa, A., Amen, N.and Ebro, A., 2012. Identification and nutritive
value of potential of fodder trees and shrubs in the mid rift valley of Ethiopia.The J. Anim.
Plant Sci., 22, 1126-1132
Sweet, C. 2004. Soil organic matter. http://www/agric.gov.ab.ca/ department/
Tennigkeit, T. and Wilkes, A. 2008.An Assessment of the Potential for Carbon Finance in
Rangelands. Working Paper no. 68.
Tessema Zewdu, Ashagre Abate and Solomon Mengistu. 2010. Botanical composition, yield and
nutritional quality of grassland in relation to stages of harvesting and fertilizer application
in the highlands of Ethiopia. Africa Journal of Range and Forage Science 27: 117-124.
57
Ahmed Hassen et al, /Eth. J. Anim. Prod. 16(1)-2016:36-58
Tessema Zewdu, de Boer, W.F., Baars, R.M.T. and Prins, H.H.T. 2011.Changes in soil nutrients,
vegetation structure and herbaceous biomass in response to grazing in semiarid savanna in
Ethiopia.Journal Arid Environment 75: 662 - 670.
Van den Bosch, H., Vlaming, J., Van Wijk, M.S., De Jager, A., Bannink, A. and Van Keulen, H.
2001. Manual to the NUTMON methodology.Alterra/LEI, Wageningen University and
Research centre, Wageningen/ The Hague.
Van de Ven,GWJ., De Ridder, N., Van Keulen, H., and Van lttersum, MK.2003. Concepts in
production ecology for analysis and design of animal and plant-animal production
systems. Agricultural Systems 76: 507-525.
Van der Lee, J., UDo, H.M.J. and Oosting, B. 1993. Design and validation of an animal traction
model for a smallholder livestock system simulation model. Agricultural system 43: 199-
227.
Van Soest, P.J. and Robertson, J.B. 1985. Analysis of forage and fibrous foods. A laboratory
manual for Animal Science 613. Cornell University, USA.
Van Soest, P.J. 1994. Nutritional Ecology of the Ruminant, 2nd ed. Comstock Publishing
Associates/Cornell University Press, Ithaca, NY (USA).
Yayneshet Tesfay. 2010. Feed Resources Availability in Tigray Region, North Ethiopia, for
Producing Export Quality Meat and Livestock. Ethiopia Sanitary and Phytosanitary
Standards and Livestock and meat Marketing Program (SPS-LMM). USAID, Ethiopia.
Yayneshet, T., Eik, LO., and Moe, SR.2009. Seasonal variations in the chemical composition
and dry matter degradability of enclosure forages in the semi-arid region of Northern
Ethiopia. Animal Feed Science. Technology 148: 12-33.
Yihalem Denekew, Berhan Tamir and Solomon Mengistu. .2005. Effect of harvesting date on
composition and yield of natural pasture in northwestern Ethiopia. Tropical Science 45:
19–22.
Zemmelink, G. 1995. Allocation and utilization of Resources at the farm level, Symposium‟ A
research Approach to livestock production Systems from a System perspective, a farewell
to professor Dick Zwart‟ Animal Production System Group, Wageningen University and
research centre, Wageningen, The Netherlands.
Zemmelink, G., Brouwer, B.O. and Ifar, S. 1992. Feed utilization and the role of ruminants in
farming system. In: Ibrahim, M.N.M., De Jong, R., Van Bruchem, J., Pumomo, H. (Eds),
Livestock and feed development in the tropics. Proceedings of an international Seminar
held at Brawijava University, Malong, 21-25 October, 1991. Wageningen Agricultural
University, Wageningen, The Netherlands, PP. 444-451.
Zemmelink, G., Ifar, S. and Oosting, S.J. 2003. Optimum utilization of feed resources: model
studies and farmers practices in two villages in East java, Indonesia. Agricultural systems
76: 77-94.
58
Tessema Zewdu et al, /Eth. J. Anim. Prod. 16(1)-2016: 59-76
Effect of Altitudinal Gradient on Herbaceous Species Composition,
Herbaceous Biomass and grassland Condition in North-Eastern Ethiopia
Tessema Zewdua and Aderajew Mola
b
a Rangeland Ecology and Biodiversity Program, School of Animal and Range Sciences,
College of Agriculture and Environmental Science, Haramaya University, P O Box 138,
Dire Dawa, Ethiopia b Bureau of Agriculture and Rural Development Amhara National Regional State, Bahir Dar,
Ethiopia
*Corresponding author: [email protected]
Abstract
Species composition, biomass yield and grassland condition of four grazing land types (both
communally and privately owned grazing areas; riverside grazing sites and grazing
reserves, as bench mark areas) were studied along three altitudinal gradients (highland:
>2600, medium altitude: 2300-2600, and bottomland: 1900-2300 meter above sea level) in
north-eastern highlands of Ethiopia. Grassland condition assessment was based on grass
layer composition, basal and litter covers, number of seedlings, age distribution of grasses
and soil erosion according to previously developed methodologies. A total of 32 species
were identified, of which 18 grasses, 7 legumes and 7 forbs. Benchmarks and private grazing
areas had higher number of desirable grasses but the riverside and communal grazing areas
dominated by undesirable grasses during the study. Similarly, benchmarks and private
grazing areas were found in good and fair grassland condition, respectively, whereas the
riverside and communal grazing areas were found in poor condition. Moreover, benchmark
areas had a higher biomass yield of herbaceous species compared to the heavily grazed
riverside and communal grazing areas. Our results confirmed that species composition,
biomass yield and grassland condition in the benchmark areas were found in good
condition, whereas riverside and communal grazing areas were highly deteriorated in the
Ethiopian highlands, and resulted in severe soil and vegetation degradation. We suggested
appropriate grazing land policy, destocking and pasture improvement technologies to
improve the condition of the grasslands on the heavily grazed riverside and communal
grazing areas in the north-eastern highlands of Ethiopia.
Keywords: Herbaceous species; Dry matter yield; Grass species; Grazing pressure;
Grassland condition class; Soil erosion
Introduction
In Ethiopia, 85% of the population depends on agriculture for their livelihood. Agriculture is
the basis for the entire socio-economic development, provides about 80% of total
59
Tessema Zewdu et al, /Eth. J. Anim. Prod. 16(1)-2016: 59-76
employment, and the source of 85% of earnings from export (EEA 2002). Livestock is an
integral component for most of the agricultural activities in the country. The livestock sector
has a share of 12-16% of the total Gross Domestic Product (GDP), and 30-35% of the
agricultural GDP (Ayele et al. 2002; EEA 2002). In general, livestock contributes 60-70% of
the livelihoods of the Ethiopian population (Abebe 2008). However, the productivity of
livestock subsector is extremely low compared to other African countries due to the shortage
of feed both in quantity and quality through-out the year (Yeshitila et al. 2008a, b).
Natural pasture is the predominant form of ruminant feeding in most parts of the crop-
livestock farming systems in the country (Getachew 2002; Solomon 2004). About 80% of
the livestock feed in the highlands of Ethiopia comes from natural pasture (Yeshitila et al.
2008a, b). Continuous grazing and stall-feeding mixed with crop residues are the common
feeding systems in the highlands. Moreover, some rotational grazing under the control of
herders in privately owned natural pasture land is also practiced in addition to fallow land
and stubble grazing. There are different types of grazing land types in the highlands of
Ethiopia such as privately owned grazing, communal grazing areas, river and roadside
grazing areas, and some permanently protected pasture lands reserved for dry season grazing
(Amsalu and Baars 2002; Tessema 2005). However, the increase in human population and
the decline in the productivity of arable lands forced the conversion of grasslands into crop
production. There is a high competition of land for grazing and crop cultivation in the
highlands of Ethiopia. As a result of this and other factors, the disappearance of palatable
herbaceous species as well as land degradation, as explained by indicators of soil and
vegetation degradation, is the major constraints limiting the productivity of grazing lands in
the highlands of Ethiopia (Tessema et al. 2002; Adane and Birhan 2005).
Increased grazing pressure due to large number of domestic animals may drastically
affect the species composition and biomass production of the natural pasture and this can in
turn change the current conditions of the pasture (Abule et al. 2005; Angassa and Oba 2010;
Hoshino et al. 2009; Tessema et al. 2011). Grassland condition indicates the change in
vegetation composition, productivity and stability of the grazing areas over time, and it is the
most important concept in pasture management (De Leeuw and Tothill 1990; Tainton 1999).
According to Trollope et al. (1990) grassland condition is defined as the state of the health of
pasture in terms of its ecological status, resistance to soil erosion and potential for producing
forage for sustained optimum livestock production. Effective pasture management requires
knowledge and information about the relationships of the current grassland condition with its
long term potential (Friedel 1991; Kuchar 1995). Grassland condition can be assessed in
terms of one or more ecological characteristics of the vegetation in the pasture such as
species composition of the herbaceous layer, basal and litter covers, soil erosion and biomass
yield (Danckwerts 1982; Friedel 1991; Baars et al. 1997; Tainton 1999). The grassland
condition is expressed in grassland condition classes as poor, fair, good, very good and
excellent (Wilson and Tupper 1982; Baars et al. 1997; Tainton 1999).
The majority of grazing areas in the highlands of Ethiopia are severely affected by soil
and vegetation degradation due to both biotic and abiotic factors. Accordingly, the species
composition, herbaceous biomass and grassland condition are affected by factors other than
livestock grazing (Bilotta et al. 2007; Ayana 2016). There might be altitudinal patterns in
60

Tessema Zewdu et al, /Eth. J. Anim. Prod. 16(1)-2016: 59-76
species composition, herbaceous biomass and grassland condition due to differences in
climate and soil factors (Dahlberg 2000; Ayana 2016), as species composition (species
richness) either show a decrease along altitudinal gradients or a humped-back relationship
with peak species richness at intermediate altitudes (Anderson et al. 2010; Speed et al.
2013). Although grazing by livestock is an important form of land use in grasslands, but how
grazing affects the species composition, herbaceous biomass and grassland condition along
altitudinal gradients is not clear. Moreover, the impact of livestock grazing on grasslands
along altitudinal gradients is hard to predict as herbivores are more selective at a range of
spatial scales (Nogues-Bravo 2008; Speed et al. 2013). Hence, information that affect the
species composition, productivity and condition of the major grazing land types, is very
crucial for proper pasture management and development in the highlands of Ethiopia.
Therefore, the objectives of the study were to assess the species composition, herbaceous
biomass and grassland condition of the major grazing land types along three altitudinal
gradients, and to validate the existing grassland condition assessment procedures developed
for dryland areas to local conditions in the north-eastern highlands of Ethiopia.
Materials and Methods
Description of the study area
The study was conducted in Kutaber district in south Wollo administrative zone, located 493
km east of Bahir Dar, the capital of Amhara regional state, and 420 km north east of Addis
Ababa, the capital of Ethiopia (Figure 1). Kutaber is bordered on the south by Dessie Zuria,
on the west by the Adila River which separates it from Tenta, on the north by the Walano
which separates it from Ambasel, and on the east by Tehuledere district. The Kutaber district
covered about 990,286 km2 (BOARD 2005).The climate of the district was characterized by
cold temperature (6-20°C). The rainfall was bimodal in distribution, with short rainy season
(from March-April) and main rainy season (from June-September). The mean annual rainfall
of the district was between 731-1068 mm, and was highly variable. The main rai8y season
accounts 70% of the total rainfall of the district, with the highest rainfall in July and August.
The human and livestock (cattle, small ruminant and equines) population of the district was
24,445 and 229,192, respectively.
Selection of sampling sites
Before the actual field study, reconnaissance survey and visual field observations were made
throughout the study district in order to have a general overview of the nature and
distribution of the major grazing areas. Then the district was stratified into 3 altitudinal
gradients: highland (>2600m), medium altitude (2300-2600m), and bottomland (1900-
2300m) for this study. Within each altitude, the grazing lands were stratified into 4 grazing
areas: privately owned grazing areas (PGAs), communal grazing areas (CGAs), riverside
grazing areas (RGAs), and benchmark (BM) areas. The BM grazing areas were permanently
protected from livestock grazing for several years to conserve pasture for dry seasons either
in the form of hay or standing biomass (standing hay) and it was lightly grazed by livestock,
and used for comparison (as a control) for other grazing land types. The PGAs were owned
61
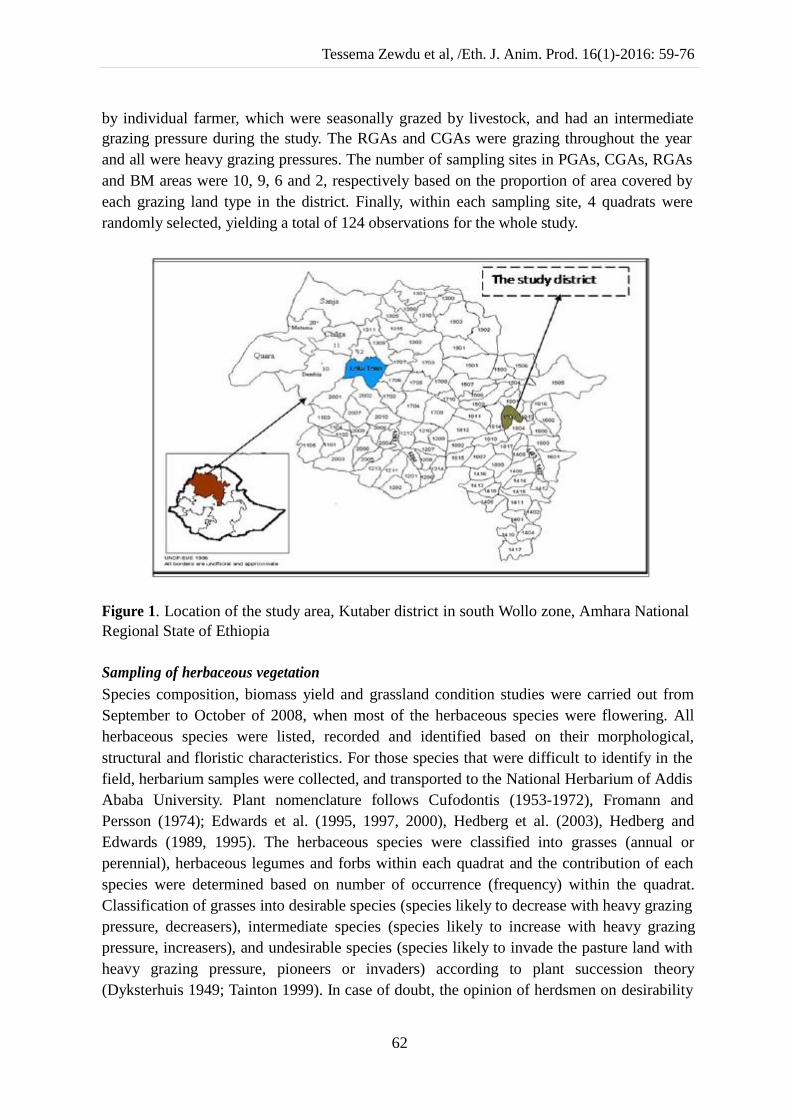
Tessema Zewdu et al, /Eth. J. Anim. Prod. 16(1)-2016: 59-76
by individual farmer, which were seasonally grazed by livestock, and had an intermediate
grazing pressure during the study. The RGAs and CGAs were grazing throughout the year
and all were heavy grazing pressures. The number of sampling sites in PGAs, CGAs, RGAs
and BM areas were 10, 9, 6 and 2, respectively based on the proportion of area covered by
each grazing land type in the district. Finally, within each sampling site, 4 quadrats were
randomly selected, yielding a total of 124 observations for the whole study.
Figure 1. Location of the study area, Kutaber district in south Wollo zone, Amhara National
Regional State of Ethiopia
Sampling of herbaceous vegetation
Species composition, biomass yield and grassland condition studies were carried out from
September to October of 2008, when most of the herbaceous species were flowering. All
herbaceous species were listed, recorded and identified based on their morphological,
structural and floristic characteristics. For those species that were difficult to identify in the
field, herbarium samples were collected, and transported to the National Herbarium of Addis
Ababa University. Plant nomenclature follows Cufodontis (1953-1972), Fromann and
Persson (1974); Edwards et al. (1995, 1997, 2000), Hedberg et al. (2003), Hedberg and
Edwards (1989, 1995). The herbaceous species were classified into grasses (annual or
perennial), herbaceous legumes and forbs within each quadrat and the contribution of each
species were determined based on number of occurrence (frequency) within the quadrat.
Classification of grasses into desirable species (species likely to decrease with heavy grazing
pressure, decreasers), intermediate species (species likely to increase with heavy grazing
pressure, increasers), and undesirable species (species likely to invade the pasture land with
heavy grazing pressure, pioneers or invaders) according to plant succession theory
(Dyksterhuis 1949; Tainton 1999). In case of doubt, the opinion of herdsmen on desirability
62
Tessema Zewdu et al, /Eth. J. Anim. Prod. 16(1)-2016: 59-76
or palatability of a particular species was considered during classification. Woody species
were not included in this study.
Assessment of grassland condition
The factors and criteria considered for grassland condition assessment was based on the
composition of the herbaceous layer, basal cover, litter cover, relative number of seedlings,
age distribution of grasses and soil erosion (Tainton, 1981; Baars et al., 1997). The
maximum possible score was 50 points and the rating was interpreted as excellent (41-50
points), good (31-40), fair (21-30), poor (11-20), and very poor (3-10 points) (Table 1).
Herbaceous species composition, 1 to 10 points were considered based on the
contribution of grasses only. At each sample site, 1 m x 1 m (1-m2) quadrant was cut, and its
fresh and dry weight of each individual species was determined. Three levels of species
occurrence, based on the dry matter weight, were distinguished: (i) present ≤5% of the dry
matter weight of the herbaceous biomass; (ii) common = 5-20%; and (iii) dominant ≥20%.
Basal cover (0-10 points) and litter cover, 0 to 10 points were considered. A representative
sample area of 1-m2 was selected for detailed assessments. The surface of basal cover of
tufted grasses and their distribution was assessed as follows. One square metre was divided
into eight equal parts. All basal covers of plant in the selected 1-m2 were transferred (drawn)
to one of the eighths in order to facilitate visual estimations of only basal covers of living
parts. The rating of basal cover for tufted species was considered excellent (10 points), if the
eighth was completely filled (corresponding to 12.5% basal cover of the original square
metre). Classes of <3%, 3-6%, 6-9%, 9-12% were distinguished. The basal cover was
considered very poor (0, 1 or 2 points) if the basal cover was <3%. The maximum score was
given to creeping grass species because of higher basal cover.
The rating for litter cover within the 1-m2 was considered excellent when it exceeded
40%, moderate from 11-40% and poor at <10% litter cover. Number of seedlings, 0 to 5
points was considered. The number of seedlings was counted using three areas, with a
distance of approximately 10 m between the areas, equal to the size of an A4 sheet of paper
chosen at random. The sheet was dropped from a height of 2 m above the ground. The
category „no seedlings‟ was given 0 points, 1 seedling 1 point etc., and more than 4 seedlings
was given the maximum score of 5 points. Age distribution (1-5 points), when all age
categories, young, medium aged and old plants of the dominant grass species were present,
the maximum score of 5 points was given. Young and medium aged plants were declined as
having approximately 20% and 50%, respectively, of the biomass of old and mature plants of
the dominant species. When there were only old, medium aged or young plants, the scores
were 3, 2 or 1 point, respectively. Soil erosion (0 to 5 points) was based on the amount of
pedestals (higher parts of soils, held together by plant roots, with eroded soil around the
tuft), and in severe cases, the presence of pavements (terraces of flat soil, normally without
basal cover, with a line of tufts between pavements) (5 points = no signs of erosion, 4 =
slightly sand mulch, 3 = weak pedestals, 2 = steep-sided pedestals, 1 = pavements, 0 =
gullies).
63
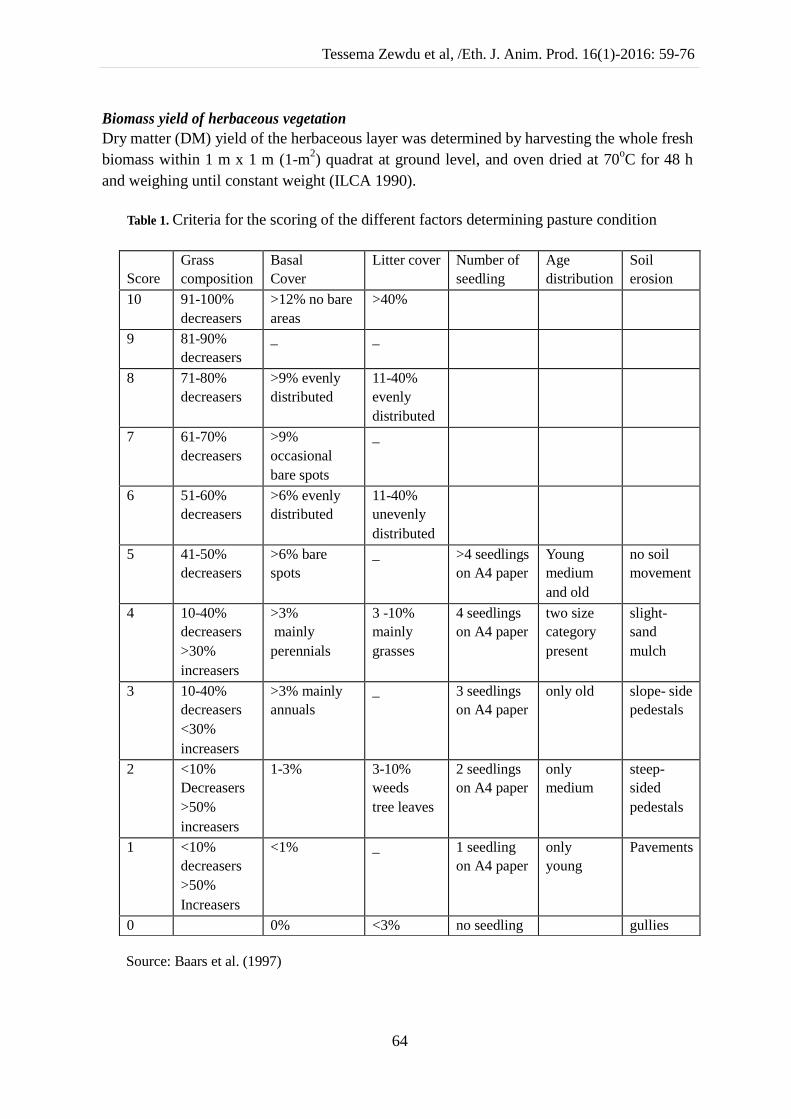
Tessema Zewdu et al, /Eth. J. Anim. Prod. 16(1)-2016: 59-76
Biomass yield of herbaceous vegetation
Dry matter (DM) yield of the herbaceous layer was determined by harvesting the whole fresh
biomass within 1 m x 1 m (1-m2) quadrat at ground level, and oven dried at 70
oC for 48 h
and weighing until constant weight (ILCA 1990).
Table 1. Criteria for the scoring of the different factors determining pasture condition
Source: Baars et al. (1997)
64
Score
Grass
composition
Basal
Cover
Litter cover Number of
seedling
Age
distribution
Soil
erosion
10 91-100%
decreasers
>12% no bare
areas
>40%
9 81-90%
decreasers
_ _
8 71-80%
decreasers
>9% evenly
distributed
11-40%
evenly
distributed
7 61-70%
decreasers
>9%
occasional
bare spots
_
6 51-60%
decreasers
>6% evenly
distributed
11-40%
unevenly
distributed
5 41-50%
decreasers
>6% bare
spots
_ >4 seedlings
on A4 paper
Young
medium
and old
no soil
movement
4 10-40%
decreasers
>30%
increasers
>3%
mainly
perennials
3 -10%
mainly
grasses
4 seedlings
on A4 paper
two size
category
present
slight-
sand
mulch
3 10-40%
decreasers
<30%
increasers
>3% mainly
annuals
_ 3 seedlings
on A4 paper
only old slope- side
pedestals
2 <10%
Decreasers
>50%
increasers
1-3% 3-10%
weeds
tree leaves
2 seedlings
on A4 paper
only
medium
steep-
sided
pedestals
1 <10%
decreasers
>50%
Increasers
<1% _ 1 seedling
on A4 paper
only
young
Pavements
0 0% <3% no seedling gullies
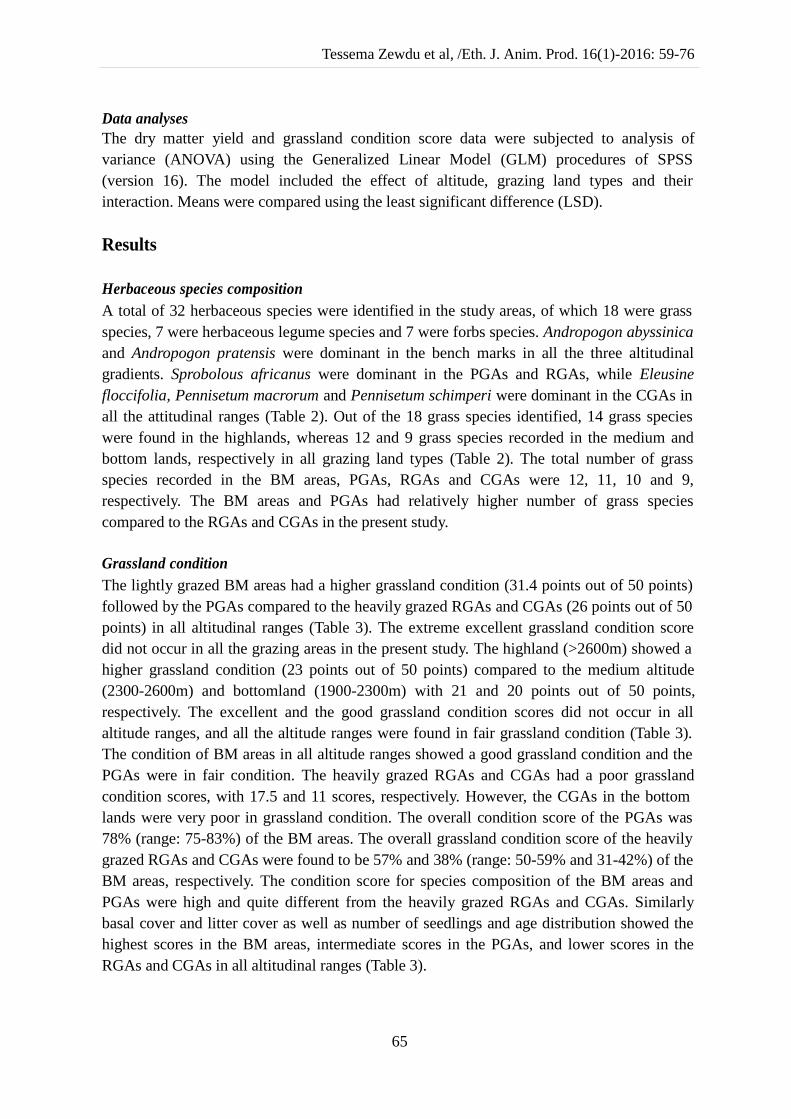
Tessema Zewdu et al, /Eth. J. Anim. Prod. 16(1)-2016: 59-76
Data analyses
The dry matter yield and grassland condition score data were subjected to analysis of
variance (ANOVA) using the Generalized Linear Model (GLM) procedures of SPSS
(version 16). The model included the effect of altitude, grazing land types and their
interaction. Means were compared using the least significant difference (LSD).
Results
Herbaceous species composition
A total of 32 herbaceous species were identified in the study areas, of which 18 were grass
species, 7 were herbaceous legume species and 7 were forbs species. Andropogon abyssinica
and Andropogon pratensis were dominant in the bench marks in all the three altitudinal
gradients. Sprobolous africanus were dominant in the PGAs and RGAs, while Eleusine
floccifolia, Pennisetum macrorum and Pennisetum schimperi were dominant in the CGAs in
all the attitudinal ranges (Table 2). Out of the 18 grass species identified, 14 grass species
were found in the highlands, whereas 12 and 9 grass species recorded in the medium and
bottom lands, respectively in all grazing land types (Table 2). The total number of grass
species recorded in the BM areas, PGAs, RGAs and CGAs were 12, 11, 10 and 9,
respectively. The BM areas and PGAs had relatively higher number of grass species
compared to the RGAs and CGAs in the present study.
Grassland condition
The lightly grazed BM areas had a higher grassland condition (31.4 points out of 50 points)
followed by the PGAs compared to the heavily grazed RGAs and CGAs (26 points out of 50
points) in all altitudinal ranges (Table 3). The extreme excellent grassland condition score
did not occur in all the grazing areas in the present study. The highland (>2600m) showed a
higher grassland condition (23 points out of 50 points) compared to the medium altitude
(2300-2600m) and bottomland (1900-2300m) with 21 and 20 points out of 50 points,
respectively. The excellent and the good grassland condition scores did not occur in all
altitude ranges, and all the altitude ranges were found in fair grassland condition (Table 3).
The condition of BM areas in all altitude ranges showed a good grassland condition and the
PGAs were in fair condition. The heavily grazed RGAs and CGAs had a poor grassland
condition scores, with 17.5 and 11 scores, respectively. However, the CGAs in the bottom
lands were very poor in grassland condition. The overall condition score of the PGAs was
78% (range: 75-83%) of the BM areas. The overall grassland condition score of the heavily
grazed RGAs and CGAs were found to be 57% and 38% (range: 50-59% and 31-42%) of the
BM areas, respectively. The condition score for species composition of the BM areas and
PGAs were high and quite different from the heavily grazed RGAs and CGAs. Similarly
basal cover and litter cover as well as number of seedlings and age distribution showed the
highest scores in the BM areas, intermediate scores in the PGAs, and lower scores in the
RGAs and CGAs in all altitudinal ranges (Table 3).
65
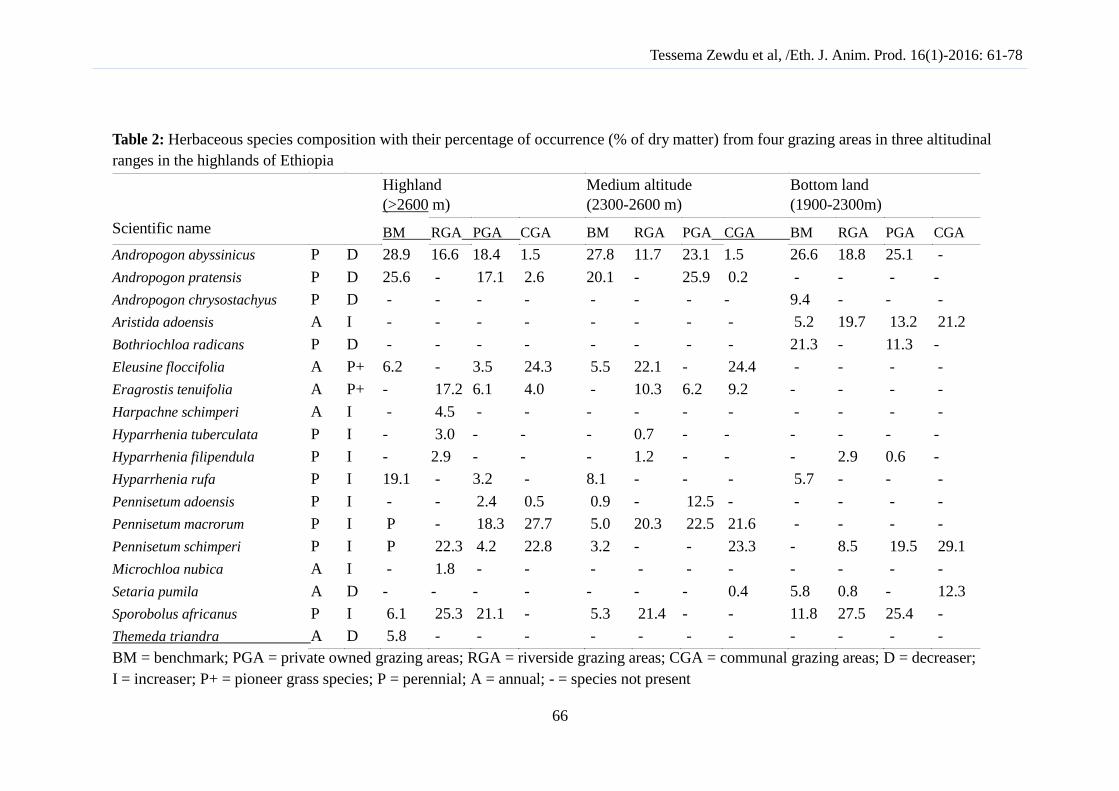
Tessema Zewdu et al, /Eth. J. Anim. Prod. 16(1)-2016: 61-78
Table 2: Herbaceous species composition with their percentage of occurrence (% of dry matter) from four grazing areas in three altitudinal
ranges in the highlands of Ethiopia
Highland
(>2600 m)
Medium altitude
(2300-2600 m)
Bottom land
(1900-2300m)
Scientific name BM RGA PGA CGA BM RGA PGA CGA BM RGA PGA CGA
Andropogon abyssinicus P D 28.9 16.6 18.4 1.5 27.8 11.7 23.1 1.5 26.6 18.8 25.1 -
Andropogon pratensis P D 25.6 - 17.1 2.6 20.1 - 25.9 0.2 - - - -
Andropogon chrysostachyus P D - - - - - - - - 9.4 - - -
Aristida adoensis A I - - - - - - - - 5.2 19.7 13.2 21.2
Bothriochloa radicans P D - - - - - - - - 21.3 - 11.3 -
Eleusine floccifolia A P+ 6.2 - 3.5 24.3 5.5 22.1 - 24.4 - - - -
Eragrostis tenuifolia A P+ - 17.2 6.1 4.0 - 10.3 6.2 9.2 - - - -
Harpachne schimperi A I - 4.5 - - - - - - - - - -
Hyparrhenia tuberculata P I - 3.0 - - - 0.7 - - - - - -
Hyparrhenia filipendula P I - 2.9 - - - 1.2 - - - 2.9 0.6 -
Hyparrhenia rufa P I 19.1 - 3.2 - 8.1 - - - 5.7 - - -
Pennisetum adoensis P I - - 2.4 0.5 0.9 - 12.5 - - - - -
Pennisetum macrorum P I P - 18.3 27.7 5.0 20.3 22.5 21.6 - - - -
Pennisetum schimperi P I P 22.3 4.2 22.8 3.2 - - 23.3 - 8.5 19.5 29.1
Microchloa nubica A I - 1.8 - - - - - - - - - -
Setaria pumila A D - - - - - - - 0.4 5.8 0.8 - 12.3
Sporobolus africanus P I 6.1 25.3 21.1 - 5.3 21.4 - - 11.8 27.5 25.4 -
Themeda triandra A D 5.8 - - - - - - - - - - -
BM = benchmark; PGA = private owned grazing areas; RGA = riverside grazing areas; CGA = communal grazing areas; D = decreaser;
I = increaser; P+ = pioneer grass species; P = perennial; A = annual; - = species not present
66

Tessema Zewdu et al, /Eth. J. Anim. Prod. 16(1)-2016: 61-78
Table 3: Least square means ± (SE) of grassland condition scores of four grazing areas in three
altitude ranges in the highlands of Ethiopia
Grazing land types
Benchmarks Private
grazing
Riverside
grazing
Communal
grazing Bottomland (1 900–2 300m)
Species composition 8.0 ± 0.12a 5.5 ± 0.20
b 2.8 ± 0.15
c 2.4 ± 0.09
c
Basal cover 7.6 ±0.13a 5.7 ± 0.17
b 4.2 ± 0.12
c 2.6 ± 0.08
d
Litter cover 5.9 ± 0.13a 3.7 ± 0.17
b 2.2 ±0.13
c 0.4 ± 0.08
d
Number of seedlings 2.7 ± 0.12a 2.6 ± 0.12
a 0.7 ± 0.10
b 0.4 ± 0.08
b
Age distribution 2.7 ± 0.10a 2.5 ± 0.13
a 1.7 ± 0.12
b 1.4 ± 0.08
b
Soil erosion 4.0 ± 0.08a 3.5 ± 0.14
b 3.0 ± 0.08
c 2.6 ± 0.08
d
Total condition score 30.9 ± 0.29a 23.5 ± 0.34
b 15.6 ± 0.25
c 9.7 ± 0.27
d
Total as % of benchmark 77% 50% 31% Grassland condition Good Fair Poor very poor
class
Medium altitude (2 300–2 600m)
Species composition 6.9 ± 0.12a 5.4 ± 0.16
b 3.5 ± 0.15
c 1.5 ± 0.11
d
Basal cover 7.7 ± 0.13a 6.3 ± 0.14
b 5.0 ± 0.12
c 3.4 ± 0.10
d
Litter cover 6.1 ± 0.13b 3.3 ± 0.10
b 2.4 ± 0.13
b 0.7 ± 0.09
b
Number of seedlings 2.6 ± 0.01a 1.7 ± 0.10
b 1.3 ± 0.10
c 0.4 ± 0.09
d
Age distribution 3.7 ± 0.13a 2.7 ± 0.10
b 2.4 ± 0.12
c 1.5 ± 0.10
d
Soil erosion 4.0 ± 0.08a 3.7 ± 0.11
b 3.3 ± 0.08
c 3.0 ± 0.09
d
Total condition score 30.8 ± 0.29a 23.2 ± 0.27
b 17.9 ± 0.25
c 10.5 ± 0.31
d
Total as % of benchmark 75% 58% 40% Grassland condition Good Fair Poor Poor
class
Highland (>2 600m)
Species composition 7.1 ± 0.12a 6.6 ± 0.13
b 3.3 ± 0.15
c 2.7 ± 0.13
d
Basal cover 8.1 ± 0.12a 6.7 ± 0.11
b 5.3 ± 0.12
c 3.6 ± 0.12
d
Litter cover 6.7 ± 0.13a 4.0 ± 0.11
b 2.7 ± 0.13
c 1.1 ± 0.12
d
Number of seedlings 3.1 ± 0.01a 2.4 ± 0.20
b 1.7 ± 0.10
c 0.7 ± 0.11
d
Age distribution 3.6 ± 0.10a 3.3 ± 0.08
b 2.7 ± 0.12
c 2.0 ± 0.12
d
Soil erosion 4.0 ± 0.08a 3.9 ± 0.08
a 3.5 ± 0.08
a 3.4 ± 0.11
a
Total condition score 32.5 ± 0.29a 27.0 ±0.21
b 19.1 ± 0.25
c 13.5 ± 0.38
d
Total as % of benchmark 83% 59% 42% Grassland condition
class
Good Fair Poor Poor
a, b, c, d Means with different superscript within row differ at P≤0.05
67
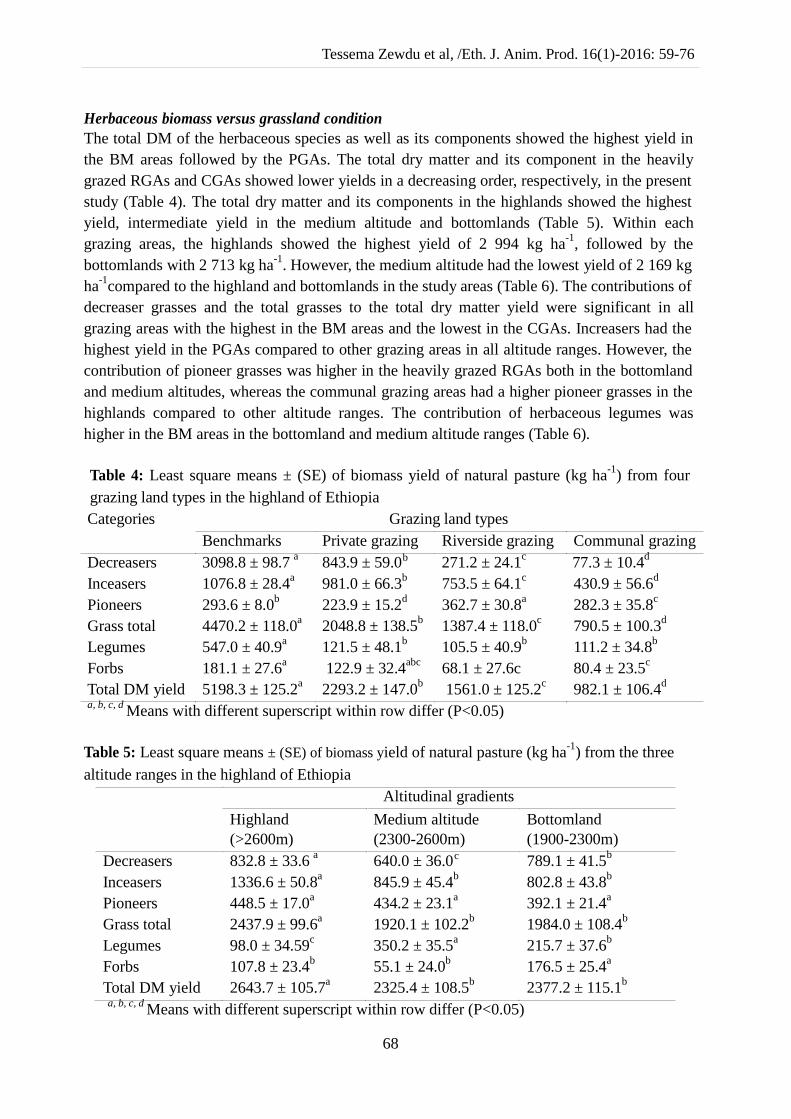
Tessema Zewdu et al, /Eth. J. Anim. Prod. 16(1)-2016: 59-76
Herbaceous biomass versus grassland condition
The total DM of the herbaceous species as well as its components showed the highest yield in
the BM areas followed by the PGAs. The total dry matter and its component in the heavily
grazed RGAs and CGAs showed lower yields in a decreasing order, respectively, in the present
study (Table 4). The total dry matter and its components in the highlands showed the highest
yield, intermediate yield in the medium altitude and bottomlands (Table 5). Within each
grazing areas, the highlands showed the highest yield of 2 994 kg ha-1
, followed by the
bottomlands with 2 713 kg ha-1
. However, the medium altitude had the lowest yield of 2 169 kg
ha-1
compared to the highland and bottomlands in the study areas (Table 6). The contributions of
decreaser grasses and the total grasses to the total dry matter yield were significant in all
grazing areas with the highest in the BM areas and the lowest in the CGAs. Increasers had the
highest yield in the PGAs compared to other grazing areas in all altitude ranges. However, the
contribution of pioneer grasses was higher in the heavily grazed RGAs both in the bottomland
and medium altitudes, whereas the communal grazing areas had a higher pioneer grasses in the
highlands compared to other altitude ranges. The contribution of herbaceous legumes was
higher in the BM areas in the bottomland and medium altitude ranges (Table 6).
Table 4: Least square means ± (SE) of biomass yield of natural pasture (kg ha-1
) from four
grazing land types in the highland of Ethiopia
Categories Grazing land types
Benchmarks Private grazing Riverside grazing Communal grazing
Decreasers 3098.8 ± 98.7 a 843.9 ± 59.0 b 271.2 ± 24.1c 77.3 ± 10.4
d
Inceasers 1076.8 ± 28.4a 981.0 ± 66.3
b 753.5 ± 64.1
c 430.9 ± 56.6
d
Pioneers 293.6 ± 8.0b 223.9 ± 15.2
d 362.7 ± 30.8
a 282.3 ± 35.8
c
Grass total 4470.2 ± 118.0a 2048.8 ± 138.5
b 1387.4 ± 118.0
c 790.5 ± 100.3
d
Legumes 547.0 ± 40.9a 121.5 ± 48.1
b 105.5 ± 40.9
b 111.2 ± 34.8
b
Forbs 181.1 ± 27.6a 122.9 ± 32.4
abc 68.1 ± 27.6c 80.4 ± 23.5
c
Total DM yield 5198.3 ± 125.2a 2293.2 ± 147.0
b 1561.0 ± 125.2
c 982.1 ± 106.4
d
a, b,
c,
d Means with different superscript within row differ (P<0.05)
Table 5: Least square means ± (SE) of biomass yield of natural pasture (kg ha-1
) from the three
altitude ranges in the highland of Ethiopia
Altitudinal gradients
Highland
(>2600m)
Medium altitude
(2300-2600m)
Bottomland
(1900-2300m)
Decreasers 832.8 ± 33.6 a 640.0 ± 36.0 c 789.1 ± 41.5
b
Inceasers 1336.6 ± 50.8a 845.9 ± 45.4
b 802.8 ± 43.8
b
Pioneers 448.5 ± 17.0a 434.2 ± 23.1
a 392.1 ± 21.4
a
Grass total 2437.9 ± 99.6a 1920.1 ± 102.2
b 1984.0 ± 108.4
b
Legumes 98.0 ± 34.59c 350.2 ± 35.5
a 215.7 ± 37.6
b
Forbs 107.8 ± 23.4b 55.1 ± 24.0
b 176.5 ± 25.4
a
Total DM yield 2643.7 ± 105.7a 2325.4 ± 108.5
b 2377.2 ± 115.1
b
a, b,
c,
d Means with different superscript within row differ (P<0.05)
68
Tessema Zewdu et al, /Eth. J. Anim. Prod. 16(1)-2016: 59-76
Table 6: The interaction effect of different grazing areas and altitudinal ranges on biomass yield of
natural pasture (kg ha-1
; Mean ± SE) in the highland of Ethiopia
Grazing land types
Bench marks Private grazing Riverside grazing Communal grazing
Bottomland (1 900–2 300m)
Decreasers 3254.7 ± 246.3a 788.4 ± 99.9
c 1082.2 ± 169.1
b 106.8 ± 24.5
d
Inceasers 394.5 ± 36.9b 1403.9 ± 174.6
a 299.8 ± 46.8
c 256.7 ± 56.6
cd
Pioneers 244.8 ± 18.3c 394.2 ± 48.9
b 523.3 ± 82
a 187.1 ± 41.2
d
Grass total 3894.0 ± 298.7a 2586.5 ± 310.8 b 1905.3 ± 49.0
c 550.6 ± 121.5d
Legumes 471.1 ± 137.4
a 105.7 ± 24.2
d 256.7 ± 40.1
b 134.2 ± 26.2
c
Forbs 244.5 ± 70.5a 239.9 ± 48.4
a 219.5 ± 49.6
a 243.1 ± 26.2
a
Total dry matter 4609.6 ± 302.4a 2932.1 ± 321.3
b 2381.5 ±160.7
c 927.9 ± 144.3
d
Medium altitude (2 300–2 600m)
Grass total 4056.2 ± 298.7a 1883.8 ± 253.9
b 1859.3 ± 40.8
b 674.4 ± 140.3
c
Decreasers 2500.8 ± 185.4a 990.8 ± 138.8
c 1134.4 ± 141.0
b 26.6 ± 7.2
d
Inceasers 1268.6 ± 93.4a 767.7 ± 98.4
b 147.6 ± 18.7
d 399.4 ± 77.4
c
Pioneers 286.8 ± 21.1b 125.3 ± 17.4
c 577.3 ± 72.1
a 248.4 ± 56.6
b
Legumes 1040.8 ± 13.7 a 166.5 ± 19.8 c 409.2 ± 50.8b 99.1 ± 30.2
d
Forbs 123.6 ± 70.5b 30.8 ± 39.6
c 145.0 ± 41.4
b 187.6 ± 30.2
a
Total dry matter 5220.6 ± 30.4a 2081.1 ± 262.3
b 413.5 ± 134.0
d 961.1± 166.2
c
Highland (>2 600m)
Decreasers 3474.9 ± 198.0a 807.1 ± 77.1
c 1754.5 ± 169.1
b 67.8 ± 11.6
d
Increasers 1534.3 ± 86.5a 1052.6 ± 99.3
b 314.0 ± 32.2
d 744.0 ± 105.8
c
Pioneers 349.4 ± 19.7 a 222.6 ± 21.5 b 112.2 ± 107.2b 394.8 ± 56.1
a
Grass total 5358.6 ± 298.7a 2082.3 ± 196.6
b 2180.7 ± 49.0
b 1206.6 ± 171.8
b
Legumes 129.0 ± 37.4b 92.3 ± 15.3
bc 326.2 ± 31.4
a 100.4 ± 37.0
bc
Forbs/sedges 175.0 ± 70.5 a 98.1 ± 30.6 b 138.3 ± 49.6a 78.3 ± 46.8
b
Total DM yield 5662.6 ±302.4a 2272.7 ± 203.2
b 2654.2 ± 160.7
c 1385.3 ± 204.1
d
a, b,
c,
d Means with different superscript within row differ (P<0.05)
Discussion
Herbaceous species
The lightly grazed BM areas and PGAs had relatively a higher number of grass species
compared to the heavily grazed RGAs and CGAs in the highlands of Ethiopia. The 32
identified herbaceous species in the present study were well known in different grazing areas in
Ethiopia (Fromann and Persson 1974, Ayana and Baars 2000; Amsalu and Baars 2002; Abule
et al. 2005; 2007; Tessema et al. 2010). 13 out of the 36 identified grasses were reported in the
southern parts of Ethiopia (Ayana and Baars 2000). Amsalu and Baars (2002) reported 36 grass
species out of the 87 species recorded in the rift valley of Ethiopia. Similarly, 14 grass species
were identified in the heavily grazed sites of the middle Awash valley of Ethiopia (Abule et al.
2005). However, Tessema et al. (2010) has reported higher number of grass species (45 species
out of the 69 total herbaceous species identified) in the Awash national park and Abernosa
69
Tessema Zewdu et al, /Eth. J. Anim. Prod. 16(1)-2016: 59-76
cattle breeding ranch in Ethiopia, and a total of 55 grass species in the highlands of north
western Ethiopia (Tessema 2005).
The total number of herbaceous species identified in particular and the total grass species
in general were very small in the present study. According to Amsalu and Baars (2002), a long
term increase or relaxation of grazing pressure could change the plant community, and under
heavy grazing pressure, palatable plants (decreasers) disappear and are replaced by less
palatable plant species (increasers or invaders). Under low grazing pressure, the reverse might
happen (Dykesterhuis 1949). Continuous heavy grazing alters the herbaceous vegetation
composition through an increase in the abundance of annual species with a decline in perennials
(Diaz et al. 2007; Hoshino et al. 2009). Smith (1979) reported that heavy grazing reduces the
growth rate and reproductive potential of perennial grasses and influences the competitive
relationships among the different species. Hence, the heavily grazed perennial grass species
loss competitive power compared to the lightly grazed ones, and subsequently, unpalatable and
grazing tolerant annual species remain dominant in heavily grazed patches (McNaughton 1979;
Stuart-Hill and Tainton 1989).
The mechanism is described by previous studies as an interaction between grazing and
competition within the plant community (Dyksterhuis 1949; Smith 1979; Tainton 1999). In this
situation, grazing intolerant species disappear because they are highly nutritious and eaten
before seed setting or other species that can tolerate heavy grazing and physical damage survive
and subsequently replace highly grazed palatable species in the area (Abule et al. 2005;
Tessema et al. 2010). Moreover, palatable perennial grass species may be dominated and
replaced by annual species, weeds and woody plants) associated with increasing grazing
pressure (Westoby et al. 1989; Milton and Hoffman 1994; Milton et al. 1994). The contribution
of decreaser grass species in the present study were higher in the BM areas followed by the
PGAs compared to the heavily grazed RGAs and CGAs in the present study. Our finding in the
present was against the report of Amsalu and Baars (2002), but in agreement with Ayana and
Baars (2000).
The scores for species composition of the BM areas and PGAs in all altitude ranges were
higher and quite different to the heavily grazed RGAs and CGAs, indicating that BM areas
were protected from heavy grazing pressure and as a result most grass species were palatable.
All grassland condition factors were found good in the BM areas. The palatable grass species
such as Andropogon abyssinica and Andropogon pratensis dominated the BM areas in all the
three altitude ranges. However, the unpalatable grass species Eleusine floccifolia, Pennisetum
macrorum and Pennisetum schimperi were dominant in the CGAs. Moreover, the tall but less
palatable Hyparrhenia spp. and Sprobolous africanus dominated the RGAs, and these species
are classified as an increaser‟s species. According to Harrington and Pratchett (1974) and
Amsalu and Baars (2002) under heavy grazing, Hyparrhenia spp. dominated grazing areas
might change to another one dominated by shorter grasses like Cynodon dactylon, Heteropogon
contortus and Microchloa species.
Grassland condition
The lightly grazed BM areas in all altitude ranges showed a good overall grassland condition,
followed by the PGAs compared to the heavily grazed RGAs and CGAs. The grassland
70

Tessema Zewdu et al, /Eth. J. Anim. Prod. 16(1)-2016: 59-76
condition of a given area should therefore not be evaluated by considering the species
composition alone (Anderson 1985; Tiedeman et al. 1991; Amsalu and Baars 2002; Gemodo et
al. 2006). The percentage of bare ground were far lower for light grazing sites compared to
heavy grazing sites, whereas the percentage basal cover of herbaceous species was far larger on
lightly grazed sites (Tessema et al. 2010).Other parameters like soil condition, ground cover
and age distribution should be included (Friedel 1991; Baars et al. 1997). We have assessed the
grassland condition in the present study including species composition, basal and litter covers,
number of seedlings and age distribution of grass species, and all these parameters were higher
in the BM areas and PGAs than the CGAs and RGAs due to sustained heavy grazing pressure
experienced in the past long years. Studies were conducted using similar criteria to evaluate the
rangeland conditions in the lowland areas of Ethiopia (Ayana and Baars 2000; Amsalu and
Baars 2002; Gemedo et al. 2006), and the range condition scores obtained from these studies
corresponded with the major grazing areas of the highlands in the present study. We concluded
that the grassland condition in the BM areas in the highland of Ethiopia and PGAs were almost
similar in most lowland rangelands areas of the country. Moreover, these range condition
assessment factors could be used not only in the lowland rangelands but also in the highland
grazing areas with proper implementation of the procedures under field situation.
Biomass versus grassland condition
The total dry matter yield of the herbaceous species as well as its components showed the
highest in the BM areas followed by the PGAs. However, the total dry matter yield and its
component yield in the heavily grazed RGAs and CGAs were lower in the present study.
Grazing areas with higher elevation under the light grazing pressure had a higher standing
biomass of herbaceous species compared to the lowland grazing areas under heavy grazing
pressure (Tessema 2005; Brinkmann et al. 2009; Tessema and Oustalet 2007; Tessema et al.
2011). Within each grazing areas, biomass yield was higher in the highlands followed by
bottomlands in the present study. According to Snyman and Fouche (1993) there is a direct
proportional relationship between biomass yield and grassland condition in such a way that
forage production is low when the grassland condition is low. The relationship between
biomass yield of the herbaceous layer and the grassland condition in our study supports the
report of previous studies by Snyman and Fouche (1993). However, Amsalu and Baars (2002)
reported a poor relationship between biomass yield of the herbaceous layer and the range
condition in the rift valley of Ethiopia.
Conclusions
The species composition, biomass yield and grassland condition in the bench mark areas was
found relatively in a good condition and the privately owned grazed areas were in fair
conditions in the north-eastern highland of Ethiopia. However, the heavily grazed riverside
grazing and communally owned grazing areas were found poor in terms of species composition,
biomass yield and grassland condition, and resulted in severe land degradation, which is
explained by the soil and herbaceous vegetation degradation indicators during our study. Unless
this soil and vegetation degradation in major grazing land types are reversed, the north-eastern
71

Tessema Zewdu et al, /Eth. J. Anim. Prod. 16(1)-2016: 59-76
highlands of the country will be in high risk of food insecurity, loss of biological diversity and
ecological instability in the future. The results of the present study confirmed that existing
grassland condition assessment procedures developed for dryland areas of Africa could be used
for the condition assessment of grazing lands (grasslands) in the highlands of Ethiopia. Finally,
we recommend that community based pasture improvement interventions and proper land use
planning should be in placed to optimize and sustain the huge livestock population as well as
for better environmental and ecological utilization of the grazing areas in the north-eastern
highlands of Ethiopia.
Acknowledgment
The authors would like to acknowledge the Amhara Agriculture and Rural Development
Bureau for financing this research and the livestock keepers for their collaboration during data
collection in field work.
References
Abebe Mekoya. 2008. Multipurpose fodder trees in Ethiopia: Farmers‟ perception, constraints
to adoption and effects of long-term supplementation on sheep performance. PhD thesis,
Wageningen University, Wageningen, the Netherlands.
Abule Ebro, Smit G.N and Snyman H.A. 2005. The influence of woody plants and livestock
grazing on grass species composition, yield and soil nutrients in the Middle Awash Valley
of Ethiopia. Journal of Arid Environments 60:343-358.
Abule Ebro, Smit G.N and Snyman H.A. 2007. Rangeland evaluation in the Middle Awash
Valley of Ethiopia: Herbaceous vegetation layer. Journal of Arid Environments 70:253-
271.
Adane Kitaba and Berhan Tamir. 2005 Effect of harvesting frequency and nutrient levels on
natural pasture in the central high lands of Ethiopia. Tropical Science 45:77-82.
Alemayehu Mengistu 2004 Pasture and forage resource profiles of Ethiopia. FAO, Addis
Ababa, Ethiopia.
Amsalu Sisay and Baars R.M.T. 2002. Grass composition and rangeland condition of the major
grazing areas in the rift valley of Ethiopia. African Journal of Range and Forage Science
19: 161-166.
Anderson, E.W. 1985. Percent composition versus absolute units of measure - a view point.
Rangelands 7: 247–248.
Anderson, P.M.L.,Hoffman, M.T. and O'Farrell, P.J. 2010. Aboveground perennial plant
biomass across an altitudinal and land-use gradient in Namaqualand, South Africa. South
African Journal of Botany 76: 471-48.
Ayana Angassa. 2016. Vegetation responses to site, elevation and land use in semi-arid
rangeland of Southern Ethiopia. African Journal of Agricultural Research 11(5): 379-391.
72

Tessema Zewdu et al, /Eth. J. Anim. Prod. 16(1)-2016: 59-76
Ayana Angassa and Baars, R.M.T. 2000. Ecological condition of encroached and non-
encroached rangelands in Borana, Ethiopia. African Journal of Ecology 38: 321-328.
Angassa Angassa and Oba, G. 2010. Effects of grazing pressure, age of enclosures and
seasonality on bush cover dynamics and vegetation composition in southern Ethiopia.
Journal of Arid Environment 74: 111-120.
Ayele S, Assegid W, Jabbar, M.A., Ahmed M.M. and Belachew H. 2002 Livestock marketing
in Ethiopia. A review of structure, performance and development initiatives. Socio-
economic and policy research working paper 52. International Livestock Research
Institute (ILRI), Nairobi, Kenya.
Baars, R.M.T., Chileshe E.C. and Kalokoni, D.M. 1997. Technical Note: Range condition in
high cattle density areas in the Western province of Zambia. Tropical Grasslands 31: 569-
573.
Bilotta, G.S., Brazier, R.E. and Haygarth, P.M. 2007. The impacts of grazing animals on the
quality of soils, vegetation, and surface waters in intensively managed grasslands.
Advances in Agronomy 94: 237-250.
Bureau of Agriculture and Rural Development (BOARD). 2005. Rural household socio-
economic baseline survey. Amhara regional state, Bahir Dar. Ethiopia.
Chapin III F.S., Walker, H.H., Hobbs, R.J., Hooper, D.U., Lawton, J.H., Sala, O.E. 1997. Biotic
cover over the functioning of ecosystems. Science 277:500-504.
Central Statistical Agency (CSA). 2008 Statistical abstracts. Statistical Survey Authority of
Ethiopia, Addis Ababa, Ethiopia.
Cufodontis, G. 1953-1972. Enumeratio Plantaraum Athiopiae Spermatophyte, 2 vols. Jard. Bot.
Etat., Bruxelles.
Dahlberg, A.C. 2000. Vegetation diversity and change in relation to land use, soil and rainfall-a
case study from north-east District, Botswana. Journal of Arid Environments 44: 19-40.
Danckwerts, J.E. 1982. Veld condition assessment in the Eastern Cape region.Dohne-
Agriculture 5: 9-15.
De Leeuw, P.N. and Tothill, J.C. 1990. The concept of rangeland carrying capacity in Sub-
Saharan Africa-myth or reality. Pastoral development network paper 29b.Overseas
development Institute, London.
Diaz, S., Lavorel, S., McIntyre, S., Falczuk, V., Casanoves, F., Milchunas, D.G., Skarpe, C.,
Rusch, G., Sternberg, M., Noy-Meir I., Landsberg, J., Zhang, W., Clark, H. and
Campbell, B.D. 2007. Plant trait responses to grazing: a global synthesis. Global Change
Biology 13: 313-341.
Dyksterhuis, E.J. 1949. Condition and management of rangeland based on quantitative ecology.
Journal of Range management 2:104-112.
Edwards, S., Mesfin T and Hedberg, I. 1995. Flora of Ethiopia and Eritrea, vol. 2(2). Addis
Ababa: The National Herbarium, Addis Ababa University; Uppsala: Department of
Systematic Botany, Uppsala University.
Edwards S., Mesfin T., Sebsebe Demissew and Hedberg, I. 2000. Flora of Ethiopia and Eritrea,
vol. 2(1). Addis Ababa: The National Herbarium, Addis Ababa University; Uppsala:
Department of Systematic Botany, Uppsala University.
73
Tessema Zewdu et al, /Eth. J. Anim. Prod. 16(1)-2016: 59-76
Edwards S, Sebsebe Demissew and Hedberg, I. 1997. Flora of Ethiopia and Eritrea, vol. 6.
Addis Ababa: The National Herbarium, Addis Ababa University; Uppsala: Department of
Systematic Botany, Uppsala University.
EEA (Ethiopian Economic Association). 2002. A research report on land tenure and
agricultural development in Ethiopia, October 2002, Addis Ababa, Ethiopia.
FAO (Food and Agriculture Organization of the United Nations). 2001 Grassland resource
assessment for pastoral systems, 2001. FAO Plant production and protection paper No.
162. 150p.
Friedel, M.H. 1991. Range condition assessment and the concept of thresholds: A viewpoint.
Journal of Range Management 44: 422-426.
Froman B and Persson S 1974 An illustrated guide to the grasses of Ethiopia. Chilalo
Agricultural Development Unit (CADU), Asella, Ethiopia.
Gemedo Dalle, Maass, B.L. and Issaelstein, J. 2006. Rangeland condition and trend analysis in
the semi-arid Borana lowlands, southern Oromia, Ethiopia. Journal of Forage and Range
Science 23: 49-58.
Getachew Eshete. 2002. An assessment of feed resources, their management and impact on
livestock productivity in the Ginchi watershed area. MSc thesis submitted to the School of
Graduate Studies, Alemaya University of Agriculture, Alemaya, Ethiopia.
Harrington, G.N. and Pratchett, D. 1974. Stocking rates in Ankole, Uganda. II. Botanical
analysis and oesophageal fistula sampling of pastures grazed at different stocking rates.
Journal of Agricultural Sciences 82:507-516.
Hedberg, I. and Edwards, S. 1989. Flora of Ethiopia, vol. 3. Addis Ababa: The National
Herbarium, Addis Ababa University; Uppsala: University of Systematic Botany, Uppsala
University.
Hedberg, I. and Edwards, S. 1995. Flora of Ethiopia, vol. 7. Addis Ababa: The National
Herbarium, Addis Ababa University; Uppsala: University of Systematic Botany, Uppsala
University.
Hedberg, I., Edwards, S. and Sileshi, N. 2003. Flora of Ethiopia and Eritrea, vol. 4. Addis
Ababa: The National Herbarium, Addis Ababa University; Uppsala: University of
Systematic Botany, Uppsala University.
Hoshino, A., Yoshihara, Y., Sasaki, T., Okayasu, T., Jamsran, U., Okuro, T. and Takeuchi, K.
2009. Comparison of vegetation changes along grazing gradients with different numbers
of livestock. Journal of Arid Environments 73:687-690
ILCA (International Livestock Center for Africa). 1990. Livestock research manual.ILCA,
Addis Ababa, Ethiopia. p.31-54.
Kucher, P. 1995. Range monitoring, evaluation and range survey methods. Southeast range
project technical report. Addis Ababa, Ethiopia.
LMA (Livestock Marketing Authority). 1995. Annual report, Addis Ababa, Ethiopia
McNaughton, S.J. 1979. Grazing as an optimisation process: grass-undulate relationships in the
Serengeti. American Naturalist 113:691-703.
Milton, S.T., Dean, W.R.J., du Plessis, M.A. and Siegfried, W.R. 1994. A conceptual model of
arid rangeland degradation: The escalating cost of declining productivity. Bioscience 44:
70-76.
74

Tessema Zewdu et al, /Eth. J. Anim. Prod. 16(1)-2016: 59-76
Milton, S.T. and Hoffman, M.T. 1994. The application of state-and-transition models to
rangeland research and management in arid succulent and semi-arid grassy karoo, South
Africa. African Journal of Range and Forage Science 11:18-26.
Nogues-Bravo, D., Araujo, M., Romdal, T. and Rahbek, C. 2008. Scale effects and human
impact on the elevational species richness gradients. Nature 453:216 -219.
Pratt, D.J. and Gwynne, M.D. 1977 Rangeland management and ecology in east Africa. Hodder
and Stoughton, London, UK.
Smith, E.L. 1979. Evaluation of the range condition concept. Rangelands 1:52-54.
Snyman, H.A. and Fouché, H.J. 1993. Estimating seasonal herbage production of a semi-arid
grassland based on veld condition, rainfall, and evapo-transpiration. African Journal of
Range and Forage Science 10:21-24.
Solomon, B. 2004. Assessment of livestock production systems feed resource base in Sinana
Dinsho district of bale highlands, Southeast Oromia, MSc thesis submitted to the School
of Graduate Studies, Alemaya University, Dire Dawa, Ethiopia.
Speed, J.D.M., Austrheim, G. and Mysterud, A. 2013. The response of plant diversity to
grazing varies along an elevational gradient. Journal of Ecology 101:1225 -1236.
Stoddart, L.A., Smith, A.D. and Box, T.W. 1975. Range management. McGraw-Hill, New
York.
Stuart-Hill, G.C. and Tainton, N.M. 1989. The competitive interaction between Acacia karoo
and the herbaceous layer and how this is affected by defoliation. Journal of Applied
Ecology 26:285-298.
Tainton, N.M. 1999. Veld management in South Africa. In: Tainton, N.M. (Eds). University of
Natal Press, Pietermarizburg South Africa. 532p.
Tessema Zewdu, Aklilu Agdie and Amha Sebsbie. 2002. Assessment of the livestock
production system, available feed resources and marketing situation in Belesa Woreda: A
case study in drought prone areas of Amhara region. In: Proceedings of the 10th annual
conference of the Ethiopian Society of Animal Production (ESAP). 22-24 August 2002.
Addis Ababa, Ethiopia. Pp: 165-175.
Tessema Zewdu. 2005. Identification of indigenous pasture and the effect of time of harvesting
and nitrogen fertilizer in the north western Ethiopian highlands. Tropical Science 45:73-
77.
Tessema Zewdu and Oustalet, Y. 2007. Vegetation composition, biomass production, carrying
capacity and grassland types in Odolla area of Shinile zone, eastern Ethiopia. East African
Journal of Science 2:148-159.
Tessema Zewdu, Ashagre Abate and Solomon Mengitu. 2010. Botanical composition, yield and
nutritional quality of grassland in response to stages of harvesting and fertilizer
application in the highland of Ethiopia. African Journal of Range and Forage Science, 27:
117-124
Tessema Zewdu Kelkay, de Boer, W.F., Baars, R.M.T. and Prins, H.H.T. 2011. Changes in soil
nutrients, vegetation structure and herbaceous biomass in response to grazing in a semi-
arid savanna in Ethiopia. Journal of Arid Environments 75:662-670.
Tiedeman, J.A., Beck, R. and Vanhorn, E.R. 1991. Dependence of standing crop on range
condition rating in New Mexico. Journal of Range Management 44:602-605.
75
Tessema Zewdu et al, /Eth. J. Anim. Prod. 16(1)-2016: 59-76
Trollope, W.S.W., Trollope, L,A, and Bosch, O.J.H. 1990. Veld and pasture management
terminologies in South Africa. Journal of the Grassland Society of South Africa 7:52-61.
Westoby, M., Walker, B. and Noy-Meir, I. 1989. Opportunistic management for rangelands not
at equilibrium. Journal of Range Management 42:266–274.
Wilson, A.D. and Tupper, G.J. 1982. Concepts and factors applicable to the measurement of
range condition. Journal of Range Management 35:684-689.
Yeshitila Admasu, Tessema Zewdu and AzageTegegne. 2008a. Availability of livestock feed
resources in Alaba Woreda, Southern Ethiopia. 2008. In: Proceedings of the 16th annual
conference of the Ethiopian Society of Animal Production (ESAP), October 8-9, 2008,
Addis Ababa, Ethiopia. Pp. 21-32. 26.
Yeshitila Admasu, Tessema Zewdu and Azage Tegegne. 2008b. Utilization of feeds, livestock
unit versus dry matter requirement in Alaba, Southern Ethiopia. In: Proceedings of the
16th
Annual Conference of the Ethiopian Society of Animal Production (ESAP), October
8-9, 2008, Addis Ababa, Ethiopia. Pp. 33-38.

76
Nigussu Fekade et al, /Eth. J. Anim. Prod. 16(1)-2016:77-92
The Effects of Partial Substitution of Maize with Enset (Ensete ventricosum)
Corm on Production and Reproduction Performance of White Leghorn Layer
Nigussu Fekade1, Mengistu Urge
2, Ajebu Nurfeta
3 and Getachew Animut4
1 Department of Animal Sciences, Assosa University, P. O. Box 18, Assosa, Ethiopia
2 School of Animal and Range Sciences, Haramaya University, P.O. Box 138, Dire-Dawa,
Ethiopia 3 School of Animal and Range Sciences, Hawassa University, P.O. Box 5, Hawassa, Ethiopia
4 Agricultural Transformation Agency, P. O. Box 708, Addis Ababa, Ethiopia
Abstract
One hundred and eighty white leghorn layers were used to evaluate the effects of partial
replacement of maize with enset (Ensete ventricosum) corm on production and reproduction
performance. The layers were fed ration containing enset corm at levels of 0% (T1), 6.5% (T2),
13% (T3) and 20% (T4) to replace 0, 15, 30 and 45% of maize. The experiment was arranged in
a completely randomized design with three replications and lasted 12 weeks. Hens were weighed
at the start and end of the experiment. Data on dry matter intake, hen-day egg production, egg
weight and egg mass were recorded daily. Egg quality parameters (egg shell weight and
thickness, albumen weight and height, Haugh unit and egg yolk weight and color were
determined at an interval of 7 days using 4 eggs per replicate. Enset corm contained 3.2% crude
protein, 6.2% ether extract, 2.1% crude fibre and 1.18μg/100g beta-carotene. The mean daily
DM intake of the group fed with T1 was significantly lower (P<0.05) compared with the groups
fed with T2, T3 and T4, all of which had similar values. There was no significant difference
(P>0.05) between all the treatment groups in average daily gain, hen-day egg production, egg
mass, egg weight, feed conversion ratio, mortality rate, egg quality parameters, fertility,
hatchability, embryonic mortality and chick quality characteristics. The net return gained from
the inclusion of 13% enset corm to replace 30% of maize was more economical in terms of egg
production and feed cost. Therefore, due to the year round availability and easy access by
smallholder farmers in enset growing areas of Ethiopia, enset corm could safely and
economically used in replacing 30% of maize in layers ration.
Keywords: Egg quality, Enset corm, Hen-day egg production, Layers, Replacement
77

Nigussu Fekade et al, /Eth. J. Anim. Prod. 16(1)-2016:77-92
Introduction
The demand for food of animal origin is expected to increase in developing countries because of
escalation in human population, urbanization and income improvements especially in urban areas
(Abdullah et al., 2011). The poultry sub-sector is one of the major protein sources that can meet
the rising demand for protein of animal origin, attributed to the high rate of reproduction and
feed conversion efficiency. Moreover, the sub-sector has the potential to create both rural and
urban employment and generate income at various economic levels (Tekalign et al., 2017).
Eggs are endowed with high quality proteins and have been used as a standard of high
biological value (Lakhotia, 2002). However, productivity per bird and the contribution of the sub-
sector to the national economy is low in Ethiopia. Availability, quality and market price of the
conventional energy and protein sources are factors that limit the productivity of poultry in the
tropics, including Ethiopia (Atawodi, 2008). Moreover, commercial poultry production is largely
dependent on high quality grains, used as human food, putting it in a direct competition with
human population, which leads to increased cost of poultry production (Gura, 2008). This
situation warrants the evaluation of locally available none conventional feeds for inclusion into
poultry ration.
Ethiopia is endowed with diverse agro-climatic conditions favoring production of many
different kinds of crops, providing a wide range of alternative feedstuffs suitable for poultry
feeding (Tadelle et al., 2002). One of such crop is enset (Ensete ventricosum). Ensete
ventricosum (Welw.) Cheesman, Musaceae] is a monocarpic short-lived perennial plant which is
widely cultivated in the central, southern and south-western parts of Ethiopia. It is estimated that
about 35% of the total population in Ethiopia live in areas where enset is a very important food
crop, indicating that enset products are staple foods in Ethiopia (CSA, 2014). The pseudo-stem,
corm and the stalk of the inflorescence constitute the most important components of enset
(Adugna, 2008). Over 70% of the enset plant is composed of pseudo-stem and corm (Ajebu et
al., 2008). The major food products obtained from the enset plant are kocho, bulla and amicho
Enset corm has the high concentration of highly soluble carbohydrates and starch, but very
low in fibre and cellulose (Mohammed et al., 2013). The corm, botanically the underground stem
of enset, is used for vegetative propagation of enset. The corm can be processed with pseudo-
stem to produce kocho. It is also cooked and eaten like potato. It is a sustainable food source,
which can be uprooted and used any time during the life span of the plant, particularly during an
extended drought. Mohammed et al. (2013) reported that enset corm contained 17 of the 20
amino acids, in concentrations ranging between 1.2 and 8.7 g per 100 g of protein and between
25.6 and 186.6 mg per 100 g of corm and the amounts of most amino acids are higher than that
of potato.
78
Nigussu Fekade et al, /Eth. J. Anim. Prod. 16(1)-2016:77-92
Ajebu and Eik (2014) indicated that corm could be used as an alternative energy source in the
diet of sheep. However, there is lack of information on the effect of feeding enset corm on
performance and egg quality of layer chickens. Therefore, the present experiment was planned to
evaluate the effect of partial substitution of maize grains with enset corm on the production and
reproduction performance of White Leghorn layers. Materials and Methods
Description of the study area
The experiment was conducted at Haramaya University poultry farm, located at 42°3‟ east
longitude, 9°26‟north latitude, at an altitude of 1980 meter above sea level 505 km east of Addis
Ababa. The mean annual rainfall of the area was reported to be 780 mm and the average
minimum and maximum temperature is 8 and 24°C, respectively (Samuel, 2008).
Treatment ration preparation
Enset plants of age 4-6years of “Ashakti” variety were bought from farmers in south west Shewa
zone, Daryan Kebele, Oromia Regional State, Ethiopia. Fresh enset corm was dug out after
removing the aerial part of enset plant. Whole fresh enset corm was washed, cleaned and sifted,
peeled, chopped into small slices and sun dried over plastic sheet for five days. It was regularly
turned to prevent uneven drying and decaying. The other feed ingredients i.e maize grain, wheat
short, soybean meal, noug seed cake, salt, vitamin premix and dicalcium phosphate were
purchased from the local market. Dried enset corm, maize grain, noug seed cake and salt were
ground to pass through 5mm sieve before mixing. Finally the four treatment rations (Table 1)
were formulated based on the results of the laboratory chemical analysis. The treatment rations
were formulated to meet the nutrient requirements of layers (Leeson and Summers, 2005). Enset
corm was included into the treatment ration to replace 0, 15, 30, and 45% of maize by weight in
T1, T2, T3 and T4, respectively.
Management of the experimental animals
A total of 180 White Leghorn layers of 26 weeks of age were obtained from Haramaya
university poultry farm. Before the commencement of the experiment, layers were managed
under feed containing 20% CP and ME content 2800kcal/kg DM during starter phase and 16%
CP and ME content of 2700kcal/kg DM during the grower stage. They were randomly divided
into 12 groups of 15 birds each with equally mean group weight. Each group was housed in an
individual pen covered with sawdust and equipped with all the necessary layers house
equipment‟s. Before the commencement of the actual experiment, all the experimental pens were
79
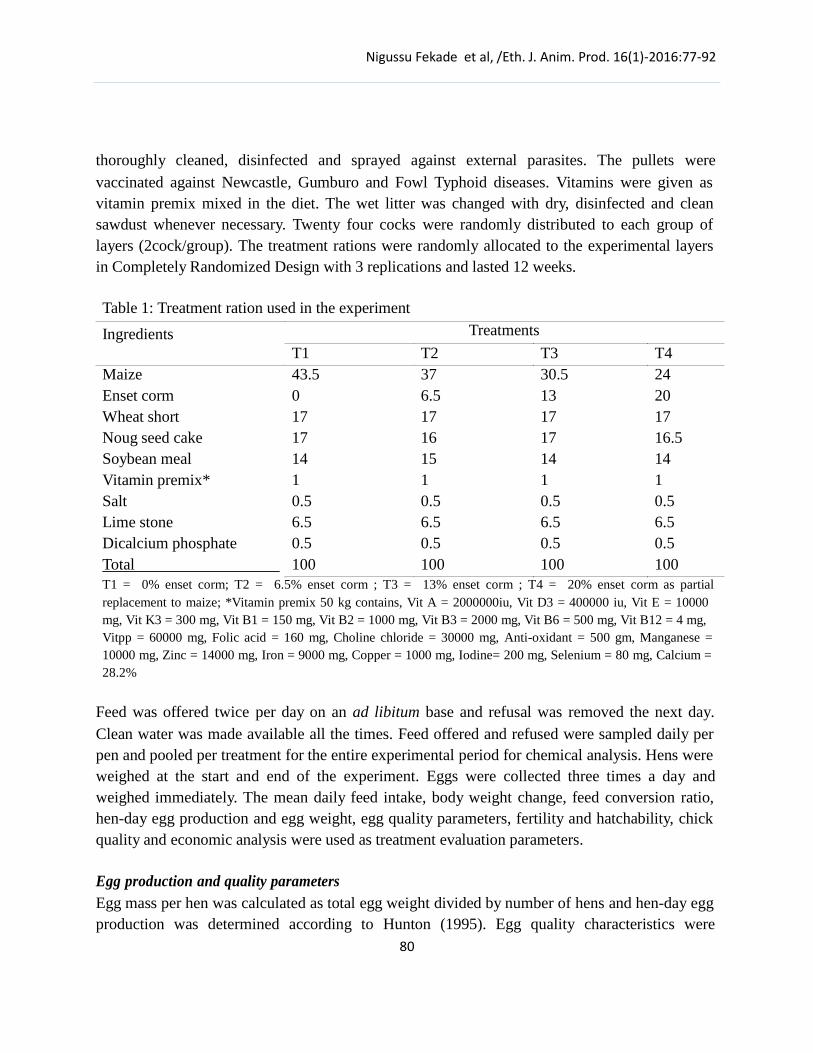
Nigussu Fekade et al, /Eth. J. Anim. Prod. 16(1)-2016:77-92
thoroughly cleaned, disinfected and sprayed against external parasites. The pullets were
vaccinated against Newcastle, Gumburo and Fowl Typhoid diseases. Vitamins were given as
vitamin premix mixed in the diet. The wet litter was changed with dry, disinfected and clean
sawdust whenever necessary. Twenty four cocks were randomly distributed to each group of
layers (2cock/group). The treatment rations were randomly allocated to the experimental layers
in Completely Randomized Design with 3 replications and lasted 12 weeks.
Table 1: Treatment ration used in the experiment
Ingredients Treatments
T1 T2 T3 T4
Maize 43.5 37 30.5 24
Enset corm 0 6.5 13 20
Wheat short 17 17 17 17
Noug seed cake 17 16 17 16.5
Soybean meal 14 15 14 14
Vitamin premix* 1 1 1 1
Salt 0.5 0.5 0.5 0.5
Lime stone 6.5 6.5 6.5 6.5
Dicalcium phosphate 0.5 0.5 0.5 0.5
Total 100 100 100 100
T1 = 0% enset corm; T2 = 6.5% enset corm ; T3 = 13% enset corm ; T4 = 20% enset corm as partial
replacement to maize; *Vitamin premix 50 kg contains, Vit A = 2000000iu, Vit D3 = 400000 iu, Vit E = 10000
mg, Vit K3 = 300 mg, Vit B1 = 150 mg, Vit B2 = 1000 mg, Vit B3 = 2000 mg, Vit B6 = 500 mg, Vit B12 = 4 mg, Vitpp = 60000 mg, Folic acid = 160 mg, Choline chloride = 30000 mg, Anti-oxidant = 500 gm, Manganese =
10000 mg, Zinc = 14000 mg, Iron = 9000 mg, Copper = 1000 mg, Iodine= 200 mg, Selenium = 80 mg, Calcium = 28.2%
Feed was offered twice per day on an ad libitum base and refusal was removed the next day.
Clean water was made available all the times. Feed offered and refused were sampled daily per
pen and pooled per treatment for the entire experimental period for chemical analysis. Hens were
weighed at the start and end of the experiment. Eggs were collected three times a day and
weighed immediately. The mean daily feed intake, body weight change, feed conversion ratio,
hen-day egg production and egg weight, egg quality parameters, fertility and hatchability, chick
quality and economic analysis were used as treatment evaluation parameters.
Egg production and quality parameters
Egg mass per hen was calculated as total egg weight divided by number of hens and hen-day egg
production was determined according to Hunton (1995). Egg quality characteristics were
80
Nigussu Fekade et al, /Eth. J. Anim. Prod. 16(1)-2016:77-92
determined at an interval of 7 days using freshly laid eggs. Egg shell, albumen and yolk weights
were measured using sensitive balance. Albumen and yolk height were measured with a tripod
micrometer. Egg shell thickness was measured by micrometer gauge. Yolk color was determined
by comparing the egg color with Roche Color Fan measurement. Haugh unit was calculated from
the egg weight and albumen height using the formula suggested by Haugh (1937). Egg and yolk
shape indexes were computed according to Penda (1996).
Fertility, hatchability and chick quality
Adequate eggs stored for <7 days at a temperature of 10-14oC and selected against undesirable
size, shape and shell characteristics were incubated. The eggs were candled on the 9th day of
incubation for the determination of percentage fertility. Average percentage hatchability of the
fertile eggs was computed by dividing the number of chicks hatched by the number of fertile
eggs. Early, mid, late and pipe embryonic mortalities were determined on the 9th
, 14th
, 18th and
the last days of incubation using the method of Bonnier and Kasper (1990).Chick quality was
determined according to Molenaar et al.( 2009) and chick length was determined according to
the method of Meijerhof (2005). Chick weight at hatching was determined by weighing the chick
after 12 hours of hatching (Molenaar et al., 2009). Yield percentage was calculated as the
percentage of average chick weight to average initial egg set weight (Molenaar et al., 2009).
Economic consideration
The procedure of partial budget analysis developed by Upton (1979) was applied to estimate the
economic benefits of each treatment ration, the market price of each feed ingredients were
registered at the time of purchase. Total Return (TR) was calculated as a total egg produced
multiplied by price of egg at Haramaya University during the experimental period. Net return
(NR) was calculated as TR (Total return)-TVC (Total Variable Cost) (in this case feed cost).
Change in total variable cost (∆TVC) was calculated as total feed cost of the treatments
containing enset corm (termed as experimental ration) minus total feed cost of treatments
without enset corm (control). The change in total return (∆TR) was calculated as the difference
between total incomes from the respective experimental treatments minus total income of the
control. Change in net return (∆NR) was calculated as net return of the respective experimental
treatments minus net return of the control experiment. The marginal rate of return (MRR)
measures increases in net return (∆NR) associated with each additional units of expenditure
(∆TVC). It is calculated as: MRR = ∆NR / ∆TVC.
Chemical analysis of feeds
Dried feed samples were milled to pass through 1 mm screen for chemical analysis. Samples
were analyzed for dry matter, crude protein, ether extract, crude fibre and ash according to
81
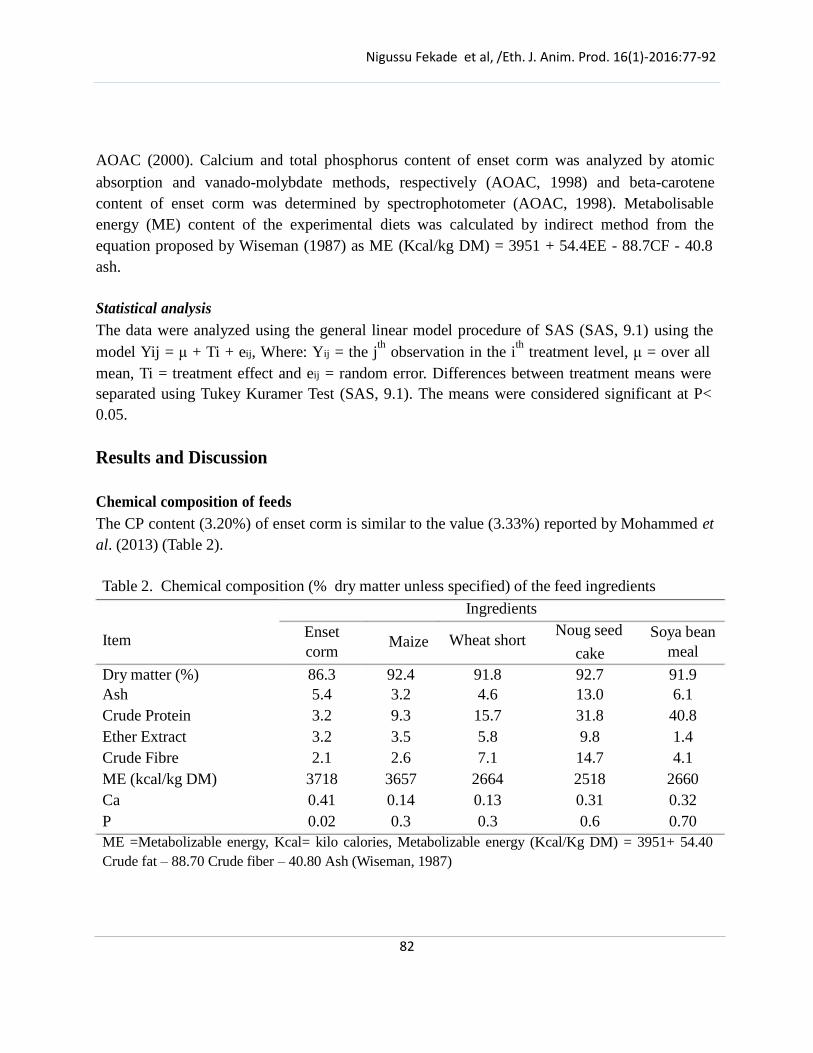
Nigussu Fekade et al, /Eth. J. Anim. Prod. 16(1)-2016:77-92
AOAC (2000). Calcium and total phosphorus content of enset corm was analyzed by atomic
absorption and vanado-molybdate methods, respectively (AOAC, 1998) and beta-carotene
content of enset corm was determined by spectrophotometer (AOAC, 1998). Metabolisable
energy (ME) content of the experimental diets was calculated by indirect method from the
equation proposed by Wiseman (1987) as ME (Kcal/kg DM) = 3951 + 54.4EE - 88.7CF - 40.8
ash.
Statistical analysis
The data were analyzed using the general linear model procedure of SAS (SAS, 9.1) using the
model Yij = μ + Ti + eij, Where: Yij = the jth
observation in the ith
treatment level, μ = over all
mean, Ti = treatment effect and eij = random error. Differences between treatment means were
separated using Tukey Kuramer Test (SAS, 9.1). The means were considered significant at P<
0.05.
Results and Discussion
Chemical composition of feeds
The CP content (3.20%) of enset corm is similar to the value (3.33%) reported by Mohammed et
al. (2013) (Table 2).
Table 2. Chemical composition (% dry matter unless specified) of the feed ingredients
Ingredients
Item Enset
corm Maize
Wheat short
Noug seed
cake
Soya bean
meal
Dry matter (%) 86.3 92.4 91.8 92.7 91.9
Ash 5.4 3.2 4.6 13.0 6.1
Crude Protein 3.2 9.3 15.7 31.8 40.8
Ether Extract 3.2 3.5 5.8 9.8 1.4
Crude Fibre 2.1 2.6 7.1 14.7 4.1
ME (kcal/kg DM) 3718 3657 2664 2518 2660
Ca 0.41 0.14 0.13 0.31 0.32
P 0.02 0.3 0.3 0.6 0.70
ME =Metabolizable energy, Kcal= kilo calories, Metabolizable energy (Kcal/Kg DM) = 3951+ 54.40
Crude fat – 88.70 Crude fiber – 40.80 Ash (Wiseman, 1987)
82
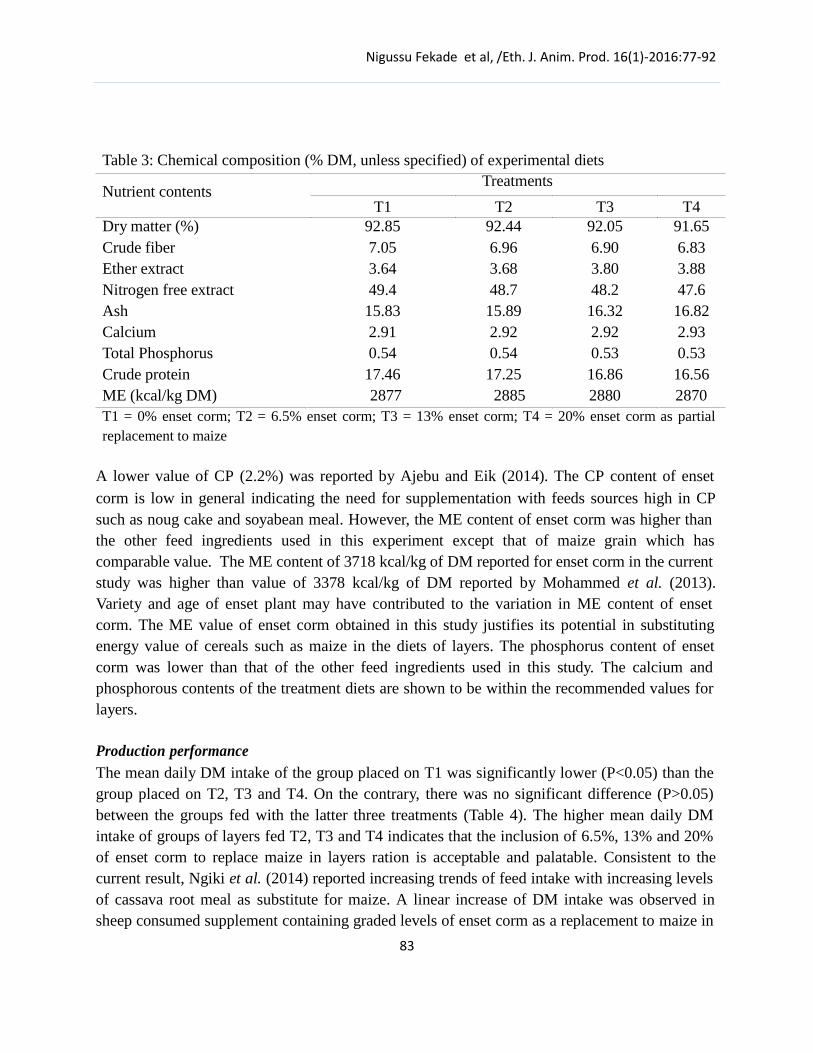
Nigussu Fekade et al, /Eth. J. Anim. Prod. 16(1)-2016:77-92
Table 3: Chemical composition (% DM, unless specified) of experimental diets
Nutrient contents Treatments
T1 T2 T3 T4
Dry matter (%) 92.85 92.44 92.05 91.65
Crude fiber 7.05 6.96 6.90 6.83
Ether extract 3.64 3.68 3.80 3.88
Nitrogen free extract 49.4 48.7 48.2 47.6
Ash 15.83 15.89 16.32 16.82
Calcium 2.91 2.92 2.92 2.93
Total Phosphorus 0.54 0.54 0.53 0.53
Crude protein 17.46 17.25 16.86 16.56
ME (kcal/kg DM) 2877 2885 2880 2870
T1 = 0% enset corm; T2 = 6.5% enset corm; T3 = 13% enset corm; T4 = 20% enset corm as partial
replacement to maize
A lower value of CP (2.2%) was reported by Ajebu and Eik (2014). The CP content of enset
corm is low in general indicating the need for supplementation with feeds sources high in CP
such as noug cake and soyabean meal. However, the ME content of enset corm was higher than
the other feed ingredients used in this experiment except that of maize grain which has
comparable value. The ME content of 3718 kcal/kg of DM reported for enset corm in the current
study was higher than value of 3378 kcal/kg of DM reported by Mohammed et al. (2013).
Variety and age of enset plant may have contributed to the variation in ME content of enset
corm. The ME value of enset corm obtained in this study justifies its potential in substituting
energy value of cereals such as maize in the diets of layers. The phosphorus content of enset
corm was lower than that of the other feed ingredients used in this study. The calcium and
phosphorous contents of the treatment diets are shown to be within the recommended values for
layers.
Production performance
The mean daily DM intake of the group placed on T1 was significantly lower (P<0.05) than the
group placed on T2, T3 and T4. On the contrary, there was no significant difference (P>0.05)
between the groups fed with the latter three treatments (Table 4). The higher mean daily DM
intake of groups of layers fed T2, T3 and T4 indicates that the inclusion of 6.5%, 13% and 20%
of enset corm to replace maize in layers ration is acceptable and palatable. Consistent to the
current result, Ngiki et al. (2014) reported increasing trends of feed intake with increasing levels
of cassava root meal as substitute for maize. A linear increase of DM intake was observed in
sheep consumed supplement containing graded levels of enset corm as a replacement to maize in
83

Nigussu Fekade et al, /Eth. J. Anim. Prod. 16(1)-2016:77-92
the ration (Ajebu and Eik, 2014). Afolaya et al. (2013) reported significantly lower feed intake
for layers fed with ration consisting up to 20% sweet potato diet as a replacement for maize. On
the other hand, Ajebu et al. (2015) noted similar feed intake for broiler chicks fed with 0%, 33%,
67% and 100% kocho diets substituting maize. Raphael et al. (2013) also reported that
replacement of maize with cassava root meal has similar effect on DM intake in laying hens.
Table 4: Feed intake, body weight change and egg laying performance of white leghorn hens
fed graded levels of enset corm
Treatments
Variables T1 T2 T3 T4 SEM
DM intake (g/hen/d) 119.1b 124.9
a 126.1 a 124.4
a 1.31
Initial body weight (kg) 1.11 1.10 1.11 1.12 0.01
Final body weight (kg) 1.71 1.68 1.67 1.65 0.01
Average daily gain (g/head) 7.14 6.90 6.67 6.31 1.31
Hen-day egg production (%) 42.50 43.40 44.40 42.20 0.65
Egg mass (g/hen/day) 20.90 21.70 20.30 19.60 0.81
Egg weight (g) 49.50 50.70 49.60 51.90 0.67
FCR (g of feed DM/g of eggs) 2.60 2.70 2.50 2.70 0.03
Mortality rate (%) 5.10 6.70 6.70 5.10 1.85 a,b Means within a row with different superscripts differ (p<0.05);T1 = 0% enset corm; T2 = 6.5% enset
corm; T3 = 13% enset corm; T4 = 20% enset corm as a partial replacement to maize; SEM = Standard
Error of the Mean; FCE= Feed conversion efficiency
Average daily gain, HDEP, egg mass, egg weight, feed conversion efficiency and mortality rate
were not different (P > 0.05) among treatments. Absence of significant variation in hen-day egg
production in the present study indicates that inclusion of enset corm diet up to 20% as a partial
replacement for maize could be used to support the nutrient requirements of layers. Similarly,
Smith (2003) observed up to 50% replacement of maize in the ration by cassava root meal show
similar effect on egg laying performance. Saentaweesuk et al. (2000) noted that total substitution
of maize by cassava in layers ration did not affect production performances. However, Anaeto
and Adighibe (2015) observed decreasing trends in HDEP of layer fed with an increasing level
(0%, 25%, 50%, 75% and 100%) of cassava root meal diets replacing maize. Senkoylu et al.
(2005) noted that cassava tuber meal inclusion above 50% reduced egg production and egg
quality as compared to maize based ration. On the other hand, Akinola and Oruwari (2007) noted
increased egg production as the level of cassava tuber meal substituted 100% of the maize.
Ladokun et al. (2007) also showed higher HDEP for layers that consumed 50% sweet potato
meal rations compared with diets containing only maize. Mortality rate was similar for hens fed
84
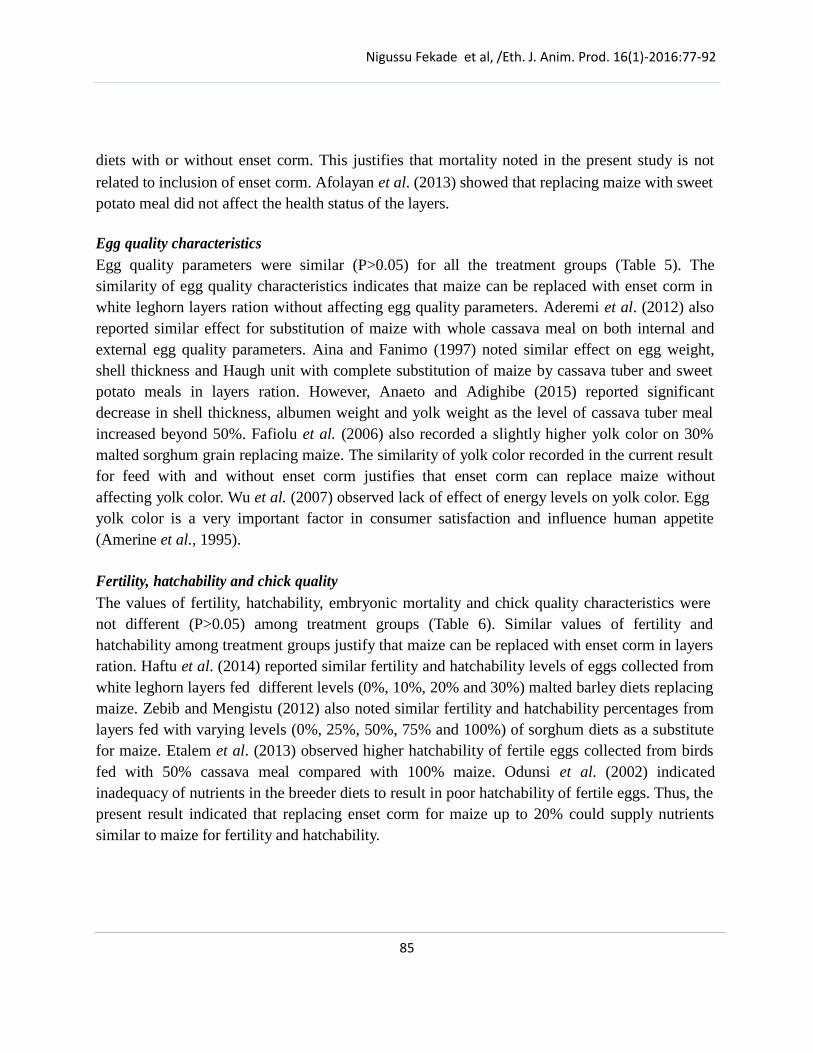
Nigussu Fekade et al, /Eth. J. Anim. Prod. 16(1)-2016:77-92
diets with or without enset corm. This justifies that mortality noted in the present study is not
related to inclusion of enset corm. Afolayan et al. (2013) showed that replacing maize with sweet
potato meal did not affect the health status of the layers.
Egg quality characteristics
Egg quality parameters were similar (P>0.05) for all the treatment groups (Table 5). The
similarity of egg quality characteristics indicates that maize can be replaced with enset corm in
white leghorn layers ration without affecting egg quality parameters. Aderemi et al. (2012) also
reported similar effect for substitution of maize with whole cassava meal on both internal and
external egg quality parameters. Aina and Fanimo (1997) noted similar effect on egg weight,
shell thickness and Haugh unit with complete substitution of maize by cassava tuber and sweet
potato meals in layers ration. However, Anaeto and Adighibe (2015) reported significant
decrease in shell thickness, albumen weight and yolk weight as the level of cassava tuber meal
increased beyond 50%. Fafiolu et al. (2006) also recorded a slightly higher yolk color on 30%
malted sorghum grain replacing maize. The similarity of yolk color recorded in the current result
for feed with and without enset corm justifies that enset corm can replace maize without
affecting yolk color. Wu et al. (2007) observed lack of effect of energy levels on yolk color. Egg
yolk color is a very important factor in consumer satisfaction and influence human appetite
(Amerine et al., 1995).
Fertility, hatchability and chick quality
The values of fertility, hatchability, embryonic mortality and chick quality characteristics were
not different (P>0.05) among treatment groups (Table 6). Similar values of fertility and
hatchability among treatment groups justify that maize can be replaced with enset corm in layers
ration. Haftu et al. (2014) reported similar fertility and hatchability levels of eggs collected from
white leghorn layers fed different levels (0%, 10%, 20% and 30%) malted barley diets replacing
maize. Zebib and Mengistu (2012) also noted similar fertility and hatchability percentages from
layers fed with varying levels (0%, 25%, 50%, 75% and 100%) of sorghum diets as a substitute
for maize. Etalem et al. (2013) observed higher hatchability of fertile eggs collected from birds
fed with 50% cassava meal compared with 100% maize. Odunsi et al. (2002) indicated
inadequacy of nutrients in the breeder diets to result in poor hatchability of fertile eggs. Thus, the
present result indicated that replacing enset corm for maize up to 20% could supply nutrients
similar to maize for fertility and hatchability.
85

Nigussu Fekade et al, /Eth. J. Anim. Prod. 16(1)-2016:77-92
Table 5: Egg quality characteristics of white leghorn hens fed graded levels of enset corm
Treatments
Egg quality parameters T1 T2 T3 T4 SEM
Sample egg weight (g) 52.25 51.81 51.78 50.43 0.33
Egg length (mm) 55.3 57.5 54.3 55.5 1.32
Egg width (mm) 40.6 40.4 40.2 40.5 0.01
Egg shape index 73.17 70.87 73.4 72.99 1.46
Egg shell weight (g) 5.59 5.56 5.71 6.07 0.06
Egg shell thickness (mm) 0.31 0.31 0.32 0.33 0.002
Egg albumen weight (g) 31.09 30.33 30.20 30.07 0.24
Albumen height (mm) 7.84 7.31 7.36 7.92 0.17
Haugh unit 89.48 87.46 91.70 89.80 1.15
Egg yolk weight (g) 15.47 15.43 15.38 14.98 0.24
Egg yolk height (mm) 15.35 15.16 15.40 14.8 0.17
Egg yolk diameter (mm) 49.2 47.7 48.0 49.2 0.05
Egg yolk index 0.31 0.32 0.32 0.30 0.03
Yolk color (RSF*) 3.4 3.3 2.83 2.9 0.13
Means within a row with different superscripts differ (p<0.05); T1 = 0% enset corm; T2 = 6.5% enset
corm; T3 = 13% enset corm; T4 = 20% enset corm as a partial replacement to maize; *RSP = Roche
scale points; SEM = Standard error of the mean
The absence of statistically significant difference in embryonic mortalities between treatment
groups justifies that enset corm could replace maize without affecting embryonic development.
Zebib and Mengistu (2012) observed similar levels of embryonic mortality for birds fed with
different levels (0%, 25%, 50%, 75% and 100%) of sorghum diets replacing maize in white
leghorn layers ration. Similarly, Mihret and Mengistu (2012) noted lack of effect on embryonic
mortalities in layers fed varying levels (0%, 25%, 50%, 75% and 100%) of dried cassava tuber
meal diets replacing maize. On the other hand, Etalem et al. (2013) reported lower early and
mid-embryonic mortalities for layers fed with 50% cassava root chips as a substitute for maize as
compared to the group fed ration based on maize as a major energy diet.
Abiola et al. (2008) documented positive correlation between egg size and chick weight at
hatching. Similarly, Mihret and Mengistu (2012) reported positive correlation of chick weight
and length for birds fed with cassava tuber meal as a substitute for maize. Accordingly, the
similarity in chick weight between all the treatment groups could be attributed to the similarity
of egg weight among the treatment groups. Moreover, it may show that replacing maize with
enset corm does not affect chick development and all ration consisted sufficient amount of
86
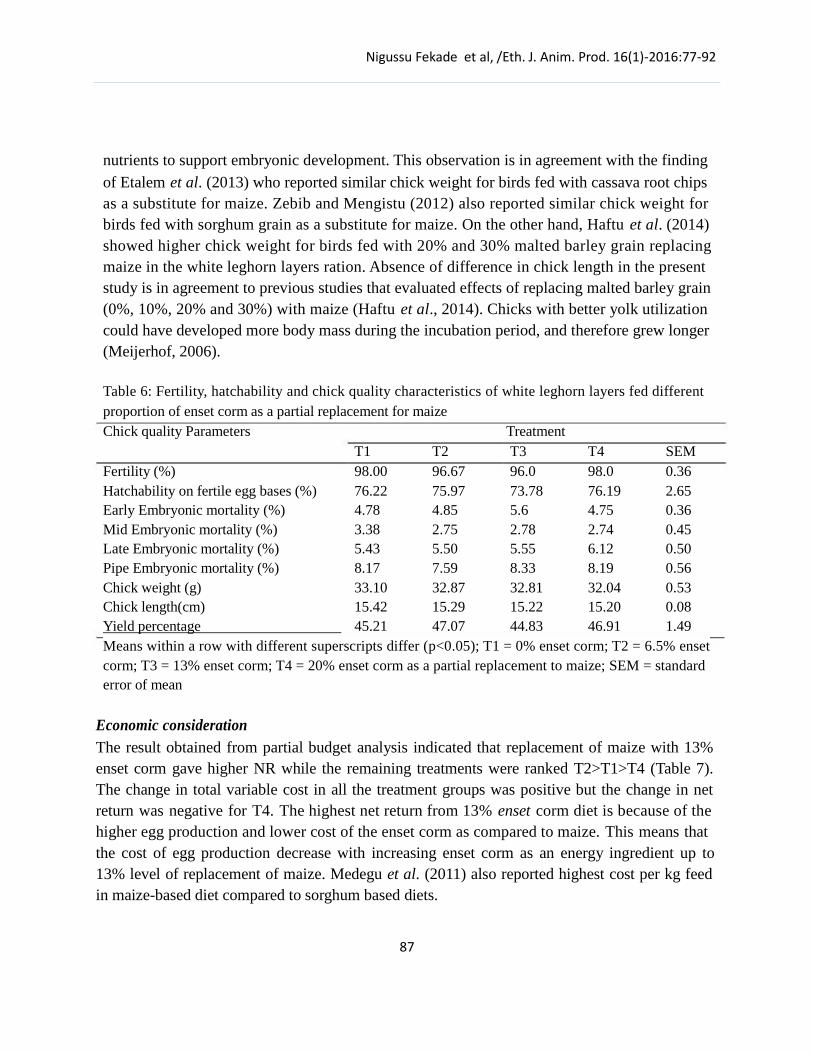
Nigussu Fekade et al, /Eth. J. Anim. Prod. 16(1)-2016:77-92
nutrients to support embryonic development. This observation is in agreement with the finding
of Etalem et al. (2013) who reported similar chick weight for birds fed with cassava root chips
as a substitute for maize. Zebib and Mengistu (2012) also reported similar chick weight for
birds fed with sorghum grain as a substitute for maize. On the other hand, Haftu et al. (2014)
showed higher chick weight for birds fed with 20% and 30% malted barley grain replacing
maize in the white leghorn layers ration. Absence of difference in chick length in the present
study is in agreement to previous studies that evaluated effects of replacing malted barley grain
(0%, 10%, 20% and 30%) with maize (Haftu et al., 2014). Chicks with better yolk utilization
could have developed more body mass during the incubation period, and therefore grew longer
(Meijerhof, 2006).
Table 6: Fertility, hatchability and chick quality characteristics of white leghorn layers fed different
proportion of enset corm as a partial replacement for maize
Chick quality Parameters Treatment
T1 T2 T3 T4 SEM
Fertility (%) 98.00 96.67 96.0 98.0 0.36
Hatchability on fertile egg bases (%) 76.22 75.97 73.78 76.19 2.65
Early Embryonic mortality (%) 4.78 4.85 5.6 4.75 0.36
Mid Embryonic mortality (%) 3.38 2.75 2.78 2.74 0.45
Late Embryonic mortality (%) 5.43 5.50 5.55 6.12 0.50
Pipe Embryonic mortality (%) 8.17 7.59 8.33 8.19 0.56
Chick weight (g) 33.10 32.87 32.81 32.04 0.53
Chick length(cm) 15.42 15.29 15.22 15.20 0.08
Yield percentage 45.21 47.07 44.83 46.91 1.49
Means within a row with different superscripts differ (p<0.05); T1 = 0% enset corm; T2 = 6.5% enset
corm; T3 = 13% enset corm; T4 = 20% enset corm as a partial replacement to maize; SEM = standard
error of mean
Economic consideration
The result obtained from partial budget analysis indicated that replacement of maize with 13%
enset corm gave higher NR while the remaining treatments were ranked T2>T1>T4 (Table 7).
The change in total variable cost in all the treatment groups was positive but the change in net
return was negative for T4. The highest net return from 13% enset corm diet is because of the
higher egg production and lower cost of the enset corm as compared to maize. This means that
the cost of egg production decrease with increasing enset corm as an energy ingredient up to
13% level of replacement of maize. Medegu et al. (2011) also reported highest cost per kg feed
in maize-based diet compared to sorghum based diets.
87
Nigussu Fekade et al, /Eth. J. Anim. Prod. 16(1)-2016:77-92
Table 7: Economics of feeding graded levels of enset corm
Treatments
Total cost T1 T2 T3 T4
Total feed consumed/ head (kg) 10.4 11.0 10.9 11.1
Total feed cost/head (birr) 62.6 67.5 68.4 70.7
Total Variable Cost(feed cost) (birr) 62.6 67.5 68.4 70.7
∆TVC (birr) - 4.9 5.8 8.6
Total revenue
Total number of egg produced/hen 38.0 43.0 44.0 38.0
Total Return (TR)(birr) 95.0 107.5 110.0 95.0
∆TR (birr) - 12.5 15 0
Net Return( NR) (birr) 32.4 40.0 41.6 24.3
∆NR (birr) - 7.6 9.2 -8.1
MRR (%) - 1.55 1.58 -0.94
∆TVC = Change in Total Variable Cost; TR= Total Return; ∆TR= Change in Total Return; NR=Net
Return; ∆NR=Change in Net Return; MRR = Marginal Rate of Return; Birr= Ethiopia‟s unit of
currency: US $ 1.00= Birr 22.00; Egg sale = 2.5 birr/egg; T1 = 0% enset corm; T2 = 6.5% enset corm;
T3 = 13% enset corm; T4 = 20% enset corm as a partial replacement to maize
Conclusion
The dry matter intake was the highest for layers fed with the treatment ration containing 20%
enset corm diet. However, egg quality parameters, fertility, hatchability and chick quality were
similar for layers fed with the treatment ration containing 0%, 6.5%, 13% and 20% enset corm as
a substitute for maize in layers diet. The net return gained from the inclusion of 13% enset corm
to replace 30% of maize was more economical in terms of egg production and feed cost.
Therefore, due to the year round availability and easy access by smallholder farmers in enset
growing areas of Ethiopia, enset corm could safely and economically used in replacing about
30% of maize in layers ration.
Acknowledgement
The Authors would like to express their deepest gratitude to the Ministry of Education,
Haramaya University research office and Assosa University for financial support.
88
Nigussu Fekade et al, /Eth. J. Anim. Prod. 16(1)-2016:77-92
References
Abdullah, R.B., Embong, W.K. and Soh, H.H. 2011. Biotechnology in animal production in
developing countries. Proceedings of the 2nd International Conference on Agricultural and
Animal Science, Pp: 88-91.
Abiola, S.S., Afolabi, A.O. and Dosunmu, O.J. 2008. Hatchability of chickens eggs as influenced
by turning frequency in hurricane lantern incubator. Africa Journal of Biotechnology, 7
(23): 4310-4313.
Aderemi, F. A., Adenowo, T.K. and Oguntunji, A.O. 2012. Effect of Whole Cassava Meal on
Performance and Egg Quality Characteristics of Layers. Journal of Agricultural Science, 4
(2):195-200.
Adugna Tolera. 2008. Feed Resource and Feeding Management. A manual for feed operators
and development workers. Ethiopia sanitary and phyto-sanitary standards and livestock
and meat marketing program (SPS-LMM). Addis Ababa, Ethiopia, Pp:38.
Afolayan, S.B., Dafwang, I.I., Sekoni, A. and Jegede, J.O. 2013. Effect of Dietary Maize
substitution with sweet potato meal on performance of growers (10-12 weeks) and
subsequent egg production (23-35 weeks). Asian Journal of Poultry Science, 7(2): 55-64.
Aina, A.B.J. and Fanimo, A. O. 1997. Substitution of Maize with Cassava and Sweet Potato
Meal as the Energy Source in the Rations of Layer Birds. Journal of Tropical Agricultural
Science, 20 (2): 163-167.
Ajebu Nurfeta., Abebash kebede and Aster Abebe. 2015. Evaluation of Replacement Value of
Maize with Kocho on the Growth Performance and Carcass Characteristics of Broiler
Hubbard Chickens. Journal of Science and Development, 3 (1):35-43.
Ajebu Nurfeta and Eik, L.O. 2014. Assessment of different levels of enset (Ensete ventricosum)
corm as an energy supplement in sheep fed a basal diet of Rhodes grass hay, Hawasa,
Ethiopia. Tropical Animal Health and Production, 46:905–911.
Ajebu Nurfeta, Adugna Tolera, Eik, L.O. and Sundstøl, F. 2008. Yield and mineral content of ten
enset (Ensete ventricosum) varieties. Tropical Animal Health and Production, 40: 299-
309.
Akinola, L.A.F., Oruwari, B.M. 2007. Response of laying hens to total dietary replacement of
maize with cassava. Nigerian Journal of Animal Production, 34(2): 196-202.
Amerine, M.A., Pangborn, R.M. and Roessler, E.B. 1995. Principles of Sensory Evaluation of
Food. Academic Press, New York.
Anaeto, M. and Adighibe, L.C. 2015. Cassava root meal as substitute for maize in layers ration.
Brazilian Journal of Poultry Science, 13: 153-156.
AOAC. 2000. Association of Official Analytical Chemists, 16th ed. Official Methods of Analysis
of AOAC International, Virginia. USA.
89

Nigussu Fekade et al, /Eth. J. Anim. Prod. 16(1)-2016:77-92
AOAC (Association of Official Analytical Chemist).1998. Official Methods of Analysis,
16thEdition, Washington, DC.
Atawodi, S. E., Mari, D., Atawodi, J. C. and Yahaya, Y. 2008. Assessment of Leucaena
leucocephala leaves as feed supplement in laying hens. Africa Journal of Biotechnology, 7
(3): 317-321.
Bonnier, P and Kasper, H. 1990. Hatching Eggs by Hens or in an Incubator. Agrodok No. 34.
Agromisa, Wageningen. 39p.
CSA (Central Statistical Agency). 2014. Agricultural sample survey Volume II.
StatisticalBulletin No. 505. CSA, Addis Ababa, Ethiopia.
Etalem Tesfaye, Getachew Animut, Mengistu Urge and Tadelle Dessie. 2013. Cassava Root
Chips and Moringa oleifera Leaf Meal as Alternative Feed Ingredients in Layers Ration.
International Journal Poultry Science, 12 (5): 298-306.
Fafiolu, A. O., Oduguwa, O.O., Ikeobi, C. O. N. and Onwuka, C. F. I. 2006. Utilization of
malted sorghum sprout in the diet of rearing pullets and laying hen. Animal Archive, (55)
212: 361-371.
Gura, S. 2008. Industrial livestock production and its impact on smallholders in developing
countries. Consultancy report to the League for Pastoral Peoples and Endogenous
Livestock Development (www.pastoralpeoples.org), Germany.
Haftu Kebede, Mengistu Urge and Kefelegn Kebede. 2014. Effect of replacing maize with
malted barley grain on fertility, hatchability, embryonic mortality and chick quality of
white leghorn layers. Global Journal of Poultry Farming and Vaccination, 2 (3):121-125.
Haugh, R.R. 1937. The Haugh unit for measuring egg quality. U.S. Egg Poultry Magazine, 43:
552-553,572-573. .
Hunton, P. 1995. Egg production, processing and marketing. World Poultry Science, Elsevier,
Tokyo. 457-480p.
Ladokun, O.A., Aderemi, F.A. and Tewe, O.O. 2007. Sweet potato as feed resource for layer
production in Nigeria. African Crop Science Conference Proceedings, 8: 585-588.
Lakhotia, R.L. 2002. Poultry Eggs. Agro bios (India). Jodhbur. 342p.
Leeson, S. and Summers, J.D. 2005. Commercial Poultry Nutrition. 3rd ed. Nottingham
University Press, Canada. 398p.
Medegu, C. I., Raji, A. O., Igwebuike, J. U. and Barwa, E. 2011. Alternative cereal grains and
cereal by-products as sources of energy in poultry diets. Research Opinions in Animal and
Veterinary Sciences, 1(8): 530-542.
Meijerhof, R. 2006. Chick size matters. World Poultry Science, 22:30–31.
Meijerhof, R. 2005. What counts for chick quality? Hybro B.V P.O. Box 30, 5830 AA, Boxmeer,
Netherlands.
90
Nigussu Fekade et al, /Eth. J. Anim. Prod. 16(1)-2016:77-92
Mihret Aregy and Mengistu Urge. 2012. Effect of substituting maize with sundried and ground
Cassava tuber on egg production, quality, fertility and hatchability of white leghorn hens.
MSc. thesis. Haramaya University, Ethiopia.
Mohammed Beyan, Gabel, M. and Karlsson, L.M. 2013. Nutritive values of the drought tolerant
food and fodder crop enset. Africa Journal of Agricultural Research, 8 (20): 2327-2333.
Molenaar, R. I., Reijrink, R., Meijerhof and Van den Brand, H. 2009. Relationship between
hatchling length and weight on later productive performance in broilers. Hatch Tech B. V.,
adaptation Physiology Group, Wageningen University, 6700 AH Wageningen, The
Netherlands.
Ngiki, Y.U., Igwebuike, J.U., Morupp, S.M. 2014. Effect of replacing maize with cassava root-
leaf meal mixture on the performance of broiler chickens. International Journal of Science
and Technology, 3(6): 352-362.
Odunsi, A.A., Ogunleke, M.O., Alagbe, O.S. and Ajani, T.O. 2002. Effect of feeding Gliricidia
Sepium leaf meal on the performance and egg quality of layers. International Journal of
Poultry Science, (1):26-28.
Penda, P.C. 1996. Shape and texture. In: Text book on egg and poultry Technology, PP.57.
Raphael, K.J., Kouabena, K., Herve, M.K., Alexis, T., Yacouba, M. 2013. Effect of substituting
maize with cassava root meal on laying performances of local barred-chicken under
improved management conditions in Cameroon. Livestock Research and Rural
Development, 25(10).
Saentaweesuk, S., Kanto, U., Juttupornpong, S. and Harinsut, P. 2000. Substitution of cassava
meal for corn in layer diets. In: Proceedings of the 38th Kasetsart University Conference,
Kasetsart University, Bangkok, Thailand, 1-4 February, 2000.
Samuel Sahle. 2008. The epidemiology and management options of chocolate spot disease
(Botrytis fabae sard) on Faba bean (Vicia faba L.) in Northern Ethiopia. PhD Dissertation,
Haramaya University, Ethiopia. 175p.
Senkoylu, N., Samli, H. E., Akyurek, H., Agma, A. and Yasar, S. 2005. Use of high levels of
full-fat soybeans in laying hen diets. Journal of Applied Poultry Research, 14:32-37.
Smith, H. 2003. Cassava as substitute for cereals in livestock rations. Available from:
htttp://www.rada.gov.jm/hidden-menu-items/item/665-cassava-as-a-substitute-for-cereal-
in-livestock-rations.
SAS (Statistical Software System). 2009. SAS User’s Guide, Statistics. SAS Institute, Inc., Cary,
NC. USA.
Tadelle Dessie, Nigussie Dana, Alemu Yami and Peters, K.J. 2002. The feed resource base and
its potentials for increased poultry production in Etiopia. World Poultry Science Journal,
58: 77-87.
91
Nigussu Fekade et al, /Eth. J. Anim. Prod. 16(1)-2016:77-92
Tekalign Yirgu, Etalem Tesfaye, Getinet Assefa. 2017. Poultry Feed Resources and Coping
Mechanisms of Challenges in Sidama Zone, Southern Ethiopia. Food Science and Quality
Management, 60:77-87.
Upton, M. 1979. Farm Management in Africa, the Principal of Production and Planning, Oxford
University Press, p.380.
Wiseman, J., 1987. Feeding of Non-Ruminant Livestock. Butter worth and C. Ltd. p.370.
Wu, G, Bryant, M.M., Gunawardana, P., Roland, D.A. 2007. Effect of nutrient density on
performance, egg components, egg solids, egg quality, and profits in eight commercial
leghorn strain during phase I. Poultry Science, 86:691-697.
Zebib Abisa and Mengistu Urge. 2012. Effects of substituting sorghum for maize on egg
production, quality, fertility and hatchability of white leghorn layers. MSc. thesis.
Haramaya University, Ethiopia.
Information for Contributors
General
Ethiopia is one of the countries endowed with a large number and diverse livestock
resources. The spectacular land formation, ranging from mountain chains with peaks of over 4500 m asl to areas below sea level, has created diverse climatic conditions with variable agro-ecological zones and rich biodiversity. This unique variability has afforded the country for the evolution and development of different agricultural production systems. Different species and breeds of livestock have been domesticated and used for various purposes. The different production systems and the economic and social roles that livestock play in the livelihood of millions of smallholder farmers is substantial. The proper exploitation of this large number and diverse livestock resource in the country has remained a great challenge to all professionals engaged in livestock production. This has also afforded a number of national and international organizations a great opportunity to undertake research and development activities to ensure proper utilization and conservation of these resources.
In order to co-ordinate such efforts and to streamline the research and development
agenda, The Ethiopian Society of Animal Production (ESAP) has been operational since its establishment in 1985. ESAP has created opportunities for professionals and associates to present and discuss research results and other relevant issues on livestock. Currently, ESAP has a large number of memberships from research, academia, and the development sector. So far, ESAP has successfully organised about 10 annual conferences and the proceedings have been published. The ESAP Newsletter also provides opportunities to communicate recent developments and advancements in livestock production, news, views and feature articles. The General Assembly of the Ethiopian Society of Animal Production (ESAP), on it‟s 7th Annual Conference on May 14, 1999, has resolved that an Ethiopian Journal of Animal Production (EJAP) be established. The Journal is intended to be the official organ of ESAP.
The Ethiopian Journal of Animal Production (EJAP) welcomes reports of original
research data or methodology concerning all aspects of animal science. Study areas include genetics and breeding, feed resources and nutrition, animal health, farmstead structure, shelter and environment, production (growth, reproduction, lactation, etc), products (meat, milk, eggs, etc), livestock economics, livestock production and natural resources management. In addition the journal publishes short communications, critical review articles, feature articles, technical notes and correspondence as deemed necessary.
Objectives
• To serve as an official organ of the Ethiopian Society of Animal Production
(ESAP).
• Serve as a media for publication of original research results relevant to
animal production in Ethiopia and similar countries and contribute to global knowledge
• To encourage and provide a forum for publication of research results to
scientists, researchers and development workers in Ethiopia
Columns of the Journal
Each publication shall include some or all of the following columns.
Research articles
Research articles based on basic or applied research findings with relevance to tropical and sub-tropical livestock production. Short communications Short communications are open to short preliminary reports of important findings; normally not more than 2000 words. They may contain research results that are complete but characterized by a rather limited area or scope of investigation, description of new genetic materials, description of new or improved techniques including data on performance. They should contain only a few references, usually not more than five and a minimum number of illustrations (not more than one table or figure). Abstract should not be more than 50 words. Review articles Review papers will be welcomed. However, authors considering the submission of review papers are advised to consult the Editor-in-Chief in advance. Topical and timely short pieces, news items and view points, essays discussing critical issues can be considered for publication Feature articles Feature articles include views and news on the different aspects of education, curricula, environment, etc will be considered for publication after consulting the Editor-in-Chief. Areas for consideration include education, society, indigenous knowledge, etc. Technical notes Technical notes relate to techniques and methods of investigation (field and laboratory) relevant to livestock production. Notes should be short, brief and should not exceed one page. Correspondence Letters on topics relevant to the aims of the Journal will be considered for publication by the Editor-in-Chief, who may modify them. Frequency of publication Once a year (May)

Guidelines to Authors
General
The Ethiopian Journal of Animal Production (EJAP) publishes original articles of
high scientific standard dealing with livestock and livestock related issues. Reviews on selected topics on livestock research and development appropriate to Ethiopia and other similar countries will also be considered for publication. Short communication and technical notes are also welcome.
Manuscripts should be written in English, double spaced throughout and should be on
one side of an A4 sheet. Authors are advised to strictly stick to the format of the journal. Submit three copies of manuscript and each page should be numbered. An electronic form in Word format should also accompany the manuscript. The disk should be clean from viruses, and should be labelled clearly with the authors‟ names and disk file name. Manuscripts submitted to the Editorial Office will be duly acknowledged. All articles will be sent to at least two reviewers (within or outside the country) selected by the Editorial Board and will be reviewed for relevance to the journal, scientific value and technicality. Rejected papers will be returned to the author(s) immediately. Accepted papers will be returned to the author with the comments of the reviewer(s) for further improvement of the manuscript. EJAP has no page charge.
Proofs will be sent to the author. Typeset proofs are not checked for errors. Thus, it is
the responsibility of the primary author of each paper to review page proofs carefully for accuracy of citations, formulae, etc. and to check for omissions in the text. It is imperative that the authors do a prompt, thorough job of reviewing the returned proofs to ensure timely publication. Authors are instructed to return the proofs to the Editorial Office within 15 (fifteen) days of receipt. Senior or corresponding authors will be provided with 25 (twenty-five) offprints free of charge for each published articles.
Format for Manuscripts
Research paper should be as concise as possible and should not exceed 6000 words or
about 10 to 12 pages including illustrations and tables. Papers should be partitioned into sections including abstract, introduction, materials and methods, results, discussion, acknowledgements and references. Main text headings should be centered and typed in capitals. Sub-headings are typed in capitals and small letters starting from left hand margin.
Headings: Title of the paper should be in upper and lower case. Main headings should
be in upper and lower case, centre.
Sub-headings: First sub-headings, flush left, separate line, capitalize main words;
second sub-headings- flush left, same line as text, capitalize first word, followed by period; third sub-heading – flush left, same line as text, capitalize first word, italics followed by a dash.
Title: The title should be concise, specific and descriptive enough to contain key words
or phrases including the contents of the article. A short running title of less than 50 characters should also be suggested.

Author and institution: The name(s) of author(s) and the institution(s) with which they are affiliated, along with the addresses, should be provided. Corresponding author should be identified in case of more than one author.
Abstract: Research or applied articles should have an abstract of no more than 300
words. The abstract should state concisely the goals, methods, principal results and major conclusions of the paper. Incomplete and uninformative descriptions should not be used. The use of acronyms is discouraged. Keywords of up to five words should be included.
Introduction: This part should be brief and limited to the statement of the problem or
the aim of the experiment, justification and a review of the literature pertinent to the problem.
Materials and methods: The techniques and procedures of the research, the conditions
under which the study was conducted and the experimental design are described under this heading. Relevant details about the animal should be given and the statistical design should be described briefly and clearly. Data should be analyzed and summarized by appropriate statistical methods; authors should examine closely their use of multiple comparison procedures. A measure of variability, e.g., standard deviation or standard error must be provided when reporting quantitative data. If standard methods of investigation and analysis are employed appropriate citation suffice.
Results: The summary of major findings and assessments of the investigation are given
in this section. The results can be presented using tables, illustrations and diagrams.
Tables: Tables are numbered consecutively in arabic numerals (e.g., Table 1) and
should bear a short, yet adequately descriptive caption. Avoid using vertical and/or horizontal grid lines to separate columns and/or rows. Metric units are clearly to be shown, abbreviated in accordance with international procedure. Footnotes to tables are designated by lower case which appear as superscripts in appropriate entries. Tables should be compatible with column width viz. 140 mm, and should be presented on separate sheets, and grouped together at the end of the manuscript. Their appropriate position in the text should be indicated and all tables should be referenced to in the text.
Illustrations and diagrams: These should be inserted into the text using any suitable
graphics programmes. Freehand or typewritten lettering and lines are not acceptable. Authors are requested to pay attention to the proportions of the illustrations so that they can be accommodated in the paper without wastage of space. Figures: Figures should be restricted to the display of results where a large number of values are presented and interpretation would be more difficult in a Table. Figures may not reproduce the same data as Tables. Originals of figures should preferably be A4 size, of good quality, drawn or produced on good quality printer and saved in a separate file. There should be no numbering or lettering on the originals. Numbering and lettering, which must be kept to an absolute minimum, should be legibly inserted on the copies. Vertical axes should be labelled vertically. A full legend, describing the figure and giving a key to all the symbols on it, should be typed on a separate sheet. The symbols preferred are: ▲,■ ○ ∎, but + and x signs should be avoided. Figures should be numbered consecutively in arabic numerals (e.g., Figure 1), and refer to all figures
in the text.
Photographs: Should be original prints and suitable for reproduction. They should be
unmounted with lettering clearly indicated on overlays or photocopies. For composites, photographs should be unmounted and a photocopy enclosed to indicate the required measurement. Magnification should be given in the legend or indicated by a scale or bar. They should be numbered as part of the sequence of Figures. If several plates or coloured photographs are submitted, the authors may be asked to the cost of reproducing them.
Discussion: The reliability of evidence (result), comparison with already recorded
observations and the possible practical implication is discussed.
Conclusion: Authors are encouraged to forward conclusion (two to three brief
statements) from the study summarising the main findings and indicating the practical implications of the findings.
Acknowledgements: Should be briefly stated following the conclusion.
References: Cite references by name and date. The abbreviation et al should be
used in the text where more than two authors are quoted. Personal communications and unpublished work should be cited in the text only, giving the initials, name and date. They should not appear in the list of references. All references should be listed alphabetically. References should be selected based on their relevance and the numbers should be kept to a minimum. Journal names should be abbreviated according to the World list of Scientific Periodicals.
Ethiopian names should be in direct order, i.e., the full first name followed by the
father‟s name and should not be abbreviated. E.g. Zinash Sileshi and not Sileshi, Z. (Tesfu Kassa and Azage Tegegne, 1998).
(Alemu Yami and Kebede Abebe, 1992; Alemu Gebre Wold and Azage Tegegne, 1995;
Zinash et al., 1996) – Chronologically
According to Zinash Sileshi and Siyoum Bediye (1995)
Where more than two authors are quoted in the text: - Zinash Sileshi et al. (1990)
or (Zinash Sileshi et al., 1990). However, all authors‟ names should be given in the Reference list.
Examples
Journal article:
Zerbini, E., Takele Gemeda, Azage Tegegne, Alemu Gebrewold and Franceschini,
R. 1993. The effects of work and nutritional supplementation on postpartum reproductive activities and progesterone secretion in F1 crossbred dairy cows in Ethiopia. Theriogenology 40(3):571-584.
Crosse, S., Umunna, N.N., Osuji, P.O., Azage Tegegne, Khalili, H. and Abate Tedla.
1998. Comparative yield and nutritive value of forages from two cereal-legume based cropping systems: 2. Milk production and reproductive performance of

crossbred (Bos taurus x Bos indicus) cows. Tropical Agriculture 75 (4):415-421.
Book
Steel, R.G.D. and Torrie, J.H. 1960. Principles and Procedures of Statistics. McGraw-
Hill Book Co., Inc., New York.
Chapter in a Book
Zerbini, E., Takele Gemeda, Alemu Gebre Wold and Azage Tegegne. 1995. Effect
of draught work on the metabolism and reproduction of dairy cows. In: Philips, C.J.C. (ed.), Progress in Dairy Science. Chapter 8. CAB International. pp. 145- 168.
Paper in Proceedings
Alemu Gebre Wold, Mengistu Alemayhu, Azage Tegegne, E. Zerbini and C. Larsen.
1998. On-farm performance of crossbred cows used as dairy-draught in Holetta area. Proceedings of the 6th National Conference of the Ethiopian Society of Animal Production (ESAP), May 14-15, 1998, Addis Ababa, Ethiopia, pp. 232- 240.
Papers based on Theses
Papers based on theses should be presented with the thesis advisor as co-author and should indicate the institution, the year the work was done, and the full title of the thesis as a footnote. Abbreviations Follow standard procedures. Units All measurements should be reported in SI units. (e.g., g, kg, m, cm)

Table 1. The following are examples of SI units for use in EJAP
Quantity Application Unit Symbol or
expression of
unit
Absorption Balance trials Grams per day g d-1 Activity Enzyme Micromoles per minute
per gram μmol min-1 g-1
Area Land
Carcass Hectare Square centimetre
Ha cm2
Backfat Carcass Millimetres Mm Concentration Diet
Blood Percent Gram per kilogram
International unites per kilogram
Milligram per 100 mL
% g kg-1 IU kg-1 Mg dL-1
Mequiv L-1
Milliequivalents per litre
Density Feeds Kilogram per hectolitre Kg hL-1 Flow Digesta
Blood Grams per day Milligrams per minute
g d-1 mg min-1
Growth rate Animal Kilogram per day
Grams per day
Intake Animal Kilograms per day
Grams per day
Grams per day per kg
bodyweight0.75
Metabolic rate Animal Megajoules per day
Watts per kg bodyweight
Kg d-1 g d-1
Kg d-1
g d-1 g d-1 kg-0.75
MJ d-1
W kg-1
Pressure Atmosphere Kilopascal KPa
Temperature Animal Kelvin or degree Celsius K or oC
Volume Solutions Litre L
Millilitre ML
Yield Milk production Litres per day L d-1
Radioactivity Metabolism Curie or Becquerel Ci (=37 GBq)
Units with two divisors should be written with negative indices (e.g., kg ha-1 yr-1). The use of solidus (/) should be reserved for units written in full (e.g., mole/kilogram) or
to separate a physical quantity and unit (e.g., yield/ha). Units should be chosen so that
the numeric component falls between 1 and 10 or 1 and 100 when using one or two significant figures, respectively (e.g., use 31.2 mg than 0.0312 g).

Membership to the Ethiopian Society of Animal Production
(ESAP)
Membership advantages
Some of the personal benefits afforded to active members of the Ethiopian Society of
Animal Production (ESAP) include the following:
• A convenient means of keeping up-to-date on current scientific and production
developments;
• An avenue for personal involvement in fostering high standards and
professional developments in Animal Science;
• To receive a printed copy of the Ethiopian Journal of Animal Production
(EJAP);
• Receiving copies of the Society‟s newsletter, Membership Directory, and
advanced registration information for national meetings;
• Eligibility to present abstracts at national meetings and to submit manuscripts
for publication in the Ethiopian Journal of Animal Production (EJAP);
• Eligibility to provide personal leadership to the field of animal science by
serving on the Executive Committee of the society or by accepting other society assignments; and
• Eligibility to be selected for prestigious society-sponsored awards
Eligibility for membership
Membership is open to individuals interested in research, instruction or extension in Animal Science or associated with the production, processing, marketing and distribution of livestock and livestock products.
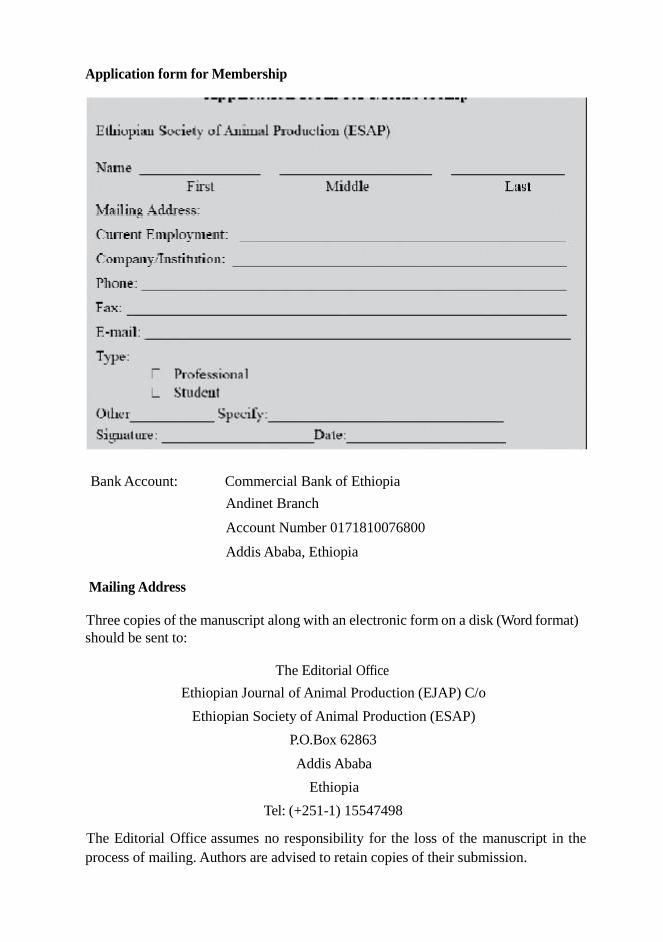
Application form for Membership
Bank Account: Commercial Bank of Ethiopia
Andinet Branch
Account Number 0171810076800
Addis Ababa, Ethiopia
Mailing Address Three copies of the manuscript along with an electronic form on a disk (Word format)
should be sent to:
The Editorial Office
Ethiopian Journal of Animal Production (EJAP) C/o
Ethiopian Society of Animal Production (ESAP)
P.O.Box 62863
Addis Ababa
Ethiopia
Tel: (+251-1) 15547498
The Editorial Office assumes no responsibility for the loss of the manuscript in the
process of mailing. Authors are advised to retain copies of their submission.

Subscription and Communications
Information to Subscribers
Subscription rates for one year (one issue), including airmail, are as follows
Local Foreign
Institution:
Individuals:
50 (Birr)
25 (Birr)
25 (US$)
10 (US$)
All business correspondences about subscriptions, back issues, single copies, change of address
and claims for missing issues should be sent to:
The Editor-in-Chief EJAP Editorial Office
C/o ESAP Office P.O.Box 62863
Addis Ababa; Ethiopia;
Tel: (+251-1) 15547498
Dr. Getachew Gebru (MARIL, Ethiopia), President
Dr. Girma Abebe (LMD), Vice President
Dr. Daniel Temesgen (PFE), Secretary
Dr. Kefena Iffa (EIAR), Editor – in Chief
Dr. Million Tadesse (EIAR), Finance
W/O Bogalech Siyoum (A.A Urban Agriculture) Member
Dr. Gebreyohannes Berhane (Policy Study Research Center) Editor
Dr. Sisay Tilahun (EIAR) Public Relation
Ato Taddesse Sori (MoLF) Member
Dr. Ammanuael Assefa (Consultant), Partnership & Funding

Related Documents