FINAL REPORT AUGUST 2020 Ethiopia Population-based HIV Impact Assessment EPHIA 2017-2018 The mark "CDC" is owned by the US Dept. of Health and Human Services and is used with permission. Use of this logo is not an endorsement by HHS or CDC of any particular product, service or enterprise.

Welcome message from author
This document is posted to help you gain knowledge. Please leave a comment to let me know what you think about it! Share it to your friends and learn new things together.
Transcript
FINAL REPORTAUGUST 2020
Ethiopia Population-based HIV Impact Assessment EPHIA 2017-2018
The mark "CDC" is owned by the US Dept. of Health and Human Services and is used with permission. Use of this logo is not an endorsement by HHS or CDC of any particular product, service or enterprise.
2 | Ethiopia Population-based HIV Impact Assessment (EPHIA) 2017-2018
EPHIA 2017-2018 COLLABORATING INSTITUTIONSEthiopian Public Health Institute (EPHI) in collaboration with the Federal HIV/AIDS Prevention and Control Office (FHAPCO)The United States President’s Emergency Plan for AIDS Relief (PEPFAR)The United States Centers for Disease Control and Prevention (CDC)Central Statistics Agency, EthiopiaEthiopian Public Health Association (EPHA)Westat ICAP at Columbia University
DONOR SUPPORT AND DISCLAIMERThis project is supported by the U.S. President’s Emergency Plan for AIDS Relief (PEPFAR) through CDC under the terms of cooperative agreement award # 1U2GGH001226. The findings and conclusions in this report are those of the authors and do not necessarily represent the official position of the funding agencies.
SUGGESTED CITATIONEthiopian Public Health Institute (EPHI). Ethiopia Population-based HIV Impact Assessment (EPHIA) 2017-2018: Final Report. Addis Ababa: EPHI; August 2020.
DESIGN AGENCYPhoenix Design Aid A/S
ACCESS THIS REPORT ONLINEEPHIA Project: http://www.ephi.gov.etThe PHIA Project: http://phia.icap.columbia.edu
CONTACT INFORMATIONEthiopian Public Health InstituteP.O. Box-1242Addis AbabaEthiopia
Ethiopia Population-based HIV Impact Assessment (EPHIA) 2017-2018
TABLE OF CONTENTS | 3
LIST OF TABLES AND FIGURES ................................................................................................ 7GLOSSARY OF TERMS ............................................................................................................... 10LIST OF ABBREVIATIONS .......................................................................................................... 12FOREWORD ................................................................................................................................ 13EXECUTIVE SUMMARY .............................................................................................................. 15
1 INTRODUCTION ........................................................................................................... 20 1.1 Background ................................................................................................................... 21 1.2 Overview of EPHIA 2017-2018 ...................................................................................... 21 1.3 Aim ................................................................................................................................. 22
2 SURVEY DESIGN, METHODS, AND RESPONSE RATES ............................................. 23 2.1 Sample Frame and Design ............................................................................................ 24 2.2 Eligibility Criteria, Recruitment, and Consent Procedures .......................................... 25 2.3 Survey Implementation ................................................................................................. 26 2.4 Field-Based Biomarker Testing ..................................................................................... 28 2.5 Laboratory-Based Biomarker Testing ........................................................................... 30 2.6 Data Processing and Analysis ....................................................................................... 34 2.7 Response Rates ............................................................................................................. 35 2.8 References ..................................................................................................................... 37
3 SURVEY HOUSEHOLD CHARACTERISTICS ............................................................... 38 3.1 Key Findings .................................................................................................................. 38 3.2 Background ................................................................................................................... 39 3.3 Household Composition ............................................................................................... 39 3.4 Prevalence of HIV-Affected Households ..................................................................... 42
4 SURVEY RESPONDENT CHARACTERISTICS .............................................................. 46 4.1 Key Findings .................................................................................................................. 46 4.2 Background ................................................................................................................... 47 4.3 Demographic Characteristics of the Adult Population ................................................ 47 4.4 Demographic Characteristics of the Pediatric Population .......................................... 49
TABLE OF CONTENTS
4 | Ethiopia Population-based HIV Impact Assessment (EPHIA) 2017-2018
5 HIV INCIDENCE IN ADULTS ......................................................................................... 50 5.1 Key Findings .................................................................................................................. 50 5.2 Background ................................................................................................................... 52 5.3 HIV Incidence Among Adults ....................................................................................... 52 5.4 Gaps and Unmet Needs ................................................................................................ 54 5.5 References ..................................................................................................................... 54
6 HIV PREVALENCE IN ADULTS ...................................................................................... 55 6.1 Key Findings .................................................................................................................. 55 6.2 Background ................................................................................................................... 56 6.3 Adult HIV Prevalence by Age and Sex ......................................................................... 56
6.4 Adult HIV Prevalence by Other Demographic Characteristics ................................... 58
7 HIV TESTING ................................................................................................................. 65 7.1 Key Findings .................................................................................................................. 65 7.2 Background ................................................................................................................... 66
7.3 Self-Reported HIV Testing Among Adults ................................................................... 66
8 HIV DIAGNOSIS AND TREATMENT ............................................................................. 75 8.1 Key Findings .................................................................................................................. 75 8.2 Background ................................................................................................................... 76 8.3 Self-Reported Diagnosis and Treatment Status Among HIV-Positive Adults ............ 76 8.4 Concordance of Self-Reported Treatment Status Versus Laboratory ARV Data ....... 83 8.5 Gaps and Unmet Needs ................................................................................................ 85 8.6 References ..................................................................................................................... 85
9 VIRAL LOAD SUPPRESSION ........................................................................................ 86 9.1 Key Findings .................................................................................................................. 86 9.2 Background ................................................................................................................... 87 9.3 Adult Viral Load Suppression by Age and Sex ............................................................. 87 9.4 Adult Viral Load Suppression by Other Demographic Characteristics ....................... 89 9.5 Adult Viral Load Suppression by Region ...................................................................... 92 9.6 Gaps and Unmet Needs ................................................................................................ 93
10 PROGRESS TOWARDS 90-90-90 TARGETS ................................................................. 94 10.1 Key Findings .................................................................................................................. 94 10.2 Background ................................................................................................................... 95 10.3 Status of the UNAIDS 90-90-90 Targets ..................................................................... 95 10.4 Gaps and Unmet Needs ................................................................................................ 101 10.5 References ..................................................................................................................... 101
TABLE OF CONTENTS | 5
11 CLINICAL PERSPECTIVES ON PEOPLE LIVING WITH HIV ........................................ 102 11.2 Background ................................................................................................................... 103 11.3 CD4 Counts and Immunosuppression .......................................................................... 103 11.4 Late HIV Diagnosis ........................................................................................................ 107 11.5 Self-Reported Retention on Antiretroviral Therapy ..................................................... 110 11.6 Transmitted Resistance to Antiretroviral Drugs ........................................................... 115 11.7 HIV Subtype .................................................................................................................. 115 11.8 Gaps and Unmet Needs ................................................................................................ 116 11.9 References ..................................................................................................................... 116
12 PREVENTION OF MOTHER-TO-CHILD TRANSMISSION ........................................... 117 12.1 Key Findings .................................................................................................................. 117 12.2 Background ................................................................................................................... 118 12.3 Antenatal Care Attendance .......................................................................................... 118 12.4 Breastfeeding ................................................................................................................ 121 12.5 Awareness of Mother’s HIV Status ............................................................................... 121 12.6 Antiretroviral Therapy Among HIV-Positive Pregnant Women ................................... 124 12.7 Mother-to-Child Transmission ...................................................................................... 124 12.8 Gaps and Unmet Needs ................................................................................................ 124 12.9 References ..................................................................................................................... 124
13 ADOLESCENTS AND YOUNG ADULTS ....................................................................... 125 13.1 Key Findings .................................................................................................................. 125 13.2 Background ................................................................................................................... 126 13.3 Sex Before the Age of 15 Years ..................................................................................... 126 13.4 Knowledge About HIV Prevention ............................................................................... 129 13.5 Discriminatory Attitudes Towards People Living with HIV .......................................... 133 13.6 HIV Incidence and Prevalence ...................................................................................... 134 13.7 HIV Testing, Treatment, and Viral Load Suppression ................................................... 134 13.8 Status of the 90-90-90 Targets .................................................................................... 134 13.9 Gaps and Unmet Needs ................................................................................................ 135 13.10 References .................................................................................................................... 135
14 CHILDREN ..................................................................................................................... 136 14.1 Key Findings .................................................................................................................. 136 14.2 Background ................................................................................................................... 137 14.3 HIV Prevalence .............................................................................................................. 137 14.4 HIV Treatment and Viral Load Suppression.................................................................. 137 14.5 Status of the UNAIDS 90-90-90 Targets ..................................................................... 137
6 | Ethiopia Population-based HIV Impact Assessment (EPHIA) 2017-2018
15 HIV RISK BEHAVIORS ................................................................................................... 139 15.1 Key Findings .................................................................................................................. 139 15.2 Background ................................................................................................................... 140 15.3 HIV Prevalence by Sexual Behavior .............................................................................. 140 15.4 Condom Use at Last Sex with a Non-Marital, Non-Cohabitating Partner ................. 141 15.5 Male Circumcision ......................................................................................................... 149 15.6 Gaps and Unmet Needs ................................................................................................ 152
16 TUBERCULOSIS, SYPHILIS, HBV, STI SYMPTOMS, AND CERVICAL
CANCER SCREENING .................................................................................................. 153 16.1 Key Findings .................................................................................................................. 153 16.2 Background ................................................................................................................... 154 16.3 Tuberculosis ................................................................................................................... 154 16.4 Syphilis Prevalence among HIV-Positive Persons ........................................................ 155 16.5 Hepatitis B Prevalence Among HIV-Positive Persons ................................................. 158 16.6 Self-Reported Symptoms and Diagnosis of Sexually Transmitted Infection ............... 161 16.7 Self-Reported Cervical Cancer Screening Among HIV-Positive Women ................... 167 16.8 Gaps and Unmet Needs ................................................................................................ 169 16.7 References ..................................................................................................................... 169
DISCUSSION AND CONCLUSIONS .................................................................................... 171
APPENDIX A SAMPLE DESIGN AND WEIGHTING .............................................................. 173APPENDIX B HIV TESTING METHODOLOGY ....................................................................... 177APPENDIX C ESTIMATES OF SAMPLING ERRORS .............................................................. 187APPENDIX D SURVEY INVESTIGATORS AND CONTRIBUTORS ....................................... 200APPENDIX E HOUSEHOLD QUESTIONNAIRE ..................................................................... 203APPENDIX F ADULT QUESTIONNAIRE ................................................................................. 225APPENDIX G YOUNG ADOLESCENT QUESTIONNAIRE .................................................... 261APPENDIX H SURVEY CONSENT FORMS ............................................................................ 276
LIST OF TABLES AND FIGURES | 7
2 SURVEY DESIGN, METHODS, AND RESPONSE RATES .......................................................... 23
Table 2.1.A Distribution of sampled enumeration areas and households, by region ..................24 Figure 2.4.A Household-based HIV testing algorithm, EPHIA 2017-2018 ....................................29 Figure 2.5.A HIV-1 recent infection testing algorithm (LAg/VL algorithm), EPHIA 2017-2018 ........................................................................................................32 Figure 2.5.B HIV-1 recent infection testing algorithm (LAg/VL/ARV algorithm), EPHIA 2017-2018 ........................................................................................................33 Table 2.7.A Household response rates .........................................................................................35 Table 2.7.B Interview and blood draw response rates..................................................................36
3 SURVEY HOUSEHOLD CHARACTERISTIC ..............................................................................38 Table 3.3.A Household composition .............................................................................................39 Table 3.3.B Household population by age, sex, and residence .................................................. 40 Figure 3.3.A Distribution of the de facto population by sex and age, EPHIA 2017-2018 ............ 40 Table 3.3.C Distribution of the de facto household population, by 5-year age group, sex ........ 41 Figure 3.3.B Household population by age, sex, and residence, EPHIA 2017-2018 .....................42 Table 3.4.A Prevalence of HIV-affected households ....................................................................42 Table 3.4.B HIV-affected households by number of HIV-positive members ..............................43 Table 3.4.C Prevalence of households with an HIV-positive head of household .........................43 Figure 3.4.A Prevalence of HIV-affected households by residence, EPHIA 2017-2018 ................44 Figure 3.4.B HIV-affected households by number of HIV-positive members and residence EPHIA 2017-2018 ........................................................................................................44 Figure 3.4.C Prevalence of households with an HIV-positive head of household by sex, EPHIA 2017-2018 ........................................................................................................45
4 SURVEY RESPONDENT CHARACTERISTICS .........................................................................46 Table 4.3.A Demographic characteristics of the adult population ..............................................47 Table 4.4.A Demographic characteristics of the pediatric population ....................................... 50
5 HIV INCIDENCE ........................................................................................................................50 Table 5.3.A Annual HIV incidence using the limiting antigen (LAg) avidity plus viral load algorithm ....................................................................................................................53 Table 5.3.B Annual HIV incidence using the limiting antigen (LAg) avidity plus viral load (VL) plus antiretroviral detection algorithm ......................................................................53 Table 5.3.C People living with HIV and number of new HIV infections per year incorporating antiretroviral detection into the recent infection algorithm .....................................54
6 HIV PREVALENCE IN ADULTS ................................................................................................. 55 Table 6.3.A HIV prevalence by age and sex.................................................................................. 57 Figure 6.3.A HIV prevalence by age and sex, EPHIA 2017-2018 ...................................................58 Table 6.4.A HIV prevalence by demographic characteristics: Ages 15-64 years .........................59 Table 6.4.B HIV prevalence by demographic characteristics: Ages 15-49 years ......................... 61 Figure 6.4.A HIV prevalence by marital status: Ages 15-64 years, EPHIA 2017-2018 ...................63 Figure 6.5.A HIV prevalence among adults aged 15-64 years, by region, EPHIA 2017-2018 (map) .............................................................................................64
LIST OF TABLES AND FIGURES
8 | Ethiopia Population-based HIV Impact Assessment (EPHIA) 2017-2018
Figure 6.5.B HIV prevalence among adults aged 15-64 years, by region, EPHIA 2017-2018 (bar graph) ....................................................................................64
7 HIV TESTING ............................................................................................................................ 65 Table 7.3.A Self-reported HIV testing: Men ................................................................................67 Table 7.3.B Self-reported HIV testing: Women ...........................................................................70 Table 7.3.C Self-reported HIV testing: Total ................................................................................ 72 Figure 7.3.A Proportion of adults who self-reported having received an HIV test in the 12 months before the survey, by age and sex, EPHIA 2017-2018 .................................. 74
8 HIV DIAGNOSIS AND TREATMENT ........................................................................................ 75 Table 8.3.A HIV treatment status: Men ........................................................................................ 77 Table 8.3.B HIV treatment status: Women ...................................................................................79 Table 8.3.C HIV treatment status: Total ........................................................................................ 81 Figure 8.3.A Proportion of HIV-positive adults aged 15-64 years reporting awareness of HIV status and antiretroviral therapy (ART) status, by age and sex, EPHIA 2017-2018 . 83 Table 8.4.A Concordance of self-reported treatment status versus presence of antiretrovirals (ARVs): Men .............................................................................................................. 84 Table 8.4.B Concordance of self-reported treatment status versus presence of antiretrovirals (ARVs): Women ......................................................................................................... 84 Table 8.4.C Concordance of self-reported treatment status versus presence of antiretroviral (ARVs): Total ...............................................................................................................85
9 VIRAL LOAD SUPPRESSION ................................................................................................... 87 Table 9.3.A Viral load suppression by age (5-year age groups) .................................................. 88 Table 9.3.B Viral load suppression by age (10-15-year age groups) ........................................... 89 Figure 9.3.A Proportion of viral load suppression (<1000 copies/mL) among adults living with HIV, by age and sex, EPHIA 2017-2018 .................................................................... 89 Table 9.4.A Viral load suppression by demographic characteristics ........................................... 90 Figure 9.5.A Viral load suppression (<1000 copies/mL) among HIV-positive adults aged 15-64, by region, EPHIA 2017-2018(map) .............................................................................92 Figure 9.5.B Viral load suppression (<1000 copies/mL) among HIV-positive adults aged 15-64, by region, EPHIA 2017-2018 (bar graph) ...................................................................93
10 PROGRESS TOWARDS 90-90-90 TARGETS ............................................................................94 Table 10.3.A Adult 90-90-90 (self-reported antiretroviral [ARV] therapy [ART] status and laboratory ARV data; unconditional percentages) ...................................................97 Table 10.3.B Adult 90-90-90 (self-reported antiretroviral [ARV] therapy [ART] status and laboratory ARV data; conditional percentages) ...................................................... 98 Table 10.3.C Adult 90-90-90 (self-reported antiretroviral [ARV] therapy [ART] status and laboratory ARV data; unconditional percentages for regions) ............................... 99 Figure 10.3.A Adult 90-90-90 (adjusted for laboratory antiretroviral data among adults aged 15-64 years), EPHIA 2017-2018 .................................................................................101
11 CLINICAL PERSPECTIVES ON PEOPLE LIVING WITH HIV ..................................................102 Table 11.3.A Median CD4 count and prevalence of immunosuppression ................................... 104
LIST OF TABLES AND FIGURES | 9
Figure 11.3.A CD4 count distribution among HIV-positive adults aged 15-64 years, by antiretroviral therapy status, EPHIA 2017-2018 ....................................................... 107 Table 11.4.A Late HIV diagnosis ...................................................................................................108 Table 11.5.A Self-reported retention on antiretroviral therapy (ART): People initiating ART LESS THAN 12 months prior to the survey ..............................................................110 Table 11.5.B Self-reported retention on antiretroviral therapy (ART): People initiating ART MORE THAN 12 months prior to the survey ............................................................ 113 Table 11.6.A Resistance to antiretrovirals ...................................................................................... 115 Table 11.7.A HIV subtype .............................................................................................................. 115
12 PREVENTION OF MOTHER-TO-CHILD TRANSMISSION ..................................................... 117 Table 12.3.A Antenatal care ........................................................................................................... 119 Table 12.4.A Breastfeeding status by child’s age and mother’s HIV status .................................. 121 Table 12.5.A Prevention of mother-to-child transmission, known HIV status ..............................122
13 ADOLESCENTS AND YOUNG ADULTS .................................................................................125 Table 13.3.A Sex before the age of 15 years ..................................................................................127 Table 13.4.A Young adolescents’ knowledge about HIV: Boys .................................................... 130 Table 13.4.B Young adolescents’ knowledge about HIV: Girls ..................................................... 131 Table 13.4.C Young adolescents’ knowledge about HIV: Total .................................................... 132 Table 13.5.A Discriminatory attitudes towards people living with HIV ....................................... 133 Figure 13.8.A Young people 90-90-90 (laboratory ARV-adjusted data among young people aged 15-24 years), EPHIA 2017-2018....................................................................... 135
14 CHILDREN ............................................................................................................................136 Table 14.5.A Pediatric 90-90-90 (based on parent-reported antiretroviral therapy [ART] data; conditional percentages) ......................................................................................... 138 Table 14.5.B Pediatric 90-90-90 (parent-reported antiretroviral therapy [ART] data and antiretroviral laboratory data; conditional percentages) ........................................ 138
15 HIV RISK BEHAVIORS .............................................................................................................139 Table 15.3.A HIV prevalence by sexual behavior .......................................................................... 140 Table 15.4.A Condom use at last sex with a non-marital, non-cohabitating partner: Men ........ 142 Table 15.4.B Condom use at last sex with a non-marital, non-cohabitating partner: Women ... 145 Table 15.4.C Condom use at last sex with a non-marital, non-cohabitating partner: Total .........147 Table 15.5.A Male circumcision ..................................................................................................... 150
16 TUBERCULOSIS, SYPHILIS, HBV, STI SYMPTOMS, AND CERVICAL CANCER SCREENING ............................................................................................................153
Table 16.3.A HIV testing in a clinic for tuberculosis (TB) diagnosis or treatment ........................155 Table 16.3.B Self-reported tuberculosis (TB) diagnosis and treatment among HIV-positive adults .........................................................................................................................155 Table 16.4.A Syphilis prevalence ................................................................................................... 156 Table 16.5.A Hepatitis B prevalence ............................................................................................. 159 Table 16.6.A Other sexually transmitted infections: Men ............................................................ 162 Table 16.6.B Other sexually transmitted infections: Women ....................................................... 165 Table 16.7.A Cervical Cancer Screening Among HIV-Positive Women .......................................167
10 | Ethiopia Population-based HIV Impact Assessment (EPHIA) 2017-2018
90-90-90: An ambitious set of targets to help end the AIDS epidemic. By 2020, 90% of all people living with HIV will know their status; 90% of all people diagnosed with HIV will receive antiretroviral therapy (ART); and 90% of all people receiving ART will achieve viral load (VL) suppression (VLS).
Acquired Immunodeficiency Syndrome (AIDS): AIDS is a disease that can develop after HIV infection causes severe damage to the immune system, leaving the body vulnerable to life-threatening conditions, such as infections and cancer.
Adolescents: This report defines young adolescents as children aged 10-14 years, and older adolescents as individuals aged 15-19 years. (Note: Older adolescents are included among young people [ages 15-24 years] and are also treated as part of the overall adult population for reporting purposes.)
Adults: Unless otherwise noted, for the purposes of this report, adults are defined as the population aged 15-64 years.
Antiretroviral (ARV): A type of medication used in the treatment of HIV.
Antiretroviral Therapy (ART): Treatment with antiretroviral (ARV) drugs that inhibit the ability of HIV to multiply in the body, leading to improved health and survival among HIV-positive persons.
CD4+ T-Cells: CD4+ T-cells (CD4) are white blood cells (lymphocytes) that are an essential part of the human immune system. These cells are often referred to as T-helper cells. HIV attacks and kills CD4 cells, leaving the body vulnerable to a wide range of infections. The CD4 count is used to determine the degree of weakness of the immune system from HIV infection.
Children: Defined in this survey as the population of individuals 0-14 years of age.
De Facto Household Resident: A person who slept in the household the night prior to the survey.
Enumeration Area (EA): A limited geographic area defined by the national statistical agency and the primary sampling unit for the Population-based HIV Impact Assessment (PHIA) surveys, including EPHIA.
Head of Household: The person who is recognized within the household as being the head and is aged 18 years and older or is considered an emancipated minor (less than the age of 18 years who is married or is free from any legally competent representative as defined by law in Ethiopia).
Human Immunodeficiency Virus (HIV): HIV is the virus that causes AIDS. The virus is passed from person to person through blood, semen, vaginal fluids, and breast milk. HIV attacks CD4 cells in the body, leaving people living with HIV vulnerable to illnesses a healthy immune system would have eliminated.
HIV Incidence: A measure of the frequency with which new cases of HIV occur in a population over a period of time. The denominator is the population at risk; the numerator is the number of new cases that occur during a given time period.
HIV Prevalence: The proportion of persons in a population who are living with HIV at a specific point in time. The denominator is the total population; the numerator is the number of persons living with HIV.
GLOSSARY OF TERMS
GLOSSARY OF TERMS | 11
HIV Viral Load (VL): The concentration of HIV virus particles in the blood, usually expressed as copies per milliliter (mL).
HIV Viral Load Suppression (VLS): An HIV VL of less than 1,000 copies per mL.
Household: A person or group of persons related or unrelated to each other who live in the same compound (fenced or unfenced), share the same cooking arrangements, and have one person whom they identify as head of that household.
Informed Consent: Informed consent is a legal condition whereby a person can give consent based upon a clear understanding of the facts, implications, and future consequences of an action. In order to give informed consent, the individual concerned must have adequate reasoning faculties and be in possession of all relevant facts at the time he or she gives consent.
Male Circumcision: Male circumcision is the removal of some or the entire foreskin (prepuce) from the penis. Medically supervised adult male circumcision is a scientifically proven method for reducing a man’s risk of acquiring HIV infection through heterosexual intercourse.
Prevention of Mother-To-Child-Transmission (PMTCT) of HIV: Activities to prevent an HIV-positive woman passing HIV to her baby during pregnancy, labor, delivery, or while breastfeeding. The World Health Organization (WHO) recommends effective PMTCT to include a four-fold approach: (1) primary prevention of HIV infection among women of childbearing age; (2) preventing unintended pregnancies among women living with HIV; (3) preventing HIV transmission from women living with HIV to their infants; and (4) providing appropriate treatment, care, and support to mothers living with HIV, their children, and families.
Sexually Transmitted Infections (STI): STIs are infections transmitted through person-to-person sexual contact. They are sometimes called sexually transmitted diseases.
Syphilis: Syphilis is a curable STI caused by a bacterium, Treponema pallidum. Syphilis can be transmitted to the fetus during pregnancy or to the infant during delivery.
Tuberculosis (TB): TB is a contagious bacterial disease that spreads through the air and is the leading cause of death among people living with HIV in Africa.
Urban (Large and Small): Urban areas include all geographic areas classified as urban by the Ethiopia’s 2007 National Population and Housing Census. According to the census, urban referred to all capitals of regions, zones, and woredas (an administrative unit similar to a district), and it also included localities with urban kebeles (kebeles are similar to wards) where inhabitants are primarily engaged in non-agricultural activities. A large urban area was defined as having a population of more than 50,000 residents, while a small urban area was defined as having a population of 50,000 or less.
Young Adults: Unless otherwise noted, this report defines young adults as individuals aged 20-24 years.
Young People: Defined in this survey as the population of individuals aged 15-24 years.
12 | Ethiopia Population-based HIV Impact Assessment (EPHIA) 2017-2018
LIST OF ABBREVIATIONS
AIDS Acquired Immunodeficiency Syndrome
ANC Antenatal Care
ART Antiretroviral Therapy
ARV Antiretroviral
CDC U.S. Centers for Disease Control and Prevention
CD4 CD4+ T-cell
CI Confidence Interval
DBS Dried Blood Spot
EA Enumeration Area
EID Early Infant Diagnosis
EPHA Ethiopian Public Health Association
EPHI Ethiopian Public Health Institute
EIA Enzyme Immunoassay
EPHIA Ethiopia Population-based HIV Impact Assessment
FMOH Federal Ministry of Health
HBTC Home-Based Testing and Counseling
HBV Hepatitis B Virus
HIV Human Immunodeficiency Virus
HPV Human Papillomavirus
ID Identification Number
IPV Intimate Partner Violence
IQR Interquartile Range
LAg Limiting Antigen
mL Milliliter
µL Microliter
MDRI Mean Duration of Recent Infection
MTCT Mother-to-Child Transmission
NNRTIs Non-Nucleoside Reverse Transcriptase Inhibitors
NRTI Nucleoside Reverse Transcriptase Inhibitors
ODn (normalized) Optical Density
PCR Polymerase Chain Reaction
PEPFAR U.S. President’s Emergency Plan for AIDS Relief
PFR Percentage False Recent
PHIA Population-based HIV Impact Assessment
PMTCT Prevention of Mother-to-Child Transmission
POC Point of Care
QA Quality Assurance
QC Quality Control
RR Response Rate
RRC Results Returning Coordinator
SMS Short Message Service
STI Sexually Transmitted Infection
TB TuberculosisTWG UNAIDS
Technical Working GroupJoint United Nations Programme on HIV and AIDS
VL Viral Load
VLS Viral Load Suppression
VMMC Voluntary Medical Male Circumcision
WHO World Health Organization
FOREWORD | 13
FOREWORD
Despite historic progress responding to the epidemic, HIV has remained an issue of public health concern in Ethiopia—particularly in urban areas of the country. According to the 2016 Ethiopia Demographic and Health Survey, the estimated national HIV prevalence rate among adults (15-49 years) was 0.9%, but the prevalence varied by sex, age, geography, and socio-economic status. Most notably, HIV prevalence was found to be markedly higher in urban areas (2.9%) than in rural areas (0.4%).* Despite our persistent efforts to halt the epidemic, HIV transmission appeared to continue in the country, particularly among the urban population.
Consequently, our country implemented a public health approach to service delivery, which, in recent years, has included the rapid expansion in the number of facilities providing antiretroviral (ARV) therapy (ART). We have embraced the Joint United Nations Programme on HIV and AIDS (UNAIDS) 90-90-90 targets, which, in addition to improving health outcomes among people living with HIV, should lead to an increase in viral load suppression (VLS) among the HIV-positive population. It was anticipated that our service delivery public health approach would, in turn, reduce HIV incidence in Ethiopia and move the country closer to control of the HIV epidemic. Nevertheless, we needed evidence to measure our progress and to provide high-quality data on VLS, HIV prevalence, risk behaviors, and morbidity—particularly in urban areas of the country—to support our program management decisions and policy formulation.
It is therefore, with great pleasure, that we present the results from the Ethiopia Population-based HIV Impact Assessment (EPHIA), a household-based national survey in urban Ethiopia, conducted between October 2017 and April 2018. EPHIA offered home-based testing and counseling (HBTC) with return of results and collected information about uptake of HIV care and treatment services. This survey was the first in Ethiopia to measure HIV incidence, VLS prevalence, pediatric HIV prevalence, CD4 count distribution, presence of ARV drugs in blood, and transmitted HIV drug resistance among the urban population.
EPHIA was led by the government of Ethiopia through the Ethiopian Public Health Institute (EPHI) with technical assistance from the United States Centers for Disease Control and Prevention (CDC). The survey was implemented by ICAP at Columbia University in collaboration with local partners, including Federal HIV/AIDS Prevention and Control Office (FHAPCO), the Central Statistical Agency, and the Ethiopian Public Health Association (EPHA).
While HIV incidence is low, we need to bring it to zero. The evidence provided by EPHIA suggests some of the key areas where our efforts should be focused: There is a major gap in diagnosis among young people and adult men. There is even a failure to consistently test for HIV in tuberculosis (TB) diagnosis or treatment clinics, where it is the national policy to test anyone not already aware of their HIV-positive status. We also need to develop interventions to support adherence and improve rates of VLS among young people. In addition, two-thirds of sexually active adults continue to practice unprotected sex with non-marital, non-cohabitating partners—and the uptake of medical male circumcision remains too low in some regions of the country.
*Central Statistical Agency (CSA) [Ethiopia] and ICF. 2018. Ethiopia Demographic and Health Survey 2016: HIV Report. Addis Ababa, Ethiopia, and Rockville, Maryland, USA: CSA and ICF; 2018.
14 | Ethiopia Population-based HIV Impact Assessment (EPHIA) 2017-2018
Ebba Abate (Dr.)Director General Ethiopian Public Health Institute
Finally, we need to scale up interventions to improve the health and well-being of people living with HIV—including fostering an environment where they feel it is safe to disclose their HIV-positive status.
It is our hope that the biologic and behavioral data from EPHIA will be used by program planners to tailor interventions to these underserved populations—and improve the effectiveness of our service delivery models.
We would like to acknowledge the efforts of the national and international organizations in the planning and implementation of the survey and in writing this report. Most of all, we would like to thank our dedicated field staff and all the participants who shared their time and data for the benefit of our nation.
FOREWORD (Continued)

CONTENT | 15
EXECUTIVE SUMMARY
16 | Ethiopia Population-based HIV Impact Assessment (EPHIA) 2017-2018
BACKGROUND: The Ethiopia Population-based HIV Impact Assessment (EPHIA) was a household-based national survey in urban Ethiopia. EPHIA focused on measuring key biological endpoints to provide direct estimates of HIV infection, risk, and burden as well as the effectiveness and population-level impact of the HIV-related prevention, care and treatment interventions implemented in urban areas of the country. Its primary objective was to estimate the national and subnational HIV viral load (VL) suppression (VLS) (defined as less than 1,000 copies per milliliter [mL]) among adults (defined as those aged 15-64 years in this survey) living with HIV. In addition, EPHIA measured the national- and subnational-level prevalence of HIV, the annual HIV incidence among adults, CD4 counts, antiretroviral (ARV) drugs in blood, transmitted HIV drug resistance, pediatric HIV and VLS prevalence, prevalence of syphilis and hepatitis B in adults, and progress toward the 90-90-90 targets as defined by the Joint United Nations Programme on HIV/AIDS (UNAIDS). The survey also collected information on behaviors associated with HIV acquisition and transmission, common HIV co-morbidities, and other health conditions.
METHODS:The survey used a two-stage, stratified cluster sample design, in which census enumeration areas (EA)(clusters) were selected in the first stage and households in the second stage. The sample was stratified by nine regional states: Tigray, Afar, Amhara, Oromia, Somali, Benishangul Gumuz, SNNPR, Gambella, and Harari, and two city administrations: Addis Ababa, and Dire Dawa. Data collection was conducted from the beginning of October 2017 to the end of April 2018. EPHIA provided home-based testing and counseling (HBTC) with return of results and point-of-care (POC) CD4 counts for those who were HIV positive. Central laboratory procedures included HIV VL testing, HIV DNA polymerase chain reaction (PCR) for infant virological testing and for confirmation of status of those who self-reported an HIV-positive status but tested negative in HBTC, testing for recent HIV infection, and ARV drug resistance testing.
HIV VL results were returned to participants through health facilities of their choice. The estimates in EPHIA were weighted for sample selection probabilities and were adjusted for nonresponse and noncoverage. The key findings of EPHIA are:
RESULTS: RESPONSE RATES• The survey was administered to 10,529 out of 11,581 eligible households. Of 12,618 eligible
women and 8,920 eligible men, 96.1% of eligible women and 89.6% of eligible men were interviewed, and among these, 95.2% of women and 93.6% of men also had their blood drawn and tested for HIV.
• Of 5,536 eligible children (defined as the population aged 0-14 years in this survey), 85.4% were tested for HIV.
• The overall response rates for adults was 80.8%; 83.6% for women, 76.8% for men. The overall response rate for children was 77.6%.
EXECUTIVE SUMMARY | 17
ANNUAL HIV INCIDENCE AND HIV PREVALENCE • In urban Ethiopia, based upon the ARV-adjusted recent infection algorithm, the annual HIV
incidence was 0.05% (corresponding to approximately 6,000 new cases) among adults in 2017-2018.
• In urban Ethiopia, HIV prevalence was 3.0% among adults in 2017-2018, which corresponds to approximately 384,000 persons living with HIV. HIV prevalence was the highest (14.7%) among widowed adults and the lowest (1.0%) among those who had never married. HIV prevalence among women was significantly higher than among men at ages 25-29, 30-34, and 35-39 years. HIV prevalence was 0.9% in older adolescents (those aged 15-19 years) (1.0% in boys, 0.7% in girls) and 0.6% in young adults (those aged 20-24 years) (0.3% in young men, 0.9% in young women). This corresponds to approximately 32,000 HIV-positive young people (older adolescents and young adults aged 15-24 years) in urban Ethiopia. Prevalence of HIV infection among children in urban Ethiopia was 0.3%, corresponding to approximately 19,000 HIV-positive children in urban Ethiopia. The burden of adult HIV infection varies across regions in urban areas. HIV prevalence among adults ranged from 0.8% in Somali to 5.7% in Gambella.
• In urban Ethiopia, 5.1% of the households had at least one HIV-positive member (4.6% in small [population ≤50,000 individuals] and 5.5% in large [population >50,000 individuals] urban areas).
• In urban Ethiopia, 4.2% of the households are headed by an HIV-positive person (5.8% of the female-headed and 2.3% of the male-headed households).
HIV TESTING• In Ethiopia, 69.8% of the urban adult population had ever tested for HIV and received their
results (73.0% of women and 66.5% of men), based upon self-report. • In Ethiopia, 23.4% of the overall urban adult population reported that they were tested for HIV
and received their results in the 12 months preceding the survey (26.7% of women and 20.0% of men).
• Among only the adults who tested HIV positive in EPHIA, 90.6% reported ever testing for HIV and receiving their results (84.8% among men and 93.2% among women), while 19.0% were tested and received their results in 12 months preceding the survey.
• Only 28.9% of older adolescent boys reported ever testing for HIV and having received their results.
VIRAL LOAD SUPPRESSION• Among HIV-positive adults aged 15-49 years in urban Ethiopia, the proportion of adults
achieving VLS (defined as HIV RNA less than 1,000 copies/mL) was 68.2%, while the proportion of adults aged 15-64 years with VLS was 70.1% (66.8% among men and 71.7% among women). The proportion of HIV-positive adults achieving VLS ranged from 48.2% in young people (defined as those aged 15-24 years in this survey) to 80.2% in those aged 45-54 years.
18 | Ethiopia Population-based HIV Impact Assessment (EPHIA) 2017-2018
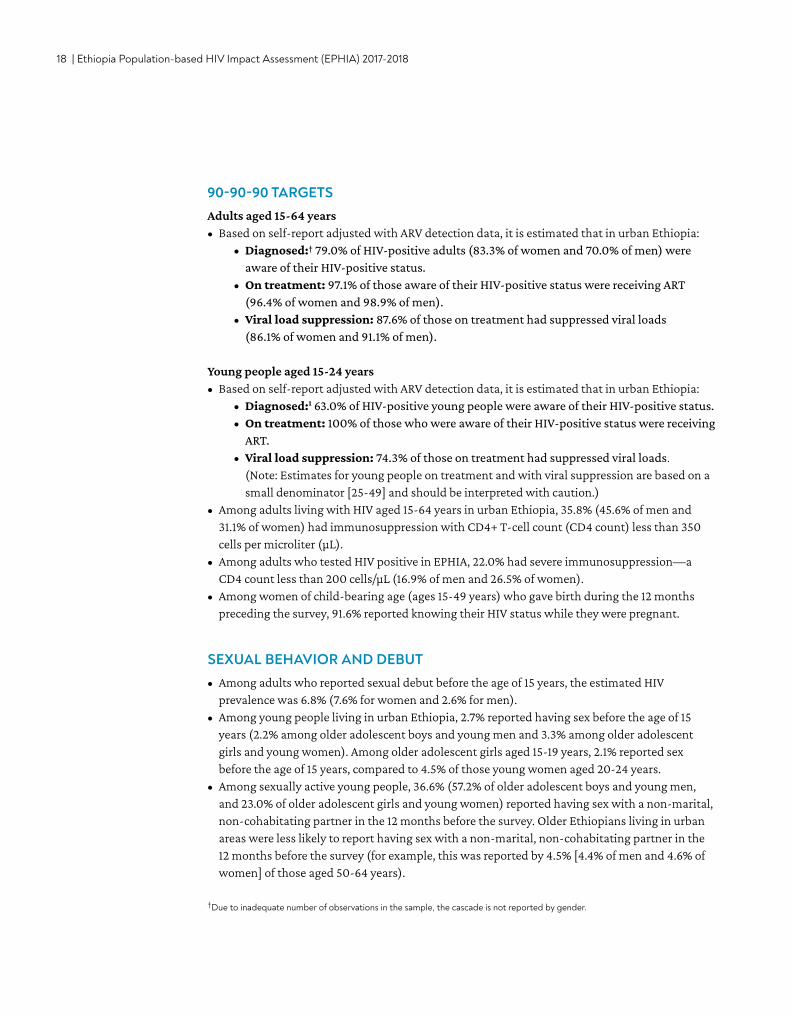
90-90-90 TARGETSAdults aged 15-64 years • Based on self-report adjusted with ARV detection data, it is estimated that in urban Ethiopia:
• Diagnosed:† 79.0% of HIV-positive adults (83.3% of women and 70.0% of men) were aware of their HIV-positive status.
• On treatment: 97.1% of those aware of their HIV-positive status were receiving ART (96.4% of women and 98.9% of men).
• Viral load suppression: 87.6% of those on treatment had suppressed viral loads (86.1% of women and 91.1% of men).
Young people aged 15-24 years• Based on self-report adjusted with ARV detection data, it is estimated that in urban Ethiopia:
• Diagnosed:1 63.0% of HIV-positive young people were aware of their HIV-positive status.• On treatment: 100% of those who were aware of their HIV-positive status were receiving
ART. • Viral load suppression: 74.3% of those on treatment had suppressed viral loads.
(Note: Estimates for young people on treatment and with viral suppression are based on a small denominator [25-49] and should be interpreted with caution.)
• Among adults living with HIV aged 15-64 years in urban Ethiopia, 35.8% (45.6% of men and 31.1% of women) had immunosuppression with CD4+ T-cell count (CD4 count) less than 350 cells per microliter (μL).
• Among adults who tested HIV positive in EPHIA, 22.0% had severe immunosuppression—a CD4 count less than 200 cells/μL (16.9% of men and 26.5% of women).
• Among women of child-bearing age (ages 15-49 years) who gave birth during the 12 months preceding the survey, 91.6% reported knowing their HIV status while they were pregnant.
SEXUAL BEHAVIOR AND DEBUT• Among adults who reported sexual debut before the age of 15 years, the estimated HIV
prevalence was 6.8% (7.6% for women and 2.6% for men).• Among young people living in urban Ethiopia, 2.7% reported having sex before the age of 15
years (2.2% among older adolescent boys and young men and 3.3% among older adolescent girls and young women). Among older adolescent girls aged 15-19 years, 2.1% reported sex before the age of 15 years, compared to 4.5% of those young women aged 20-24 years.
• Among sexually active young people, 36.6% (57.2% of older adolescent boys and young men, and 23.0% of older adolescent girls and young women) reported having sex with a non-marital, non-cohabitating partner in the 12 months before the survey. Older Ethiopians living in urban areas were less likely to report having sex with a non-marital, non-cohabitating partner in the 12 months before the survey (for example, this was reported by 4.5% [4.4% of men and 4.6% of women] of those aged 50-64 years).
†Due to inadequate number of observations in the sample, the cascade is not reported by gender.
EXECUTIVE SUMMARY | 19
• Among sexually active adults, 15.9% (18.5% of men and 13.0% of women) reported having sex with a non-marital or non-cohabitating partner in the 12 months preceding the survey—and among these, only 37.6% reported using a condom during their last sexual intercourse with such a non-marital or non-cohabitating partner.
COINFECTIONS• Based on self-report, 57.0% of adults in urban Ethiopia who had ever visited a clinic for TB
diagnosis or treatment were tested for HIV during a TB-related clinic visit; however, 39.6% did not test for HIV during the visit and did not know their HIV status.
• Among adults living with HIV in urban Ethiopia who had ever visited a clinic for TB diagnosis and treatment, 63.3% were diagnosed with TB, and of these, 100% were treated for TB.
• Overall, the prevalence of ever having had syphilis was 13.4% among HIV-positive adults (17.4% among men and 11.5% among women). The overall prevalence of active syphilis among people living with HIV was 2.6% (5.0% among men and 1.4% among women).
• The prevalence of hepatitis B was 4.8% among adults who tested HIV positive (7.4% among men and 3.6% among women).
• Among women living with HIV aged 30-49 years in urban Ethiopia, the probability of having been screened for cervical cancer was 18.5% in large urban areas compared to 12.9% in small urban areas.

20 | Ethiopia Population-based HIV Impact Assessment (EPHIA) 2017-2018
1. INTRODUCTION
INTRODUCTION | 21
1.1 BACKGROUND
Ethiopia is the second-most populous country in sub-Saharan Africa and has a significant burden of HIV. In the 2011 Ethiopia Demographic Health Survey, the estimated national HIV prevalence rate among adults (15-49 years) was 1.5%, but prevalence varied by sex, age, geography, and socio-economic status. Despite persistent efforts to halt the epidemic, HIV remains one of the health challenges in Ethiopia, and HIV transmission continues in the country, particularly among the urban population.
Consequently, Ethiopia has implemented a public health approach to service delivery, which includes a rapid expansion in the number of facilities providing antiretroviral (ARV) therapy (ART) in recent years. The country has endorsed the Joint United Nations Programme on HIV/AIDS (UNAIDS) 90-90-90 targets, which, in addition to improving health outcomes among people living with HIV, should lead to an increase in viral load (VL) suppression (VLS) among the HIV-positive population. It is anticipated that this will, in turn, reduce HIV incidence in Ethiopia and move the country closer to control of the HIV epidemic. However, further evidence was necessary to measure the country's progress; to provide high-quality data on HIV prevalence, viral suppression, risk behaviors, and morbidity, particularly in urban areas of the country; and to support future decision making and policy formation.
The Population-based HIV Impact Assessment (PHIA) is a multicountry project funded by the United States President’s Emergency Plan for AIDS Relief (PEPFAR) to conduct national HIV-focused surveys that describe the status of the HIV epidemic. The surveys measure important national and regional HIV-related parameters, including progress toward the achievement of the UNAIDS 90-90-90 targets (UNAIDS, 2014), and will guide policy and funding priorities.
The Ethiopia Population-based HIV Impact Assessment (EPHIA) was led by the government of Ethiopia through the Ethiopian Public Health Institute (EPHI) with technical assistance from the United States Centers for Disease Control and Prevention (CDC). The survey was implemented by ICAP at Columbia University in collaboration with local partners, including Federal HIV/AIDS Prevention and Control Office (FHAPCO), the Central Statistical Agency, and the Ethiopian Public Health Association (EPHA).
1.2 OVERVIEW OF EPHIA 2017-2018
EPHIA, a household-based survey in Ethiopia’s urban areas, was conducted between October 2017 and April 2018 to measure the status of Ethiopia’s national HIV response. EPHIA offered home-based testing and counseling (HBTC) with return of results and collected information about uptake of HIV care and treatment services. This survey is the first in Ethiopia to measure HIV incidence, VLS prevalence, pediatric HIV prevalence, CD4 count distribution, presence of ARV drugs in blood, and transmitted HIV drug resistance. The survey also collected information on selected behaviors associated with HIV acquisition and transmission, and on common HIV comorbidities and other health conditions in urban Ethiopia.
Although HIV facility-based sentinel surveillance and previously conducted population-based studies provided useful knowledge regarding Ethiopia’s HIV epidemic and HIV control efforts, information critical to understand the current status of the epidemic and guide future interventions was still lacking. While population-level outcomes and impact can be inferred and modeled from facility-level data, this requires a series of untested assumptions about trends in the unobserved segments of the population. In addition, the population-based data that were available for HIV focused largely on knowledge, attitudes, and self-reported risk behaviors.
22 | Ethiopia Population-based HIV Impact Assessment (EPHIA) 2017-2018
With its focus on measuring key biological endpoints in a representative sample of the population in Ethiopia’s urban areas, EPHIA provides direct estimates of HIV-infection risk and burden, the effectiveness and population-level impact of HIV-related prevention, care, and treatment interventions implemented in the country, and Ethiopia’s progress toward the achievement of the UNAIDS 90-90-90 targets in the areas of the country most heavily affected by the HIV epidemic.
1.3 AIM
The goal of the survey was to examine the distribution of HIV disease, measure HIV-related risk behaviors, and assess the coverage and impact of HIV services on the population level using a representative sample of adults (defined as those aged 15-64 years) and children (defined as the population aged 0-14 years) in urban Ethiopia.
Primary Objectives• To estimate the proportion of people living with HIV/AIDS with VLS in a household-based survey among adults 15-49 years
of age in urban Ethiopia at the national and sub-national (i.e., regional) level.
Secondary Objectives• To estimate national and sub-national (i.e., regional) HIV prevalence among adults (defined as those aged 15-64 years)
in urban Ethiopia.• To estimate HIV prevalence in urban children. • To estimate HIV incidence among adults in urban Ethiopia.• To estimate the proportion of people living with HIV with VLS among adults aged 50-64 years in urban Ethiopia.• To describe the prevalence of HIV-related risk behaviors, knowledge, and attitudes in a household-based, representative
urban sample of young adolescents aged 12-14 years and adults. • To examine the correlation of demographic characteristics and HIV prevalence among adults and children. • To determine the distribution of CD4 counts among HIV-positive adults and children.• To estimate coverage of HIV-related services including HBTC, knowledge of HIV status, coverage of care and treatment
services among adults and children.• To estimate the prevalence of detectable ARVs in HIV-positive children and adults. • To estimate the level of transmitted drug resistance in adults and children with evidence of recent HIV infection.• To estimate the prevalence of syphilis among HIV-positive adults. • To estimate the prevalence of hepatitis B coinfection among HIV-positive adults.
INTRODUCTION | 23
2. SURVEY DESIGN, METHODS, AND
RESPONSE RATES
24 | Ethiopia Population-based HIV Impact Assessment (EPHIA) 2017-2018
Table 2.1.A Distribution of sampled enumeration areas and households, by region
Distribution of sampled enumeration areas and households, by region, EPHIA 2017-18
Enumeration Areas Households
Region Small Urban Area (≤50,000)
Large Urban Area (>50,000) Total Small Urban Area
(≤50,000)Large Urban Area
(>50,000) Total
Tigray 11 15 26 322 457 779
Afar 17 0 17 513 0 513
Amhara 47 24 71 1,379 735 2,114
Oromia 63 29 92 1,932 827 2,759
Somali 9 8 17 253 260 513
Benishangul Gumuz 13 4 17 389 124 513
SNNPR 27 24 51 904 609 1,513
Gambella 8 9 17 255 258 513
Harari 0 16 16 0 498 498
Addis Ababa 0 52 52 0 1,582 1,582
Dire Dawa 0 17 17 0 513 513
Total 195 198 393 5,947 5,863 11,810
Unweighted figures
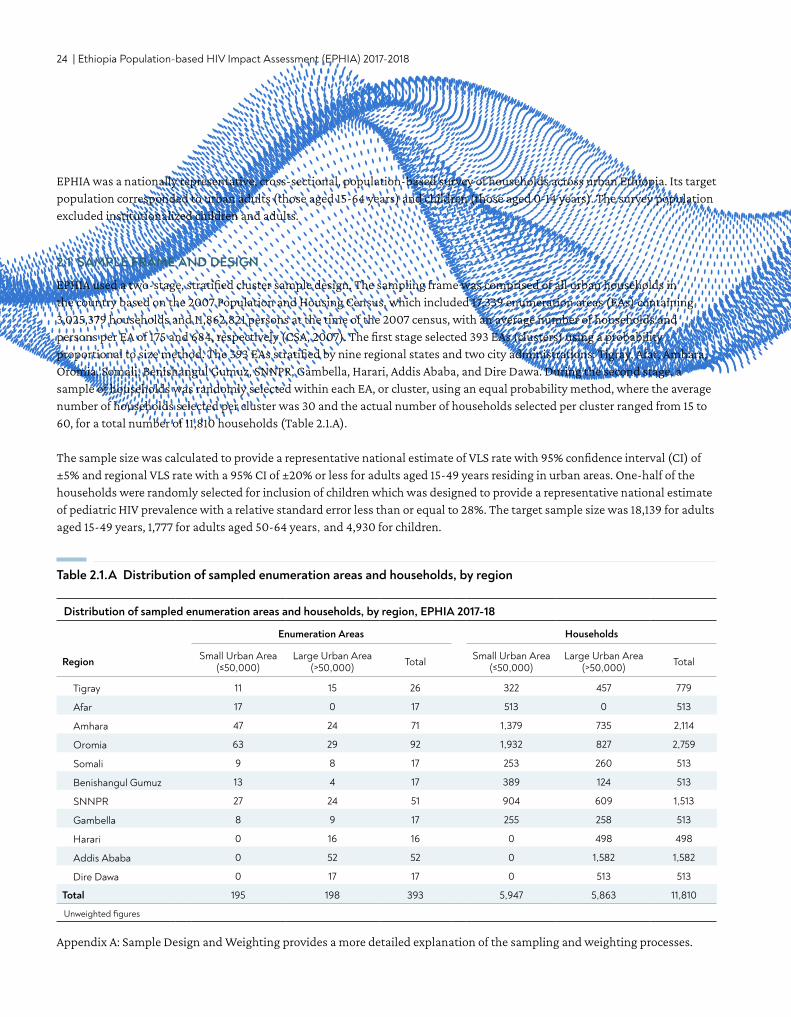
EPHIA was a nationally representative, cross-sectional, population-based survey of households across urban Ethiopia. Its target population corresponded to urban adults (those aged 15-64 years) and children (those aged 0-14 years). The survey population excluded institutionalized children and adults.
2.1 SAMPLE FRAME AND DESIGN
EPHIA used a two-stage, stratified cluster sample design. The sampling frame was comprised of all urban households in the country based on the 2007 Population and Housing Census, which included 17,339 enumeration areas (EAs) containing 3,025,379 households and 11,862,821 persons at the time of the 2007 census, with an average number of households and persons per EA of 175 and 684, respectively (CSA, 2007). The first stage selected 393 EAs (clusters) using a probability proportional to size method. The 393 EAs stratified by nine regional states and two city administrations: Tigray, Afar, Amhara, Oromia, Somali, Benishangul Gumuz, SNNPR, Gambella, Harari, Addis Ababa, and Dire Dawa. During the second stage, a sample of households was randomly selected within each EA, or cluster, using an equal probability method, where the average number of households selected per cluster was 30 and the actual number of households selected per cluster ranged from 15 to 60, for a total number of 11,810 households (Table 2.1.A).
The sample size was calculated to provide a representative national estimate of VLS rate with 95% confidence interval (CI) of ±5% and regional VLS rate with a 95% CI of ±20% or less for adults aged 15-49 years residing in urban areas. One-half of the households were randomly selected for inclusion of children which was designed to provide a representative national estimate of pediatric HIV prevalence with a relative standard error less than or equal to 28%. The target sample size was 18,139 for adults aged 15-49 years, 1,777 for adults aged 50-64 years, and 4,930 for children.
Appendix A: Sample Design and Weighting provides a more detailed explanation of the sampling and weighting processes.
SURVEY DESIGN, METHODS, AND RESPONSE RATES | 25
2.2 ELIGIBILITY CRITERIA, RECRUITMENT, AND CONSENT PROCEDURES
In EPHIA, the eligible survey population included individuals aged 0-64 years. The consent criteria are determined in each country, and it should be noted that the age categories are different than the adult, adolescent, and children population ages used for sampling and reporting purposes in this report. The consent criteria included:
• Women and men, ages 18-64 years, living in the selected households, and visitors of the same ages who slept in the household the night before the survey, who were willing and able to provide written consent.
• Adolescents aged 12-17 years living in the selected households, and visitors in the same age bracket who slept in the household the night before the survey, who were willing and able to provide written assent, and whose parents or guardians were willing and able to provide written permission for their participation.
• Children aged 0-11 years living in the selected households, and visitors of the same ages who slept in the household the night before the survey, whose parents or guardians were willing and able to provide written consent for their participation.
An electronic informed consent form was administered using a tablet (Appendix G). At each stage of the consent process, consent was indicated by signing or making a mark on the consent form on the tablet and on a printed copy, which was retained by the participant. A designated head of household provided written consent for household members to participate in the survey, after which individual members were rostered during a household interview. Adults and emancipated minors*2 (ages 13-17) then provided written consent on the tablet for an interview and for participation in the biomarker component of the survey, including HBTC, with return of HIV-testing results and CD4 counts during the household visit. Receipt of test results was a requirement for participation in the biomarker component. If an individual did not want to receive his or her HIV test result, this was considered a refusal and the survey was concluded. Adults were also asked for written consent to store their blood samples in a repository to perform additional tests in the future.
Adolescents aged 12-17 years were asked for assent to the interview and biomarker components after permission was granted by their parents or guardians. Parents provided consent for biomarker testing for children below the age of assent (ages 0-11 years). In both cases, if a parent or guardian did not want to receive his or her child's HIV test results, this was considered a refusal and the survey was concluded.
Procedures with illiterate participants or participants with a sight disability involved the use of an impartial witness, chosen by the potential participant, who also signed or made a mark on the consent form on the tablet and the printed copy. If no witness could be identified, the potential participant or household (if the head of household was sight disabled or illiterate) was deemed ineligible.
All PHIA survey protocols, consent forms, screening forms, refusal forms, referral forms, recruitment materials and questionnaires were reviewed and approved by in-country ethics and regulatory bodies and the institutional review boards of Columbia University Medical Center, Westat, and the CDC.
*An emancipated minor is an adolescent aged 13-17 years who is married or is free from any legally competent representative as defined by law in Ethiopia.
26 | Ethiopia Population-based HIV Impact Assessment (EPHIA) 2017-2018
2.3 SURVEY IMPLEMENTATION
Training of Field and Laboratory Staff Survey staff received training on both the contents of the data collection instruments and tablet use. The training curriculum included:
• Scientific objectives of the survey• Survey design and methods• Completion of survey forms• Data collection• Staff responsibilities• Recruitment of participants• Informed consent procedures, including human subjects’ protection, privacy, and confidentiality• Blood collection for children and adults, including venipuncture and finger/heel stick• HBTC• CD4 count measurement using point-of-care (POC) Pima™ Analyzer• Referral of participants to health and social services• Management and transportation of blood specimens• Biosafety• Communication skills• Protocol deviations, adverse events, and reporting of events
Laboratory staff were trained in specimen management, including sample processing, labeling, and quality assurance (QA). Central laboratory staff were trained in VL measurement, early infant diagnosis, HIV confirmatory testing, and testing for recent HIV infection using the limiting antigen (LAg) avidity enzyme immunoassay (EIA).
Survey StaffFieldwork started at the beginning of October 2017 and was completed in April 2018. Fieldwork was conducted by 31 locally hired field teams composed of a team leader, six nurse interviewers and two drivers, who were locally hired. Field teams included both male and female staff members who spoke the languages used in the areas to which they were deployed. A total of about 328 field staff (six field coordinators, 31 team leaders, 211 nurse interviewers [93 testers and 118 interviewers], six community-mobilization coordinators, and 74 drivers) participated in data collection. The field teams were supervised by 31 team leaders, six field coordinators and managed by central staff, who guided and oversaw data collection activities, performed quality checks, and provided technical support (Appendix D).
In addition, the laboratory staff was organized at different levels (central laboratory staff, regional field supervisors, onsite laboratory supervisors, satellite lab technicians, and satellite lab logisticians). Overall, 31 satellite laboratory technicians and five central lab technicians processed samples and performed additional procedures for HIV-1 VL, infant virological HIV testing, and quality control (QC) and QA. National and international monitors periodically conducted direct observation of data collection activities in the field and in the laboratories to provide technical support and ensure quality.
Community Sensitization and MobilizationCommunity mobilization was conducted prior to data collection to maximize community support and participation in the survey. The mobilization began before fieldwork commenced with a national launch meeting that included key national and
SURVEY DESIGN, METHODS, AND RESPONSE RATES | 27
regional leaders, media, and other stakeholders. Community mobilization teams visited each EA prior to initiation of data collection and partnered with community mobilizers to meet key gatekeepers in the communities (chiefs, local government officials, religious and community leaders). The mobilization teams held community sensitization meetings, disseminated written informational materials such as brochures and posters, and held discussions with selected households and other community residents.
SupervisionData-collection teams were continuously overseen by field-based supervisors as well as periodically monitored by national and international teams with representation from collaborating institutions. Monitoring teams visited field and laboratory sites at least monthly and provided direct supervision as well as verification of results by household revisits. Daily monitoring forms for household and individual outcome tracking were also reviewed by monitors for completeness. Field-based supervisors also supported teams by organizing supplies and transport of blood samples, coordinating community-mobilization efforts, providing technical troubleshooting, and checking the quality of household procedures and data collected.
The national and international monitoring teams observed and assessed the quality of survey procedures, including adherence to protocol and standard operating procedures, and identified and responded to challenges with data collection. Regular debriefing sessions were held between field-based supervisors and monitoring teams. Monitoring reports were circulated to collaborating institutions and the EPHIA Technical Working Group to respond to any issues.
Electronic monitoring systemAn electronic dashboard system was established to monitor the progression of the survey. The dashboard summarized data uploaded to the PHIA server daily. The dashboard tracked coverage and completion of EAs, sampled households, household response, eligible household members providing consent to the interview, and biomarker components of the survey, blood draws, response rates (RRs), and overall progress towards the achievement of the target sample.
Questionnaire Data CollectionQuestionnaire and field laboratory data were collected on mobile tablet devices using an application programmed in Open Data Kit (ODK), an open-source mobile data collection application. The household interview collected information on household residents, assets, economic support, recent deaths, and orphans and vulnerable children (see Appendix E). The adult interview was administered to participants aged 15 years and older and included modules on demographic characteristics, sexual and reproductive health, marriage, male circumcision, sexual activity, HIV/AIDS knowledge and attitudes, the HIV testing and treatment history, TB and other diseases, alcohol use, and gender norms (see Appendix F). Participants who self-reported their HIV-positive status were asked questions about their HIV care experience. Parents also answered questions about their children’s (ages 0-14 years) health and participation in HBTC services as a part of the adult interview. The adolescent questionnaire, for children aged 12-14 years, contained a subset of questions from the adult questionnaire, including demographic characteristics, sexual activity, HIV-related risk behaviors, exposure to HIV prevention programs, and awareness of HIV-positive status. In each household, one woman among those aged 15-64 years was also randomly selected to answer questions about her experiences with violence. Participants of any age who reported being victims of violence and minors who reported being victims of sexual exploitation were provided with referrals to social services. Female participants were interviewed by female staff, and males by male staff, whenever possible. The questionnaire was administered in the five languages most commonly used in Ethiopia: Amharic, Oromiffa, Tigrigna, Afarigna, and Somaligna. Versions of the questionnaires in each language were reviewed and tested thoroughly for acceptability, feasibility, and flow of questions.
28 | Ethiopia Population-based HIV Impact Assessment (EPHIA) 2017-2018
2.4 FIELD-BASED BIOMARKER TESTING
Blood CollectionBlood was collected by trained and qualified survey staff from consenting participants: 14 milliliter (mL) of venous blood from adults, 5 mL from children aged 2-14 years and 1 mL of capillary blood from adults who either refused to give venous blood or failed to be collected using vacuum tubes, and from children under 2 years of age (using finger-stick for children aged between 6 and 24 months, and heel-stick for children below 6 months of age).
Blood samples were labeled with a unique barcoded participant identification number and stored in temperature-controlled cooler boxes at the field level. At the end of each day, samples were transported to a satellite laboratory for processing into plasma aliquots and dried blood spots (DBS) and were frozen within 24 hours of blood collection.
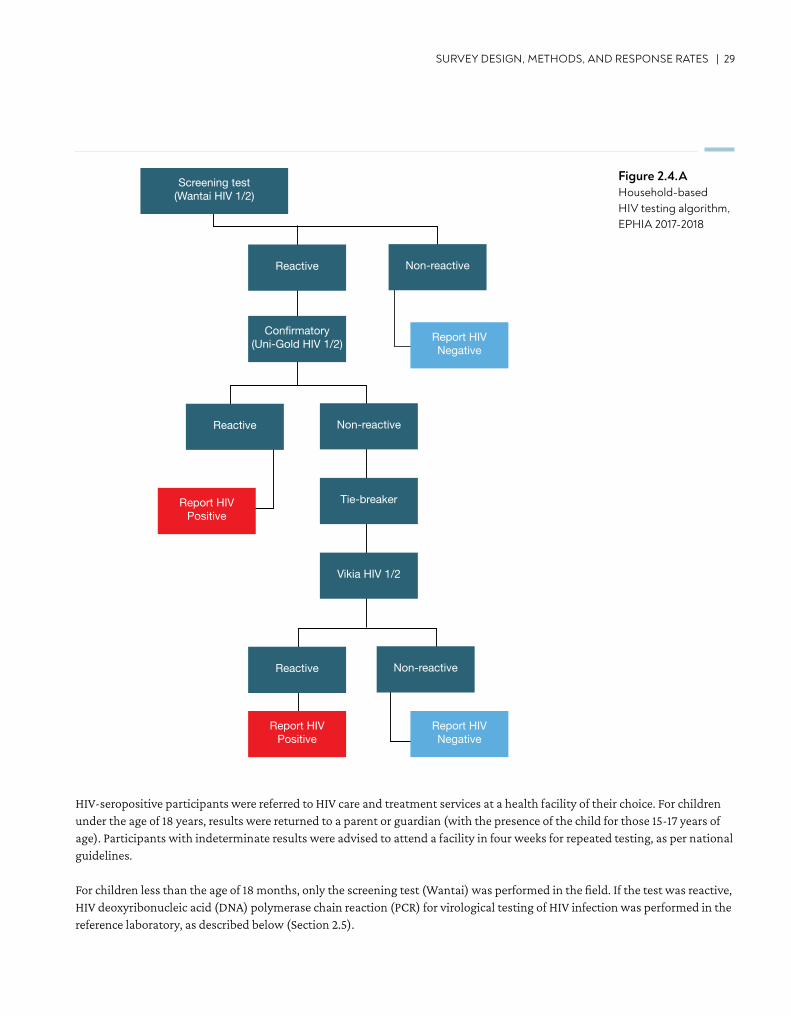
HIV Home-Based Testing and CounselingHIV HBTC was conducted in each household using the Ethiopian National HIV testing algorithm in accordance with national guidelines (Figure 2.4.A). As per these guidelines, the survey used a sequential rapid-testing algorithm in the field: Wantai HIV 1/2 (Beijing Wantai Biological Pharmacy Enterprise Co., Ltd, Beijing, China) as a screening test, Uni-Gold HIV 1/2™ (Trinity Biotech, plc., Wicklow, Ireland) confirmatory and Vikia HIV 1/2 (bioMérieux, SA, F-69280 Marcy l’Etoile, France) as a tie breaker test. Individuals with a nonreactive result on the screening test were reported as HIV negative. Individuals with a reactive screening test underwent confirmatory testing. Those with reactive results on both the screening and confirmatory tests were classified as HIV positive. Individuals with a reactive screening test result, followed by a nonreactive confirmatory test result, were retested using a tie-breaker test. The results were finally determined based on the tie-breaker test. t.
SURVEY DESIGN, METHODS, AND RESPONSE RATES | 29
Figure 2.4.AHousehold-based HIV testing algorithm, EPHIA 2017-2018
Screening test(Wantai HIV 1/2)
Reactive Non-reactive
Reactive Non-reactive
Reactive Non-reactive
Confirmatory(Uni-Gold HIV 1/2) Report HIV
Negative
Report HIVNegative
Report HIVPositive
Report HIVPositive
Tie-breaker
Vikia HIV 1/2
HIV Negative HIV Positive
TargetNot Detected
TargetNot Detected
HIV TNA PCR1
(EID2)
HIV-seropositive participants were referred to HIV care and treatment services at a health facility of their choice. For children under the age of 18 years, results were returned to a parent or guardian (with the presence of the child for those 15-17 years of age). Participants with indeterminate results were advised to attend a facility in four weeks for repeated testing, as per national guidelines.
For children less than the age of 18 months, only the screening test (Wantai) was performed in the field. If the test was reactive, HIV deoxyribonucleic acid (DNA) polymerase chain reaction (PCR) for virological testing of HIV infection was performed in the reference laboratory, as described below (Section 2.5).
30 | Ethiopia Population-based HIV Impact Assessment (EPHIA) 2017-2018
For participants who reported an HIV-positive status, but tested HIV negative at the time of the survey, additional laboratory-based testing was conducted using HIV DNA PCR for confirmation of the status. In conjunction with the Ministry of Health, survey staff revisited these participants and health providers to provide counseling and guidance on next steps to confirm these results, particularly for those on ART.
QC and QA for HIV testingQC using a panel of positive and negative dried tube specimens was performed on a biweekly basis by field staff performing HIV testing. In addition, QA proficiency testing was conducted twice in the course of the survey, using a panel of masked HIV-positive and negative dried tube specimens. Proficiency in the correct performance and interpretation of the HIV testing algorithm was assessed for each tester.
Hepatitis B Testing Hepatitis B virus (HBV) testing was performed using Determine HBsAg rapid HBV test (Abbott Molecular Inc., Chicago, Illinois, United States, formerly Alere) for all HIV-positive adults for HBV surface antigen. A reactive test result using Determine HBV test classified the participant as HBV positive while a HBV test non-reactive result classified the participant as HBV negative.
Syphilis TestingIn EPHIA, syphilis screening and confirmatory testing was done for all HIV-positive adults. The test (DPP Chembio Diagnostic System, INC., Medford, New York, United States) was used to differentiate active and past syphilis infection by nontreponemal and treponemal antibodies. Reactive for both non-treponemal and treponemal antibodies were classified as having active syphilis infection and referred for care with their HIV and CD4 results.
CD4 T-Cell Count MeasurementAll participants who tested HIV positive during HBTC, and a random sample of 2.0% of those who tested HIV negative, received a CD4 count measurement in the field by qualified survey staff. The measurement was performed using the Pima™ CD4 Analyzer (Abbott Molecular Inc., Chicago, Illinois, United States, formerly Alere).
2.5 LABORATORY-BASED BIOMARKER TESTING
Satellite and Central LaboratoriesTwenty-one satellite laboratories for the survey were established in existing health facility laboratories. One central reference laboratory (National HIV Reference Laboratory, EPHI, Addis Ababa) was chosen for more specialized tests. At each satellite laboratory, trained laboratory technicians performed processing of whole blood specimens into plasma aliquots and DBS cards for storage at -20°C, testing for QA, and HIV confirmatory testing. For QA of the HIV rapid testing conducted in the field, the first 50 samples tested by each field tester and a random sample of 5.0% of specimens that tested HIV negative during HBTC were retested in the laboratory using the national HIV rapid-testing algorithm. All specimens that tested HIV positive during HBTC and those that had confirmed positive rapid test results during QA, underwent confirmatory testing using the Geenius HIV 1/2 Supplemental Assay (Bio-Rad, Hercules, California, United States). A positive Geenius result defined HIV-positive status for the survey. Central laboratory procedures included HIV VL testing, HIV DNA PCR for infant virological testing and for confirmation of status of those who self-reported an HIV-positive status but tested negative in HBTC, testing for recent HIV infections, ARV drug resistance testing and long-term storage of samples at -80°C.
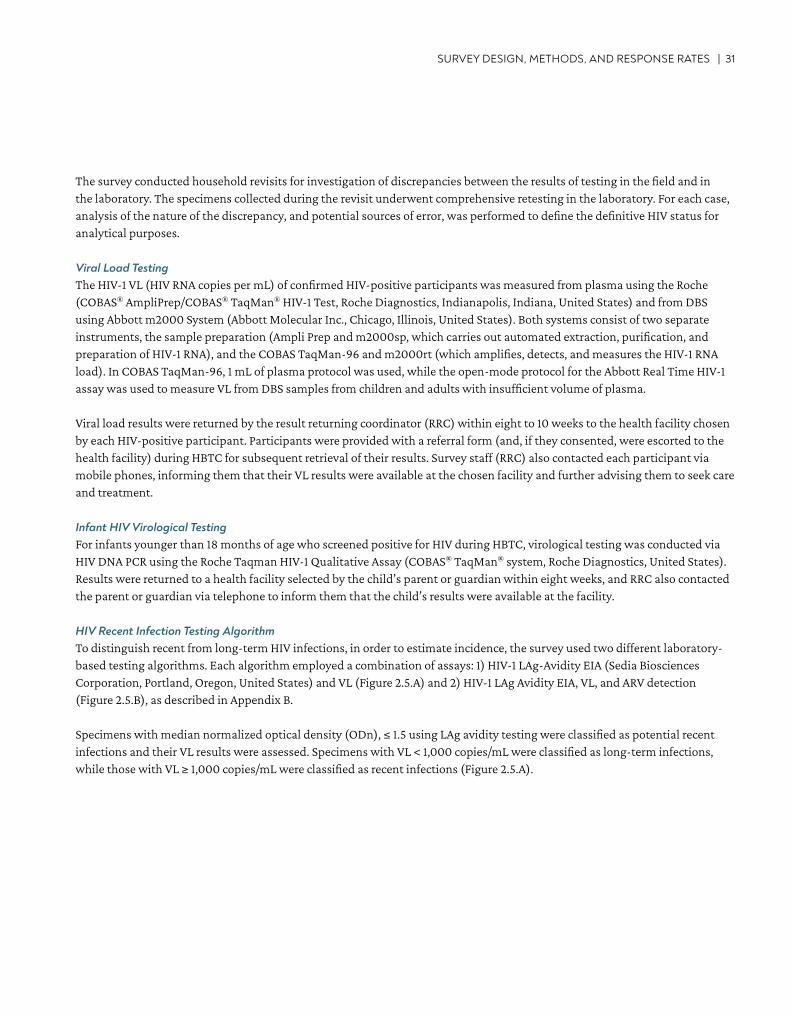
SURVEY DESIGN, METHODS, AND RESPONSE RATES | 31
The survey conducted household revisits for investigation of discrepancies between the results of testing in the field and in the laboratory. The specimens collected during the revisit underwent comprehensive retesting in the laboratory. For each case, analysis of the nature of the discrepancy, and potential sources of error, was performed to define the definitive HIV status for analytical purposes.
Viral Load TestingThe HIV-1 VL (HIV RNA copies per mL) of confirmed HIV-positive participants was measured from plasma using the Roche (COBAS® AmpliPrep/COBAS® TaqMan® HIV-1 Test, Roche Diagnostics, Indianapolis, Indiana, United States) and from DBS using Abbott m2000 System (Abbott Molecular Inc., Chicago, Illinois, United States). Both systems consist of two separate instruments, the sample preparation (Ampli Prep and m2000sp, which carries out automated extraction, purification, and preparation of HIV-1 RNA), and the COBAS TaqMan-96 and m2000rt (which amplifies, detects, and measures the HIV-1 RNA load). In COBAS TaqMan-96, 1 mL of plasma protocol was used, while the open-mode protocol for the Abbott Real Time HIV-1 assay was used to measure VL from DBS samples from children and adults with insufficient volume of plasma.
Viral load results were returned by the result returning coordinator (RRC) within eight to 10 weeks to the health facility chosen by each HIV-positive participant. Participants were provided with a referral form (and, if they consented, were escorted to the health facility) during HBTC for subsequent retrieval of their results. Survey staff (RRC) also contacted each participant via mobile phones, informing them that their VL results were available at the chosen facility and further advising them to seek care and treatment.
Infant HIV Virological TestingFor infants younger than 18 months of age who screened positive for HIV during HBTC, virological testing was conducted via HIV DNA PCR using the Roche Taqman HIV-1 Qualitative Assay (COBAS® TaqMan® system, Roche Diagnostics, United States). Results were returned to a health facility selected by the child’s parent or guardian within eight weeks, and RRC also contacted the parent or guardian via telephone to inform them that the child’s results were available at the facility.
HIV Recent Infection Testing AlgorithmTo distinguish recent from long-term HIV infections, in order to estimate incidence, the survey used two different laboratory-based testing algorithms. Each algorithm employed a combination of assays: 1) HIV-1 LAg-Avidity EIA (Sedia Biosciences Corporation, Portland, Oregon, United States) and VL (Figure 2.5.A) and 2) HIV-1 LAg Avidity EIA, VL, and ARV detection (Figure 2.5.B), as described in Appendix B.
Specimens with median normalized optical density (ODn), ≤ 1.5 using LAg avidity testing were classified as potential recent infections and their VL results were assessed. Specimens with VL < 1,000 copies/mL were classified as long-term infections, while those with VL ≥ 1,000 copies/mL were classified as recent infections (Figure 2.5.A).
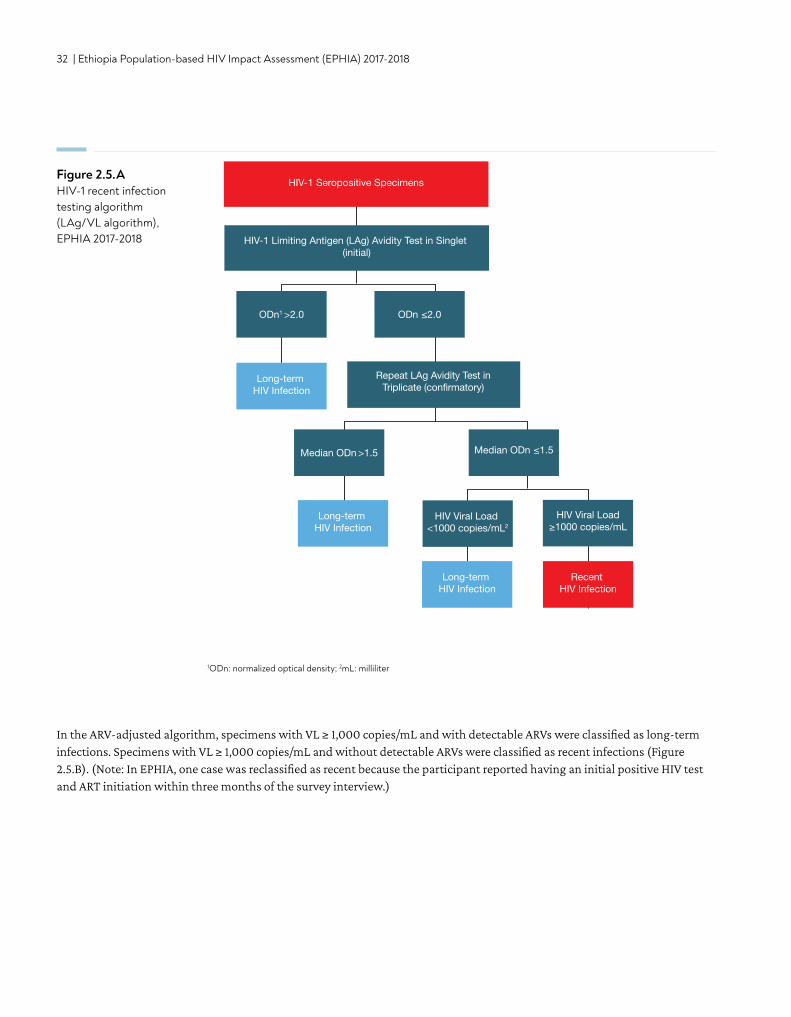
32 | Ethiopia Population-based HIV Impact Assessment (EPHIA) 2017-2018
In the ARV-adjusted algorithm, specimens with VL ≥ 1,000 copies/mL and with detectable ARVs were classified as long-term infections. Specimens with VL ≥ 1,000 copies/mL and without detectable ARVs were classified as recent infections (Figure 2.5.B). (Note: In EPHIA, one case was reclassified as recent because the participant reported having an initial positive HIV test and ART initiation within three months of the survey interview.)
Figure 2.5.AHIV-1 recent infection testing algorithm (LAg/VL algorithm), EPHIA 2017-2018
1ODn: normalized optical density; 2mL: milliliter
HIV-1 Limiting Antigen (LAg) Avidity Test in Singlet (initial)
ODn1 >2.0 ODn ≤2.0
Median ODn >1.5 Median ODn ≤1.5
HIV Viral Load ≥1000 copies/mL
Repeat LAg Avidity Test inTriplicate (confirmatory)
HIV-1 Seropositive Specimens
Long-term HIV Infection
Long-term HIV Infection
Recent HIV Infection
Long-term HIV Infection
HIV Viral Load <1000 copies/mL2
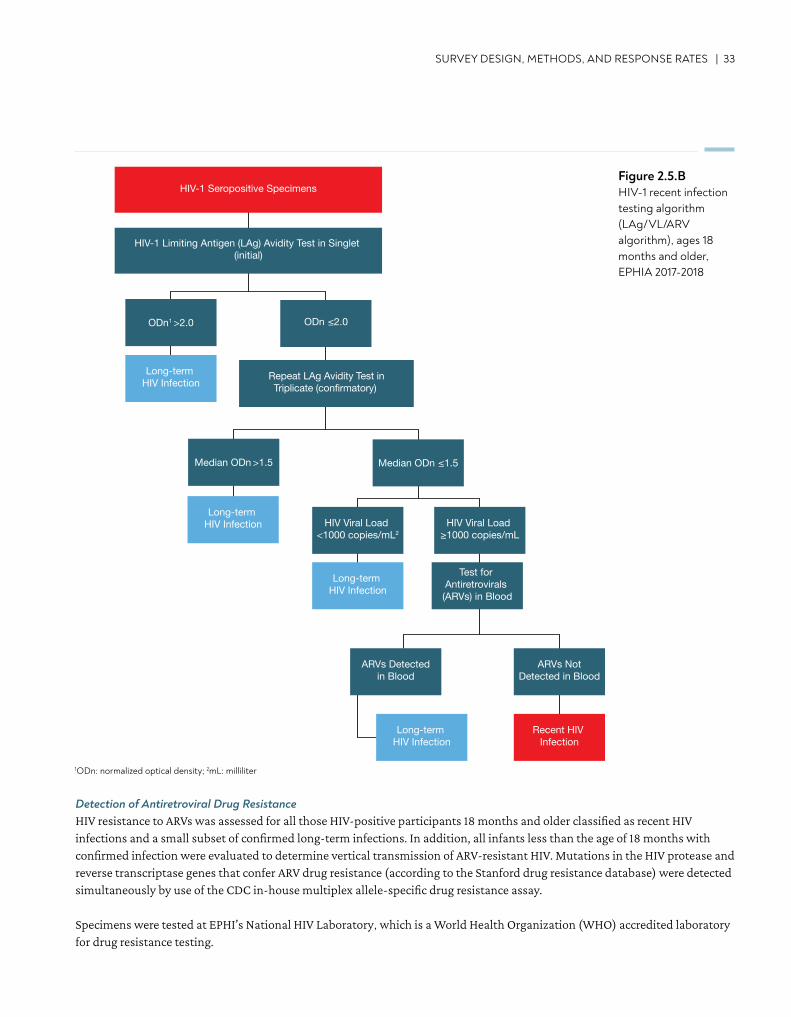
SURVEY DESIGN, METHODS, AND RESPONSE RATES | 33
Detection of Antiretroviral Drug Resistance HIV resistance to ARVs was assessed for all those HIV-positive participants 18 months and older classified as recent HIV infections and a small subset of confirmed long-term infections. In addition, all infants less than the age of 18 months with confirmed infection were evaluated to determine vertical transmission of ARV-resistant HIV. Mutations in the HIV protease and reverse transcriptase genes that confer ARV drug resistance (according to the Stanford drug resistance database) were detected simultaneously by use of the CDC in-house multiplex allele-specific drug resistance assay.
Specimens were tested at EPHI’s National HIV Laboratory, which is a World Health Organization (WHO) accredited laboratory for drug resistance testing.
HIV-1 Seropositive Specimens
ODn1 >2.0 ODn ≤2.0
Median ODn >1.5 Median ODn ≤1.5
HIV-1 Limiting Antigen (LAg) Avidity Test in Singlet (initial)
Long-term HIV Infection
Long-term HIV Infection
Long-term HIV Infection
Long-term HIV Infection
Repeat LAg Avidity Test inTriplicate (confirmatory)
HIV Viral Load <1000 copies/mL2
Recent HIV Infection
ARVs NotDetected in Blood
Test for Antiretrovirals (ARVs) in Blood
HIV Viral Load ≥1000 copies/mL
ARVs Detectedin Blood
Figure 2.5.BHIV-1 recent infection testing algorithm (LAg/VL/ARV algorithm), ages 18 months and older, EPHIA 2017-2018
1ODn: normalized optical density; 2mL: milliliter
34 | Ethiopia Population-based HIV Impact Assessment (EPHIA) 2017-2018
Detection of Antiretrovirals Qualitative screening for detectable concentrations of ARVs was conducted on DBS specimens from all HIV-positive adults and children by means of high-resolution liquid chromatography coupled with tandem mass spectrometry. The method used for ARV detection was a modified version of the methodology described by Koal et al.1 This qualitative assay was highly specific, as it separates the parent compound from the fragments, and highly sensitive, with a limit of detection of 0.02 μg/mL for each drug, and a signal-to-noise ratio of at least 5:1 for all drugs. As detection of all ARVs in use at the time of the survey was cost-prohibitive, three ARVs, efavirenz, lopinavir, and tenofovir, were selected as markers for the most commonly prescribed first- and second-line regimens. Samples from participants who had VLS and/or reported being on ART, but had no evidence of the first three compounds, were tested for nevirapine. These ARVs were also selected based on their relatively long half-lives, allowing for a longer period of detection following intake.
Detection of ARVs is considered indicative of participant use of a given drug at the time of blood collection. Results below the limit of detection among individuals who self-reported on ART indicate that there was no recent exposure to the regimen and that adherence to a prescribed regimen is sub-optimal, but cannot be interpreted as “not on ART.” In addition, given the limited number of ARVs selected for detection, their absence could not rule out the use of other ART regimes that do not include them.
ARV detection was performed by the Division of Clinical Pharmacology of the Department of Medicine at the University of Cape Town in South Africa.
2.6 DATA PROCESSING AND ANALYSIS
All field data were collected on tablets, transmitted to a central server using a secure virtual private network, and stored in a secure PostgreSQL database. Data cleaning was conducted using SAS 9.4 (SAS Institute Inc. Cary, North Carolina, United States). Laboratory data were cleaned and merged with the final questionnaire database using unique specimen bar codes and study identification numbers.
All results presented in the report are based on weighted estimates unless otherwise noted. Analysis weights account for sample selection probabilities and adjusted for nonresponse and non-coverage. Nonresponse adjusted weights were calculated for households, individual interviews, and individual blood draws in a hierarchical form. Adjustment for nonresponse for initial individual and blood-level weights was based on the development of weighting adjustment cells defined by a combination of variables that are potential predictors of response and HIV status. The nonresponse adjustment cells were constructed using chi-square automatic interaction detection, or Chi-square Automatic Interaction Detector (CHAID), algorithm. The cells were defined based on data from the household interview for the adjustment of individual-level weights, and from both the household and individual interviews for the adjustment of blood sample-level weights. Post-stratification adjustments were implemented to compensate for non-coverage in the sampling process. This final adjustment calibrated the nonresponse-adjusted individual and blood weights to make the sum of each set of weights conform to national population totals by sex and five-year age groups. For a detailed explanation of the sampling and weighting processes, see the Sampling and Weighting Technical Report, available on the PHIA website at https://phia-data.icap.columbia.edu/.
Descriptive analyses of RR, characteristics of respondents, HIV prevalence, CD4 count distribution, HIV testing, self-reported HIV status, self-reported ART, VLS, prevention of mother-to-child transmission (PMTCT) indicators, and sexual behavior were conducted using SAS 9.4. (Note: Unless otherwise noted, claims of statistically significant comparisons in the report were based upon non-overlapping 95% CIs [the CIs shown in the narrative are in the final release data set available on the https://phia.icap.columbia.edu/].)
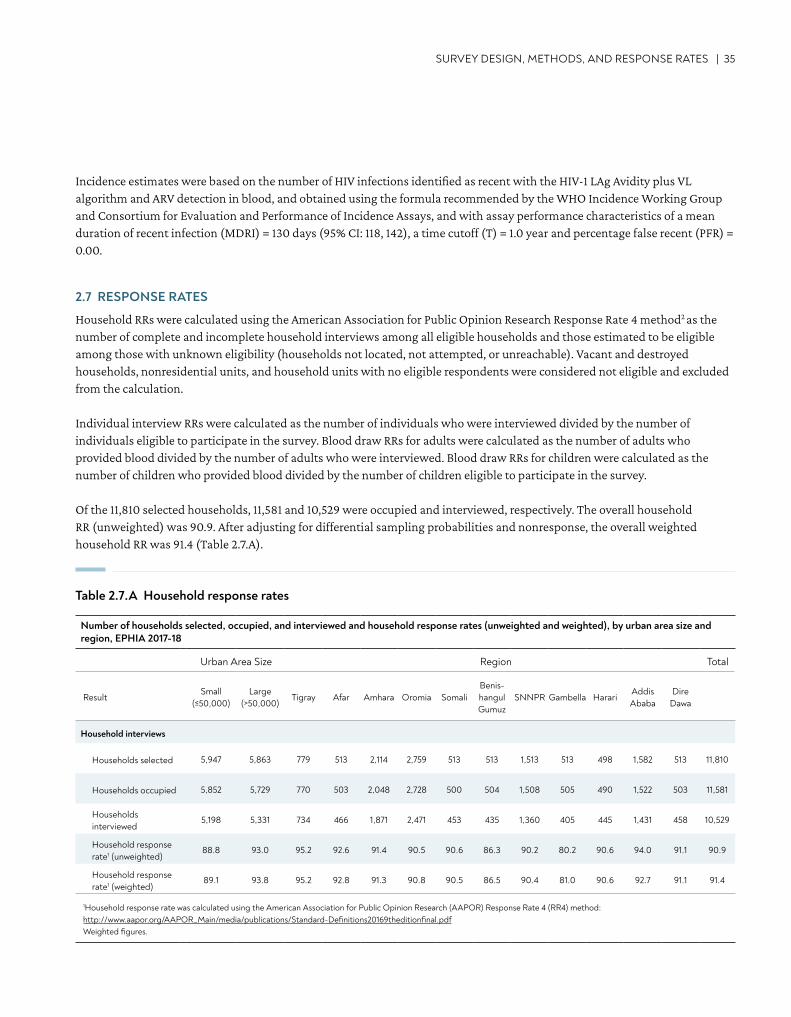
SURVEY DESIGN, METHODS, AND RESPONSE RATES | 35
Incidence estimates were based on the number of HIV infections identified as recent with the HIV-1 LAg Avidity plus VL algorithm and ARV detection in blood, and obtained using the formula recommended by the WHO Incidence Working Group and Consortium for Evaluation and Performance of Incidence Assays, and with assay performance characteristics of a mean duration of recent infection (MDRI) = 130 days (95% CI: 118, 142), a time cutoff (T) = 1.0 year and percentage false recent (PFR) = 0.00.
2.7 RESPONSE RATES
Household RRs were calculated using the American Association for Public Opinion Research Response Rate 4 method2 as the number of complete and incomplete household interviews among all eligible households and those estimated to be eligible among those with unknown eligibility (households not located, not attempted, or unreachable). Vacant and destroyed households, nonresidential units, and household units with no eligible respondents were considered not eligible and excluded from the calculation.
Individual interview RRs were calculated as the number of individuals who were interviewed divided by the number of individuals eligible to participate in the survey. Blood draw RRs for adults were calculated as the number of adults who provided blood divided by the number of adults who were interviewed. Blood draw RRs for children were calculated as the number of children who provided blood divided by the number of children eligible to participate in the survey.
Of the 11,810 selected households, 11,581 and 10,529 were occupied and interviewed, respectively. The overall household RR (unweighted) was 90.9. After adjusting for differential sampling probabilities and nonresponse, the overall weighted household RR was 91.4 (Table 2.7.A).
Table 2.7.A Household response rates
Number of households selected, occupied, and interviewed and household response rates (unweighted and weighted), by urban area size and region, EPHIA 2017-18
Urban Area Size Region Total
ResultSmall
(≤50,000)Large
(>50,000)Tigray Afar Amhara Oromia Somali
Benis-hangul Gumuz
SNNPR Gambella HarariAddis Ababa
Dire Dawa
Household interviews
Households selected 5,947 5,863 779 513 2,114 2,759 513 513 1,513 513 498 1,582 513 11,810
Households occupied 5,852 5,729 770 503 2,048 2,728 500 504 1,508 505 490 1,522 503 11,581
Households interviewed
5,198 5,331 734 466 1,871 2,471 453 435 1,360 405 445 1,431 458 10,529
Household response rate1 (unweighted)
88.8 93.0 95.2 92.6 91.4 90.5 90.6 86.3 90.2 80.2 90.6 94.0 91.1 90.9
Household response rate1 (weighted)
89.1 93.8 95.2 92.8 91.3 90.8 90.5 86.5 90.4 81.0 90.6 92.7 91.1 91.4
1Household response rate was calculated using the American Association for Public Opinion Research (AAPOR) Response Rate 4 (RR4) method: http://www.aapor.org/AAPOR_Main/media/publications/Standard-Definitions20169theditionfinal.pdf Weighted figures.
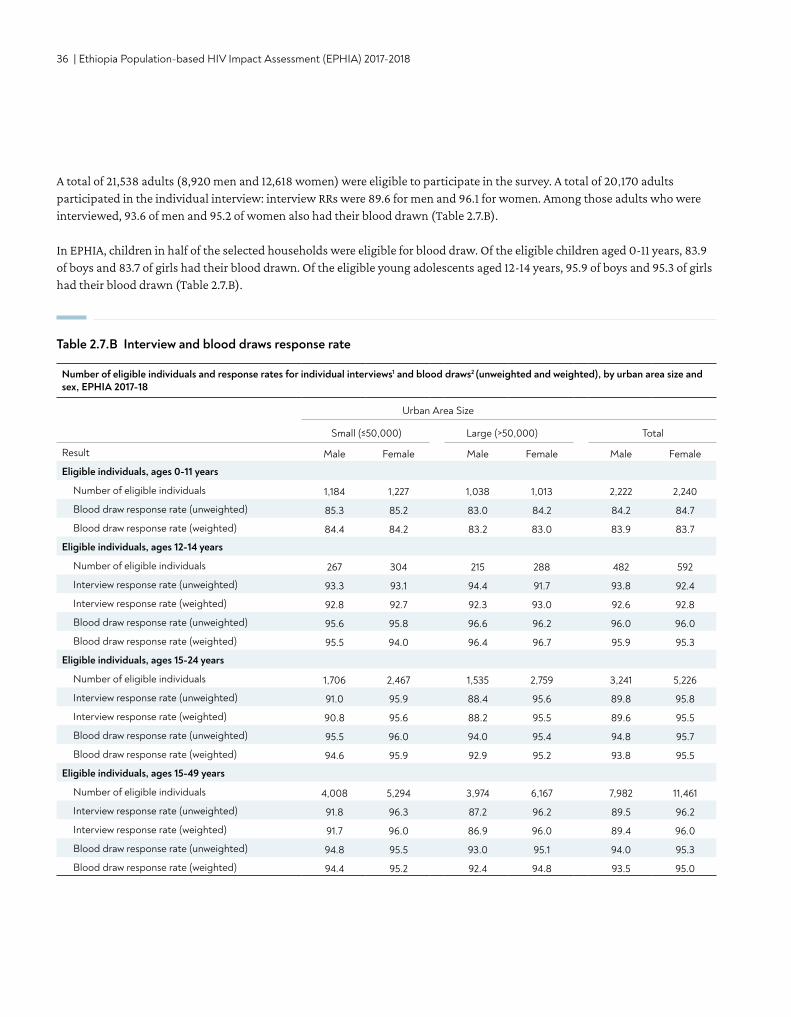
36 | Ethiopia Population-based HIV Impact Assessment (EPHIA) 2017-2018
Number of eligible individuals and response rates for individual interviews1 and blood draws2 (unweighted and weighted), by urban area size and sex, EPHIA 2017-18
Urban Area Size
Small (≤50,000) Large (>50,000) Total
Result Male Female Male Female Male Female
Eligible individuals, ages 0-11 years
Number of eligible individuals 1,184 1,227 1,038 1,013 2,222 2,240
Blood draw response rate (unweighted) 85.3 85.2 83.0 84.2 84.2 84.7
Blood draw response rate (weighted) 84.4 84.2 83.2 83.0 83.9 83.7
Eligible individuals, ages 12-14 years
Number of eligible individuals 267 304 215 288 482 592
Interview response rate (unweighted) 93.3 93.1 94.4 91.7 93.8 92.4
Interview response rate (weighted) 92.8 92.7 92.3 93.0 92.6 92.8
Blood draw response rate (unweighted) 95.6 95.8 96.6 96.2 96.0 96.0
Blood draw response rate (weighted) 95.5 94.0 96.4 96.7 95.9 95.3
Eligible individuals, ages 15-24 years
Number of eligible individuals 1,706 2,467 1,535 2,759 3,241 5,226
Interview response rate (unweighted) 91.0 95.9 88.4 95.6 89.8 95.8
Interview response rate (weighted) 90.8 95.6 88.2 95.5 89.6 95.5
Blood draw response rate (unweighted) 95.5 96.0 94.0 95.4 94.8 95.7
Blood draw response rate (weighted) 94.6 95.9 92.9 95.2 93.8 95.5
Eligible individuals, ages 15-49 years
Number of eligible individuals 4,008 5,294 3,974 6,167 7,982 11,461
Interview response rate (unweighted) 91.8 96.3 87.2 96.2 89.5 96.2
Interview response rate (weighted) 91.7 96.0 86.9 96.0 89.4 96.0
Blood draw response rate (unweighted) 94.8 95.5 93.0 95.1 94.0 95.3
Blood draw response rate (weighted) 94.4 95.2 92.4 94.8 93.5 95.0
A total of 21,538 adults (8,920 men and 12,618 women) were eligible to participate in the survey. A total of 20,170 adults participated in the individual interview: interview RRs were 89.6 for men and 96.1 for women. Among those adults who were interviewed, 93.6 of men and 95.2 of women also had their blood drawn (Table 2.7.B).
In EPHIA, children in half of the selected households were eligible for blood draw. Of the eligible children aged 0-11 years, 83.9 of boys and 83.7 of girls had their blood drawn. Of the eligible young adolescents aged 12-14 years, 95.9 of boys and 95.3 of girls had their blood drawn (Table 2.7.B).
Table 2.7.B Interview and blood draws response rate
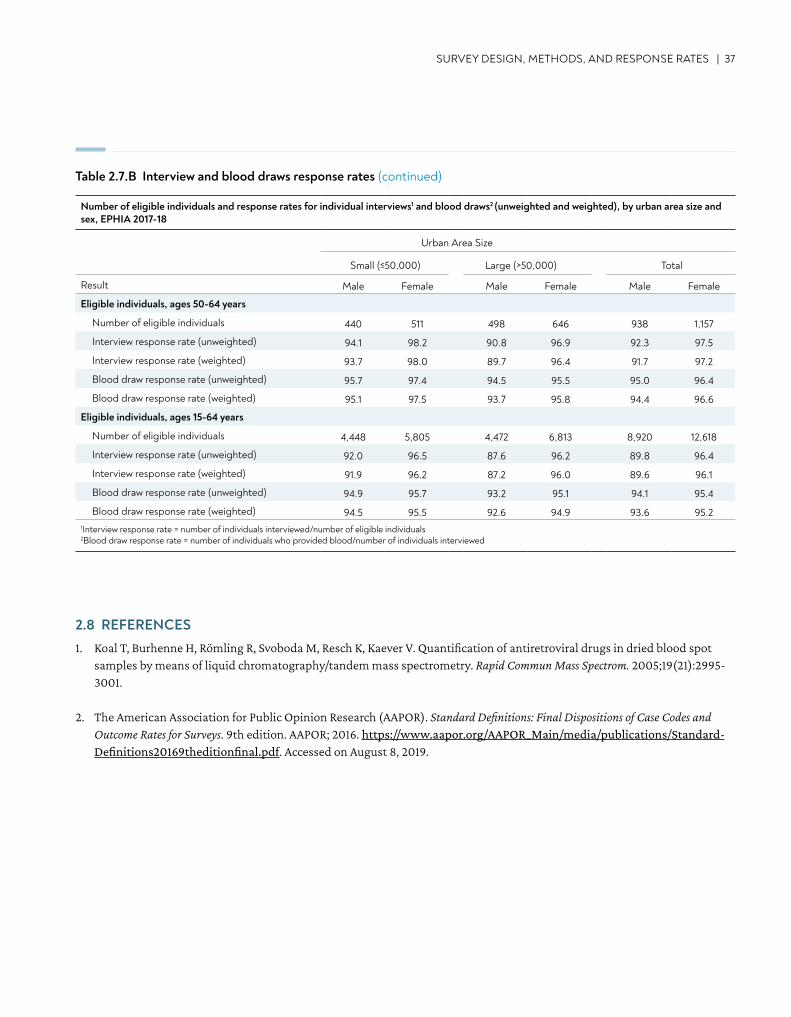
Result
Eligible individuals, ages 50-64 years
Number of eligible individuals 440 511 498 646 938 1,157
Interview response rate (unweighted) 94.1 98.2 90.8 96.9 92.3 97.5
Interview response rate (weighted) 93.7 98.0 89.7 96.4 91.7 97.2
Blood draw response rate (unweighted) 95.7 97.4 94.5 95.5 95.0 96.4
Blood draw response rate (weighted) 95.1 97.5 93.7 95.8 94.4 96.6
Eligible individuals, ages 15-64 years
Number of eligible individuals 4,448 5,805 4,472 6,813 8,920 12,618
Interview response rate (unweighted) 92.0 96.5 87.6 96.2 89.8 96.4
Interview response rate (weighted) 91.9 96.2 87.2 96.0 89.6 96.1
Blood draw response rate (unweighted) 94.9 95.7 93.2 95.1 94.1 95.4
Blood draw response rate (weighted) 94.5 95.5 92.6 94.9 93.6 95.21Interview response rate = number of individuals interviewed/number of eligible individuals 2Blood draw response rate = number of individuals who provided blood/number of individuals interviewed
Table 2.7.B Interview and blood draws response rates (continued)
SURVEY DESIGN, METHODS, AND RESPONSE RATES | 37
2.8 REFERENCES1. Koal T, Burhenne H, Römling R, Svoboda M, Resch K, Kaever V. Quantification of antiretroviral drugs in dried blood spot
samples by means of liquid chromatography/tandem mass spectrometry. Rapid Commun Mass Spectrom. 2005;19(21):2995-3001.
2. The American Association for Public Opinion Research (AAPOR). Standard Definitions: Final Dispositions of Case Codes and Outcome Rates for Surveys. 9th edition. AAPOR; 2016. https://www.aapor.org/AAPOR_Main/media/publications/Standard-Definitions20169theditionfinal.pdf. Accessed on August 8, 2019.
Number of eligible individuals and response rates for individual interviews1 and blood draws2 (unweighted and weighted), by urban area size and sex, EPHIA 2017-18
Urban Area Size
Small (≤50,000) Large (>50,000) Total
Male Female Male Female Male Female
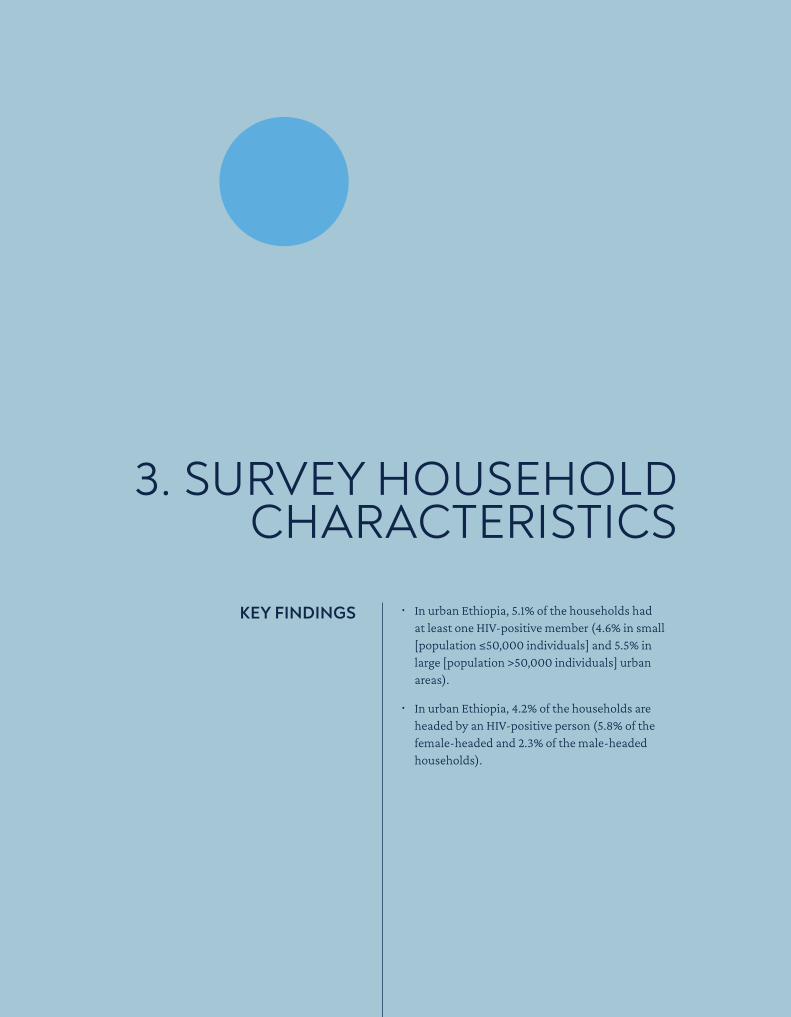
38 | Ethiopia Population-based HIV Impact Assessment (EPHIA) 2017-2018
• In urban Ethiopia, 5.1% of the households had at least one HIV-positive member (4.6% in small [population ≤50,000 individuals] and 5.5% in large [population >50,000 individuals] urban areas).
• In urban Ethiopia, 4.2% of the households are headed by an HIV-positive person (5.8% of the female-headed and 2.3% of the male-headed households).
KEY FINDINGS
3. SURVEY HOUSEHOLD CHARACTERISTICS
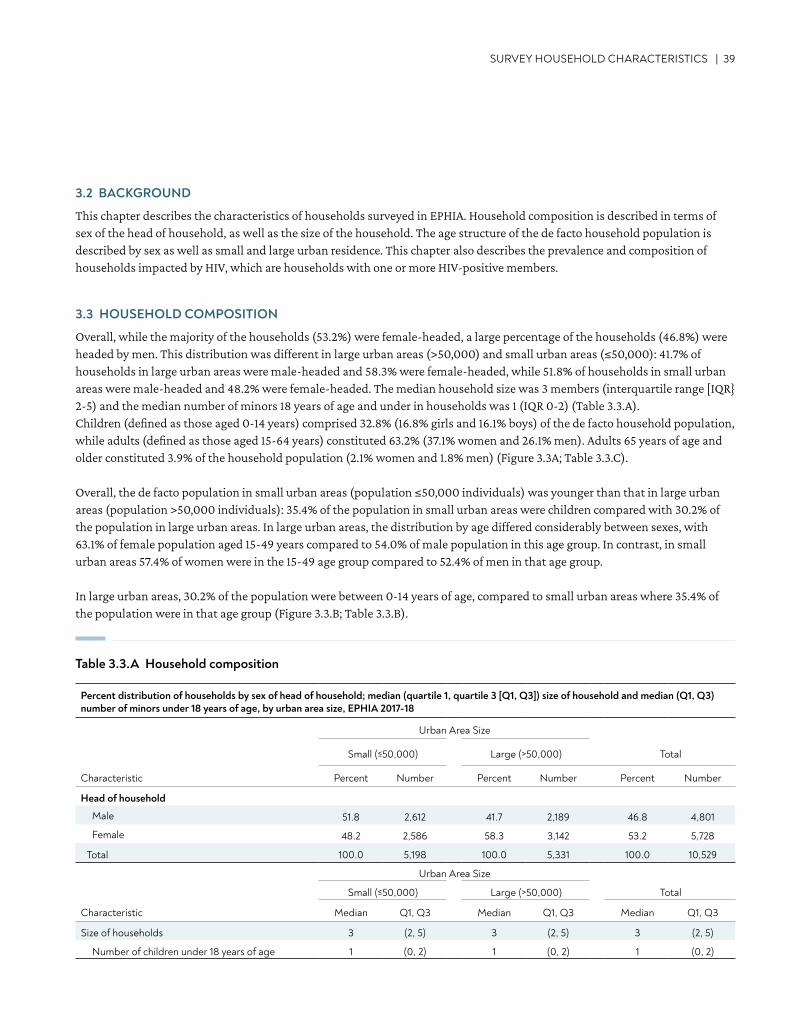
SURVEY HOUSEHOLD CHARACTERISTICS | 39
Percent distribution of households by sex of head of household; median (quartile 1, quartile 3 [Q1, Q3]) size of household and median (Q1, Q3) number of minors under 18 years of age, by urban area size, EPHIA 2017-18
Urban Area Size
Small (≤50,000) Large (>50,000) Total
Characteristic Percent Number Percent Number Percent Number
Head of household
Male 51.8 2,612 41.7 2,189 46.8 4,801
Female 48.2 2,586 58.3 3,142 53.2 5,728
Total 100.0 5,198 100.0 5,331 100.0 10,529
Urban Area Size
Small (≤50,000) Large (>50,000) Total
Characteristic Median Q1, Q3 Median Q1, Q3 Median Q1, Q3
Size of households 3 (2, 5) 3 (2, 5) 3 (2, 5)
Number of children under 18 years of age 1 (0, 2) 1 (0, 2) 1 (0, 2)
Table 3.3.A Household composition
3.2 BACKGROUND
This chapter describes the characteristics of households surveyed in EPHIA. Household composition is described in terms of sex of the head of household, as well as the size of the household. The age structure of the de facto household population is described by sex as well as small and large urban residence. This chapter also describes the prevalence and composition of households impacted by HIV, which are households with one or more HIV-positive members.
3.3 HOUSEHOLD COMPOSITION
Overall, while the majority of the households (53.2%) were female-headed, a large percentage of the households (46.8%) were headed by men. This distribution was different in large urban areas (>50,000) and small urban areas (≤50,000): 41.7% of households in large urban areas were male-headed and 58.3% were female-headed, while 51.8% of households in small urban areas were male-headed and 48.2% were female-headed. The median household size was 3 members (interquartile range [IQR} 2-5) and the median number of minors 18 years of age and under in households was 1 (IQR 0-2) (Table 3.3.A).Children (defined as those aged 0-14 years) comprised 32.8% (16.8% girls and 16.1% boys) of the de facto household population, while adults (defined as those aged 15-64 years) constituted 63.2% (37.1% women and 26.1% men). Adults 65 years of age and older constituted 3.9% of the household population (2.1% women and 1.8% men) (Figure 3.3A; Table 3.3.C).
Overall, the de facto population in small urban areas (population ≤50,000 individuals) was younger than that in large urban areas (population >50,000 individuals): 35.4% of the population in small urban areas were children compared with 30.2% of the population in large urban areas. In large urban areas, the distribution by age differed considerably between sexes, with 63.1% of female population aged 15-49 years compared to 54.0% of male population in this age group. In contrast, in small urban areas 57.4% of women were in the 15-49 age group compared to 52.4% of men in that age group.
In large urban areas, 30.2% of the population were between 0-14 years of age, compared to small urban areas where 35.4% of the population were in that age group (Figure 3.3.B; Table 3.3.B).
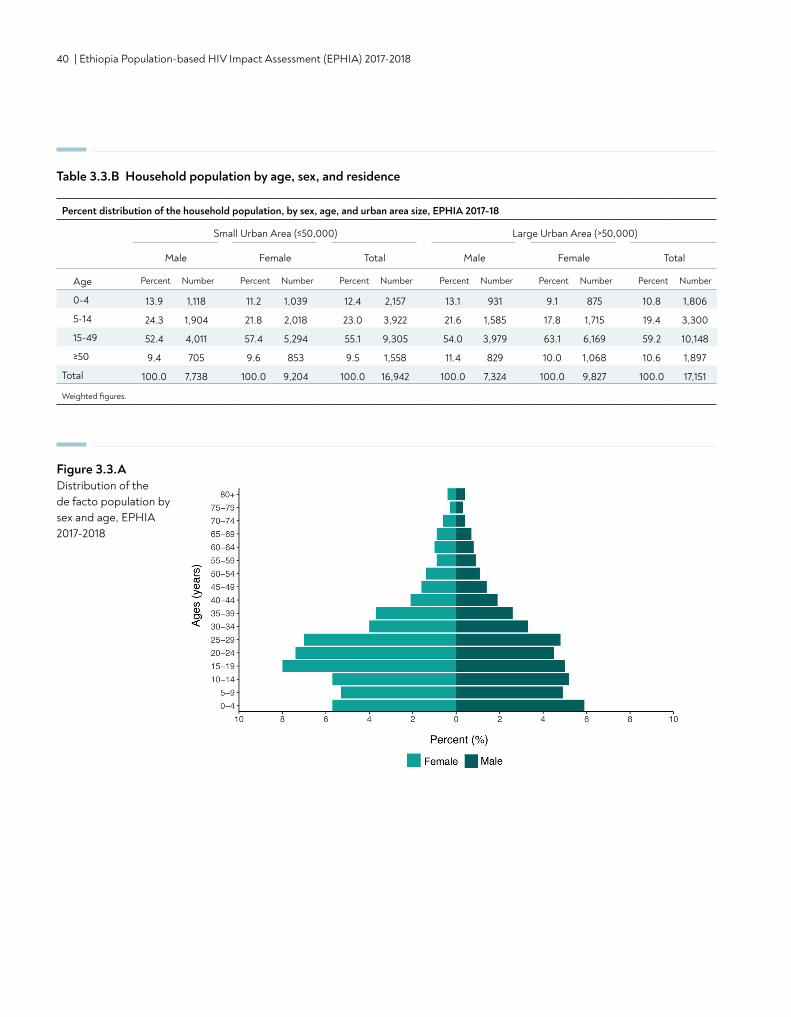
40 | Ethiopia Population-based HIV Impact Assessment (EPHIA) 2017-2018
Percent distribution of the household population, by sex, age, and urban area size, EPHIA 2017-18
Small Urban Area (≤50,000) Large Urban Area (>50,000)
Male Female Total Male Female Total
Age Percent Number Percent Number Percent Number Percent Number Percent Number Percent Number
0-4 13.9 1,118 11.2 1,039 12.4 2,157 13.1 931 9.1 875 10.8 1,806
5-14 24.3 1,904 21.8 2,018 23.0 3,922 21.6 1,585 17.8 1,715 19.4 3,300
15-49 52.4 4,011 57.4 5,294 55.1 9,305 54.0 3,979 63.1 6,169 59.2 10,148
≥50 9.4 705 9.6 853 9.5 1,558 11.4 829 10.0 1,068 10.6 1,897
Total 100.0 7,738 100.0 9,204 100.0 16,942 100.0 7,324 100.0 9,827 100.0 17,151
Weighted figures.
Figure 3.3.ADistribution of the de facto population by sex and age, EPHIA 2017-2018
Table 3.3.B Household population by age, sex, and residence
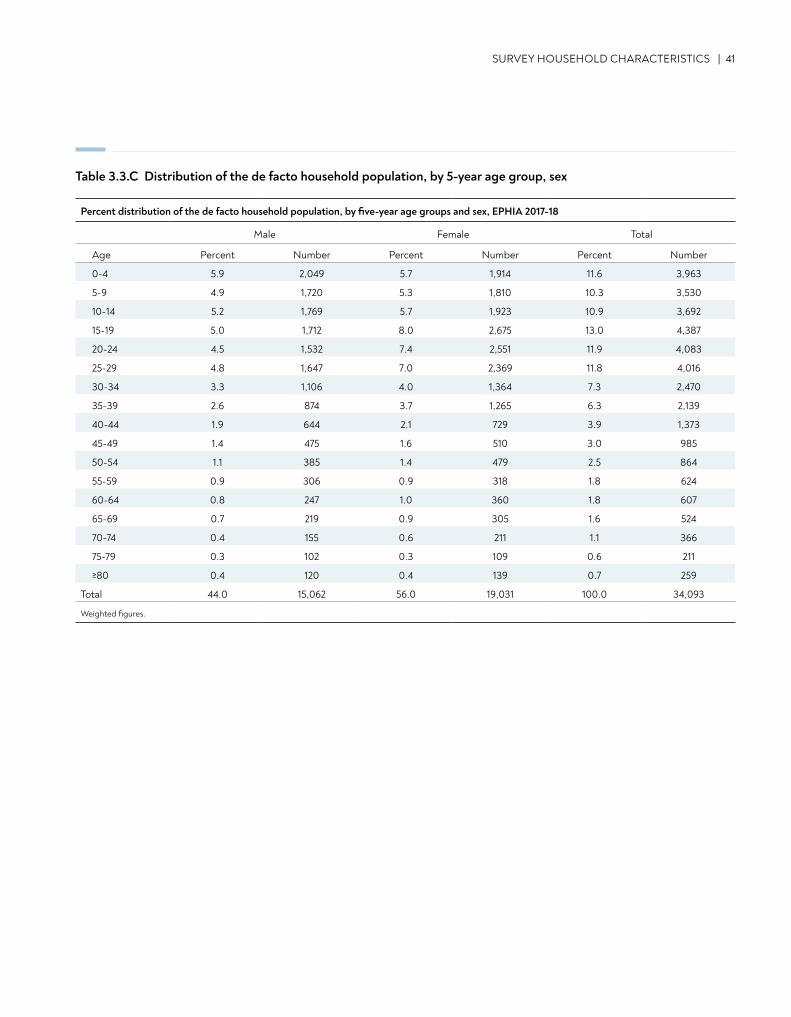
SURVEY HOUSEHOLD CHARACTERISTICS | 41
Percent distribution of the de facto household population, by five-year age groups and sex, EPHIA 2017-18
Male Female Total
Age Percent Number Percent Number Percent Number
0-4 5.9 2,049 5.7 1,914 11.6 3,963
5-9 4.9 1,720 5.3 1,810 10.3 3,530
10-14 5.2 1,769 5.7 1,923 10.9 3,692
15-19 5.0 1,712 8.0 2,675 13.0 4,387
20-24 4.5 1,532 7.4 2,551 11.9 4,083
25-29 4.8 1,647 7.0 2,369 11.8 4,016
30-34 3.3 1,106 4.0 1,364 7.3 2,470
35-39 2.6 874 3.7 1,265 6.3 2,139
40-44 1.9 644 2.1 729 3.9 1,373
45-49 1.4 475 1.6 510 3.0 985
50-54 1.1 385 1.4 479 2.5 864
55-59 0.9 306 0.9 318 1.8 624
60-64 0.8 247 1.0 360 1.8 607
65-69 0.7 219 0.9 305 1.6 524
70-74 0.4 155 0.6 211 1.1 366
75-79 0.3 102 0.3 109 0.6 211
≥80 0.4 120 0.4 139 0.7 259
Total 44.0 15,062 56.0 19,031 100.0 34,093
Weighted figures.
Table 3.3.C Distribution of the de facto household population, by 5-year age group, sex
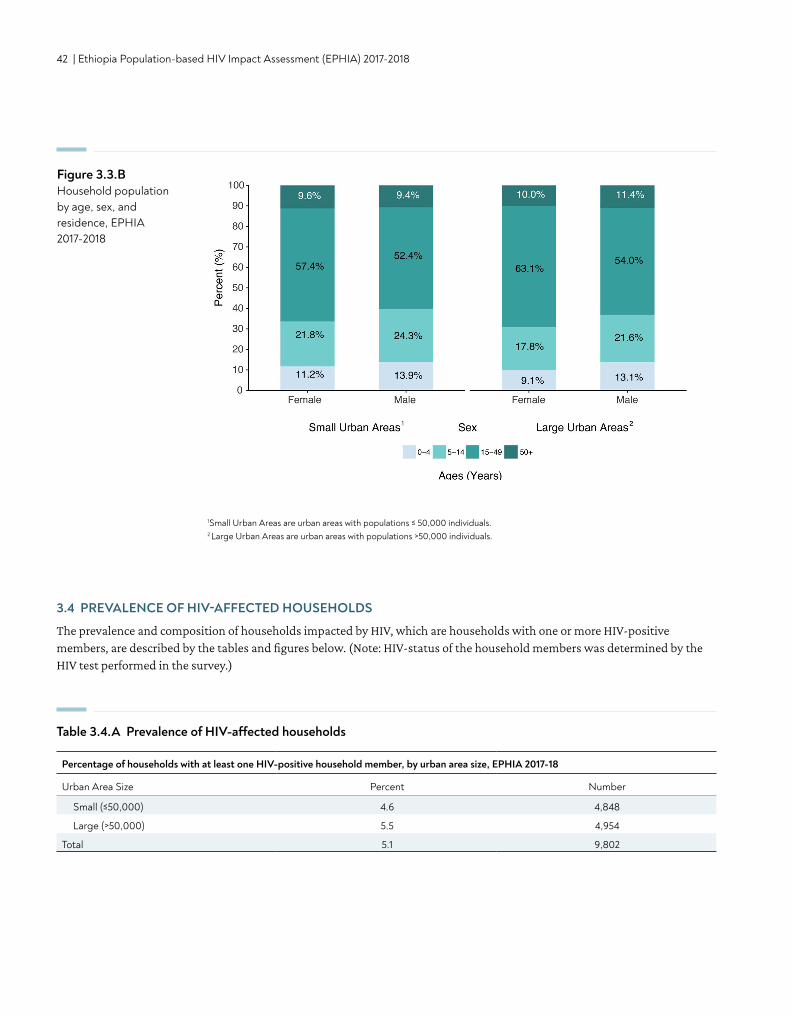
42 | Ethiopia Population-based HIV Impact Assessment (EPHIA) 2017-2018
3.4 PREVALENCE OF HIV-AFFECTED HOUSEHOLDS
The prevalence and composition of households impacted by HIV, which are households with one or more HIV-positive members, are described by the tables and figures below. (Note: HIV-status of the household members was determined by the HIV test performed in the survey.)
Table 3.4.A Prevalence of HIV-affected households
Percentage of households with at least one HIV-positive household member, by urban area size, EPHIA 2017-18
Urban Area Size Percent Number
Small (≤50,000) 4.6 4,848
Large (>50,000) 5.5 4,954
Total 5.1 9,802
Figure 3.3.BHousehold population by age, sex, and residence, EPHIA 2017-2018
1Small Urban Areas are urban areas with populations ≤ 50,000 individuals.2 Large Urban Areas are urban areas with populations >50,000 individuals.
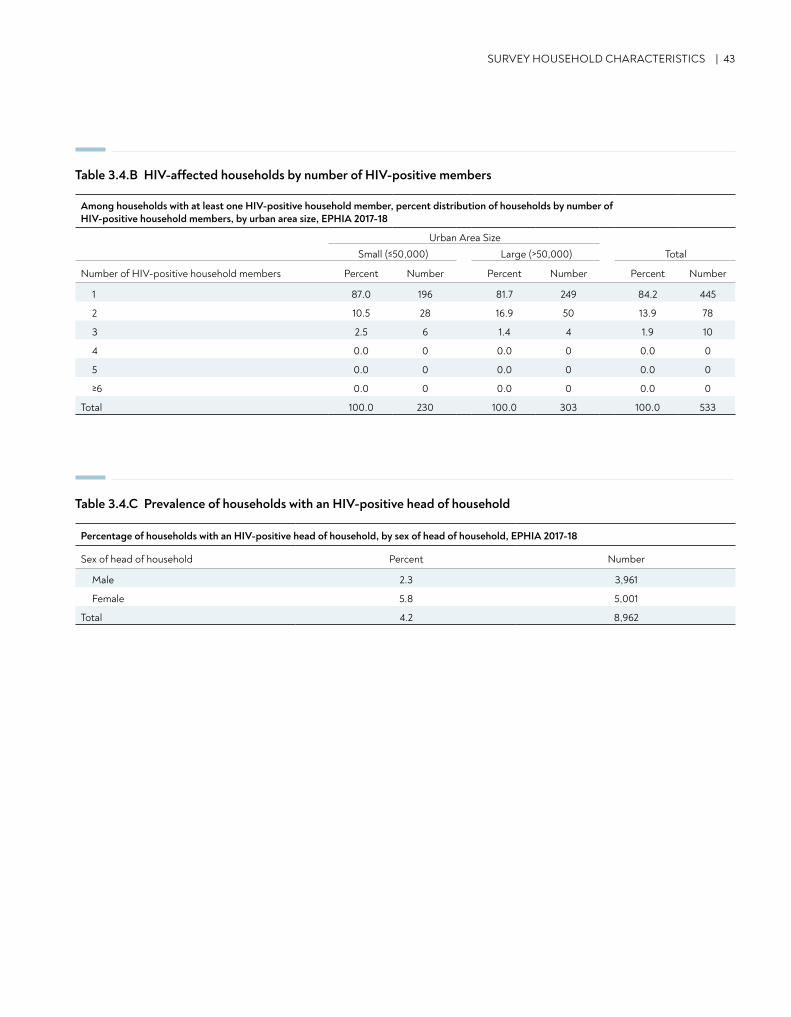
SURVEY HOUSEHOLD CHARACTERISTICS | 43
Table 3.4.B HIV-affected households by number of HIV-positive members
Table 3.4.C Prevalence of households with an HIV-positive head of household
Among households with at least one HIV-positive household member, percent distribution of households by number of HIV-positive household members, by urban area size, EPHIA 2017-18
Urban Area SizeSmall (≤50,000) Large (>50,000) Total
Number of HIV-positive household members Percent Number Percent Number Percent Number
1 87.0 196 81.7 249 84.2 445
2 10.5 28 16.9 50 13.9 78
3 2.5 6 1.4 4 1.9 10
4 0.0 0 0.0 0 0.0 0
5 0.0 0 0.0 0 0.0 0
≥6 0.0 0 0.0 0 0.0 0
Total 100.0 230 100.0 303 100.0 533
Percentage of households with an HIV-positive head of household, by sex of head of household, EPHIA 2017-18
Sex of head of household Percent Number
Male 2.3 3,961
Female 5.8 5,001
Total 4.2 8,962
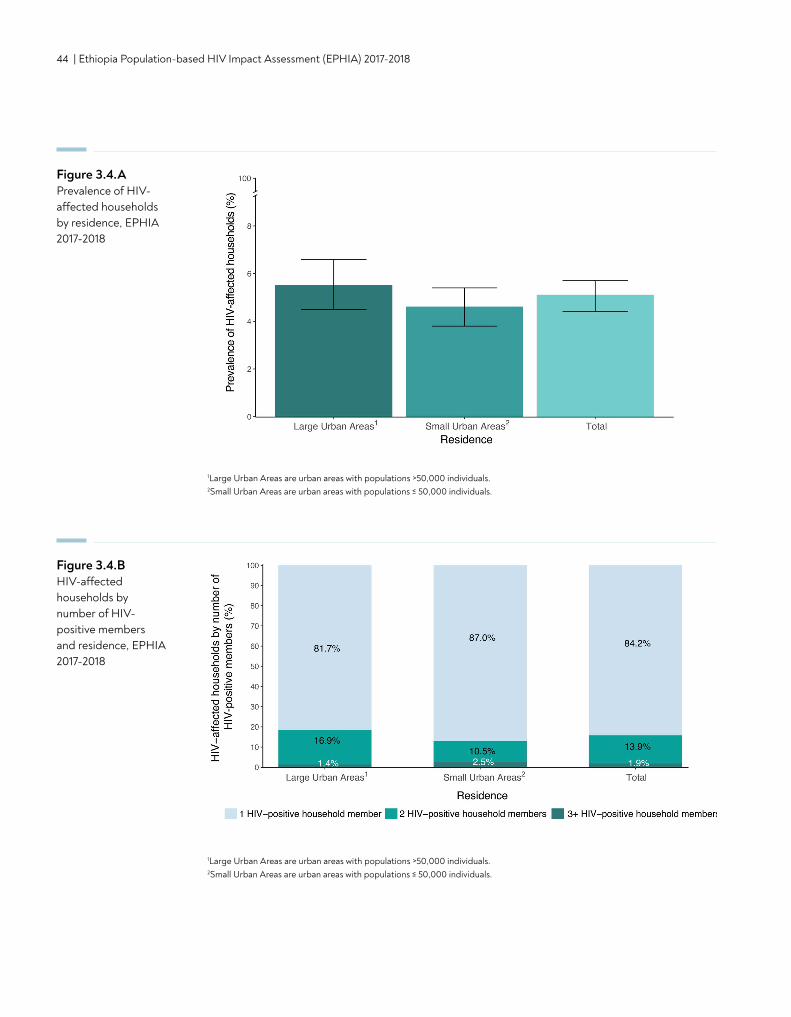
44 | Ethiopia Population-based HIV Impact Assessment (EPHIA) 2017-2018
1Large Urban Areas are urban areas with populations >50,000 individuals.2Small Urban Areas are urban areas with populations ≤ 50,000 individuals.
Figure 3.4.BHIV-affected households by number of HIV-positive members and residence, EPHIA 2017-2018
1Large Urban Areas are urban areas with populations >50,000 individuals.2Small Urban Areas are urban areas with populations ≤ 50,000 individuals.
Figure 3.4.A Prevalence of HIV-affected households by residence, EPHIA 2017-2018
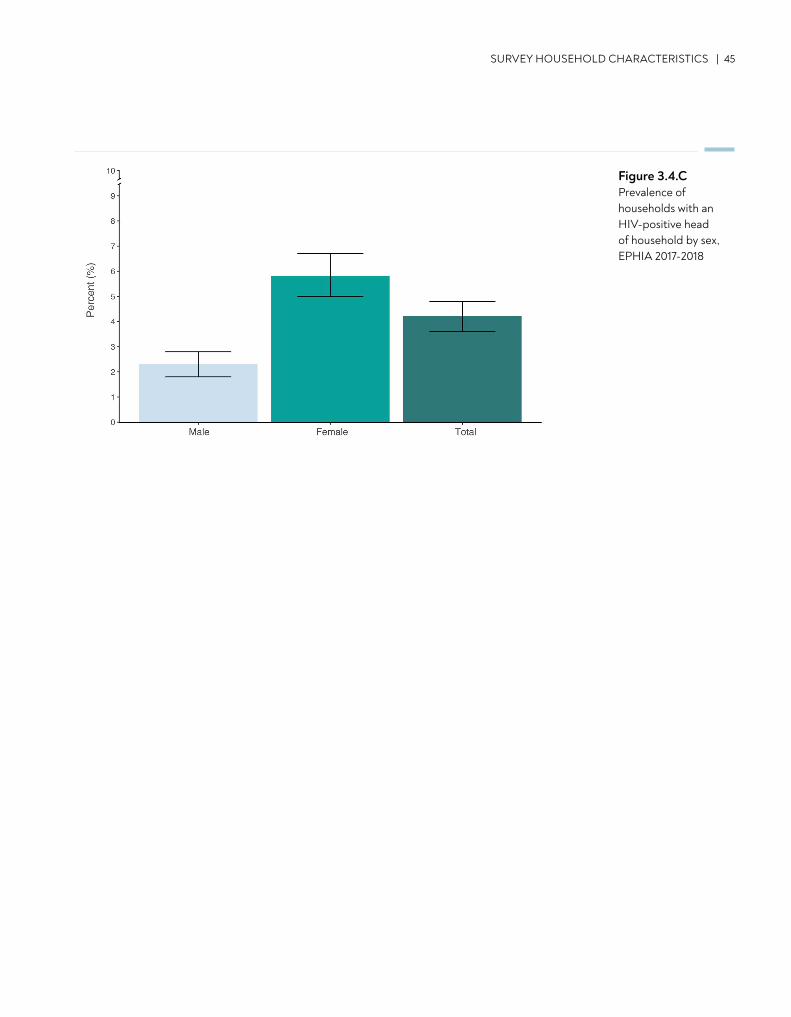
Figure 3.4.CPrevalence of households with an HIV-positive head of household by sex, EPHIA 2017-2018
SURVEY HOUSEHOLD CHARACTERISTICS | 45
46 | Ethiopia Population-based HIV Impact Assessment (EPHIA) 2017-2018
• Among adult respondents (those aged 15-64 years), 17.4% were older adolescents (15-19 years of age), 72.7% were aged 20-49 years, and 9.9% were aged 50-64 years.
• Approximately half of the respondents were residing in small urban areas, 49.2% of adults and 54.2% of children (those aged 0-14 years).
KEY FINDINGS
4. SURVEY RESPONDENT CHARACTERISTICS
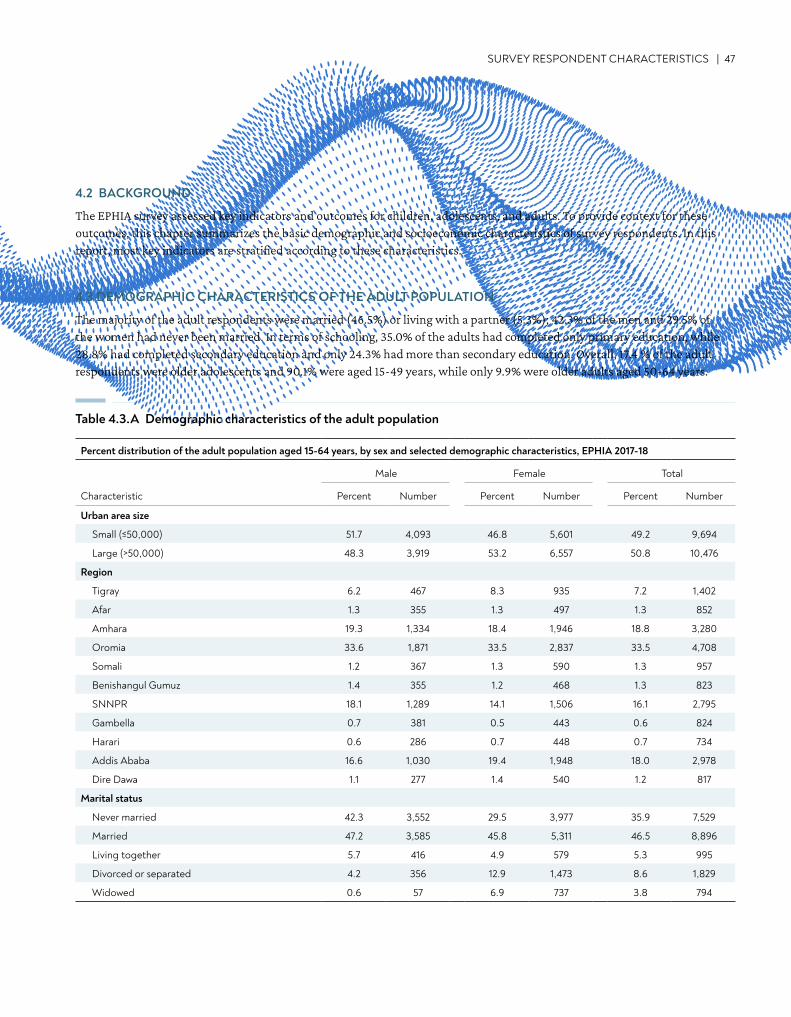
SURVEY RESPONDENT CHARACTERISTICS | 47
4.2 BACKGROUND
The EPHIA survey assessed key indicators and outcomes for children, adolescents, and adults. To provide context for these outcomes, this chapter summarizes the basic demographic and socioeconomic characteristics of survey respondents. In this report, most key indicators are stratified according to these characteristics.
4.3 DEMOGRAPHIC CHARACTERISTICS OF THE ADULT POPULATION
The majority of the adult respondents were married (46.5%) or living with a partner (5.3%); 42.3% of the men and 29.5% of the women had never been married. In terms of schooling, 35.0% of the adults had completed only primary education, while 28.8% had completed secondary education and only 24.3% had more than secondary education. Overall, 17.4 % of the adult respondents were older adolescents and 90.1% were aged 15-49 years, while only 9.9% were older adults aged 50-64 years.
Percent distribution of the adult population aged 15-64 years, by sex and selected demographic characteristics, EPHIA 2017-18
Male Female Total
Characteristic Percent Number Percent Number Percent Number
Urban area size
Small (≤50,000) 51.7 4,093 46.8 5,601 49.2 9,694
Large (>50,000) 48.3 3,919 53.2 6,557 50.8 10,476
Region
Tigray 6.2 467 8.3 935 7.2 1,402
Afar 1.3 355 1.3 497 1.3 852
Amhara 19.3 1,334 18.4 1,946 18.8 3,280
Oromia 33.6 1,871 33.5 2,837 33.5 4,708
Somali 1.2 367 1.3 590 1.3 957
Benishangul Gumuz 1.4 355 1.2 468 1.3 823
SNNPR 18.1 1,289 14.1 1,506 16.1 2,795
Gambella 0.7 381 0.5 443 0.6 824
Harari 0.6 286 0.7 448 0.7 734
Addis Ababa 16.6 1,030 19.4 1,948 18.0 2,978
Dire Dawa 1.1 277 1.4 540 1.2 817
Marital status
Never married 42.3 3,552 29.5 3,977 35.9 7,529
Married 47.2 3,585 45.8 5,311 46.5 8,896
Living together 5.7 416 4.9 579 5.3 995
Divorced or separated 4.2 356 12.9 1,473 8.6 1,829
Widowed 0.6 57 6.9 737 3.8 794
Table 4.3.A Demographic characteristics of the adult population
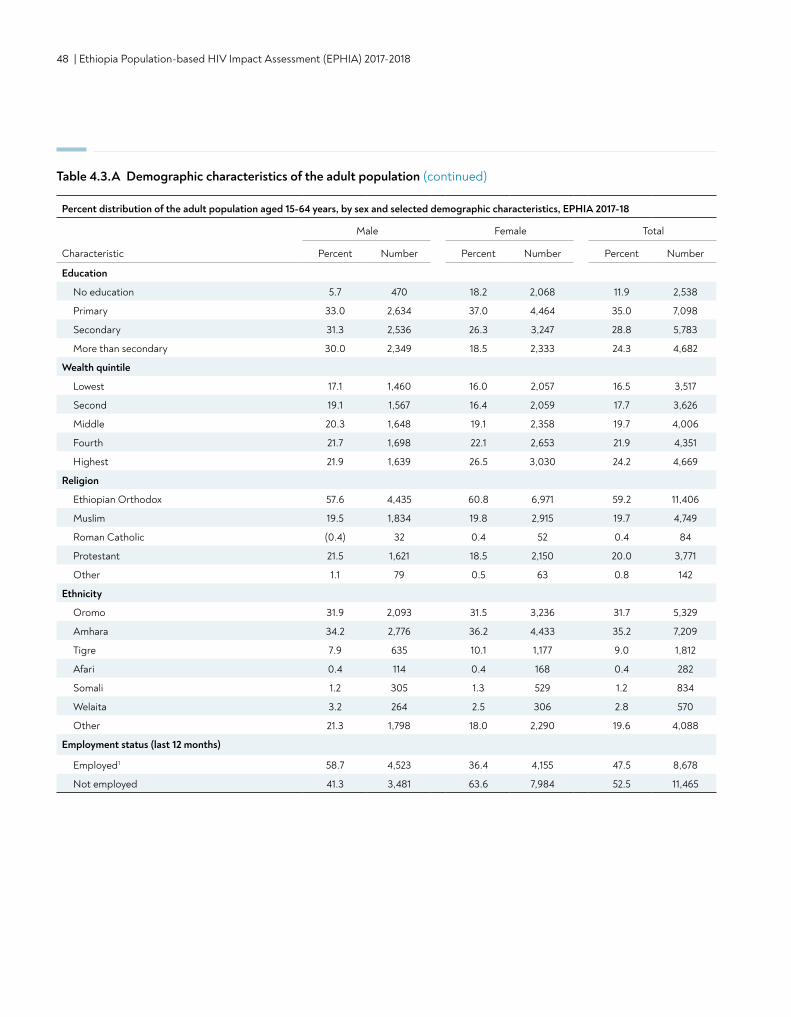
48 | Ethiopia Population-based HIV Impact Assessment (EPHIA) 2017-2018
Percent distribution of the adult population aged 15-64 years, by sex and selected demographic characteristics, EPHIA 2017-18
Male Female Total
Characteristic Percent Number Percent Number Percent Number
Education
No education 5.7 470 18.2 2,068 11.9 2,538
Primary 33.0 2,634 37.0 4,464 35.0 7,098
Secondary 31.3 2,536 26.3 3,247 28.8 5,783
More than secondary 30.0 2,349 18.5 2,333 24.3 4,682
Wealth quintile
Lowest 17.1 1,460 16.0 2,057 16.5 3,517
Second 19.1 1,567 16.4 2,059 17.7 3,626
Middle 20.3 1,648 19.1 2,358 19.7 4,006
Fourth 21.7 1,698 22.1 2,653 21.9 4,351
Highest 21.9 1,639 26.5 3,030 24.2 4,669
Religion
Ethiopian Orthodox 57.6 4,435 60.8 6,971 59.2 11,406
Muslim 19.5 1,834 19.8 2,915 19.7 4,749
Roman Catholic (0.4) 32 0.4 52 0.4 84
Protestant 21.5 1,621 18.5 2,150 20.0 3,771
Other 1.1 79 0.5 63 0.8 142
Ethnicity
Oromo 31.9 2,093 31.5 3,236 31.7 5,329
Amhara 34.2 2,776 36.2 4,433 35.2 7,209
Tigre 7.9 635 10.1 1,177 9.0 1,812
Afari 0.4 114 0.4 168 0.4 282
Somali 1.2 305 1.3 529 1.2 834
Welaita 3.2 264 2.5 306 2.8 570
Other 21.3 1,798 18.0 2,290 19.6 4,088
Employment status (last 12 months)
Employed1 58.7 4,523 36.4 4,155 47.5 8,678
Not employed 41.3 3,481 63.6 7,984 52.5 11,465
Table 4.3.A Demographic characteristics of the adult population (continued)
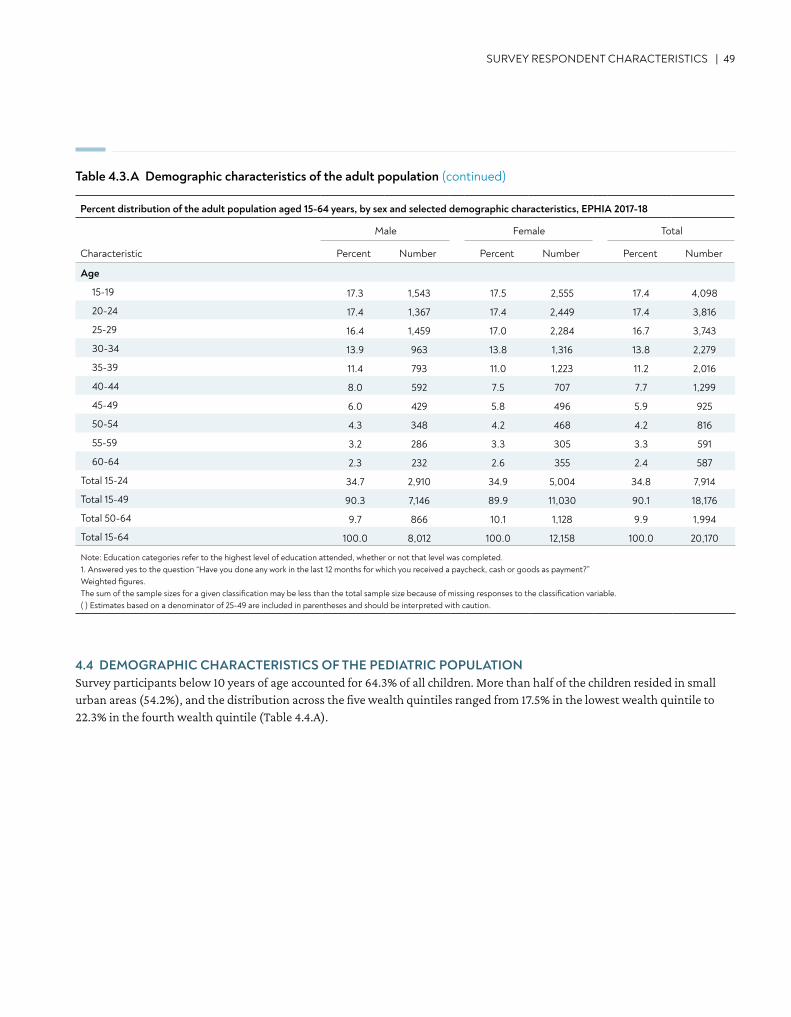
SURVEY RESPONDENT CHARACTERISTICS | 49
Table 4.3.A Demographic characteristics of the adult population (continued)
Percent distribution of the adult population aged 15-64 years, by sex and selected demographic characteristics, EPHIA 2017-18
Male Female Total
Characteristic Percent Number Percent Number Percent Number
Age
15-19 17.3 1,543 17.5 2,555 17.4 4,098
20-24 17.4 1,367 17.4 2,449 17.4 3,816
25-29 16.4 1,459 17.0 2,284 16.7 3,743
30-34 13.9 963 13.8 1,316 13.8 2,279
35-39 11.4 793 11.0 1,223 11.2 2,016
40-44 8.0 592 7.5 707 7.7 1,299
45-49 6.0 429 5.8 496 5.9 925
50-54 4.3 348 4.2 468 4.2 816
55-59 3.2 286 3.3 305 3.3 591
60-64 2.3 232 2.6 355 2.4 587
Total 15-24 34.7 2,910 34.9 5,004 34.8 7,914
Total 15-49 90.3 7,146 89.9 11,030 90.1 18,176
Total 50-64 9.7 866 10.1 1,128 9.9 1,994
Total 15-64 100.0 8,012 100.0 12,158 100.0 20,170
Note: Education categories refer to the highest level of education attended, whether or not that level was completed. 1. Answered yes to the question “Have you done any work in the last 12 months for which you received a paycheck, cash or goods as payment?” Weighted figures. The sum of the sample sizes for a given classification may be less than the total sample size because of missing responses to the classification variable.( ) Estimates based on a denominator of 25-49 are included in parentheses and should be interpreted with caution.
4.4 DEMOGRAPHIC CHARACTERISTICS OF THE PEDIATRIC POPULATIONSurvey participants below 10 years of age accounted for 64.3% of all children. More than half of the children resided in small urban areas (54.2%), and the distribution across the five wealth quintiles ranged from 17.5% in the lowest wealth quintile to 22.3% in the fourth wealth quintile (Table 4.4.A).
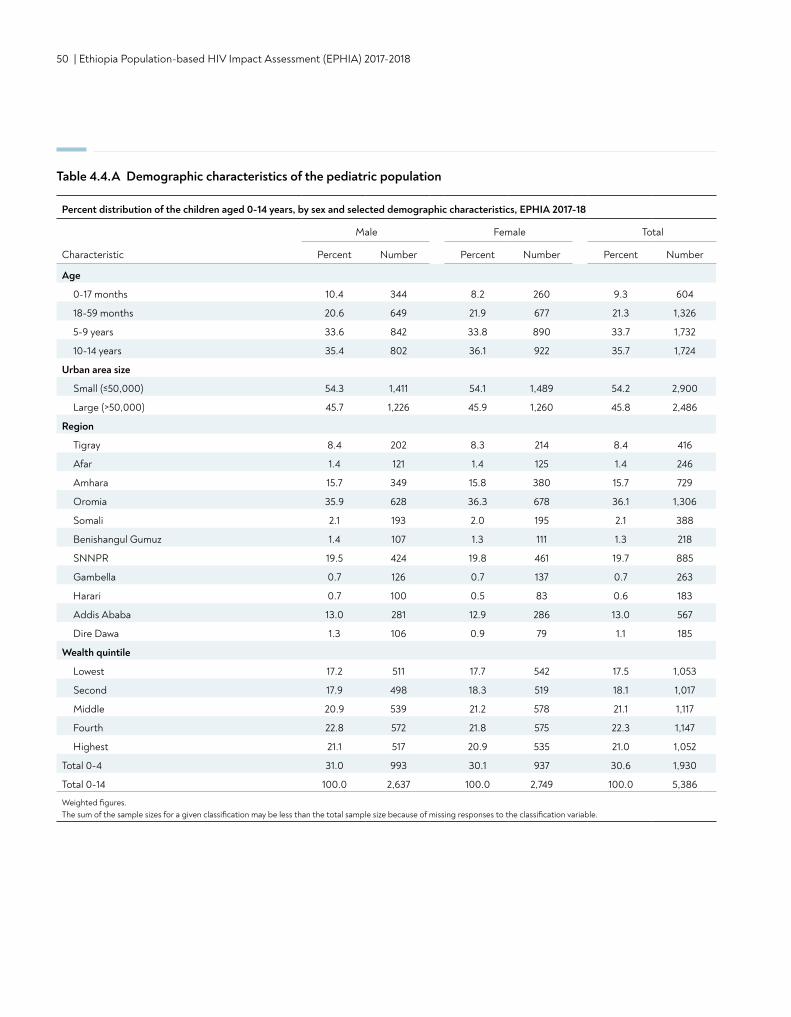
50 | Ethiopia Population-based HIV Impact Assessment (EPHIA) 2017-2018
Table 4.4.A Demographic characteristics of the pediatric population
Percent distribution of the children aged 0-14 years, by sex and selected demographic characteristics, EPHIA 2017-18
Male Female Total
Characteristic Percent Number Percent Number Percent Number
Age
0-17 months 10.4 344 8.2 260 9.3 604
18-59 months 20.6 649 21.9 677 21.3 1,326
5-9 years 33.6 842 33.8 890 33.7 1,732
10-14 years 35.4 802 36.1 922 35.7 1,724
Urban area size
Small (≤50,000) 54.3 1,411 54.1 1,489 54.2 2,900
Large (>50,000) 45.7 1,226 45.9 1,260 45.8 2,486
Region
Tigray 8.4 202 8.3 214 8.4 416
Afar 1.4 121 1.4 125 1.4 246
Amhara 15.7 349 15.8 380 15.7 729
Oromia 35.9 628 36.3 678 36.1 1,306
Somali 2.1 193 2.0 195 2.1 388
Benishangul Gumuz 1.4 107 1.3 111 1.3 218
SNNPR 19.5 424 19.8 461 19.7 885
Gambella 0.7 126 0.7 137 0.7 263
Harari 0.7 100 0.5 83 0.6 183
Addis Ababa 13.0 281 12.9 286 13.0 567
Dire Dawa 1.3 106 0.9 79 1.1 185
Wealth quintile
Lowest 17.2 511 17.7 542 17.5 1,053
Second 17.9 498 18.3 519 18.1 1,017
Middle 20.9 539 21.2 578 21.1 1,117
Fourth 22.8 572 21.8 575 22.3 1,147
Highest 21.1 517 20.9 535 21.0 1,052
Total 0-4 31.0 993 30.1 937 30.6 1,930
Total 0-14 100.0 2,637 100.0 2,749 100.0 5,386
Weighted figures. The sum of the sample sizes for a given classification may be less than the total sample size because of missing responses to the classification variable.

CONTENT | 51
5. HIV INCIDENCE IN ADULTS
• Incidence of HIV infection in 2017-2018 among adults (ages 15-64 years) in urban Ethiopia was 0.05%. This corresponds to approximately 6,000 new cases of HIV among adults living in urban Ethiopia.
KEY FINDINGS
52 | Ethiopia Population-based HIV Impact Assessment (EPHIA) 2017-2018
5.2 BACKGROUND
HIV incidence is the measure of new HIV infections in a population over time, providing critical information on the status of the HIV epidemic. Changes in HIV incidence can be used for effective targeted HIV prevention planning in groups that are most vulnerable to infection and to measure impact of HIV prevention programs. HIV incidence is optimal for measuring acute changes in an HIV epidemic, including changes in HIV transmission, as opposed to HIV prevalence, which is a measure of the relative burden of disease in a population. This chapter presents annual estimates of HIV incidence in 2017-2018 among adults in urban areas at the national level. For the purposes of this analysis, HIV incidence is expressed as the cumulative incidence or risk of new infections in a 12-month period, which is a close approximation to the instantaneous incidence rate. It is important to note that the EPHIA primary objective was to estimate prevalence of VLS, to which the sample size was powered. Therefore, the estimate for incidence rates should be interpreted with caution.
Two laboratory-based incidence testing algorithms (HIV-1 LAg avidity plus VL and HIV-1 LAg avidity plus VL and ARV detection) were used to distinguish recent from long-term infection. Incidence estimates were obtained using the formula recommended by the WHO Incidence Working Group and Consortium for Evaluation and Performance of Incidence Assays, and with assay performance characteristics of an MDRI = 130 days (95% CI: 118, 142), with T = 1.0 year and residual PFR = 0.00. Survey weights are utilized for all estimates. All HIV-positive participants 18 months and older were tested for recent infection using HIV-1 LAg avidity assay.
Incidence estimation is based on recent/long-term (LT) classification using algorithms with LAg avidity.1,2,3 The first testing algorithm (i.e., HIV-1 LAg avidity plus VL) uses VL testing to exclude specimens with low VL and limit misclassification of persons as recent infections who are elite controllers or on effective ART. The second algorithm (i.e., HIV-1 LAg avidity plus VL and ARV detection) uses ARV detection to exclude specimens with high VL and limit misclassification as recent infections of persons who are on ART but have drug resistance or poor treatment adherence. (Note: In EPHIA, one case was reclassified as recent because the participant reported having an initial positive HIV test and ART initiation within three months of the survey interview.)
5.3 HIV INCIDENCE AMONG ADULTS
HIV incidence estimates using LAg avidity and HIV viral load Using the LAg avidity assay and VL algorithm, estimated HIV incidence was 0.06% (95% CI: 0.00-0.12) among adults (those aged 15-64 years). This corresponds to approximately 7,000 new cases of HIV annually in 2017-2018 among adults living in urban Ethiopia. Incidence estimates are based on a small number of recent infections. EPHIA was not powered to estimate incidence in urban areas at the national level; therefore, these estimates should be interpreted with caution (Table 5.3.A).
HIV incidence estimates using LAg avidity, HIV viral load, and ARV detectionUsing the LAg avidity, VL, and ARV detection algorithm, estimated incidence was 0.05% (95% CI: 0.00-0.10) among adults (Table 5.3.B). This corresponds to approximately 6,000 new cases of HIV annually in 2017-2018 among adults living in urban Ethiopia (Table 5.3.C). Incidence estimates are based on a small number of recent infections. EPHIA was not powered to estimate HIV incidence in urban areas at the national level; therefore, these estimates should be interpreted with caution.
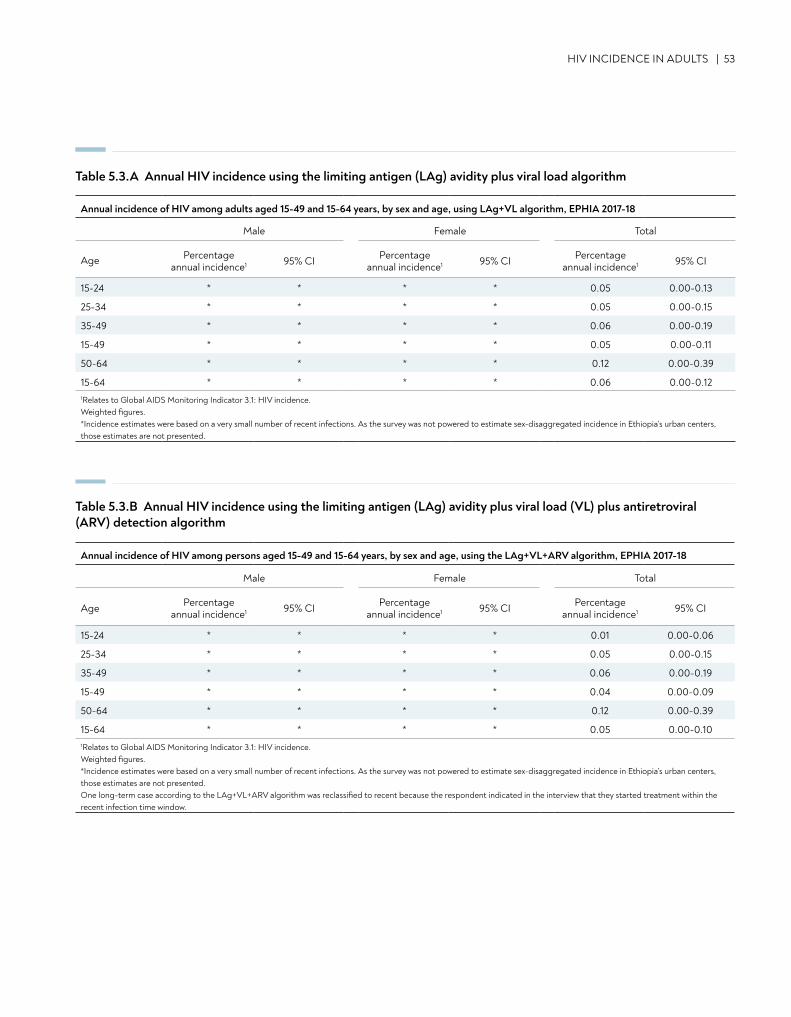
HIV INCIDENCE IN ADULTS | 53
Table 5.3.A Annual HIV incidence using the limiting antigen (LAg) avidity plus viral load algorithm
Annual incidence of HIV among adults aged 15-49 and 15-64 years, by sex and age, using LAg+VL algorithm, EPHIA 2017-18
Male Female Total
Age Percentage annual incidence1 95% CI Percentage
annual incidence1 95% CI Percentage annual incidence1 95% CI
15-24 * * * * 0.05 0.00-0.13
25-34 * * * * 0.05 0.00-0.15
35-49 * * * * 0.06 0.00-0.19
15-49 * * * * 0.05 0.00-0.11
50-64 * * * * 0.12 0.00-0.39
15-64 * * * * 0.06 0.00-0.121Relates to Global AIDS Monitoring Indicator 3.1: HIV incidence. Weighted figures. *Incidence estimates were based on a very small number of recent infections. As the survey was not powered to estimate sex-disaggregated incidence in Ethiopia’s urban centers, those estimates are not presented.
Table 5.3.B Annual HIV incidence using the limiting antigen (LAg) avidity plus viral load (VL) plus antiretroviral (ARV) detection algorithm
Annual incidence of HIV among persons aged 15-49 and 15-64 years, by sex and age, using the LAg+VL+ARV algorithm, EPHIA 2017-18
Male Female Total
Age Percentage annual incidence1 95% CI Percentage
annual incidence1 95% CI Percentage annual incidence1 95% CI
15-24 * * * * 0.01 0.00-0.06
25-34 * * * * 0.05 0.00-0.15
35-49 * * * * 0.06 0.00-0.19
15-49 * * * * 0.04 0.00-0.09
50-64 * * * * 0.12 0.00-0.39
15-64 * * * * 0.05 0.00-0.101Relates to Global AIDS Monitoring Indicator 3.1: HIV incidence. Weighted figures.*Incidence estimates were based on a very small number of recent infections. As the survey was not powered to estimate sex-disaggregated incidence in Ethiopia’s urban centers, those estimates are not presented.One long-term case according to the LAg+VL+ARV algorithm was reclassified to recent because the respondent indicated in the interview that they started treatment within the recent infection time window.
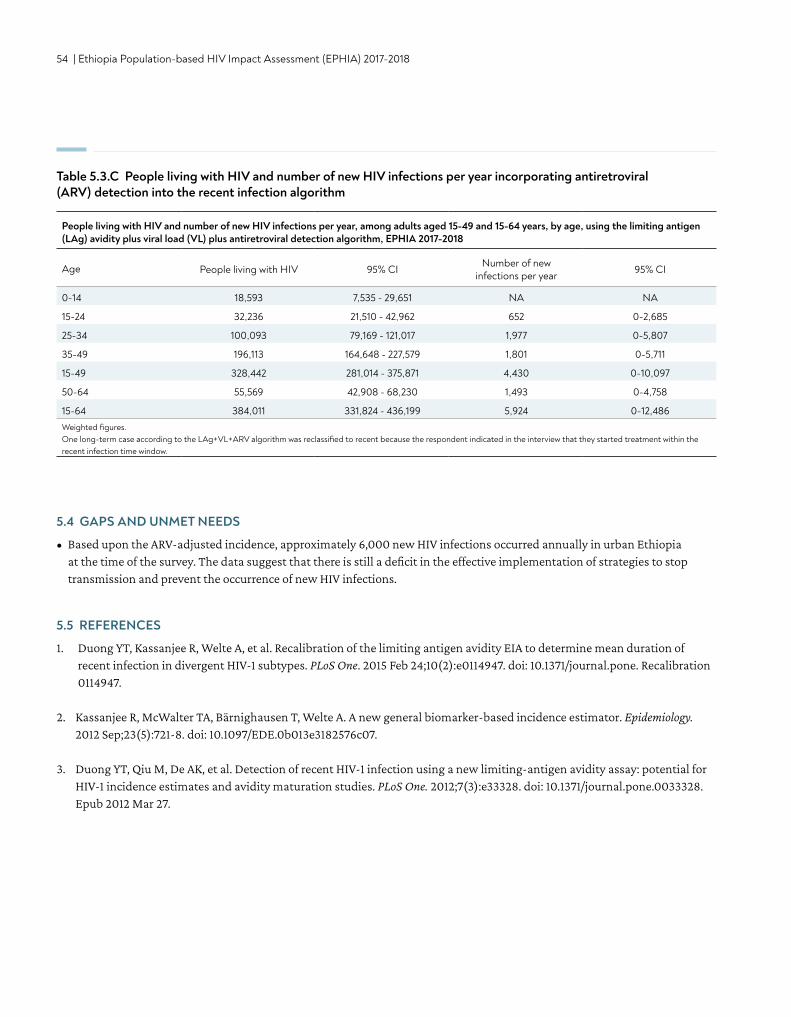
54 | Ethiopia Population-based HIV Impact Assessment (EPHIA) 2017-2018
Table 5.3.C People living with HIV and number of new HIV infections per year incorporating antiretroviral (ARV) detection into the recent infection algorithm
People living with HIV and number of new HIV infections per year, among adults aged 15-49 and 15-64 years, by age, using the limiting antigen (LAg) avidity plus viral load (VL) plus antiretroviral detection algorithm, EPHIA 2017-2018
Age People living with HIV 95% CI Number of new infections per year 95% CI
0-14 18,593 7,535 - 29,651 NA NA
15-24 32,236 21,510 - 42,962 652 0-2,685
25-34 100,093 79,169 - 121,017 1,977 0-5,807
35-49 196,113 164,648 - 227,579 1,801 0-5,711
15-49 328,442 281,014 - 375,871 4,430 0-10,097
50-64 55,569 42,908 - 68,230 1,493 0-4,758
15-64 384,011 331,824 - 436,199 5,924 0-12,486Weighted figures.One long-term case according to the LAg+VL+ARV algorithm was reclassified to recent because the respondent indicated in the interview that they started treatment within the recent infection time window.
5.4 GAPS AND UNMET NEEDS
• Based upon the ARV-adjusted incidence, approximately 6,000 new HIV infections occurred annually in urban Ethiopia at the time of the survey. The data suggest that there is still a deficit in the effective implementation of strategies to stop transmission and prevent the occurrence of new HIV infections.
5.5 REFERENCES
1. Duong YT, Kassanjee R, Welte A, et al. Recalibration of the limiting antigen avidity EIA to determine mean duration of recent infection in divergent HIV-1 subtypes. PLoS One. 2015 Feb 24;10(2):e0114947. doi: 10.1371/journal.pone. Recalibration 0114947.
2. Kassanjee R, McWalter TA, Bärnighausen T, Welte A. A new general biomarker-based incidence estimator. Epidemiology. 2012 Sep;23(5):721-8. doi: 10.1097/EDE.0b013e3182576c07.
3. Duong YT, Qiu M, De AK, et al. Detection of recent HIV-1 infection using a new limiting-antigen avidity assay: potential for HIV-1 incidence estimates and avidity maturation studies. PLoS One. 2012;7(3):e33328. doi: 10.1371/journal.pone.0033328. Epub 2012 Mar 27.
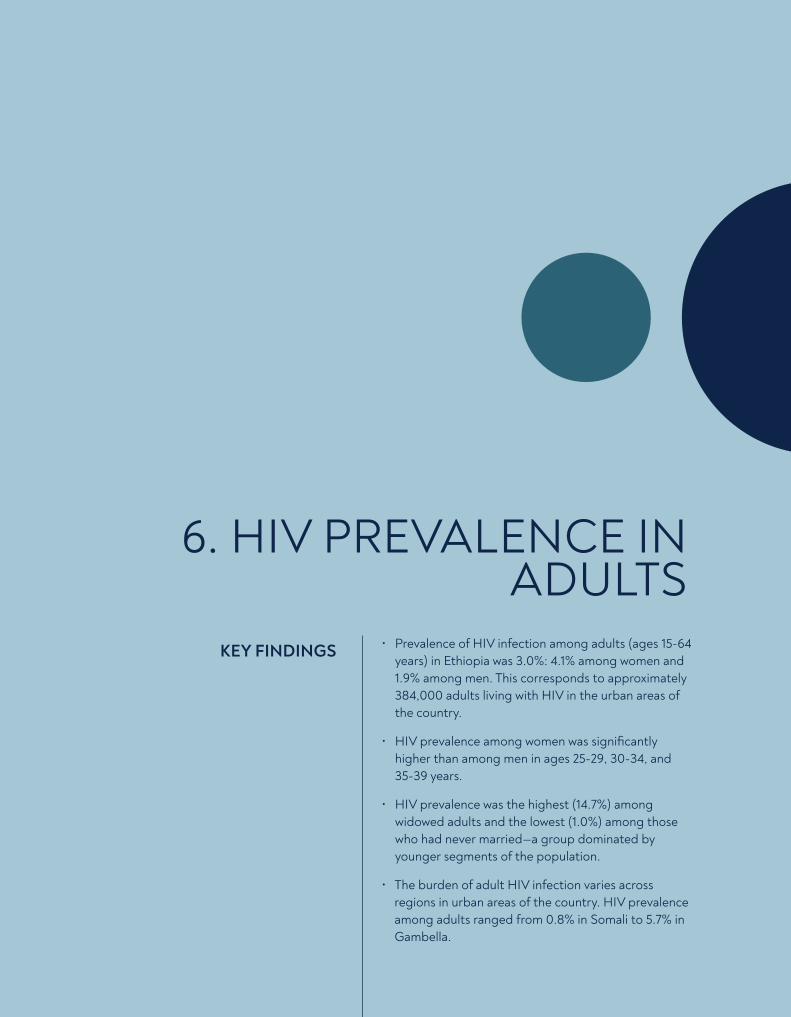
CONTENT | 55
6. HIV PREVALENCE IN ADULTS
• Prevalence of HIV infection among adults (ages 15-64 years) in Ethiopia was 3.0%: 4.1% among women and 1.9% among men. This corresponds to approximately 384,000 adults living with HIV in the urban areas of the country.
• HIV prevalence among women was significantly higher than among men in ages 25-29, 30-34, and 35-39 years.
• HIV prevalence was the highest (14.7%) among widowed adults and the lowest (1.0%) among those who had never married—a group dominated by younger segments of the population.
• The burden of adult HIV infection varies across regions in urban areas of the country. HIV prevalence among adults ranged from 0.8% in Somali to 5.7% in Gambella.
KEY FINDINGS
56 | Ethiopia Population-based HIV Impact Assessment (EPHIA) 2017-2018
6.2 BACKGROUND
This chapter presents representative estimates of prevalence of HIV infection among adults at the national and regional levels by selected demographic characteristics in urban areas of Ethiopia. It also presents estimates of the number of adults living with HIV in urban Ethiopia.
HIV testing was conducted in each household using a serological rapid diagnostic testing algorithm based on Ethiopia’s national guidelines, with laboratory confirmation of seropositive samples using a supplemental assay. Appendix A describes the EPHIA sampling design.Appendix B describes the EPHIA HIV testing methodology.Appendix C describes the EPHIA sampling errors.
6.3 ADULT HIV PREVALENCE BY AGE AND SEX
Overall, HIV prevalence among adults was 3.0%: 1.9% in men, and 4.1% in women (Table 6.3.A). This corresponds to approximately 384,000 adults living with HIV in the urban areas of the country (Table 5.3.C)
In adults, HIV prevalence ranged from 0.6% in those aged 20-24 years to 7.0% in those aged 40-44 years. The peak HIV prevalence in females was 9.1%, observed in ages 35-39 years, and the peak HIV prevalence in males was 5.7%, observed in ages 40-44 years. Prevalence among women aged 15-24 years was 0.8%, compared to 2.8% among women aged 25-29 years. Prevalence among older adults aged 50-64 years was 4.4% (4.7% for women and 4.2% for men) (Table 6.3.A).
HIV prevalence in women was more than twice (4.1%) that of men (1.9%). Differences in prevalence between men and women were statistically significant in the 5-year age brackets of 25-29 years, 30-34 years, and 35-39 years (with non-overlapping 95% CIs). Among adults aged 15-49 years, HIV prevalence was higher among women (4.0%) than among men (1.7%), and HIV prevalence among those aged 25-29 years was more than three times higher in women (2.8%) compared to men (0.8%) (Table 6.3.A, Figure 6.3.A).
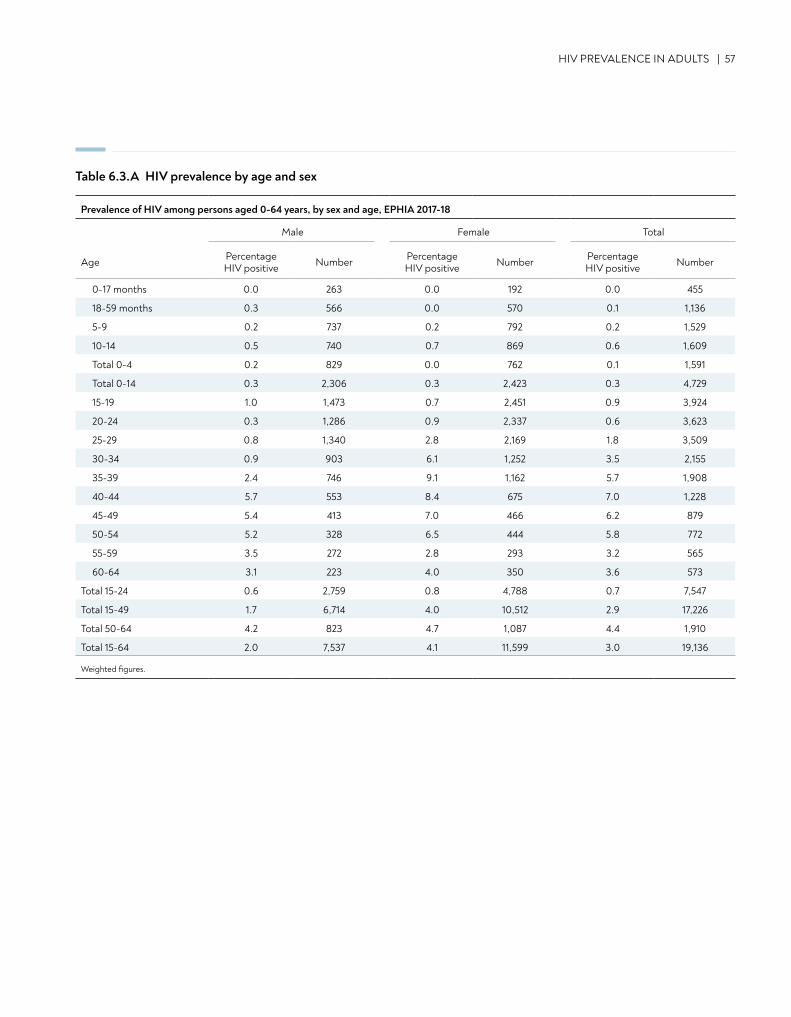
HIV PREVALENCE IN ADULTS | 57
Table 6.3.A HIV prevalence by age and sex
Prevalence of HIV among persons aged 0-64 years, by sex and age, EPHIA 2017-18
Male Female Total
Age Percentage HIV positive Number Percentage
HIV positive Number Percentage HIV positive Number
0-17 months 0.0 263 0.0 192 0.0 455
18-59 months 0.3 566 0.0 570 0.1 1,136
5-9 0.2 737 0.2 792 0.2 1,529
10-14 0.5 740 0.7 869 0.6 1,609
Total 0-4 0.2 829 0.0 762 0.1 1,591
Total 0-14 0.3 2,306 0.3 2,423 0.3 4,729
15-19 1.0 1,473 0.7 2,451 0.9 3,924
20-24 0.3 1,286 0.9 2,337 0.6 3,623
25-29 0.8 1,340 2.8 2,169 1.8 3,509
30-34 0.9 903 6.1 1,252 3.5 2,155
35-39 2.4 746 9.1 1,162 5.7 1,908
40-44 5.7 553 8.4 675 7.0 1,228
45-49 5.4 413 7.0 466 6.2 879
50-54 5.2 328 6.5 444 5.8 772
55-59 3.5 272 2.8 293 3.2 565
60-64 3.1 223 4.0 350 3.6 573
Total 15-24 0.6 2,759 0.8 4,788 0.7 7,547
Total 15-49 1.7 6,714 4.0 10,512 2.9 17,226
Total 50-64 4.2 823 4.7 1,087 4.4 1,910
Total 15-64 2.0 7,537 4.1 11,599 3.0 19,136
Weighted figures.
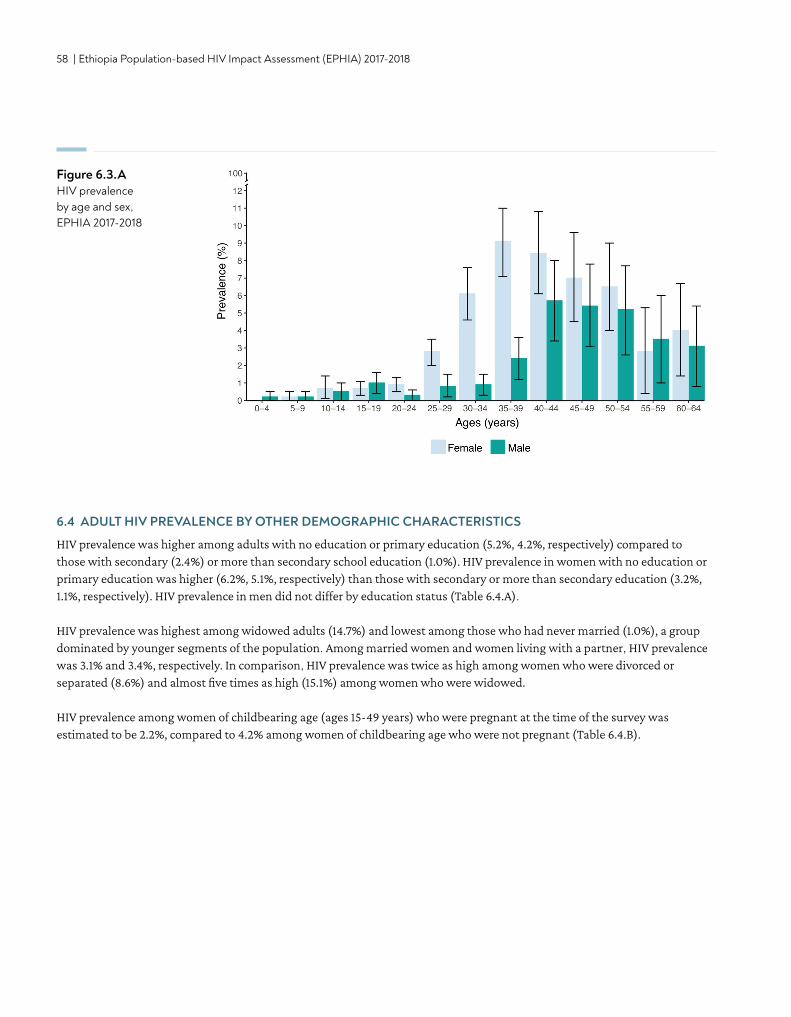
58 | Ethiopia Population-based HIV Impact Assessment (EPHIA) 2017-2018
Figure 6.3.A HIV prevalence by age and sex, EPHIA 2017-2018
6.4 ADULT HIV PREVALENCE BY OTHER DEMOGRAPHIC CHARACTERISTICS
HIV prevalence was higher among adults with no education or primary education (5.2%, 4.2%, respectively) compared to those with secondary (2.4%) or more than secondary school education (1.0%). HIV prevalence in women with no education or primary education was higher (6.2%, 5.1%, respectively) than those with secondary or more than secondary education (3.2%, 1.1%, respectively). HIV prevalence in men did not differ by education status (Table 6.4.A).
HIV prevalence was highest among widowed adults (14.7%) and lowest among those who had never married (1.0%), a group dominated by younger segments of the population. Among married women and women living with a partner, HIV prevalence was 3.1% and 3.4%, respectively. In comparison, HIV prevalence was twice as high among women who were divorced or separated (8.6%) and almost five times as high (15.1%) among women who were widowed.
HIV prevalence among women of childbearing age (ages 15-49 years) who were pregnant at the time of the survey was estimated to be 2.2%, compared to 4.2% among women of childbearing age who were not pregnant (Table 6.4.B).
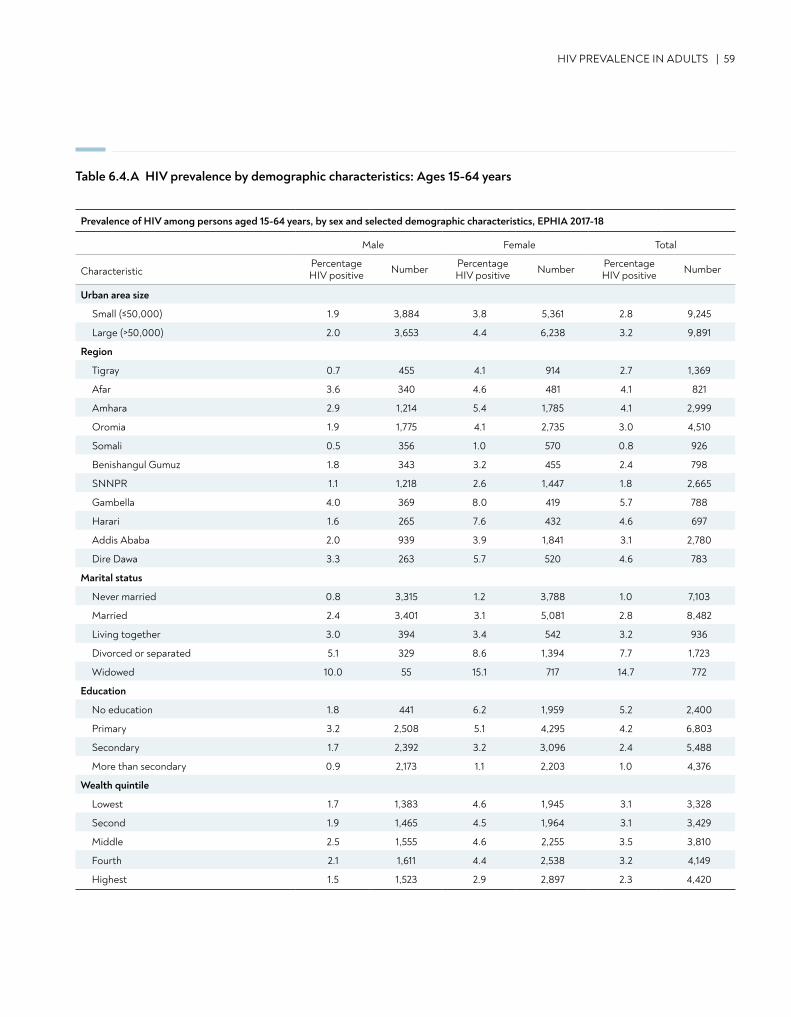
HIV PREVALENCE IN ADULTS | 59
Table 6.4.A HIV prevalence by demographic characteristics: Ages 15-64 years
Prevalence of HIV among persons aged 15-64 years, by sex and selected demographic characteristics, EPHIA 2017-18
Male Female Total
CharacteristicPercentage HIV positive Number Percentage
HIV positive Number Percentage HIV positive Number
Urban area size
Small (≤50,000) 1.9 3,884 3.8 5,361 2.8 9,245
Large (>50,000) 2.0 3,653 4.4 6,238 3.2 9,891
Region
Tigray 0.7 455 4.1 914 2.7 1,369
Afar 3.6 340 4.6 481 4.1 821
Amhara 2.9 1,214 5.4 1,785 4.1 2,999
Oromia 1.9 1,775 4.1 2,735 3.0 4,510
Somali 0.5 356 1.0 570 0.8 926
Benishangul Gumuz 1.8 343 3.2 455 2.4 798
SNNPR 1.1 1,218 2.6 1,447 1.8 2,665
Gambella 4.0 369 8.0 419 5.7 788
Harari 1.6 265 7.6 432 4.6 697
Addis Ababa 2.0 939 3.9 1,841 3.1 2,780
Dire Dawa 3.3 263 5.7 520 4.6 783
Marital status
Never married 0.8 3,315 1.2 3,788 1.0 7,103
Married 2.4 3,401 3.1 5,081 2.8 8,482
Living together 3.0 394 3.4 542 3.2 936
Divorced or separated 5.1 329 8.6 1,394 7.7 1,723
Widowed 10.0 55 15.1 717 14.7 772
Education
No education 1.8 441 6.2 1,959 5.2 2,400
Primary 3.2 2,508 5.1 4,295 4.2 6,803
Secondary 1.7 2,392 3.2 3,096 2.4 5,488
More than secondary 0.9 2,173 1.1 2,203 1.0 4,376
Wealth quintile
Lowest 1.7 1,383 4.6 1,945 3.1 3,328
Second 1.9 1,465 4.5 1,964 3.1 3,429
Middle 2.5 1,555 4.6 2,255 3.5 3,810
Fourth 2.1 1,611 4.4 2,538 3.2 4,149
Highest 1.5 1,523 2.9 2,897 2.3 4,420
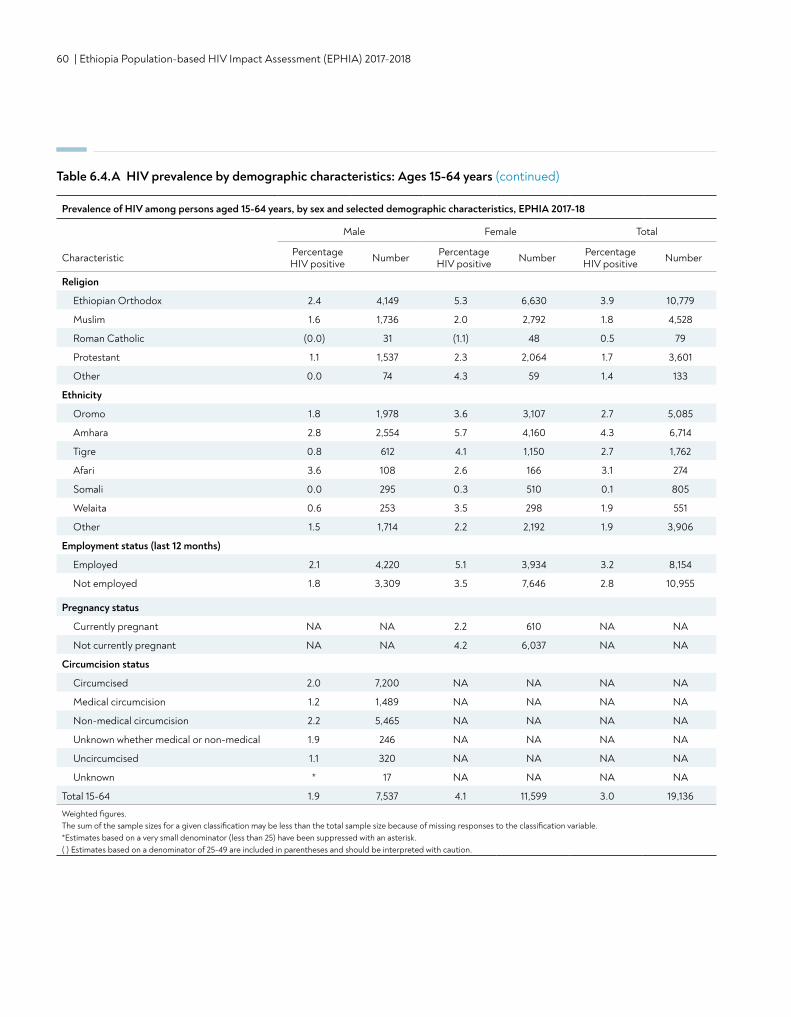
60 | Ethiopia Population-based HIV Impact Assessment (EPHIA) 2017-2018
Table 6.4.A HIV prevalence by demographic characteristics: Ages 15-64 years (continued)
Religion
Ethiopian Orthodox 2.4 4,149 5.3 6,630 3.9 10,779
Muslim 1.6 1,736 2.0 2,792 1.8 4,528
Roman Catholic (0.0) 31 (1.1) 48 0.5 79
Protestant 1.1 1,537 2.3 2,064 1.7 3,601
Other 0.0 74 4.3 59 1.4 133
Ethnicity
Oromo 1.8 1,978 3.6 3,107 2.7 5,085
Amhara 2.8 2,554 5.7 4,160 4.3 6,714
Tigre 0.8 612 4.1 1,150 2.7 1,762
Afari 3.6 108 2.6 166 3.1 274
Somali 0.0 295 0.3 510 0.1 805
Welaita 0.6 253 3.5 298 1.9 551
Other 1.5 1,714 2.2 2,192 1.9 3,906
Employment status (last 12 months)
Employed 2.1 4,220 5.1 3,934 3.2 8,154
Not employed 1.8 3,309 3.5 7,646 2.8 10,955
Pregnancy status
Currently pregnant NA NA 2.2 610 NA NA
Not currently pregnant NA NA 4.2 6,037 NA NA
Circumcision status
Circumcised 2.0 7,200 NA NA NA NA
Medical circumcision 1.2 1,489 NA NA NA NA
Non-medical circumcision 2.2 5,465 NA NA NA NA
Unknown whether medical or non-medical 1.9 246 NA NA NA NA
Uncircumcised 1.1 320 NA NA NA NA
Unknown * 17 NA NA NA NA
Total 15-64 1.9 7,537 4.1 11,599 3.0 19,136
Weighted figures. The sum of the sample sizes for a given classification may be less than the total sample size because of missing responses to the classification variable.*Estimates based on a very small denominator (less than 25) have been suppressed with an asterisk. ( ) Estimates based on a denominator of 25-49 are included in parentheses and should be interpreted with caution.
Prevalence of HIV among persons aged 15-64 years, by sex and selected demographic characteristics, EPHIA 2017-18
Male Female Total
Characteristic Percentage HIV positive Number Percentage
HIV positive Number Percentage HIV positive Number
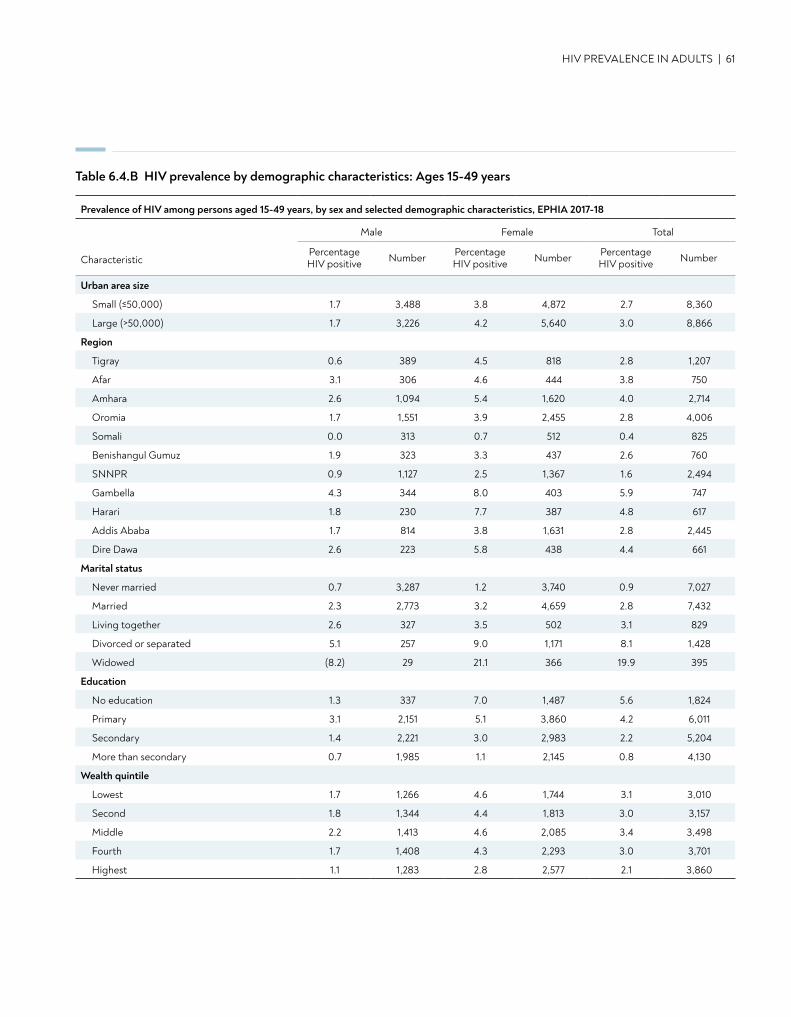
HIV PREVALENCE IN ADULTS | 61
Table 6.4.B HIV prevalence by demographic characteristics: Ages 15-49 years
Prevalence of HIV among persons aged 15-49 years, by sex and selected demographic characteristics, EPHIA 2017-18
Male Female Total
CharacteristicPercentage HIV positive Number Percentage
HIV positive Number Percentage HIV positive Number
Urban area size
Small (≤50,000) 1.7 3,488 3.8 4,872 2.7 8,360
Large (>50,000) 1.7 3,226 4.2 5,640 3.0 8,866
Region
Tigray 0.6 389 4.5 818 2.8 1,207
Afar 3.1 306 4.6 444 3.8 750
Amhara 2.6 1,094 5.4 1,620 4.0 2,714
Oromia 1.7 1,551 3.9 2,455 2.8 4,006
Somali 0.0 313 0.7 512 0.4 825
Benishangul Gumuz 1.9 323 3.3 437 2.6 760
SNNPR 0.9 1,127 2.5 1,367 1.6 2,494
Gambella 4.3 344 8.0 403 5.9 747
Harari 1.8 230 7.7 387 4.8 617
Addis Ababa 1.7 814 3.8 1,631 2.8 2,445
Dire Dawa 2.6 223 5.8 438 4.4 661
Marital status
Never married 0.7 3,287 1.2 3,740 0.9 7,027
Married 2.3 2,773 3.2 4,659 2.8 7,432
Living together 2.6 327 3.5 502 3.1 829
Divorced or separated 5.1 257 9.0 1,171 8.1 1,428
Widowed (8.2) 29 21.1 366 19.9 395
Education
No education 1.3 337 7.0 1,487 5.6 1,824
Primary 3.1 2,151 5.1 3,860 4.2 6,011
Secondary 1.4 2,221 3.0 2,983 2.2 5,204
More than secondary 0.7 1,985 1.1 2,145 0.8 4,130
Wealth quintile
Lowest 1.7 1,266 4.6 1,744 3.1 3,010
Second 1.8 1,344 4.4 1,813 3.0 3,157
Middle 2.2 1,413 4.6 2,085 3.4 3,498
Fourth 1.7 1,408 4.3 2,293 3.0 3,701
Highest 1.1 1,283 2.8 2,577 2.1 3,860
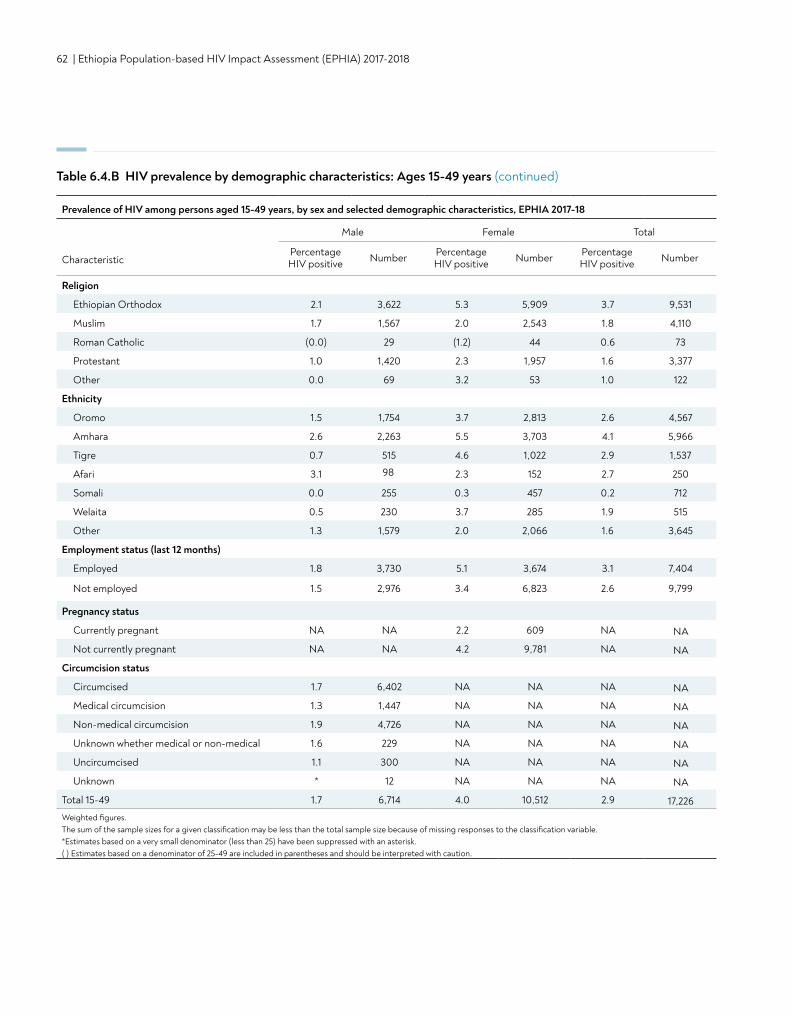
62 | Ethiopia Population-based HIV Impact Assessment (EPHIA) 2017-2018
Religion
Ethiopian Orthodox 2.1 3,622 5.3 5,909 3.7 9,531
Muslim 1.7 1,567 2.0 2,543 1.8 4,110
Roman Catholic (0.0) 29 (1.2) 44 0.6 73
Protestant 1.0 1,420 2.3 1,957 1.6 3,377
Other 0.0 69 3.2 53 1.0 122
Ethnicity
Oromo 1.5 1,754 3.7 2,813 2.6 4,567
Amhara 2.6 2,263 5.5 3,703 4.1 5,966
Tigre 0.7 515 4.6 1,022 2.9 1,537
Afari 3.1 98 2.3 152 2.7 250
Somali 0.0 255 0.3 457 0.2 712
Welaita 0.5 230 3.7 285 1.9 515
Other 1.3 1,579 2.0 2,066 1.6 3,645
Employment status (last 12 months)
Employed 1.8 3,730 5.1 3,674 3.1 7,404
Not employed 1.5 2,976 3.4 6,823 2.6 9,799
Pregnancy status
Currently pregnant NA NA 2.2 609 NA NA
Not currently pregnant NA NA 4.2 9,781 NA NA
Circumcision status
Circumcised 1.7 6,402 NA NA NA NA
Medical circumcision 1.3 1,447 NA NA NA NA
Non-medical circumcision 1.9 4,726 NA NA NA NA
Unknown whether medical or non-medical 1.6 229 NA NA NA NA
Uncircumcised 1.1 300 NA NA NA NA
Unknown * 12 NA NA NA NA
Total 15-49 1.7 6,714 4.0 10,512 2.9 17,226Weighted figures. The sum of the sample sizes for a given classification may be less than the total sample size because of missing responses to the classification variable.*Estimates based on a very small denominator (less than 25) have been suppressed with an asterisk. ( ) Estimates based on a denominator of 25-49 are included in parentheses and should be interpreted with caution.
Table 6.4.B HIV prevalence by demographic characteristics: Ages 15-49 years (continued)
Prevalence of HIV among persons aged 15-49 years, by sex and selected demographic characteristics, EPHIA 2017-18
Male Female Total
CharacteristicPercentage HIV positive Number Percentage
HIV positive Number Percentage HIV positive Number
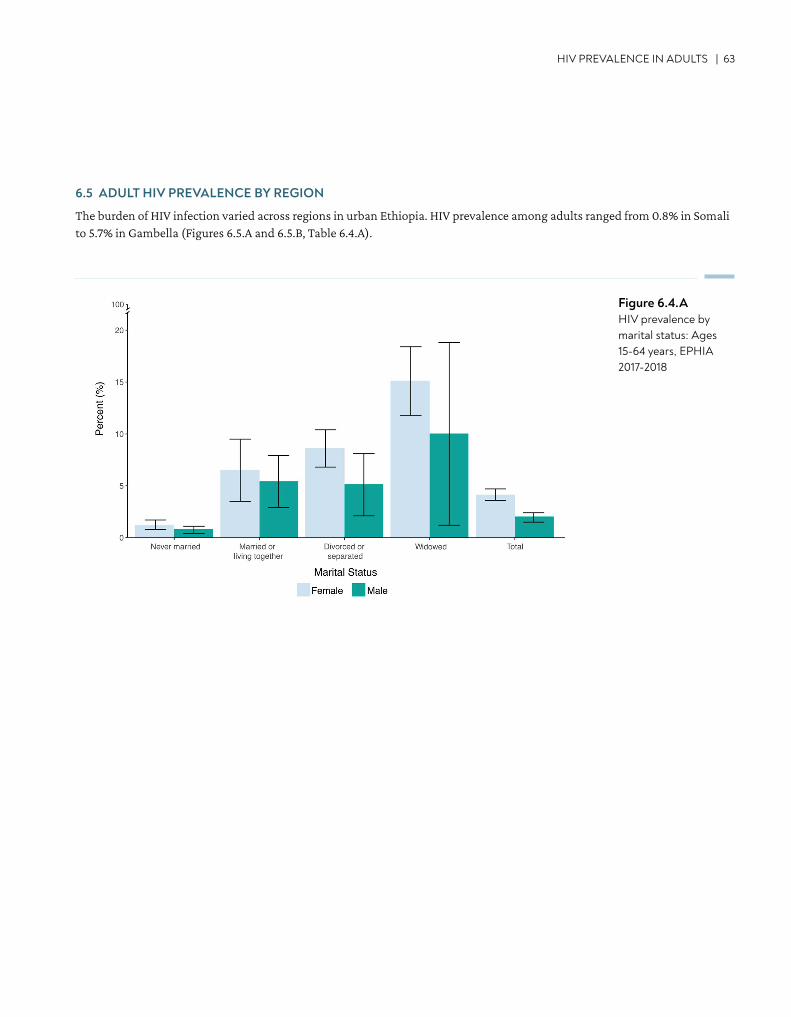
HIV PREVALENCE IN ADULTS | 63
6.5 ADULT HIV PREVALENCE BY REGION
The burden of HIV infection varied across regions in urban Ethiopia. HIV prevalence among adults ranged from 0.8% in Somali to 5.7% in Gambella (Figures 6.5.A and 6.5.B, Table 6.4.A).
Figure 6.4.AHIV prevalence by marital status: Ages 15-64 years, EPHIA 2017-2018
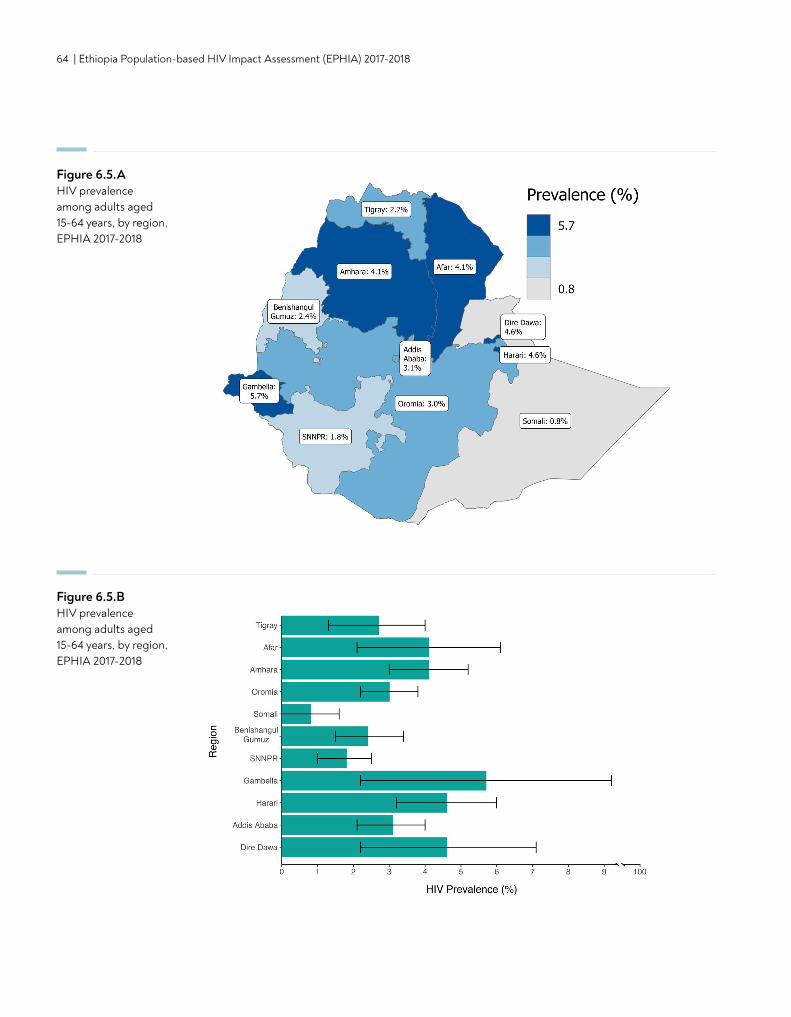
64 | Ethiopia Population-based HIV Impact Assessment (EPHIA) 2017-2018
Figure 6.5.AHIV prevalence among adults aged 15-64 years, by region, EPHIA 2017-2018
Figure 6.5.BHIV prevalence among adults aged 15-64 years, by region, EPHIA 2017-2018
CONTENT | 65
7. SELF-REPORTED HIV TESTING
• In Ethiopia, 69.8% of the urban population of adults (ages 15-64 years) had ever tested for HIV and received their results (73.0% of women and 66.5% of men), based upon self-report.
• In Ethiopia, 23.4% of the urban adult population reported having HIV testing and receiving results in the 12 months preceding the survey (26.7% of women and 20.0% of men).
• Among adults who tested positive in EPHIA, 90.6% reported ever testing for HIV and receiving their results (84.8% among men and 93.2% among women), while only 19.0% were tested and received their results in 12 months preceding the survey.
• Only 28.9% of older adolescent boys and 36% older adolescent girls (those aged 15-19 years) reported ever testing for HIV and having received their results.
KEY FINDINGS
66 | Ethiopia Population-based HIV Impact Assessment (EPHIA) 2017-2018
7.2 BACKGROUND
HIV testing is necessary for awareness of HIV status and is a critical component of HIV epidemic control targets. Awareness of HIV-positive status is the first step to engagement with HIV care and treatment services, accessing ART, as well as access to screening services for other co-morbidities. HIV testing is also the entry to prevention counseling for both HIV-positive and HIV-negative individuals to reduce risk of HIV transmission or acquisition.
Data presented in this section pertain to men and women, who reported ever receiving an HIV test and receiving the test results. Results on HIV testing in the 12 months preceding the survey and receiving the test results are also presented to understand frequent or recent testing.
7.3 SELF-REPORTED HIV TESTING AMONG ADULTS
Overall, 69.8% of adults reported that they had ever tested for HIV and received their results, while 23.4% indicated that they had tested in the 12 months preceding the survey and received their results. About 66.5% of men and 73.0% of women reported having ever tested for HIV and receiving their test results. The proportion of women who tested for HIV in the year preceding the survey was higher (26.7%) than men (20.0%) (Tables 7.3.A, 7.3.B, and 7.3.C).
While approximately two-thirds or over of men in most age groups reported ever testing for HIV and receiving their results, only 28.9% of older adolescent boys (those aged 15-19 years) reported ever testing for HIV and having received their results (as opposed to 62.9% of young men aged 20-24 years). Among the male population, the percentage testing for HIV and receiving results in the year before the survey ranged from 9.6% among older adolescent boys to 28.9% among men aged 25-29 years (Table 7.3.A, Figure 7.3.A).
Nearly three-quarters (73.0%) of women reported ever testing and receiving their results, while only 26.7% indicated that they had tested and received results in the 12 months preceding the survey. Among the female population, 36.0% of older adolescent girls had ever been tested for HIV and received results, compared to 77.6% among women aged 20-24 years. Among older women aged 45-64 years, the proportion ever tested ranged from 50.4% among ages 60-64 years to 70.6% among ages 45-49 years. The percentage of the female population, testing for HIV and receiving results in the year preceding the survey ranged from 14.9% among older adolescent girls to 37.1% among women aged 25-29 years (Tables 7.3.B, Figure 7.3.A).
There were variations in ever testing and recent HIV testing by education status. Among adults, 65.7% of those with no education have ever tested for HIV and received their results and 19.9% tested in the year preceding the survey, while 79.1% of those with more than secondary education reported ever testing and 28.6% reported testing in the year preceding the survey. Among men with more than secondary education, 77.5% reported having ever tested for HIV and receiving their results, compared to 62.4% of men with no education. Women with more than secondary education had the highest percentage of having ever been tested for HIV, and testing for HIV in the year preceding the survey, (81.6% and 33.1%, respectively; Tables 7.3.A, 7.3.B and 7.3.C).
Among men, about three-quarters of those who were married, cohabitating, or divorced or separated (78.7%, 74.8% and 78.5%, respectively) reported ever testing for HIV. Percentages of testing were even higher among women: 86.4% of married, 81.5% of cohabitating women, and 80.0% of divorced or separated women reported ever testing for HIV. Among both men and women, less than half of those who were never married had ever been tested (50.6% and 48.1%, respectively; Tables 7.3.A and 7.3.B).
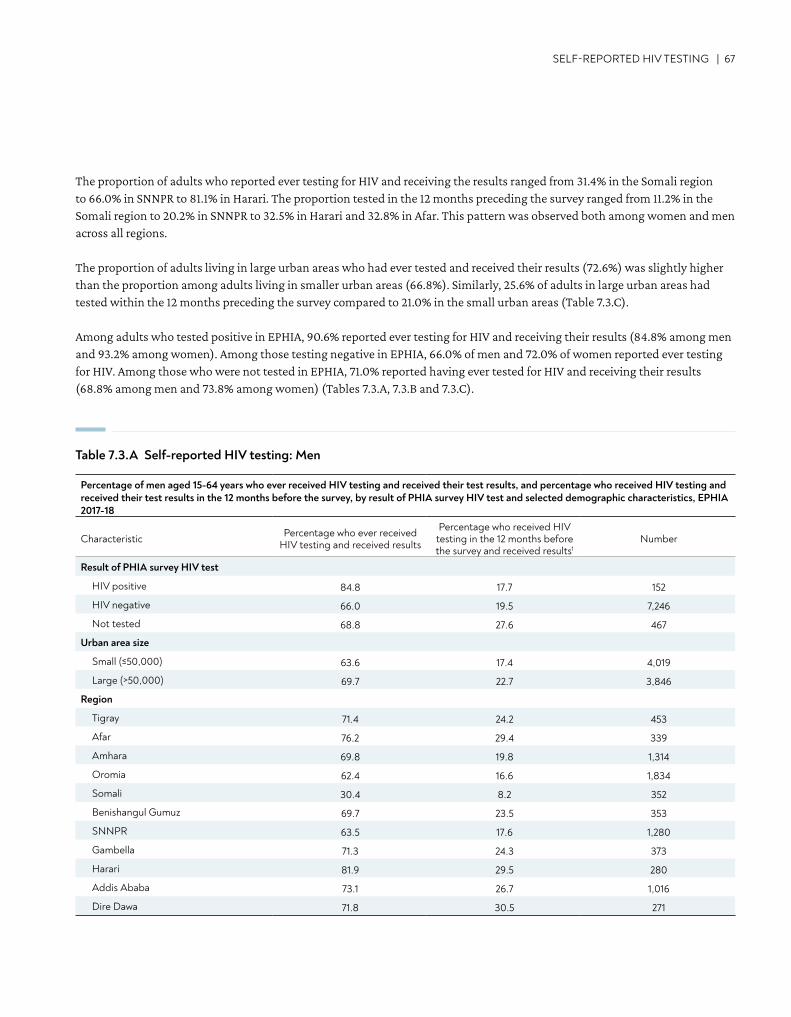
SELF-REPORTED HIV TESTING | 67
The proportion of adults who reported ever testing for HIV and receiving the results ranged from 31.4% in the Somali region to 66.0% in SNNPR to 81.1% in Harari. The proportion tested in the 12 months preceding the survey ranged from 11.2% in the Somali region to 20.2% in SNNPR to 32.5% in Harari and 32.8% in Afar. This pattern was observed both among women and men across all regions.
The proportion of adults living in large urban areas who had ever tested and received their results (72.6%) was slightly higher than the proportion among adults living in smaller urban areas (66.8%). Similarly, 25.6% of adults in large urban areas had tested within the 12 months preceding the survey compared to 21.0% in the small urban areas (Table 7.3.C).
Among adults who tested positive in EPHIA, 90.6% reported ever testing for HIV and receiving their results (84.8% among men and 93.2% among women). Among those testing negative in EPHIA, 66.0% of men and 72.0% of women reported ever testing for HIV. Among those who were not tested in EPHIA, 71.0% reported having ever tested for HIV and receiving their results (68.8% among men and 73.8% among women) (Tables 7.3.A, 7.3.B and 7.3.C).
Percentage of men aged 15-64 years who ever received HIV testing and received their test results, and percentage who received HIV testing and received their test results in the 12 months before the survey, by result of PHIA survey HIV test and selected demographic characteristics, EPHIA 2017-18
Characteristic Percentage who ever received HIV testing and received results
Percentage who received HIV testing in the 12 months before the survey and received results1
Number
Result of PHIA survey HIV test
HIV positive 84.8 17.7 152
HIV negative 66.0 19.5 7,246
Not tested 68.8 27.6 467
Urban area size
Small (≤50,000) 63.6 17.4 4,019
Large (>50,000) 69.7 22.7 3,846
Region
Tigray 71.4 24.2 453
Afar 76.2 29.4 339
Amhara 69.8 19.8 1,314
Oromia 62.4 16.6 1,834
Somali 30.4 8.2 352
Benishangul Gumuz 69.7 23.5 353
SNNPR 63.5 17.6 1,280
Gambella 71.3 24.3 373
Harari 81.9 29.5 280
Addis Ababa 73.1 26.7 1,016
Dire Dawa 71.8 30.5 271
Table 7.3.A Self-reported HIV testing: Men
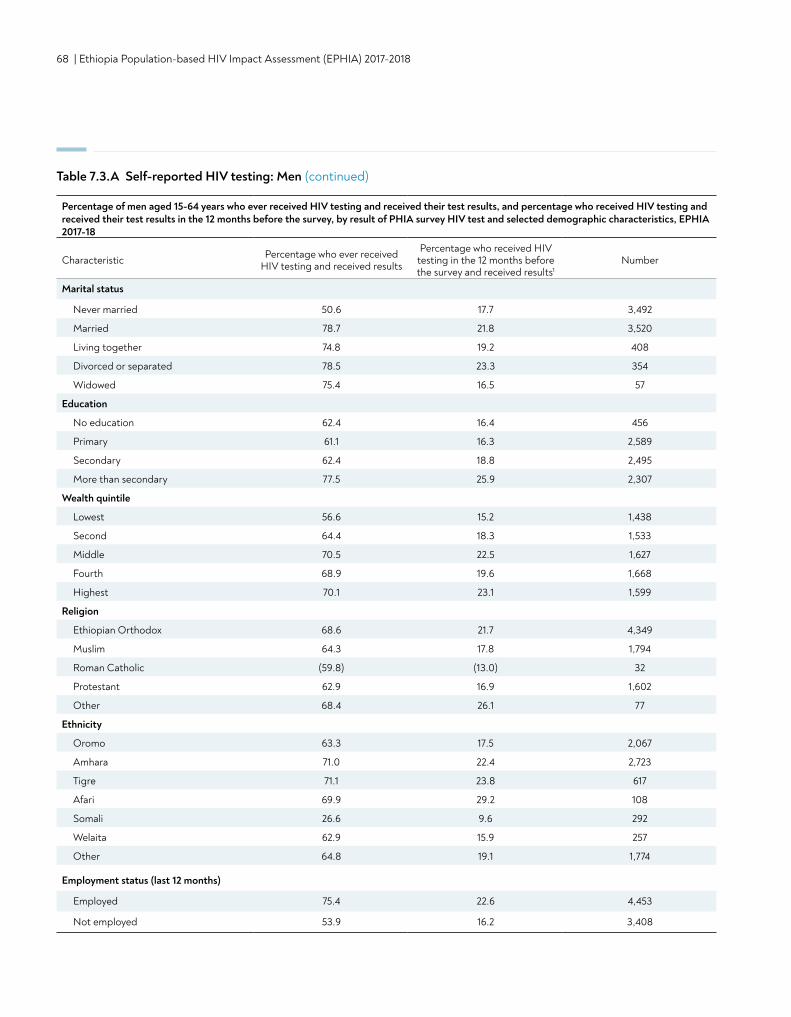
68 | Ethiopia Population-based HIV Impact Assessment (EPHIA) 2017-2018
Marital status
Never married 50.6 17.7 3,492
Married 78.7 21.8 3,520
Living together 74.8 19.2 408
Divorced or separated 78.5 23.3 354
Widowed 75.4 16.5 57
Education
No education 62.4 16.4 456
Primary 61.1 16.3 2,589
Secondary 62.4 18.8 2,495
More than secondary 77.5 25.9 2,307
Wealth quintile
Lowest 56.6 15.2 1,438
Second 64.4 18.3 1,533
Middle 70.5 22.5 1,627
Fourth 68.9 19.6 1,668
Highest 70.1 23.1 1,599
Religion
Ethiopian Orthodox 68.6 21.7 4,349
Muslim 64.3 17.8 1,794
Roman Catholic (59.8) (13.0) 32
Protestant 62.9 16.9 1,602
Other 68.4 26.1 77
Ethnicity
Oromo 63.3 17.5 2,067
Amhara 71.0 22.4 2,723
Tigre 71.1 23.8 617
Afari 69.9 29.2 108
Somali 26.6 9.6 292
Welaita 62.9 15.9 257
Other 64.8 19.1 1,774
Employment status (last 12 months)
Employed 75.4 22.6 4,453
Not employed 53.9 16.2 3,408
Table 7.3.A Self-reported HIV testing: Men (continued)
Percentage of men aged 15-64 years who ever received HIV testing and received their test results, and percentage who received HIV testing and received their test results in the 12 months before the survey, by result of PHIA survey HIV test and selected demographic characteristics, EPHIA 2017-18
Characteristic Percentage who ever received HIV testing and received results
Percentage who received HIV testing in the 12 months before the survey and received results1
Number
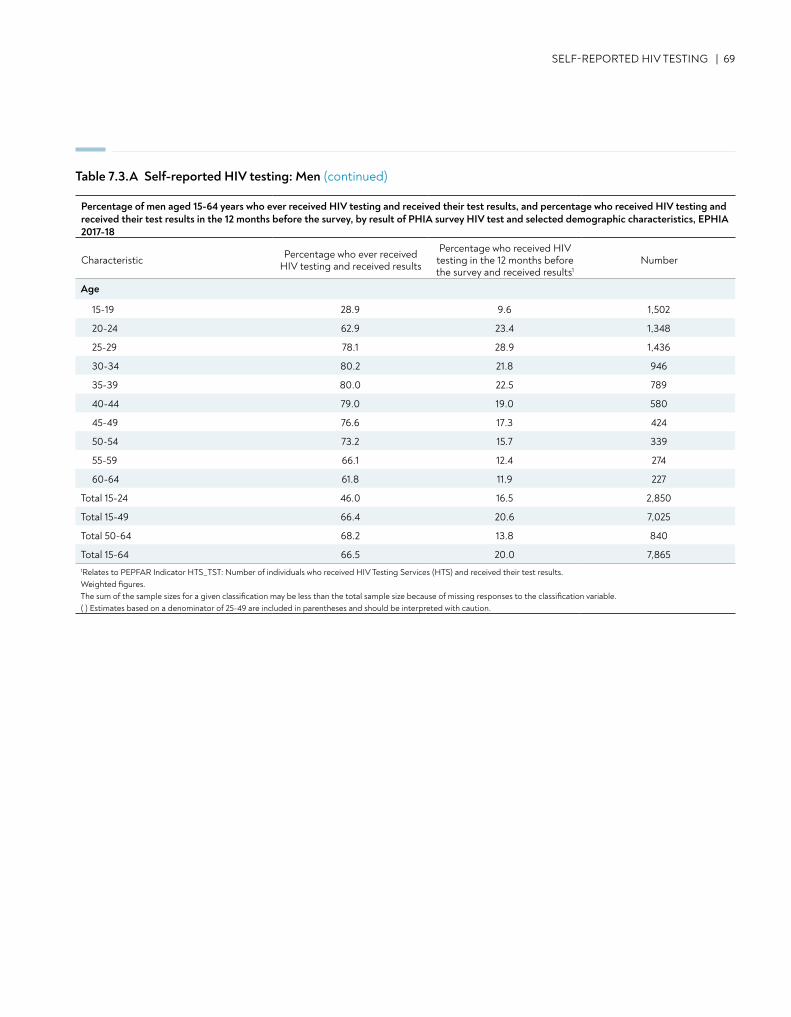
SELF-REPORTED HIV TESTING | 69
Table 7.3.A Self-reported HIV testing: Men (continued)
Age
15-19 28.9 9.6 1,502
20-24 62.9 23.4 1,348
25-29 78.1 28.9 1,436
30-34 80.2 21.8 946
35-39 80.0 22.5 789
40-44 79.0 19.0 580
45-49 76.6 17.3 424
50-54 73.2 15.7 339
55-59 66.1 12.4 274
60-64 61.8 11.9 227
Total 15-24 46.0 16.5 2,850
Total 15-49 66.4 20.6 7,025
Total 50-64 68.2 13.8 840
Total 15-64 66.5 20.0 7,8651Relates to PEPFAR Indicator HTS_TST: Number of individuals who received HIV Testing Services (HTS) and received their test results.Weighted figures. The sum of the sample sizes for a given classification may be less than the total sample size because of missing responses to the classification variable.( ) Estimates based on a denominator of 25-49 are included in parentheses and should be interpreted with caution.
Percentage of men aged 15-64 years who ever received HIV testing and received their test results, and percentage who received HIV testing and received their test results in the 12 months before the survey, by result of PHIA survey HIV test and selected demographic characteristics, EPHIA 2017-18
Characteristic Percentage who ever received HIV testing and received results
Percentage who received HIV testing in the 12 months before the survey and received results1
Number
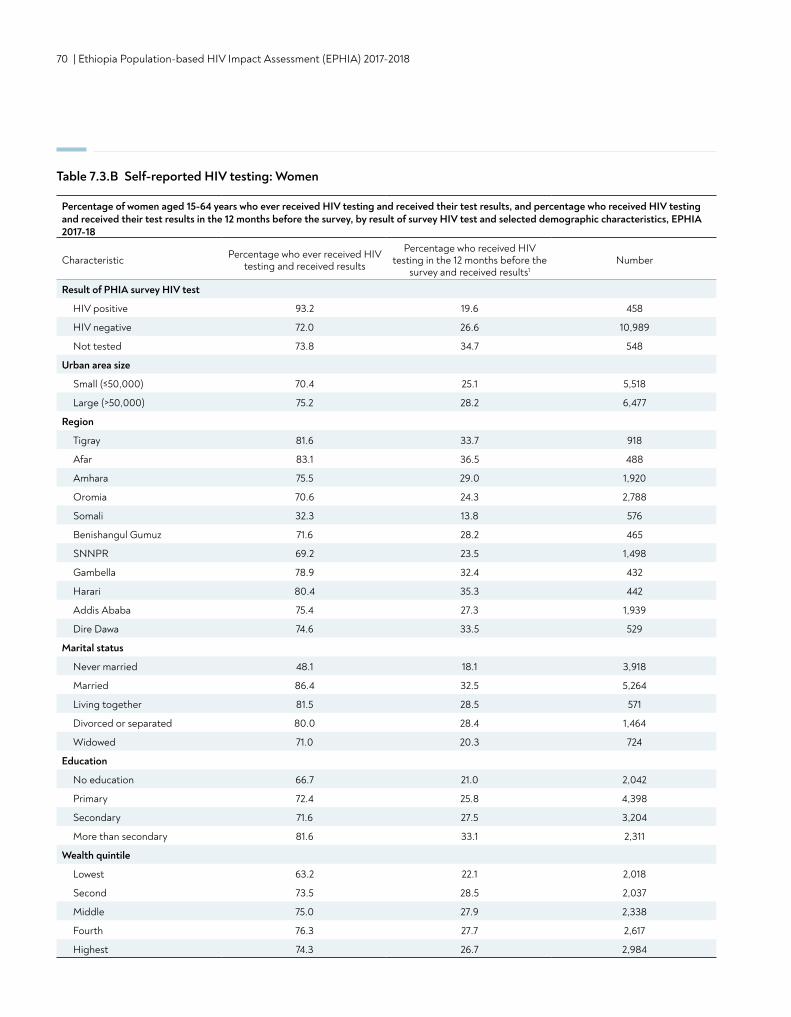
70 | Ethiopia Population-based HIV Impact Assessment (EPHIA) 2017-2018
Percentage of women aged 15-64 years who ever received HIV testing and received their test results, and percentage who received HIV testing and received their test results in the 12 months before the survey, by result of survey HIV test and selected demographic characteristics, EPHIA 2017-18
Characteristic Percentage who ever received HIV testing and received results
Percentage who received HIV testing in the 12 months before the
survey and received results1Number
Result of PHIA survey HIV test
HIV positive 93.2 19.6 458
HIV negative 72.0 26.6 10,989
Not tested 73.8 34.7 548
Urban area size
Small (≤50,000) 70.4 25.1 5,518
Large (>50,000) 75.2 28.2 6,477
Region
Tigray 81.6 33.7 918
Afar 83.1 36.5 488
Amhara 75.5 29.0 1,920
Oromia 70.6 24.3 2,788
Somali 32.3 13.8 576
Benishangul Gumuz 71.6 28.2 465
SNNPR 69.2 23.5 1,498
Gambella 78.9 32.4 432
Harari 80.4 35.3 442
Addis Ababa 75.4 27.3 1,939
Dire Dawa 74.6 33.5 529
Marital status
Never married 48.1 18.1 3,918
Married 86.4 32.5 5,264
Living together 81.5 28.5 571
Divorced or separated 80.0 28.4 1,464
Widowed 71.0 20.3 724
Education
No education 66.7 21.0 2,042
Primary 72.4 25.8 4,398
Secondary 71.6 27.5 3,204
More than secondary 81.6 33.1 2,311
Wealth quintile
Lowest 63.2 22.1 2,018
Second 73.5 28.5 2,037
Middle 75.0 27.9 2,338
Fourth 76.3 27.7 2,617
Highest 74.3 26.7 2,984
Table 7.3.B Self-reported HIV testing: Women
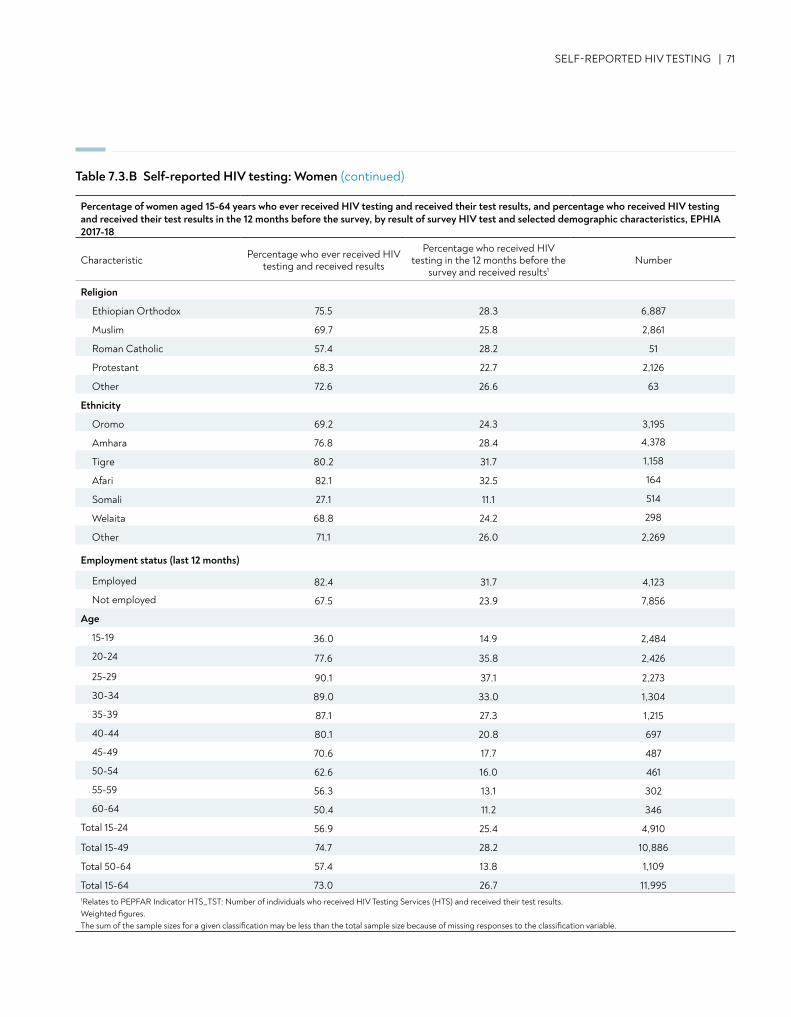
SELF-REPORTED HIV TESTING | 71
Religion
Ethiopian Orthodox 75.5 28.3 6,887
Muslim 69.7 25.8 2,861
Roman Catholic 57.4 28.2 51
Protestant 68.3 22.7 2,126
Other 72.6 26.6 63
Ethnicity
Oromo 69.2 24.3 3,195
Amhara 76.8 28.4 4,378
Tigre 80.2 31.7 1,158
Afari 82.1 32.5 164
Somali 27.1 11.1 514
Welaita 68.8 24.2 298
Other 71.1 26.0 2,269
Employment status (last 12 months)
Employed 82.4 31.7 4,123
Not employed 67.5 23.9 7,856
Age
15-19 36.0 14.9 2,484
20-24 77.6 35.8 2,426
25-29 90.1 37.1 2,273
30-34 89.0 33.0 1,304
35-39 87.1 27.3 1,215
40-44 80.1 20.8 697
45-49 70.6 17.7 487
50-54 62.6 16.0 461
55-59 56.3 13.1 302
60-64 50.4 11.2 346
Total 15-24 56.9 25.4 4,910
Total 15-49 74.7 28.2 10,886
Total 50-64 57.4 13.8 1,109
Total 15-64 73.0 26.7 11,9951Relates to PEPFAR Indicator HTS_TST: Number of individuals who received HIV Testing Services (HTS) and received their test results. Weighted figures. The sum of the sample sizes for a given classification may be less than the total sample size because of missing responses to the classification variable.
Table 7.3.B Self-reported HIV testing: Women (continued)
Percentage of women aged 15-64 years who ever received HIV testing and received their test results, and percentage who received HIV testing and received their test results in the 12 months before the survey, by result of survey HIV test and selected demographic characteristics, EPHIA 2017-18
Characteristic Percentage who ever received HIV testing and received results
Percentage who received HIV testing in the 12 months before the
survey and received results1Number
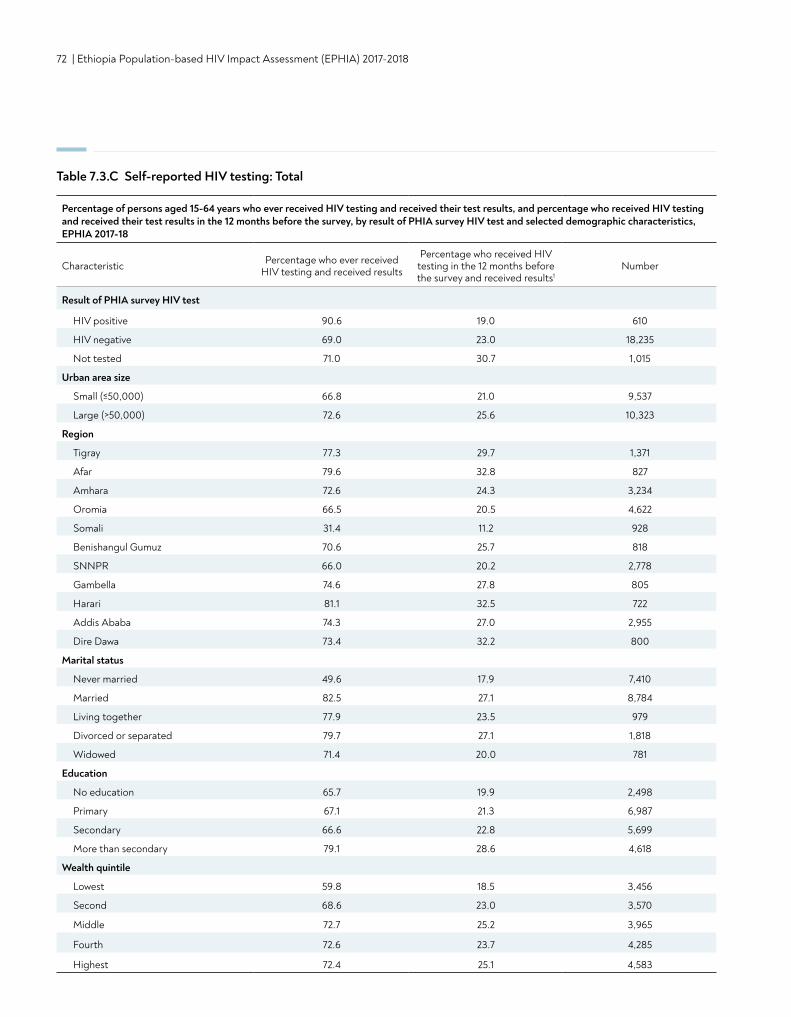
72 | Ethiopia Population-based HIV Impact Assessment (EPHIA) 2017-2018
Percentage of persons aged 15-64 years who ever received HIV testing and received their test results, and percentage who received HIV testing and received their test results in the 12 months before the survey, by result of PHIA survey HIV test and selected demographic characteristics, EPHIA 2017-18
Characteristic Percentage who ever received HIV testing and received results
Percentage who received HIV testing in the 12 months before the survey and received results1
Number
Result of PHIA survey HIV test
HIV positive 90.6 19.0 610
HIV negative 69.0 23.0 18,235
Not tested 71.0 30.7 1,015
Urban area size
Small (≤50,000) 66.8 21.0 9,537
Large (>50,000) 72.6 25.6 10,323
Region
Tigray 77.3 29.7 1,371
Afar 79.6 32.8 827
Amhara 72.6 24.3 3,234
Oromia 66.5 20.5 4,622
Somali 31.4 11.2 928
Benishangul Gumuz 70.6 25.7 818
SNNPR 66.0 20.2 2,778
Gambella 74.6 27.8 805
Harari 81.1 32.5 722
Addis Ababa 74.3 27.0 2,955
Dire Dawa 73.4 32.2 800
Marital status
Never married 49.6 17.9 7,410
Married 82.5 27.1 8,784
Living together 77.9 23.5 979
Divorced or separated 79.7 27.1 1,818
Widowed 71.4 20.0 781
Education
No education 65.7 19.9 2,498
Primary 67.1 21.3 6,987
Secondary 66.6 22.8 5,699
More than secondary 79.1 28.6 4,618
Wealth quintile
Lowest 59.8 18.5 3,456
Second 68.6 23.0 3,570
Middle 72.7 25.2 3,965
Fourth 72.6 23.7 4,285
Highest 72.4 25.1 4,583
Table 7.3.C Self-reported HIV testing: Total
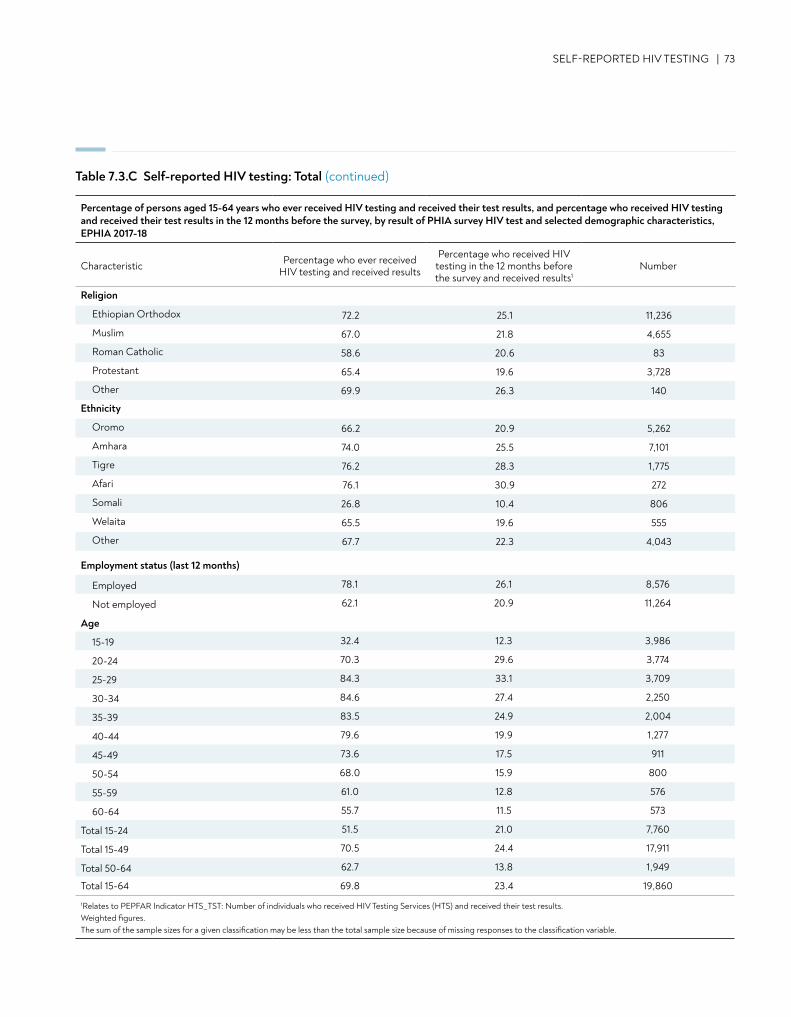
Religion
Ethiopian Orthodox 72.2 25.1 11,236
Muslim 67.0 21.8 4,655
Roman Catholic 58.6 20.6 83
Protestant 65.4 19.6 3,728
Other 69.9 26.3 140
Ethnicity
Oromo 66.2 20.9 5,262
Amhara 74.0 25.5 7,101
Tigre 76.2 28.3 1,775
Afari 76.1 30.9 272
Somali 26.8 10.4 806
Welaita 65.5 19.6 555
Other 67.7 22.3 4,043
Employment status (last 12 months)
Employed 78.1 26.1 8,576
Not employed 62.1 20.9 11,264
Age
15-19 32.4 12.3 3,986
20-24 70.3 29.6 3,774
25-29 84.3 33.1 3,709
30-34 84.6 27.4 2,250
35-39 83.5 24.9 2,004
40-44 79.6 19.9 1,277
45-49 73.6 17.5 911
50-54 68.0 15.9 800
55-59 61.0 12.8 576
60-64 55.7 11.5 573
Total 15-24 51.5 21.0 7,760
Total 15-49 70.5 24.4 17,911
Total 50-64 62.7 13.8 1,949
Total 15-64 69.8 23.4 19,860
1Relates to PEPFAR Indicator HTS_TST: Number of individuals who received HIV Testing Services (HTS) and received their test results. Weighted figures. The sum of the sample sizes for a given classification may be less than the total sample size because of missing responses to the classification variable.
SELF-REPORTED HIV TESTING | 73
Table 7.3.C Self-reported HIV testing: Total (continued)
Percentage of persons aged 15-64 years who ever received HIV testing and received their test results, and percentage who received HIV testing and received their test results in the 12 months before the survey, by result of PHIA survey HIV test and selected demographic characteristics, EPHIA 2017-18
Characteristic Percentage who ever received HIV testing and received results
Percentage who received HIV testing in the 12 months before the survey and received results1
Number
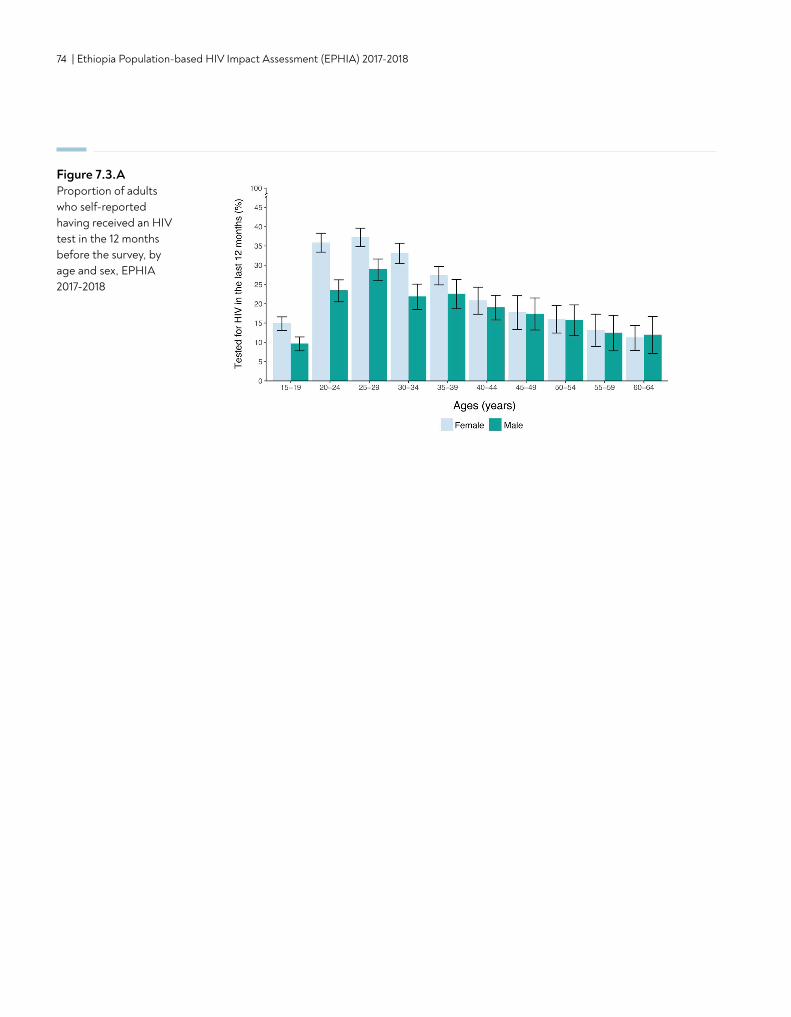
74 | Ethiopia Population-based HIV Impact Assessment (EPHIA) 2017-2018
Figure 7.3.AProportion of adults who self-reported having received an HIV test in the 12 months before the survey, by age and sex, EPHIA 2017-2018
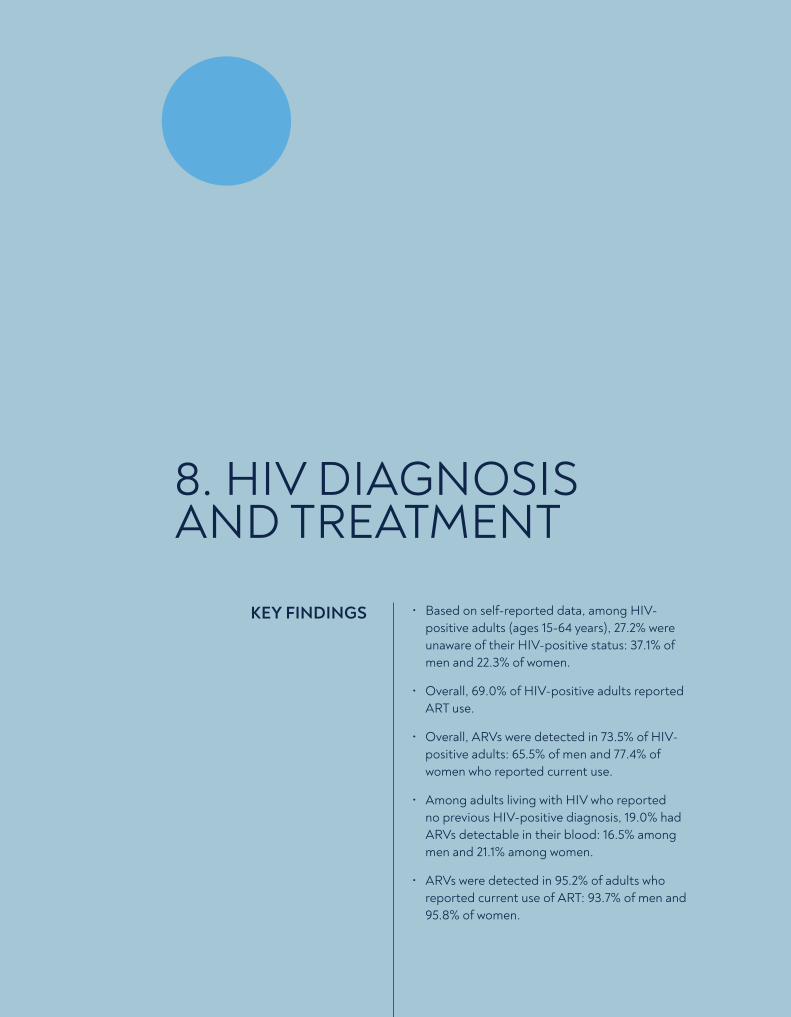
CONTENT | 75
• Based on self-reported data, among HIV-positive adults (ages 15-64 years), 27.2% were unaware of their HIV-positive status: 37.1% of men and 22.3% of women.
• Overall, 69.0% of HIV-positive adults reported ART use.
• Overall, ARVs were detected in 73.5% of HIV-positive adults: 65.5% of men and 77.4% of women who reported current use.
• Among adults living with HIV who reported no previous HIV-positive diagnosis, 19.0% had ARVs detectable in their blood: 16.5% among men and 21.1% among women.
• ARVs were detected in 95.2% of adults who reported current use of ART: 93.7% of men and 95.8% of women.
KEY FINDINGS
8. HIV DIAGNOSIS AND TREATMENT
76 | Ethiopia Population-based HIV Impact Assessment (EPHIA) 2017-2018
8.2 BACKGROUND
Recent studies have proven that treating people living with HIV at higher CD4 counts improves immune recovery, decreases the incidence of non-AIDS events and comorbidities and mortality, and reduces sexual and vertical transmission. In 2016, after extensive review of evidence of both the clinical and population-level benefits of expanding ART, WHO changed its recommendation to support a policy of "treatment for all," regardless of CD4 count.1,2 By November 2017, almost all countries in sub-Saharan Africa had adopted this policy, despite the challenges in ensuring uptake and implementation.2 This policy was adopted in Ethiopia in May 2016.
8.3 SELF-REPORTED DIAGNOSIS AND TREATMENT STATUS AMONG HIV-POSITIVE ADULTS
Among HIV-positive adults, based on self-report, 27.2% were unaware of their HIV-positive status: 37.1% of men and 22.3% of women (Tables 8.3.A, 8.3.B and 8.3.C).
In large urban areas, 42.2% of HIV-positive men were unaware of their status, compared to 32.0% among those in small urban areas (Table 8.3.A). Awareness of HIV status among women did not vary by residence with 23.6% and 20.6% unaware among those residing in large and small urban areas, respectively (Table 8.3.B).
Among HIV-positive men, the percentage of those who reported they were unaware of their HIV status was 43.5% among adults aged 15-49 years and 13.9% among older adults aged 50-64 years (Table 8.3.A). Among HIV-positive women, the percentage who reported that they were unaware of their HIV status ranged from 51.7% among those aged 15-24 years to 25.4% among older women aged 50-64 years (Table 8.3.B).
Among HIV-positive men, 61.1% were aware of their status and on ART, while 72.9% of HIV-positive women were aware of their status and on ART. (Tables 8.3.A, and 8.3.B).
The percentage of HIV-positive men who reported ART use ranged from 55.1% among those aged 15-49 years to 82.9% among older adults aged 50-64 years, while the percentage of HIV-positive women who reported being on ART ranged from 66.1% among those aged 25-29 years to 82.0% among those aged 30-34 years (Tables 8.3.A and 8.3.B).
Among married HIV-positive adults, 67.1% were aware of their status and on ART, 60.6% of men and 72.6% of women, while among those who had never married, 64.7% reported being on ART, 68.0% of men and 61.8% of women (Tables 8.3.A, 8.3.B and 8.3.C).
Overall, among HIV-positive adults, the percentage unaware of their status varied from 11.5% in Tigray to 41.6% in Gambella (Table 8.3.C). (Note: Not every region had a sample size large enough to make an estimate.)
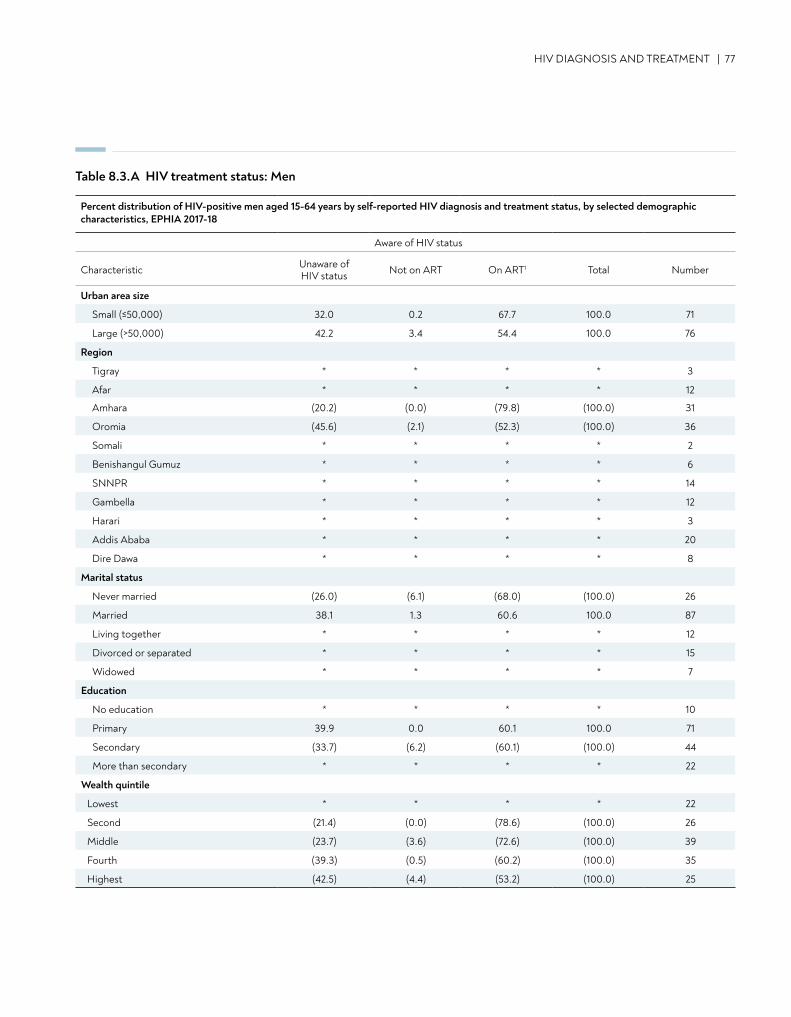
HIV DIAGNOSIS AND TREATMENT | 77
Table 8.3.A HIV treatment status: Men
Percent distribution of HIV-positive men aged 15-64 years by self-reported HIV diagnosis and treatment status, by selected demographic characteristics, EPHIA 2017-18
Aware of HIV status
Characteristic Unaware of HIV status Not on ART On ART1 Total Number
Urban area size
Small (≤50,000) 32.0 0.2 67.7 100.0 71
Large (>50,000) 42.2 3.4 54.4 100.0 76
Region
Tigray * * * * 3
Afar * * * * 12
Amhara (20.2) (0.0) (79.8) (100.0) 31
Oromia (45.6) (2.1) (52.3) (100.0) 36
Somali * * * * 2
Benishangul Gumuz * * * * 6
SNNPR * * * * 14
Gambella * * * * 12
Harari * * * * 3
Addis Ababa * * * * 20
Dire Dawa * * * * 8
Marital status
Never married (26.0) (6.1) (68.0) (100.0) 26
Married 38.1 1.3 60.6 100.0 87
Living together * * * * 12
Divorced or separated * * * * 15
Widowed * * * * 7
Education
No education * * * * 10
Primary 39.9 0.0 60.1 100.0 71
Secondary (33.7) (6.2) (60.1) (100.0) 44
More than secondary * * * * 22
Wealth quintile
Lowest * * * * 22
Second (21.4) (0.0) (78.6) (100.0) 26
Middle (23.7) (3.6) (72.6) (100.0) 39
Fourth (39.3) (0.5) (60.2) (100.0) 35
Highest (42.5) (4.4) (53.2) (100.0) 25
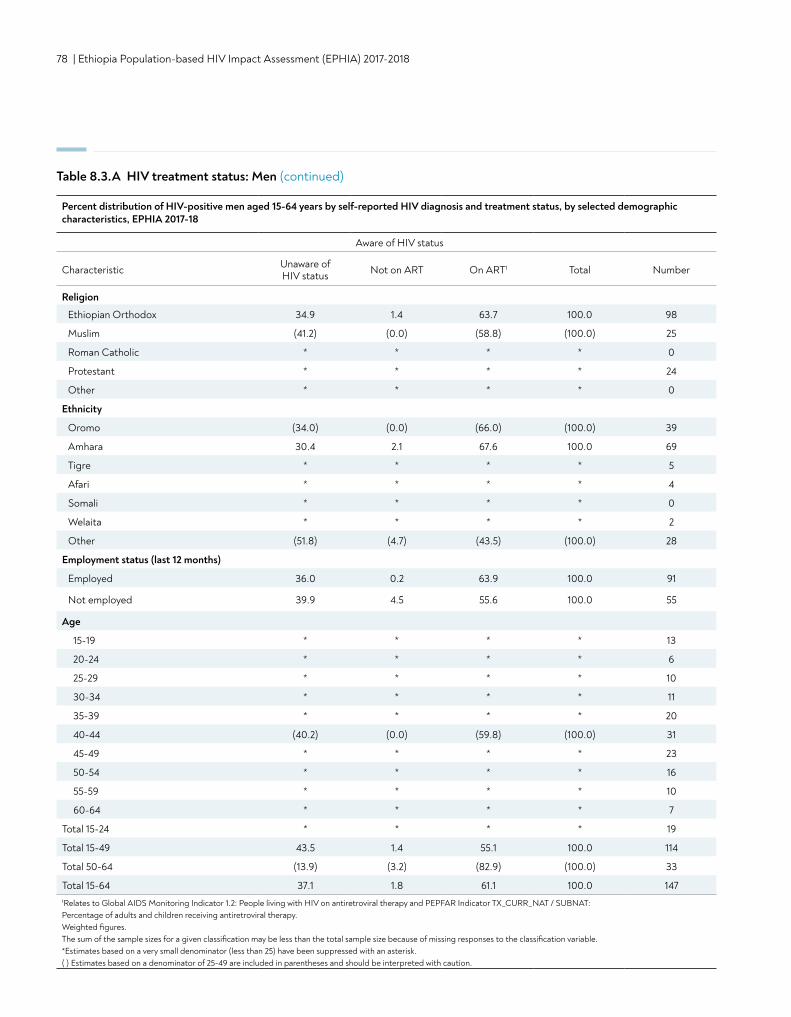
78 | Ethiopia Population-based HIV Impact Assessment (EPHIA) 2017-2018
Table 8.3.A HIV treatment status: Men (continued)
Religion
Ethiopian Orthodox 34.9 1.4 63.7 100.0 98
Muslim (41.2) (0.0) (58.8) (100.0) 25
Roman Catholic * * * * 0
Protestant * * * * 24
Other * * * * 0
Ethnicity
Oromo (34.0) (0.0) (66.0) (100.0) 39
Amhara 30.4 2.1 67.6 100.0 69
Tigre * * * * 5
Afari * * * * 4
Somali * * * * 0
Welaita * * * * 2
Other (51.8) (4.7) (43.5) (100.0) 28
Employment status (last 12 months)
Employed 36.0 0.2 63.9 100.0 91
Not employed 39.9 4.5 55.6 100.0 55
Age
15-19 * * * * 13
20-24 * * * * 6
25-29 * * * * 10
30-34 * * * * 11
35-39 * * * * 20
40-44 (40.2) (0.0) (59.8) (100.0) 31
45-49 * * * * 23
50-54 * * * * 16
55-59 * * * * 10
60-64 * * * * 7
Total 15-24 * * * * 19
Total 15-49 43.5 1.4 55.1 100.0 114
Total 50-64 (13.9) (3.2) (82.9) (100.0) 33
Total 15-64 37.1 1.8 61.1 100.0 1471Relates to Global AIDS Monitoring Indicator 1.2: People living with HIV on antiretroviral therapy and PEPFAR Indicator TX_CURR_NAT / SUBNAT: Percentage of adults and children receiving antiretroviral therapy. Weighted figures. The sum of the sample sizes for a given classification may be less than the total sample size because of missing responses to the classification variable.*Estimates based on a very small denominator (less than 25) have been suppressed with an asterisk. ( ) Estimates based on a denominator of 25-49 are included in parentheses and should be interpreted with caution.
Percent distribution of HIV-positive men aged 15-64 years by self-reported HIV diagnosis and treatment status, by selected demographiccharacteristics, EPHIA 2017-18
Aware of HIV status
Characteristic Unaware of HIV status Not on ART On ART1 Total Number
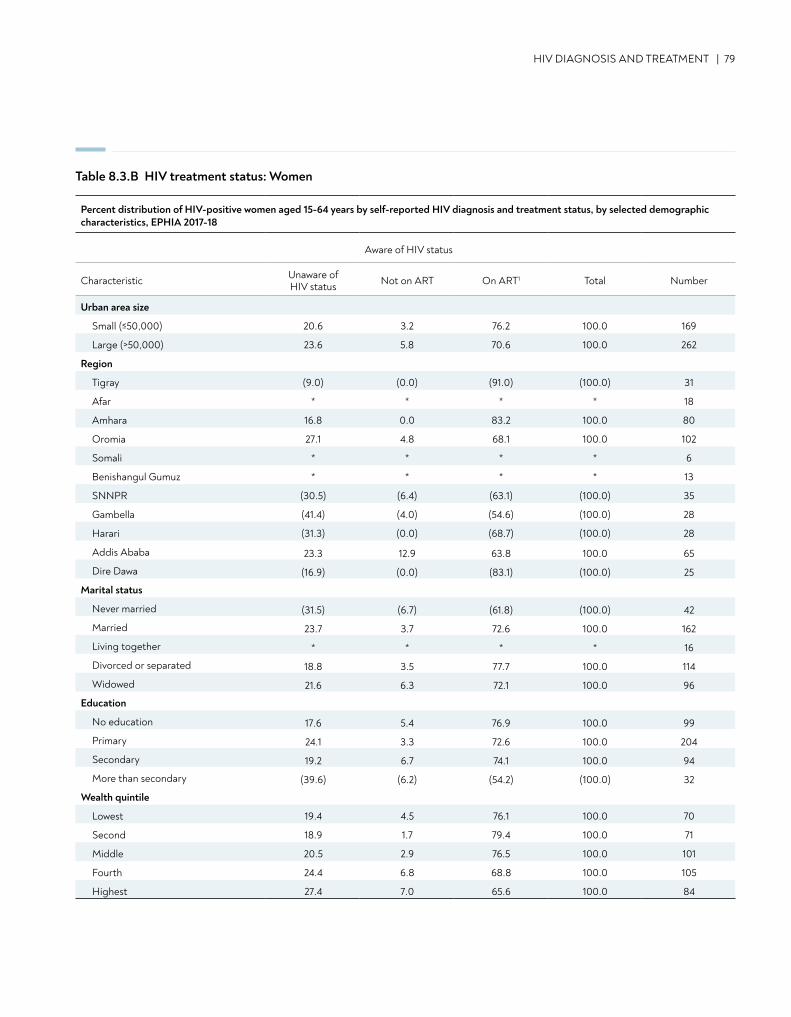
HIV DIAGNOSIS AND TREATMENT | 79
Percent distribution of HIV-positive women aged 15-64 years by self-reported HIV diagnosis and treatment status, by selected demographic characteristics, EPHIA 2017-18
Aware of HIV status
Characteristic Unaware of HIV status Not on ART On ART1 Total Number
Urban area size
Small (≤50,000) 20.6 3.2 76.2 100.0 169
Large (>50,000) 23.6 5.8 70.6 100.0 262
Region
Tigray (9.0) (0.0) (91.0) (100.0) 31
Afar * * * * 18
Amhara 16.8 0.0 83.2 100.0 80
Oromia 27.1 4.8 68.1 100.0 102
Somali * * * * 6
Benishangul Gumuz * * * * 13
SNNPR (30.5) (6.4) (63.1) (100.0) 35
Gambella (41.4) (4.0) (54.6) (100.0) 28
Harari (31.3) (0.0) (68.7) (100.0) 28
Addis Ababa 23.3 12.9 63.8 100.0 65
Dire Dawa (16.9) (0.0) (83.1) (100.0) 25
Marital status
Never married (31.5) (6.7) (61.8) (100.0) 42
Married 23.7 3.7 72.6 100.0 162
Living together * * * * 16
Divorced or separated 18.8 3.5 77.7 100.0 114
Widowed 21.6 6.3 72.1 100.0 96
Education
No education 17.6 5.4 76.9 100.0 99
Primary 24.1 3.3 72.6 100.0 204
Secondary 19.2 6.7 74.1 100.0 94
More than secondary (39.6) (6.2) (54.2) (100.0) 32
Wealth quintile
Lowest 19.4 4.5 76.1 100.0 70
Second 18.9 1.7 79.4 100.0 71
Middle 20.5 2.9 76.5 100.0 101
Fourth 24.4 6.8 68.8 100.0 105
Highest 27.4 7.0 65.6 100.0 84
Table 8.3.B HIV treatment status: Women
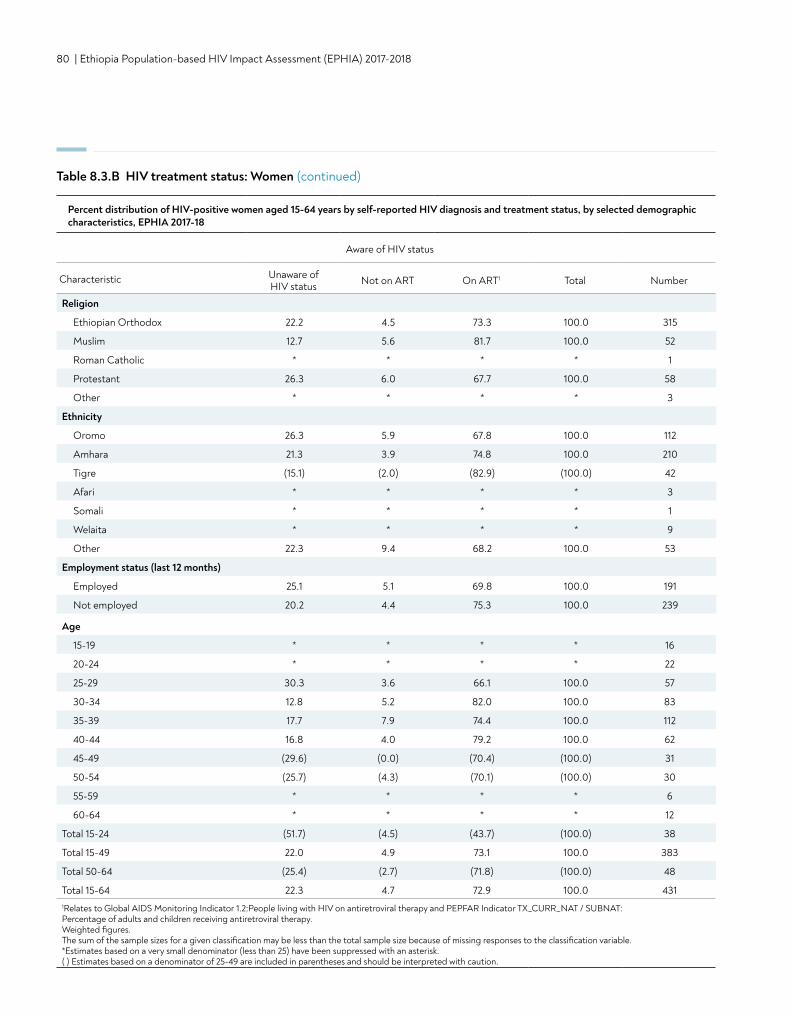
80 | Ethiopia Population-based HIV Impact Assessment (EPHIA) 2017-2018
Table 8.3.B HIV treatment status: Women (continued)
Religion
Ethiopian Orthodox 22.2 4.5 73.3 100.0 315
Muslim 12.7 5.6 81.7 100.0 52
Roman Catholic * * * * 1
Protestant 26.3 6.0 67.7 100.0 58
Other * * * * 3
Ethnicity
Oromo 26.3 5.9 67.8 100.0 112
Amhara 21.3 3.9 74.8 100.0 210
Tigre (15.1) (2.0) (82.9) (100.0) 42
Afari * * * * 3
Somali * * * * 1
Welaita * * * * 9
Other 22.3 9.4 68.2 100.0 53
Employment status (last 12 months)
Employed 25.1 5.1 69.8 100.0 191
Not employed 20.2 4.4 75.3 100.0 239
Percent distribution of HIV-positive women aged 15-64 years by self-reported HIV diagnosis and treatment status, by selected demographic characteristics, EPHIA 2017-18
Aware of HIV status
Characteristic Unaware of HIV status Not on ART On ART1 Total Number
Age
15-19 * * * * 16
20-24 * * * * 22
25-29 30.3 3.6 66.1 100.0 57
30-34 12.8 5.2 82.0 100.0 83
35-39 17.7 7.9 74.4 100.0 112
40-44 16.8 4.0 79.2 100.0 62
45-49 (29.6) (0.0) (70.4) (100.0) 31
50-54 (25.7) (4.3) (70.1) (100.0) 30
55-59 * * * * 6
60-64 * * * * 12
Total 15-24 (51.7) (4.5) (43.7) (100.0) 38
Total 15-49 22.0 4.9 73.1 100.0 383
Total 50-64 (25.4) (2.7) (71.8) (100.0) 48
Total 15-64 22.3 4.7 72.9 100.0 4311Relates to Global AIDS Monitoring Indicator 1.2:People living with HIV on antiretroviral therapy and PEPFAR Indicator TX_CURR_NAT / SUBNAT: Percentage of adults and children receiving antiretroviral therapy. Weighted figures. The sum of the sample sizes for a given classification may be less than the total sample size because of missing responses to the classification variable.*Estimates based on a very small denominator (less than 25) have been suppressed with an asterisk. ( ) Estimates based on a denominator of 25-49 are included in parentheses and should be interpreted with caution.
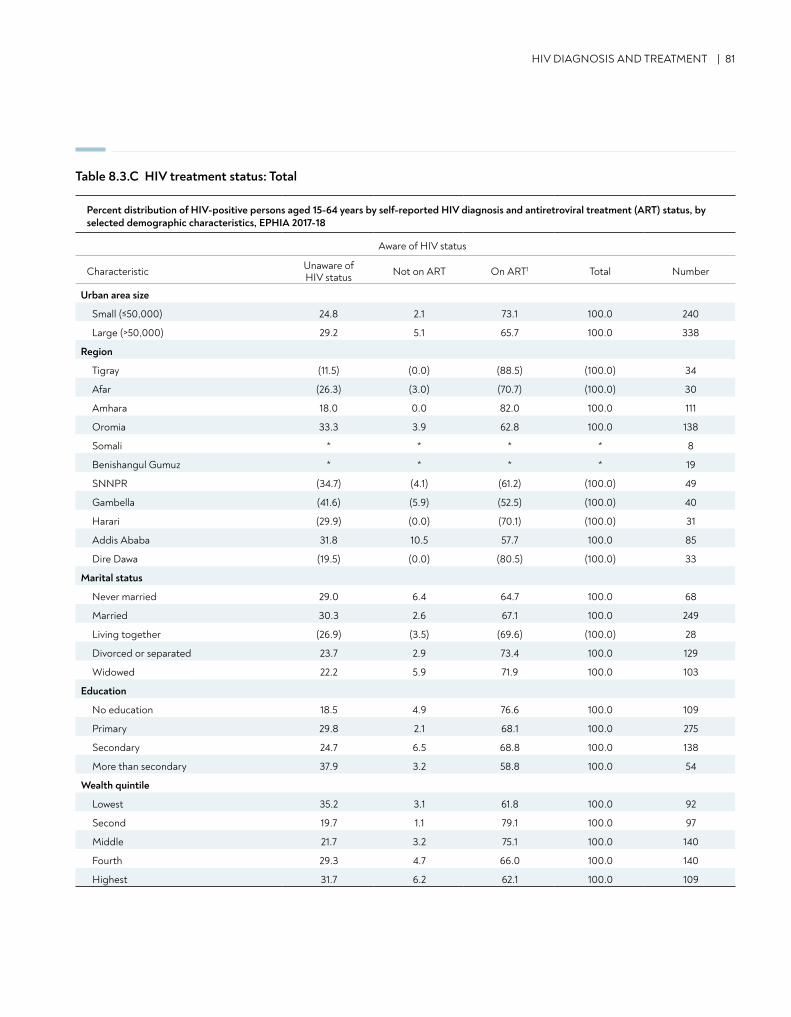
HIV DIAGNOSIS AND TREATMENT | 81
Table 8.3.C HIV treatment status: Total
Percent distribution of HIV-positive persons aged 15-64 years by self-reported HIV diagnosis and antiretroviral treatment (ART) status, by selected demographic characteristics, EPHIA 2017-18
Aware of HIV status
Characteristic Unaware of HIV status Not on ART On ART1 Total Number
Urban area size
Small (≤50,000) 24.8 2.1 73.1 100.0 240
Large (>50,000) 29.2 5.1 65.7 100.0 338
Region
Tigray (11.5) (0.0) (88.5) (100.0) 34
Afar (26.3) (3.0) (70.7) (100.0) 30
Amhara 18.0 0.0 82.0 100.0 111
Oromia 33.3 3.9 62.8 100.0 138
Somali * * * * 8
Benishangul Gumuz * * * * 19
SNNPR (34.7) (4.1) (61.2) (100.0) 49
Gambella (41.6) (5.9) (52.5) (100.0) 40
Harari (29.9) (0.0) (70.1) (100.0) 31
Addis Ababa 31.8 10.5 57.7 100.0 85
Dire Dawa (19.5) (0.0) (80.5) (100.0) 33
Marital status
Never married 29.0 6.4 64.7 100.0 68
Married 30.3 2.6 67.1 100.0 249
Living together (26.9) (3.5) (69.6) (100.0) 28
Divorced or separated 23.7 2.9 73.4 100.0 129
Widowed 22.2 5.9 71.9 100.0 103
Education
No education 18.5 4.9 76.6 100.0 109
Primary 29.8 2.1 68.1 100.0 275
Secondary 24.7 6.5 68.8 100.0 138
More than secondary 37.9 3.2 58.8 100.0 54
Wealth quintile
Lowest 35.2 3.1 61.8 100.0 92
Second 19.7 1.1 79.1 100.0 97
Middle 21.7 3.2 75.1 100.0 140
Fourth 29.3 4.7 66.0 100.0 140
Highest 31.7 6.2 62.1 100.0 109
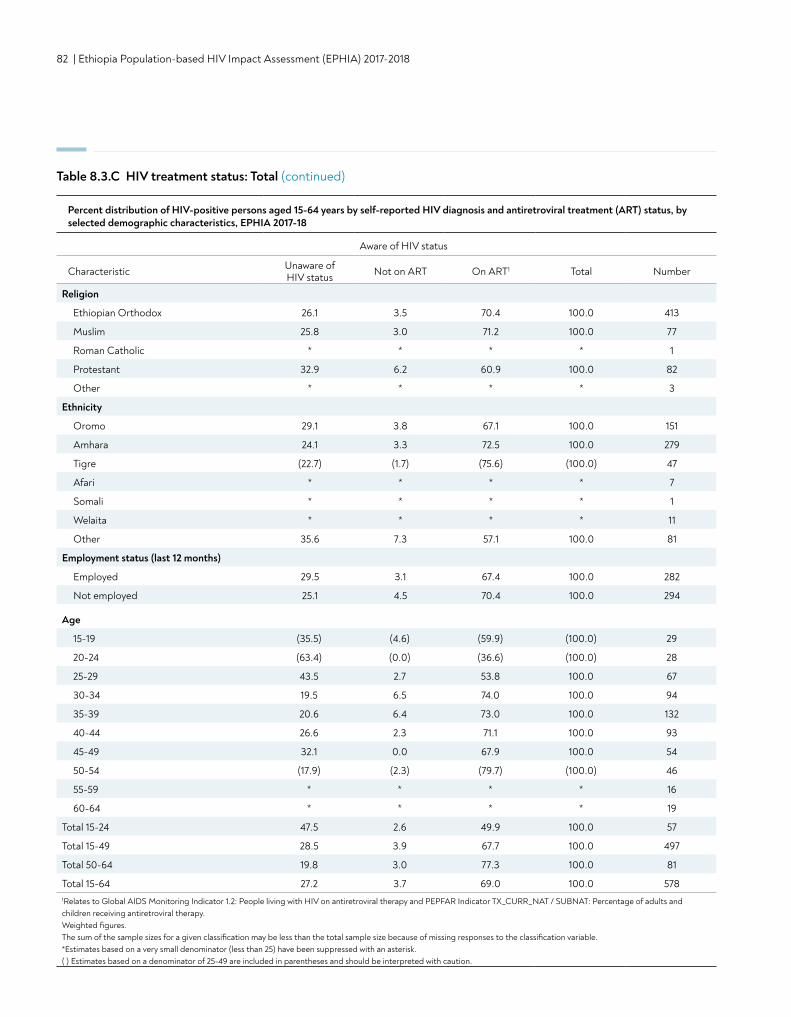
82 | Ethiopia Population-based HIV Impact Assessment (EPHIA) 2017-2018
Table 8.3.C HIV treatment status: Total (continued)
Religion
Ethiopian Orthodox 26.1 3.5 70.4 100.0 413
Muslim 25.8 3.0 71.2 100.0 77
Roman Catholic * * * * 1
Protestant 32.9 6.2 60.9 100.0 82
Other * * * * 3
Ethnicity
Oromo 29.1 3.8 67.1 100.0 151
Amhara 24.1 3.3 72.5 100.0 279
Tigre (22.7) (1.7) (75.6) (100.0) 47
Afari * * * * 7
Somali * * * * 1
Welaita * * * * 11
Other 35.6 7.3 57.1 100.0 81
Employment status (last 12 months)
Employed 29.5 3.1 67.4 100.0 282
Not employed 25.1 4.5 70.4 100.0 294
Age
15-19 (35.5) (4.6) (59.9) (100.0) 29
20-24 (63.4) (0.0) (36.6) (100.0) 28
25-29 43.5 2.7 53.8 100.0 67
30-34 19.5 6.5 74.0 100.0 94
35-39 20.6 6.4 73.0 100.0 132
40-44 26.6 2.3 71.1 100.0 93
45-49 32.1 0.0 67.9 100.0 54
50-54 (17.9) (2.3) (79.7) (100.0) 46
55-59 * * * * 16
60-64 * * * * 19
Total 15-24 47.5 2.6 49.9 100.0 57
Total 15-49 28.5 3.9 67.7 100.0 497
Total 50-64 19.8 3.0 77.3 100.0 81
Total 15-64 27.2 3.7 69.0 100.0 5781Relates to Global AIDS Monitoring Indicator 1.2: People living with HIV on antiretroviral therapy and PEPFAR Indicator TX_CURR_NAT / SUBNAT: Percentage of adults and children receiving antiretroviral therapy. Weighted figures. The sum of the sample sizes for a given classification may be less than the total sample size because of missing responses to the classification variable.*Estimates based on a very small denominator (less than 25) have been suppressed with an asterisk. ( ) Estimates based on a denominator of 25-49 are included in parentheses and should be interpreted with caution.
Percent distribution of HIV-positive persons aged 15-64 years by self-reported HIV diagnosis and antiretroviral treatment (ART) status, by selected demographic characteristics, EPHIA 2017-18
Aware of HIV status
Characteristic Unaware of HIV status Not on ART On ART1 Total Number
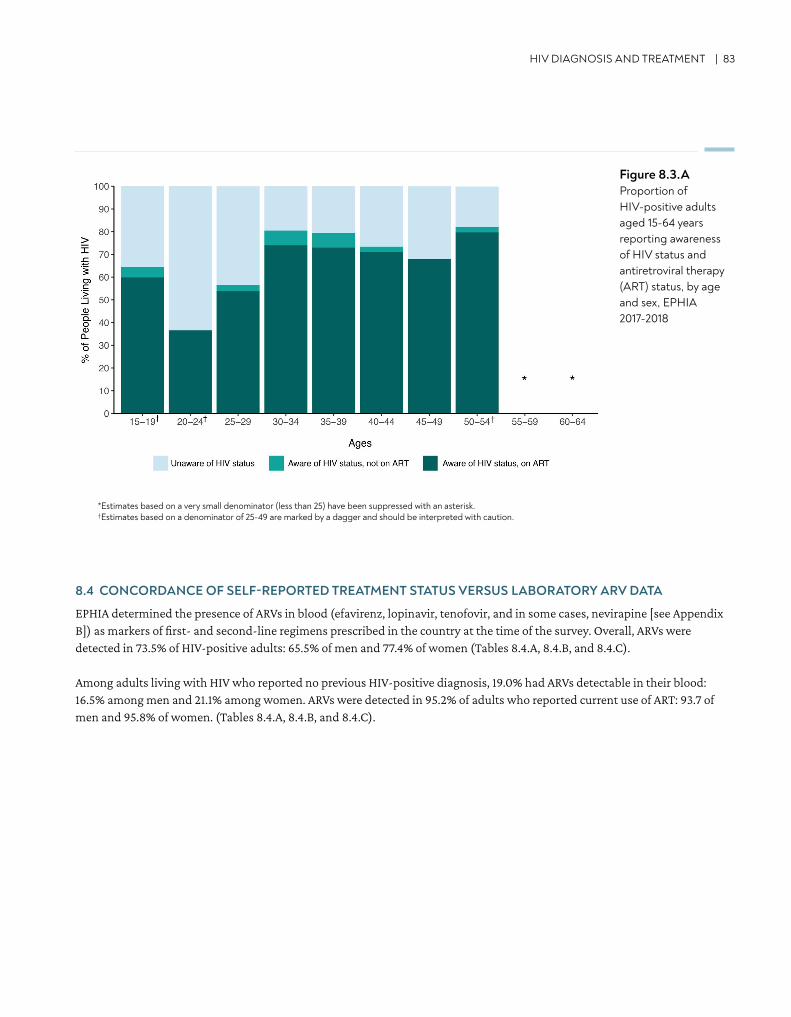
HIV DIAGNOSIS AND TREATMENT | 83
8.4 CONCORDANCE OF SELF-REPORTED TREATMENT STATUS VERSUS LABORATORY ARV DATA
EPHIA determined the presence of ARVs in blood (efavirenz, lopinavir, tenofovir, and in some cases, nevirapine [see Appendix B]) as markers of first- and second-line regimens prescribed in the country at the time of the survey. Overall, ARVs were detected in 73.5% of HIV-positive adults: 65.5% of men and 77.4% of women (Tables 8.4.A, 8.4.B, and 8.4.C).
Among adults living with HIV who reported no previous HIV-positive diagnosis, 19.0% had ARVs detectable in their blood: 16.5% among men and 21.1% among women. ARVs were detected in 95.2% of adults who reported current use of ART: 93.7 of men and 95.8% of women. (Tables 8.4.A, 8.4.B, and 8.4.C).
Figure 8.3.AProportion of HIV-positive adults aged 15-64 years reporting awareness of HIV status and antiretroviral therapy (ART) status, by age and sex, EPHIA 2017-2018
*Estimates based on a very small denominator (less than 25) have been suppressed with an asterisk.†Estimates based on a denominator of 25-49 are marked by a dagger and should be interpreted with caution.
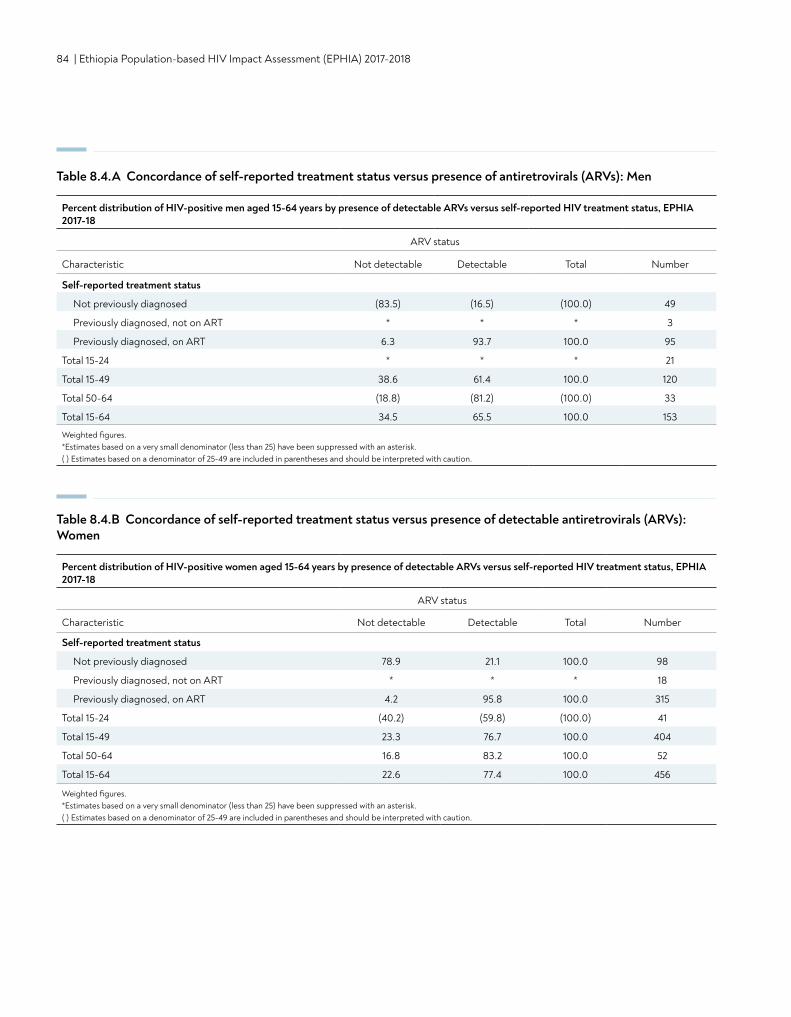
84 | Ethiopia Population-based HIV Impact Assessment (EPHIA) 2017-2018
Table 8.4.A Concordance of self-reported treatment status versus presence of antiretrovirals (ARVs): Men
Percent distribution of HIV-positive men aged 15-64 years by presence of detectable ARVs versus self-reported HIV treatment status, EPHIA 2017-18
ARV status
Characteristic Not detectable Detectable Total Number
Self-reported treatment status
Not previously diagnosed (83.5) (16.5) (100.0) 49
Previously diagnosed, not on ART * * * 3
Previously diagnosed, on ART 6.3 93.7 100.0 95
Total 15-24 * * * 21
Total 15-49 38.6 61.4 100.0 120
Total 50-64 (18.8) (81.2) (100.0) 33
Total 15-64 34.5 65.5 100.0 153
Weighted figures.*Estimates based on a very small denominator (less than 25) have been suppressed with an asterisk. ( ) Estimates based on a denominator of 25-49 are included in parentheses and should be interpreted with caution.
Table 8.4.B Concordance of self-reported treatment status versus presence of detectable antiretrovirals (ARVs): Women
Percent distribution of HIV-positive women aged 15-64 years by presence of detectable ARVs versus self-reported HIV treatment status, EPHIA 2017-18
ARV status
Characteristic Not detectable Detectable Total Number
Self-reported treatment status
Not previously diagnosed 78.9 21.1 100.0 98
Previously diagnosed, not on ART * * * 18
Previously diagnosed, on ART 4.2 95.8 100.0 315
Total 15-24 (40.2) (59.8) (100.0) 41
Total 15-49 23.3 76.7 100.0 404
Total 50-64 16.8 83.2 100.0 52
Total 15-64 22.6 77.4 100.0 456
Weighted figures.*Estimates based on a very small denominator (less than 25) have been suppressed with an asterisk. ( ) Estimates based on a denominator of 25-49 are included in parentheses and should be interpreted with caution.
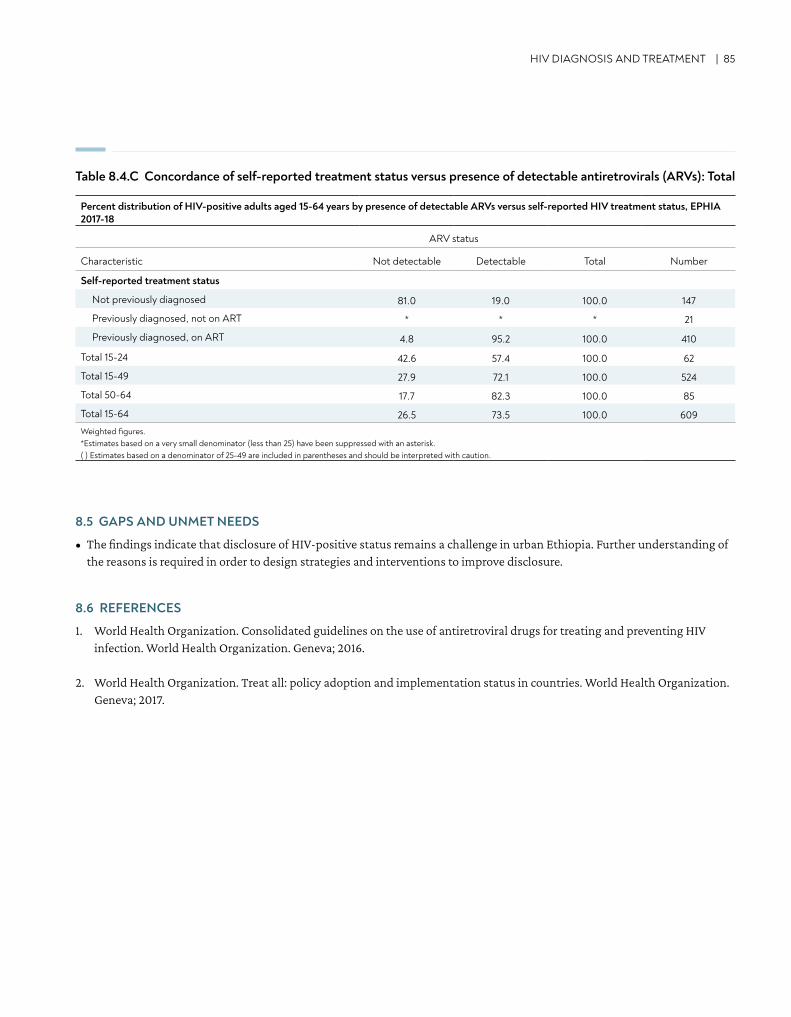
Table 8.4.C Concordance of self-reported treatment status versus presence of detectable antiretrovirals (ARVs): Total
HIV DIAGNOSIS AND TREATMENT | 85
8.5 GAPS AND UNMET NEEDS
• The findings indicate that disclosure of HIV-positive status remains a challenge in urban Ethiopia. Further understanding of the reasons is required in order to design strategies and interventions to improve disclosure.
8.6 REFERENCES
1. World Health Organization. Consolidated guidelines on the use of antiretroviral drugs for treating and preventing HIV infection. World Health Organization. Geneva; 2016.
2. World Health Organization. Treat all: policy adoption and implementation status in countries. World Health Organization. Geneva; 2017.
Percent distribution of HIV-positive adults aged 15-64 years by presence of detectable ARVs versus self-reported HIV treatment status, EPHIA 2017-18
ARV status
Characteristic Not detectable Detectable Total Number
Self-reported treatment status
Not previously diagnosed 81.0 19.0 100.0 147
Previously diagnosed, not on ART * * * 21
Previously diagnosed, on ART 4.8 95.2 100.0 410
Total 15-24 42.6 57.4 100.0 62
Total 15-49 27.9 72.1 100.0 524
Total 50-64 17.7 82.3 100.0 85
Total 15-64 26.5 73.5 100.0 609Weighted figures.*Estimates based on a very small denominator (less than 25) have been suppressed with an asterisk. ( ) Estimates based on a denominator of 25-49 are included in parentheses and should be interpreted with caution.
86 | Ethiopia Population-based HIV Impact Assessment (EPHIA) 2017-2018
9. VIRAL LOAD SUPPRESSION
• Among all HIV-positive adults aged 15-49 years in urban Ethiopia, the proportion with VLS was 68.2%, while the proportion of adults 15-64 years with VLS was 70.1%: 66.8% among men and 71.7% among women.
• The proportion of HIV-positive adults with VLS ranged from 48.2% in young people (ages 15-24 years) to 80.2% in adults aged 45-54 years.
• The percentage of HIV-positive adults aged 15-64 years with VLS ranged from 56.7% in Gambella and 58.2% in Addis Ababa to 79.6% in Amhara.
• Among those who reported a previous HIV-positive diagnosis and current ART use, the proportion with VLS was 89.6%.
KEY FINDINGS
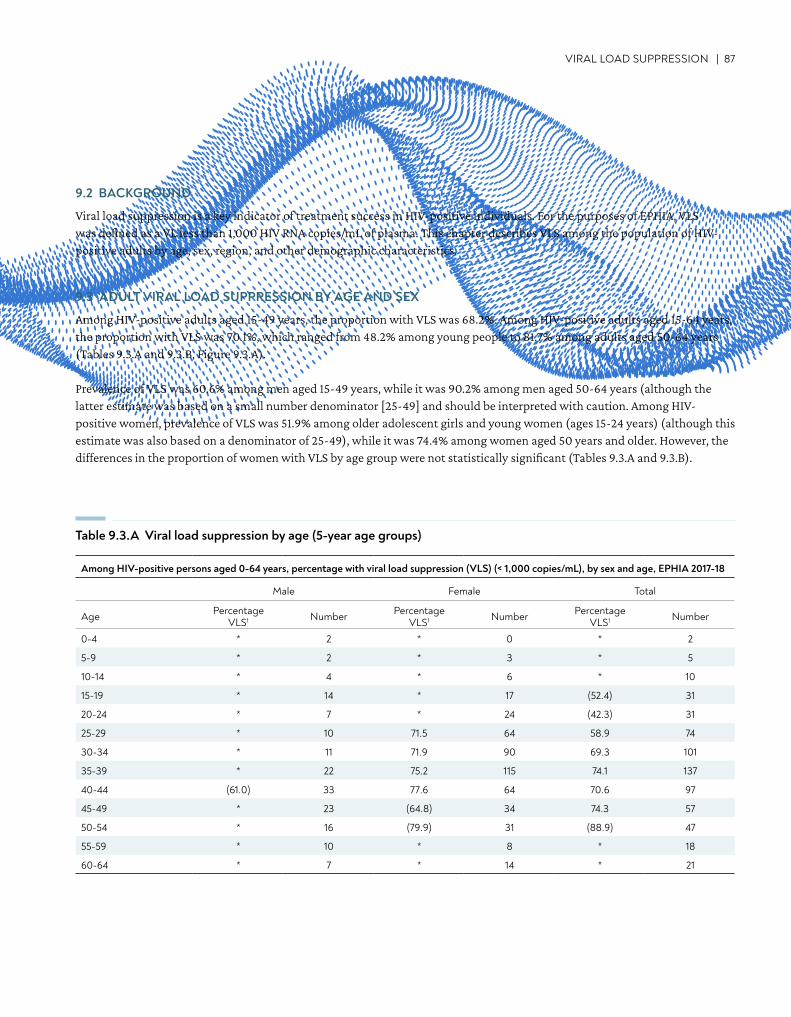
VIRAL LOAD SUPPRESSION | 87
9.2 BACKGROUND
Viral load suppression is a key indicator of treatment success in HIV-positive individuals. For the purposes of EPHIA, VLS was defined as a VL less than 1,000 HIV RNA copies/mL of plasma. This chapter describes VLS among the population of HIV-positive adults by age, sex, region, and other demographic characteristics.
9.3 ADULT VIRAL LOAD SUPPRESSION BY AGE AND SEX
Among HIV-positive adults aged 15-49 years, the proportion with VLS was 68.2%. Among HIV-positive adults aged 15-64 years, the proportion with VLS was 70.1%, which ranged from 48.2% among young people to 81.7% among adults aged 50-64 years (Tables 9.3.A and 9.3.B, Figure 9.3.A).
Prevalence of VLS was 60.6% among men aged 15-49 years, while it was 90.2% among men aged 50-64 years (although the latter estimate was based on a small number denominator [25-49] and should be interpreted with caution. Among HIV-positive women, prevalence of VLS was 51.9% among older adolescent girls and young women (ages 15-24 years) (although this estimate was also based on a denominator of 25-49), while it was 74.4% among women aged 50 years and older. However, the differences in the proportion of women with VLS by age group were not statistically significant (Tables 9.3.A and 9.3.B).
Table 9.3.A Viral load suppression by age (5-year age groups)
Among HIV-positive persons aged 0-64 years, percentage with viral load suppression (VLS) (< 1,000 copies/mL), by sex and age, EPHIA 2017-18
Male Female Total
Age Percentage VLS1 Number Percentage
VLS1 Number Percentage VLS1 Number
0-4 * 2 * 0 * 2
5-9 * 2 * 3 * 5
10-14 * 4 * 6 * 10
15-19 * 14 * 17 (52.4) 31
20-24 * 7 * 24 (42.3) 31
25-29 * 10 71.5 64 58.9 74
30-34 * 11 71.9 90 69.3 101
35-39 * 22 75.2 115 74.1 137
40-44 (61.0) 33 77.6 64 70.6 97
45-49 * 23 (64.8) 34 74.3 57
50-54 * 16 (79.9) 31 (88.9) 47
55-59 * 10 * 8 * 18
60-64 * 7 * 14 * 21
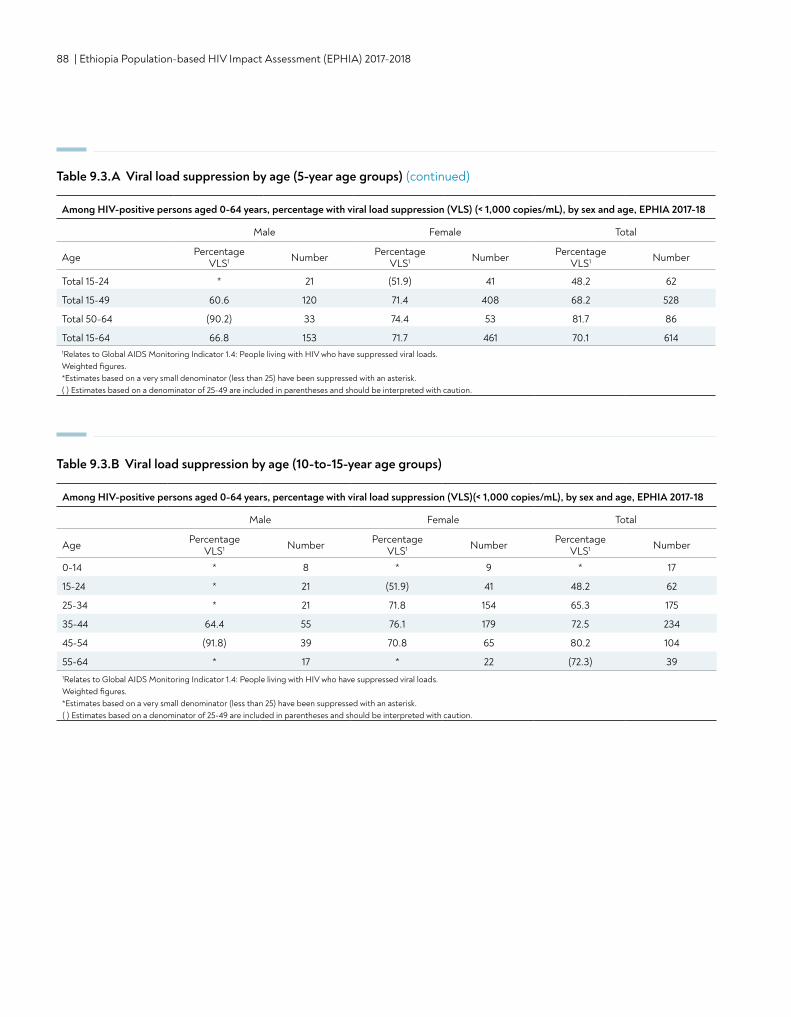
88 | Ethiopia Population-based HIV Impact Assessment (EPHIA) 2017-2018
Table 9.3.B Viral load suppression by age (10-to-15-year age groups)
Among HIV-positive persons aged 0-64 years, percentage with viral load suppression (VLS)(< 1,000 copies/mL), by sex and age, EPHIA 2017-18
Male Female Total
Age Percentage VLS1 Number Percentage
VLS1 Number Percentage VLS1 Number
0-14 * 8 * 9 * 17
15-24 * 21 (51.9) 41 48.2 62
25-34 * 21 71.8 154 65.3 175
35-44 64.4 55 76.1 179 72.5 234
45-54 (91.8) 39 70.8 65 80.2 104
55-64 * 17 * 22 (72.3) 391Relates to Global AIDS Monitoring Indicator 1.4: People living with HIV who have suppressed viral loads. Weighted figures.*Estimates based on a very small denominator (less than 25) have been suppressed with an asterisk. ( ) Estimates based on a denominator of 25-49 are included in parentheses and should be interpreted with caution.
Table 9.3.A Viral load suppression by age (5-year age groups) (continued)
Total 15-24 * 21 (51.9) 41 48.2 62
Total 15-49 60.6 120 71.4 408 68.2 528
Total 50-64 (90.2) 33 74.4 53 81.7 86
Total 15-64 66.8 153 71.7 461 70.1 6141Relates to Global AIDS Monitoring Indicator 1.4: People living with HIV who have suppressed viral loads. Weighted figures.*Estimates based on a very small denominator (less than 25) have been suppressed with an asterisk. ( ) Estimates based on a denominator of 25-49 are included in parentheses and should be interpreted with caution.
Among HIV-positive persons aged 0-64 years, percentage with viral load suppression (VLS) (< 1,000 copies/mL), by sex and age, EPHIA 2017-18
Male Female Total
Age Percentage VLS1 Number Percentage
VLS1 Number Percentage VLS1 Number
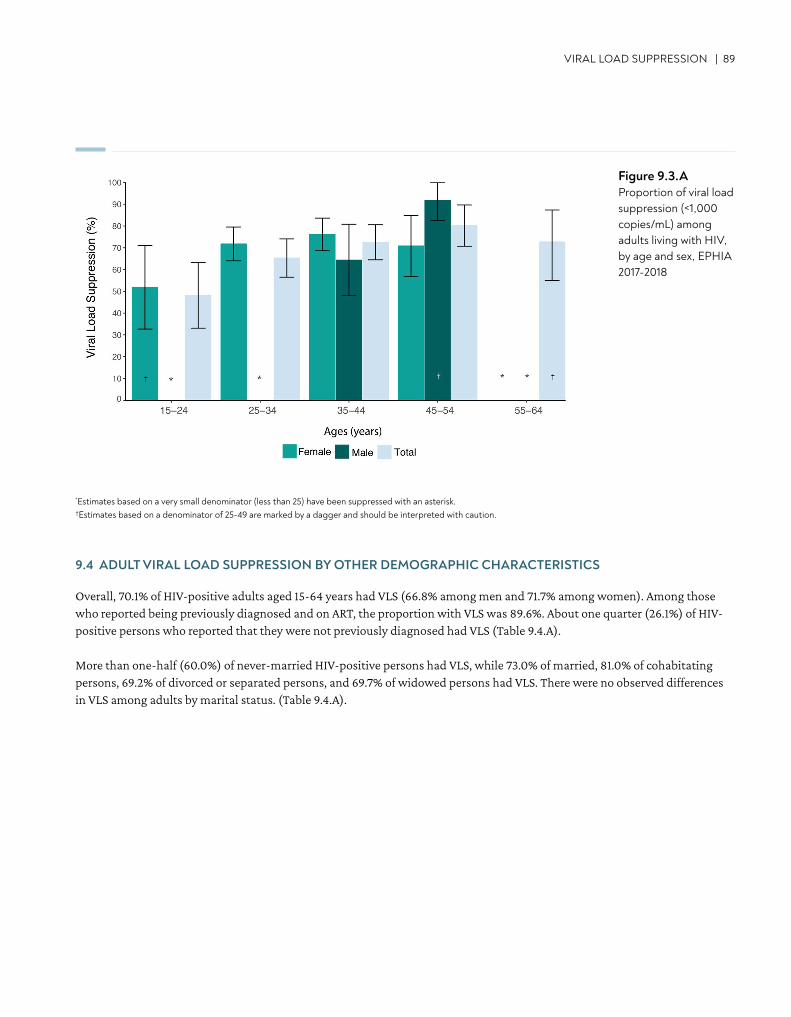
VIRAL LOAD SUPPRESSION | 89
*Estimates based on a very small denominator (less than 25) have been suppressed with an asterisk. †Estimates based on a denominator of 25-49 are marked by a dagger and should be interpreted with caution.
Figure 9.3.AProportion of viral load suppression (<1,000 copies/mL) among adults living with HIV, by age and sex, EPHIA 2017-2018
9.4 ADULT VIRAL LOAD SUPPRESSION BY OTHER DEMOGRAPHIC CHARACTERISTICS
Overall, 70.1% of HIV-positive adults aged 15-64 years had VLS (66.8% among men and 71.7% among women). Among those who reported being previously diagnosed and on ART, the proportion with VLS was 89.6%. About one quarter (26.1%) of HIV-positive persons who reported that they were not previously diagnosed had VLS (Table 9.4.A).
More than one-half (60.0%) of never-married HIV-positive persons had VLS, while 73.0% of married, 81.0% of cohabitating persons, 69.2% of divorced or separated persons, and 69.7% of widowed persons had VLS. There were no observed differences in VLS among adults by marital status. (Table 9.4.A).
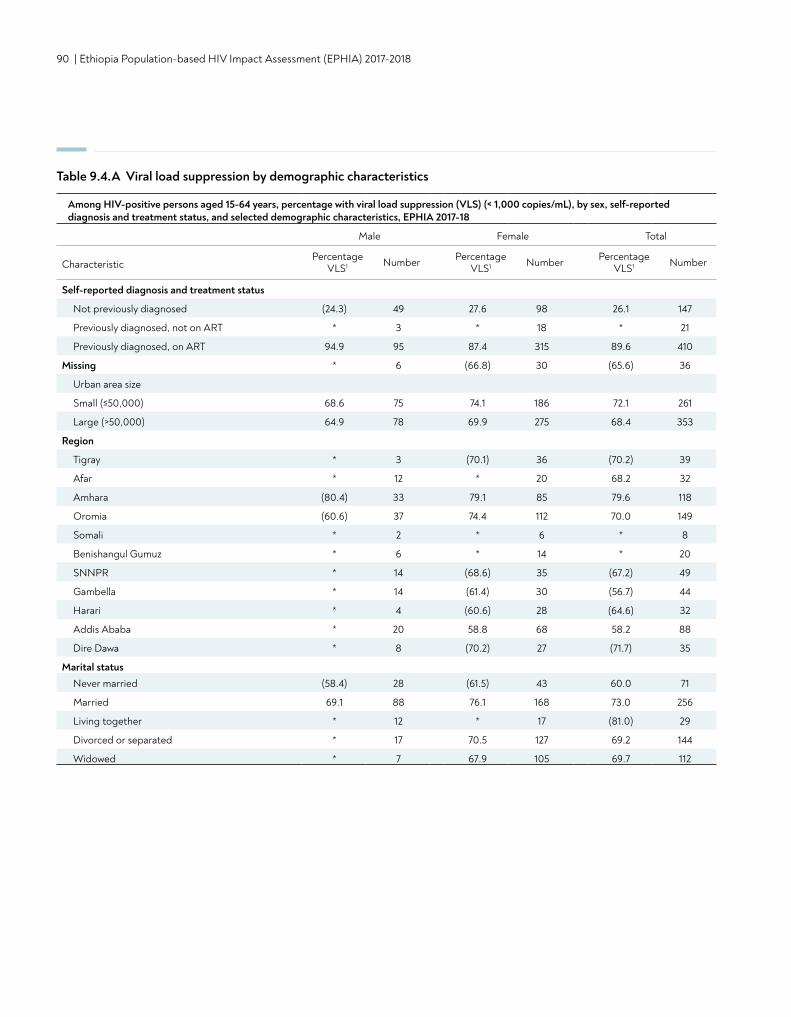
90 | Ethiopia Population-based HIV Impact Assessment (EPHIA) 2017-2018
Among HIV-positive persons aged 15-64 years, percentage with viral load suppression (VLS) (< 1,000 copies/mL), by sex, self-reported diagnosis and treatment status, and selected demographic characteristics, EPHIA 2017-18
Male Female Total
CharacteristicPercentage
VLS1 Number Percentage VLS1 Number Percentage
VLS1 Number
Self-reported diagnosis and treatment status
Not previously diagnosed (24.3) 49 27.6 98 26.1 147
Previously diagnosed, not on ART * 3 * 18 * 21
Previously diagnosed, on ART 94.9 95 87.4 315 89.6 410
Missing * 6 (66.8) 30 (65.6) 36
Urban area size
Small (≤50,000) 68.6 75 74.1 186 72.1 261
Large (>50,000) 64.9 78 69.9 275 68.4 353
Region
Tigray * 3 (70.1) 36 (70.2) 39
Afar * 12 * 20 68.2 32
Amhara (80.4) 33 79.1 85 79.6 118
Oromia (60.6) 37 74.4 112 70.0 149
Somali * 2 * 6 * 8
Benishangul Gumuz * 6 * 14 * 20
SNNPR * 14 (68.6) 35 (67.2) 49
Gambella * 14 (61.4) 30 (56.7) 44
Harari * 4 (60.6) 28 (64.6) 32
Addis Ababa * 20 58.8 68 58.2 88
Dire Dawa * 8 (70.2) 27 (71.7) 35
Marital statusNever married (58.4) 28 (61.5) 43 60.0 71
Married 69.1 88 76.1 168 73.0 256
Living together * 12 * 17 (81.0) 29
Divorced or separated * 17 70.5 127 69.2 144
Widowed * 7 67.9 105 69.7 112
Table 9.4.A Viral load suppression by demographic characteristics
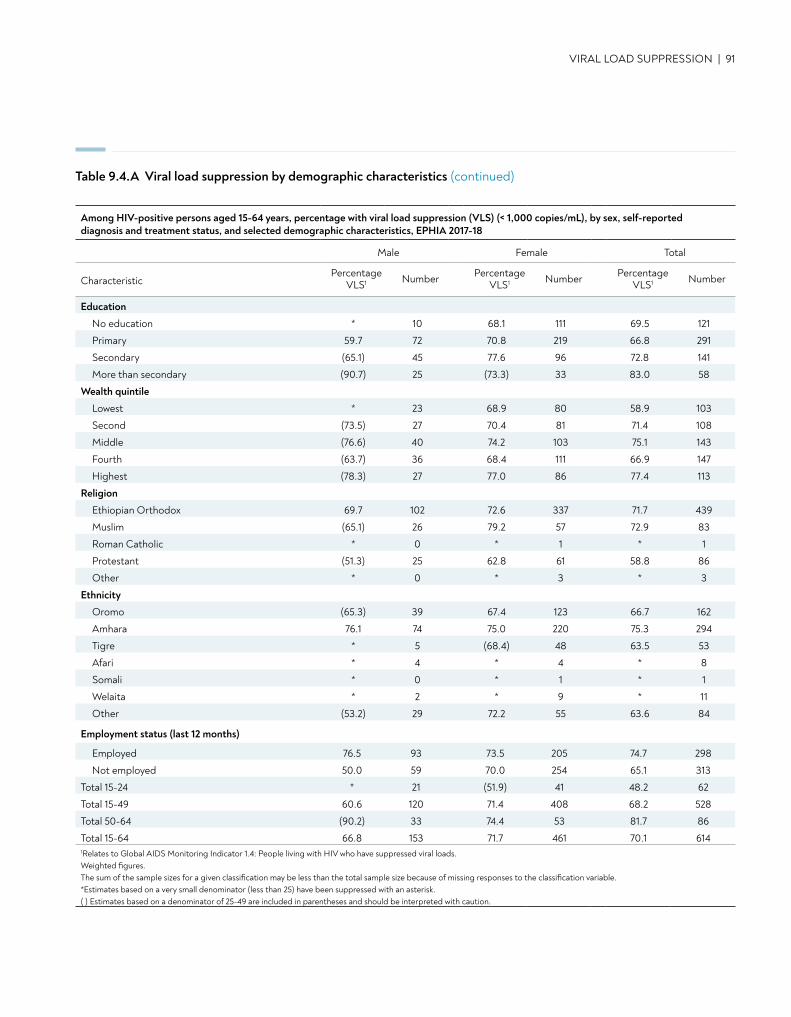
VIRAL LOAD SUPPRESSION | 91
Education
No education * 10 68.1 111 69.5 121
Primary 59.7 72 70.8 219 66.8 291
Secondary (65.1) 45 77.6 96 72.8 141
More than secondary (90.7) 25 (73.3) 33 83.0 58
Wealth quintile
Lowest * 23 68.9 80 58.9 103
Second (73.5) 27 70.4 81 71.4 108
Middle (76.6) 40 74.2 103 75.1 143
Fourth (63.7) 36 68.4 111 66.9 147
Highest (78.3) 27 77.0 86 77.4 113
Religion
Ethiopian Orthodox 69.7 102 72.6 337 71.7 439
Muslim (65.1) 26 79.2 57 72.9 83
Roman Catholic * 0 * 1 * 1
Protestant (51.3) 25 62.8 61 58.8 86
Other * 0 * 3 * 3
Ethnicity
Oromo (65.3) 39 67.4 123 66.7 162
Amhara 76.1 74 75.0 220 75.3 294
Tigre * 5 (68.4) 48 63.5 53
Afari * 4 * 4 * 8
Somali * 0 * 1 * 1
Welaita * 2 * 9 * 11
Other (53.2) 29 72.2 55 63.6 84
Employment status (last 12 months)
Employed 76.5 93 73.5 205 74.7 298
Not employed 50.0 59 70.0 254 65.1 313
Total 15-24 * 21 (51.9) 41 48.2 62
Total 15-49 60.6 120 71.4 408 68.2 528
Total 50-64 (90.2) 33 74.4 53 81.7 86
Total 15-64 66.8 153 71.7 461 70.1 6141Relates to Global AIDS Monitoring Indicator 1.4: People living with HIV who have suppressed viral loads. Weighted figures.The sum of the sample sizes for a given classification may be less than the total sample size because of missing responses to the classification variable.*Estimates based on a very small denominator (less than 25) have been suppressed with an asterisk. ( ) Estimates based on a denominator of 25-49 are included in parentheses and should be interpreted with caution.
Among HIV-positive persons aged 15-64 years, percentage with viral load suppression (VLS) (< 1,000 copies/mL), by sex, self-reported diagnosis and treatment status, and selected demographic characteristics, EPHIA 2017-18
Male Female Total
CharacteristicPercentage
VLS1 Number Percentage VLS1 Number Percentage
VLS1 Number
Table 9.4.A Viral load suppression by demographic characteristics (continued)
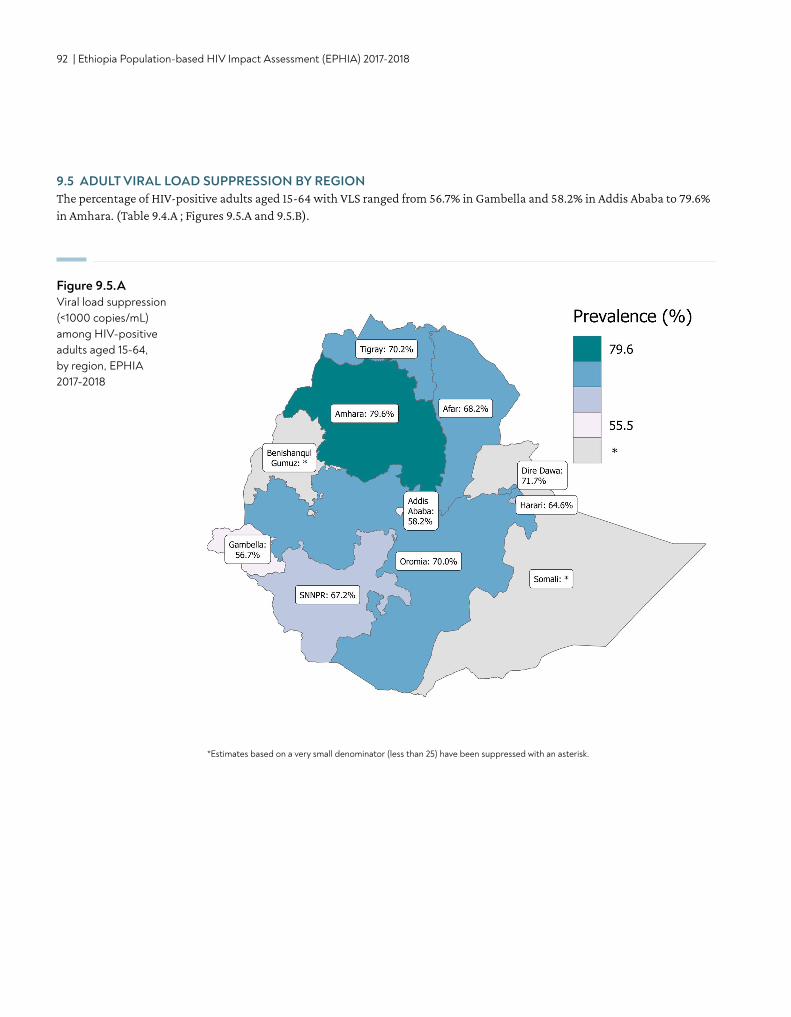
92 | Ethiopia Population-based HIV Impact Assessment (EPHIA) 2017-2018
9.5 ADULT VIRAL LOAD SUPPRESSION BY REGION The percentage of HIV-positive adults aged 15-64 with VLS ranged from 56.7% in Gambella and 58.2% in Addis Ababa to 79.6% in Amhara. (Table 9.4.A ; Figures 9.5.A and 9.5.B).
Figure 9.5.AViral load suppression (<1000 copies/mL) among HIV-positive adults aged 15-64, by region, EPHIA 2017-2018
*Estimates based on a very small denominator (less than 25) have been suppressed with an asterisk.

VIRAL LOAD SUPPRESSION | 93
Figure 9.5.BViral load suppression (<1000 copies/mL) among HIV-positive adults aged 15-64, by region, EPHIA 2017-2018
*Estimates based on a very small denominator (less than 25) have been suppressed with an asterisk.
9.6 GAPS AND UNMET NEEDS
• About one third of the adults living with HIV in the urban areas of Ethiopia do not have VLS. VLS among young people was low (48.2%).
• Overall, VLS is high among people living with HIV who report that they know their HIV status and are taking ART, but among those who did not know their HIV status, it is very low. This shows the need to strengthen case finding through effective HIV testing strategies in order to improve VLS for the overall population.
• VLS among people living with HIV in some of the regions is low, indicating a need to improve case finding as well as adherence to treatment.
94 | Ethiopia Population-based HIV Impact Assessment (EPHIA) 2017-2018
10. PROGRESS TOWARDS 90-90-90 TARGETS
• Diagnosed: Based on self-report adjusted with ARV detection data, it is estimated that in urban Ethiopia, 79.0% of HIV positive adults (ages 15-64 years) know their HIV status (83.3% of HIV-positive women and 70.0% of HIV-positive men).
• On treatment: Based on self-report adjusted for ARV detection, it is estimated that among adults living with HIV who know their HIV status, 97.1% were receiving ART (96.4% of women and 98.9% men).
• Viral load suppression: Among adults living with HIV who reported ARV use or had detectable ARVs, 87.6% had VLS (86.1% of women and 91.1% of men).
• Based on EPHIA data, it is estimated there are approximately 384,000 adults living with HIV in urban Ethiopia. Among them, approximately 303,000 people were aware of their HIV positive status, 295,000 were on treatment, and 258,000 had VLS on treatment.
KEY FINDINGS
PROGRESS TOWARDS 90-90-90 TARGETS | 95
10.2 BACKGROUND
In order to bring the HIV epidemic under control, UNAIDS has set the ambitious target referred to as 90-90-90: By 2020, 90% of all people living with HIV will know their HIV status; 90% of all persons with diagnosed HIV infection will receive sustained ART; and 90% of all persons receiving ART will have VLS.1
The previous chapters on HIV testing and treatment provide results on coverage of HIV testing and treatment services, while VLS among all HIV-positive individuals is a measure of program impact, irrespective of knowledge of status or being on treatment. This chapter presents the status of the 90-90-90 indicators, which indicate signals of program performance. Awareness of HIV-positive status and receipt of treatment among those aware of their HIV-positive status are indicators of access to services. Measuring VLS among those aware of their HIV status and on treatment not only provides an indication of access to and retention in care, but also, when compared to VLS among all HIV-positive individuals, provides a measure of program success. VLS among all HIV-positive individuals of 73% (the product of 90% x 90% x 90%) or greater is an indication of successful testing and treatment services.
The 90-90-90 results in this chapter have been presented in two ways. First, Table 10.3.A measures the overall percentages among all adults living with HIV in the urban centers of Ethiopia of those who were aware of their status, those who were on treatment, and those who achieved VLS. Individuals were classified as ‘aware’ of their HIV-positive status if they reported their HIV-positive status or had detectable ARVs in their blood. Individuals were classified as ‘on treatment’ if they reported that they were taking ART or had detectable ARVs in their blood. Table 10.3.C presents the same overall percentages, only disaggregated by region.
Second, Table 10.3.B, which also uses both self-reported and ARV biomarker data for its estimates of the 90-90-90 results, reflects the outcomes only among those receiving care in HIV treatment programs in Ethiopia (thus this is called the conditional 90-90-90). Estimates for those aware of their status are the same as in Table 10.3.A. However, this table reports the percentages of those who are ‘on treatment’ only among those who were classified as aware (or diagnosed), and presents the percentage with VLS only among those who were determined to be on treatment. Therefore, this table presents the outcomes only of the people living with HIV who are participating in an HIV treatment program rather than among the entire population of people living with HIV in the urban centers of Ethiopia.
It is important to note that in both cascades, individuals who have VLS, but are not aware of their HIV-positive status or are not on ARVs, are excluded from the numerator for the third 90 (VLS among those who are aware and on ARVs).
10.3 STATUS OF THE UNAIDS 90-90-90 TARGETS
Overall 90-90-90 cascade based on self-reported awareness of HIV status and ART use and adjusted for detectable ARVs, and VLS (ARV-adjusted awareness of HIV-positive status):More than three quarters (79.0%) of HIV-positive adults in urban Ethiopia were aware of their HIV status: 83.3% of women and 70.0% of men. Among all the HIV-positive adults, 76.7% had detectable ARVs or reported current ART usage: 80.3% among women and 69.3% among men. Of all the HIV-positive population, only 67.2% had VLS: 69.2% among women and 63.1% among men. (Table 10.3.A).
96 | Ethiopia Population-based HIV Impact Assessment (EPHIA) 2017-2018
90-90-90 cascade based on self-reported awareness of HIV status and ART use and adjusted for detectable ARVs (ARV-adjusted awareness of HIV-positive status):Among HIV-positive adults, 79.0% were classified as aware according to combined self-reported awareness and detectable ARVs data (ARV-adjusted awareness). There was a significant difference by gender (70.0% of men [95% CI: 60.8%-79.2%] and 83.3% of women [95% CI: 79.7%-86.9%]) (Table 10.3.B, Figure 10.3.A). Similar or higher levels of ARV-adjusted awareness were observed for all age groups above 25 years of age. However, ARV-adjusted awareness of HIV-positive status was observed in only 63.0% of HIV-positive young people aged 15-24 years (Table 10.3.B).
ARV-adjusted treatment status: Based on either self-reported ART status or detection of ARVs, 97.1% of those with ARV-adjusted awareness status were classified as on ART (Table 10.3.B; Figure 10.3.A). This was similar across age groups ranging from 100.0% among young people (those aged 15-24 years) to 95.8% among adults aged 25-34 years. (Table 10.3.B).
Viral suppression: Among adults on ART (ARV-adjusted treatment status), 87.6% had VLS, ranging from 74.3% among young people to 92.6% among older adults aged 50-64 years. There were no significant differences in VLS among men and women and across age groups who were on ART (Table 10.3.B, Figure 10.3.A).
Based on EPHIA data, it is estimated there are approximately 384,000 adults living with HIV in urban Ethiopia (Table 5.3.C). Among them, approximately 303,000 people were aware of their HIV-positive status, 295,000 were on treatment, and 258,000 had suppressed viral loads (data not shown).
90-90-90 cascade at regional level, based on self-reported awareness of HIV-positive status and treatment status, adjusted for detectable ARVs, and VLS (ARV-adjusted awareness of HIV-positive status):Among HIV-positive adults aged 15-64, awareness of ARV status ranged from 66.6% in Gambella to 89.5% in Tigray. The percentage of all HIV-positive adults with detectable ARVs or self-reported current ART usage ranged from 61.2% in Gambella to 89.5% in Tigray. The percentage of all HIV-positive adults who achieved VLS ranged from 54.1% in Gambella to 78.5% in Amhara (Table 10.3.C). (Note: Some of these estimates were based on a small number of observations [a denominator of 25 to 49], and should be interpreted with caution.)
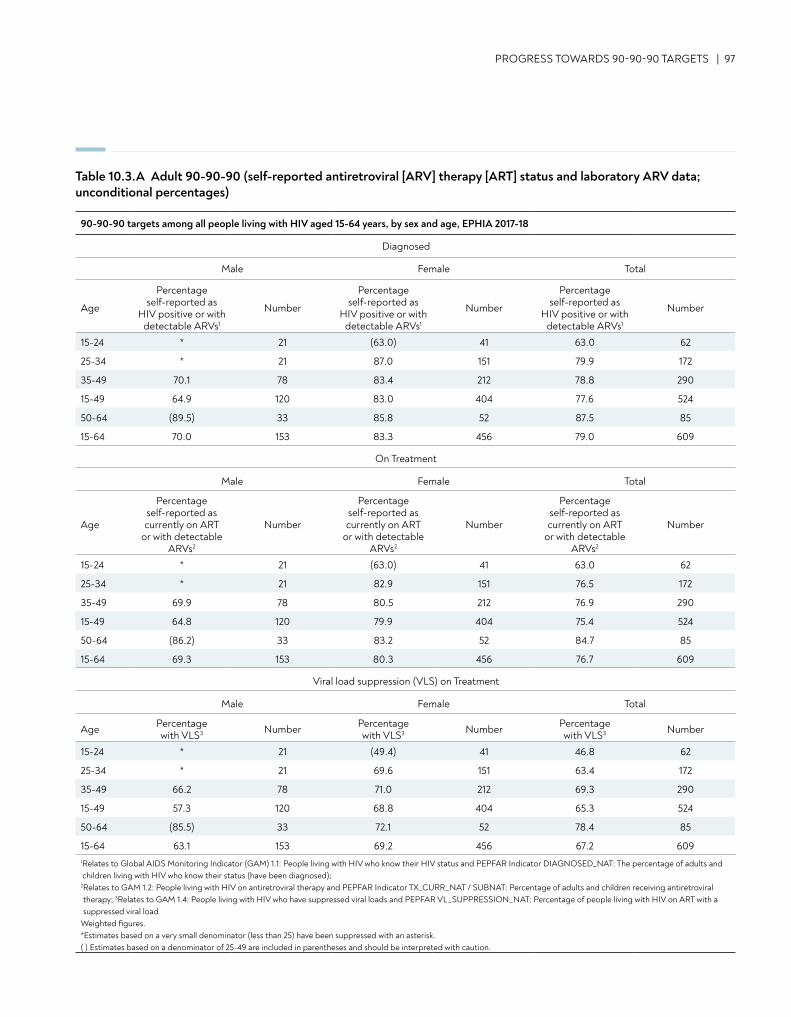
PROGRESS TOWARDS 90-90-90 TARGETS | 97
90-90-90 targets among all people living with HIV aged 15-64 years, by sex and age, EPHIA 2017-18
Diagnosed
Male Female Total
Age
Percentage self-reported as
HIV positive or with detectable ARVs1
Number
Percentage self-reported as
HIV positive or with detectable ARVs1
Number
Percentage self-reported as
HIV positive or with detectable ARVs1
Number
15-24 * 21 (63.0) 41 63.0 62
25-34 * 21 87.0 151 79.9 172
35-49 70.1 78 83.4 212 78.8 290
15-49 64.9 120 83.0 404 77.6 524
50-64 (89.5) 33 85.8 52 87.5 85
15-64 70.0 153 83.3 456 79.0 609
On Treatment
Male Female Total
Age
Percentage self-reported as currently on ART
or with detectable ARVs2
Number
Percentage self-reported as currently on ART
or with detectable ARVs2
Number
Percentage self-reported as currently on ART
or with detectable ARVs2
Number
15-24 * 21 (63.0) 41 63.0 62
25-34 * 21 82.9 151 76.5 172
35-49 69.9 78 80.5 212 76.9 290
15-49 64.8 120 79.9 404 75.4 524
50-64 (86.2) 33 83.2 52 84.7 85
15-64 69.3 153 80.3 456 76.7 609
Viral load suppression (VLS) on Treatment
Male Female Total
Age Percentage with VLS3 Number Percentage
with VLS3 Number Percentage with VLS3 Number
15-24 * 21 (49.4) 41 46.8 62
25-34 * 21 69.6 151 63.4 172
35-49 66.2 78 71.0 212 69.3 290
15-49 57.3 120 68.8 404 65.3 524
50-64 (85.5) 33 72.1 52 78.4 85
15-64 63.1 153 69.2 456 67.2 6091 Relates to Global AIDS Monitoring Indicator (GAM) 1.1: People living with HIV who know their HIV status and PEPFAR Indicator DIAGNOSED_NAT: The percentage of adults and children living with HIV who know their status (have been diagnosed);
2 Relates to GAM 1.2: People living with HIV on antiretroviral therapy and PEPFAR Indicator TX_CURR_NAT / SUBNAT: Percentage of adults and children receiving antiretroviral therapy; 3Relates to GAM 1.4: People living with HIV who have suppressed viral loads and PEPFAR VL_SUPPRESSION_NAT: Percentage of people living with HIV on ART with a suppressed viral load
Weighted figures.*Estimates based on a very small denominator (less than 25) have been suppressed with an asterisk. ( ) Estimates based on a denominator of 25-49 are included in parentheses and should be interpreted with caution.
Table 10.3.A Adult 90-90-90 (self-reported antiretroviral [ARV] therapy [ART] status and laboratory ARV data; unconditional percentages)
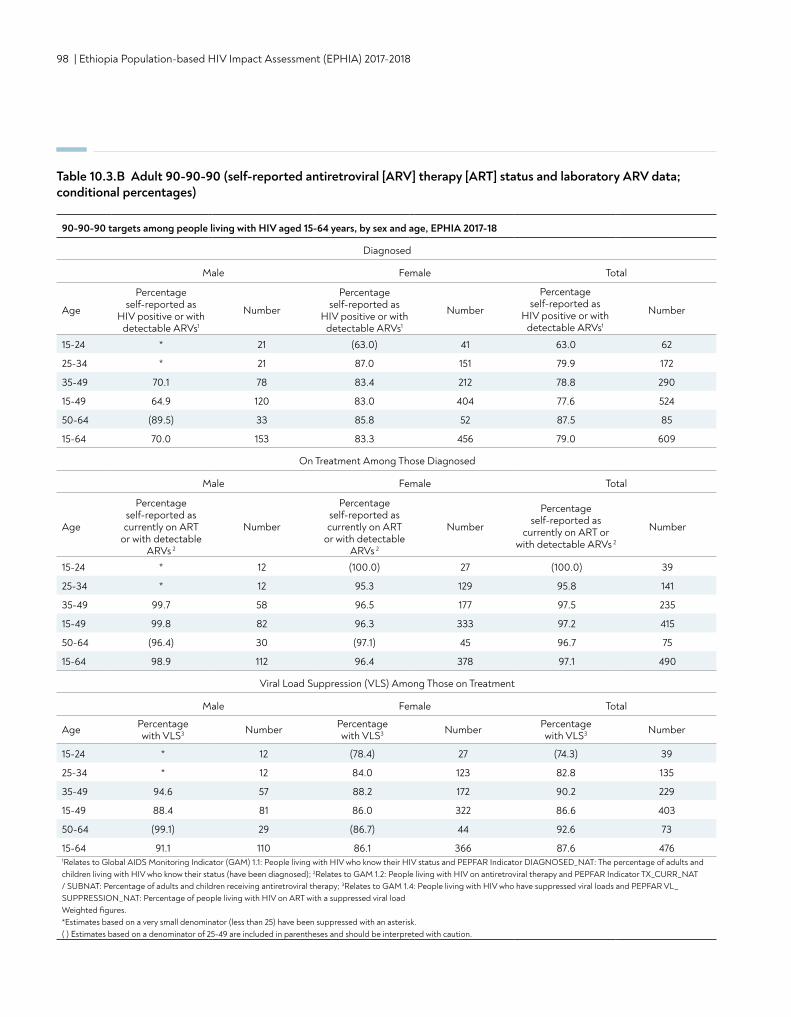
98 | Ethiopia Population-based HIV Impact Assessment (EPHIA) 2017-2018
Table 10.3.B Adult 90-90-90 (self-reported antiretroviral [ARV] therapy [ART] status and laboratory ARV data; conditional percentages)
90-90-90 targets among people living with HIV aged 15-64 years, by sex and age, EPHIA 2017-18
Diagnosed
Male Female Total
Age
Percentage self-reported as
HIV positive or with detectable ARVs1
Number
Percentage self-reported as
HIV positive or with detectable ARVs1
Number
Percentage self-reported as
HIV positive or with detectable ARVs1
Number
15-24 * 21 (63.0) 41 63.0 62
25-34 * 21 87.0 151 79.9 172
35-49 70.1 78 83.4 212 78.8 290
15-49 64.9 120 83.0 404 77.6 524
50-64 (89.5) 33 85.8 52 87.5 85
15-64 70.0 153 83.3 456 79.0 609
On Treatment Among Those Diagnosed
Male Female Total
Age
Percentage self-reported as currently on ART
or with detectable ARVs 2
Number
Percentage self-reported as currently on ART
or with detectable ARVs 2
Number
Percentage self-reported as
currently on ART or with detectable ARVs 2
Number
15-24 * 12 (100.0) 27 (100.0) 39
25-34 * 12 95.3 129 95.8 141
35-49 99.7 58 96.5 177 97.5 235
15-49 99.8 82 96.3 333 97.2 415
50-64 (96.4) 30 (97.1) 45 96.7 75
15-64 98.9 112 96.4 378 97.1 490
Viral Load Suppression (VLS) Among Those on Treatment
Male Female Total
Age Percentage with VLS3 Number Percentage
with VLS3 Number Percentage with VLS3 Number
15-24 * 12 (78.4) 27 (74.3) 39
25-34 * 12 84.0 123 82.8 135
35-49 94.6 57 88.2 172 90.2 229
15-49 88.4 81 86.0 322 86.6 403
50-64 (99.1) 29 (86.7) 44 92.6 73
15-64 91.1 110 86.1 366 87.6 4761Relates to Global AIDS Monitoring Indicator (GAM) 1.1: People living with HIV who know their HIV status and PEPFAR Indicator DIAGNOSED_NAT: The percentage of adults and children living with HIV who know their status (have been diagnosed); 2Relates to GAM 1.2: People living with HIV on antiretroviral therapy and PEPFAR Indicator TX_CURR_NAT / SUBNAT: Percentage of adults and children receiving antiretroviral therapy; 3Relates to GAM 1.4: People living with HIV who have suppressed viral loads and PEPFAR VL_SUPPRESSION_NAT: Percentage of people living with HIV on ART with a suppressed viral load Weighted figures.*Estimates based on a very small denominator (less than 25) have been suppressed with an asterisk. ( ) Estimates based on a denominator of 25-49 are included in parentheses and should be interpreted with caution.
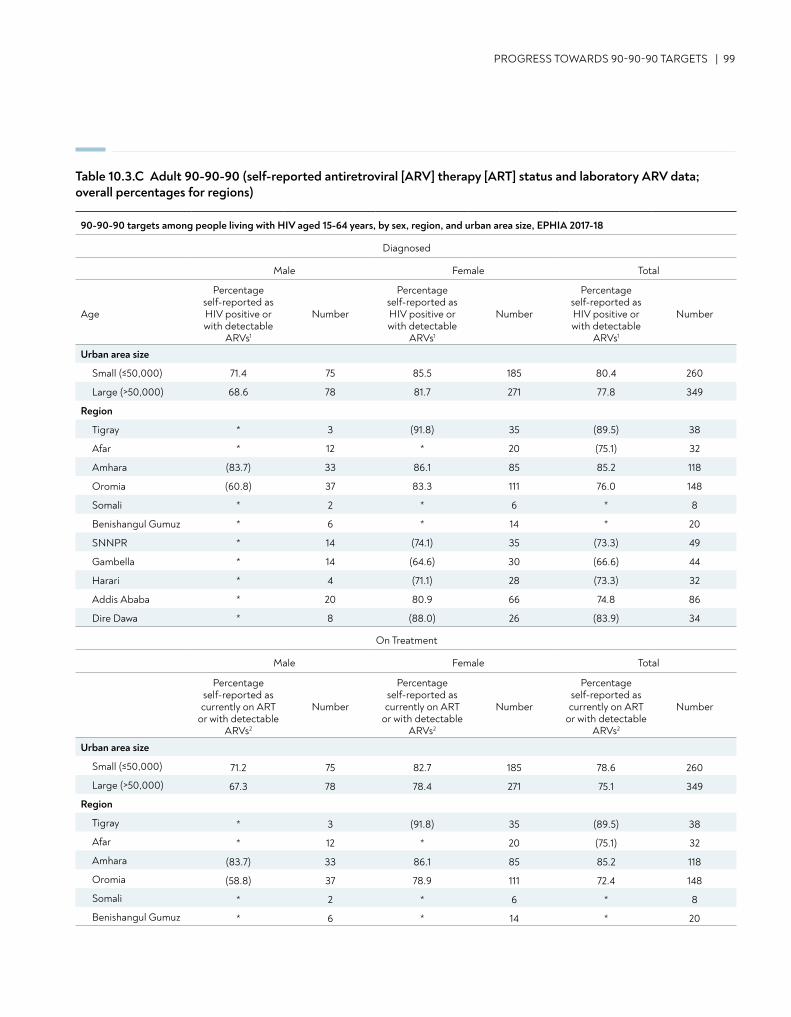
90-90-90 targets among people living with HIV aged 15-64 years, by sex, region, and urban area size, EPHIA 2017-18
Diagnosed
Male Female Total
Age
Percentage self-reported as HIV positive or with detectable
ARVs1
Number
Percentage self-reported as HIV positive or with detectable
ARVs1
Number
Percentage self-reported as HIV positive or with detectable
ARVs1
Number
Urban area size
Small (≤50,000) 71.4 75 85.5 185 80.4 260
Large (>50,000) 68.6 78 81.7 271 77.8 349
Region
Tigray * 3 (91.8) 35 (89.5) 38
Afar * 12 * 20 (75.1) 32
Amhara (83.7) 33 86.1 85 85.2 118
Oromia (60.8) 37 83.3 111 76.0 148
Somali * 2 * 6 * 8
Benishangul Gumuz * 6 * 14 * 20
SNNPR * 14 (74.1) 35 (73.3) 49
Gambella * 14 (64.6) 30 (66.6) 44
Harari * 4 (71.1) 28 (73.3) 32
Addis Ababa * 20 80.9 66 74.8 86
Dire Dawa * 8 (88.0) 26 (83.9) 34
On Treatment
Male Female Total
Percentageself-reported as currently on ART
or with detectable ARVs2
Number
Percentageself-reported as currently on ART
or with detectable ARVs2
Number
Percentageself-reported as currently on ART
or with detectable ARVs2
Number
Urban area size
Small (≤50,000) 71.2 75 82.7 185 78.6 260
Large (>50,000) 67.3 78 78.4 271 75.1 349
Region
Tigray * 3 (91.8) 35 (89.5) 38
Afar * 12 * 20 (75.1) 32
Amhara (83.7) 33 86.1 85 85.2 118
Oromia (58.8) 37 78.9 111 72.4 148
Somali * 2 * 6 * 8
Benishangul Gumuz * 6 * 14 * 20
PROGRESS TOWARDS 90-90-90 TARGETS | 99
Table 10.3.C Adult 90-90-90 (self-reported antiretroviral [ARV] therapy [ART] status and laboratory ARV data; overall percentages for regions)
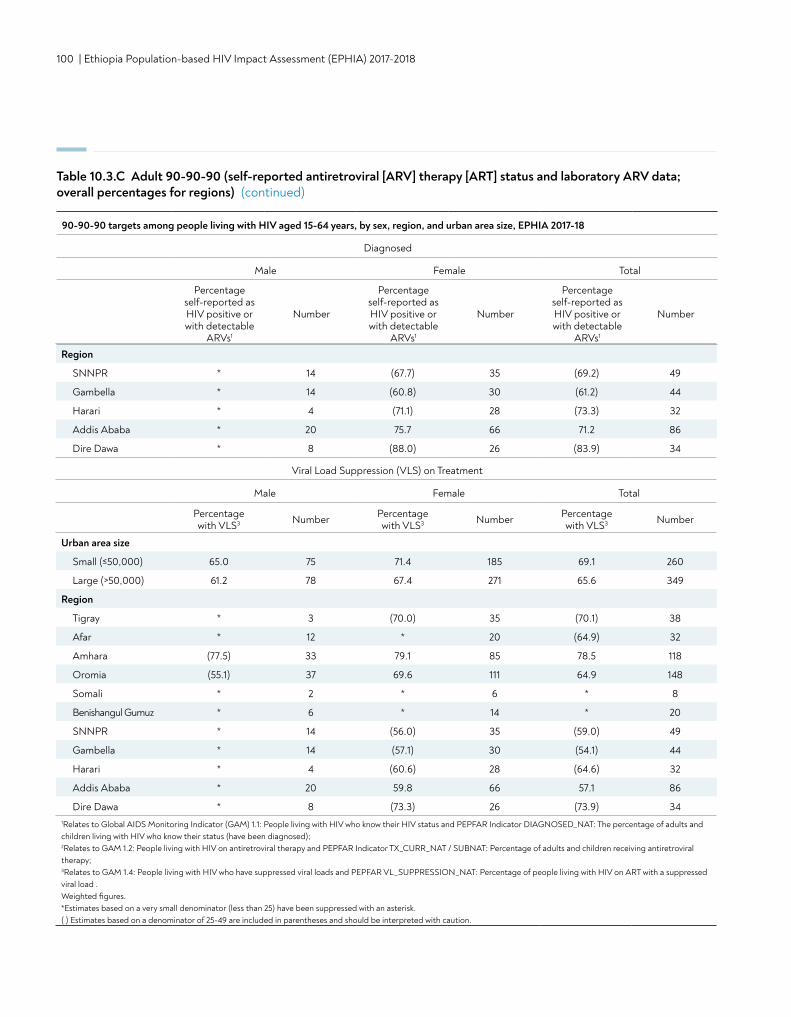
100 | Ethiopia Population-based HIV Impact Assessment (EPHIA) 2017-2018
Region
SNNPR * 14 (67.7) 35 (69.2) 49
Gambella * 14 (60.8) 30 (61.2) 44
Harari * 4 (71.1) 28 (73.3) 32
Addis Ababa * 20 75.7 66 71.2 86
Dire Dawa * 8 (88.0) 26 (83.9) 34
Viral Load Suppression (VLS) on Treatment
Male Female Total
Percentage with VLS3 Number Percentage
with VLS3 Number Percentage with VLS3 Number
Urban area size
Small (≤50,000) 65.0 75 71.4 185 69.1 260
Large (>50,000) 61.2 78 67.4 271 65.6 349
Region
Tigray * 3 (70.0) 35 (70.1) 38
Afar * 12 * 20 (64.9) 32
Amhara (77.5) 33 79.1 85 78.5 118
Oromia (55.1) 37 69.6 111 64.9 148
Somali * 2 * 6 * 8
Benishangul Gumuz * 6 * 14 * 20
SNNPR * 14 (56.0) 35 (59.0) 49
Gambella * 14 (57.1) 30 (54.1) 44
Harari * 4 (60.6) 28 (64.6) 32
Addis Ababa * 20 59.8 66 57.1 86
Dire Dawa * 8 (73.3) 26 (73.9) 341Relates to Global AIDS Monitoring Indicator (GAM) 1.1: People living with HIV who know their HIV status and PEPFAR Indicator DIAGNOSED_NAT: The percentage of adults and children living with HIV who know their status (have been diagnosed); 2Relates to GAM 1.2: People living with HIV on antiretroviral therapy and PEPFAR Indicator TX_CURR_NAT / SUBNAT: Percentage of adults and children receiving antiretroviral therapy; 3Relates to GAM 1.4: People living with HIV who have suppressed viral loads and PEPFAR VL_SUPPRESSION_NAT: Percentage of people living with HIV on ART with a suppressed viral load . Weighted figures.*Estimates based on a very small denominator (less than 25) have been suppressed with an asterisk. ( ) Estimates based on a denominator of 25-49 are included in parentheses and should be interpreted with caution.
Table 10.3.C Adult 90-90-90 (self-reported antiretroviral [ARV] therapy [ART] status and laboratory ARV data; overall percentages for regions) (continued)
90-90-90 targets among people living with HIV aged 15-64 years, by sex, region, and urban area size, EPHIA 2017-18
Diagnosed
Male Female Total
Percentage self-reported as HIV positive or with detectable
ARVs1
Number
Percentage self-reported as HIV positive or with detectable
ARVs1
Number
Percentage self-reported as HIV positive or with detectable
ARVs1
Number
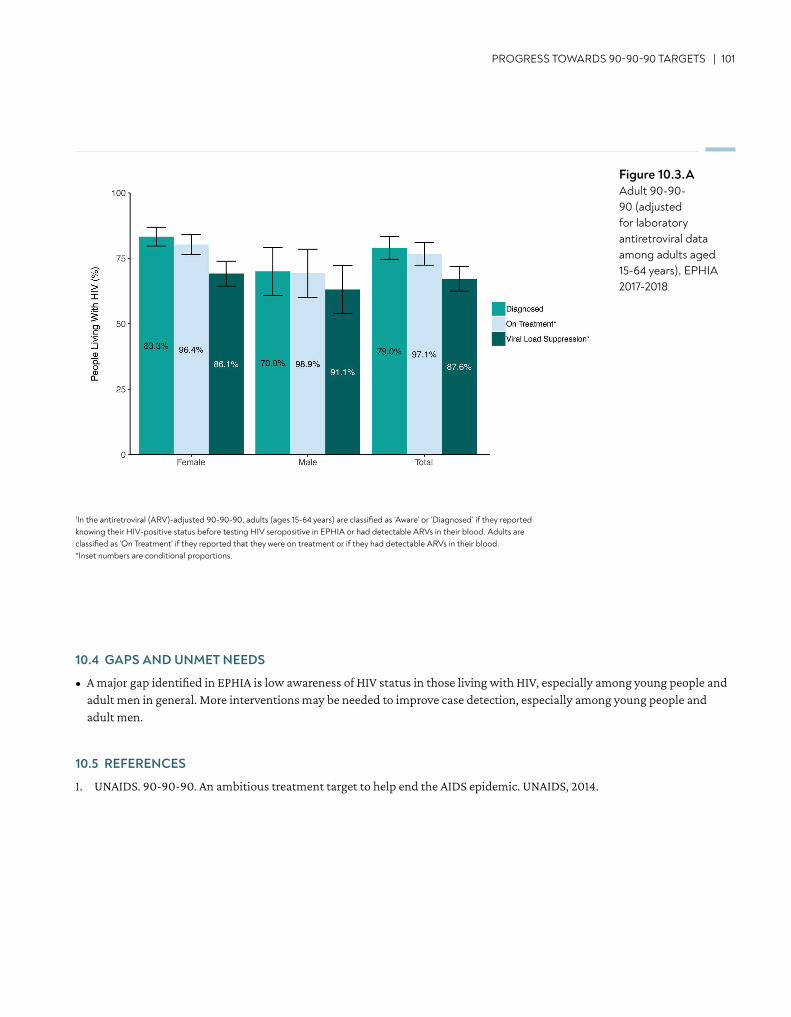
PROGRESS TOWARDS 90-90-90 TARGETS | 101
10.4 GAPS AND UNMET NEEDS
• A major gap identified in EPHIA is low awareness of HIV status in those living with HIV, especially among young people and adult men in general. More interventions may be needed to improve case detection, especially among young people and adult men.
10.5 REFERENCES
1. UNAIDS. 90-90-90. An ambitious treatment target to help end the AIDS epidemic. UNAIDS, 2014.
Figure 10.3.AAdult 90-90-90 (adjusted for laboratory antiretroviral data among adults aged 15-64 years), EPHIA 2017-2018
1In the antiretroviral (ARV)-adjusted 90-90-90, adults (ages 15-64 years) are classified as ‘Aware’ or ‘Diagnosed’ if they reported knowing their HIV-positive status before testing HIV seropositive in EPHIA or had detectable ARVs in their blood. Adults are classified as ‘On Treatment’ if they reported that they were on treatment or if they had detectable ARVs in their blood.*Inset numbers are conditional proportions.
102 | Ethiopia Population-based HIV Impact Assessment (EPHIA) 2017-2018
11. CLINICAL PERSPECTIVES ON PEOPLE LIVING WITH HIV
• Among adults (ages 15-64 years) living with HIV, 35.8% (45.6% of men and 31.1% of women) had immunosuppression with CD4 count less than 350 cells per microliter (μL). The median CD4 count among all HIV-positive adults was 432 (IQR 277-594) cells/μL. The median CD4 count among adults who tested HIV positive in EPHIA but reported that they had not been previously diagnosed was 352 (IQR 217-480) cells/μL.
• Among adults who reported that they were unaware of their HIV-positive status, 22.0% had severe immunosuppression—a CD4 count less than 200 cells/μL (16.9% of men and 26.5% of women).
KEY FINDINGS
CLINICAL PERSPECTIVES ON PEOPLE LIVING WITH HIV | 103
11.2 BACKGROUND
The quality of HIV care is based on key principles of accessibility, efficiency, and safety. As countries implement treatment for all people living with HIV, ensuring a sustainable health system that is people-centered and innovative requires diligent monitoring and responsiveness (WHO 2016). Indicators such as CD4 count at diagnosis and during lifelong ART can provide evidence of program coverage, the success in reaching vulnerable populations, and quality of care. The distribution of CD4 counts also reflects population health, and the potential impact of HIV on mortality and healthcare costs, since persons with severe immunosuppression tend to have frequent opportunistic infections, hospitalizations, and a higher likelihood of severe illnesses and death. Ethiopia has committed to HIV epidemic control under the Fast Track strategy. The higher the median CD4 count, the healthier the population and the better the HIV treatment outcome. Finally, the measurement of transmitted and acquired drug resistance allows optimization of national ART guidelines including second- and third-line therapies. EPHIA provides a unique opportunity to gauge progress in the expansion of HIV clinical services in Ethiopia, as well as identify gaps and future challenges. In this survey, CD4 enumeration was performed using POC diagnostics. This was also the first time that data on transmitted drug resistance has been collected at a population level in Ethiopia.
11.3 CD4 COUNTS AND IMMUNOSUPPRESSION
Among all HIV-positive adults, 35.8% were immunosuppressed with a CD4 count of less than 350 cells/μL. Nearly half (45.6%) of HIV-positive men were immunosuppressed compared to 31.1% of women. The median CD4 count was 432 cells/μL in HIV-positive adults (370 cells/μL in men and 462 cells/μL in women) (Table 11.3.A).
Among adults aged 15-49 years, the percentage of immunosuppressed persons was higher among men (49.2%) than among women (31.4%) (Table 11.3.A). Among HIV-positive adults who were unaware of their status (that is, they reported that they were HIV negative or never tested), the median CD4 count was 352 cells/μL—close to half (47.8%) had a CD4 count less than 350 cells/μL (46.9% of men and 48.6% of women). Among HIV-positive adults who were on ART, the median CD4 count was 457 cells/µL—and 30.9% had a CD4 count less than 350 cells/μL (45.3% of men and 25.0% of women) (Table 11.3.A, Figure 11.3.A).
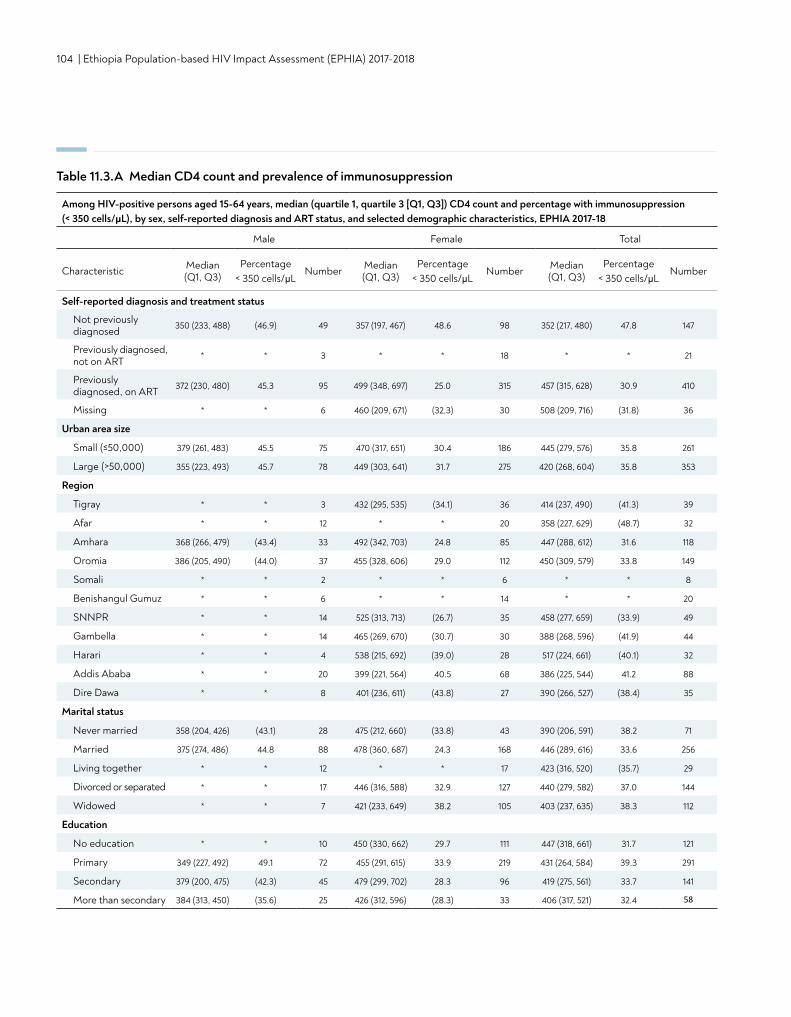
104 | Ethiopia Population-based HIV Impact Assessment (EPHIA) 2017-2018
Table 11.3.A Median CD4 count and prevalence of immunosuppression
Among HIV-positive persons aged 15-64 years, median (quartile 1, quartile 3 [Q1, Q3]) CD4 count and percentage with immunosuppression (< 350 cells/μL), by sex, self-reported diagnosis and ART status, and selected demographic characteristics, EPHIA 2017-18
Male Female Total
Characteristic Median (Q1, Q3)
Percentage < 350 cells/μL
Number Median (Q1, Q3)
Percentage < 350 cells/μL
Number Median (Q1, Q3)
Percentage < 350 cells/μL
Number
Self-reported diagnosis and treatment status
Not previouslydiagnosed 350 (233, 488) (46.9) 49 357 (197, 467) 48.6 98 352 (217, 480) 47.8 147
Previously diagnosed, not on ART * 3 * * 18 * * 21
Previously diagnosed, on ART 372 (230, 480) 45.3 95 499 (348, 697) 25.0 315 457 (315, 628) 30.9 410
Missing * * 6 460 (209, 671) (32.3) 30 508 (209, 716) (31.8) 36
Urban area size
Small (≤50,000) 379 (261, 483) 45.5 75 470 (317, 651) 30.4 186 445 (279, 576) 35.8 261
Large (>50,000) 355 (223, 493) 45.7 78 449 (303, 641) 31.7 275 420 (268, 604) 35.8 353
Region
Tigray * * 3 432 (295, 535) (34.1) 36 414 (237, 490) (41.3) 39
Afar * * 12 * * 20 358 (227, 629) (48.7) 32
Amhara 368 (266, 479) (43.4) 33 492 (342, 703) 24.8 85 447 (288, 612) 31.6 118
Oromia 386 (205, 490) (44.0) 37 455 (328, 606) 29.0 112 450 (309, 579) 33.8 149
Somali * * 2 * * 6 * * 8
Benishangul Gumuz * * 6 * * 14 * * 20
SNNPR * * 14 525 (313, 713) (26.7) 35 458 (277, 659) (33.9) 49
Gambella * * 14 465 (269, 670) (30.7) 30 388 (268, 596) (41.9) 44
Harari * * 4 538 (215, 692) (39.0) 28 517 (224, 661) (40.1) 32
Addis Ababa * * 20 399 (221, 564) 40.5 68 386 (225, 544) 41.2 88
Dire Dawa * * 8 401 (236, 611) (43.8) 27 390 (266, 527) (38.4) 35
Marital status
Never married 358 (204, 426) (43.1) 28 475 (212, 660) (33.8) 43 390 (206, 591) 38.2 71
Married 375 (274, 486) 44.8 88 478 (360, 687) 24.3 168 446 (289, 616) 33.6 256
Living together * * 12 * * 17 423 (316, 520) (35.7) 29
Divorced or separated * * 17 446 (316, 588) 32.9 127 440 (279, 582) 37.0 144
Widowed * * 7 421 (233, 649) 38.2 105 403 (237, 635) 38.3 112
Education
No education * * 10 450 (330, 662) 29.7 111 447 (318, 661) 31.7 121
Primary 349 (227, 492) 49.1 72 455 (291, 615) 33.9 219 431 (264, 584) 39.3 291
Secondary 379 (200, 475) (42.3) 45 479 (299, 702) 28.3 96 419 (275, 561) 33.7 141
More than secondary 384 (313, 450) (35.6) 25 426 (312, 596) (28.3) 33 406 (317, 521) 32.4 58
*
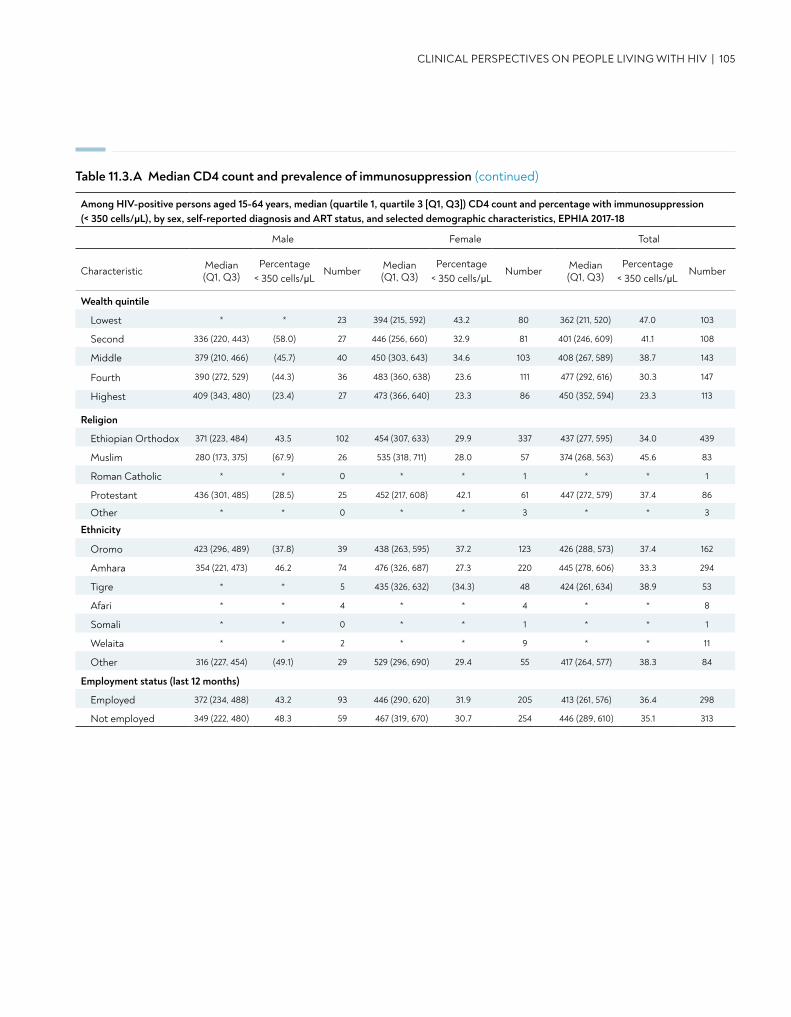
CLINICAL PERSPECTIVES ON PEOPLE LIVING WITH HIV | 105
Table 11.3.A Median CD4 count and prevalence of immunosuppression (continued)
Wealth quintile
Lowest * * 23 394 (215, 592) 43.2 80 362 (211, 520) 47.0 103
Second 336 (220, 443) (58.0) 27 446 (256, 660) 32.9 81 401 (246, 609) 41.1 108
Middle 379 (210, 466) (45.7) 40 450 (303, 643) 34.6 103 408 (267, 589) 38.7 143
Fourth 390 (272, 529) (44.3) 36 483 (360, 638) 23.6 111 477 (292, 616) 30.3 147
Highest 409 (343, 480) (23.4) 27 473 (366, 640) 23.3 86 450 (352, 594) 23.3 113
Religion
Ethiopian Orthodox 371 (223, 484) 43.5 102 454 (307, 633) 29.9 337 437 (277, 595) 34.0 439
Muslim 280 (173, 375) (67.9) 26 535 (318, 711) 28.0 57 374 (268, 563) 45.6 83
Roman Catholic * * 0 * * 1 * * 1
Protestant 436 (301, 485) (28.5) 25 452 (217, 608) 42.1 61 447 (272, 579) 37.4 86
Other * * 0 * * 3 * * 3
Ethnicity
Oromo 423 (296, 489) (37.8) 39 438 (263, 595) 37.2 123 426 (288, 573) 37.4 162
Amhara 354 (221, 473) 46.2 74 476 (326, 687) 27.3 220 445 (278, 606) 33.3 294
Tigre * * 5 435 (326, 632) (34.3) 48 424 (261, 634) 38.9 53
Afari * * 4 * * 4 * * 8
Somali * * 0 * * 1 * * 1
Welaita * * 2 * * 9 * * 11
Other 316 (227, 454) (49.1) 29 529 (296, 690) 29.4 55 417 (264, 577) 38.3 84
Employment status (last 12 months)
Employed 372 (234, 488) 43.2 93 446 (290, 620) 31.9 205 413 (261, 576) 36.4 298
Not employed 349 (222, 480) 48.3 59 467 (319, 670) 30.7 254 446 (289, 610) 35.1 313
Among HIV-positive persons aged 15-64 years, median (quartile 1, quartile 3 [Q1, Q3]) CD4 count and percentage with immunosuppression (< 350 cells/μL), by sex, self-reported diagnosis and ART status, and selected demographic characteristics, EPHIA 2017-18
Male Female Total
Characteristic Median (Q1, Q3)
Percentage < 350 cells/μL
Number Median (Q1, Q3)
Percentage < 350 cells/μL
Number Median (Q1, Q3)
Percentage < 350 cells/μL
Number
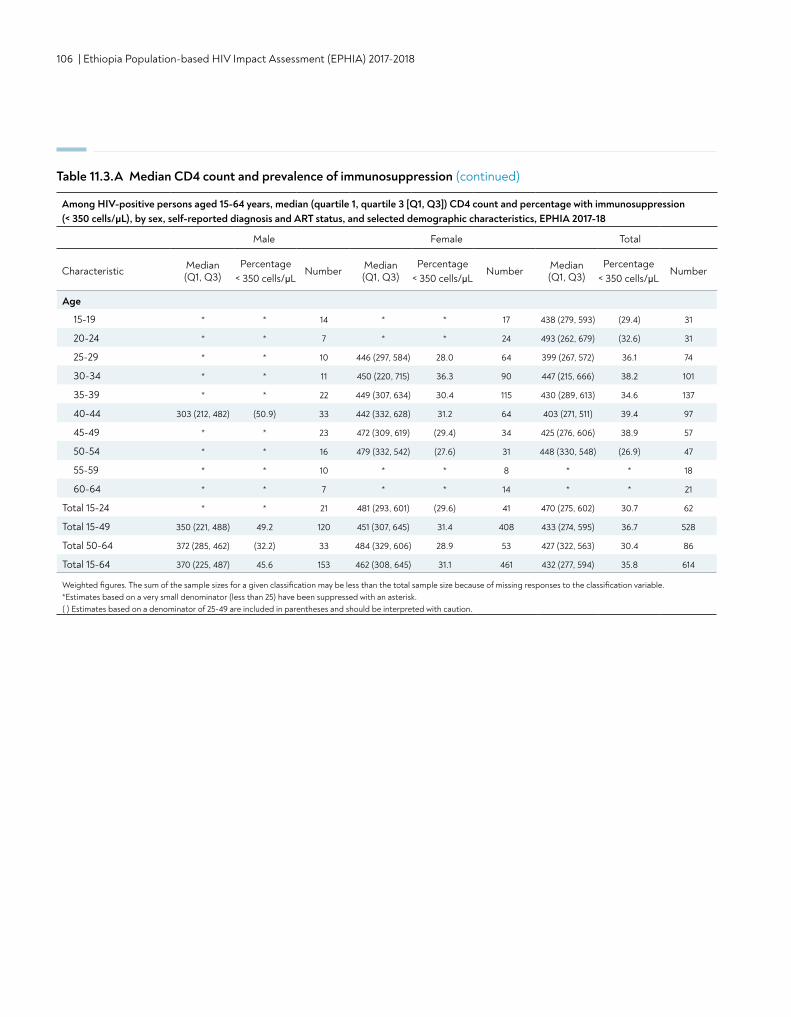
106 | Ethiopia Population-based HIV Impact Assessment (EPHIA) 2017-2018
Age
15-19 * * 14 * * 17 438 (279, 593) (29.4) 31
20-24 * * 7 * * 24 493 (262, 679) (32.6) 31
25-29 * * 10 446 (297, 584) 28.0 64 399 (267, 572) 36.1 74
30-34 * * 11 450 (220, 715) 36.3 90 447 (215, 666) 38.2 101
35-39 * * 22 449 (307, 634) 30.4 115 430 (289, 613) 34.6 137
40-44 303 (212, 482) (50.9) 33 442 (332, 628) 31.2 64 403 (271, 511) 39.4 97
45-49 * * 23 472 (309, 619) (29.4) 34 425 (276, 606) 38.9 57
50-54 * * 16 479 (332, 542) (27.6) 31 448 (330, 548) (26.9) 47
55-59 * * 10 * * 8 * * 18
60-64 * * 7 * * 14 * * 21
Total 15-24 * * 21 481 (293, 601) (29.6) 41 470 (275, 602) 30.7 62
Total 15-49 350 (221, 488) 49.2 120 451 (307, 645) 31.4 408 433 (274, 595) 36.7 528
Total 50-64 372 (285, 462) (32.2) 33 484 (329, 606) 28.9 53 427 (322, 563) 30.4 86
Total 15-64 370 (225, 487) 45.6 153 462 (308, 645) 31.1 461 432 (277, 594) 35.8 614
Weighted figures. The sum of the sample sizes for a given classification may be less than the total sample size because of missing responses to the classification variable. *Estimates based on a very small denominator (less than 25) have been suppressed with an asterisk. ( ) Estimates based on a denominator of 25-49 are included in parentheses and should be interpreted with caution.
Table 11.3.A Median CD4 count and prevalence of immunosuppression (continued)
Among HIV-positive persons aged 15-64 years, median (quartile 1, quartile 3 [Q1, Q3]) CD4 count and percentage with immunosuppression (< 350 cells/μL), by sex, self-reported diagnosis and ART status, and selected demographic characteristics, EPHIA 2017-18
Male Female Total
Characteristic Median (Q1, Q3)
Percentage < 350 cells/μL
Number Median (Q1, Q3)
Percentage < 350 cells/μL
Number Median (Q1, Q3)
Percentage < 350 cells/μL
Number
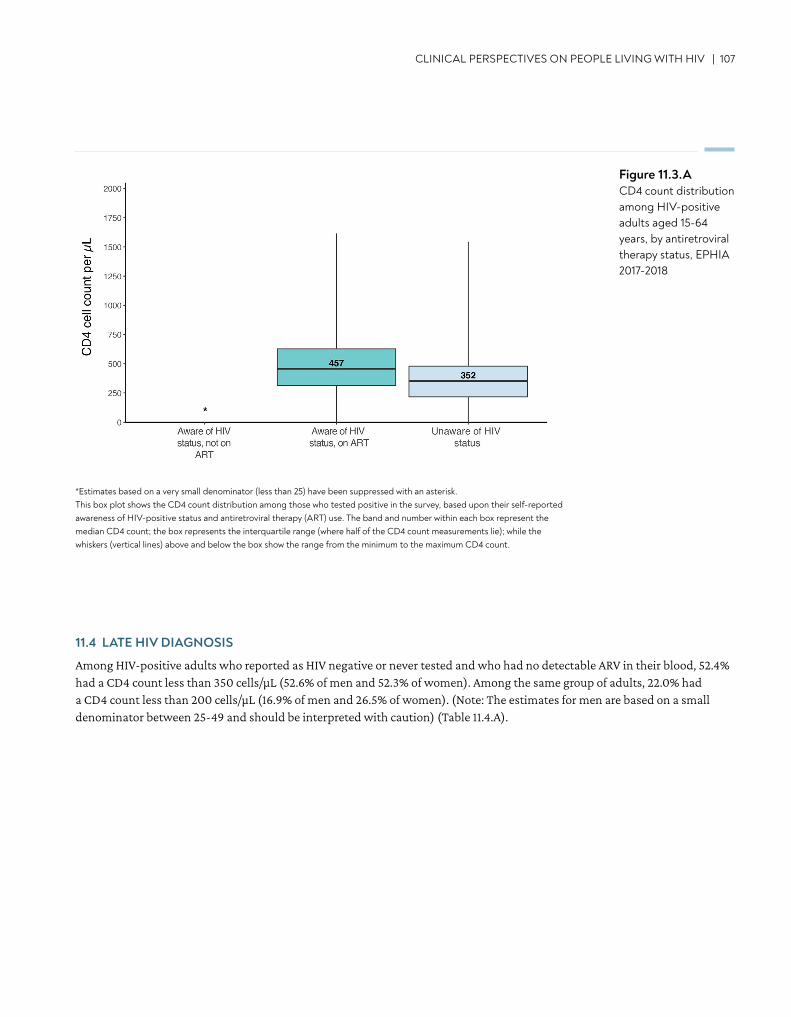
CLINICAL PERSPECTIVES ON PEOPLE LIVING WITH HIV | 107
Figure 11.3.ACD4 count distribution among HIV-positive adults aged 15-64 years, by antiretroviral therapy status, EPHIA 2017-2018
11.4 LATE HIV DIAGNOSIS
Among HIV-positive adults who reported as HIV negative or never tested and who had no detectable ARV in their blood, 52.4% had a CD4 count less than 350 cells/μL (52.6% of men and 52.3% of women). Among the same group of adults, 22.0% had a CD4 count less than 200 cells/μL (16.9% of men and 26.5% of women). (Note: The estimates for men are based on a small denominator between 25-49 and should be interpreted with caution) (Table 11.4.A).
*Estimates based on a very small denominator (less than 25) have been suppressed with an asterisk. This box plot shows the CD4 count distribution among those who tested positive in the survey, based upon their self-reported awareness of HIV-positive status and antiretroviral therapy (ART) use. The band and number within each box represent the median CD4 count; the box represents the interquartile range (where half of the CD4 count measurements lie); while the whiskers (vertical lines) above and below the box show the range from the minimum to the maximum CD4 count.
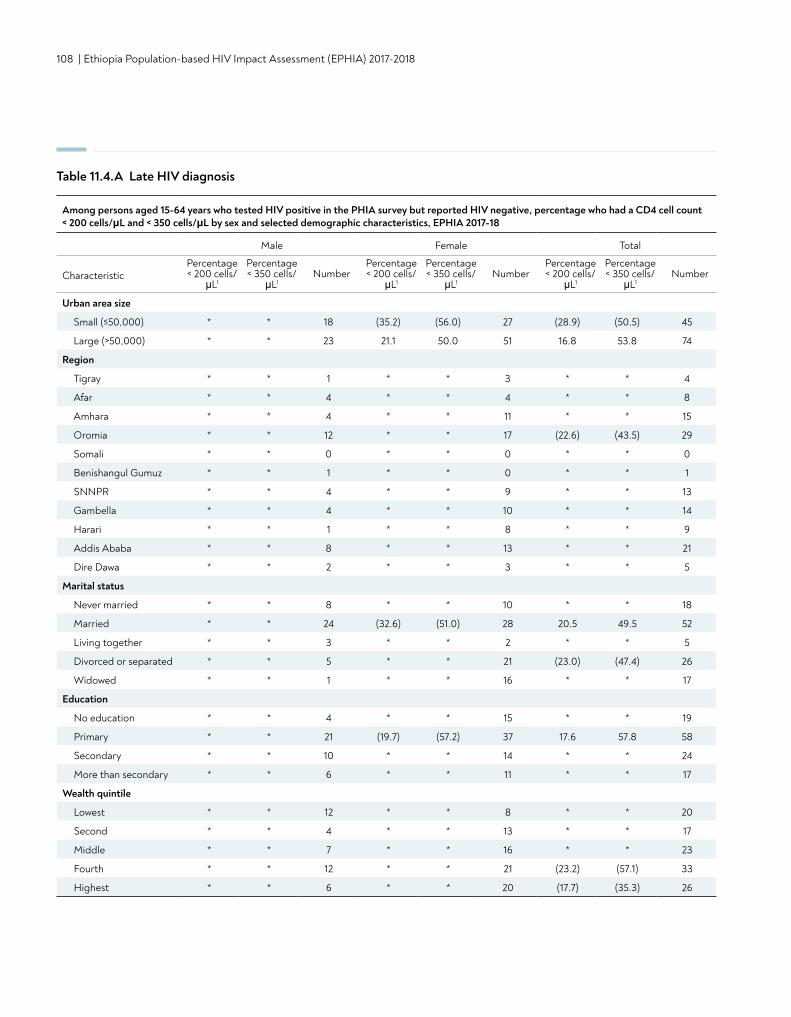
108 | Ethiopia Population-based HIV Impact Assessment (EPHIA) 2017-2018
Table 11.4.A Late HIV diagnosis
Among persons aged 15-64 years who tested HIV positive in the PHIA survey but reported HIV negative, percentage who had a CD4 cell count < 200 cells/μL and < 350 cells/μL by sex and selected demographic characteristics, EPHIA 2017-18
Male Female Total
CharacteristicPercentage < 200 cells/
μL1
Percentage < 350 cells/
μL1Number
Percentage < 200 cells/
μL1
Percentage < 350 cells/
μL1Number
Percentage < 200 cells/
μL1
Percentage < 350 cells/
μL1Number
Urban area size
Small (≤50,000) * * 18 (35.2) (56.0) 27 (28.9) (50.5) 45
Large (>50,000) * * 23 21.1 50.0 51 16.8 53.8 74
Region
Tigray * * 1 * * 3 * * 4
Afar * * 4 * * 4 * * 8
Amhara * * 4 * * 11 * * 15
Oromia * * 12 * * 17 (22.6) (43.5) 29
Somali * * 0 * * 0 * * 0
Benishangul Gumuz * * 1 * * 0 * * 1
SNNPR * * 4 * * 9 * * 13
Gambella * * 4 * * 10 * * 14
Harari * * 1 * * 8 * * 9
Addis Ababa * * 8 * * 13 * * 21
Dire Dawa * * 2 * * 3 * * 5
Marital status
Never married * * 8 * * 10 * * 18
Married * * 24 (32.6) (51.0) 28 20.5 49.5 52
Living together * * 3 * * 2 * * 5
Divorced or separated * * 5 * * 21 (23.0) (47.4) 26
Widowed * * 1 * * 16 * * 17
Education
No education * * 4 * * 15 * * 19
Primary * * 21 (19.7) (57.2) 37 17.6 57.8 58
Secondary * * 10 * * 14 * * 24
More than secondary * * 6 * * 11 * * 17
Wealth quintile
Lowest * * 12 * * 8 * * 20
Second * * 4 * * 13 * * 17
Middle * * 7 * * 16 * * 23
Fourth * * 12 * * 21 (23.2) (57.1) 33
Highest * * 6 * * 20 (17.7) (35.3) 26
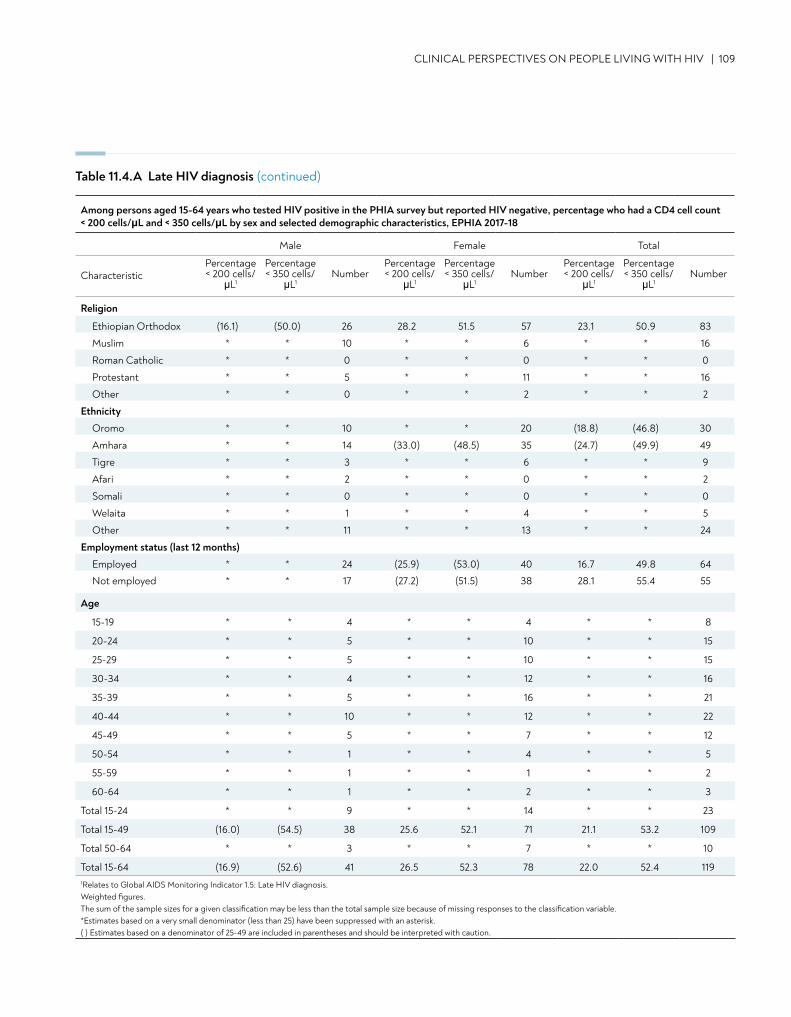
CLINICAL PERSPECTIVES ON PEOPLE LIVING WITH HIV | 109
Religion
Ethiopian Orthodox (16.1) (50.0) 26 28.2 51.5 57 23.1 50.9 83
Muslim * * 10 * * 6 * * 16
Roman Catholic * * 0 * * 0 * * 0
Protestant * * 5 * * 11 * * 16
Other * * 0 * * 2 * * 2
Ethnicity
Oromo * * 10 * * 20 (18.8) (46.8) 30
Amhara * * 14 (33.0) (48.5) 35 (24.7) (49.9) 49
Tigre * * 3 * * 6 * * 9
Afari * * 2 * * 0 * * 2
Somali * * 0 * * 0 * * 0
Welaita * * 1 * * 4 * * 5
Other * * 11 * * 13 * * 24
Employment status (last 12 months)
Employed * * 24 (25.9) (53.0) 40 16.7 49.8 64
Not employed * * 17 (27.2) (51.5) 38 28.1 55.4 55
Age
15-19 * * 4 * * 4 * * 8
20-24 * * 5 * * 10 * * 15
25-29 * * 5 * * 10 * * 15
30-34 * * 4 * * 12 * * 16
35-39 * * 5 * * 16 * * 21
40-44 * * 10 * * 12 * * 22
45-49 * * 5 * * 7 * * 12
50-54 * * 1 * * 4 * * 5
55-59 * * 1 * * 1 * * 2
60-64 * * 1 * * 2 * * 3
Total 15-24 * * 9 * * 14 * * 23
Total 15-49 (16.0) (54.5) 38 25.6 52.1 71 21.1 53.2 109
Total 50-64 * * 3 * * 7 * * 10
Total 15-64 (16.9) (52.6) 41 26.5 52.3 78 22.0 52.4 1191Relates to Global AIDS Monitoring Indicator 1.5: Late HIV diagnosis. Weighted figures. The sum of the sample sizes for a given classification may be less than the total sample size because of missing responses to the classification variable.*Estimates based on a very small denominator (less than 25) have been suppressed with an asterisk. ( ) Estimates based on a denominator of 25-49 are included in parentheses and should be interpreted with caution.
Table 11.4.A Late HIV diagnosis (continued)
Among persons aged 15-64 years who tested HIV positive in the PHIA survey but reported HIV negative, percentage who had a CD4 cell count < 200 cells/μL and < 350 cells/μL by sex and selected demographic characteristics, EPHIA 2017-18
Male Female Total
CharacteristicPercentage < 200 cells/
μL1
Percentage < 350 cells/
μL1Number
Percentage < 200 cells/
μL1
Percentage < 350 cells/
μL1Number
Percentage < 200 cells/
μL1
Percentage < 350 cells/
μL1Number
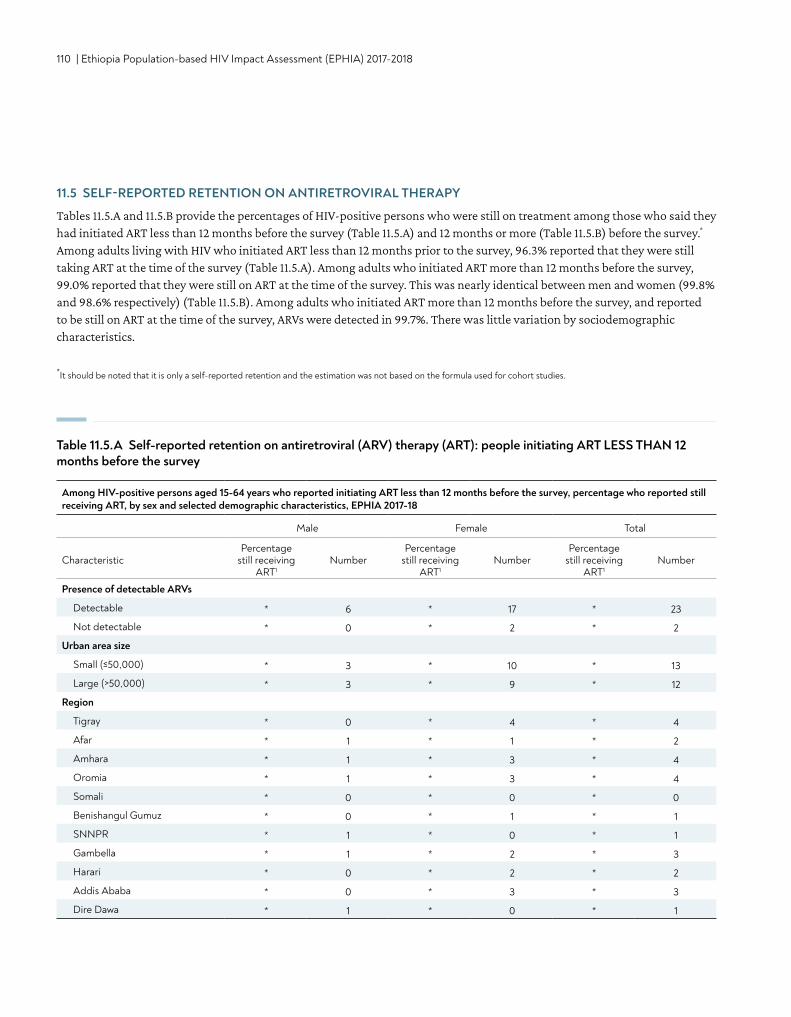
110 | Ethiopia Population-based HIV Impact Assessment (EPHIA) 2017-2018
11.5 SELF-REPORTED RETENTION ON ANTIRETROVIRAL THERAPY
Tables 11.5.A and 11.5.B provide the percentages of HIV-positive persons who were still on treatment among those who said they had initiated ART less than 12 months before the survey (Table 11.5.A) and 12 months or more (Table 11.5.B) before the survey.* Among adults living with HIV who initiated ART less than 12 months prior to the survey, 96.3% reported that they were still taking ART at the time of the survey (Table 11.5.A). Among adults who initiated ART more than 12 months before the survey, 99.0% reported that they were still on ART at the time of the survey. This was nearly identical between men and women (99.8% and 98.6% respectively) (Table 11.5.B). Among adults who initiated ART more than 12 months before the survey, and reported to be still on ART at the time of the survey, ARVs were detected in 99.7%. There was little variation by sociodemographic characteristics.
Among HIV-positive persons aged 15-64 years who reported initiating ART less than 12 months before the survey, percentage who reported still receiving ART, by sex and selected demographic characteristics, EPHIA 2017-18
Male Female Total
CharacteristicPercentage
still receiving ART1
NumberPercentage
still receiving ART1
NumberPercentage
still receiving ART1
Number
Presence of detectable ARVs
Detectable * 6 * 17 * 23
Not detectable * 0 * 2 * 2
Urban area size
Small (≤50,000) * 3 * 10 * 13
Large (>50,000) * 3 * 9 * 12
Region
Tigray * 0 * 4 * 4
Afar * 1 * 1 * 2
Amhara * 1 * 3 * 4
Oromia * 1 * 3 * 4
Somali * 0 * 0 * 0
Benishangul Gumuz * 0 * 1 * 1
SNNPR * 1 * 0 * 1
Gambella * 1 * 2 * 3
Harari * 0 * 2 * 2
Addis Ababa * 0 * 3 * 3
Dire Dawa * 1 * 0 * 1
Table 11.5.A Self-reported retention on antiretroviral (ARV) therapy (ART): people initiating ART LESS THAN 12 months before the survey
*It should be noted that it is only a self-reported retention and the estimation was not based on the formula used for cohort studies.
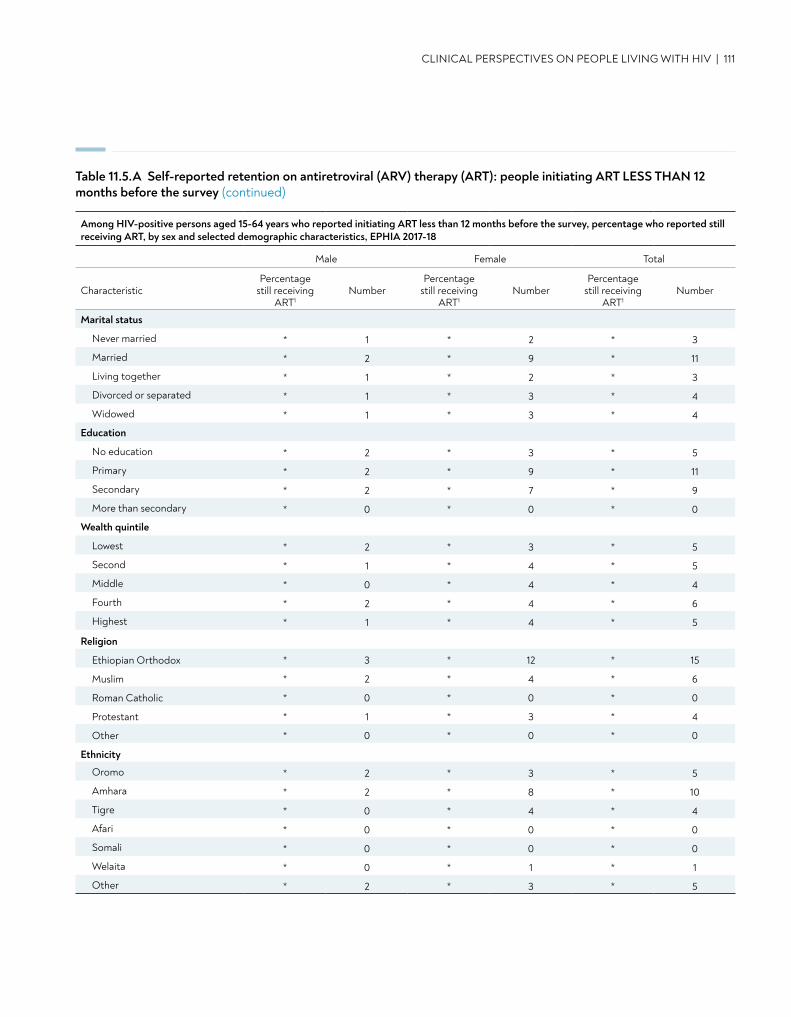
Table 11.5.A Self-reported retention on antiretroviral (ARV) therapy (ART): people initiating ART LESS THAN 12 months before the survey (continued)
CLINICAL PERSPECTIVES ON PEOPLE LIVING WITH HIV | 111
Marital status
Never married * 1 * 2 * 3
Married * 2 * 9 * 11
Living together * 1 * 2 * 3
Divorced or separated * 1 * 3 * 4
Widowed * 1 * 3 * 4
Education
No education * 2 * 3 * 5
Primary * 2 * 9 * 11
Secondary * 2 * 7 * 9
More than secondary * 0 * 0 * 0
Wealth quintile
Lowest * 2 * 3 * 5
Second * 1 * 4 * 5
Middle * 0 * 4 * 4
Fourth * 2 * 4 * 6
Highest * 1 * 4 * 5
Religion
Ethiopian Orthodox * 3 * 12 * 15
Muslim * 2 * 4 * 6
Roman Catholic * 0 * 0 * 0
Protestant * 1 * 3 * 4
Other * 0 * 0 * 0
Ethnicity
Oromo * 2 * 3 * 5
Amhara * 2 * 8 * 10
Tigre * 0 * 4 * 4
Afari * 0 * 0 * 0
Somali * 0 * 0 * 0
Welaita * 0 * 1 * 1
Other * 2 * 3 * 5
Among HIV-positive persons aged 15-64 years who reported initiating ART less than 12 months before the survey, percentage who reported still receiving ART, by sex and selected demographic characteristics, EPHIA 2017-18
Male Female Total
CharacteristicPercentage
still receiving ART1
NumberPercentage
still receiving ART1
NumberPercentage
still receiving ART1
Number
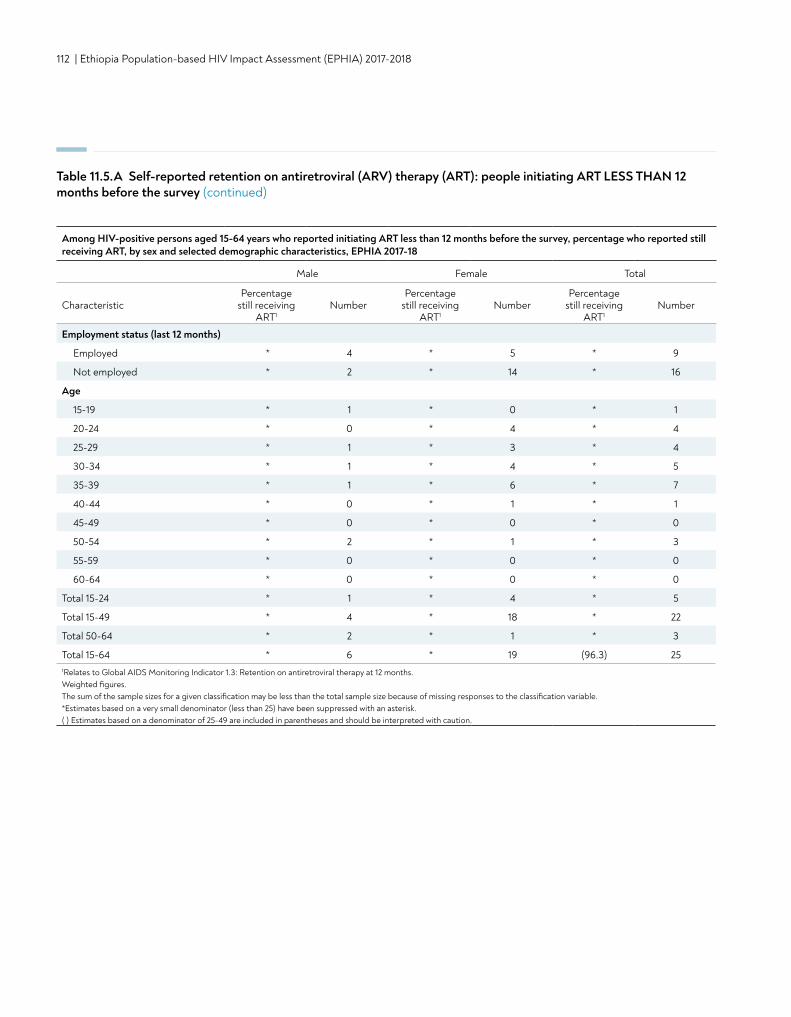
112 | Ethiopia Population-based HIV Impact Assessment (EPHIA) 2017-2018
Table 11.5.A Self-reported retention on antiretroviral (ARV) therapy (ART): people initiating ART LESS THAN 12 months before the survey (continued)
Employment status (last 12 months)
Employed * 4 * 5 * 9
Not employed * 2 * 14 * 16
Age
15-19 * 1 * 0 * 1
20-24 * 0 * 4 * 4
25-29 * 1 * 3 * 4
30-34 * 1 * 4 * 5
35-39 * 1 * 6 * 7
40-44 * 0 * 1 * 1
45-49 * 0 * 0 * 0
50-54 * 2 * 1 * 3
55-59 * 0 * 0 * 0
60-64 * 0 * 0 * 0
Total 15-24 * 1 * 4 * 5
Total 15-49 * 4 * 18 * 22
Total 50-64 * 2 * 1 * 3
Total 15-64 * 6 * 19 (96.3) 251Relates to Global AIDS Monitoring Indicator 1.3: Retention on antiretroviral therapy at 12 months. Weighted figures. The sum of the sample sizes for a given classification may be less than the total sample size because of missing responses to the classification variable.*Estimates based on a very small denominator (less than 25) have been suppressed with an asterisk. ( ) Estimates based on a denominator of 25-49 are included in parentheses and should be interpreted with caution.
Among HIV-positive persons aged 15-64 years who reported initiating ART less than 12 months before the survey, percentage who reported still receiving ART, by sex and selected demographic characteristics, EPHIA 2017-18
Male Female Total
CharacteristicPercentage
still receiving ART1
NumberPercentage
still receiving ART1
NumberPercentage
still receiving ART1
Number
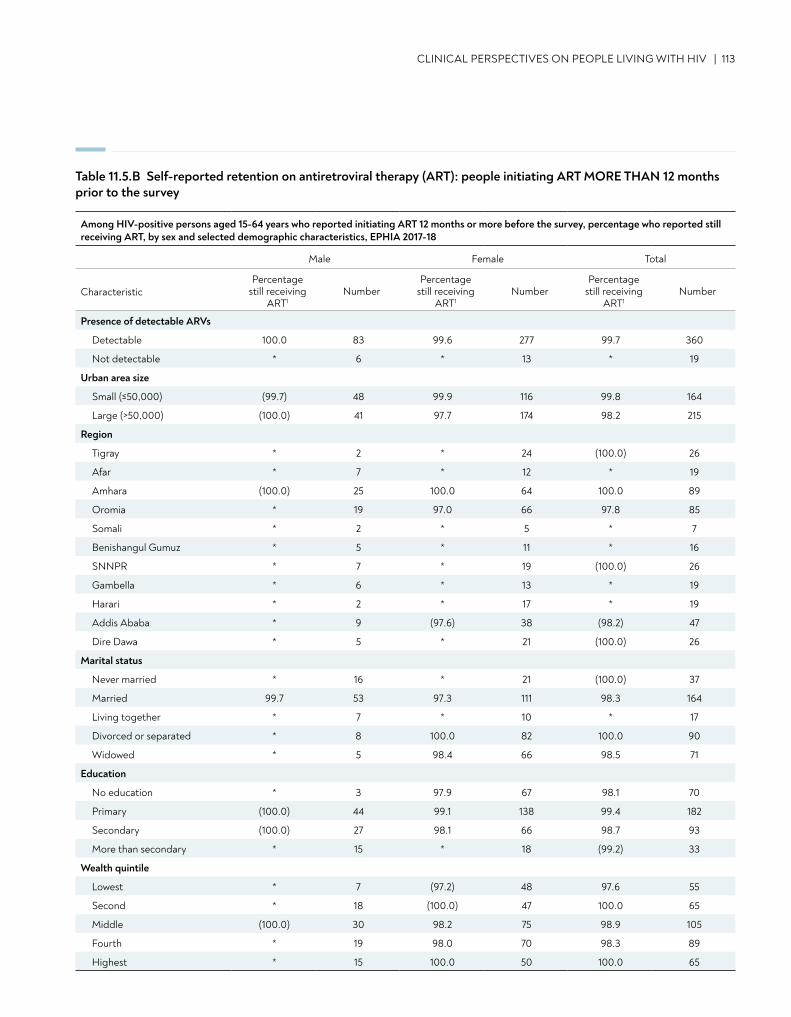
CLINICAL PERSPECTIVES ON PEOPLE LIVING WITH HIV | 113
Table 11.5.B Self-reported retention on antiretroviral therapy (ART): people initiating ART MORE THAN 12 months prior to the survey
Among HIV-positive persons aged 15-64 years who reported initiating ART 12 months or more before the survey, percentage who reported still receiving ART, by sex and selected demographic characteristics, EPHIA 2017-18
Male Female Total
CharacteristicPercentage
still receiving ART1
NumberPercentage
still receiving ART1
NumberPercentage
still receiving ART1
Number
Presence of detectable ARVs
Detectable 100.0 83 99.6 277 99.7 360
Not detectable * 6 * 13 * 19
Urban area size
Small (≤50,000) (99.7) 48 99.9 116 99.8 164
Large (>50,000) (100.0) 41 97.7 174 98.2 215
Region
Tigray * 2 * 24 (100.0) 26
Afar * 7 * 12 * 19
Amhara (100.0) 25 100.0 64 100.0 89
Oromia * 19 97.0 66 97.8 85
Somali * 2 * 5 * 7
Benishangul Gumuz * 5 * 11 * 16
SNNPR * 7 * 19 (100.0) 26
Gambella * 6 * 13 * 19
Harari * 2 * 17 * 19
Addis Ababa * 9 (97.6) 38 (98.2) 47
Dire Dawa * 5 * 21 (100.0) 26
Marital status
Never married * 16 * 21 (100.0) 37
Married 99.7 53 97.3 111 98.3 164
Living together * 7 * 10 * 17
Divorced or separated * 8 100.0 82 100.0 90
Widowed * 5 98.4 66 98.5 71
Education
No education * 3 97.9 67 98.1 70
Primary (100.0) 44 99.1 138 99.4 182
Secondary (100.0) 27 98.1 66 98.7 93
More than secondary * 15 * 18 (99.2) 33
Wealth quintile
Lowest * 7 (97.2) 48 97.6 55
Second * 18 (100.0) 47 100.0 65
Middle (100.0) 30 98.2 75 98.9 105
Fourth * 19 98.0 70 98.3 89
Highest * 15 100.0 50 100.0 65
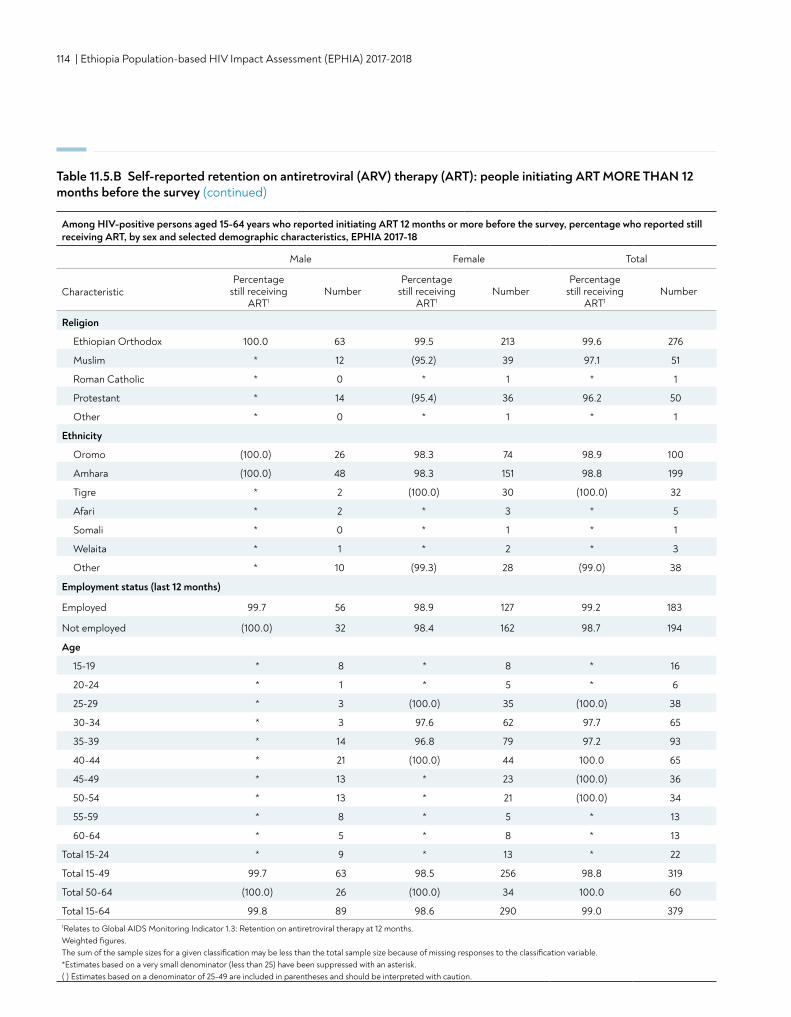
114 | Ethiopia Population-based HIV Impact Assessment (EPHIA) 2017-2018
Religion
Ethiopian Orthodox 100.0 63 99.5 213 99.6 276
Muslim * 12 (95.2) 39 97.1 51
Roman Catholic * 0 * 1 * 1
Protestant * 14 (95.4) 36 96.2 50
Other * 0 * 1 * 1
Ethnicity
Oromo (100.0) 26 98.3 74 98.9 100
Amhara (100.0) 48 98.3 151 98.8 199
Tigre * 2 (100.0) 30 (100.0) 32
Afari * 2 * 3 * 5
Somali * 0 * 1 * 1
Welaita * 1 * 2 * 3
Other * 10 (99.3) 28 (99.0) 38
Table 11.5.B Self-reported retention on antiretroviral (ARV) therapy (ART): people initiating ART MORE THAN 12 months before the survey (continued)
Age
15-19 * 8 * 8 * 16
20-24 * 1 * 5 * 6
25-29 * 3 (100.0) 35 (100.0) 38
30-34 * 3 97.6 62 97.7 65
35-39 * 14 96.8 79 97.2 93
40-44 * 21 (100.0) 44 100.0 65
45-49 * 13 * 23 (100.0) 36
50-54 * 13 * 21 (100.0) 34
55-59 * 8 * 5 * 13
60-64 * 5 * 8 * 13
Total 15-24 * 9 * 13 * 22
Total 15-49 99.7 63 98.5 256 98.8 319
Total 50-64 (100.0) 26 (100.0) 34 100.0 60
Total 15-64 99.8 89 98.6 290 99.0 3791Relates to Global AIDS Monitoring Indicator 1.3: Retention on antiretroviral therapy at 12 months. Weighted figures. The sum of the sample sizes for a given classification may be less than the total sample size because of missing responses to the classification variable.*Estimates based on a very small denominator (less than 25) have been suppressed with an asterisk. ( ) Estimates based on a denominator of 25-49 are included in parentheses and should be interpreted with caution.
Among HIV-positive persons aged 15-64 years who reported initiating ART 12 months or more before the survey, percentage who reported still receiving ART, by sex and selected demographic characteristics, EPHIA 2017-18
Male Female Total
CharacteristicPercentage
still receiving ART1
NumberPercentage
still receiving ART1
NumberPercentage
still receiving ART1
Number
Employment status (last 12 months)
Employed 99.7 56 98.9 127 99.2 183
Not employed (100.0) 32 98.4 162 98.7 194
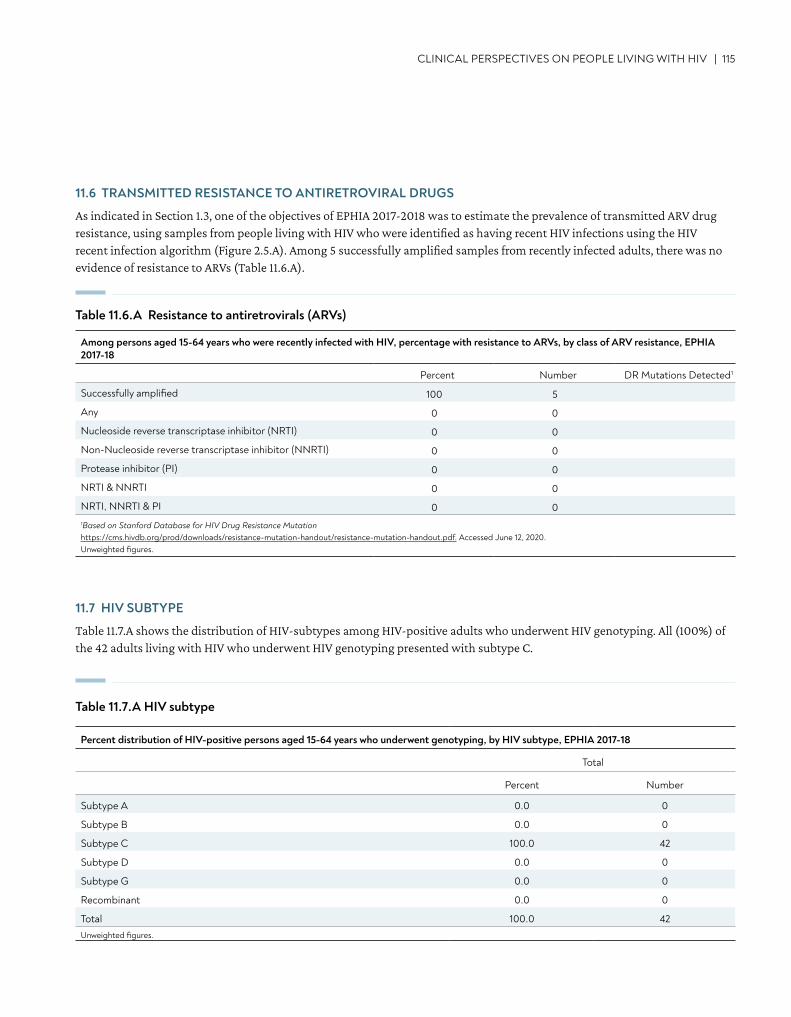
CLINICAL PERSPECTIVES ON PEOPLE LIVING WITH HIV | 115
Percent distribution of HIV-positive persons aged 15-64 years who underwent genotyping, by HIV subtype, EPHIA 2017-18
Total
Percent Number
Subtype A 0.0 0
Subtype B 0.0 0
Subtype C 100.0 42
Subtype D 0.0 0
Subtype G 0.0 0
Recombinant 0.0 0
Total 100.0 42Unweighted figures.
11.6 TRANSMITTED RESISTANCE TO ANTIRETROVIRAL DRUGS
As indicated in Section 1.3, one of the objectives of EPHIA 2017-2018 was to estimate the prevalence of transmitted ARV drug resistance, using samples from people living with HIV who were identified as having recent HIV infections using the HIV recent infection algorithm (Figure 2.5.A). Among 5 successfully amplified samples from recently infected adults, there was no evidence of resistance to ARVs (Table 11.6.A).
Among persons aged 15-64 years who were recently infected with HIV, percentage with resistance to ARVs, by class of ARV resistance, EPHIA 2017-18
Percent Number DR Mutations Detected1
Successfully amplified 100 5
Any 0 0
Nucleoside reverse transcriptase inhibitor (NRTI) 0 0
Non-Nucleoside reverse transcriptase inhibitor (NNRTI) 0 0
Protease inhibitor (PI) 0 0
NRTI & NNRTI 0 0
NRTI, NNRTI & PI 0 01Based on Stanford Database for HIV Drug Resistance Mutation https://cms.hivdb.org/prod/downloads/resistance-mutation-handout/resistance-mutation-handout.pdf. Accessed June 12, 2020. Unweighted figures.
Table 11.6.A Resistance to antiretrovirals (ARVs)
11.7 HIV SUBTYPE
Table 11.7.A shows the distribution of HIV-subtypes among HIV-positive adults who underwent HIV genotyping. All (100%) of the 42 adults living with HIV who underwent HIV genotyping presented with subtype C.
Table 11.7.A HIV subtype
116 | Ethiopia Population-based HIV Impact Assessment (EPHIA) 2017-2018
11.8 GAPS AND UNMET NEEDS
• More than half of HIV-positive people who do not know their status were immunosuppressed, i.e., less than 350 cells/μL. • More HIV-positive men were immunosuppressed, defined as having a CD4 count below 350 cells/μL, compared to women. • Over a quarter of HIV-positive women who reported an HIV-negative status or never tested were severely
immunosuppressed, with CD4 count less than 200 cells/μL. • There is a need for early identification and ART initiation of people living with HIV who are unaware of their HIV-positive
status—long before they experience immunosuppression.
11.9 REFERENCES
1. World Health Organization. Consolidated guidelines on the use of antiretroviral drugs for treating and preventing HIV infection. World Health Organization. Geneva; 2016.
CONTENT | 117
• In urban Ethiopia, 95.3% of the women of childbearing age (those aged 15-49 years) who reported having delivered in the three years preceding the survey attended at least one antenatal care (ANC) visit for their most recent birth.
• Among women who gave birth during the 12 months preceding the survey, 91.6% knew their HIV status.
• Among HIV-positive women who reported giving birth during the 12 months preceding the survey, 99.3% attended at least one ANC visit.
KEY FINDINGS
12. PREVENTION OF MOTHER-TO-CHILD TRANSMISSION
118 | Ethiopia Population-based HIV Impact Assessment (EPHIA) 2017-2018
12.2 BACKGROUND
Pregnant women living with HIV are at high risk of transmitting HIV to their infants during pregnancy, during birth, or through breastfeeding. Over 90% of new infections among infants and young children occur through mother-to-child transmission (MTCT). Without any interventions, between 20% and 45% of infants may become infected, with an estimated risk of 5-10% during pregnancy, 10-20% during labor and delivery, and 5-20% through breastfeeding.1 In 2010, global targets were set to decrease new HIV infections in children and reduce mortality among mothers living with HIV, including a 90% reduction in child HIV infections, a 50% reduction in AIDS-related maternal deaths, and virtual elimination of MTCT.2
To prevent MTCT, WHO recommends a comprehensive four-pronged approach including: (1) primary prevention of HIV infection among women of childbearing age; (2) preventing unintended pregnancies among women living with HIV; (3) preventing HIV transmission from women living with HIV to their infants; and (4) providing appropriate treatment, care and support to mothers living with HIV and their children and families.2
This chapter describes ANC attendance, breastfeeding practices, awareness of a woman’s HIV status prior to or during pregnancy, and infant HIV testing to confirm HIV infection through self-report by the mother and through biomarker testing during the survey.
12.3 ANTENATAL CARE ATTENDANCE
Among women of childbearing age (henceforth referred to as women or mothers in this chapter) who reported giving birth during the three years preceding the survey, the percentage who attended at least one ANC visit for their most recent birth was 95.3%, with very little regional variation, except for Somali region with 70.8% (Table 12.3.A). There was little variation observed across age groups, marital status, and education level.
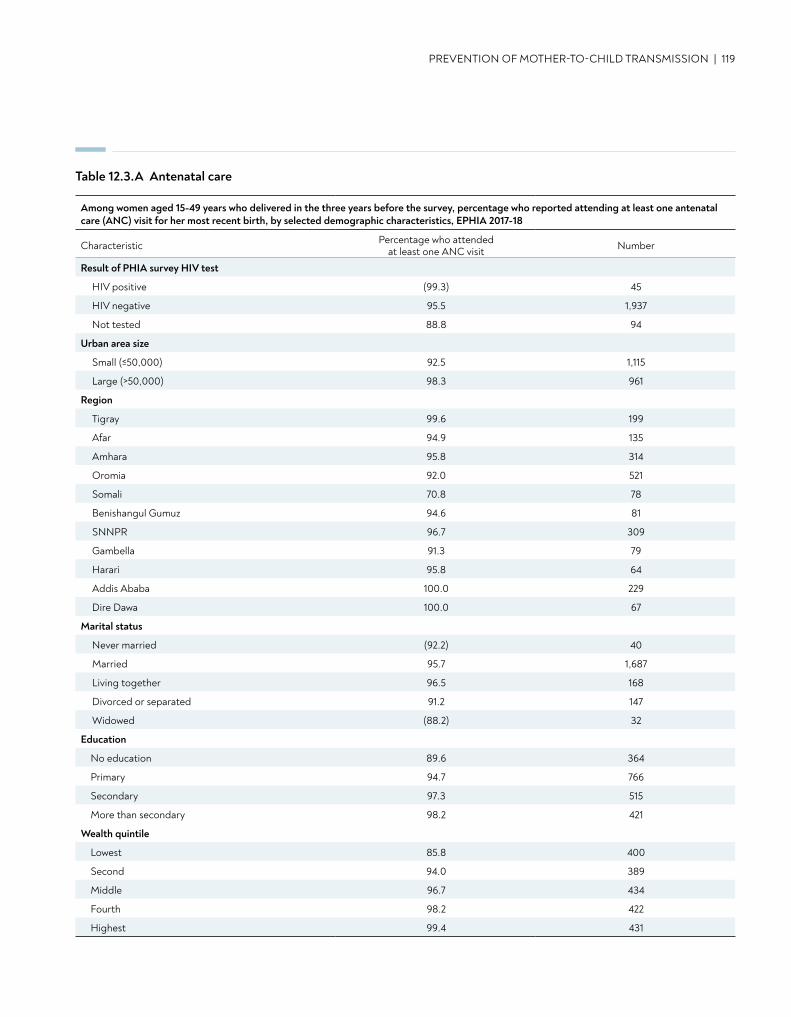
Table 12.3.A Antenatal care
PREVENTION OF MOTHER-TO-CHILD TRANSMISSION | 119
Among women aged 15-49 years who delivered in the three years before the survey, percentage who reported attending at least one antenatal care (ANC) visit for her most recent birth, by selected demographic characteristics, EPHIA 2017-18
Characteristic Percentage who attended at least one ANC visit Number
Result of PHIA survey HIV test
HIV positive (99.3) 45
HIV negative 95.5 1,937
Not tested 88.8 94
Urban area size
Small (≤50,000) 92.5 1,115
Large (>50,000) 98.3 961
Region
Tigray 99.6 199
Afar 94.9 135
Amhara 95.8 314
Oromia 92.0 521
Somali 70.8 78
Benishangul Gumuz 94.6 81
SNNPR 96.7 309
Gambella 91.3 79
Harari 95.8 64
Addis Ababa 100.0 229
Dire Dawa 100.0 67
Marital status
Never married (92.2) 40
Married 95.7 1,687
Living together 96.5 168
Divorced or separated 91.2 147
Widowed (88.2) 32
Education
No education 89.6 364
Primary 94.7 766
Secondary 97.3 515
More than secondary 98.2 421
Wealth quintile
Lowest 85.8 400
Second 94.0 389
Middle 96.7 434
Fourth 98.2 422
Highest 99.4 431
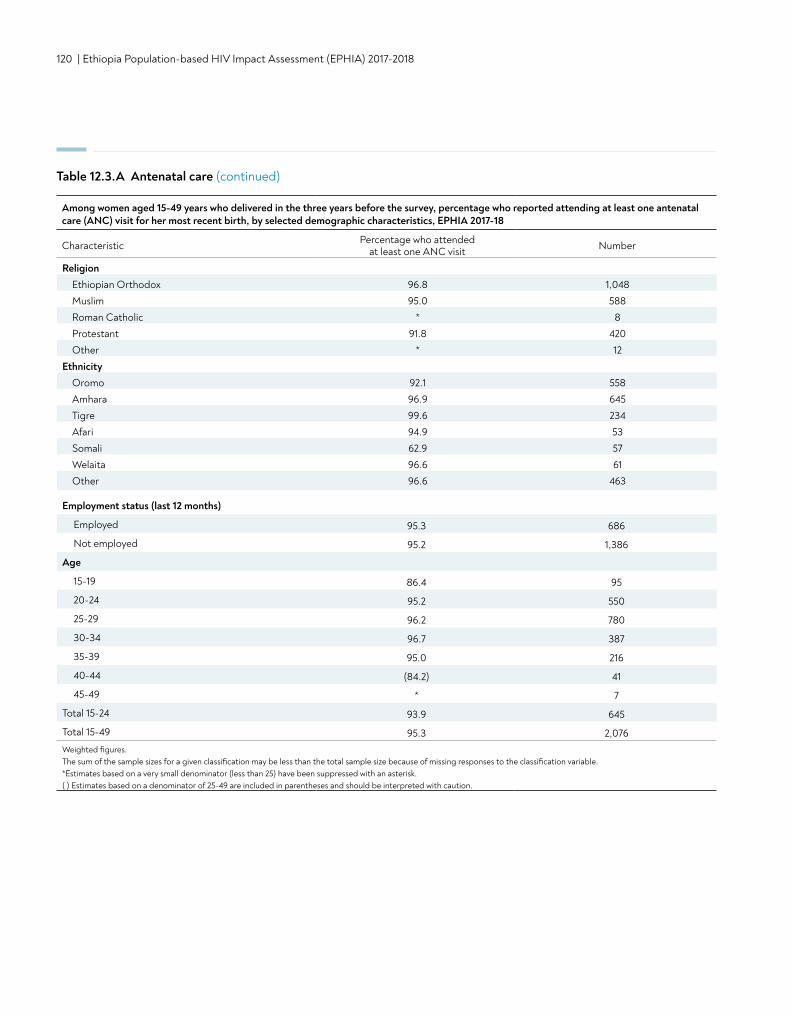
120 | Ethiopia Population-based HIV Impact Assessment (EPHIA) 2017-2018
Table 12.3.A Antenatal care (continued)
Among women aged 15-49 years who delivered in the three years before the survey, percentage who reported attending at least one antenatal care (ANC) visit for her most recent birth, by selected demographic characteristics, EPHIA 2017-18
Characteristic Percentage who attended at least one ANC visit Number
ReligionEthiopian Orthodox 96.8 1,048Muslim 95.0 588Roman Catholic * 8Protestant 91.8 420Other * 12
EthnicityOromo 92.1 558Amhara 96.9 645Tigre 99.6 234Afari 94.9 53Somali 62.9 57Welaita 96.6 61Other 96.6 463
Employment status (last 12 months)
Employed 95.3 686
Not employed 95.2 1,386
Age
15-19 86.4 95
20-24 95.2 550
25-29 96.2 780
30-34 96.7 387
35-39 95.0 216
40-44 (84.2) 41
45-49 * 7
Total 15-24 93.9 645
Total 15-49 95.3 2,076Weighted figures. The sum of the sample sizes for a given classification may be less than the total sample size because of missing responses to the classification variable.*Estimates based on a very small denominator (less than 25) have been suppressed with an asterisk. ( ) Estimates based on a denominator of 25-49 are included in parentheses and should be interpreted with caution.
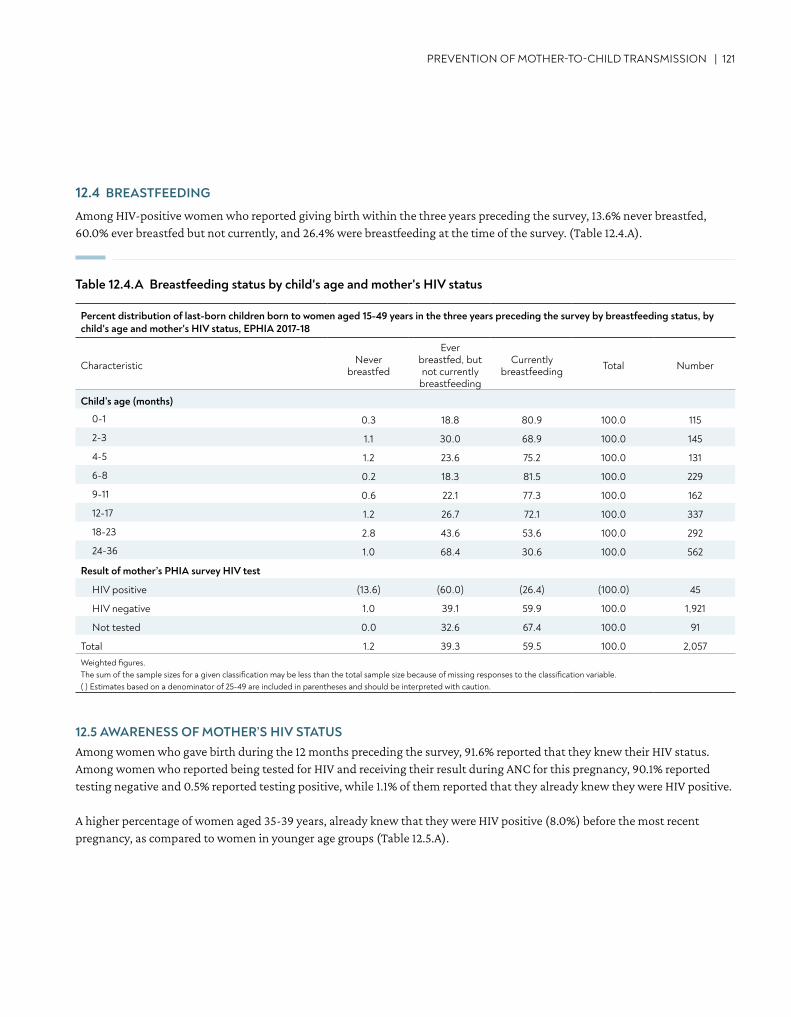
PREVENTION OF MOTHER-TO-CHILD TRANSMISSION | 121
Percent distribution of last-born children born to women aged 15-49 years in the three years preceding the survey by breastfeeding status, by child's age and mother's HIV status, EPHIA 2017-18
Characteristic Never breastfed
Ever breastfed, but not currently
breastfeeding
Currently breastfeeding Total Number
Child’s age (months)
0-1 0.3 18.8 80.9 100.0 115
2-3 1.1 30.0 68.9 100.0 145
4-5 1.2 23.6 75.2 100.0 131
6-8 0.2 18.3 81.5 100.0 229
9-11 0.6 22.1 77.3 100.0 162
12-17 1.2 26.7 72.1 100.0 337
18-23 2.8 43.6 53.6 100.0 292
24-36 1.0 68.4 30.6 100.0 562
Result of mother’s PHIA survey HIV test
HIV positive (13.6) (60.0) (26.4) (100.0) 45
HIV negative 1.0 39.1 59.9 100.0 1,921
Not tested 0.0 32.6 67.4 100.0 91
Total 1.2 39.3 59.5 100.0 2,057Weighted figures. The sum of the sample sizes for a given classification may be less than the total sample size because of missing responses to the classification variable.( ) Estimates based on a denominator of 25-49 are included in parentheses and should be interpreted with caution.
12.4 BREASTFEEDING
Among HIV-positive women who reported giving birth within the three years preceding the survey, 13.6% never breastfed, 60.0% ever breastfed but not currently, and 26.4% were breastfeeding at the time of the survey. (Table 12.4.A).
Table 12.4.A Breastfeeding status by child's age and mother's HIV status
12.5 AWARENESS OF MOTHER’S HIV STATUSAmong women who gave birth during the 12 months preceding the survey, 91.6% reported that they knew their HIV status. Among women who reported being tested for HIV and receiving their result during ANC for this pregnancy, 90.1% reported testing negative and 0.5% reported testing positive, while 1.1% of them reported that they already knew they were HIV positive.
A higher percentage of women aged 35-39 years, already knew that they were HIV positive (8.0%) before the most recent pregnancy, as compared to women in younger age groups (Table 12.5.A).
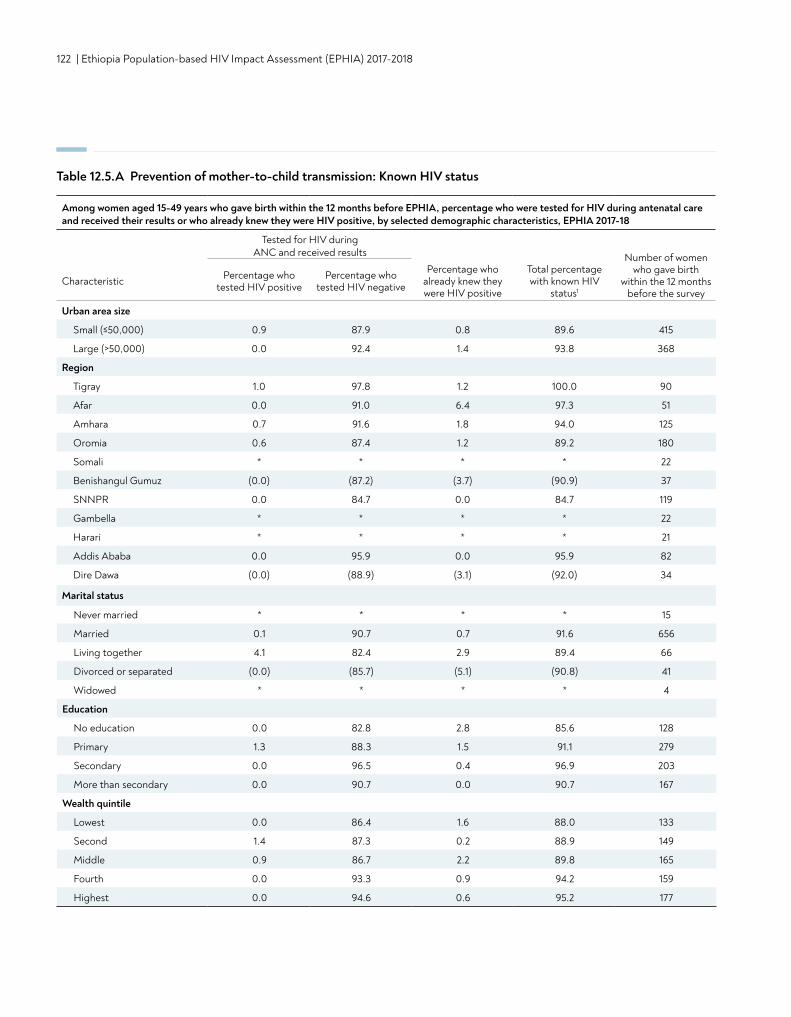
122 | Ethiopia Population-based HIV Impact Assessment (EPHIA) 2017-2018
Table 12.5.A Prevention of mother-to-child transmission: Known HIV status
Among women aged 15-49 years who gave birth within the 12 months before EPHIA, percentage who were tested for HIV during antenatal care and received their results or who already knew they were HIV positive, by selected demographic characteristics, EPHIA 2017-18
Tested for HIV during ANC and received results Number of women
who gave birth within the 12 months
before the surveyCharacteristic Percentage who
tested HIV positivePercentage who
tested HIV negative
Percentage who already knew they were HIV positive
Total percentage with known HIV
status1
Urban area size
Small (≤50,000) 0.9 87.9 0.8 89.6 415
Large (>50,000) 0.0 92.4 1.4 93.8 368
Region
Tigray 1.0 97.8 1.2 100.0 90
Afar 0.0 91.0 6.4 97.3 51
Amhara 0.7 91.6 1.8 94.0 125
Oromia 0.6 87.4 1.2 89.2 180
Somali * * * * 22
Benishangul Gumuz (0.0) (87.2) (3.7) (90.9) 37
SNNPR 0.0 84.7 0.0 84.7 119
Gambella * * * * 22
Harari * * * * 21
Addis Ababa 0.0 95.9 0.0 95.9 82
Dire Dawa (0.0) (88.9) (3.1) (92.0) 34
Marital status
Never married * * * * 15
Married 0.1 90.7 0.7 91.6 656
Living together 4.1 82.4 2.9 89.4 66
Divorced or separated (0.0) (85.7) (5.1) (90.8) 41
Widowed * * * * 4
Education
No education 0.0 82.8 2.8 85.6 128
Primary 1.3 88.3 1.5 91.1 279
Secondary 0.0 96.5 0.4 96.9 203
More than secondary 0.0 90.7 0.0 90.7 167
Wealth quintile
Lowest 0.0 86.4 1.6 88.0 133
Second 1.4 87.3 0.2 88.9 149
Middle 0.9 86.7 2.2 89.8 165
Fourth 0.0 93.3 0.9 94.2 159
Highest 0.0 94.6 0.6 95.2 177
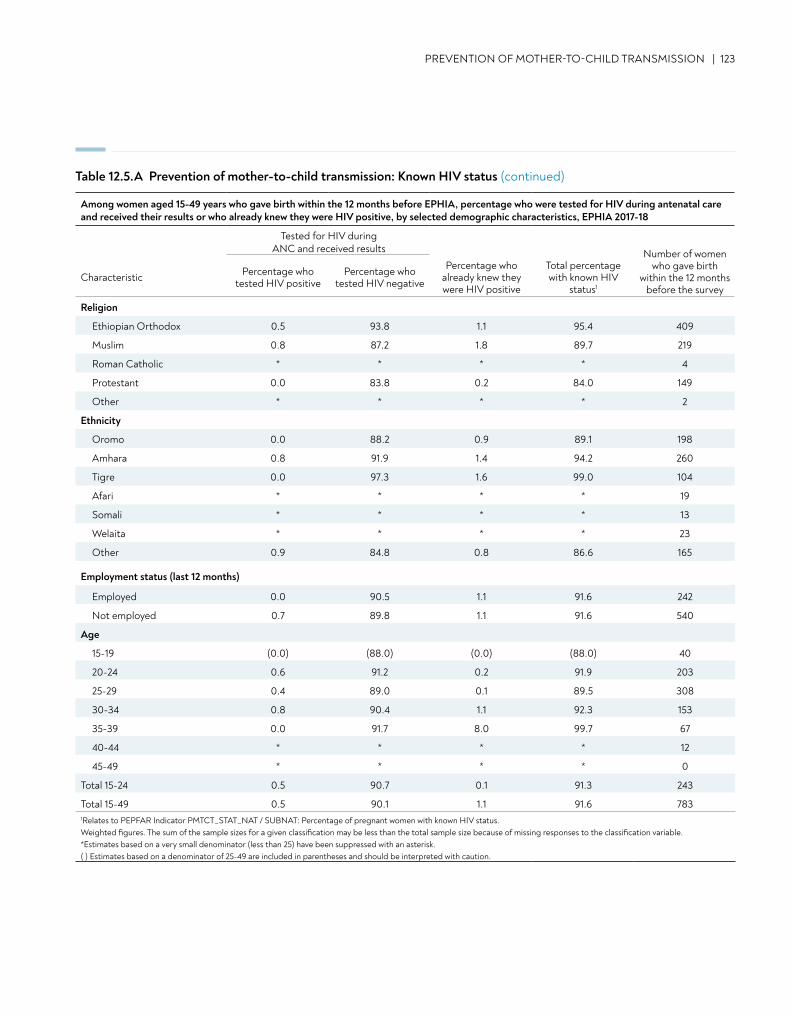
PREVENTION OF MOTHER-TO-CHILD TRANSMISSION | 123
Religion
Ethiopian Orthodox 0.5 93.8 1.1 95.4 409
Muslim 0.8 87.2 1.8 89.7 219
Roman Catholic * * * * 4
Protestant 0.0 83.8 0.2 84.0 149
Other * * * * 2
Ethnicity
Oromo 0.0 88.2 0.9 89.1 198
Amhara 0.8 91.9 1.4 94.2 260
Tigre 0.0 97.3 1.6 99.0 104
Afari * * * * 19
Somali * * * * 13
Welaita * * * * 23
Other 0.9 84.8 0.8 86.6 165
Employment status (last 12 months)
Employed 0.0 90.5 1.1 91.6 242
Not employed 0.7 89.8 1.1 91.6 540
Age
15-19 (0.0) (88.0) (0.0) (88.0) 40
20-24 0.6 91.2 0.2 91.9 203
25-29 0.4 89.0 0.1 89.5 308
30-34 0.8 90.4 1.1 92.3 153
35-39 0.0 91.7 8.0 99.7 67
40-44 * * * * 12
45-49 * * * * 0
Total 15-24 0.5 90.7 0.1 91.3 243
Total 15-49 0.5 90.1 1.1 91.6 7831Relates to PEPFAR Indicator PMTCT_STAT_NAT / SUBNAT: Percentage of pregnant women with known HIV status. Weighted figures. The sum of the sample sizes for a given classification may be less than the total sample size because of missing responses to the classification variable.*Estimates based on a very small denominator (less than 25) have been suppressed with an asterisk. ( ) Estimates based on a denominator of 25-49 are included in parentheses and should be interpreted with caution.
Table 12.5.A Prevention of mother-to-child transmission: Known HIV status (continued)
Among women aged 15-49 years who gave birth within the 12 months before EPHIA, percentage who were tested for HIV during antenatal care and received their results or who already knew they were HIV positive, by selected demographic characteristics, EPHIA 2017-18
Tested for HIV during ANC and received results Number of women
who gave birth within the 12 months
before the surveyCharacteristic Percentage who
tested HIV positivePercentage who
tested HIV negative
Percentage who already knew they were HIV positive
Total percentage with known HIV
status1
124 | Ethiopia Population-based HIV Impact Assessment (EPHIA) 2017-2018
12.6 ANTIRETROVIRAL THERAPY AMONG HIV-POSITIVE PREGNANT WOMEN
There was not an adequate sample size to generate reliable estimates of HIV-positive women who delivered in the 12 months preceding the survey.
12.7 MOTHER-TO-CHILD TRANSMISSION
No children aged 0-17 months were identified to be HIV positive as part of the virological testing in EPHIA.
12.8 GAPS AND UNMET NEEDS
• Among HIV-positive women in urban Ethiopia who reported giving birth within the three years preceding the survey, 60.0% had ever breastfed but were not at the time of the survey, and 26.4% were breastfeeding at the time of the survey. This indicates the need for closer follow-up of mothers and infants, and stronger psychosocial support and counselling, especially regarding infant feeding and postpartum care.
12.9 REFERENCES
1. De Cock KM, Fowler MG, Mercier E, et al. Prevention of mother-to-child HIV transmission in resource-poor countries: translating research into policy and practice. JAMA, 2000, 283:1175–1182. doi:10.1001/jama.283.9.1175.
2. World Health Organization. Towards the elimination of mother-to-child transmission of HIV: report of a WHO technical consultation. Geneva: World Health Organization; 2011. http://apps.who.int/iris/bitstream/handle/10665/44638/9789241501910_eng.pdf;jsessionid=CD35DAE3C3D00349A9B149BCFF9262C4?sequence=1. Accessed December 17, 2018.
CONTENT | 125
13. ADOLESCENTS AND YOUNG ADULTS
• Among young people (older adolescents aged 15-19 years and young adults aged 20-24 years) living in urban Ethiopia, 2.7% reported having sex before the age of 15 years (2.2% among older adolescent boys and young men and 3.3% among older adolescent girls and young women).
• Among female young people, 2.1% of the older adolescent girls reported sex before the age of 15 years, compared to 4.5% of young women.
• HIV prevalence in older adolescents was 0.9% (1.0% in boys, 0.7% in girls) and 0.6% in young adults (0.3% in young men, 0.9% in young women).
• Based on self-reported and ARV-adjusted data, 63.0% of young people living with HIV were aware of their HIV-positive status, and among those who had been previously diagnosed, 100% were on ART. Among those on treatment, 74.3% had suppressed VLs.
KEY FINDINGS
126 | Ethiopia Population-based HIV Impact Assessment (EPHIA) 2017-2018
13.2 BACKGROUND
One-third of the population of sub-Saharan Africa, including in Ethiopia, is between aged 10-24 years; a phenomenon often referred to as the youth bulge.1,2 Older adolescents and young adults are more likely to engage in risky sexual behaviors than older adults and have less frequent contact with the healthcare system. Control of HIV in this age demographic is critical for long-term epidemic control but is also particularly challenging.
This chapter presents the prevalence of early sexual debut before age 15 years among young people by sex, marital status, region, and socio-demographic characteristics. It also describes knowledge of HIV prevention among younger adolescents boys and girls aged 12-14 years. These data were measured by asking participants to agree or disagree with both accurate and inaccurate statements about HIV prevention. Findings are also presented on attitudes towards HIV-positive people among young adolescents aged 12-14 years. This chapter also describes HIV prevalence and the 90-90-90 cascade for young people.
13.3 SEX BEFORE THE AGE OF 15 YEARS
Among young people, 2.7% (3.3% of older adolescent girls and young women and 2.2% of older adolescent boys and young men) reported having had sex before the age of 15 years. Among older adolescent girls, 2.1% reported sex before the age of 15 years, compared to 4.5% among young women. Among older adolescent boys and young men there was little variation, with 2.1% and 2.2%, respectively, reporting sexual debut before the age of 15 years. Among young people, the percentage of those who reported sex before the age of 15 years was higher among those with no education (10.5%), compared to those from other education categories (Table 13.3.A).
Sexual debut before the age of 15 years for young people ranges from 1.2% in Addis Ababa to 4.8% in Afar. For the older adolescent boys and young men, sexual debut before age of 15 years ranges from 0.7% in Amhara and Addis Ababa to 5.6% in Benishangul Gumuz, while for the older adolescent girls and young women, it ranges from 1.6% in Addis Ababa to 6.1% in Afar. Sex before the age of 15 years was reported by 3.6% of employed young people, and 2.4% among the non-employed. It was reported by 4.9% of the employed and 2.7% of the unemployed older adolescent girls and young women, and 2.5% of the employed and 2.0% of the unemployed older adolescent boys and young men (Table 13.3.A).
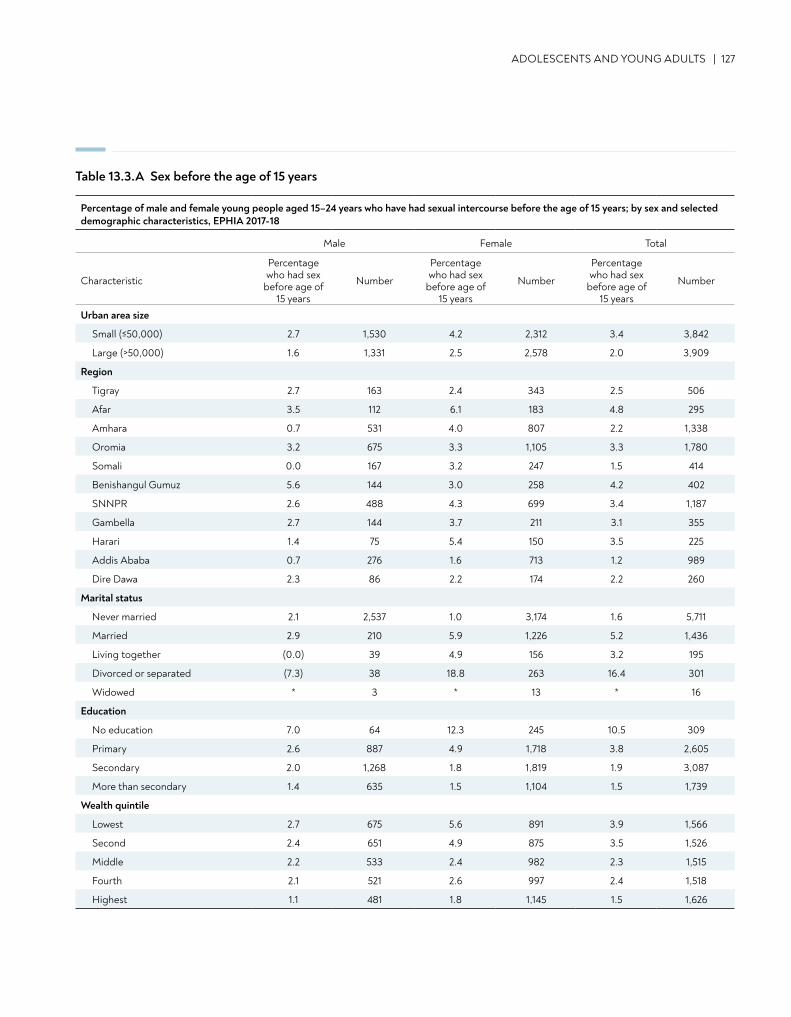
Table 13.3.A Sex before the age of 15 years
ADOLESCENTS AND YOUNG ADULTS | 127
Percentage of male and female young people aged 15–24 years who have had sexual intercourse before the age of 15 years; by sex and selected demographic characteristics, EPHIA 2017-18
Male Female Total
Characteristic
Percentage who had sex
before age of 15 years
Number
Percentage who had sex
before age of 15 years
Number
Percentage who had sex
before age of 15 years
Number
Urban area size
Small (≤50,000) 2.7 1,530 4.2 2,312 3.4 3,842
Large (>50,000) 1.6 1,331 2.5 2,578 2.0 3,909
Region
Tigray 2.7 163 2.4 343 2.5 506
Afar 3.5 112 6.1 183 4.8 295
Amhara 0.7 531 4.0 807 2.2 1,338
Oromia 3.2 675 3.3 1,105 3.3 1,780
Somali 0.0 167 3.2 247 1.5 414
Benishangul Gumuz 5.6 144 3.0 258 4.2 402
SNNPR 2.6 488 4.3 699 3.4 1,187
Gambella 2.7 144 3.7 211 3.1 355
Harari 1.4 75 5.4 150 3.5 225
Addis Ababa 0.7 276 1.6 713 1.2 989
Dire Dawa 2.3 86 2.2 174 2.2 260
Marital status
Never married 2.1 2,537 1.0 3,174 1.6 5,711
Married 2.9 210 5.9 1,226 5.2 1,436
Living together (0.0) 39 4.9 156 3.2 195
Divorced or separated (7.3) 38 18.8 263 16.4 301
Widowed * 3 * 13 * 16
Education
No education 7.0 64 12.3 245 10.5 309
Primary 2.6 887 4.9 1,718 3.8 2,605
Secondary 2.0 1,268 1.8 1,819 1.9 3,087
More than secondary 1.4 635 1.5 1,104 1.5 1,739
Wealth quintile
Lowest 2.7 675 5.6 891 3.9 1,566
Second 2.4 651 4.9 875 3.5 1,526
Middle 2.2 533 2.4 982 2.3 1,515
Fourth 2.1 521 2.6 997 2.4 1,518
Highest 1.1 481 1.8 1,145 1.5 1,626
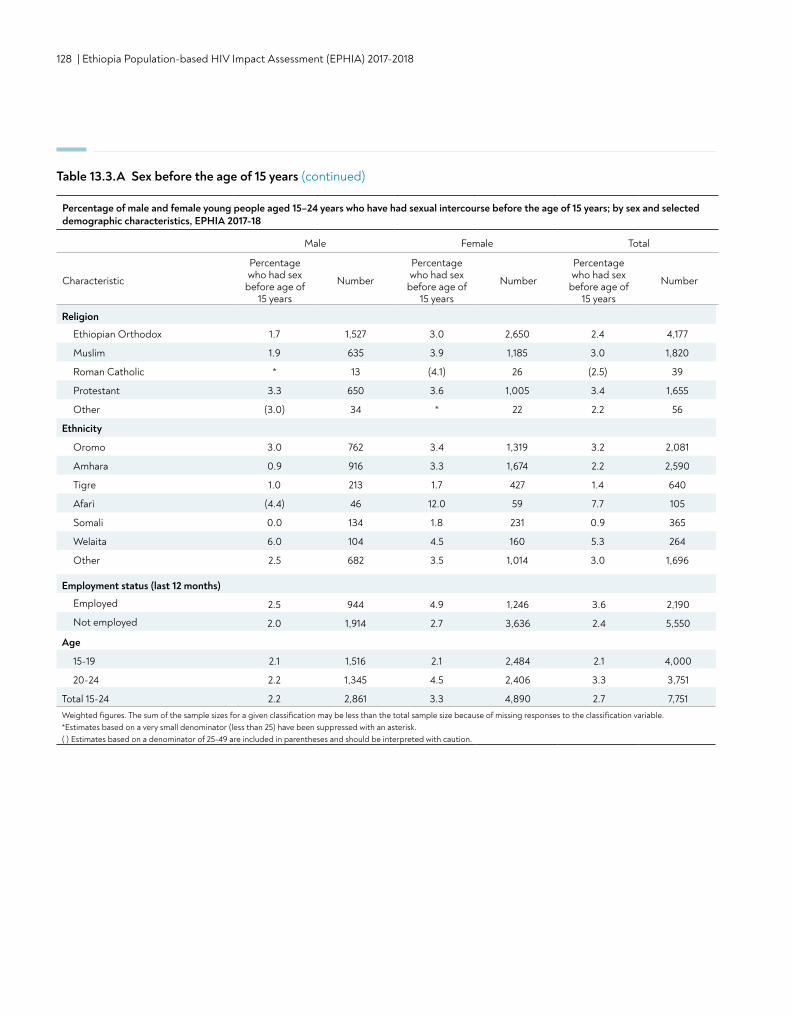
128 | Ethiopia Population-based HIV Impact Assessment (EPHIA) 2017-2018
Religion
Ethiopian Orthodox 1.7 1,527 3.0 2,650 2.4 4,177
Muslim 1.9 635 3.9 1,185 3.0 1,820
Roman Catholic * 13 (4.1) 26 (2.5) 39
Protestant 3.3 650 3.6 1,005 3.4 1,655
Other (3.0) 34 * 22 2.2 56
Ethnicity
Oromo 3.0 762 3.4 1,319 3.2 2,081
Amhara 0.9 916 3.3 1,674 2.2 2,590
Tigre 1.0 213 1.7 427 1.4 640
Afari (4.4) 46 12.0 59 7.7 105
Somali 0.0 134 1.8 231 0.9 365
Welaita 6.0 104 4.5 160 5.3 264
Other 2.5 682 3.5 1,014 3.0 1,696
Employment status (last 12 months)
Employed 2.5 944 4.9 1,246 3.6 2,190
Not employed 2.0 1,914 2.7 3,636 2.4 5,550
Age
15-19 2.1 1,516 2.1 2,484 2.1 4,000
20-24 2.2 1,345 4.5 2,406 3.3 3,751
Total 15-24 2.2 2,861 3.3 4,890 2.7 7,751Weighted figures. The sum of the sample sizes for a given classification may be less than the total sample size because of missing responses to the classification variable.*Estimates based on a very small denominator (less than 25) have been suppressed with an asterisk. ( ) Estimates based on a denominator of 25-49 are included in parentheses and should be interpreted with caution.
Percentage of male and female young people aged 15–24 years who have had sexual intercourse before the age of 15 years; by sex and selected demographic characteristics, EPHIA 2017-18
Male Female Total
Characteristic
Percentage who had sex
before age of 15 years
Number
Percentage who had sex
before age of 15 years
Number
Percentage who had sex
before age of 15 years
Number
Table 13.3.A Sex before the age of 15 years (continued)
ADOLESCENTS AND YOUNG ADULTS | 129
13.4 KNOWLEDGE ABOUT HIV PREVENTION
Table 13.4.A and 13.4.B report on the knowledge about HIV transmission and prevention among younger adolescent boys and girls aged 12-14 years, respectively, by selected demographic characteristics.
Questions asked included:1. Can a person reduce their chance of getting HIV by not having sex?
2. Can a person reduce their chance of getting HIV by using condoms when having sex?
3. Can a healthy-looking person have HIV or AIDS?
4. Can a mother with HIV or AIDS pass HIV to her unborn baby?
5. Are there medicines that people with HIV or AIDS can take to help them live longer?
6. Can male circumcision help prevent HIV infection?
7. Can female circumcision be a risk factor for HIV infection?
8. Can ARVs make people with HIV less likely to spread the virus?
Overall, 1.9% responded correctly to all eight questions (2.6% of the boys and 1.3% of the girls). Knowledge scores on individual questions among the boys varied, ranging from 81.8% of participants responding correctly to the question, “Are there medicines that people with HIV or AIDS can take to help them live longer?” to 21.2% responding correctly to the question, “Can male circumcision help prevent HIV infection?”(Tables 13.4.A and 13.4.B).
Among younger adolescent girls, 79.5% responded correctly to the question “Are there medicines that people with HIV or AIDS can take to help them live longer?” as compared to 18.6% of girls who responded correctly to the question, “Can male circumcision help prevent HIV infection?” (Table 13.4.B).
There was no significant difference between young adolescents aged 12-14 years in large urban areas and small urban areas. Knowledge scores were not markedly different across wealth quintiles (Table 13.4.C).
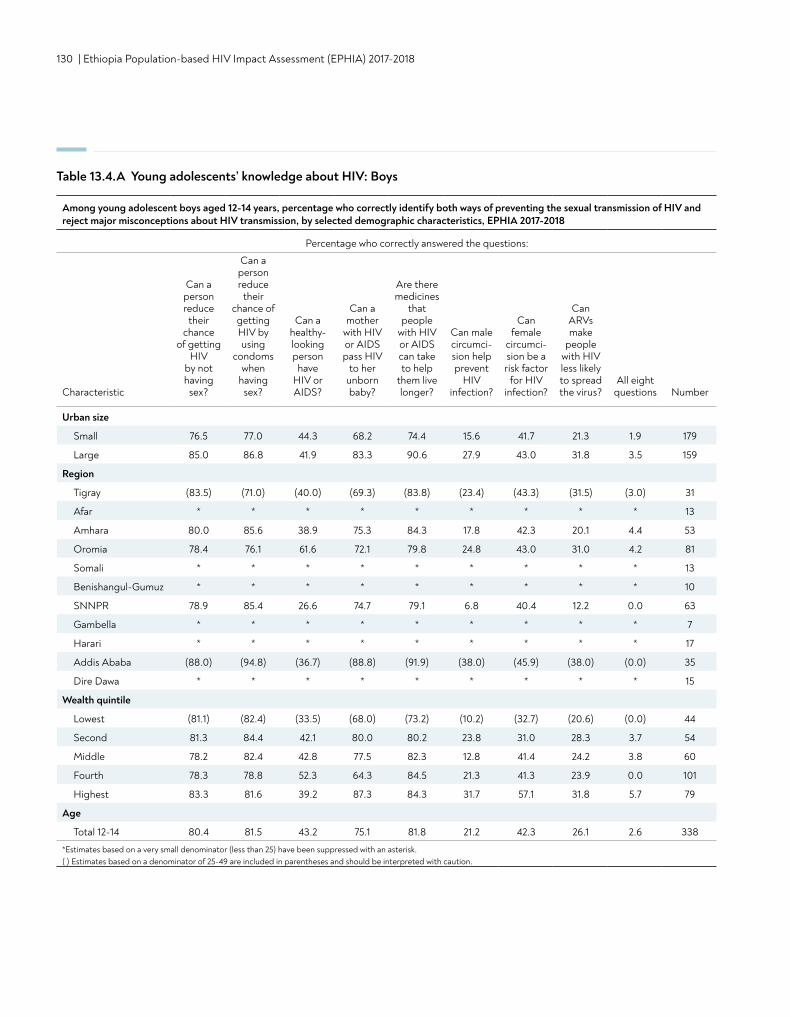
130 | Ethiopia Population-based HIV Impact Assessment (EPHIA) 2017-2018
Table 13.4.A Young adolescents’ knowledge about HIV: Boys
Among young adolescent boys aged 12-14 years, percentage who correctly identify both ways of preventing the sexual transmission of HIV and reject major misconceptions about HIV transmission, by selected demographic characteristics, EPHIA 2017-2018
Percentage who correctly answered the questions:
Characteristic
Can a person reduce
their chance
of getting HIV
by not having
sex?
Can a person reduce
their chance of getting HIV by using
condoms when
having sex?
Can a healthy- looking person
have HIV or AIDS?
Can a mother
with HIV or AIDS pass HIV
to her unborn baby?
Are there medicines
that people
with HIV or AIDS can take to help
them live longer?
Can male circumci-sion help prevent
HIV infection?
Can female
circumci-sion be a risk factor
for HIV infection?
Can ARVs make
people with HIV less likely to spread the virus?
All eight questions Number
Urban size
Small 76.5 77.0 44.3 68.2 74.4 15.6 41.7 21.3 1.9 179
Large 85.0 86.8 41.9 83.3 90.6 27.9 43.0 31.8 3.5 159
Region
Tigray (83.5) (71.0) (40.0) (69.3) (83.8) (23.4) (43.3) (31.5) (3.0) 31
Afar * * * * * * * * * 13
Amhara 80.0 85.6 38.9 75.3 84.3 17.8 42.3 20.1 4.4 53
Oromia 78.4 76.1 61.6 72.1 79.8 24.8 43.0 31.0 4.2 81
Somali * * * * * * * * * 13
Benishangul-Gumuz * * * * * * * * * 10
SNNPR 78.9 85.4 26.6 74.7 79.1 6.8 40.4 12.2 0.0 63
Gambella * * * * * * * * * 7
Harari * * * * * * * * * 17
Addis Ababa (88.0) (94.8) (36.7) (88.8) (91.9) (38.0) (45.9) (38.0) (0.0) 35
Dire Dawa * * * * * * * * * 15
Wealth quintile
Lowest (81.1) (82.4) (33.5) (68.0) (73.2) (10.2) (32.7) (20.6) (0.0) 44
Second 81.3 84.4 42.1 80.0 80.2 23.8 31.0 28.3 3.7 54
Middle 78.2 82.4 42.8 77.5 82.3 12.8 41.4 24.2 3.8 60
Fourth 78.3 78.8 52.3 64.3 84.5 21.3 41.3 23.9 0.0 101
Highest 83.3 81.6 39.2 87.3 84.3 31.7 57.1 31.8 5.7 79
Age
Total 12-14 80.4 81.5 43.2 75.1 81.8 21.2 42.3 26.1 2.6 338
*Estimates based on a very small denominator (less than 25) have been suppressed with an asterisk. ( ) Estimates based on a denominator of 25-49 are included in parentheses and should be interpreted with caution.
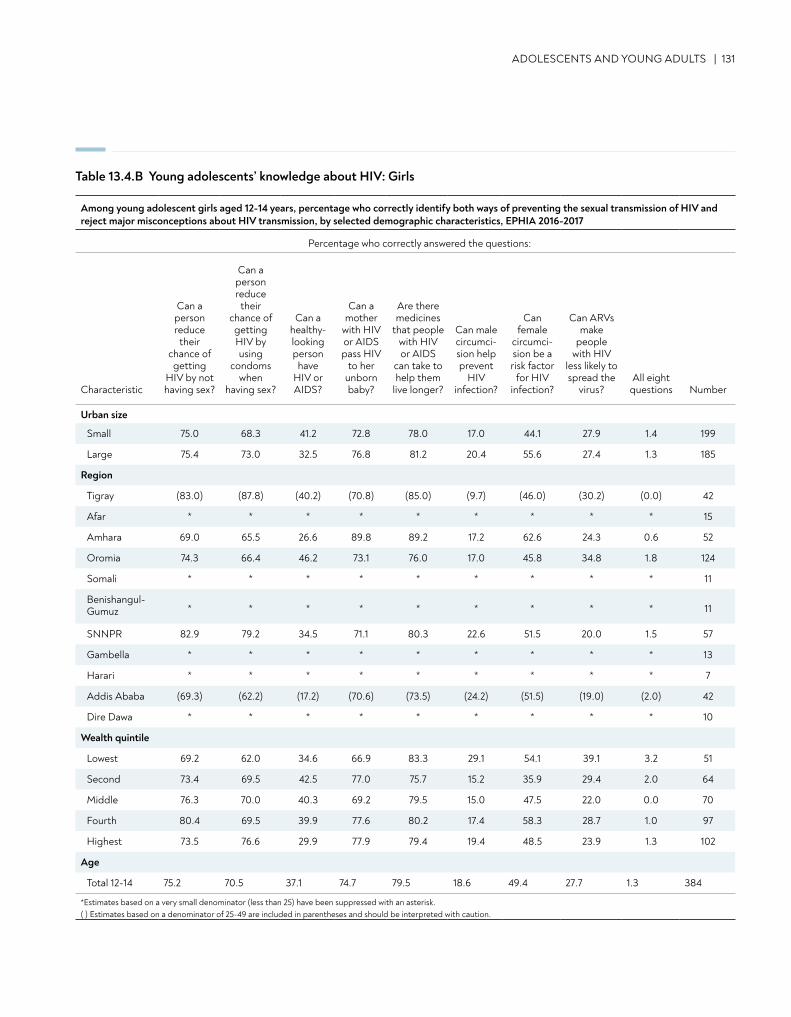
ADOLESCENTS AND YOUNG ADULTS | 131
Table 13.4.B Young adolescents’ knowledge about HIV: Girls
Among young adolescent girls aged 12-14 years, percentage who correctly identify both ways of preventing the sexual transmission of HIV and reject major misconceptions about HIV transmission, by selected demographic characteristics, EPHIA 2016-2017
Percentage who correctly answered the questions:
Characteristic
Can a person reduce
their chance of getting
HIV by not having sex?
Can a person reduce
their chance of getting HIV by using
condoms when
having sex?
Can a healthy- looking person
have HIV or AIDS?
Can a mother
with HIV or AIDS pass HIV
to her unborn baby?
Are there medicines
that people with HIV or AIDS
can take to help them
live longer?
Can male circumci-sion help prevent
HIV infection?
Can female
circumci-sion be a risk factor
for HIV infection?
Can ARVs make
people with HIV
less likely to spread the
virus?All eight
questions Number
Urban size
Small 75.0 68.3 41.2 72.8 78.0 17.0 44.1 27.9 1.4 199
Large 75.4 73.0 32.5 76.8 81.2 20.4 55.6 27.4 1.3 185
Region
Tigray (83.0) (87.8) (40.2) (70.8) (85.0) (9.7) (46.0) (30.2) (0.0) 42
Afar * * * * * * * * * 15
Amhara 69.0 65.5 26.6 89.8 89.2 17.2 62.6 24.3 0.6 52
Oromia 74.3 66.4 46.2 73.1 76.0 17.0 45.8 34.8 1.8 124
Somali * * * * * * * * * 11
Benishangul- Gumuz * * * * * * * * * 11
SNNPR 82.9 79.2 34.5 71.1 80.3 22.6 51.5 20.0 1.5 57
Gambella * * * * * * * * * 13
Harari * * * * * * * * * 7
Addis Ababa (69.3) (62.2) (17.2) (70.6) (73.5) (24.2) (51.5) (19.0) (2.0) 42
Dire Dawa * * * * * * * * * 10
Wealth quintile
Lowest 69.2 62.0 34.6 66.9 83.3 29.1 54.1 39.1 3.2 51
Second 73.4 69.5 42.5 77.0 75.7 15.2 35.9 29.4 2.0 64
Middle 76.3 70.0 40.3 69.2 79.5 15.0 47.5 22.0 0.0 70
Fourth 80.4 69.5 39.9 77.6 80.2 17.4 58.3 28.7 1.0 97
Highest 73.5 76.6 29.9 77.9 79.4 19.4 48.5 23.9 1.3 102
Age
Total 12-14 75.2 70.5 37.1 74.7 79.5 18.6 49.4 27.7 1.3 384
*Estimates based on a very small denominator (less than 25) have been suppressed with an asterisk. ( ) Estimates based on a denominator of 25-49 are included in parentheses and should be interpreted with caution.
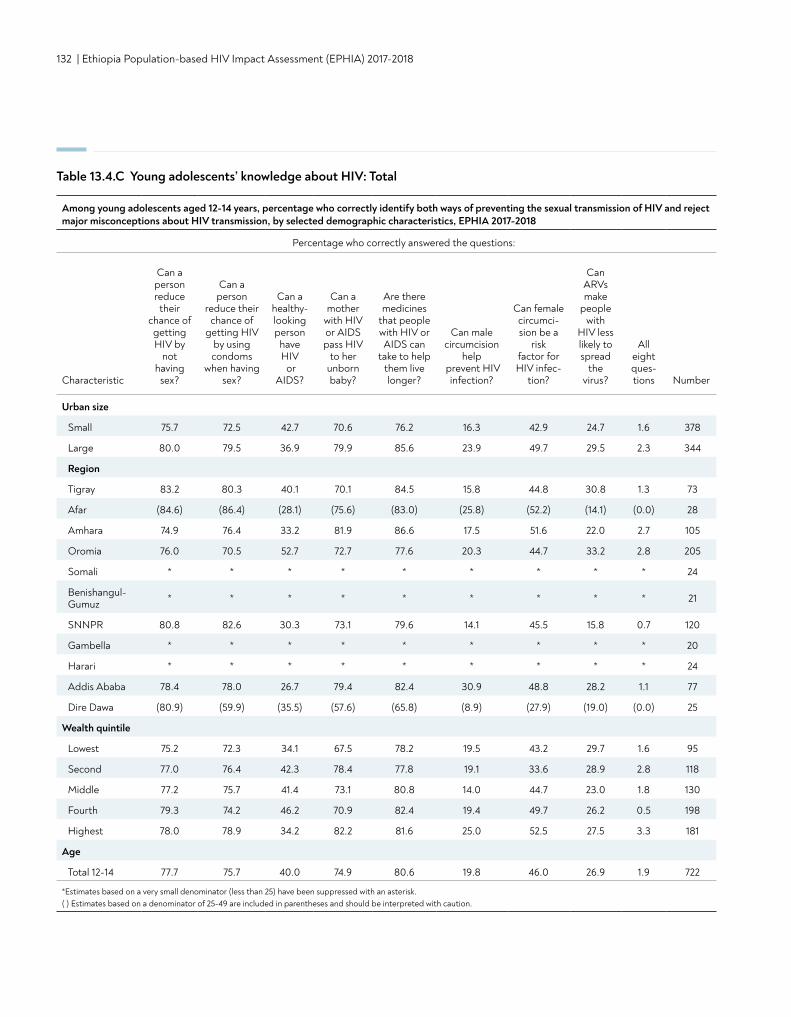
132 | Ethiopia Population-based HIV Impact Assessment (EPHIA) 2017-2018
Table 13.4.C Young adolescents’ knowledge about HIV: Total
Among young adolescents aged 12-14 years, percentage who correctly identify both ways of preventing the sexual transmission of HIV and reject major misconceptions about HIV transmission, by selected demographic characteristics, EPHIA 2017-2018
Percentage who correctly answered the questions:
Characteristic
Can a person reduce
their chance of getting HIV by
not having
sex?
Can a person
reduce their chance of
getting HIV by using condoms
when having sex?
Can a healthy- looking person
have HIV or
AIDS?
Can a mother
with HIV or AIDS pass HIV
to her unborn baby?
Are there medicines
that people with HIV or AIDS can
take to help them live longer?
Can male circumcision
help prevent HIV
infection?
Can female circumci-sion be a
risk factor for HIV infec-
tion?
Can ARVs make
people with
HIV less likely to spread
the virus?
All eight ques-tions Number
Urban size
Small 75.7 72.5 42.7 70.6 76.2 16.3 42.9 24.7 1.6 378
Large 80.0 79.5 36.9 79.9 85.6 23.9 49.7 29.5 2.3 344
Region
Tigray 83.2 80.3 40.1 70.1 84.5 15.8 44.8 30.8 1.3 73
Afar (84.6) (86.4) (28.1) (75.6) (83.0) (25.8) (52.2) (14.1) (0.0) 28
Amhara 74.9 76.4 33.2 81.9 86.6 17.5 51.6 22.0 2.7 105
Oromia 76.0 70.5 52.7 72.7 77.6 20.3 44.7 33.2 2.8 205
Somali * * * * * * * * * 24
Benishangul- Gumuz * * * * * * * * * 21
SNNPR 80.8 82.6 30.3 73.1 79.6 14.1 45.5 15.8 0.7 120
Gambella * * * * * * * * * 20
Harari * * * * * * * * * 24
Addis Ababa 78.4 78.0 26.7 79.4 82.4 30.9 48.8 28.2 1.1 77
Dire Dawa (80.9) (59.9) (35.5) (57.6) (65.8) (8.9) (27.9) (19.0) (0.0) 25
Wealth quintile
Lowest 75.2 72.3 34.1 67.5 78.2 19.5 43.2 29.7 1.6 95
Second 77.0 76.4 42.3 78.4 77.8 19.1 33.6 28.9 2.8 118
Middle 77.2 75.7 41.4 73.1 80.8 14.0 44.7 23.0 1.8 130
Fourth 79.3 74.2 46.2 70.9 82.4 19.4 49.7 26.2 0.5 198
Highest 78.0 78.9 34.2 82.2 81.6 25.0 52.5 27.5 3.3 181
Age
Total 12-14 77.7 75.7 40.0 74.9 80.6 19.8 46.0 26.9 1.9 722
*Estimates based on a very small denominator (less than 25) have been suppressed with an asterisk. ( ) Estimates based on a denominator of 25-49 are included in parentheses and should be interpreted with caution.
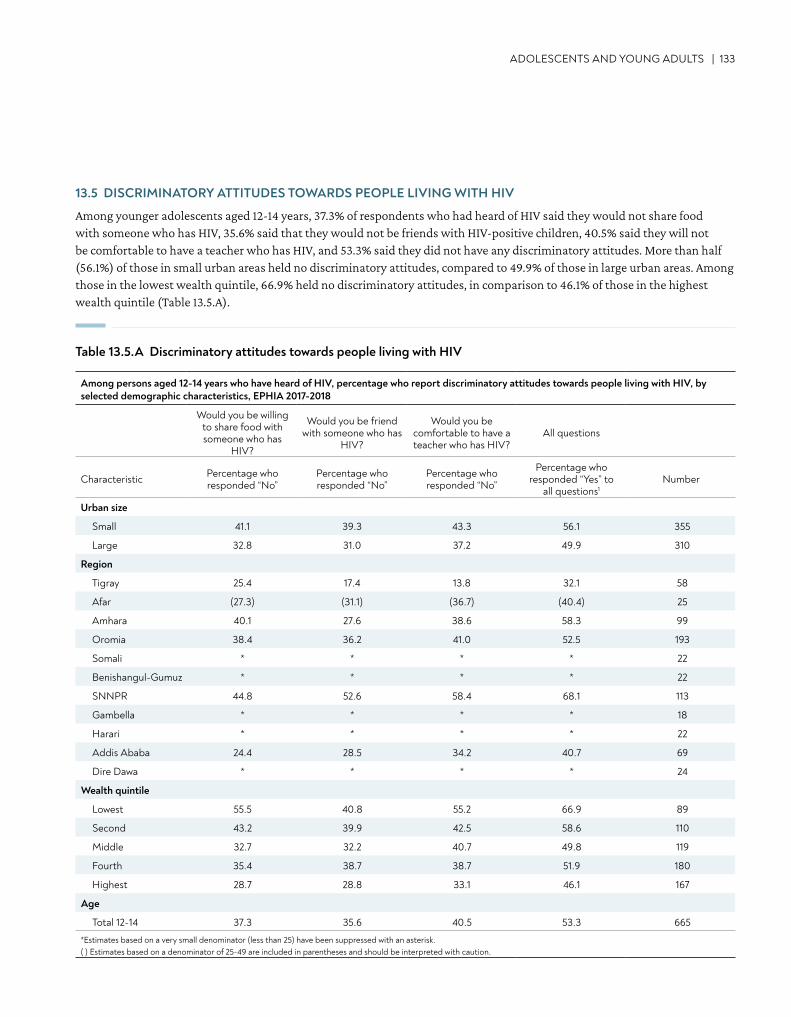
ADOLESCENTS AND YOUNG ADULTS | 133
13.5 DISCRIMINATORY ATTITUDES TOWARDS PEOPLE LIVING WITH HIV
Among younger adolescents aged 12-14 years, 37.3% of respondents who had heard of HIV said they would not share food with someone who has HIV, 35.6% said that they would not be friends with HIV-positive children, 40.5% said they will not be comfortable to have a teacher who has HIV, and 53.3% said they did not have any discriminatory attitudes. More than half (56.1%) of those in small urban areas held no discriminatory attitudes, compared to 49.9% of those in large urban areas. Among those in the lowest wealth quintile, 66.9% held no discriminatory attitudes, in comparison to 46.1% of those in the highest wealth quintile (Table 13.5.A).
Table 13.5.A Discriminatory attitudes towards people living with HIV
Among persons aged 12-14 years who have heard of HIV, percentage who report discriminatory attitudes towards people living with HIV, by selected demographic characteristics, EPHIA 2017-2018
Would you be willing to share food with someone who has
HIV?
Would you be friend with someone who has
HIV?
Would you be comfortable to have a teacher who has HIV?
All questions
Characteristic Percentage who responded “No”
Percentage who responded “No”
Percentage who responded “No”
Percentage who responded “Yes” to
all questions1Number
Urban size
Small 41.1 39.3 43.3 56.1 355
Large 32.8 31.0 37.2 49.9 310
Region
Tigray 25.4 17.4 13.8 32.1 58
Afar (27.3) (31.1) (36.7) (40.4) 25
Amhara 40.1 27.6 38.6 58.3 99
Oromia 38.4 36.2 41.0 52.5 193
Somali * * * * 22
Benishangul-Gumuz * * * * 22
SNNPR 44.8 52.6 58.4 68.1 113
Gambella * * * * 18
Harari * * * * 22
Addis Ababa 24.4 28.5 34.2 40.7 69
Dire Dawa * * * * 24
Wealth quintile
Lowest 55.5 40.8 55.2 66.9 89
Second 43.2 39.9 42.5 58.6 110
Middle 32.7 32.2 40.7 49.8 119
Fourth 35.4 38.7 38.7 51.9 180
Highest 28.7 28.8 33.1 46.1 167
Age
Total 12-14 37.3 35.6 40.5 53.3 665
*Estimates based on a very small denominator (less than 25) have been suppressed with an asterisk. ( ) Estimates based on a denominator of 25-49 are included in parentheses and should be interpreted with caution.
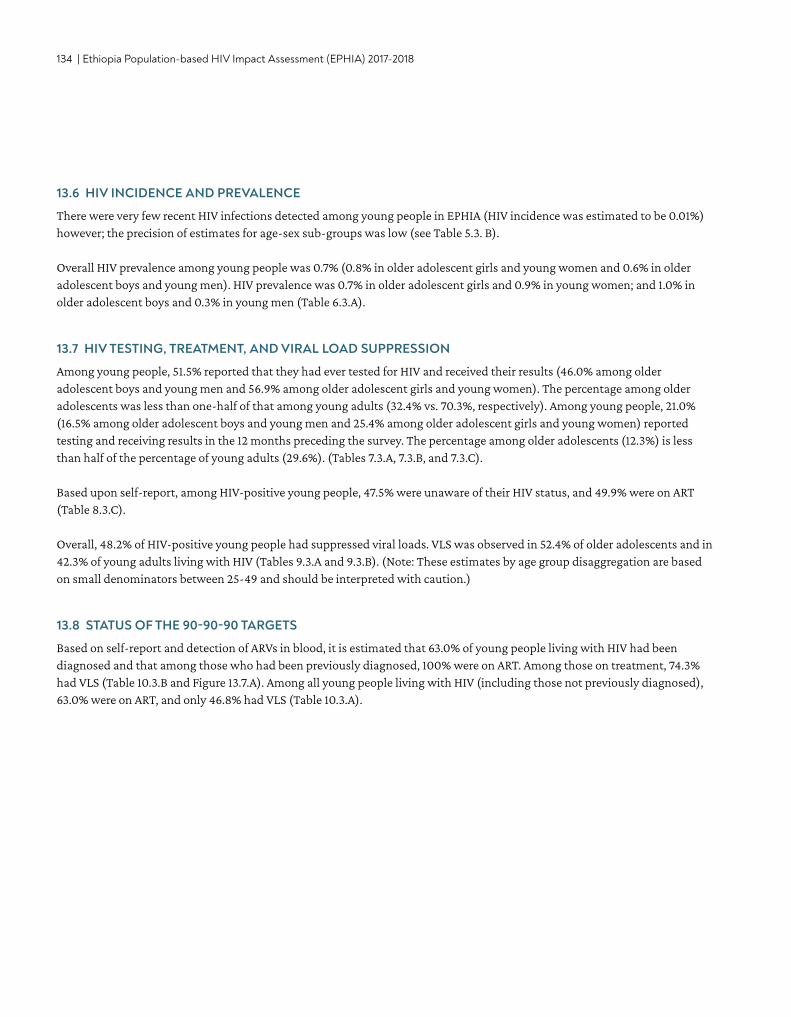
134 | Ethiopia Population-based HIV Impact Assessment (EPHIA) 2017-2018
13.6 HIV INCIDENCE AND PREVALENCE
There were very few recent HIV infections detected among young people in EPHIA (HIV incidence was estimated to be 0.01%) however; the precision of estimates for age-sex sub-groups was low (see Table 5.3. B).
Overall HIV prevalence among young people was 0.7% (0.8% in older adolescent girls and young women and 0.6% in older adolescent boys and young men). HIV prevalence was 0.7% in older adolescent girls and 0.9% in young women; and 1.0% in older adolescent boys and 0.3% in young men (Table 6.3.A).
13.7 HIV TESTING, TREATMENT, AND VIRAL LOAD SUPPRESSION
Among young people, 51.5% reported that they had ever tested for HIV and received their results (46.0% among older adolescent boys and young men and 56.9% among older adolescent girls and young women). The percentage among older adolescents was less than one-half of that among young adults (32.4% vs. 70.3%, respectively). Among young people, 21.0% (16.5% among older adolescent boys and young men and 25.4% among older adolescent girls and young women) reported testing and receiving results in the 12 months preceding the survey. The percentage among older adolescents (12.3%) is less than half of the percentage of young adults (29.6%). (Tables 7.3.A, 7.3.B, and 7.3.C). Based upon self-report, among HIV-positive young people, 47.5% were unaware of their HIV status, and 49.9% were on ART (Table 8.3.C).
Overall, 48.2% of HIV-positive young people had suppressed viral loads. VLS was observed in 52.4% of older adolescents and in 42.3% of young adults living with HIV (Tables 9.3.A and 9.3.B). (Note: These estimates by age group disaggregation are based on small denominators between 25-49 and should be interpreted with caution.)
13.8 STATUS OF THE 90-90-90 TARGETS
Based on self-report and detection of ARVs in blood, it is estimated that 63.0% of young people living with HIV had been diagnosed and that among those who had been previously diagnosed, 100% were on ART. Among those on treatment, 74.3% had VLS (Table 10.3.B and Figure 13.7.A). Among all young people living with HIV (including those not previously diagnosed), 63.0% were on ART, and only 46.8% had VLS (Table 10.3.A).
ADOLESCENTS AND YOUNG ADULTS | 135
Figure 13.8.A Young people 90-90-90 (laboratory ARV-adjusted data among young people aged 15-24 years), EPHIA 2017-2018
13.9 GAPS AND UNMET NEEDS
• Almost half of young people in urban Ethiopia were unaware of their HIV-positive status. Testing strategies that better engage young people could increase awareness about HIV-positive status among this population.
• Almost a quarter of the HIV-positive young people in urban Ethiopia who reported taking ART did not achieve VLS. • Many young adolescents 12-14 years of age do not have sufficient knowledge about HIV prevention and the ways to reduce
their risk of HIV acquisition.• Almost half of young adolescents 12-14 years of age had some form of discriminatory attitude. Improved efforts to educate
the adolescents about HIV could reduce HIV-related stigma and discrimination.
13.10 REFERENCES
1. Hervish A, Clifton D. The Status Report on Adolescents and Young People in Sub-Saharan Africa: Opportunities and Challenges. Johannesburg and Washington, D.C.: Population Reference Bureau; 2012.
2. Central Statistical Agency (CSA). Population Projections for Ethiopia 2007-2037. Addis Ababa: Central Statistical Agency; July 2013.
1In the antiretroviral (ARV)-adjusted 90-90-90, young people aged 15-24 years are classified as ‘Aware’ or ‘Diagnosed’ if they reported knowing their HIV-positive status before testing HIV seropositive in EPHIA or had detectable ARVs in their blood. Young people are classified as ‘On Treatment’ if they reported that they were on treatment or if they had detectable ARVs in their blood. *Inset numbers are conditional proportions.*Estimates based on a very small denominator (less than 25) have been suppressed with a dagger.
136 | Ethiopia Population-based HIV Impact Assessment (EPHIA) 2017-2018
14. CHILDREN• The estimated prevalence of HIV among children
(those aged 0-14 years) in urban Ethiopia was 0.3%. This corresponds to approximately 19,000 children living with HIV in urban Ethiopia.
KEY FINDINGS
CHILDREN | 137
14.2 BACKGROUND
Estimates of prevalence of HIV in children, estimates of children living with HIV, and VLS among children are most commonly derived indirectly from clinic-based data or epidemiologic models. EPHIA provides direct measurements of these estimates among children. These estimates are critical for meeting the needs of pediatric HIV treatment, planning for HIV prevention, care and treatment services for children, evaluating PMTCT programs, and addressing specific needs of young adolescents (those aged 10-14 years).
This chapter presents results on the UNAIDS 90-90-90 cascade in children, using both parent/guardian-reported data (on awareness of child’s HIV status and ARV use) and data on detectable ARVs. Analyses for the 90-90-90 tables for children were similar to that described for adults in Chapter 10. Parents or guardians were asked about a child’s HIV infection status and ART use. Data on detectable ARVs were used in combination with self-reported ARV use to define awareness of the HIV-positive status and ART status of a child. Presence of detectable ARVs among children who were reported as HIV negative was used to reclassify the child as aware and on ART.
14.3 HIV PREVALENCE
It is estimated that 0.3% of children in urban Ethiopia are living with HIV (0.3% of males and 0.3% of females). This corresponds to approximately 19,000 HIV-positive children in urban Ethiopia. The prevalence of HIV was 0.1% among those under 5 years of age, 0.2% among those aged 5-9 years, and 0.6% among those young adolescents (Table 6.3.A).
14.4 HIV TREATMENT AND VIRAL LOAD SUPPRESSION
Among children EPHIA identified as living with HIV, the sample size was inadequate to generate reliable estimates (Table 14.5.B). Since the number of observations was very small (less than 25 unweighted cases), the point estimates for the proportion of the children on treatment and with VLS were not reported.
14.5 STATUS OF THE UNAIDS 90-90-90 TARGETS
The sample size of children living with HIV identified in EPHIA was inadequate to generate reliable estimates (Table 14.5.B). Since the number of observations was very small (less than 25 unweighted cases), the point estimates for the proportion of the children on treatment and with VLS were not reported.
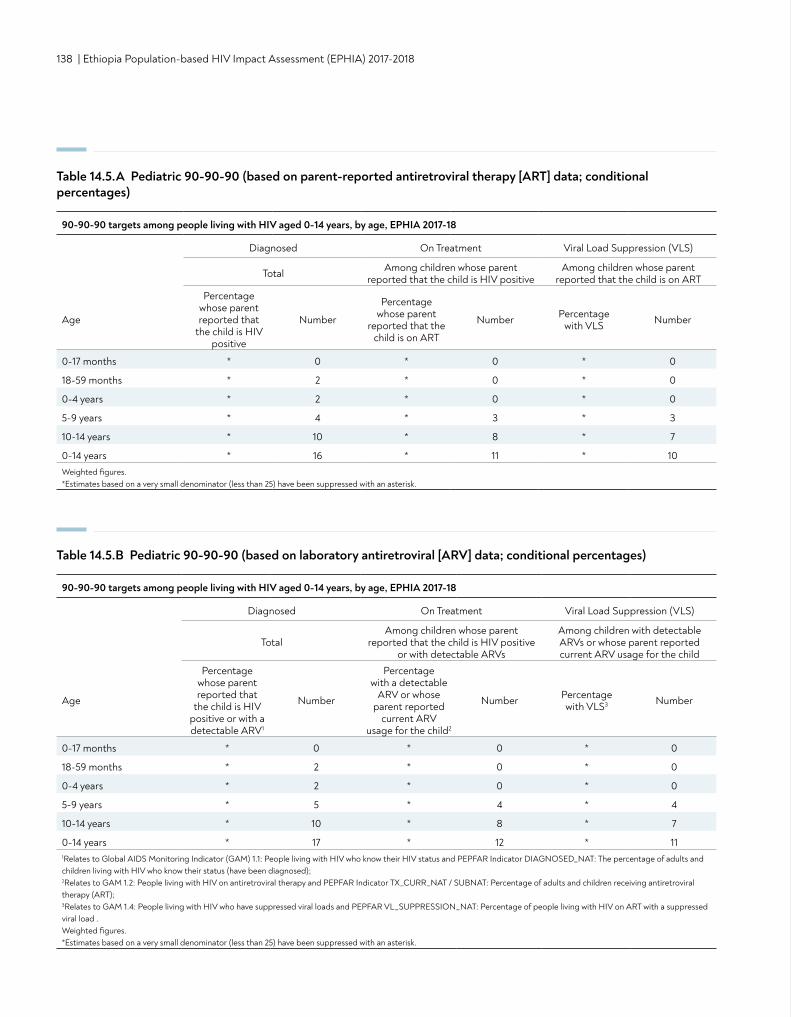
138 | Ethiopia Population-based HIV Impact Assessment (EPHIA) 2017-2018
Table 14.5.A Pediatric 90-90-90 (based on parent-reported antiretroviral therapy [ART] data; conditional percentages)
Table 14.5.B Pediatric 90-90-90 (based on laboratory antiretroviral [ARV] data; conditional percentages)
90-90-90 targets among people living with HIV aged 0-14 years, by age, EPHIA 2017-18
Diagnosed On Treatment Viral Load Suppression (VLS)
Total Among children whose parent reported that the child is HIV positive
Among children whose parent reported that the child is on ART
Age
Percentage whose parent reported that
the child is HIV positive
Number
Percentage whose parent
reported that the child is on ART
Number Percentage with VLS Number
0-17 months * 0 * 0 * 0
18-59 months * 2 * 0 * 0
0-4 years * 2 * 0 * 0
5-9 years * 4 * 3 * 3
10-14 years * 10 * 8 * 7
0-14 years * 16 * 11 * 10Weighted figures.*Estimates based on a very small denominator (less than 25) have been suppressed with an asterisk.
90-90-90 targets among people living with HIV aged 0-14 years, by age, EPHIA 2017-18
Diagnosed On Treatment Viral Load Suppression (VLS)
TotalAmong children whose parent
reported that the child is HIV positive or with detectable ARVs
Among children with detectable ARVs or whose parent reported current ARV usage for the child
Age
Percentage whose parent reported that
the child is HIV positive or with a detectable ARV1
Number
Percentage with a detectable
ARV or whose parent reported
current ARV usage for the child2
Number Percentage with VLS3 Number
0-17 months * 0 * 0 * 0
18-59 months * 2 * 0 * 0
0-4 years * 2 * 0 * 0
5-9 years * 5 * 4 * 4
10-14 years * 10 * 8 * 7
0-14 years * 17 * 12 * 111Relates to Global AIDS Monitoring Indicator (GAM) 1.1: People living with HIV who know their HIV status and PEPFAR Indicator DIAGNOSED_NAT: The percentage of adults and children living with HIV who know their status (have been diagnosed); 2Relates to GAM 1.2: People living with HIV on antiretroviral therapy and PEPFAR Indicator TX_CURR_NAT / SUBNAT: Percentage of adults and children receiving antiretroviral therapy (ART); 3Relates to GAM 1.4: People living with HIV who have suppressed viral loads and PEPFAR VL_SUPPRESSION_NAT: Percentage of people living with HIV on ART with a suppressed viral load . Weighted figures.*Estimates based on a very small denominator (less than 25) have been suppressed with an asterisk.
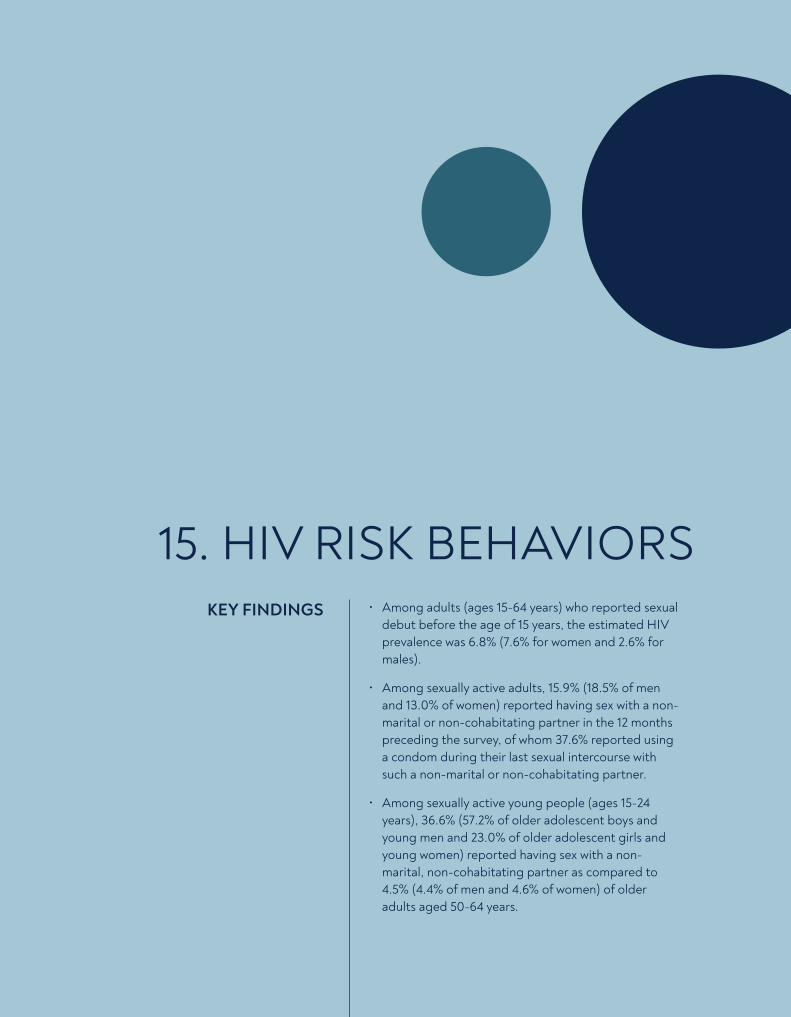
CONTENT | 139
15. HIV RISK BEHAVIORS• Among adults (ages 15-64 years) who reported sexual
debut before the age of 15 years, the estimated HIV prevalence was 6.8% (7.6% for women and 2.6% for males).
• Among sexually active adults, 15.9% (18.5% of men and 13.0% of women) reported having sex with a non-marital or non-cohabitating partner in the 12 months preceding the survey, of whom 37.6% reported using a condom during their last sexual intercourse with such a non-marital or non-cohabitating partner.
• Among sexually active young people (ages 15-24 years), 36.6% (57.2% of older adolescent boys and young men and 23.0% of older adolescent girls and young women) reported having sex with a non-marital, non-cohabitating partner as compared to 4.5% (4.4% of men and 4.6% of women) of older adults aged 50-64 years.
KEY FINDINGS
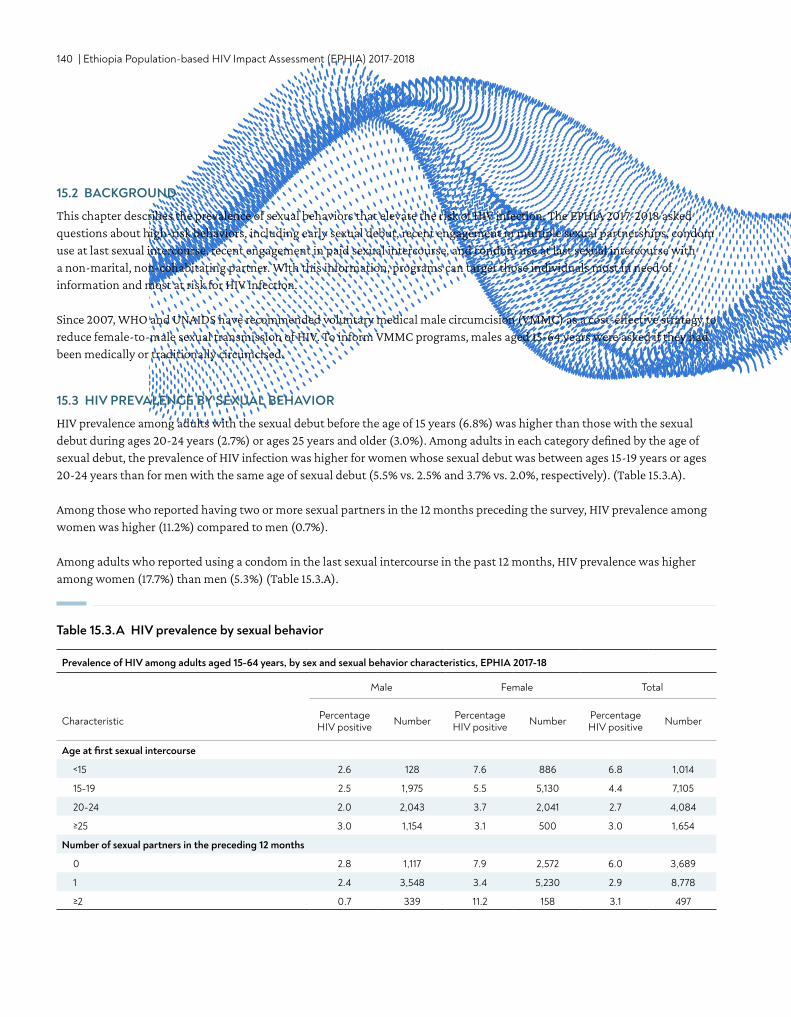
140 | Ethiopia Population-based HIV Impact Assessment (EPHIA) 2017-2018
15.2 BACKGROUND
This chapter describes the prevalence of sexual behaviors that elevate the risk of HIV infection. The EPHIA 2017-2018 asked questions about high-risk behaviors, including early sexual debut, recent engagement in multiple sexual partnerships, condom use at last sexual intercourse, recent engagement in paid sexual intercourse, and condom use at last sexual intercourse with a non-marital, non-cohabitating partner. With this information, programs can target those individuals most in need of information and most at risk for HIV infection.
Since 2007, WHO and UNAIDS have recommended voluntary medical male circumcision (VMMC) as a cost-effective strategy to reduce female-to-male sexual transmission of HIV. To inform VMMC programs, males aged 15-64 years were asked if they had been medically or traditionally circumcised.
15.3 HIV PREVALENCE BY SEXUAL BEHAVIOR
HIV prevalence among adults with the sexual debut before the age of 15 years (6.8%) was higher than those with the sexual debut during ages 20-24 years (2.7%) or ages 25 years and older (3.0%). Among adults in each category defined by the age of sexual debut, the prevalence of HIV infection was higher for women whose sexual debut was between ages 15-19 years or ages 20-24 years than for men with the same age of sexual debut (5.5% vs. 2.5% and 3.7% vs. 2.0%, respectively). (Table 15.3.A).
Among those who reported having two or more sexual partners in the 12 months preceding the survey, HIV prevalence among women was higher (11.2%) compared to men (0.7%).
Among adults who reported using a condom in the last sexual intercourse in the past 12 months, HIV prevalence was higher among women (17.7%) than men (5.3%) (Table 15.3.A).
Table 15.3.A HIV prevalence by sexual behavior
Prevalence of HIV among adults aged 15-64 years, by sex and sexual behavior characteristics, EPHIA 2017-18
Male Female Total
Characteristic Percentage HIV positive Number Percentage
HIV positive Number Percentage HIV positive Number
Age at first sexual intercourse
<15 2.6 128 7.6 886 6.8 1,014
15-19 2.5 1,975 5.5 5,130 4.4 7,105
20-24 2.0 2,043 3.7 2,041 2.7 4,084
≥25 3.0 1,154 3.1 500 3.0 1,654
Number of sexual partners in the preceding 12 months
0 2.8 1,117 7.9 2,572 6.0 3,689
1 2.4 3,548 3.4 5,230 2.9 8,778
≥2 0.7 339 11.2 158 3.1 497
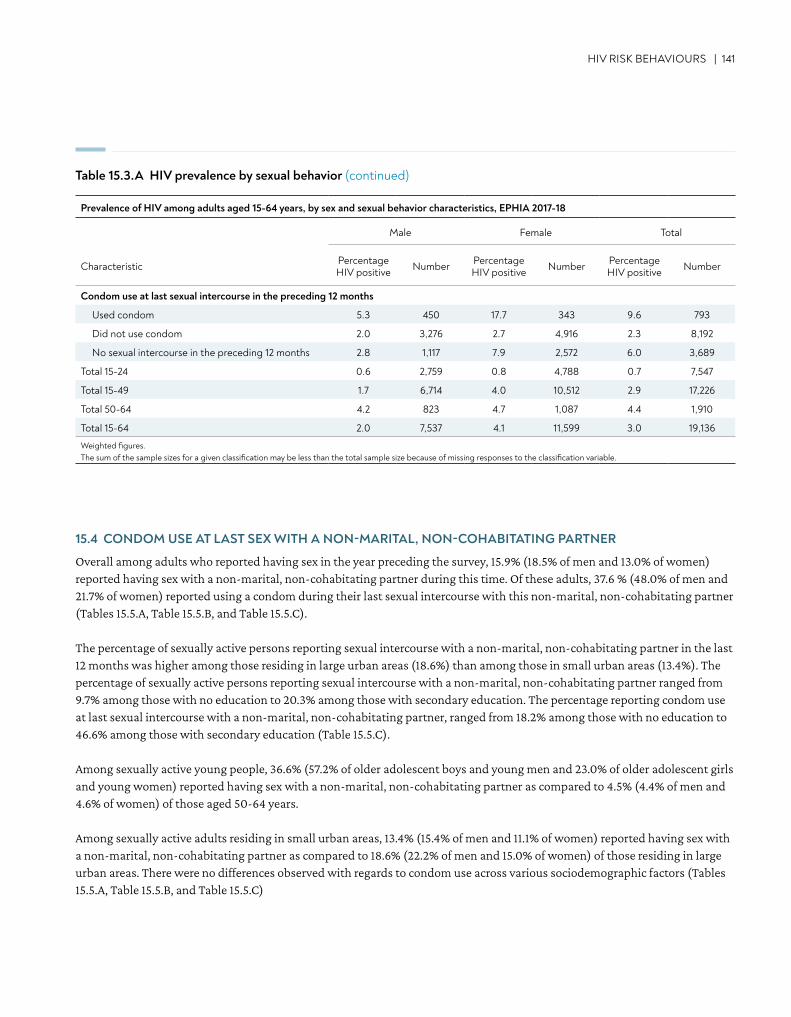
HIV RISK BEHAVIOURS | 141
Condom use at last sexual intercourse in the preceding 12 months
Used condom 5.3 450 17.7 343 9.6 793
Did not use condom 2.0 3,276 2.7 4,916 2.3 8,192
No sexual intercourse in the preceding 12 months 2.8 1,117 7.9 2,572 6.0 3,689
Total 15-24 0.6 2,759 0.8 4,788 0.7 7,547
Total 15-49 1.7 6,714 4.0 10,512 2.9 17,226
Total 50-64 4.2 823 4.7 1,087 4.4 1,910
Total 15-64 2.0 7,537 4.1 11,599 3.0 19,136
Weighted figures. The sum of the sample sizes for a given classification may be less than the total sample size because of missing responses to the classification variable.
Table 15.3.A HIV prevalence by sexual behavior (continued)
15.4 CONDOM USE AT LAST SEX WITH A NON-MARITAL, NON-COHABITATING PARTNER
Overall among adults who reported having sex in the year preceding the survey, 15.9% (18.5% of men and 13.0% of women) reported having sex with a non-marital, non-cohabitating partner during this time. Of these adults, 37.6 % (48.0% of men and 21.7% of women) reported using a condom during their last sexual intercourse with this non-marital, non-cohabitating partner (Tables 15.5.A, Table 15.5.B, and Table 15.5.C).
The percentage of sexually active persons reporting sexual intercourse with a non-marital, non-cohabitating partner in the last 12 months was higher among those residing in large urban areas (18.6%) than among those in small urban areas (13.4%). The percentage of sexually active persons reporting sexual intercourse with a non-marital, non-cohabitating partner ranged from 9.7% among those with no education to 20.3% among those with secondary education. The percentage reporting condom use at last sexual intercourse with a non-marital, non-cohabitating partner, ranged from 18.2% among those with no education to 46.6% among those with secondary education (Table 15.5.C).
Among sexually active young people, 36.6% (57.2% of older adolescent boys and young men and 23.0% of older adolescent girls and young women) reported having sex with a non-marital, non-cohabitating partner as compared to 4.5% (4.4% of men and 4.6% of women) of those aged 50-64 years.
Among sexually active adults residing in small urban areas, 13.4% (15.4% of men and 11.1% of women) reported having sex with a non-marital, non-cohabitating partner as compared to 18.6% (22.2% of men and 15.0% of women) of those residing in large urban areas. There were no differences observed with regards to condom use across various sociodemographic factors (Tables 15.5.A, Table 15.5.B, and Table 15.5.C)
Prevalence of HIV among adults aged 15-64 years, by sex and sexual behavior characteristics, EPHIA 2017-18
Male Female Total
Characteristic Percentage HIV positive Number Percentage
HIV positive Number Percentage HIV positive Number
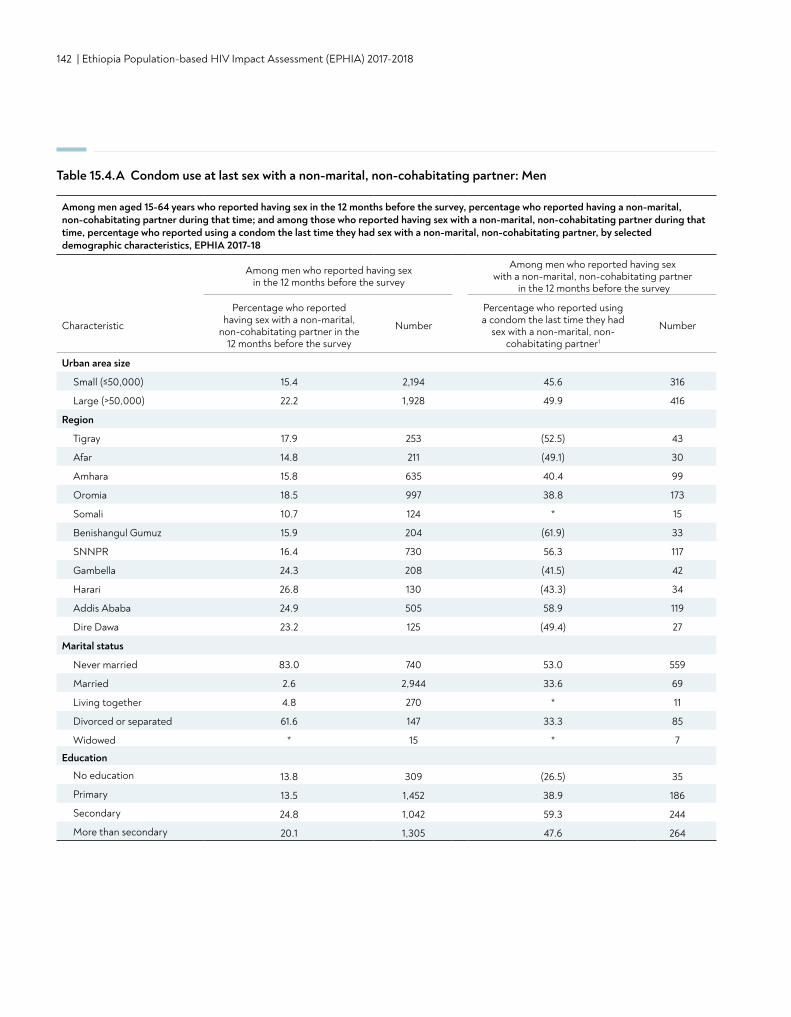
142 | Ethiopia Population-based HIV Impact Assessment (EPHIA) 2017-2018
Table 15.4.A Condom use at last sex with a non-marital, non-cohabitating partner: Men
Among men aged 15-64 years who reported having sex in the 12 months before the survey, percentage who reported having a non-marital, non-cohabitating partner during that time; and among those who reported having sex with a non-marital, non-cohabitating partner during that time, percentage who reported using a condom the last time they had sex with a non-marital, non-cohabitating partner, by selected demographic characteristics, EPHIA 2017-18
Among men who reported having sex in the 12 months before the survey
Among men who reported having sex with a non-marital, non-cohabitating partner
in the 12 months before the survey
Characteristic
Percentage who reported having sex with a non-marital,
non-cohabitating partner in the 12 months before the survey
Number
Percentage who reported using a condom the last time they had
sex with a non-marital, non- cohabitating partner1
Number
Urban area size
Small (≤50,000) 15.4 2,194 45.6 316
Large (>50,000) 22.2 1,928 49.9 416
Region
Tigray 17.9 253 (52.5) 43
Afar 14.8 211 (49.1) 30
Amhara 15.8 635 40.4 99
Oromia 18.5 997 38.8 173
Somali 10.7 124 * 15
Benishangul Gumuz 15.9 204 (61.9) 33
SNNPR 16.4 730 56.3 117
Gambella 24.3 208 (41.5) 42
Harari 26.8 130 (43.3) 34
Addis Ababa 24.9 505 58.9 119
Dire Dawa 23.2 125 (49.4) 27
Marital status
Never married 83.0 740 53.0 559
Married 2.6 2,944 33.6 69
Living together 4.8 270 * 11
Divorced or separated 61.6 147 33.3 85
Widowed * 15 * 7
Education
No education 13.8 309 (26.5) 35
Primary 13.5 1,452 38.9 186
Secondary 24.8 1,042 59.3 244
More than secondary 20.1 1,305 47.6 264
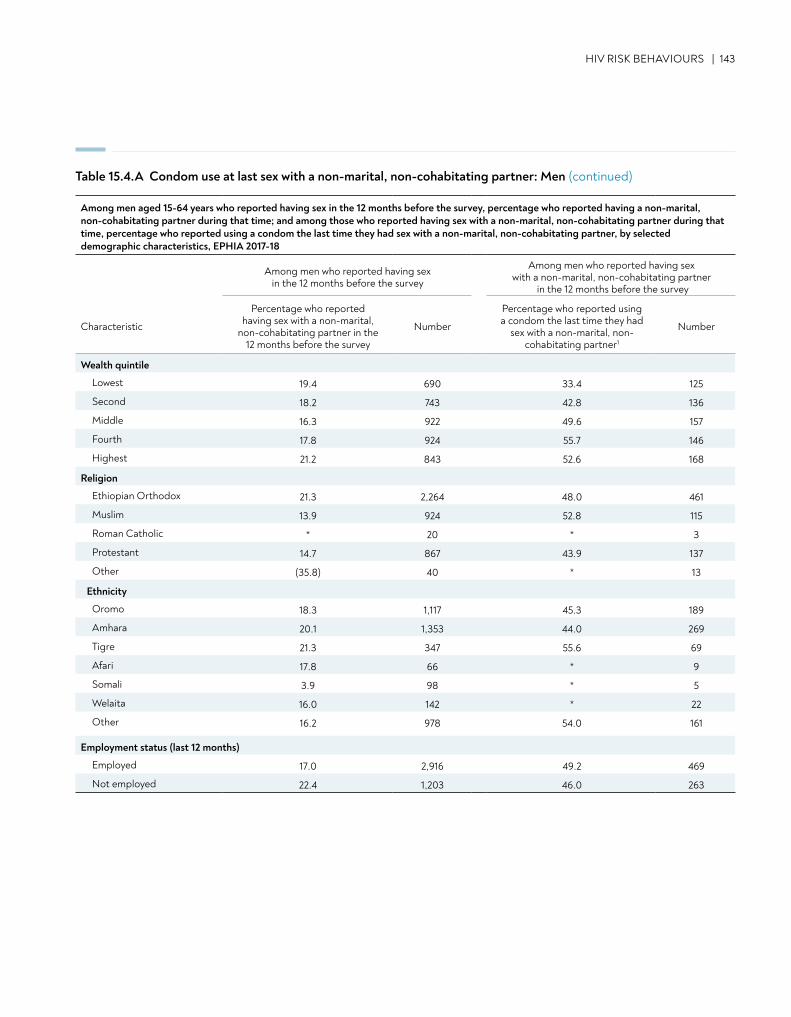
HIV RISK BEHAVIOURS | 143
Table 15.4.A Condom use at last sex with a non-marital, non-cohabitating partner: Men (continued)
Wealth quintile
Lowest 19.4 690 33.4 125
Second 18.2 743 42.8 136
Middle 16.3 922 49.6 157
Fourth 17.8 924 55.7 146
Highest 21.2 843 52.6 168
Religion
Ethiopian Orthodox 21.3 2,264 48.0 461
Muslim 13.9 924 52.8 115
Roman Catholic * 20 * 3
Protestant 14.7 867 43.9 137
Other (35.8) 40 * 13
Ethnicity
Oromo 18.3 1,117 45.3 189
Amhara 20.1 1,353 44.0 269
Tigre 21.3 347 55.6 69
Afari 17.8 66 * 9
Somali 3.9 98 * 5
Welaita 16.0 142 * 22
Other 16.2 978 54.0 161
Employment status (last 12 months)
Employed 17.0 2,916 49.2 469
Not employed 22.4 1,203 46.0 263
Among men aged 15-64 years who reported having sex in the 12 months before the survey, percentage who reported having a non-marital, non-cohabitating partner during that time; and among those who reported having sex with a non-marital, non-cohabitating partner during that time, percentage who reported using a condom the last time they had sex with a non-marital, non-cohabitating partner, by selected demographic characteristics, EPHIA 2017-18
Among men who reported having sex in the 12 months before the survey
Among men who reported having sex with a non-marital, non-cohabitating partner
in the 12 months before the survey
Characteristic
Percentage who reported having sex with a non-marital,
non-cohabitating partner in the 12 months before the survey
Number
Percentage who reported using a condom the last time they had
sex with a non-marital, non- cohabitating partner1
Number
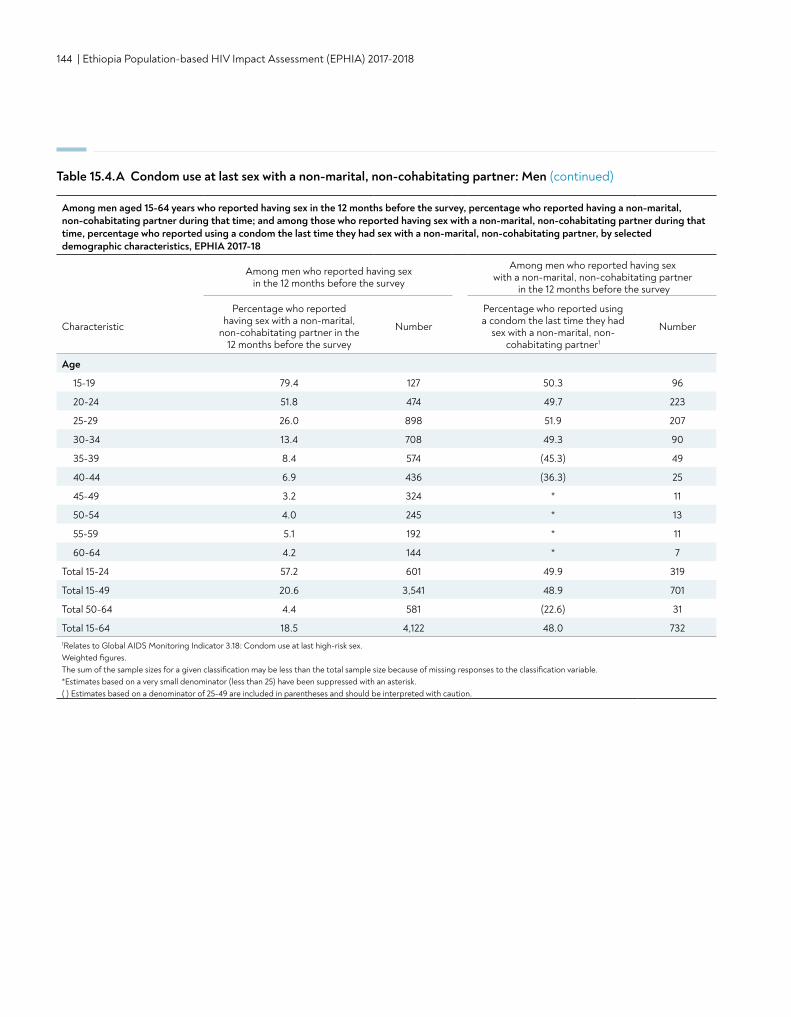
144 | Ethiopia Population-based HIV Impact Assessment (EPHIA) 2017-2018
Table 15.4.A Condom use at last sex with a non-marital, non-cohabitating partner: Men (continued)
Age
15-19 79.4 127 50.3 96
20-24 51.8 474 49.7 223
25-29 26.0 898 51.9 207
30-34 13.4 708 49.3 90
35-39 8.4 574 (45.3) 49
40-44 6.9 436 (36.3) 25
45-49 3.2 324 * 11
50-54 4.0 245 * 13
55-59 5.1 192 * 11
60-64 4.2 144 * 7
Total 15-24 57.2 601 49.9 319
Total 15-49 20.6 3,541 48.9 701
Total 50-64 4.4 581 (22.6) 31
Total 15-64 18.5 4,122 48.0 7321Relates to Global AIDS Monitoring Indicator 3.18: Condom use at last high-risk sex. Weighted figures. The sum of the sample sizes for a given classification may be less than the total sample size because of missing responses to the classification variable.*Estimates based on a very small denominator (less than 25) have been suppressed with an asterisk. ( ) Estimates based on a denominator of 25-49 are included in parentheses and should be interpreted with caution.
Among men aged 15-64 years who reported having sex in the 12 months before the survey, percentage who reported having a non-marital, non-cohabitating partner during that time; and among those who reported having sex with a non-marital, non-cohabitating partner during that time, percentage who reported using a condom the last time they had sex with a non-marital, non-cohabitating partner, by selected demographic characteristics, EPHIA 2017-18
Among men who reported having sex in the 12 months before the survey
Among men who reported having sex with a non-marital, non-cohabitating partner
in the 12 months before the survey
Characteristic
Percentage who reported having sex with a non-marital,
non-cohabitating partner in the 12 months before the survey
Number
Percentage who reported using a condom the last time they had
sex with a non-marital, non- cohabitating partner1
Number
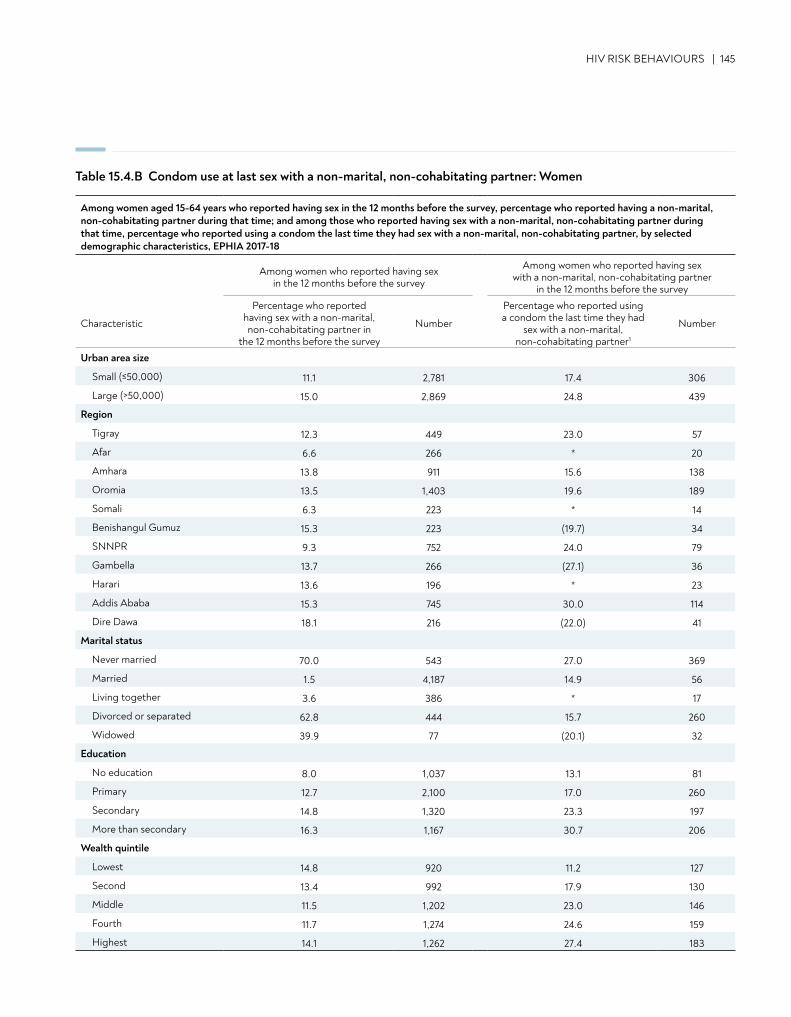
HIV RISK BEHAVIOURS | 145
Table 15.4.B Condom use at last sex with a non-marital, non-cohabitating partner: Women
Among women aged 15-64 years who reported having sex in the 12 months before the survey, percentage who reported having a non-marital, non-cohabitating partner during that time; and among those who reported having sex with a non-marital, non-cohabitating partner during that time, percentage who reported using a condom the last time they had sex with a non-marital, non-cohabitating partner, by selected demographic characteristics, EPHIA 2017-18
Among women who reported having sex in the 12 months before the survey
Among women who reported having sex with a non-marital, non-cohabitating partner
in the 12 months before the survey
Characteristic
Percentage who reported having sex with a non-marital, non-cohabitating partner in
the 12 months before the survey
Number
Percentage who reported using a condom the last time they had
sex with a non-marital, non-cohabitating partner1
Number
Urban area size
Small (≤50,000) 11.1 2,781 17.4 306
Large (>50,000) 15.0 2,869 24.8 439
Region
Tigray 12.3 449 23.0 57
Afar 6.6 266 * 20
Amhara 13.8 911 15.6 138
Oromia 13.5 1,403 19.6 189
Somali 6.3 223 * 14
Benishangul Gumuz 15.3 223 (19.7) 34
SNNPR 9.3 752 24.0 79
Gambella 13.7 266 (27.1) 36
Harari 13.6 196 * 23
Addis Ababa 15.3 745 30.0 114
Dire Dawa 18.1 216 (22.0) 41
Marital status
Never married 70.0 543 27.0 369
Married 1.5 4,187 14.9 56
Living together 3.6 386 * 17
Divorced or separated 62.8 444 15.7 260
Widowed 39.9 77 (20.1) 32
Education
No education 8.0 1,037 13.1 81
Primary 12.7 2,100 17.0 260
Secondary 14.8 1,320 23.3 197
More than secondary 16.3 1,167 30.7 206
Wealth quintile
Lowest 14.8 920 11.2 127
Second 13.4 992 17.9 130
Middle 11.5 1,202 23.0 146
Fourth 11.7 1,274 24.6 159
Highest 14.1 1,262 27.4 183
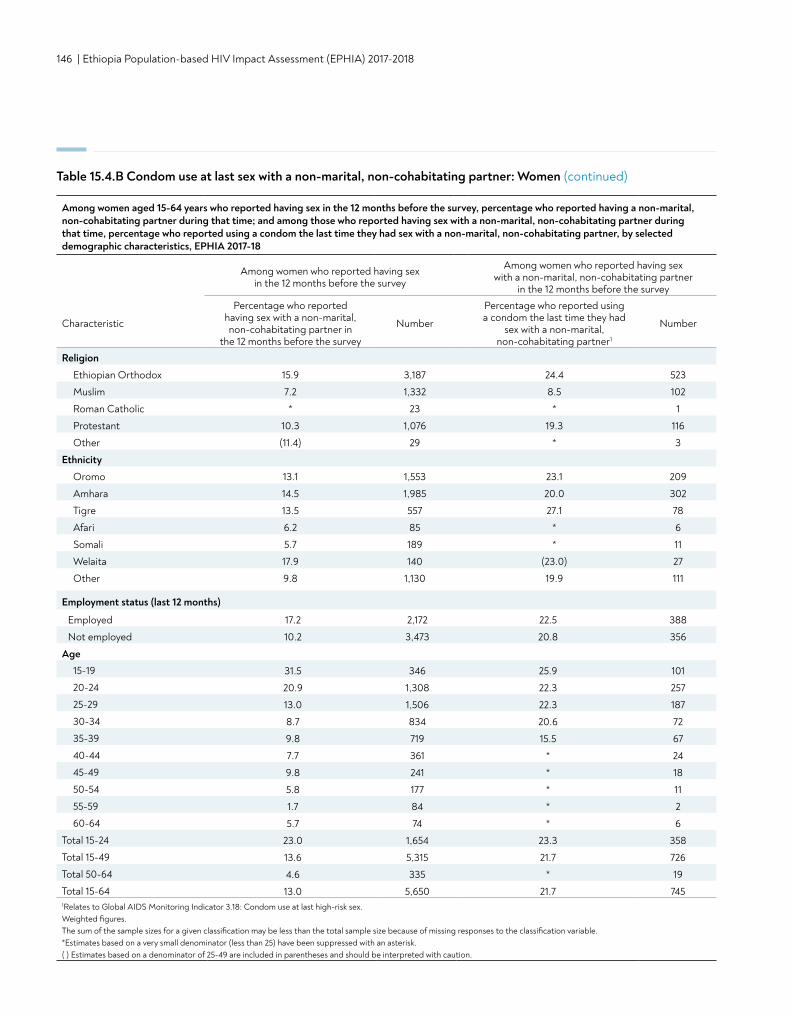
146 | Ethiopia Population-based HIV Impact Assessment (EPHIA) 2017-2018
Religion
Ethiopian Orthodox 15.9 3,187 24.4 523
Muslim 7.2 1,332 8.5 102
Roman Catholic * 23 * 1
Protestant 10.3 1,076 19.3 116
Other (11.4) 29 * 3
Ethnicity
Oromo 13.1 1,553 23.1 209
Amhara 14.5 1,985 20.0 302
Tigre 13.5 557 27.1 78
Afari 6.2 85 * 6
Somali 5.7 189 * 11
Welaita 17.9 140 (23.0) 27
Other 9.8 1,130 19.9 111
Employment status (last 12 months)
Employed 17.2 2,172 22.5 388
Not employed 10.2 3,473 20.8 356
Age15-19 31.5 346 25.9 101
20-24 20.9 1,308 22.3 257
25-29 13.0 1,506 22.3 187
30-34 8.7 834 20.6 72
35-39 9.8 719 15.5 67
40-44 7.7 361 * 24
45-49 9.8 241 * 18
50-54 5.8 177 * 11
55-59 1.7 84 * 2
60-64 5.7 74 * 6
Total 15-24 23.0 1,654 23.3 358
Total 15-49 13.6 5,315 21.7 726
Total 50-64 4.6 335 * 19
Total 15-64 13.0 5,650 21.7 7451Relates to Global AIDS Monitoring Indicator 3.18: Condom use at last high-risk sex. Weighted figures. The sum of the sample sizes for a given classification may be less than the total sample size because of missing responses to the classification variable.*Estimates based on a very small denominator (less than 25) have been suppressed with an asterisk. ( ) Estimates based on a denominator of 25-49 are included in parentheses and should be interpreted with caution.
Table 15.4.B Condom use at last sex with a non-marital, non-cohabitating partner: Women (continued)
Among women aged 15-64 years who reported having sex in the 12 months before the survey, percentage who reported having a non-marital, non-cohabitating partner during that time; and among those who reported having sex with a non-marital, non-cohabitating partner during that time, percentage who reported using a condom the last time they had sex with a non-marital, non-cohabitating partner, by selected demographic characteristics, EPHIA 2017-18
Among women who reported having sex in the 12 months before the survey
Among women who reported having sex with a non-marital, non-cohabitating partner
in the 12 months before the survey
Characteristic
Percentage who reported having sex with a non-marital, non-cohabitating partner in
the 12 months before the survey
Number
Percentage who reported using a condom the last time they had
sex with a non-marital, non-cohabitating partner1
Number
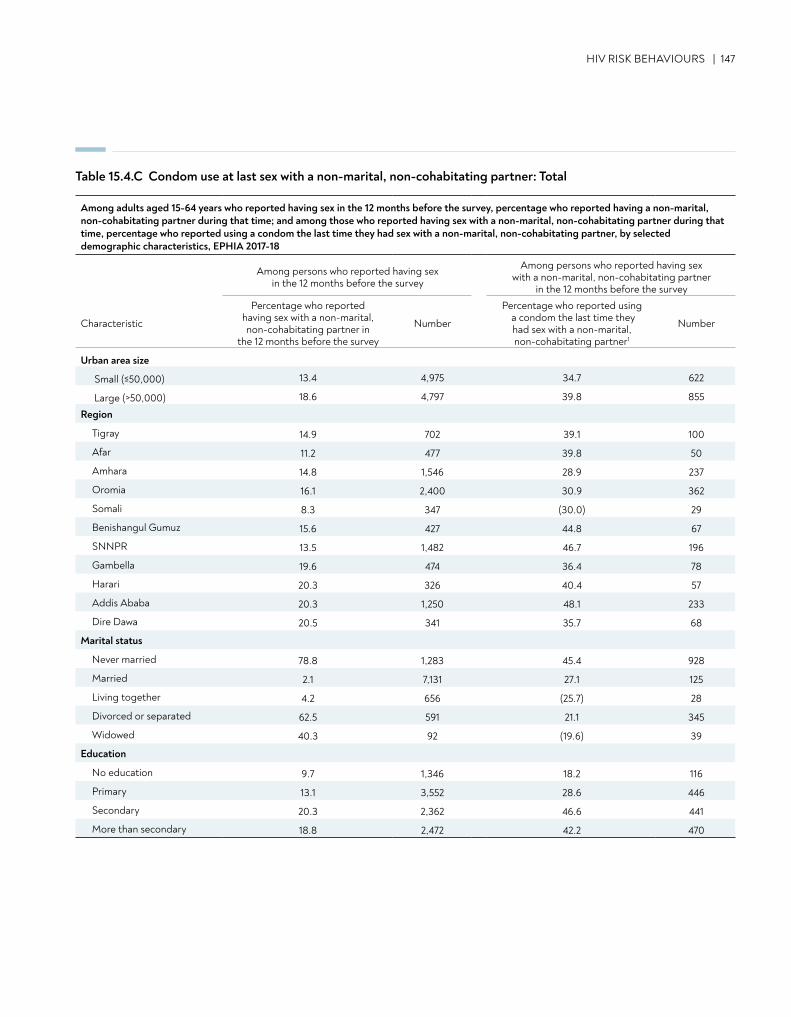
HIV RISK BEHAVIOURS | 147
Table 15.4.C Condom use at last sex with a non-marital, non-cohabitating partner: Total
Among adults aged 15-64 years who reported having sex in the 12 months before the survey, percentage who reported having a non-marital, non-cohabitating partner during that time; and among those who reported having sex with a non-marital, non-cohabitating partner during that time, percentage who reported using a condom the last time they had sex with a non-marital, non-cohabitating partner, by selected demographic characteristics, EPHIA 2017-18
Among persons who reported having sex in the 12 months before the survey
Among persons who reported having sex with a non-marital, non-cohabitating partner
in the 12 months before the survey
Characteristic
Percentage who reported having sex with a non-marital, non-cohabitating partner in
the 12 months before the survey
Number
Percentage who reported using a condom the last time they had sex with a non-marital, non-cohabitating partner1
Number
Urban area size
Small (≤50,000) 13.4 4,975 34.7 622
Large (>50,000) 18.6 4,797 39.8 855
Region
Tigray 14.9 702 39.1 100
Afar 11.2 477 39.8 50
Amhara 14.8 1,546 28.9 237
Oromia 16.1 2,400 30.9 362
Somali 8.3 347 (30.0) 29
Benishangul Gumuz 15.6 427 44.8 67
SNNPR 13.5 1,482 46.7 196
Gambella 19.6 474 36.4 78
Harari 20.3 326 40.4 57
Addis Ababa 20.3 1,250 48.1 233
Dire Dawa 20.5 341 35.7 68
Marital status
Never married 78.8 1,283 45.4 928
Married 2.1 7,131 27.1 125
Living together 4.2 656 (25.7) 28
Divorced or separated 62.5 591 21.1 345
Widowed 40.3 92 (19.6) 39
Education
No education 9.7 1,346 18.2 116
Primary 13.1 3,552 28.6 446
Secondary 20.3 2,362 46.6 441
More than secondary 18.8 2,472 42.2 470
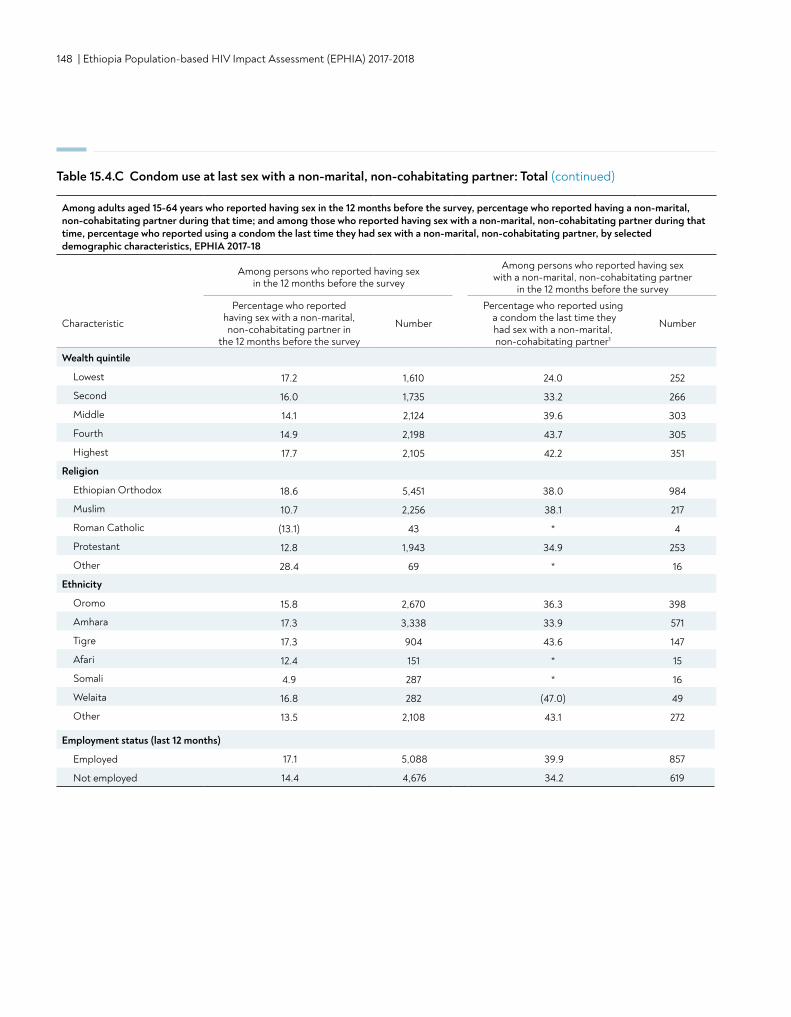
148 | Ethiopia Population-based HIV Impact Assessment (EPHIA) 2017-2018
Wealth quintile
Lowest 17.2 1,610 24.0 252
Second 16.0 1,735 33.2 266
Middle 14.1 2,124 39.6 303
Fourth 14.9 2,198 43.7 305
Highest 17.7 2,105 42.2 351
Religion
Ethiopian Orthodox 18.6 5,451 38.0 984
Muslim 10.7 2,256 38.1 217
Roman Catholic (13.1) 43 * 4
Protestant 12.8 1,943 34.9 253
Other 28.4 69 * 16
Ethnicity
Oromo 15.8 2,670 36.3 398
Amhara 17.3 3,338 33.9 571
Tigre 17.3 904 43.6 147
Afari 12.4 151 * 15
Somali 4.9 287 * 16
Welaita 16.8 282 (47.0) 49
Other 13.5 2,108 43.1 272
Employment status (last 12 months)
Employed 17.1 5,088 39.9 857
Not employed 14.4 4,676 34.2 619
Table 15.4.C Condom use at last sex with a non-marital, non-cohabitating partner: Total (continued)
Among adults aged 15-64 years who reported having sex in the 12 months before the survey, percentage who reported having a non-marital, non-cohabitating partner during that time; and among those who reported having sex with a non-marital, non-cohabitating partner during that time, percentage who reported using a condom the last time they had sex with a non-marital, non-cohabitating partner, by selected demographic characteristics, EPHIA 2017-18
Among persons who reported having sex in the 12 months before the survey
Among persons who reported having sex with a non-marital, non-cohabitating partner
in the 12 months before the survey
Characteristic
Percentage who reported having sex with a non-marital, non-cohabitating partner in
the 12 months before the survey
Number
Percentage who reported using a condom the last time they had sex with a non-marital, non-cohabitating partner1
Number
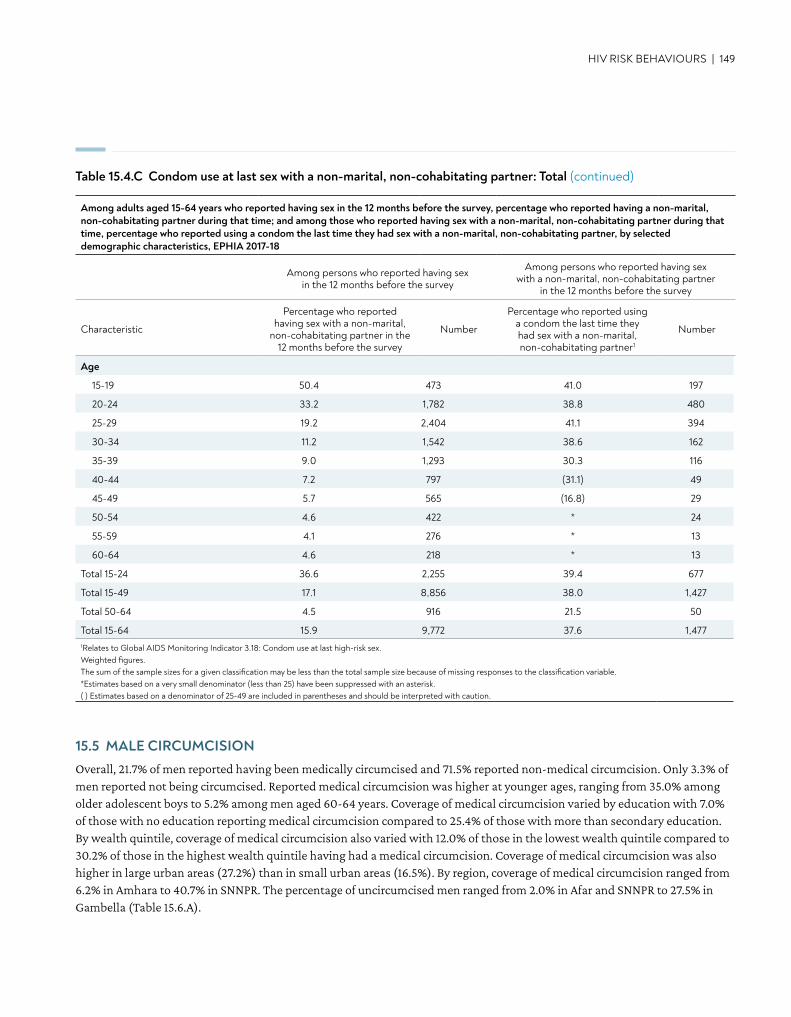
Age
15-19 50.4 473 41.0 197
20-24 33.2 1,782 38.8 480
25-29 19.2 2,404 41.1 394
30-34 11.2 1,542 38.6 162
35-39 9.0 1,293 30.3 116
40-44 7.2 797 (31.1) 49
45-49 5.7 565 (16.8) 29
50-54 4.6 422 * 24
55-59 4.1 276 * 13
60-64 4.6 218 * 13
Total 15-24 36.6 2,255 39.4 677
Total 15-49 17.1 8,856 38.0 1,427
Total 50-64 4.5 916 21.5 50
Total 15-64 15.9 9,772 37.6 1,4771Relates to Global AIDS Monitoring Indicator 3.18: Condom use at last high-risk sex. Weighted figures. The sum of the sample sizes for a given classification may be less than the total sample size because of missing responses to the classification variable.*Estimates based on a very small denominator (less than 25) have been suppressed with an asterisk. ( ) Estimates based on a denominator of 25-49 are included in parentheses and should be interpreted with caution.
HIV RISK BEHAVIOURS | 149
Table 15.4.C Condom use at last sex with a non-marital, non-cohabitating partner: Total (continued)
Among adults aged 15-64 years who reported having sex in the 12 months before the survey, percentage who reported having a non-marital, non-cohabitating partner during that time; and among those who reported having sex with a non-marital, non-cohabitating partner during that time, percentage who reported using a condom the last time they had sex with a non-marital, non-cohabitating partner, by selected demographic characteristics, EPHIA 2017-18
Among persons who reported having sex in the 12 months before the survey
Among persons who reported having sex with a non-marital, non-cohabitating partner
in the 12 months before the survey
Characteristic
Percentage who reported having sex with a non-marital,
non-cohabitating partner in the 12 months before the survey
Number
Percentage who reported using a condom the last time they had sex with a non-marital, non-cohabitating partner1
Number
15.5 MALE CIRCUMCISIONOverall, 21.7% of men reported having been medically circumcised and 71.5% reported non-medical circumcision. Only 3.3% of men reported not being circumcised. Reported medical circumcision was higher at younger ages, ranging from 35.0% among older adolescent boys to 5.2% among men aged 60-64 years. Coverage of medical circumcision varied by education with 7.0% of those with no education reporting medical circumcision compared to 25.4% of those with more than secondary education. By wealth quintile, coverage of medical circumcision also varied with 12.0% of those in the lowest wealth quintile compared to 30.2% of those in the highest wealth quintile having had a medical circumcision. Coverage of medical circumcision was also higher in large urban areas (27.2%) than in small urban areas (16.5%). By region, coverage of medical circumcision ranged from 6.2% in Amhara to 40.7% in SNNPR. The percentage of uncircumcised men ranged from 2.0% in Afar and SNNPR to 27.5% in Gambella (Table 15.6.A).
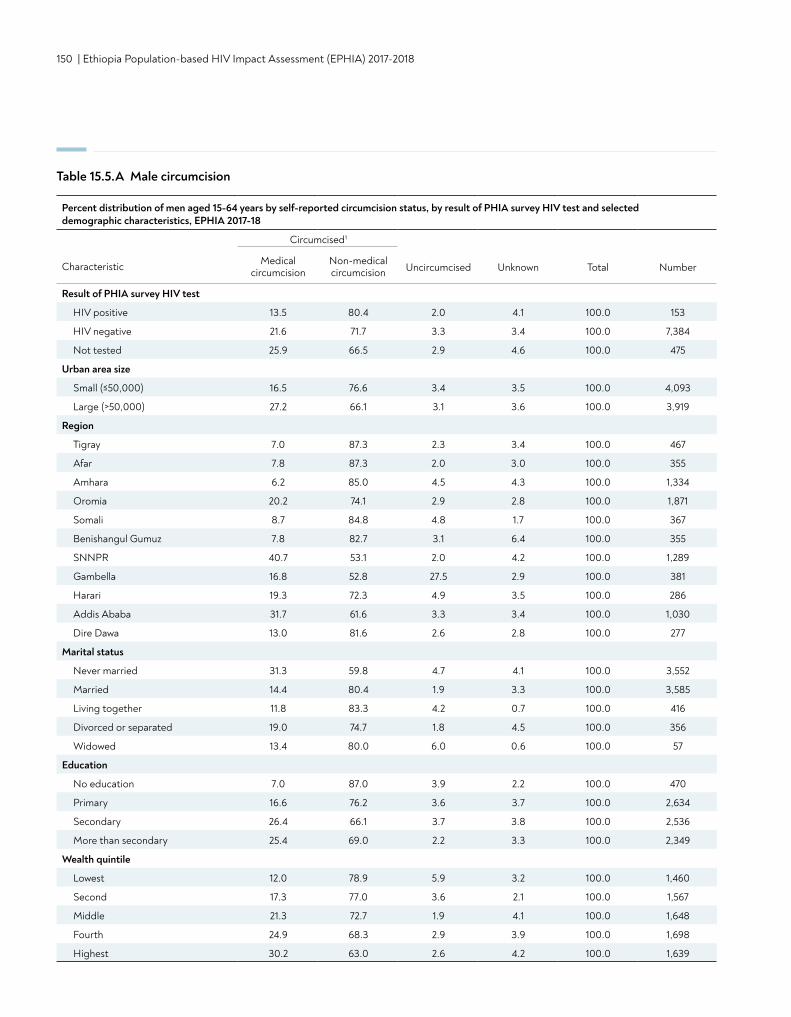
150 | Ethiopia Population-based HIV Impact Assessment (EPHIA) 2017-2018
Table 15.5.A Male circumcision
Percent distribution of men aged 15-64 years by self-reported circumcision status, by result of PHIA survey HIV test and selected demographic characteristics, EPHIA 2017-18
Circumcised1
Uncircumcised Unknown Total NumberCharacteristic Medical circumcision
Non-medical circumcision
Result of PHIA survey HIV test
HIV positive 13.5 80.4 2.0 4.1 100.0 153
HIV negative 21.6 71.7 3.3 3.4 100.0 7,384
Not tested 25.9 66.5 2.9 4.6 100.0 475
Urban area size
Small (≤50,000) 16.5 76.6 3.4 3.5 100.0 4,093
Large (>50,000) 27.2 66.1 3.1 3.6 100.0 3,919
Region
Tigray 7.0 87.3 2.3 3.4 100.0 467
Afar 7.8 87.3 2.0 3.0 100.0 355
Amhara 6.2 85.0 4.5 4.3 100.0 1,334
Oromia 20.2 74.1 2.9 2.8 100.0 1,871
Somali 8.7 84.8 4.8 1.7 100.0 367
Benishangul Gumuz 7.8 82.7 3.1 6.4 100.0 355
SNNPR 40.7 53.1 2.0 4.2 100.0 1,289
Gambella 16.8 52.8 27.5 2.9 100.0 381
Harari 19.3 72.3 4.9 3.5 100.0 286
Addis Ababa 31.7 61.6 3.3 3.4 100.0 1,030
Dire Dawa 13.0 81.6 2.6 2.8 100.0 277
Marital status
Never married 31.3 59.8 4.7 4.1 100.0 3,552
Married 14.4 80.4 1.9 3.3 100.0 3,585
Living together 11.8 83.3 4.2 0.7 100.0 416
Divorced or separated 19.0 74.7 1.8 4.5 100.0 356
Widowed 13.4 80.0 6.0 0.6 100.0 57
Education
No education 7.0 87.0 3.9 2.2 100.0 470
Primary 16.6 76.2 3.6 3.7 100.0 2,634
Secondary 26.4 66.1 3.7 3.8 100.0 2,536
More than secondary 25.4 69.0 2.2 3.3 100.0 2,349
Wealth quintile
Lowest 12.0 78.9 5.9 3.2 100.0 1,460
Second 17.3 77.0 3.6 2.1 100.0 1,567
Middle 21.3 72.7 1.9 4.1 100.0 1,648
Fourth 24.9 68.3 2.9 3.9 100.0 1,698
Highest 30.2 63.0 2.6 4.2 100.0 1,639
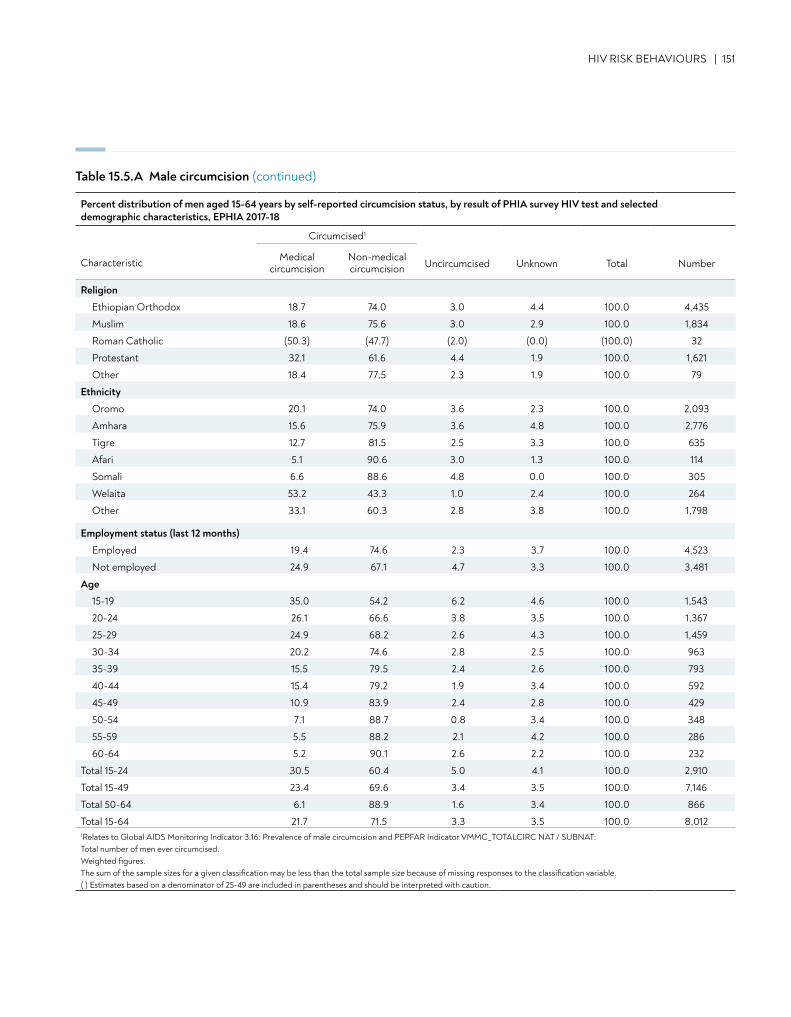
Religion
Ethiopian Orthodox 18.7 74.0 3.0 4.4 100.0 4,435
Muslim 18.6 75.6 3.0 2.9 100.0 1,834
Roman Catholic (50.3) (47.7) (2.0) (0.0) (100.0) 32
Protestant 32.1 61.6 4.4 1.9 100.0 1,621
Other 18.4 77.5 2.3 1.9 100.0 79
Ethnicity
Oromo 20.1 74.0 3.6 2.3 100.0 2,093
Amhara 15.6 75.9 3.6 4.8 100.0 2,776
Tigre 12.7 81.5 2.5 3.3 100.0 635
Afari 5.1 90.6 3.0 1.3 100.0 114
Somali 6.6 88.6 4.8 0.0 100.0 305
Welaita 53.2 43.3 1.0 2.4 100.0 264
Other 33.1 60.3 2.8 3.8 100.0 1,798
Employment status (last 12 months)
Employed 19.4 74.6 2.3 3.7 100.0 4,523
Not employed 24.9 67.1 4.7 3.3 100.0 3,481
Age
15-19 35.0 54.2 6.2 4.6 100.0 1,543
20-24 26.1 66.6 3.8 3.5 100.0 1,367
25-29 24.9 68.2 2.6 4.3 100.0 1,459
30-34 20.2 74.6 2.8 2.5 100.0 963
35-39 15.5 79.5 2.4 2.6 100.0 793
40-44 15.4 79.2 1.9 3.4 100.0 592
45-49 10.9 83.9 2.4 2.8 100.0 429
50-54 7.1 88.7 0.8 3.4 100.0 348
55-59 5.5 88.2 2.1 4.2 100.0 286
60-64 5.2 90.1 2.6 2.2 100.0 232
Total 15-24 30.5 60.4 5.0 4.1 100.0 2,910
Total 15-49 23.4 69.6 3.4 3.5 100.0 7,146
Total 50-64 6.1 88.9 1.6 3.4 100.0 866
Total 15-64 21.7 71.5 3.3 3.5 100.0 8,0121Relates to Global AIDS Monitoring Indicator 3.16: Prevalence of male circumcision and PEPFAR Indicator VMMC_TOTALCIRC NAT / SUBNAT: Total number of men ever circumcised. Weighted figures. The sum of the sample sizes for a given classification may be less than the total sample size because of missing responses to the classification variable.( ) Estimates based on a denominator of 25-49 are included in parentheses and should be interpreted with caution.
HIV RISK BEHAVIOURS | 151
Table 15.5.A Male circumcision (continued)
Percent distribution of men aged 15-64 years by self-reported circumcision status, by result of PHIA survey HIV test and selected demographic characteristics, EPHIA 2017-18
Circumcised1
Uncircumcised Unknown Total NumberCharacteristic Medical circumcision
Non-medical circumcision
152 | Ethiopia Population-based HIV Impact Assessment (EPHIA) 2017-2018
15.6 GAPS AND UNMET NEEDS
• Nearly two thirds of sexually active adults who reported to have sex with a non-marital, non-cohabitating partner in the last 12 months were not using a condom at last sex.
• The proportion of uncircumcised men in Gambella was significantly higher than other regions.
CONTENT | 153
• Based on self-report, 57.0% of adults (ages 15-64 years) in urban Ethiopia who visited a tuberculosis (TB) clinic were tested for HIV during a TB clinic visit; however, 39.6% did not test for HIV during the visit and did not know their HIV status.
• Among adults living with HIV in urban Ethiopia who had ever visited a clinic for TB diagnosis and treatment, 63.3% were diagnosed with TB and of these, 100% were treated for TB.
• Overall, the prevalence of ever having been infected with syphilis was 13.4% among HIV-positive adults (17.4% among men and 11.5% among women). The overall prevalence of active syphilis infection was 2.6% (5.0% among men and 1.4% among women).
• The prevalence of hepatitis B was 4.8% among adults who tested HIV positive (7.4% among men and 3.6% among women).
• For women 15-64 years of age, the prevalence of abnormal vaginal discharge was twice as high in women living with HIV versus those without HIV (6.8% versus 3.5% respectively). In addition, ulcers or sores on or near the vagina were four times as likely to be reported among HIV-positive women than HIV-negative women (6.3% versus 1.3%).
• Among women with HIV aged 30-49 years in urban Ethiopia, the proportion who had been screened for cervical cancer was 18.5% in large urban areas and 12.9% in small urban areas.
KEY FINDINGS
16. TUBERCULOSIS, SYPHILIS, HBV, STI SYMPTOMS, AND CERVICAL CANCER
154 | Ethiopia Population-based HIV Impact Assessment (EPHIA) 2017-2018
16.2 BACKGROUND
People living with HIV are at risk for acquiring other diseases, including TB, hepatitis B, syphilis, and other sexually transmitted infections (STIs). TB is the leading cause of death among people living with HIV in sub-Saharan Africa. A UNAIDS model estimates there were 3,600 TB-related deaths among HIV-positive persons in Ethiopia in 2017.1 This chapter describes the TB clinical care cascade for HIV-positive individuals: received care at a TB clinic, TB diagnoses among those receiving care, and treatment among those diagnosed with TB.
Syphilis is a relatively common STI, and untreated syphilis can result in severe morbidity and death in adults and children. Providing a syphilis diagnosis in a timely manner also allows patients to get treated, thereby reducing morbidity and transmission to sexual partners or vertically to newborn infants. As syphilis has been implicated in increasing transmission and acquisition of HIV, describing syphilis in HIV-positive individuals adds to the understanding of the epidemiology of HIV. This chapter describes syphilis prevalence in adults, by HIV status, age, sex, and sociodemographic characteristics.
HIV and HBV have similar transmission routes and concurrent infection with both viruses often results in more rapid progression of HBV disease to cirrhosis and higher liver disease-related mortality. EPHIA 2017-2018 provided population-based HBV prevalence estimates among HIV-positive individuals, which can support actionable policy recommendations for screening and treatment and may help gauge the impact of national HBV vaccination programs. This chapter describes the prevalence of HBV by region, sex, age, and other sociodemographic characteristics.
Syphilis and Hepatitis B tests were done only among HIV-positive persons. For the description of testing methodologies (see Appendix B).
Women living with HIV are at greater risk of developing cervical cancer because their weakened immune systems are not able to clear human papilloma virus (HPV) infections. WHO recommends HPV screening and treatment for all sexually active HIV-positive women. EPHIA 2017-2018 provides population-based rates of screening not available from routine clinic data, which does not capture women not in care. This chapter presents cervical cancer screening rates by age and socio-demographic characteristics.
16.3 TUBERCULOSIS
Table 16.3.A shows the prevalence of self-reported HIV testing during a clinic visit for TB diagnosis or treatment among adults by knowledge of HIV status and sex. Overall, 57.0 % of adults (53.9% of men and 60.7% of women) tested for HIV during a TB-related clinic visit, and 3.4% did not test because they already knew their HIV status. More than a third (39.6%) of adults (43.5% of men and 34.9% of women) who visited a clinic for TB diagnosis or treatment were not tested for HIV and did not know their HIV status.
Table 16.3.B presents information on the percentage of self-reported HIV-positive adults who visited a TB clinic, were diagnosed with TB, and received treatment. Among these HIV-positive adults, 38.1% had ever visited a TB clinic, with 49.5% of men having ever visited a TB clinic compared to 33.9% of women. Among those who had ever visited a clinic for TB diagnosis, 63.3% were diagnosed with TB (69.0% of men and 60.3% of women). All men and women diagnosed with TB reported to have been treated for TB.
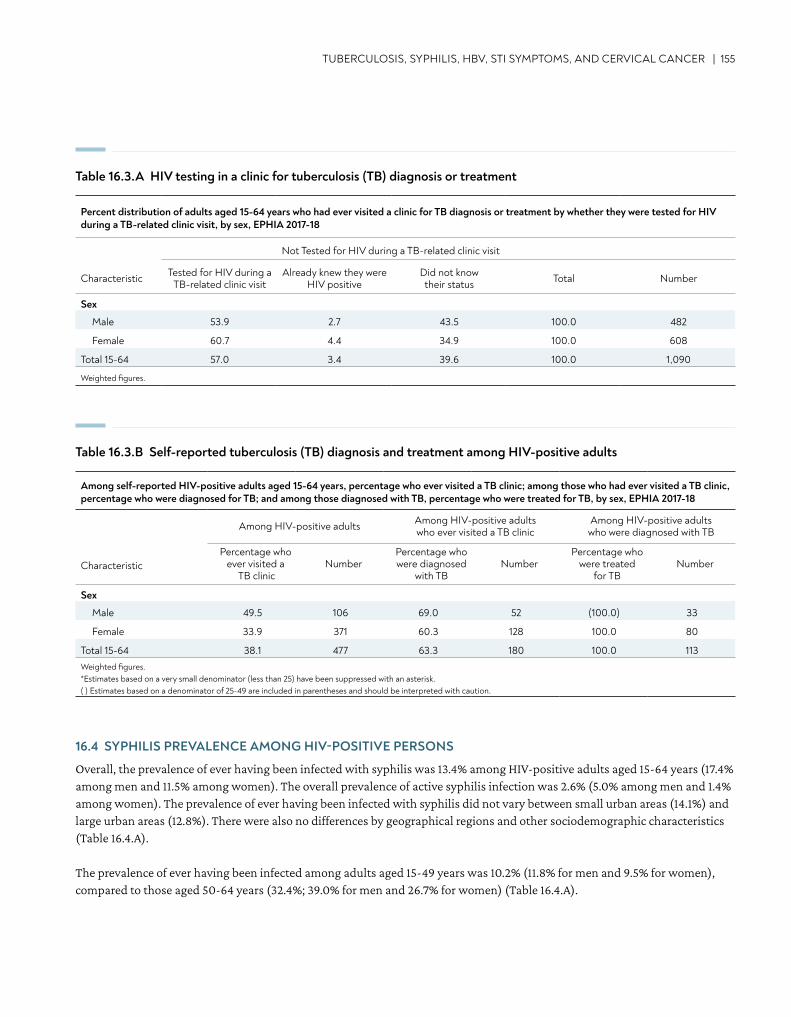
TUBERCULOSIS, SYPHILIS, HBV, STI SYMPTOMS, AND CERVICAL CANCER | 155
Table 16.3.A HIV testing in a clinic for tuberculosis (TB) diagnosis or treatment
Table 16.3.B Self-reported tuberculosis (TB) diagnosis and treatment among HIV-positive adults
Percent distribution of adults aged 15-64 years who had ever visited a clinic for TB diagnosis or treatment by whether they were tested for HIV during a TB-related clinic visit, by sex, EPHIA 2017-18
Not Tested for HIV during a TB-related clinic visit
Characteristic Tested for HIV during a TB-related clinic visit
Already knew they were HIV positive
Did not know their status Total Number
Sex
Male 53.9 2.7 43.5 100.0 482
Female 60.7 4.4 34.9 100.0 608
Total 15-64 57.0 3.4 39.6 100.0 1,090
Weighted figures.
Among self-reported HIV-positive adults aged 15-64 years, percentage who ever visited a TB clinic; among those who had ever visited a TB clinic, percentage who were diagnosed for TB; and among those diagnosed with TB, percentage who were treated for TB, by sex, EPHIA 2017-18
Among HIV-positive adults Among HIV-positive adults who ever visited a TB clinic
Among HIV-positive adults who were diagnosed with TB
CharacteristicPercentage who
ever visited a TB clinic
NumberPercentage who were diagnosed
with TBNumber
Percentage who were treated
for TBNumber
Sex
Male 49.5 106 69.0 52 (100.0) 33
Female 33.9 371 60.3 128 100.0 80
Total 15-64 38.1 477 63.3 180 100.0 113Weighted figures.*Estimates based on a very small denominator (less than 25) have been suppressed with an asterisk. ( ) Estimates based on a denominator of 25-49 are included in parentheses and should be interpreted with caution.
16.4 SYPHILIS PREVALENCE AMONG HIV-POSITIVE PERSONS
Overall, the prevalence of ever having been infected with syphilis was 13.4% among HIV-positive adults aged 15-64 years (17.4% among men and 11.5% among women). The overall prevalence of active syphilis infection was 2.6% (5.0% among men and 1.4% among women). The prevalence of ever having been infected with syphilis did not vary between small urban areas (14.1%) and large urban areas (12.8%). There were also no differences by geographical regions and other sociodemographic characteristics (Table 16.4.A).
The prevalence of ever having been infected among adults aged 15-49 years was 10.2% (11.8% for men and 9.5% for women), compared to those aged 50-64 years (32.4%; 39.0% for men and 26.7% for women) (Table 16.4.A).
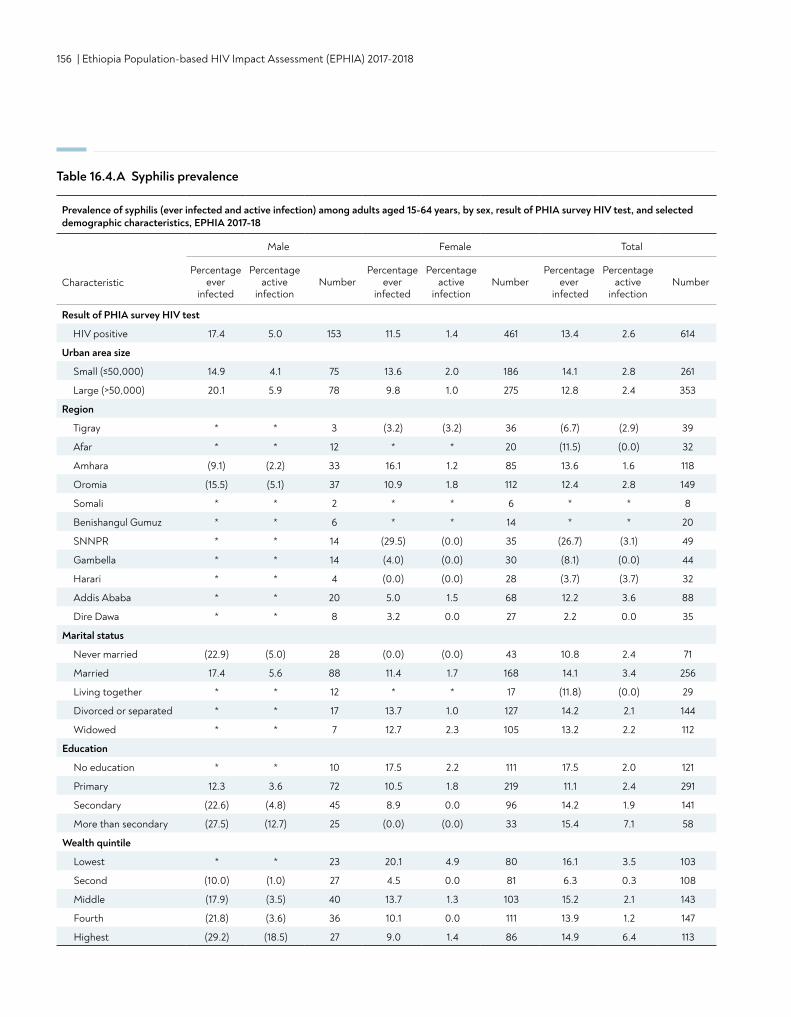
156 | Ethiopia Population-based HIV Impact Assessment (EPHIA) 2017-2018
Table 16.4.A Syphilis prevalence
Prevalence of syphilis (ever infected and active infection) among adults aged 15-64 years, by sex, result of PHIA survey HIV test, and selected demographic characteristics, EPHIA 2017-18
Male Female Total
CharacteristicPercentage
ever infected
Percentage active
infectionNumber
Percentage ever
infected
Percentage active
infectionNumber
Percentage ever
infected
Percentage active
infectionNumber
Result of PHIA survey HIV test
HIV positive 17.4 5.0 153 11.5 1.4 461 13.4 2.6 614
Urban area size
Small (≤50,000) 14.9 4.1 75 13.6 2.0 186 14.1 2.8 261
Large (>50,000) 20.1 5.9 78 9.8 1.0 275 12.8 2.4 353
Region
Tigray * * 3 (3.2) (3.2) 36 (6.7) (2.9) 39
Afar * * 12 * * 20 (11.5) (0.0) 32
Amhara (9.1) (2.2) 33 16.1 1.2 85 13.6 1.6 118
Oromia (15.5) (5.1) 37 10.9 1.8 112 12.4 2.8 149
Somali * * 2 * * 6 * * 8
Benishangul Gumuz * * 6 * * 14 * * 20
SNNPR * * 14 (29.5) (0.0) 35 (26.7) (3.1) 49
Gambella * * 14 (4.0) (0.0) 30 (8.1) (0.0) 44
Harari * * 4 (0.0) (0.0) 28 (3.7) (3.7) 32
Addis Ababa * * 20 5.0 1.5 68 12.2 3.6 88
Dire Dawa * * 8 3.2 0.0 27 2.2 0.0 35
Marital status
Never married (22.9) (5.0) 28 (0.0) (0.0) 43 10.8 2.4 71
Married 17.4 5.6 88 11.4 1.7 168 14.1 3.4 256
Living together * * 12 * * 17 (11.8) (0.0) 29
Divorced or separated * * 17 13.7 1.0 127 14.2 2.1 144
Widowed * * 7 12.7 2.3 105 13.2 2.2 112
Education
No education * * 10 17.5 2.2 111 17.5 2.0 121
Primary 12.3 3.6 72 10.5 1.8 219 11.1 2.4 291
Secondary (22.6) (4.8) 45 8.9 0.0 96 14.2 1.9 141
More than secondary (27.5) (12.7) 25 (0.0) (0.0) 33 15.4 7.1 58
Wealth quintile
Lowest * * 23 20.1 4.9 80 16.1 3.5 103
Second (10.0) (1.0) 27 4.5 0.0 81 6.3 0.3 108
Middle (17.9) (3.5) 40 13.7 1.3 103 15.2 2.1 143
Fourth (21.8) (3.6) 36 10.1 0.0 111 13.9 1.2 147
Highest (29.2) (18.5) 27 9.0 1.4 86 14.9 6.4 113
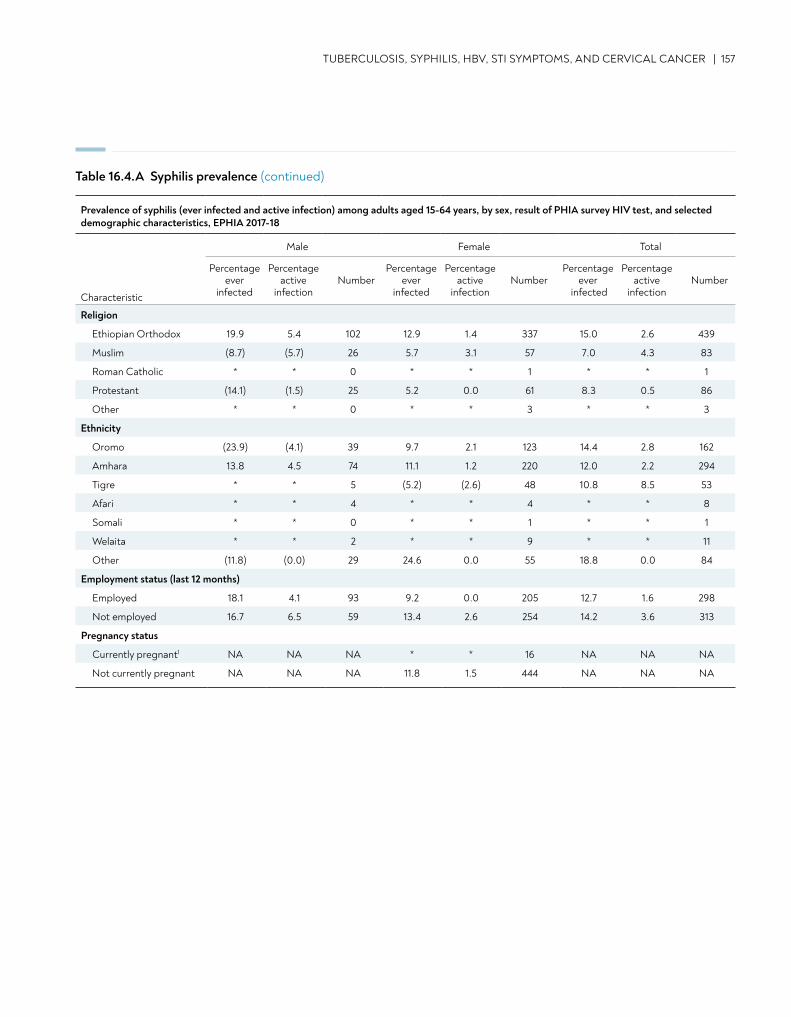
TUBERCULOSIS, SYPHILIS, HBV, STI SYMPTOMS, AND CERVICAL CANCER | 157
Table 16.4.A Syphilis prevalence (continued)
Religion
Ethiopian Orthodox 19.9 5.4 102 12.9 1.4 337 15.0 2.6 439
Muslim (8.7) (5.7) 26 5.7 3.1 57 7.0 4.3 83
Roman Catholic * * 0 * * 1 * * 1
Protestant (14.1) (1.5) 25 5.2 0.0 61 8.3 0.5 86
Other * * 0 * * 3 * * 3
Ethnicity
Oromo (23.9) (4.1) 39 9.7 2.1 123 14.4 2.8 162
Amhara 13.8 4.5 74 11.1 1.2 220 12.0 2.2 294
Tigre * * 5 (5.2) (2.6) 48 10.8 8.5 53
Afari * * 4 * * 4 * * 8
Somali * * 0 * * 1 * * 1
Welaita * * 2 * * 9 * * 11
Other (11.8) (0.0) 29 24.6 0.0 55 18.8 0.0 84
Employment status (last 12 months)
Employed 18.1 4.1 93 9.2 0.0 205 12.7 1.6 298
Not employed 16.7 6.5 59 13.4 2.6 254 14.2 3.6 313
Pregnancy status
Currently pregnant1 NA NA NA * * 16 NA NA NA
Not currently pregnant NA NA NA 11.8 1.5 444 NA NA NA
Prevalence of syphilis (ever infected and active infection) among adults aged 15-64 years, by sex, result of PHIA survey HIV test, and selected demographic characteristics, EPHIA 2017-18
Male Female Total
Characteristic
Percentage ever
infected
Percentage active
infectionNumber
Percentage ever
infected
Percentage active
infectionNumber
Percentage ever
infected
Percentage active
infectionNumber
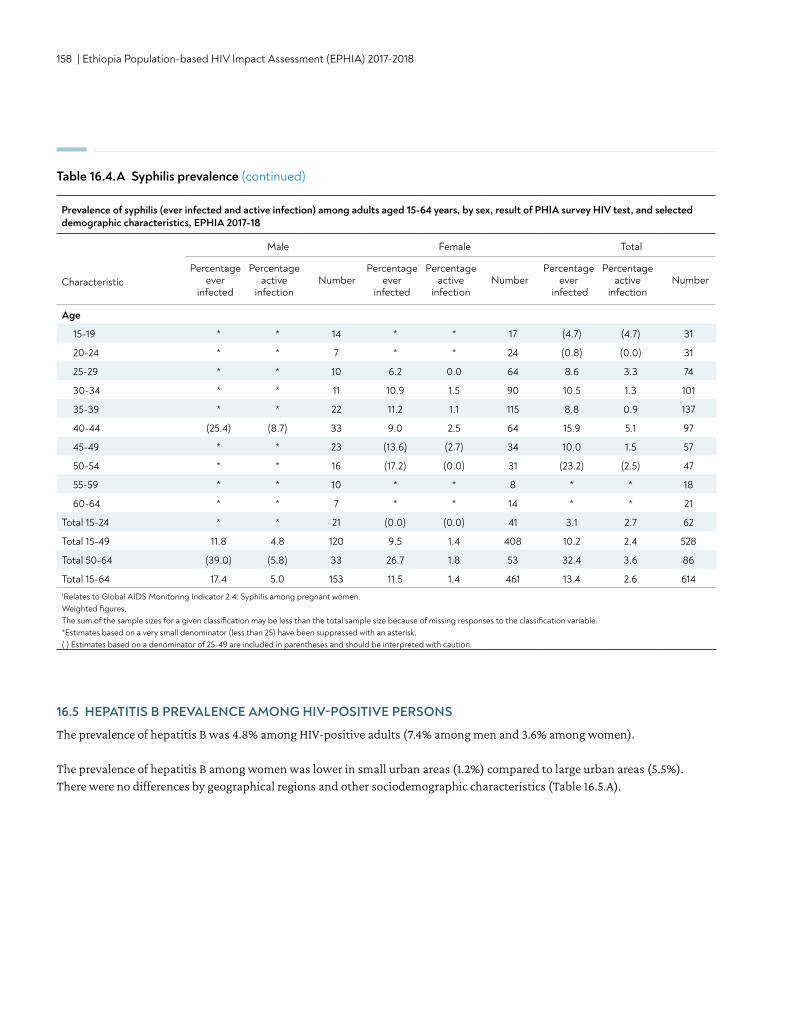
158 | Ethiopia Population-based HIV Impact Assessment (EPHIA) 2017-2018
Age
15-19 * * 14 * * 17 (4.7) (4.7) 31
20-24 * * 7 * * 24 (0.8) (0.0) 31
25-29 * * 10 6.2 0.0 64 8.6 3.3 74
30-34 * * 11 10.9 1.5 90 10.5 1.3 101
35-39 * * 22 11.2 1.1 115 8.8 0.9 137
40-44 (25.4) (8.7) 33 9.0 2.5 64 15.9 5.1 97
45-49 * * 23 (13.6) (2.7) 34 10.0 1.5 57
50-54 * * 16 (17.2) (0.0) 31 (23.2) (2.5) 47
55-59 * * 10 * * 8 * * 18
60-64 * * 7 * * 14 * * 21
Total 15-24 * * 21 (0.0) (0.0) 41 3.1 2.7 62
Total 15-49 11.8 4.8 120 9.5 1.4 408 10.2 2.4 528
Total 50-64 (39.0) (5.8) 33 26.7 1.8 53 32.4 3.6 86
Total 15-64 17.4 5.0 153 11.5 1.4 461 13.4 2.6 6141Relates to Global AIDS Monitoring Indicator 2.4: Syphilis among pregnant women. Weighted figures. The sum of the sample sizes for a given classification may be less than the total sample size because of missing responses to the classification variable.*Estimates based on a very small denominator (less than 25) have been suppressed with an asterisk. ( ) Estimates based on a denominator of 25-49 are included in parentheses and should be interpreted with caution.
Table 16.4.A Syphilis prevalence (continued)
Prevalence of syphilis (ever infected and active infection) among adults aged 15-64 years, by sex, result of PHIA survey HIV test, and selected demographic characteristics, EPHIA 2017-18
Male Female Total
CharacteristicPercentage
ever infected
Percentage active
infectionNumber
Percentage ever
infected
Percentage active
infectionNumber
Percentage ever
infected
Percentage active
infectionNumber
16.5 HEPATITIS B PREVALENCE AMONG HIV-POSITIVE PERSONS
The prevalence of hepatitis B was 4.8% among HIV-positive adults (7.4% among men and 3.6% among women).
The prevalence of hepatitis B among women was lower in small urban areas (1.2%) compared to large urban areas (5.5%). There were no differences by geographical regions and other sociodemographic characteristics (Table 16.5.A).
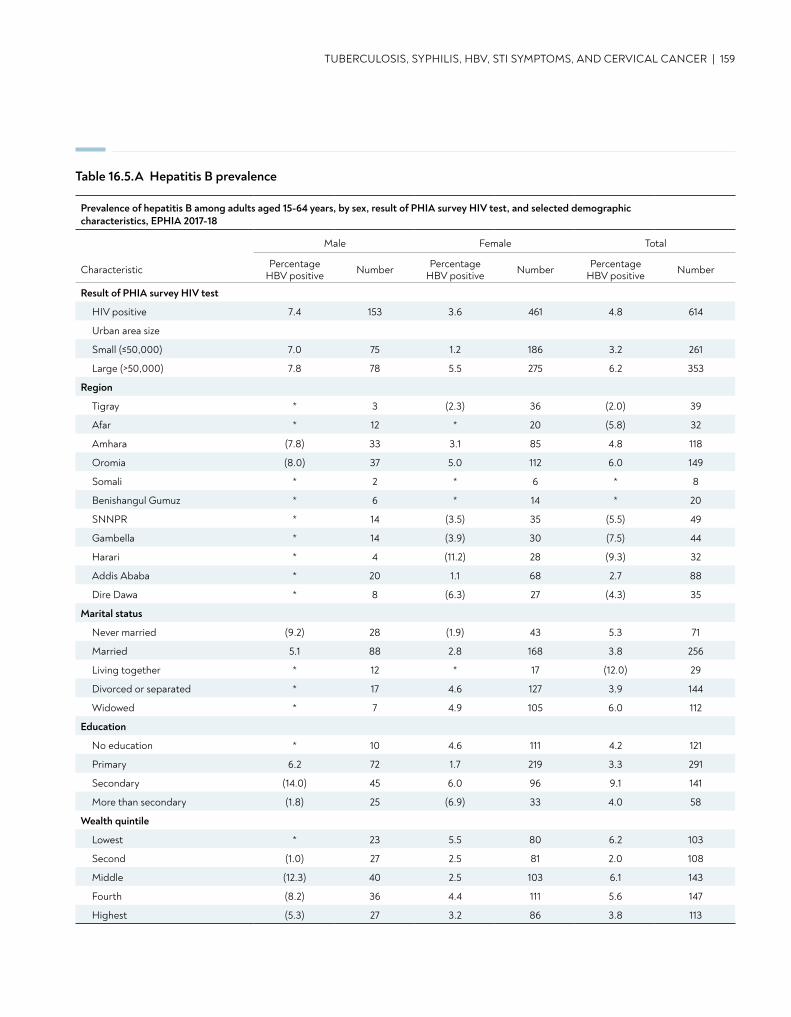
TUBERCULOSIS, SYPHILIS, HBV, STI SYMPTOMS, AND CERVICAL CANCER | 159
Table 16.5.A Hepatitis B prevalence
Prevalence of hepatitis B among adults aged 15-64 years, by sex, result of PHIA survey HIV test, and selected demographic characteristics, EPHIA 2017-18
Male Female Total
Characteristic Percentage HBV positive Number Percentage
HBV positive Number Percentage HBV positive Number
Result of PHIA survey HIV test
HIV positive 7.4 153 3.6 461 4.8 614
Urban area size
Small (≤50,000) 7.0 75 1.2 186 3.2 261
Large (>50,000) 7.8 78 5.5 275 6.2 353
Region
Tigray * 3 (2.3) 36 (2.0) 39
Afar * 12 * 20 (5.8) 32
Amhara (7.8) 33 3.1 85 4.8 118
Oromia (8.0) 37 5.0 112 6.0 149
Somali * 2 * 6 * 8
Benishangul Gumuz * 6 * 14 * 20
SNNPR * 14 (3.5) 35 (5.5) 49
Gambella * 14 (3.9) 30 (7.5) 44
Harari * 4 (11.2) 28 (9.3) 32
Addis Ababa * 20 1.1 68 2.7 88
Dire Dawa * 8 (6.3) 27 (4.3) 35
Marital status
Never married (9.2) 28 (1.9) 43 5.3 71
Married 5.1 88 2.8 168 3.8 256
Living together * 12 * 17 (12.0) 29
Divorced or separated * 17 4.6 127 3.9 144
Widowed * 7 4.9 105 6.0 112
Education
No education * 10 4.6 111 4.2 121
Primary 6.2 72 1.7 219 3.3 291
Secondary (14.0) 45 6.0 96 9.1 141
More than secondary (1.8) 25 (6.9) 33 4.0 58
Wealth quintile
Lowest * 23 5.5 80 6.2 103
Second (1.0) 27 2.5 81 2.0 108
Middle (12.3) 40 2.5 103 6.1 143
Fourth (8.2) 36 4.4 111 5.6 147
Highest (5.3) 27 3.2 86 3.8 113
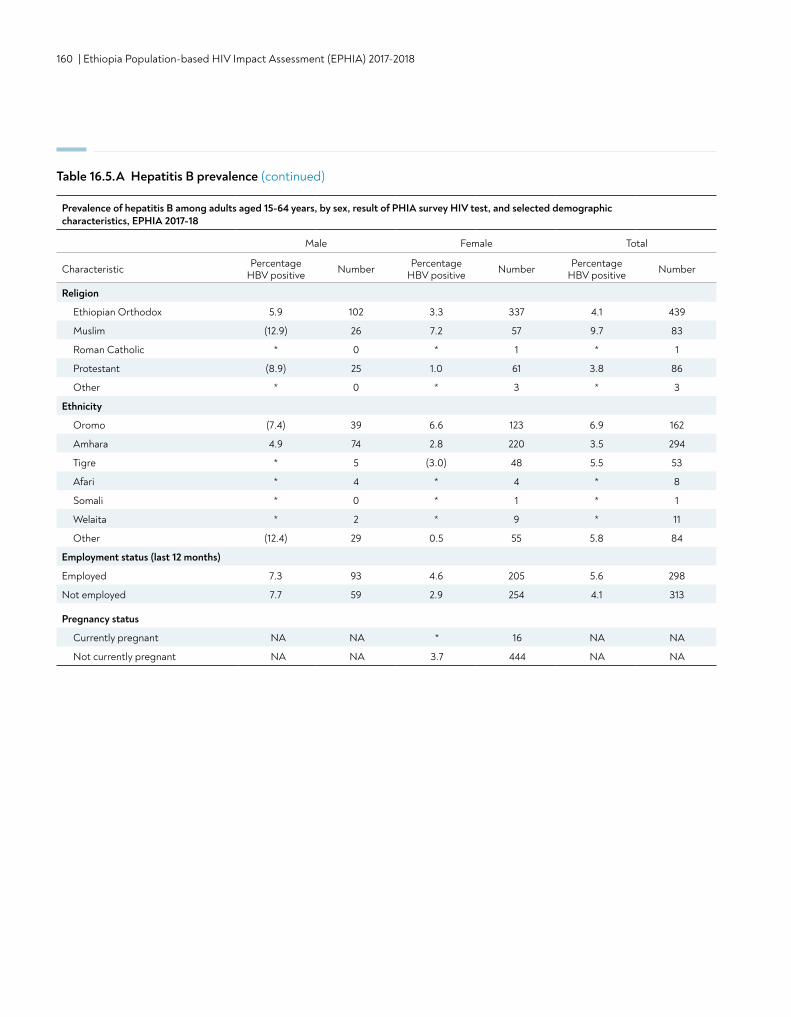
160 | Ethiopia Population-based HIV Impact Assessment (EPHIA) 2017-2018
Religion
Ethiopian Orthodox 5.9 102 3.3 337 4.1 439
Muslim (12.9) 26 7.2 57 9.7 83
Roman Catholic * 0 * 1 * 1
Protestant (8.9) 25 1.0 61 3.8 86
Other * 0 * 3 * 3
Ethnicity
Oromo (7.4) 39 6.6 123 6.9 162
Amhara 4.9 74 2.8 220 3.5 294
Tigre * 5 (3.0) 48 5.5 53
Afari * 4 * 4 * 8
Somali * 0 * 1 * 1
Welaita * 2 * 9 * 11
Other (12.4) 29 0.5 55 5.8 84
Employment status (last 12 months)
Employed 7.3 93 4.6 205 5.6 298
Not employed 7.7 59 2.9 254 4.1 313
Pregnancy status
Currently pregnant NA NA * 16 NA NA
Not currently pregnant NA NA 3.7 444 NA NA
Table 16.5.A Hepatitis B prevalence (continued)
Prevalence of hepatitis B among adults aged 15-64 years, by sex, result of PHIA survey HIV test, and selected demographic characteristics, EPHIA 2017-18
Male Female Total
Characteristic Percentage HBV positive Number Percentage
HBV positive Number Percentage HBV positive Number
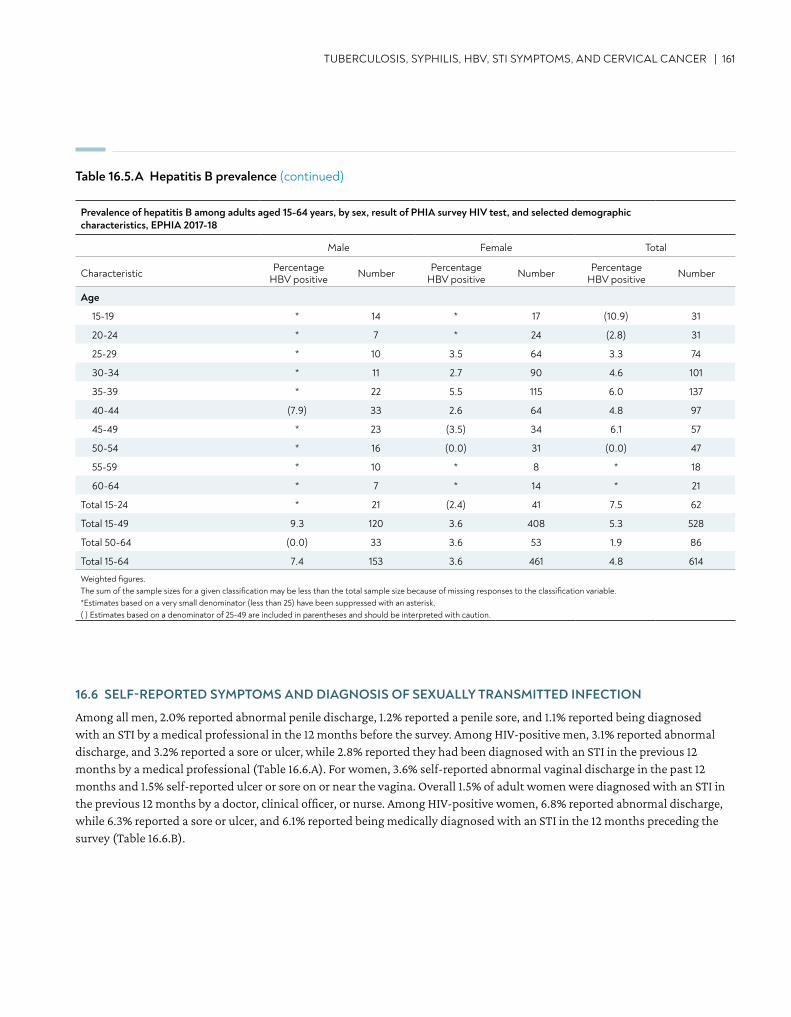
TUBERCULOSIS, SYPHILIS, HBV, STI SYMPTOMS, AND CERVICAL CANCER | 161
Age
15-19 * 14 * 17 (10.9) 31
20-24 * 7 * 24 (2.8) 31
25-29 * 10 3.5 64 3.3 74
30-34 * 11 2.7 90 4.6 101
35-39 * 22 5.5 115 6.0 137
40-44 (7.9) 33 2.6 64 4.8 97
45-49 * 23 (3.5) 34 6.1 57
50-54 * 16 (0.0) 31 (0.0) 47
55-59 * 10 * 8 * 18
60-64 * 7 * 14 * 21
Total 15-24 * 21 (2.4) 41 7.5 62
Total 15-49 9.3 120 3.6 408 5.3 528
Total 50-64 (0.0) 33 3.6 53 1.9 86
Total 15-64 7.4 153 3.6 461 4.8 614
Weighted figures. The sum of the sample sizes for a given classification may be less than the total sample size because of missing responses to the classification variable.*Estimates based on a very small denominator (less than 25) have been suppressed with an asterisk. ( ) Estimates based on a denominator of 25-49 are included in parentheses and should be interpreted with caution.
Table 16.5.A Hepatitis B prevalence (continued)
16.6 SELF-REPORTED SYMPTOMS AND DIAGNOSIS OF SEXUALLY TRANSMITTED INFECTION
Among all men, 2.0% reported abnormal penile discharge, 1.2% reported a penile sore, and 1.1% reported being diagnosed with an STI by a medical professional in the 12 months before the survey. Among HIV-positive men, 3.1% reported abnormal discharge, and 3.2% reported a sore or ulcer, while 2.8% reported they had been diagnosed with an STI in the previous 12 months by a medical professional (Table 16.6.A). For women, 3.6% self-reported abnormal vaginal discharge in the past 12 months and 1.5% self-reported ulcer or sore on or near the vagina. Overall 1.5% of adult women were diagnosed with an STI in the previous 12 months by a doctor, clinical officer, or nurse. Among HIV-positive women, 6.8% reported abnormal discharge, while 6.3% reported a sore or ulcer, and 6.1% reported being medically diagnosed with an STI in the 12 months preceding the survey (Table 16.6.B).
Prevalence of hepatitis B among adults aged 15-64 years, by sex, result of PHIA survey HIV test, and selected demographic characteristics, EPHIA 2017-18
Male Female Total
Characteristic Percentage HBV positive Number Percentage
HBV positive Number Percentage HBV positive Number
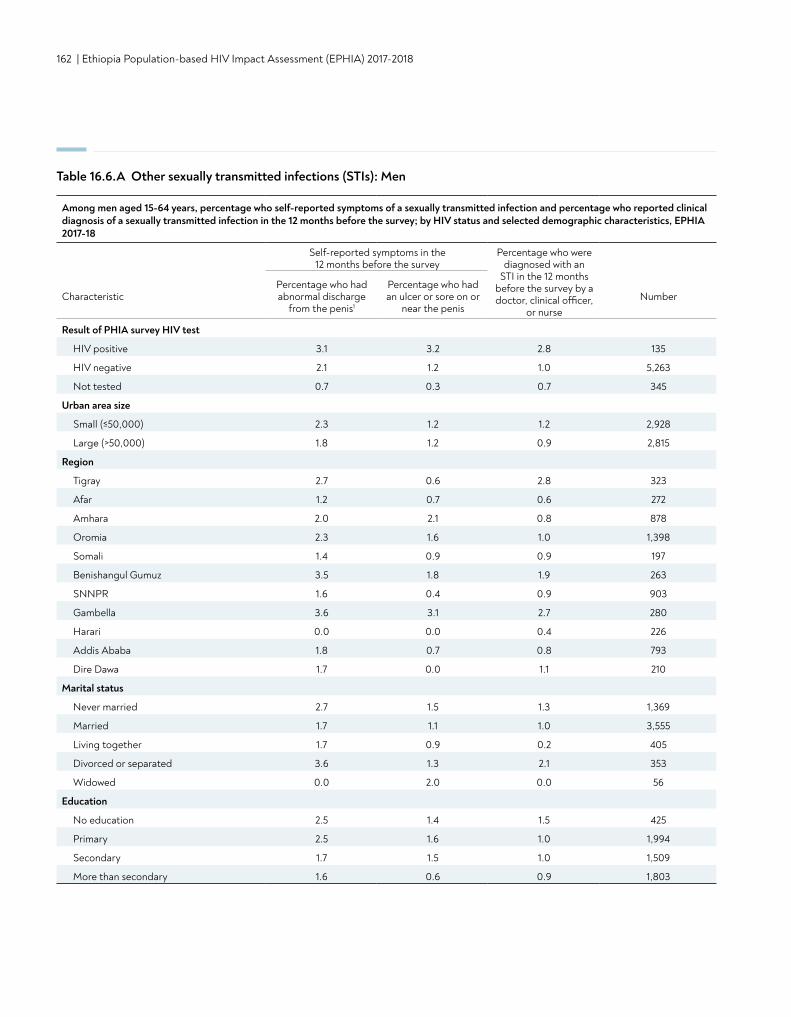
162 | Ethiopia Population-based HIV Impact Assessment (EPHIA) 2017-2018
Table 16.6.A Other sexually transmitted infections (STIs): Men
Among men aged 15-64 years, percentage who self-reported symptoms of a sexually transmitted infection and percentage who reported clinical diagnosis of a sexually transmitted infection in the 12 months before the survey; by HIV status and selected demographic characteristics, EPHIA 2017-18
Self-reported symptoms in the 12 months before the survey
Percentage who were diagnosed with an
STI in the 12 months before the survey by a doctor, clinical officer,
or nurseCharacteristic
Percentage who had abnormal discharge
from the penis1
Percentage who had an ulcer or sore on or
near the penisNumber
Result of PHIA survey HIV test
HIV positive 3.1 3.2 2.8 135
HIV negative 2.1 1.2 1.0 5,263
Not tested 0.7 0.3 0.7 345
Urban area size
Small (≤50,000) 2.3 1.2 1.2 2,928
Large (>50,000) 1.8 1.2 0.9 2,815
Region
Tigray 2.7 0.6 2.8 323
Afar 1.2 0.7 0.6 272
Amhara 2.0 2.1 0.8 878
Oromia 2.3 1.6 1.0 1,398
Somali 1.4 0.9 0.9 197
Benishangul Gumuz 3.5 1.8 1.9 263
SNNPR 1.6 0.4 0.9 903
Gambella 3.6 3.1 2.7 280
Harari 0.0 0.0 0.4 226
Addis Ababa 1.8 0.7 0.8 793
Dire Dawa 1.7 0.0 1.1 210
Marital status
Never married 2.7 1.5 1.3 1,369
Married 1.7 1.1 1.0 3,555
Living together 1.7 0.9 0.2 405
Divorced or separated 3.6 1.3 2.1 353
Widowed 0.0 2.0 0.0 56
Education
No education 2.5 1.4 1.5 425
Primary 2.5 1.6 1.0 1,994
Secondary 1.7 1.5 1.0 1,509
More than secondary 1.6 0.6 0.9 1,803
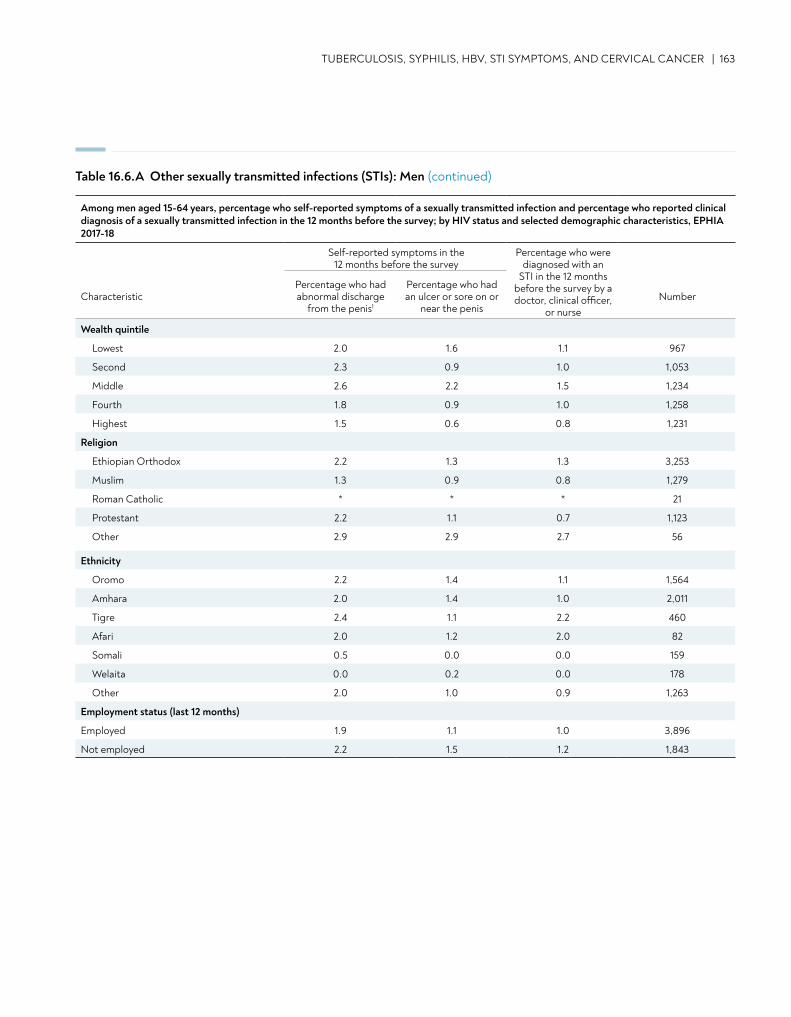
TUBERCULOSIS, SYPHILIS, HBV, STI SYMPTOMS, AND CERVICAL CANCER | 163
Table 16.6.A Other sexually transmitted infections (STIs): Men (continued)
Wealth quintile
Lowest 2.0 1.6 1.1 967
Second 2.3 0.9 1.0 1,053
Middle 2.6 2.2 1.5 1,234
Fourth 1.8 0.9 1.0 1,258
Highest 1.5 0.6 0.8 1,231
Religion
Ethiopian Orthodox 2.2 1.3 1.3 3,253
Muslim 1.3 0.9 0.8 1,279
Roman Catholic * * * 21
Protestant 2.2 1.1 0.7 1,123
Other 2.9 2.9 2.7 56
Ethnicity
Oromo 2.2 1.4 1.1 1,564
Amhara 2.0 1.4 1.0 2,011
Tigre 2.4 1.1 2.2 460
Afari 2.0 1.2 2.0 82
Somali 0.5 0.0 0.0 159
Welaita 0.0 0.2 0.0 178
Other 2.0 1.0 0.9 1,263
Employment status (last 12 months)
Employed 1.9 1.1 1.0 3,896
Not employed 2.2 1.5 1.2 1,843
Among men aged 15-64 years, percentage who self-reported symptoms of a sexually transmitted infection and percentage who reported clinical diagnosis of a sexually transmitted infection in the 12 months before the survey; by HIV status and selected demographic characteristics, EPHIA 2017-18
Self-reported symptoms in the 12 months before the survey
Percentage who were diagnosed with an
STI in the 12 months before the survey by a doctor, clinical officer,
or nurseCharacteristic
Percentage who had abnormal discharge
from the penis1
Percentage who had an ulcer or sore on or
near the penisNumber
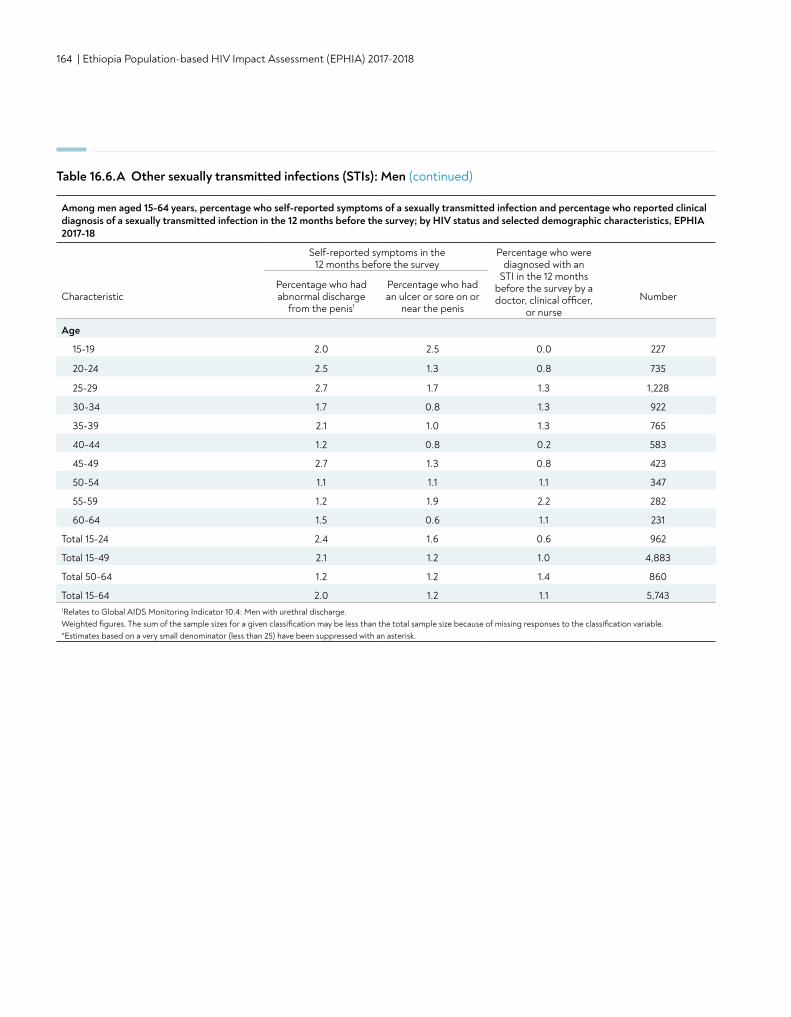
164 | Ethiopia Population-based HIV Impact Assessment (EPHIA) 2017-2018
Age
15-19 2.0 2.5 0.0 227
20-24 2.5 1.3 0.8 735
25-29 2.7 1.7 1.3 1,228
30-34 1.7 0.8 1.3 922
35-39 2.1 1.0 1.3 765
40-44 1.2 0.8 0.2 583
45-49 2.7 1.3 0.8 423
50-54 1.1 1.1 1.1 347
55-59 1.2 1.9 2.2 282
60-64 1.5 0.6 1.1 231
Total 15-24 2.4 1.6 0.6 962
Total 15-49 2.1 1.2 1.0 4,883
Total 50-64 1.2 1.2 1.4 860
Total 15-64 2.0 1.2 1.1 5,7431Relates to Global AIDS Monitoring Indicator 10.4: Men with urethral discharge. Weighted figures. The sum of the sample sizes for a given classification may be less than the total sample size because of missing responses to the classification variable.*Estimates based on a very small denominator (less than 25) have been suppressed with an asterisk.
Table 16.6.A Other sexually transmitted infections (STIs): Men (continued)
Among men aged 15-64 years, percentage who self-reported symptoms of a sexually transmitted infection and percentage who reported clinical diagnosis of a sexually transmitted infection in the 12 months before the survey; by HIV status and selected demographic characteristics, EPHIA 2017-18
Self-reported symptoms in the 12 months before the survey
Percentage who were diagnosed with an
STI in the 12 months before the survey by a doctor, clinical officer,
or nurseCharacteristic
Percentage who had abnormal discharge
from the penis1
Percentage who had an ulcer or sore on or
near the penisNumber
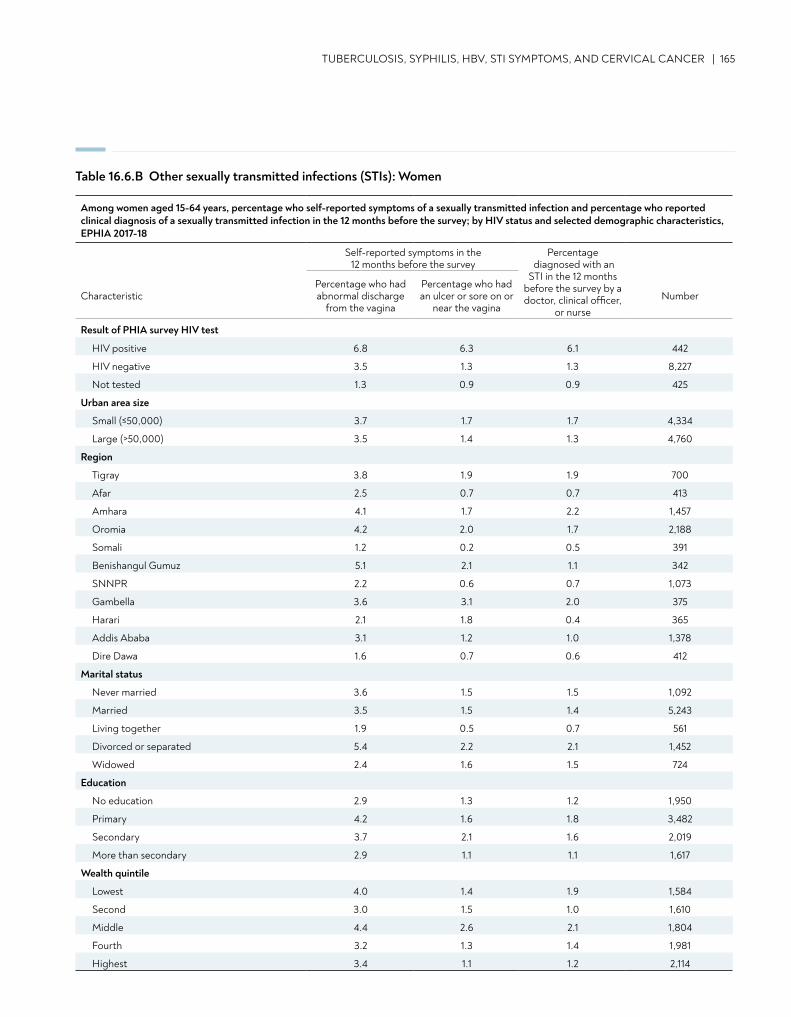
TUBERCULOSIS, SYPHILIS, HBV, STI SYMPTOMS, AND CERVICAL CANCER | 165
Table 16.6.B Other sexually transmitted infections (STIs): Women
Among women aged 15-64 years, percentage who self-reported symptoms of a sexually transmitted infection and percentage who reported clinical diagnosis of a sexually transmitted infection in the 12 months before the survey; by HIV status and selected demographic characteristics, EPHIA 2017-18
Self-reported symptoms in the 12 months before the survey
Percentage diagnosed with an
STI in the 12 months before the survey by a doctor, clinical officer,
or nurseCharacteristic
Percentage who had abnormal discharge
from the vagina
Percentage who had an ulcer or sore on or
near the vaginaNumber
Result of PHIA survey HIV test
HIV positive 6.8 6.3 6.1 442
HIV negative 3.5 1.3 1.3 8,227
Not tested 1.3 0.9 0.9 425
Urban area size
Small (≤50,000) 3.7 1.7 1.7 4,334
Large (>50,000) 3.5 1.4 1.3 4,760
Region
Tigray 3.8 1.9 1.9 700
Afar 2.5 0.7 0.7 413
Amhara 4.1 1.7 2.2 1,457
Oromia 4.2 2.0 1.7 2,188
Somali 1.2 0.2 0.5 391
Benishangul Gumuz 5.1 2.1 1.1 342
SNNPR 2.2 0.6 0.7 1,073
Gambella 3.6 3.1 2.0 375
Harari 2.1 1.8 0.4 365
Addis Ababa 3.1 1.2 1.0 1,378
Dire Dawa 1.6 0.7 0.6 412
Marital status
Never married 3.6 1.5 1.5 1,092
Married 3.5 1.5 1.4 5,243
Living together 1.9 0.5 0.7 561
Divorced or separated 5.4 2.2 2.1 1,452
Widowed 2.4 1.6 1.5 724
Education
No education 2.9 1.3 1.2 1,950
Primary 4.2 1.6 1.8 3,482
Secondary 3.7 2.1 1.6 2,019
More than secondary 2.9 1.1 1.1 1,617
Wealth quintile
Lowest 4.0 1.4 1.9 1,584
Second 3.0 1.5 1.0 1,610
Middle 4.4 2.6 2.1 1,804
Fourth 3.2 1.3 1.4 1,981
Highest 3.4 1.1 1.2 2,114
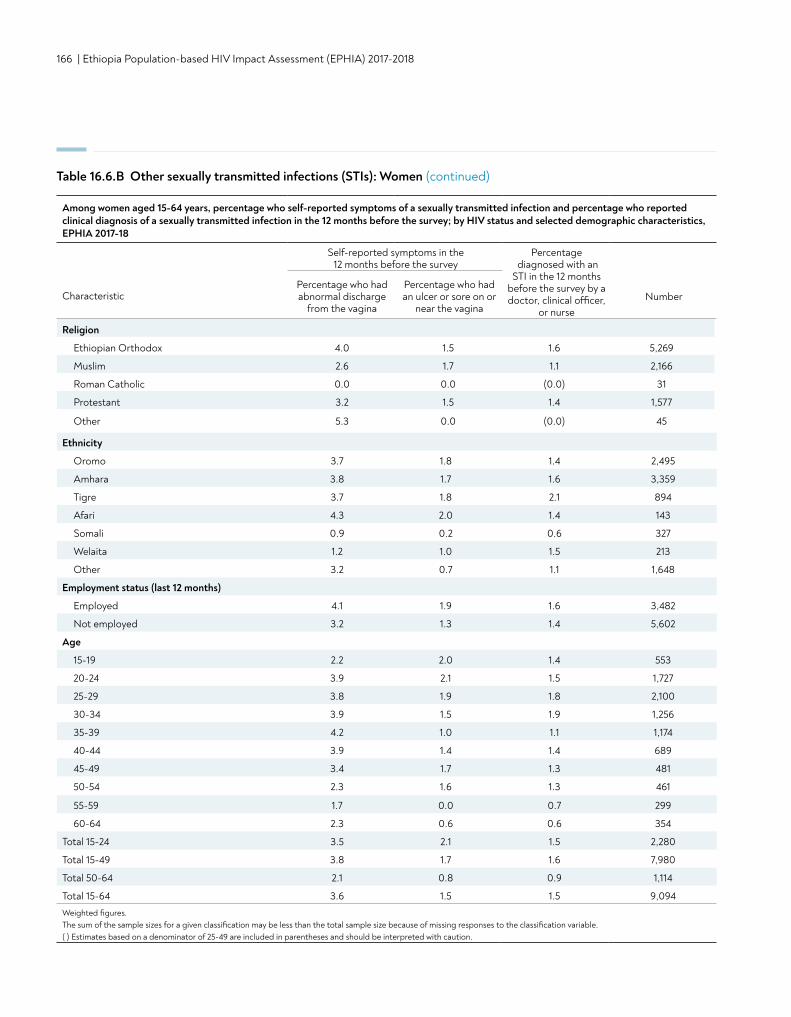
166 | Ethiopia Population-based HIV Impact Assessment (EPHIA) 2017-2018
Table 16.6.B Other sexually transmitted infections (STIs): Women (continued)
Religion
Ethiopian Orthodox 4.0 1.5 1.6 5,269
Muslim 2.6 1.7 1.1 2,166
Roman Catholic 0.0 0.0 (0.0) 31
Protestant 3.2 1.5 1.4 1,577
Other 5.3 0.0 (0.0) 45
Ethnicity
Oromo 3.7 1.8 1.4 2,495
Amhara 3.8 1.7 1.6 3,359
Tigre 3.7 1.8 2.1 894
Afari 4.3 2.0 1.4 143
Somali 0.9 0.2 0.6 327
Welaita 1.2 1.0 1.5 213
Other 3.2 0.7 1.1 1,648
Employment status (last 12 months)
Employed 4.1 1.9 1.6 3,482
Not employed 3.2 1.3 1.4 5,602
Age
15-19 2.2 2.0 1.4 553
20-24 3.9 2.1 1.5 1,727
25-29 3.8 1.9 1.8 2,100
30-34 3.9 1.5 1.9 1,256
35-39 4.2 1.0 1.1 1,174
40-44 3.9 1.4 1.4 689
45-49 3.4 1.7 1.3 481
50-54 2.3 1.6 1.3 461
55-59 1.7 0.0 0.7 299
60-64 2.3 0.6 0.6 354
Total 15-24 3.5 2.1 1.5 2,280
Total 15-49 3.8 1.7 1.6 7,980
Total 50-64 2.1 0.8 0.9 1,114
Total 15-64 3.6 1.5 1.5 9,094Weighted figures. The sum of the sample sizes for a given classification may be less than the total sample size because of missing responses to the classification variable.( ) Estimates based on a denominator of 25-49 are included in parentheses and should be interpreted with caution.
Among women aged 15-64 years, percentage who self-reported symptoms of a sexually transmitted infection and percentage who reported clinical diagnosis of a sexually transmitted infection in the 12 months before the survey; by HIV status and selected demographic characteristics, EPHIA 2017-18
Self-reported symptoms in the 12 months before the survey
Percentage diagnosed with an
STI in the 12 months before the survey by a doctor, clinical officer,
or nurseCharacteristic
Percentage who had abnormal discharge
from the vagina
Percentage who had an ulcer or sore on or
near the vaginaNumber
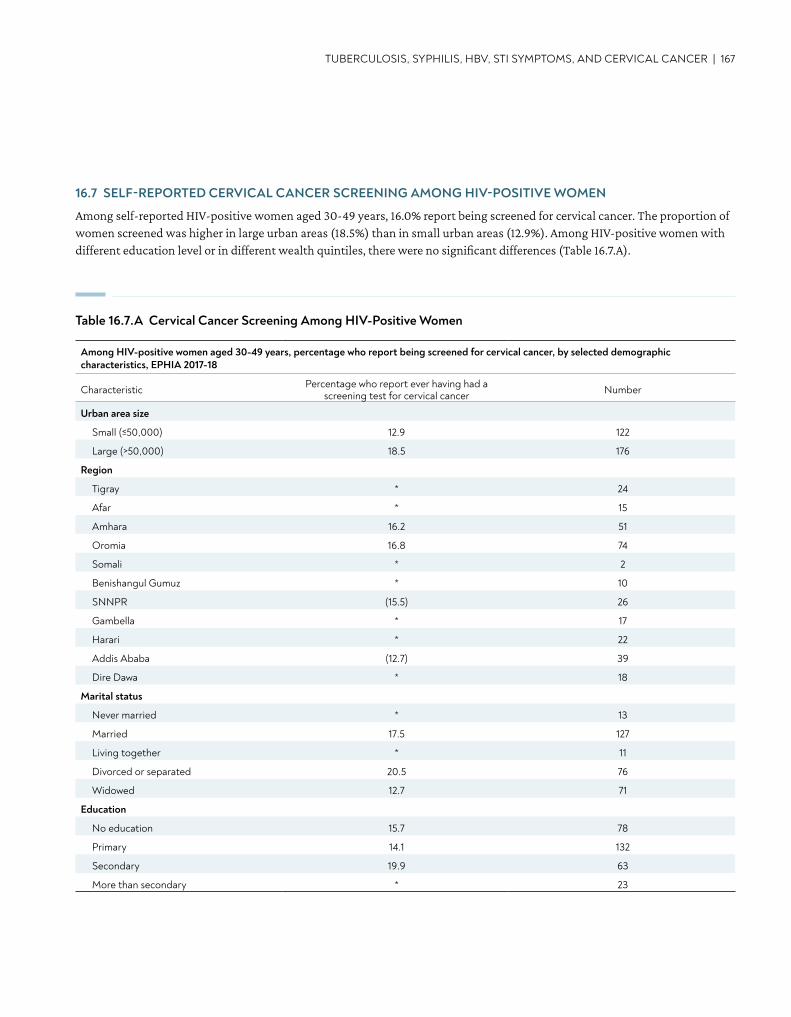
TUBERCULOSIS, SYPHILIS, HBV, STI SYMPTOMS, AND CERVICAL CANCER | 167
16.7 SELF-REPORTED CERVICAL CANCER SCREENING AMONG HIV-POSITIVE WOMEN
Among self-reported HIV-positive women aged 30-49 years, 16.0% report being screened for cervical cancer. The proportion of women screened was higher in large urban areas (18.5%) than in small urban areas (12.9%). Among HIV-positive women with different education level or in different wealth quintiles, there were no significant differences (Table 16.7.A).
Table 16.7.A Cervical Cancer Screening Among HIV-Positive Women
Among HIV-positive women aged 30-49 years, percentage who report being screened for cervical cancer, by selected demographic characteristics, EPHIA 2017-18
Characteristic Percentage who report ever having had a screening test for cervical cancer Number
Urban area size
Small (≤50,000) 12.9 122
Large (>50,000) 18.5 176
Region
Tigray * 24
Afar * 15
Amhara 16.2 51
Oromia 16.8 74
Somali * 2
Benishangul Gumuz * 10
SNNPR (15.5) 26
Gambella * 17
Harari * 22
Addis Ababa (12.7) 39
Dire Dawa * 18
Marital status
Never married * 13
Married 17.5 127
Living together * 11
Divorced or separated 20.5 76
Widowed 12.7 71
Education
No education 15.7 78
Primary 14.1 132
Secondary 19.9 63
More than secondary * 23
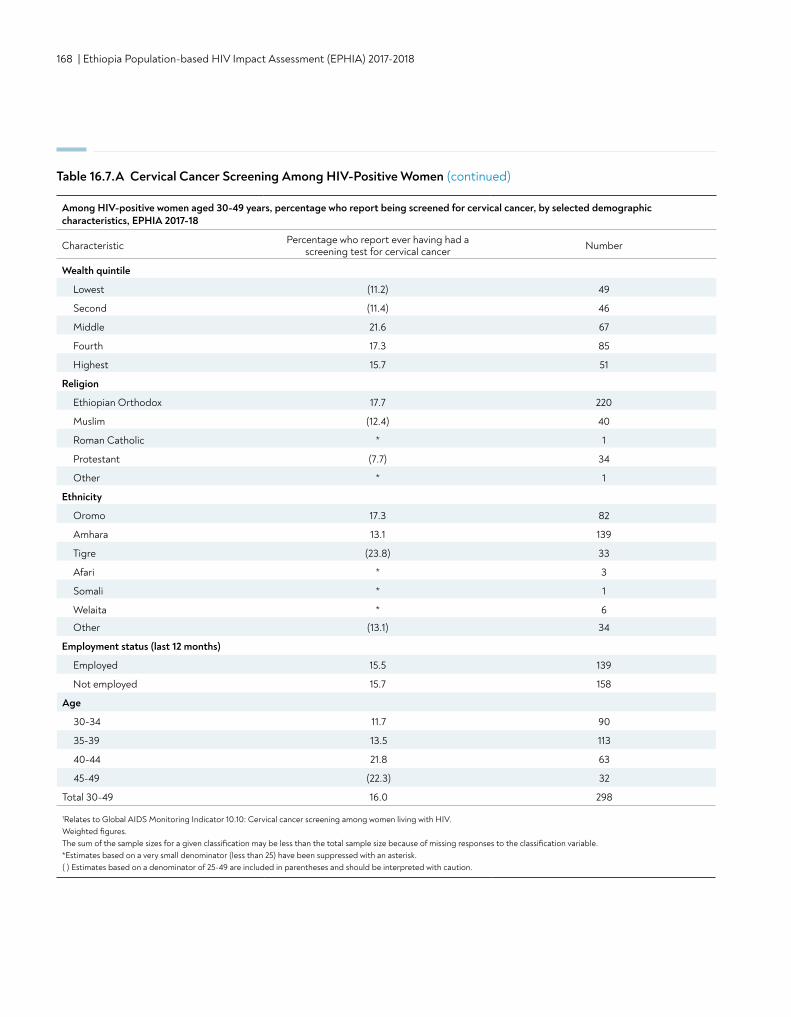
168 | Ethiopia Population-based HIV Impact Assessment (EPHIA) 2017-2018
Wealth quintile
Lowest (11.2) 49
Second (11.4) 46
Middle 21.6 67
Fourth 17.3 85
Highest 15.7 51
Religion
Ethiopian Orthodox 17.7 220
Muslim (12.4) 40
Roman Catholic * 1
Protestant (7.7) 34
Other * 1
Ethnicity
Oromo 17.3 82
Amhara 13.1 139
Tigre (23.8) 33
Afari * 3
Somali * 1
Welaita * 6
Other (13.1) 34
Employment status (last 12 months)
Employed 15.5 139
Not employed 15.7 158
Age
30-34 11.7 90
35-39 13.5 113
40-44 21.8 63
45-49 (22.3) 32
Total 30-49 16.0 298
1Relates to Global AIDS Monitoring Indicator 10.10: Cervical cancer screening among women living with HIV. Weighted figures. The sum of the sample sizes for a given classification may be less than the total sample size because of missing responses to the classification variable.*Estimates based on a very small denominator (less than 25) have been suppressed with an asterisk. ( ) Estimates based on a denominator of 25-49 are included in parentheses and should be interpreted with caution.
Table 16.7.A Cervical Cancer Screening Among HIV-Positive Women (continued)
Among HIV-positive women aged 30-49 years, percentage who report being screened for cervical cancer, by selected demographic characteristics, EPHIA 2017-18
Characteristic Percentage who report ever having had a screening test for cervical cancer Number
TUBERCULOSIS, SYPHILIS, HBV, STI SYMPTOMS, AND CERVICAL CANCER | 169
16.8 GAPS AND UNMET NEEDS
• More than a third of HIV-positive adults ever visited a clinic for TB diagnosis and treatment. Among adults who ever visited a clinic for TB diagnosis or treatment, more than a third were not tested for HIV although they did not know their HIV status. Better implementation of collaborative HIV/TB services and effective linkages between TB and HIV could improve outcomes among people at risk of HIV/TB coinfection.
• Active syphilis coinfection is a major health problem among HIV-positive persons.• Hepatitis B coinfection is also a public health problem among people living with HIV.• Less than a quarter of HIV-positive women aged 30-49 years reported they had ever been screened for cervical cancer. HIV-
positive women at risk for this common co-morbidity are in need of expanded screening services.
16.7 REFERENCES
1. Joint United Nations Programme on HIV/AIDS. UNAIDS data tables, 2017. http://aidsinfo.unaids.org/. Accessed September 18, 2018.
170 | Ethiopia Population-based HIV Impact Assessment (EPHIA) 2017-2018
DISCUSSION AND CONCLUSIONS
DISCUSSION AND CONCLUSIONS | 171
DISCUSSION AND CONCLUSIONSDiscussion and Conclusions• In urban Ethiopia, the annual HIV incidence was 0.05% (6,000 new cases) among adults (defined as individuals aged
15-64 years) in 2017-2018.
• While HIV incidence was low, steps should be taken to bring it to zero.
• In urban Ethiopia, the HIV prevalence was 3.0% among adults in 2017-2018, which corresponds to 384,000 persons living with HIV. HIV prevalence varies by demographic characteristics and region, which calls for further investigation into understanding the various aspect of the epidemic.
• The findings indicate that there is some reluctance to disclose HIV-positive status in urban Ethiopia. More interventions are needed to encourage people to disclose their HIV status.
• Ethiopia has made considerable progress towards 90-90-90 targets in urban areas. However, there is a major gap in the diagnosis of those living with HIV, especially among young people and adult men in general. More interventions are needed to improve case finding, especially among young people and adult men.
• About one third of the adults living with HIV in urban Ethiopia do not have VLS. This finding was more pronounced among younger people and in certain regions, indicating a need to improve case finding as well as adherence to treatment.
• More than half of HIV-positive people who do not know their status were immunosuppressed, with CD4 count less than 350 cells/μL. More HIV-positive men were immunosuppressed compared to women.
• Over a quarter of HIV-positive women who reported that they were HIV negative or never tested were severely immunosuppressed, with CD4 count less than 200 cells/μL. More efforts are needed to identify these individuals and initiate them on ART.
• Many adolescents 12-14 years of age show inadequate information about HIV transmission and exhibit discriminatory attitudes towards HIV-positive people. There is a need to provide further education about HIV modes of transmission and people living with HIV for this age group.
• Nearly two thirds of sexually active adults who reported to have sex with a non-marital, non-cohabitating partner in the last 12 months were not using a condom at last sex. More efforts are needed to promote condom use, particularly among people at higher risk of infection.
• The proportion of uncircumcised men in Gambella was significantly higher than other regions. More interventions are needed to promote medical male circumcision in that region.
• Little more than a third of HIV-positive adults reported that they had ever visited a clinic for TB diagnosis or treatment. Approximately four out of 10 adults who did not know their HIV status when they visited a clinic for TB diagnosis or treatment were not tested for HIV. HIV testing at TB diagnosis or treatment units should be strengthened.
• The survey's findings demonstrate a need for interventions to improve screening for active syphilis and hepatitis B among people living with HIV.
• Less than a sixth of HIV-positive women aged 30-49 years reported that they had ever been screened for cervical cancer. Coverage of screening for this common co-morbidity should be expanded.
172 | Ethiopia Population-based HIV Impact Assessment (EPHIA) 2017-2018
APPENDIX
APPENDIX A | 173
APPENDIX A SAMPLE DESIGN AND WEIGHTING
Appendix A provides a high-level overview of sampling and weighting procedures for EPHIA 2017-2018. In-depth details are provided in the EPHIA 2017-2018 Sampling and Weighting Technical Report, which may be found on the https://phia.icap.columbia.edu/.
A.1 SAMPLE DESIGN
OverviewThe sample design for EPHIA 2017-2018 is a stratified multistage probability sample design, with strata defined to be the urban areas in the 11 regions of the country, first-stage sampling units defined by EAs within strata, second-stage sampling units defined by households within EAs, and finally eligible persons within households. Within each urban region, the first-stage sampling units (also referred to as PSUs) were selected with probabilities proportionate to the number of households in the EA based on the 2007 Ethiopia Population and Housing Census. The allocation of the sample PSUs to the regional urban areas was made in a manner designed to achieve specified precision levels for regional estimates of viral load suppression (VLS) rates among HIV-positive adults 15-49 years of age.
The second-stage sampling units were selected from lists of dwelling units/households compiled by trained staff for each of the sampled PSUs. Upon completion of the listing process, random samples of specified numbers of dwelling units/households were selected from each PSU at rates designed to yield self-weighting (i.e., equal probability) samples within each region to the extent feasible.
Within the sampled households, all eligible adults aged 15-64 years were included in the study sample for data collection. Eligible children aged 0-14 years in a randomly selected one-half of the sampled households were included in the study for data collection.
Population of InferenceThe population of inference for EPHIA 2017-2018 is comprised of the de facto household population. The de facto population is comprised of individuals who were present in households (i.e., slept in the household) on the night prior to the household interview. In contrast, the de jure population is comprised of individuals who are usual residents of the household, irrespective of whether or not they slept in the household on the night prior to the household interview.
Precision Specifications and AssumptionsThe following specifications were used to develop the sample design for EPHIA 2017-2018.
• 95% confidence bounds of ±0.20 or less around an estimated VLS rate among all HIV-positive adults aged 15-49 years for each of the 11 sampling strata of Ethiopia (see Table 2-2);
• Total combined sample size of approximately 20,000-25,000 analyzable blood draws among adults aged 15-64 years and childrean aged 0-14 years.
The following assumptions were used to develop the sample design for EPHIA 2017-2018:• An overall HIV prevalence rate in urban areas of 0.021 (2.1%) for males aged 15-49 years and 0.042 (4.2%) for females
aged 15-49 years, that varied by stratum (see Table 2-2). Source: 2017 projections developed by CDC-Ethiopia.• A viral load suppression (VLS) rate of Pvh= 0.50 (50%) among HIV-positive adults aged 15-49. This was a conservative
assumption because it could have overstated the actual variance of the estimated VLS rate.• An average sample size of 30 dwelling units per PSU were sampled (prior to losses due to vacancy and nonresponse).• An intra-cluster correlation (ICC) of r=0.05 for prevalence and VLS rates. The ICC provided an average measure of the
homogeneity of responses within the first-stage sampling units.• An occupancy rate of 96% for sampled dwellings. Source: 2011 Ethiopia Demographic and Health Survey (DHS).• An overall household response rate of 97% among occupied households. Source: 2011 Ethiopia DHS.• The average number of persons aged 15 to 49 per urban household was 2.11. Source: 2011 Ethiopia DHS.• The overall percentage of persons in urban households who were 0-14 years of age was 32.2%.
Source: 2007 Ethiopia Population and Housing Census.• The overall percentage of persons in urban households who were 50-64 years of age was 5.4%.
174 | Ethiopia Population-based HIV Impact Assessment (EPHIA) 2017-2018
Source: 2007 Ethiopia Population and Housing Census.• Among the eligible adults aged 15-64 years in urban households completing the household roster, a biomarker response rate of
78%. Source: 2011 Ethiopia DHS.• Among the eligible children 0-14 years of age in urban households designated for child data collection, a biomarker response
rate of 73%. This value was the corresponding biomarker response rate for adults minus 5%.
Selection of the Primary Sampling UnitsThe PSUs for EPHIA 2017-2018 were defined as the EAs created for the 2007 Ethiopia Population and Housing Census. The sampling frame consisted of slightly over 17,000 urban EAs containing an estimated 3.0 million households at the time of the 2007 census. EAs in six of the nine zones in the Somali region were excluded from the sampling frame for security reasons.
A stratified sample of 395 EAs were selected from the sampling frame. The 11 strata specified for sampling were the urban centers of the 11 regions of Ethiopia. Two of the originally-sampled enumeration areas were found to no longer contain households because they had all been destroyed. These two EAs are considered to be out-of-scope (ineligible) and were deleted from the study sample. Thus, 393 of the 395 sampled EAs remained in the study for data collection.
The EA samples were selected systematically and with probabilities proportionate to a measure of size (MOS) equal to the number of households in the EA based on the 2007 Ethiopia Population and Housing Census. Prior to selection, the EAs were sorted by type of EA, including whether it was was within a large urban area (population >50,000) or a small urban area (population ≤50,000), and by region, zone within region, wereda (district) within zone, town within wereda, kebele (ward or neighborhood) within town, and finally by EA within kebele. Sorting of the EAs prior to sample selection induces an implicit geographic stratification. To select the sample from a particular stratum, the cumulative MOS was determined for each EA in the ordered list of EAs, and the sample selections were designated using a sampling interval equal to the total MOS of the EAs in the stratum divided by the number of EAs to be selected and a random starting point. The resulting sample had the property that the probability of selecting an EA within a particular stratum was proportional to the MOS of the EA in the stratum.
Details regarding EA substitution and segmentation may be found in the EPHIA 2017-2018 Sampling and Weighting Technical Report available on the https://phia.icap.columbia.edu/.
Selection of HouseholdsFor both sampling and analysis purposes, a household was defined as a group of individuals who reside in a physical structure such as a house, apartment, compound, or homestead, and share in housekeeping arrangements. The physical structure in which people reside was referred to as the dwelling unit, which may have contained more than one household meeting the above definition. Households were eligible for participation in the study if they were located within the sampled EA.
The selection of households for EPHIA 2017-2018 involved the following steps: (1) listing the dwelling units/households within the sampled EAs; (2) assigning eligibility codes to the listed dwelling unit/household records; (3) selecting the samples of dwelling units/households; and (4) designating a subsample of households for data collection for children.
A description of the household listing process as well as a summary of household eligibility may be found in the EPHIA 2017-2018 Sampling and Weighting Technical Report on the https://phia.icap.columbia.edu/.
Selection of households utilized an equal probability design. In order to achieve equal probability samples of households within each of the 11 regions’ urban areas, the sampling rates required to select dwelling units/households within an EA depended on the difference between the MOS used in sampling and the actual number of dwelling units/households found at the time of listing in late 2017. Thus, application of these within-EA sampling rates could have yielded more or less than the desired 30 households in EAs where the sampling MOS differs from the actual listing count. The EPHIA 2017-2018 Sampling and Weighting Technical Report provides an in-depth description of the equal probability sample design, as well as a detailed summary of the results of the household selection.
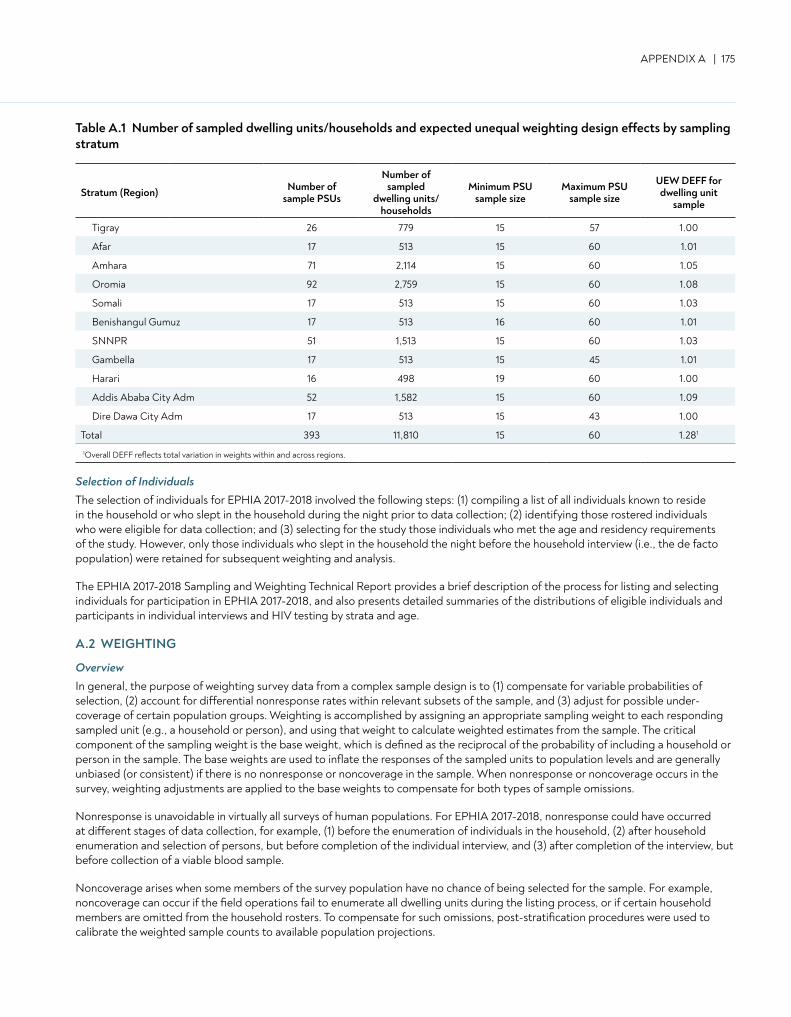
APPENDIX A | 175
Stratum (Region) Number of sample PSUs
Number of sampled
dwelling units/ households
Minimum PSU sample size
Maximum PSU sample size
UEW DEFF for dwelling unit
sample
Tigray 26 779 15 57 1.00
Afar 17 513 15 60 1.01
Amhara 71 2,114 15 60 1.05
Oromia 92 2,759 15 60 1.08
Somali 17 513 15 60 1.03
Benishangul Gumuz 17 513 16 60 1.01
SNNPR 51 1,513 15 60 1.03
Gambella 17 513 15 45 1.01
Harari 16 498 19 60 1.00
Addis Ababa City Adm 52 1,582 15 60 1.09
Dire Dawa City Adm 17 513 15 43 1.00
Total 393 11,810 15 60 1.281
1Overall DEFF reflects total variation in weights within and across regions.
Selection of IndividualsThe selection of individuals for EPHIA 2017-2018 involved the following steps: (1) compiling a list of all individuals known to reside in the household or who slept in the household during the night prior to data collection; (2) identifying those rostered individuals who were eligible for data collection; and (3) selecting for the study those individuals who met the age and residency requirements of the study. However, only those individuals who slept in the household the night before the household interview (i.e., the de facto population) were retained for subsequent weighting and analysis.
The EPHIA 2017-2018 Sampling and Weighting Technical Report provides a brief description of the process for listing and selecting individuals for participation in EPHIA 2017-2018, and also presents detailed summaries of the distributions of eligible individuals and participants in individual interviews and HIV testing by strata and age.
A.2 WEIGHTING
OverviewIn general, the purpose of weighting survey data from a complex sample design is to (1) compensate for variable probabilities of selection, (2) account for differential nonresponse rates within relevant subsets of the sample, and (3) adjust for possible under-coverage of certain population groups. Weighting is accomplished by assigning an appropriate sampling weight to each responding sampled unit (e.g., a household or person), and using that weight to calculate weighted estimates from the sample. The critical component of the sampling weight is the base weight, which is defined as the reciprocal of the probability of including a household or person in the sample. The base weights are used to inflate the responses of the sampled units to population levels and are generally unbiased (or consistent) if there is no nonresponse or noncoverage in the sample. When nonresponse or noncoverage occurs in the survey, weighting adjustments are applied to the base weights to compensate for both types of sample omissions.
Nonresponse is unavoidable in virtually all surveys of human populations. For EPHIA 2017-2018, nonresponse could have occurred at different stages of data collection, for example, (1) before the enumeration of individuals in the household, (2) after household enumeration and selection of persons, but before completion of the individual interview, and (3) after completion of the interview, but before collection of a viable blood sample.
Noncoverage arises when some members of the survey population have no chance of being selected for the sample. For example, noncoverage can occur if the field operations fail to enumerate all dwelling units during the listing process, or if certain household members are omitted from the household rosters. To compensate for such omissions, post-stratification procedures were used to calibrate the weighted sample counts to available population projections.
Table A.1 Number of sampled dwelling units/households and expected unequal weighting design effects by sampling stratum
176 | Ethiopia Population-based HIV Impact Assessment (EPHIA) 2017-2018
MethodsThe overall weighting approach for EPHIA 2017-2018 included several steps. Methods and results for each of the steps below are detailed in the EPHIA 2017-2018 Sampling and Weighting Technical Report.
Initial checks: Checks of the data files were carried out as part of the survey and data QC, and the probabilities of selection for PSUs and households were calculated and checked.
Creation of jackknife replicates: The variables needed to create the jackknife replicates for variance estimation were established at this point. This step was implemented immediately after the PSU sample was selected. All of the subsequent weighting steps described below were applied to the full sample, and to each of the jackknife replicates.
Calculation of PSU base weights: The weighting process began with the calculation and checking of the sample PSU (EA) base weights as the reciprocals of the overall PSU probabilities of selection.
Calculation of household weights: The next step was to calculate household weights. The household base weights were calculated as the PSU weights times the reciprocal of the within-PSU household selection probabilities. The household base weights were adjusted first to account for dwelling units for which it could not be determined whether the dwelling unit contained an eligible household and then the responding households had their weights adjusted to account for nonresponding eligible households. This adjustment was made based on the EA the households were in, and the resulting weight was the final household weight.
Calculation of person-level interview weights: Once the household weights were determined, they were used to calculate the individual base weights. The individual base weights were then adjusted for nonresponse among the eligible individuals, with a final adjustment for the individual weights to compensate for under-coverage in the sampling process by post-stratifying (i.e., weighting up) to 2017 population projections.
Calculation of person-level HIV testing weights: The individual weights adjusted for nonresponse were in turn the initial weights for the HIV testing data sample, with a further adjustment for nonresponse to HIV testing, and a final post-stratification adjustment to compensate for under-coverage.
Application of weighting adjustments to jackknife replicates: All of the adjustment processes were applied to the full sample and the replicate samples so that the final set of full sample and replicate weights could be used for variance estimation that accounted for the complex sample design and every step of the weighting process.
A.3 REFERENCES
1. Central Statistical Agency [Ethiopia] (CSA) and ICF International. Ethiopia Demographic and Health Survey 2011. Addis Ababa, Ethiopia and Calverton, Maryland, United States: CSA and ICF International; 2012. https://dhsprogram.com/pubs/pdf/FR255/FR255.pdf. Accessed September 17, 2019.
2. Joint United Nations Programme on HIV/AIDS. UNAIDS data tables, 2014. http://aidsinfo.unaids.org/. Accessed September 17, 2019.
APPENDIX B | 177
APPENDIX B HIV TESTING METHODOLOGY
B.1 SPECIMEN COLLECTION AND HANDLING
Blood was collected by qualified survey staff from consenting participants: 14 mL of venous blood from adults, 5 mL from children aged 2-14 years and 1 mL of capillary blood from adults (ages 15-64 years) who either refused to give venous blood or failed to be collected using vacuum tubes, and from children aged 0-2 years—using finger-stick for children aged 6-24 months, and heel-stick for infants younger than 6 months of age.
Blood samples were labeled with a unique barcoded participant identification number and stored in temperature-controlled cooler boxes with well-frozen Techni-Ice (Techni-Ice Australia Factory Outlet Address: 3 Finch St, Frankston, Victoria, Australia) at the field level. At the end of each day, samples were transported to a satellite laboratory for processing into plasma aliquots and dried blood spots (DBS), and were frozen and stored at -20°C within 24 hours of blood collection. Samples were transported on a weekly basis to the national HIV reference laboratory, EPHI, in Addis Ababa for additional testing and long-term storage at -80°C.
B.2 HOUSEHOLD-BASED PROCEDURES
HIV Rapid TestingHIV rapid testing was conducted in each household in accordance with Ethiopia’s national guidelines (Figure B.2.A). HIV-positive and HIV-indeterminate samples underwent additional testing at a satellite laboratory, as described in section B.3. For participants with a self-reported HIV-positive status but who tested HIV negative during the survey, additional testing was conducted at EPHI, as described in section B.3. For children younger than the age of 18 months, only the initial rapid test was performed. If the test was reactive, the sample underwent additional virological testing at EPHI, as described in section B.3.
CD4 Testing All participants who tested HIV positive and a random sample of 2% of participants who tested HIV negative received a CD4 T-cell count measurement in the field by qualified survey staff. The measurement was performed using a Pima™ Analyzer and Pima™ CD4 Cartridge (Abbott Molecular Inc., Chicago, Illinois, United States, formerly Alere).
Counseling, Referral to Care, and Active Linkage to CarePre- and post-test counseling were conducted in each household in accordance with Ethiopia’s national guidelines. For adults aged 18 years or older (or emancipated minors), results were communicated directly to the participant, while for minors under the age of 18 years, results were communicated to a parent or guardian (with the presence of the adolescent for those 15-17 years of age). All participants who consented to HIV testing were asked to share contact information and to select a referral health facility prior to testing. Participants with an HIV-positive test result were referred to HIV care and treatment at the health facility of their choice, while participants with an HIV-indeterminate test result were advised to seek repeated testing at the health facility of their choice in four weeks. Further, HIV-positive participants were asked to consent to be contacted by qualified healthcare personnel in order to facilitate active linkage to HIV care and treatment in Ethiopia’s healthcare system.
In rare cases where participants were provided an incorrect HIV test result, reported an HIV-positive status but tested HIV negative during the survey, or required additional collection of blood to complete testing, households were revisited by qualified personnel to provide participants with correct information and guidance on appropriate actions.
Quality Assurance and ControlTo control the quality of the performance of HIV rapid tests, field staff conducted testing of a panel of HIV-positive and HIV-negative DTS on a weekly basis. To assure the quality of the performance of field staff conducting HIV testing, proficiency testing using a panel of blinded HIV-positive and HIV-negative DTS was evaluated twice during the course of fieldwork. Additionally, sample re-testing was conducted at a satellite lab for (1) the first 50 samples tested by each field staff member, (2) a random sample of 5% of HIV-negative specimens, and (3) all HIV-indeterminate specimens.
A limitation of the survey was the limited potential of rapid tests to detect low levels of HIV antibodies among people within the serological window of infection and in HIV-positive patients on ART. Participants in these two categories were not expected to be a significant source of bias. However, it is possible that this study did not identify all HIV-exposed infants who would need further PCR testing to verify HIV status. Although the survey used the methodology commonly practiced at the time, studies cited in a recent WHO programmatic update suggest that the use of rapid tests to establish HIV-exposure status may be unreliable in some HIV-infected infants.1,2,3
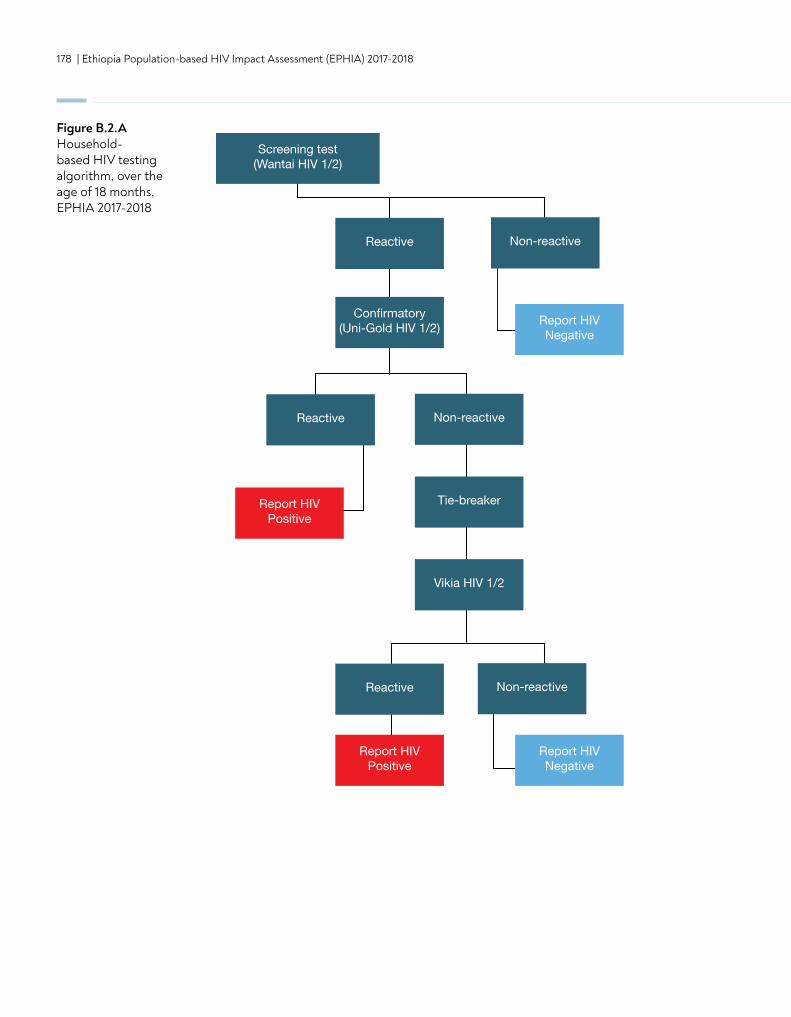
178 | Ethiopia Population-based HIV Impact Assessment (EPHIA) 2017-2018
Screening test(Wantai HIV 1/2)
Reactive Non-reactive
Reactive Non-reactive
Reactive Non-reactive
Confirmatory(Uni-Gold HIV 1/2) Report HIV
Negative
Report HIVNegative
Report HIVPositive
Report HIVPositive
Tie-breaker
Vikia HIV 1/2
HIV Negative HIV Positive
TargetNot Detected
TargetNot Detected
HIV TNA PCR1
(EID2)
Figure B.2.A Household-based HIV testing algorithm, over the age of 18 months, EPHIA 2017-2018
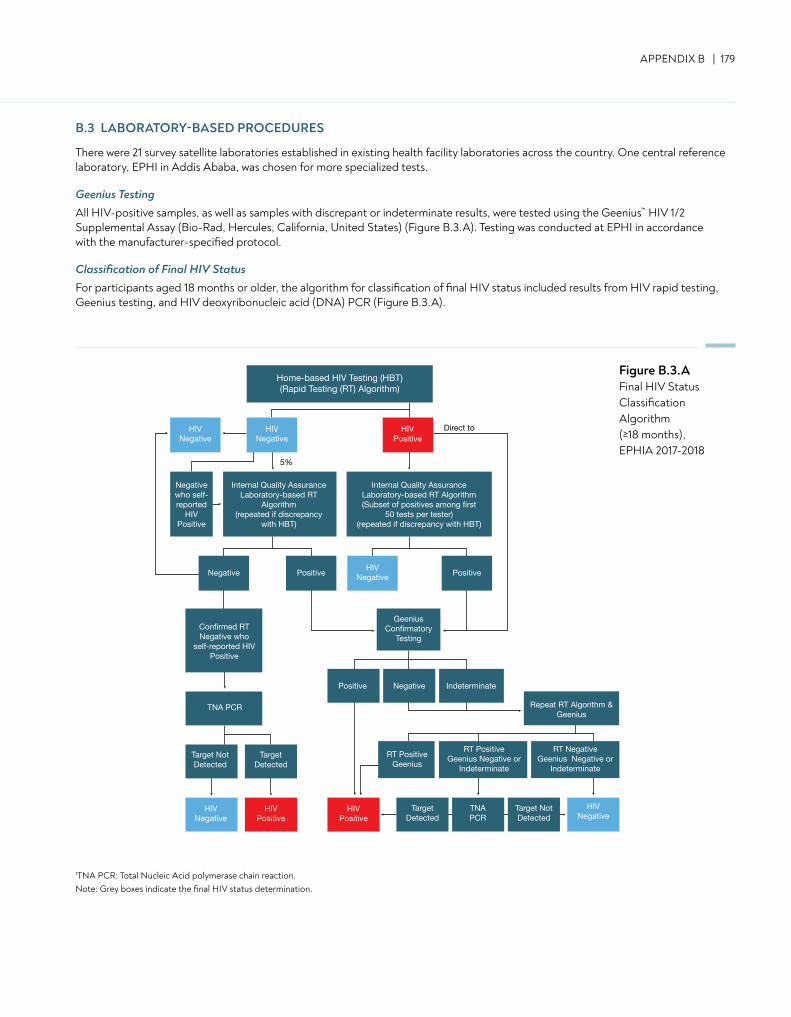
APPENDIX B | 179
B.3 LABORATORY-BASED PROCEDURES
There were 21 survey satellite laboratories established in existing health facility laboratories across the country. One central reference laboratory, EPHI in Addis Ababa, was chosen for more specialized tests.
Geenius Testing All HIV-positive samples, as well as samples with discrepant or indeterminate results, were tested using the Geenius™ HIV 1/2 Supplemental Assay (Bio-Rad, Hercules, California, United States) (Figure B.3.A). Testing was conducted at EPHI in accordance with the manufacturer-specified protocol.
Classification of Final HIV StatusFor participants aged 18 months or older, the algorithm for classification of final HIV status included results from HIV rapid testing, Geenius testing, and HIV deoxyribonucleic acid (DNA) PCR (Figure B.3.A).
1TNA PCR: Total Nucleic Acid polymerase chain reaction.Note: Grey boxes indicate the final HIV status determination.
Home-based HIV Testing (HBT)(Rapid Testing (RT) Algorithm)
HIVNegative
HIVNegative
HIVNegative
HIVNegative
HIVPositive
HIVPositive
HIVNegative
Negative who self-reported
HIV Positive
Geenius Confirmatory
TestingConfirmed RTNegative who
self-reported HIVPositive
Internal Quality AssuranceLaboratory-based RT
Algorithm(repeated if discrepancy
with HBT)
Internal Quality AssuranceLaboratory-based RT Algorithm(Subset of positives among first
50 tests per tester)(repeated if discrepancy with HBT)
HIVPositive
5%
Direct to
Negative
Negative Indeterminate
TNA PCR
Positive Positive
Positive
Target NotDetected
TargetDetected
TargetDetected
Target NotDetected
RT NegativeGeenius Negative or
Indeterminate
RT PositiveGeenius Negative or
Indeterminate
Repeat RT Algorithm & Geenius
RT PositiveGeenius
TNAPCR
1TNA PCR: Total Nucleic Acid polymerase chain reaction.Note: Grey boxes indicate the final HIV status determination.
Figure B.3.AFinal HIV Status Classification Algorithm (≥18 months), EPHIA 2017-2018
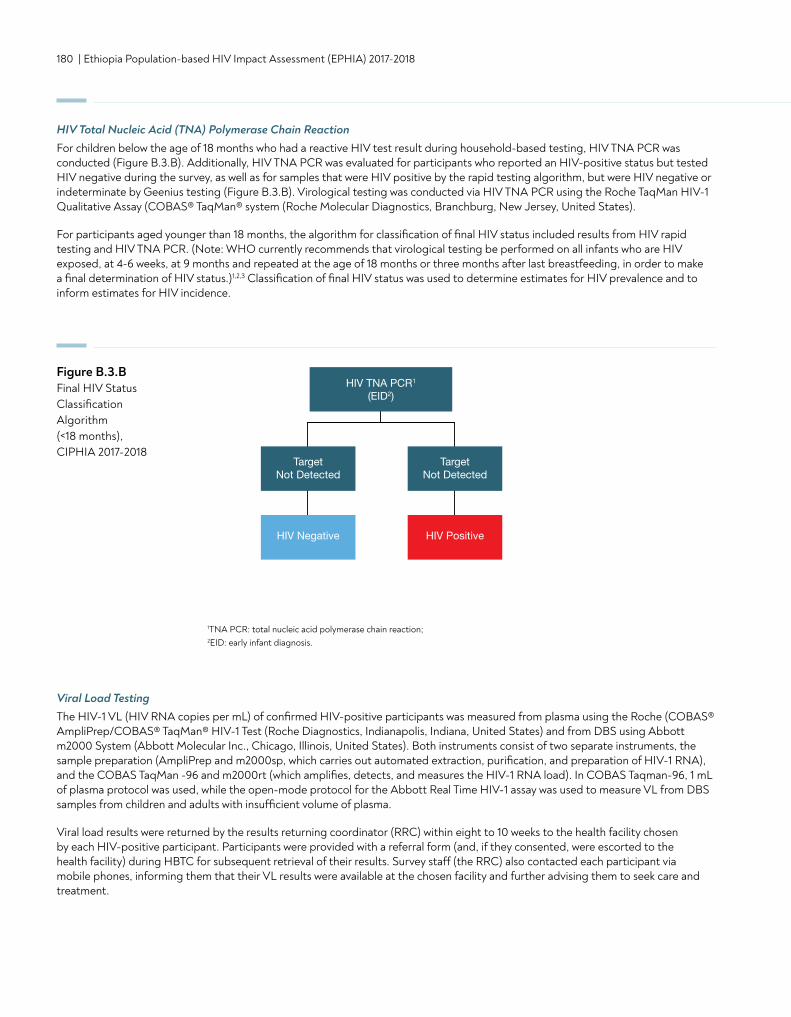
180 | Ethiopia Population-based HIV Impact Assessment (EPHIA) 2017-2018
HIV Total Nucleic Acid (TNA) Polymerase Chain Reaction For children below the age of 18 months who had a reactive HIV test result during household-based testing, HIV TNA PCR was conducted (Figure B.3.B). Additionally, HIV TNA PCR was evaluated for participants who reported an HIV-positive status but tested HIV negative during the survey, as well as for samples that were HIV positive by the rapid testing algorithm, but were HIV negative or indeterminate by Geenius testing (Figure B.3.B). Virological testing was conducted via HIV TNA PCR using the Roche TaqMan HIV-1 Qualitative Assay (COBAS® TaqMan® system (Roche Molecular Diagnostics, Branchburg, New Jersey, United States).
For participants aged younger than 18 months, the algorithm for classification of final HIV status included results from HIV rapid testing and HIV TNA PCR. (Note: WHO currently recommends that virological testing be performed on all infants who are HIV exposed, at 4-6 weeks, at 9 months and repeated at the age of 18 months or three months after last breastfeeding, in order to make a final determination of HIV status.)1,2,3 Classification of final HIV status was used to determine estimates for HIV prevalence and to inform estimates for HIV incidence.
Figure B.3.BFinal HIV Status Classification Algorithm (<18 months), CIPHIA 2017-2018
1TNA PCR: total nucleic acid polymerase chain reaction; 2EID: early infant diagnosis.
Viral Load TestingThe HIV-1 VL (HIV RNA copies per mL) of confirmed HIV-positive participants was measured from plasma using the Roche (COBAS® AmpliPrep/COBAS® TaqMan® HIV-1 Test (Roche Diagnostics, Indianapolis, Indiana, United States) and from DBS using Abbott m2000 System (Abbott Molecular Inc., Chicago, Illinois, United States). Both instruments consist of two separate instruments, the sample preparation (AmpliPrep and m2000sp, which carries out automated extraction, purification, and preparation of HIV-1 RNA), and the COBAS TaqMan -96 and m2000rt (which amplifies, detects, and measures the HIV-1 RNA load). In COBAS Taqman-96, 1 mL of plasma protocol was used, while the open-mode protocol for the Abbott Real Time HIV-1 assay was used to measure VL from DBS samples from children and adults with insufficient volume of plasma.
Viral load results were returned by the results returning coordinator (RRC) within eight to 10 weeks to the health facility chosen by each HIV-positive participant. Participants were provided with a referral form (and, if they consented, were escorted to the health facility) during HBTC for subsequent retrieval of their results. Survey staff (the RRC) also contacted each participant via mobile phones, informing them that their VL results were available at the chosen facility and further advising them to seek care and treatment.
Screening test(Wantai HIV 1/2)
Reactive Non-reactive
Reactive Non-reactive
Reactive Non-reactive
Confirmatory(Uni-Gold HIV 1/2) Report HIV
Negative
Report HIVNegative
Report HIVPositive
Report HIVPositive
Tie-breaker
Vikia HIV 1/2
HIV Negative HIV Positive
TargetNot Detected
TargetNot Detected
HIV TNA PCR1
(EID2)
APPENDIX B | 181
Infant HIV Virological TestingFor infants younger than 18 months of age who screened positive for HIV during HBTC, virological testing was conducted via HIV TNA PCR using the Roche Taqman HIV-1 Qualitative Assay (COBAS® TaqMan® system (Roche Molecular Diagnostics, Branchburg, New Jersey, United States). Results were returned to a health facility selected by the child’s parent or guardian within eight weeks, and the RRC also contacted the parent or guardian via telephone to inform them that the child’s results were available at the facility.
HIV Recency TestingTo distinguish recent from long-term HIV infections, in order to estimate incidence, the survey used two different laboratory-based testing algorithms. Each algorithm employed a combination of assays: 1) HIV-1 Limiting Antigen (LAg)-Avidity Enzyme Immunoassay (EIA) (Sedia Biosciences Corporation, Portland, Oregon, United States) and VL (Figure B.3.C) and 2) HIV-1 LAg Avidity EIA, VL, and antiretroviral (ARV) detection (Figure B.3.D).
LAg avidity testing was performed twice, with an initial screening test followed by a confirmatory test. Samples with a ODn > 2.0 during initial testing were classified as long-term infections, while those with ODn ≤ 2.0 underwent further testing of the specimen in triplicate. Samples with a median ODn > 1.5 during confirmatory testing were classified as long-term infections. Samples with a median ODn < 0.4 were retested using the HIV diagnostic testing algorithm to confirm HIV-1-positive classification, and samples identified as HIV-1 negative were excluded from the total number of HIV positives and incorporated into the total number of negative specimens for incidence estimation.
Samples with a median ODn ≤ 1.5 were classified as potential HIV-recent infections, and their VL results were assessed. For the first incidence testing algorithm, specimens with VL <1,000 copies/mL were classified as long-term infections, while those with VL ≥ 1,000 copies/mL were classified as recent infections. Specimens with median ODn ≤ 1.5 using LAg avidity testing were classified as potential recent infections, and their VL results were assessed. Specimens with VL < 1,000 copies/mL were classified as long-term infections, while those with VL ≥ 1,000 copies/mL were classified as recent infections (Figure B.3.C).
In the ARV-adjusted algorithm, specimens with VL ≥ 1,000 copies/mL and with detectable ARVs were classified as long-term infections. Specimens with VL ≥ 1,000 copies/mL and without detectable ARVs were classified as recent infections (Figure B.3.D). (Note: In EPHIA, one case was reclassified as recent because the participant reported having an initial positive HIV test and ART initiation within three months of the survey interview.)
The HIV recent infection testing algorithms were applied to repository specimens from all confirmed HIV-positive participants aged 18 months and older.
For the updated incidence algorithm, those classified as recent infections by the first algorithm were reclassified using ARV detection data. Those specimens in which efavirenz, lopinavir, and tenofovir were detected were classified as long-term infections and those in which no ARVs were detected remained classified as recent infections.
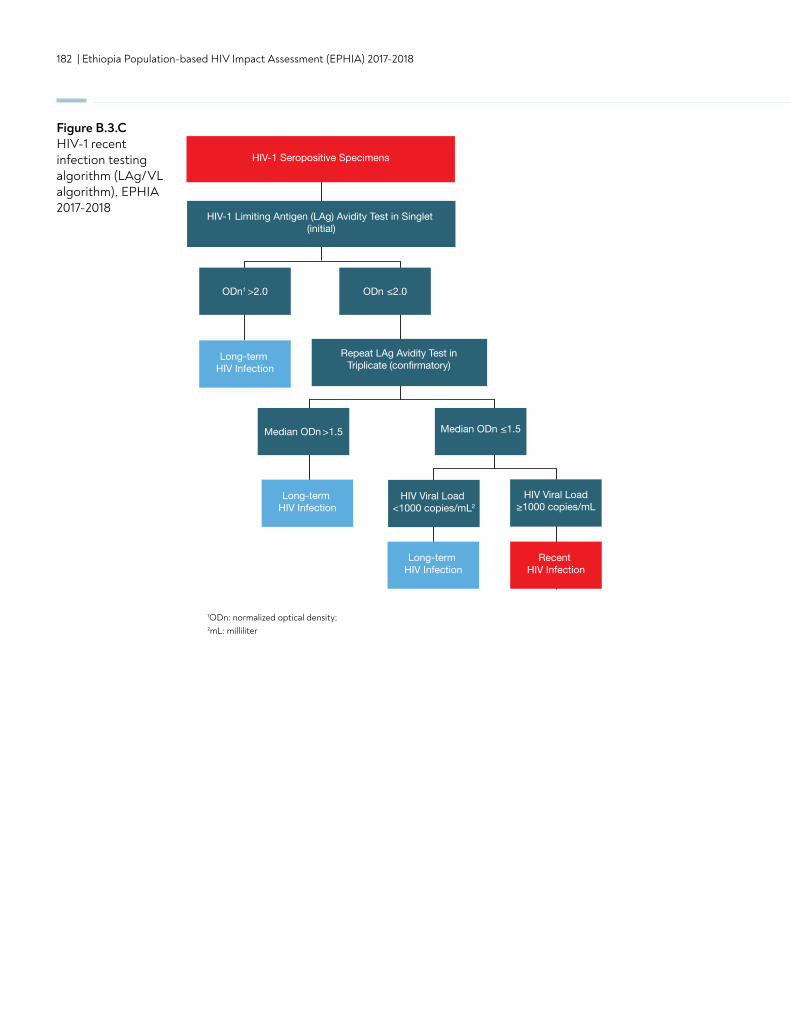
182 | Ethiopia Population-based HIV Impact Assessment (EPHIA) 2017-2018
1ODn: normalized optical density; 2mL: milliliter
Figure B.3.C HIV-1 recent infection testing algorithm (LAg/VL algorithm), EPHIA 2017-2018
HIV-1 Limiting Antigen (LAg) Avidity Test in Singlet (initial)
ODn1 >2.0 ODn ≤2.0
Median ODn >1.5 Median ODn ≤1.5
HIV Viral Load ≥1000 copies/mL
Repeat LAg Avidity Test inTriplicate (confirmatory)
HIV-1 Seropositive Specimens
Long-term HIV Infection
Long-term HIV Infection
Recent HIV Infection
Long-term HIV Infection
HIV Viral Load <1000 copies/mL2
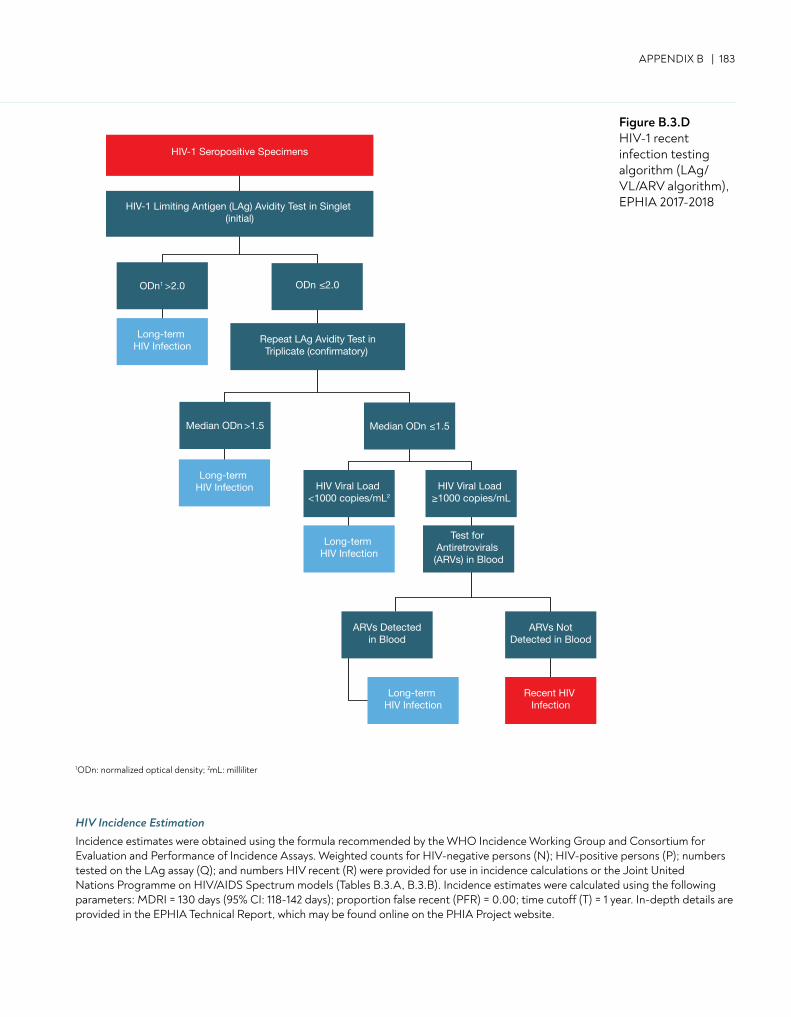
APPENDIX B | 183
Figure B.3.D HIV-1 recent infection testing algorithm (LAg/VL/ARV algorithm), EPHIA 2017-2018
1ODn: normalized optical density; 2mL: milliliter
HIV-1 Seropositive Specimens
ODn1 >2.0 ODn ≤2.0
Median ODn >1.5 Median ODn ≤1.5
HIV-1 Limiting Antigen (LAg) Avidity Test in Singlet (initial)
Long-term HIV Infection
Long-term HIV Infection
Long-term HIV Infection
Long-term HIV Infection
Repeat LAg Avidity Test inTriplicate (confirmatory)
HIV Viral Load <1000 copies/mL2
Recent HIV Infection
ARVs NotDetected in Blood
Test for Antiretrovirals (ARVs) in Blood
HIV Viral Load ≥1000 copies/mL
ARVs Detectedin Blood
HIV Incidence Estimation Incidence estimates were obtained using the formula recommended by the WHO Incidence Working Group and Consortium for Evaluation and Performance of Incidence Assays. Weighted counts for HIV-negative persons (N); HIV-positive persons (P); numbers tested on the LAg assay (Q); and numbers HIV recent (R) were provided for use in incidence calculations or the Joint United Nations Programme on HIV/AIDS Spectrum models (Tables B.3.A, B.3.B). Incidence estimates were calculated using the following parameters: MDRI = 130 days (95% CI: 118-142 days); proportion false recent (PFR) = 0.00; time cutoff (T) = 1 year. In-depth details are provided in the EPHIA Technical Report, which may be found online on the PHIA Project website.
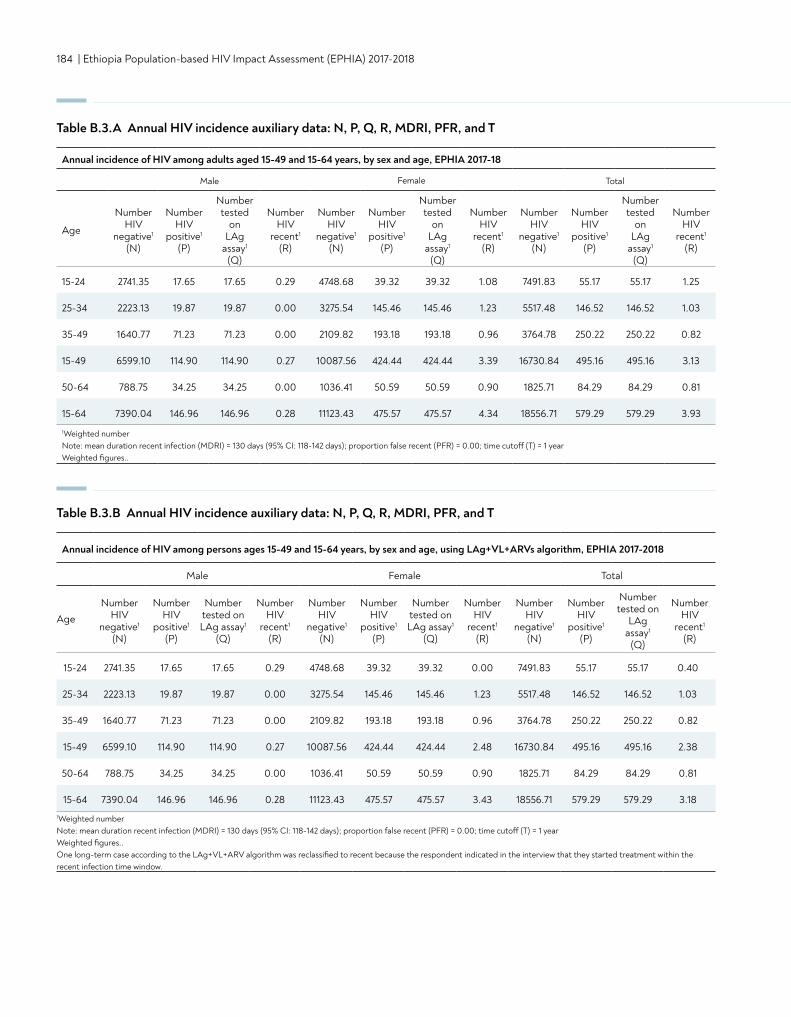
184 | Ethiopia Population-based HIV Impact Assessment (EPHIA) 2017-2018
Annual incidence of HIV among adults aged 15-49 and 15-64 years, by sex and age, EPHIA 2017-18
Male Female Total
Age
Number HIV
negative1
(N)
Number HIV
positive1
(P)
Number tested
on LAg
assay1 (Q)
Number HIV
recent1
(R)
Number HIV
negative1
(N)
Number HIV
positive1
(P)
Number tested
on LAg
assay1 (Q)
Number HIV
recent1
(R)
Number HIV
negative1
(N)
Number HIV
positive1
(P)
Number tested
on LAg
assay1 (Q)
Number HIV
recent1
(R)
15-24 2741.35 17.65 17.65 0.29 4748.68 39.32 39.32 1.08 7491.83 55.17 55.17 1.25
25-34 2223.13 19.87 19.87 0.00 3275.54 145.46 145.46 1.23 5517.48 146.52 146.52 1.03
35-49 1640.77 71.23 71.23 0.00 2109.82 193.18 193.18 0.96 3764.78 250.22 250.22 0.82
15-49 6599.10 114.90 114.90 0.27 10087.56 424.44 424.44 3.39 16730.84 495.16 495.16 3.13
50-64 788.75 34.25 34.25 0.00 1036.41 50.59 50.59 0.90 1825.71 84.29 84.29 0.81
15-64 7390.04 146.96 146.96 0.28 11123.43 475.57 475.57 4.34 18556.71 579.29 579.29 3.93
1Weighted number Note: mean duration recent infection (MDRI) = 130 days (95% CI: 118-142 days); proportion false recent (PFR) = 0.00; time cutoff (T) = 1 year Weighted figures..
Table B.3.A Annual HIV incidence auxiliary data: N, P, Q, R, MDRI, PFR, and T
Table B.3.B Annual HIV incidence auxiliary data: N, P, Q, R, MDRI, PFR, and T
Annual incidence of HIV among persons ages 15-49 and 15-64 years, by sex and age, using LAg+VL+ARVs algorithm, EPHIA 2017-2018
Male Female Total
AgeNumber
HIV negative1
(N)
Number HIV
positive1
(P)
Number tested on LAg assay1
(Q)
Number HIV
recent1
(R)
Number HIV
negative1
(N)
Number HIV
positive1
(P)
Number tested on LAg assay1
(Q)
Number HIV
recent1
(R)
Number HIV
negative1
(N)
Number HIV
positive1
(P)
Number tested on
LAg assay1
(Q)
Number HIV
recent1
(R)
15-24 2741.35 17.65 17.65 0.29 4748.68 39.32 39.32 0.00 7491.83 55.17 55.17 0.40
25-34 2223.13 19.87 19.87 0.00 3275.54 145.46 145.46 1.23 5517.48 146.52 146.52 1.03
35-49 1640.77 71.23 71.23 0.00 2109.82 193.18 193.18 0.96 3764.78 250.22 250.22 0.82
15-49 6599.10 114.90 114.90 0.27 10087.56 424.44 424.44 2.48 16730.84 495.16 495.16 2.38
50-64 788.75 34.25 34.25 0.00 1036.41 50.59 50.59 0.90 1825.71 84.29 84.29 0.81
15-64 7390.04 146.96 146.96 0.28 11123.43 475.57 475.57 3.43 18556.71 579.29 579.29 3.181Weighted number Note: mean duration recent infection (MDRI) = 130 days (95% CI: 118-142 days); proportion false recent (PFR) = 0.00; time cutoff (T) = 1 year Weighted figures.. One long-term case according to the LAg+VL+ARV algorithm was reclassified to recent because the respondent indicated in the interview that they started treatment within the recent infection time window.
APPENDIX B | 185
Detection of Antiretrovirals To understand recent exposure to ARVs and hence level of ART coverage, samples from all confirmed HIV-positive participants were evaluated for the presence of selected ARVs, using high-resolution liquid chromatography coupled with tandem mass spectrometry to detect ARVs from DBS specimens.4
As detection of all ARVs in use at the time of the survey was cost-prohibitive, three ARVs, efavirenz, lopinavir, and tenofovir, were selected as markers for the most commonly prescribed first and second line regimens. Samples from participants who had suppressed viral loads and/or reported being on ART, but had no evidence of the first three compounds, were tested for nevirapine. These ARVs were also selected based on their relatively long half-lives, allowing for a longer period of detection following intake.
To qualitatively detect ARVs, a single DBS was eluted, and chromatographic separation carried out on a Luna 5 μm PFP column (110 Å, 50 x 2 mm) (Phenomonex, Torrance, California, United States). Each ARV was detected using an API 4000 LC/MS/MS instrument (Applied Biosystems, Foster City, California, United States). Internal standards and in-house QC cut-off samples, including negative controls, were utilized in each run. This qualitative method used a limit of detection of 0.02 μg/mL for each ARV, with a signal-to-noise ratio of at least 5:1 for all ARVs. Samples with concentrations above 0.02 μg/mL were considered positive for each ARV.
ARV detection was performed by the Division of Clinical Pharmacology of the Department of Medicine at the University of Cape Town in South Africa.
Genotyping for Detection of Antiretroviral Drug Resistance and HIV SubtypingTo determine the extent of transmitted HIV-1 drug resistance mutations among participants in EPHIA 2017-2018, samples from confirmed HIV-positive infants below the age of 18 months and HIV-positive participants aged 18 months or older who were classified as recent infections, as well as an equal or greater number of whom were classified as long-term infections, were evaluated using a TaqMan® SNP Genotyping Assay (Applied Biosystems) to identify mutations within the HIV-1 pol gene region, which encodes amino acid substitutions known to be responsible for resistance to specific ARVs.
Viral RNA or TNA from plasma or DBS was extracted using the NucliSENS® easyMAG® (bioMerieux, SA, F-69280 Marcy l’Etoile, France) platform. The HIV pol gene was amplified by one-step reverse transcription polymerase chain reaction, which was followed by nested PCR. Sequencing of the approximately one-kilobase amplicons was performed on the ABI 3730 DNA Analyzer (Applied Biosystems, Foster City, California, United States).5,6,7
The customized RECall software program was used to edit raw sequences and generate consensus sequences.6 Mutations in the protease and reverse transcriptase genes were classified as potentially associated with drug resistance, according to the Stanford University HIV Drug Resistance Database.8 Sequences with >98% homology were flagged for potential cross-contamination or possible epidemiological links. Internal QA measures and in-house QC standards were included in each run, in order to validate results. The assay’s sensitivity was established at 1000 copies/mL for plasma and DBS.9 Sequences were also analyzed for potential cross-contamination by phylogenetic analysis from code 6 of the protease gene to code 251 of the reverse transcriptase gene.
Subtyping of each sample was performed using the REGA HIV-1 & 2 Automated Subtyping Tool.10, 11, 12 This BioAfrica viral subtyping tool was designed to use phylogenetic methods in order to identify the HIV-1 subtype of a specific sequence. The sequence was analyzed for recombination using boot-scanning methods.
186 | Ethiopia Population-based HIV Impact Assessment (EPHIA) 2017-2018
B.4 REFERENCES
1. World Health Organization. HIV diagnosis and ARV use in HIV-exposed infants: a programmatic update. Geneva, Switzerland: World Health Organization; 2018 (WHO/CDS/HIV/18.17). https://apps.who.int/iris/bitstream/handle/10665/273155/WHO-CDS-HIV-18.17-eng.pdf?ua=1. Accessed April 30, 2019.
2. Urick B, Fong Y, Okiira C, Nabukeera-Barungi N, Nansera D, Ochola E, et al. Rapid Serological Tests Ineffectively Screen for HIV Exposure in HIV-Positive Infants. JAIDS. 2018;77(3):331-6.
3. Wagner AD, Njuguna IN, Andere RA, Cranmer LM, Okinyi HM, Benki-Nugent S, et al. Infant/child rapid serology tests fail to reliably assess HIV exposure among sick hospitalized infants. AIDS. 2017;31(11):F1-F7.
4. Koal T, Burhenne H, Römlinag R, Svoboda M, Resch K, Kaever V. Quantification of antiretroviral drugs in dried blood spot samples by means of liquid chromatography/tandem mass spectrometry. Rapid Commun Mass Spectrom. 2005;19(21):2995-3001.
5. Loens K, Bergs K, Ursi D, Goossens H, Ieven M. Evaluation of NucliSens easyMAG for automated nucleic acid extraction from various clinical specimens. J Clin Microbiol. 2007 Feb;45(2):421-5. Epub 2006 Dec 13.
6. Perandin F, Pollara PC, Gargiulo F, Bonfanti C, Manca N. Performance evaluation of the automated NucliSens easyMAG nucleic acid extraction platform in comparison with QIAamp Mini kit from clinical specimens. Diagn Microbiol Infect Dis. 2009 Jun;64(2):158-65. doi: 10.1016/j.diagmicrobio.2009.02.013.
7. Joint United Nations Programme on HIV/AIDS (UNAIDS). Global report: UNAIDS report on the global AIDS epidemic 2010. Geneva, Switzerland: UNAIDS; 2010. http://www.unaids.org/globalreport/documents/20101123_GlobalReport_full_en.pdf. Accessed February 19, 2019.
8. Woods CK, Brumme CJ, Liu TF, et al. Automating HIV drug resistance genotyping with RECall, a freely accessible sequence analysis tool. J Clin Microbiol. 2012 Jun;50(6):1936-42. doi: 10.1128/JCM.06689-11. Epub 2012 Mar 7.
9. Stanford University. HIV Drug Resistance Database. Stanford, California: Stanford University; 2019. http://hivdb.stanford.edu. Accessed February 19, 2019.
10. Yang C, McNulty A, Diallo K, et al. Development and application of a broadly sensitive dried-bloodspot-based genotyping assay for global surveillance of HIV-1 drug resistance. J Clin Microbiol. 2010;48(9):3158-64. doi: 10.1128/JCM.00564-10.
11. Alcantara LC, Cassol S, Libin P, et al. A standardized framework for accurate, high-throughput genotyping of recombinant and non-recombinant viral sequences. Nucleic Acids Res. 2009;37 (Web Server issue):W634-42. doi: 10.1093/nar/gkp455.
12. de Oliveira T, Deforche K, Cassol S, et al. An automated genotyping system for analysis of HIV-1 and other microbial sequences. Bioinformatics. 2005 Oct 1;21(19):3797-800. doi: 10.1093/bioinformatics/bti607.
APPENDIX C | 187
Estimates from sample surveys are affected by two types of errors: non-sampling errors and sampling errors. Non-sampling errors result from mistakes made during data collection (e.g., misinterpretation of an HIV test result) and data management (e.g., transcription errors in data entry). While EPHIA 2017-2018 implemented numerous QA and QC measures to minimize non-sampling errors, these errors are impossible to avoid and difficult to evaluate statistically.
In contrast, sampling errors can be evaluated statistically. The sample of respondents selected for EPHIA 2017-2018 is only one of many samples that could have been selected from the same population, using the same design and expected size. Each of these samples would yield results that differ somewhat from the results of the actual sample selected. Sampling errors are a measure of the variability between all possible samples. Although the degree of variability is not known exactly, it can be estimated from the survey results.
The standard error, which is the square root of the variance, is the usual measurement of sampling error for a particular statistic (e.g., proportion, mean, rate, count). In turn, the standard error can be used to calculate confidence intervals within which the true value for the population can reasonably be assumed to fall. For example, for any given statistic calculated from a sample survey, the value of that statistic will fall within a range of approximately plus or minus two times the standard error of that statistic in 95 percent of all possible samples of identical size and design.
EPHIA 2017-2018 utilized a multi-stage stratified sample design, which required complex calculations to obtain sampling errors. Specifically, a variant of the jackknife replication method was implemented in SAS to estimate variance for proportions (e.g., HIV prevalence), rates (e.g., annual HIV incidence), and counts (e.g., numbers of people living with HIV). Each replication considered all but one cluster in the calculation of the estimates. Pseudo-independent replications were thus created. In EPHIA 2017-2018, a jackknife replicate was created by randomly deleting one cluster from each variance-estimation stratum and retaining all of the clusters in the remaining strata. A total of 193 variance-estimation strata were created by pairing (or occasionally tripling) the sample clusters in the systematic order in which they had been selected. Hence, 193 replications were created. The variance of a sample-based statistic, y, was calculated as follows:
where y is the full-sample estimate, and yk is the corresponding estimate for jackknife replicate k (k = 1, 2, ...K).
In addition to the standard error, the design effect for each estimate was also calculated. The design effect is defined as the ratio of the standard error using the given sample design to the standard error that would result if a simple random sample had been used. A design effect of 1.0 indicates that the sample design is as efficient as a simple random sample, while a value greater than 1.0 indicates the increase in the sampling error due to the use of a more complex and less statistically efficient design. Confidence limits for the estimates, which are calculated as
y ± t(0.975; K) var(y)
where t(0.975; K) is the 97.5th percentile of a t-distribution with K degrees of freedom, were also computed.
Sampling errors for selected variables from EPHIA 2017-2018 are presented in tables C.1 through C.8, and sampling errors for all survey estimates may be found online on the PHIA website. For each variable, sampling error tables include the weighted estimate, unweighted denominator, standard error, design effect, and lower and upper 95 percent confidence limits.
APPENDIX C ESTIMATES OF SAMPLING ERRORS
var(y) = ∑ k=1K (yk-y)2
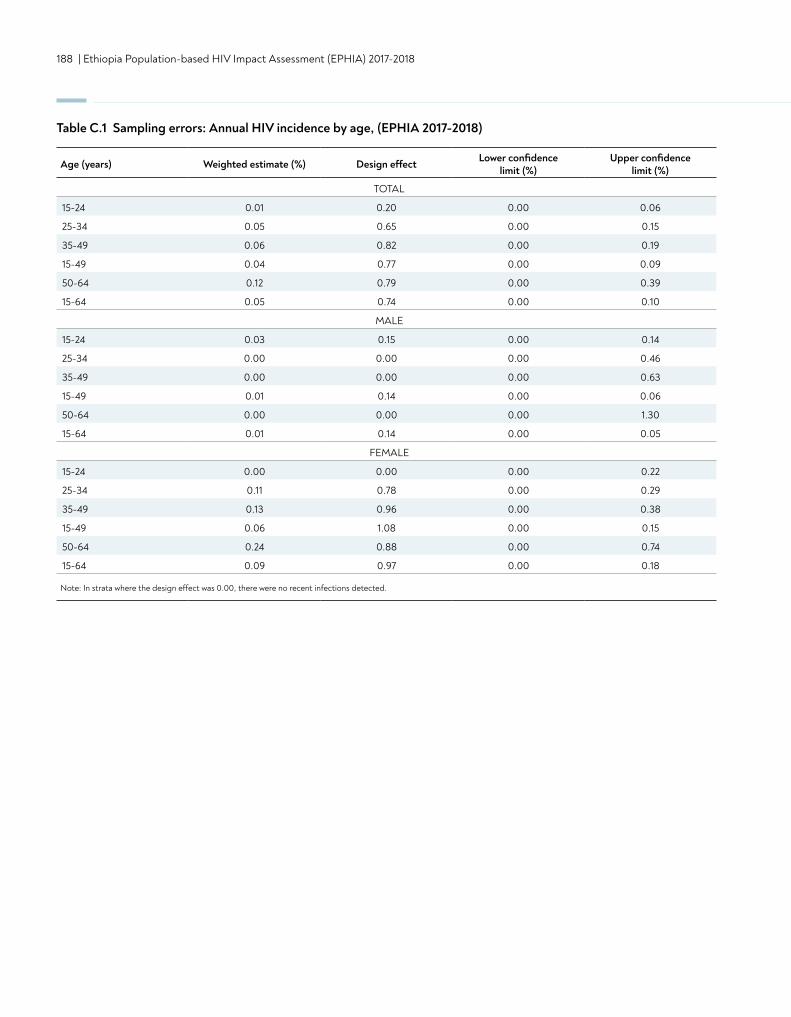
188 | Ethiopia Population-based HIV Impact Assessment (EPHIA) 2017-2018
Age (years) Weighted estimate (%) Design effect Lower confidence limit (%)
Upper confidence limit (%)
TOTAL
15-24 0.01 0.20 0.00 0.06
25-34 0.05 0.65 0.00 0.15
35-49 0.06 0.82 0.00 0.19
15-49 0.04 0.77 0.00 0.09
50-64 0.12 0.79 0.00 0.39
15-64 0.05 0.74 0.00 0.10
MALE
15-24 0.03 0.15 0.00 0.14
25-34 0.00 0.00 0.00 0.46
35-49 0.00 0.00 0.00 0.63
15-49 0.01 0.14 0.00 0.06
50-64 0.00 0.00 0.00 1.30
15-64 0.01 0.14 0.00 0.05
FEMALE
15-24 0.00 0.00 0.00 0.22
25-34 0.11 0.78 0.00 0.29
35-49 0.13 0.96 0.00 0.38
15-49 0.06 1.08 0.00 0.15
50-64 0.24 0.88 0.00 0.74
15-64 0.09 0.97 0.00 0.18
Note: In strata where the design effect was 0.00, there were no recent infections detected.
Table C.1 Sampling errors: Annual HIV incidence by age, (EPHIA 2017-2018)
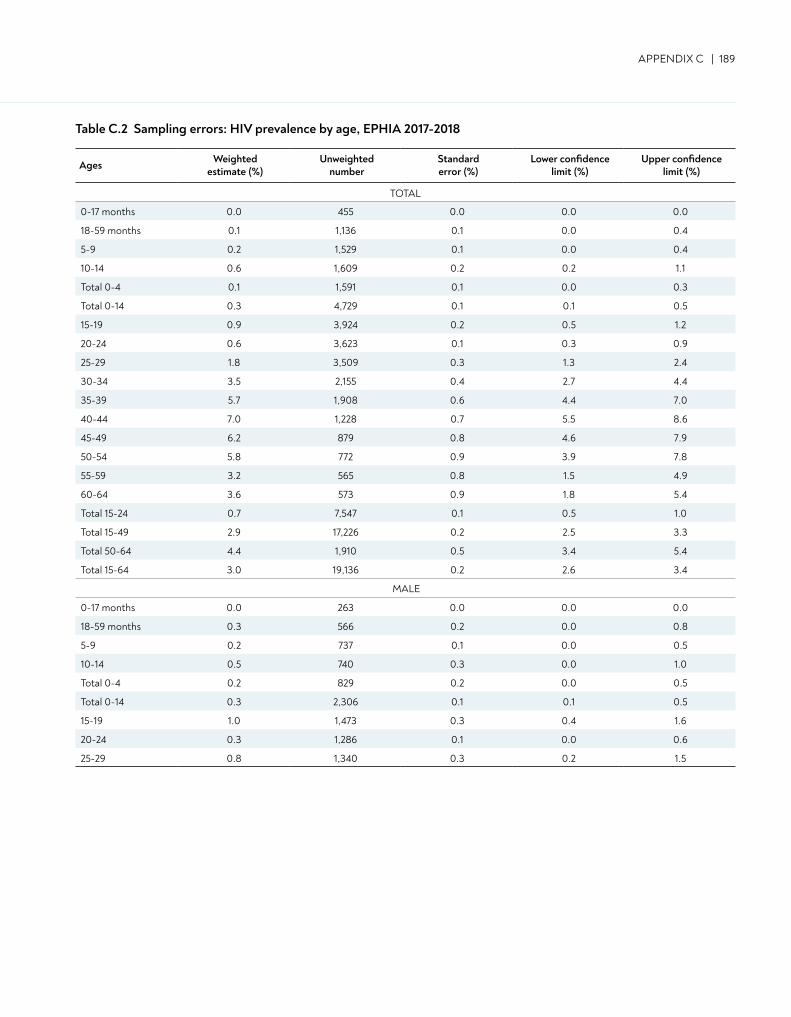
APPENDIX C | 189
Ages Weighted estimate (%)
Unweighted number
Standard error (%)
Lower confidence limit (%)
Upper confidence limit (%)
TOTAL
0-17 months 0.0 455 0.0 0.0 0.0
18-59 months 0.1 1,136 0.1 0.0 0.4
5-9 0.2 1,529 0.1 0.0 0.4
10-14 0.6 1,609 0.2 0.2 1.1
Total 0-4 0.1 1,591 0.1 0.0 0.3
Total 0-14 0.3 4,729 0.1 0.1 0.5
15-19 0.9 3,924 0.2 0.5 1.2
20-24 0.6 3,623 0.1 0.3 0.9
25-29 1.8 3,509 0.3 1.3 2.4
30-34 3.5 2,155 0.4 2.7 4.4
35-39 5.7 1,908 0.6 4.4 7.0
40-44 7.0 1,228 0.7 5.5 8.6
45-49 6.2 879 0.8 4.6 7.9
50-54 5.8 772 0.9 3.9 7.8
55-59 3.2 565 0.8 1.5 4.9
60-64 3.6 573 0.9 1.8 5.4
Total 15-24 0.7 7,547 0.1 0.5 1.0
Total 15-49 2.9 17,226 0.2 2.5 3.3
Total 50-64 4.4 1,910 0.5 3.4 5.4
Total 15-64 3.0 19,136 0.2 2.6 3.4
MALE
0-17 months 0.0 263 0.0 0.0 0.0
18-59 months 0.3 566 0.2 0.0 0.8
5-9 0.2 737 0.1 0.0 0.5
10-14 0.5 740 0.3 0.0 1.0
Total 0-4 0.2 829 0.2 0.0 0.5
Total 0-14 0.3 2,306 0.1 0.1 0.5
15-19 1.0 1,473 0.3 0.4 1.6
20-24 0.3 1,286 0.1 0.0 0.6
25-29 0.8 1,340 0.3 0.2 1.5
Table C.2 Sampling errors: HIV prevalence by age, EPHIA 2017-2018
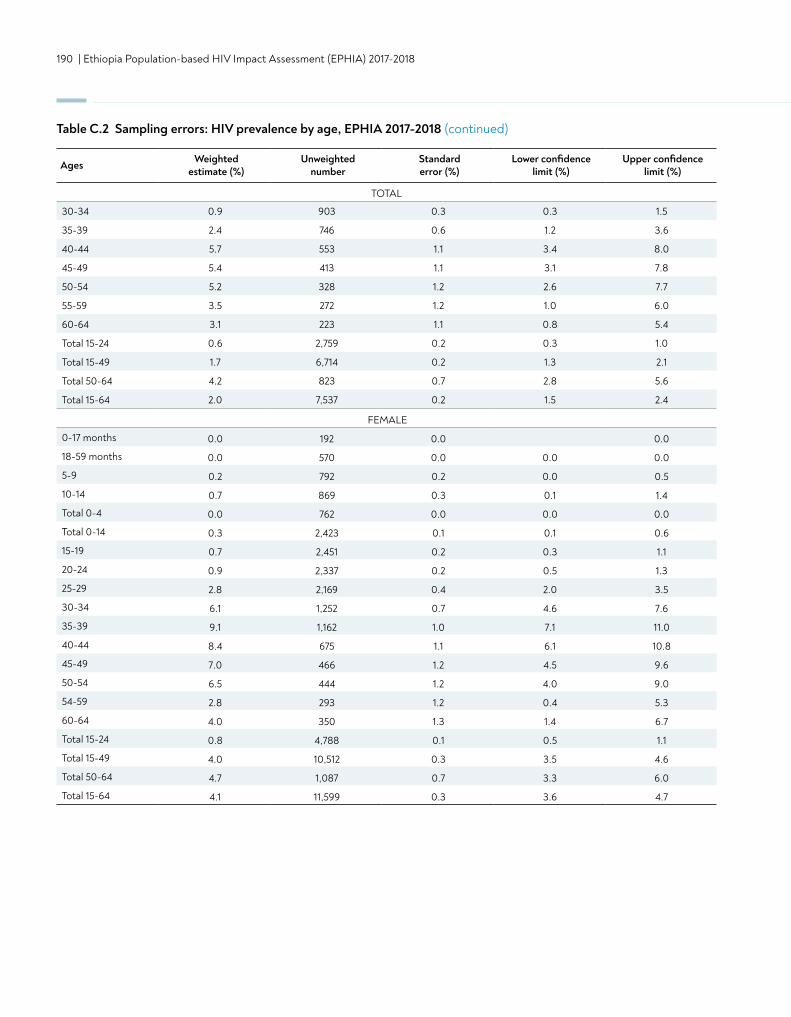
190 | Ethiopia Population-based HIV Impact Assessment (EPHIA) 2017-2018
Table C.2 Sampling errors: HIV prevalence by age, EPHIA 2017-2018 (continued)
Ages Weighted estimate (%)
Unweighted number
Standard error (%)
Lower confidence limit (%)
Upper confidence limit (%)
TOTAL
30-34 0.9 903 0.3 0.3 1.5
35-39 2.4 746 0.6 1.2 3.6
40-44 5.7 553 1.1 3.4 8.0
45-49 5.4 413 1.1 3.1 7.8
50-54 5.2 328 1.2 2.6 7.7
55-59 3.5 272 1.2 1.0 6.0
60-64 3.1 223 1.1 0.8 5.4
Total 15-24 0.6 2,759 0.2 0.3 1.0
Total 15-49 1.7 6,714 0.2 1.3 2.1
Total 50-64 4.2 823 0.7 2.8 5.6
Total 15-64 2.0 7,537 0.2 1.5 2.4
FEMALE
0-17 months 0.0 192 0.0 0.0
18-59 months 0.0 570 0.0 0.0 0.0
5-9 0.2 792 0.2 0.0 0.5
10-14 0.7 869 0.3 0.1 1.4
Total 0-4 0.0 762 0.0 0.0 0.0
Total 0-14 0.3 2,423 0.1 0.1 0.6
15-19 0.7 2,451 0.2 0.3 1.1
20-24 0.9 2,337 0.2 0.5 1.3
25-29 2.8 2,169 0.4 2.0 3.5
30-34 6.1 1,252 0.7 4.6 7.6
35-39 9.1 1,162 1.0 7.1 11.0
40-44 8.4 675 1.1 6.1 10.8
45-49 7.0 466 1.2 4.5 9.6
50-54 6.5 444 1.2 4.0 9.0
54-59 2.8 293 1.2 0.4 5.3
60-64 4.0 350 1.3 1.4 6.7
Total 15-24 0.8 4,788 0.1 0.5 1.1
Total 15-49 4.0 10,512 0.3 3.5 4.6
Total 50-64 4.7 1,087 0.7 3.3 6.0
Total 15-64 4.1 11,599 0.3 3.6 4.7
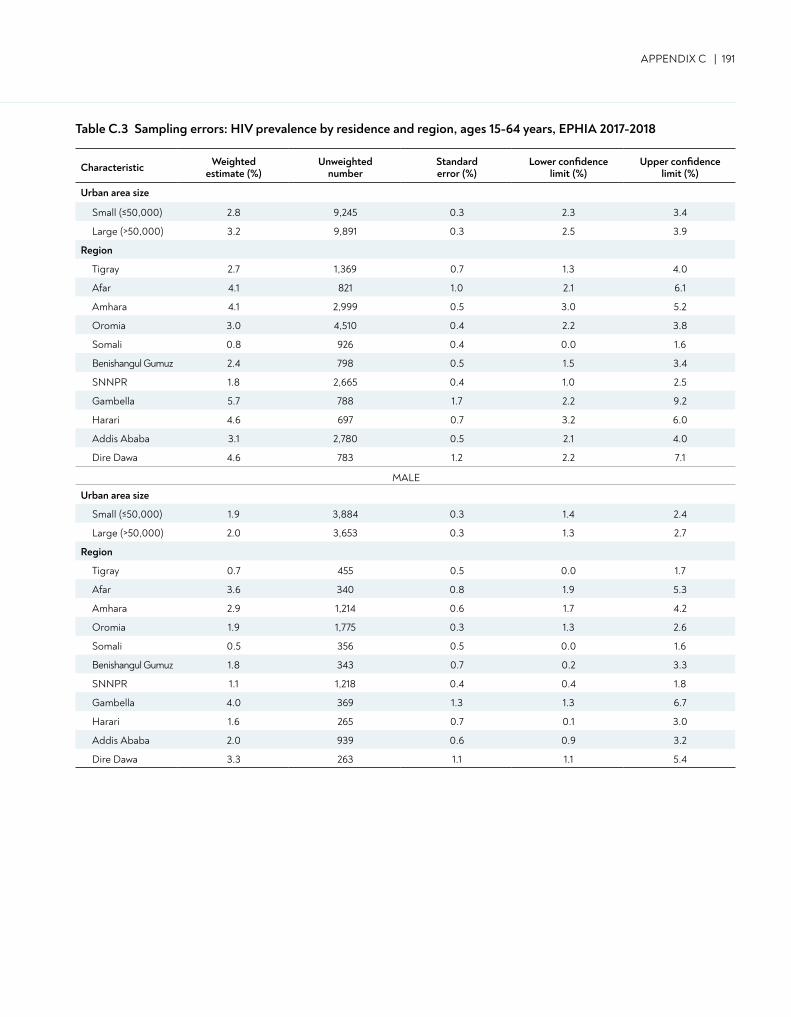
APPENDIX C | 191
Table C.3 Sampling errors: HIV prevalence by residence and region, ages 15-64 years, EPHIA 2017-2018
Characteristic Weightedestimate (%)
Unweightednumber
Standarderror (%)
Lower confidencelimit (%)
Upper confidencelimit (%)
Urban area size
Small (≤50,000) 2.8 9,245 0.3 2.3 3.4
Large (>50,000) 3.2 9,891 0.3 2.5 3.9
Region
Tigray 2.7 1,369 0.7 1.3 4.0
Afar 4.1 821 1.0 2.1 6.1
Amhara 4.1 2,999 0.5 3.0 5.2
Oromia 3.0 4,510 0.4 2.2 3.8
Somali 0.8 926 0.4 0.0 1.6
Benishangul Gumuz 2.4 798 0.5 1.5 3.4
SNNPR 1.8 2,665 0.4 1.0 2.5
Gambella 5.7 788 1.7 2.2 9.2
Harari 4.6 697 0.7 3.2 6.0
Addis Ababa 3.1 2,780 0.5 2.1 4.0
Dire Dawa 4.6 783 1.2 2.2 7.1
MALE
Urban area size
Small (≤50,000) 1.9 3,884 0.3 1.4 2.4
Large (>50,000) 2.0 3,653 0.3 1.3 2.7
Region
Tigray 0.7 455 0.5 0.0 1.7
Afar 3.6 340 0.8 1.9 5.3
Amhara 2.9 1,214 0.6 1.7 4.2
Oromia 1.9 1,775 0.3 1.3 2.6
Somali 0.5 356 0.5 0.0 1.6
Benishangul Gumuz 1.8 343 0.7 0.2 3.3
SNNPR 1.1 1,218 0.4 0.4 1.8
Gambella 4.0 369 1.3 1.3 6.7
Harari 1.6 265 0.7 0.1 3.0
Addis Ababa 2.0 939 0.6 0.9 3.2
Dire Dawa 3.3 263 1.1 1.1 5.4
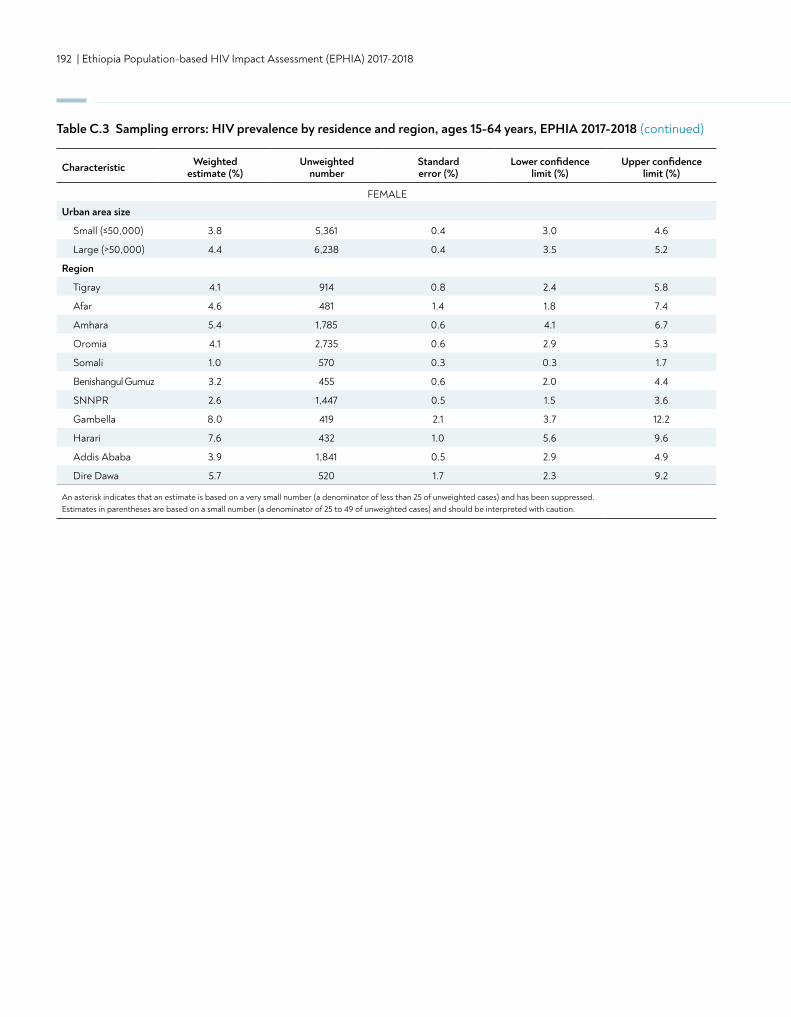
192 | Ethiopia Population-based HIV Impact Assessment (EPHIA) 2017-2018
Table C.3 Sampling errors: HIV prevalence by residence and region, ages 15-64 years, EPHIA 2017-2018 (continued)
FEMALE
Urban area size
Small (≤50,000) 3.8 5,361 0.4 3.0 4.6
Large (>50,000) 4.4 6,238 0.4 3.5 5.2
Region
Tigray 4.1 914 0.8 2.4 5.8
Afar 4.6 481 1.4 1.8 7.4
Amhara 5.4 1,785 0.6 4.1 6.7
Oromia 4.1 2,735 0.6 2.9 5.3
Somali 1.0 570 0.3 0.3 1.7
Benishangul Gumuz 3.2 455 0.6 2.0 4.4
SNNPR 2.6 1,447 0.5 1.5 3.6
Gambella 8.0 419 2.1 3.7 12.2
Harari 7.6 432 1.0 5.6 9.6
Addis Ababa 3.9 1,841 0.5 2.9 4.9
Dire Dawa 5.7 520 1.7 2.3 9.2
An asterisk indicates that an estimate is based on a very small number (a denominator of less than 25 of unweighted cases) and has been suppressed. Estimates in parentheses are based on a small number (a denominator of 25 to 49 of unweighted cases) and should be interpreted with caution.
Characteristic Weightedestimate (%)
Unweightednumber
Standarderror (%)
Lower confidencelimit (%)
Upper confidencelimit (%)
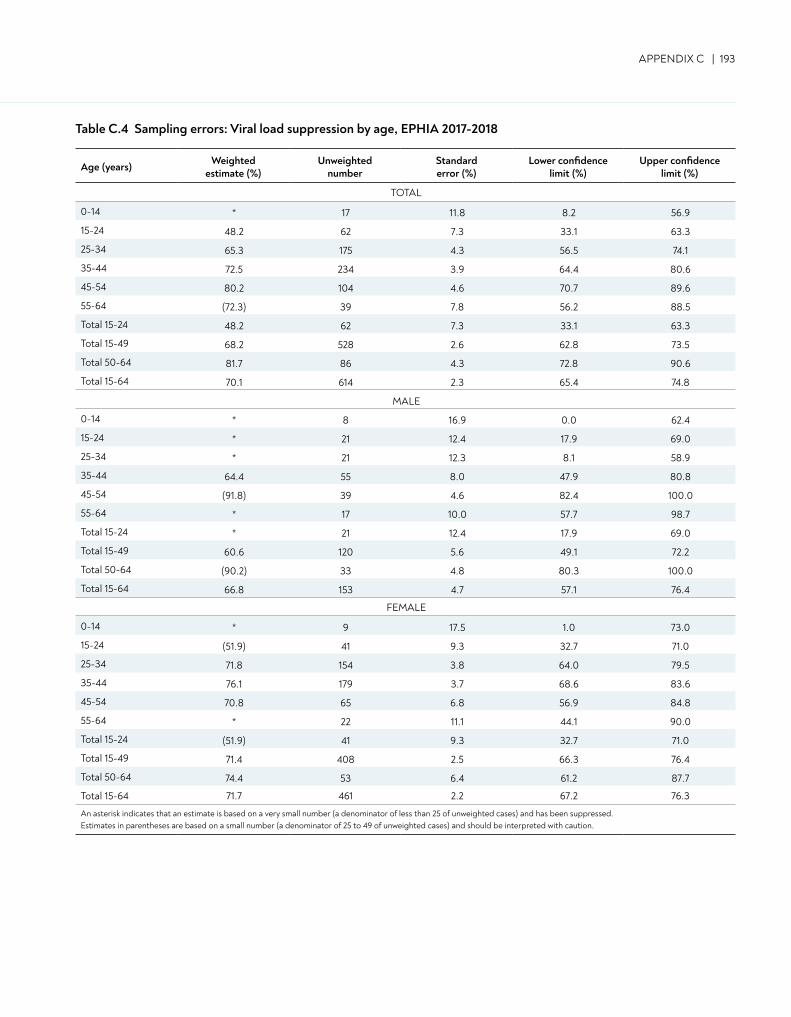
APPENDIX C | 193
Table C.4 Sampling errors: Viral load suppression by age, EPHIA 2017-2018
Age (years) Weighted estimate (%)
Unweighted number
Standard error (%)
Lower confidence limit (%)
Upper confidence limit (%)
TOTAL
0-14 * 17 11.8 8.2 56.9
15-24 48.2 62 7.3 33.1 63.3
25-34 65.3 175 4.3 56.5 74.1
35-44 72.5 234 3.9 64.4 80.6
45-54 80.2 104 4.6 70.7 89.6
55-64 (72.3) 39 7.8 56.2 88.5
Total 15-24 48.2 62 7.3 33.1 63.3
Total 15-49 68.2 528 2.6 62.8 73.5
Total 50-64 81.7 86 4.3 72.8 90.6
Total 15-64 70.1 614 2.3 65.4 74.8
MALE
0-14 * 8 16.9 0.0 62.4
15-24 * 21 12.4 17.9 69.0
25-34 * 21 12.3 8.1 58.9
35-44 64.4 55 8.0 47.9 80.8
45-54 (91.8) 39 4.6 82.4 100.0
55-64 * 17 10.0 57.7 98.7
Total 15-24 * 21 12.4 17.9 69.0
Total 15-49 60.6 120 5.6 49.1 72.2
Total 50-64 (90.2) 33 4.8 80.3 100.0
Total 15-64 66.8 153 4.7 57.1 76.4
FEMALE
0-14 * 9 17.5 1.0 73.0
15-24 (51.9) 41 9.3 32.7 71.0
25-34 71.8 154 3.8 64.0 79.5
35-44 76.1 179 3.7 68.6 83.6
45-54 70.8 65 6.8 56.9 84.8
55-64 * 22 11.1 44.1 90.0
Total 15-24 (51.9) 41 9.3 32.7 71.0
Total 15-49 71.4 408 2.5 66.3 76.4
Total 50-64 74.4 53 6.4 61.2 87.7
Total 15-64 71.7 461 2.2 67.2 76.3
An asterisk indicates that an estimate is based on a very small number (a denominator of less than 25 of unweighted cases) and has been suppressed. Estimates in parentheses are based on a small number (a denominator of 25 to 49 of unweighted cases) and should be interpreted with caution.
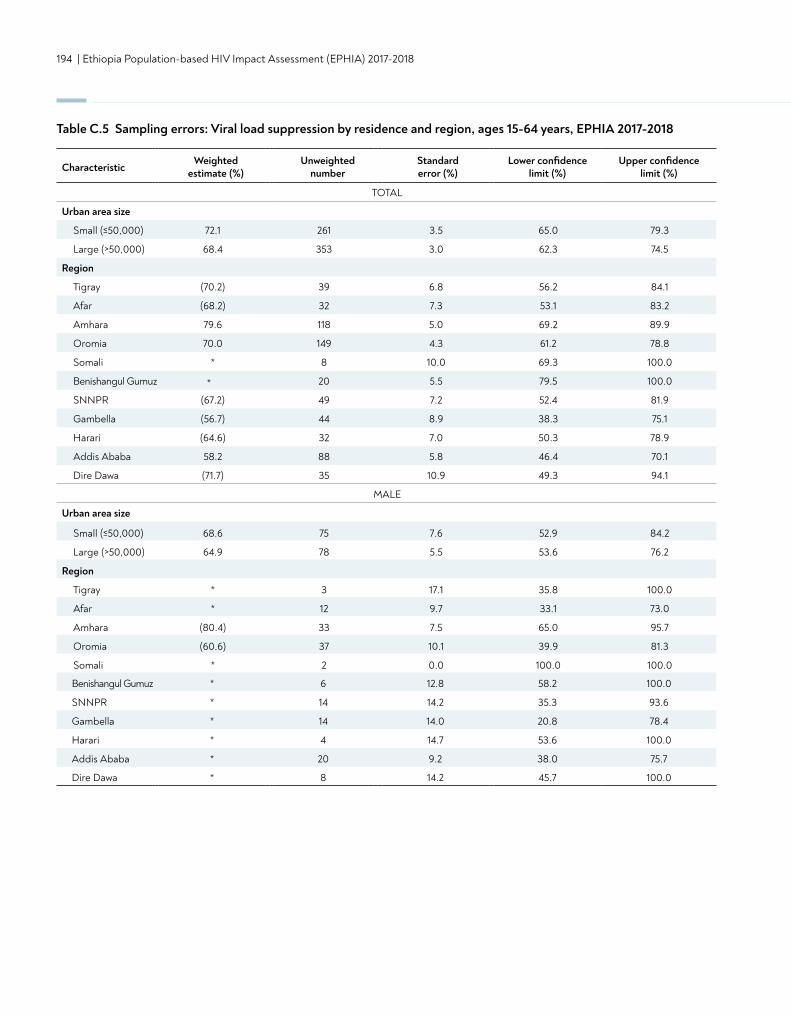
194 | Ethiopia Population-based HIV Impact Assessment (EPHIA) 2017-2018
Table C.5 Sampling errors: Viral load suppression by residence and region, ages 15-64 years, EPHIA 2017-2018
CharacteristicWeighted
estimate (%) Unweighted
numberStandard error (%)
Lower confidence limit (%)
Upper confidence limit (%)
TOTAL
Urban area size
Small (≤50,000) 72.1 261 3.5 65.0 79.3
Large (>50,000) 68.4 353 3.0 62.3 74.5
Region
Tigray (70.2) 39 6.8 56.2 84.1
Afar (68.2) 32 7.3 53.1 83.2
Amhara 79.6 118 5.0 69.2 89.9
Oromia 70.0 149 4.3 61.2 78.8
Somali * 8 10.0 69.3 100.0
Benishangul Gumuz 20 5.5 79.5 100.0
SNNPR (67.2) 49 7.2 52.4 81.9
Gambella (56.7) 44 8.9 38.3 75.1
Harari (64.6) 32 7.0 50.3 78.9
Addis Ababa 58.2 88 5.8 46.4 70.1
Dire Dawa (71.7) 35 10.9 49.3 94.1
MALE
Urban area size
Small (≤50,000) 68.6 75 7.6 52.9 84.2
Large (>50,000) 64.9 78 5.5 53.6 76.2
Region
Tigray * 3 17.1 35.8 100.0
Afar * 12 9.7 33.1 73.0
Amhara (80.4) 33 7.5 65.0 95.7
Oromia (60.6) 37 10.1 39.9 81.3
Somali * 2 0.0 100.0 100.0
Benishangul Gumuz * 6 12.8 58.2 100.0
SNNPR * 14 14.2 35.3 93.6
Gambella * 14 14.0 20.8 78.4
Harari * 4 14.7 53.6 100.0
Addis Ababa * 20 9.2 38.0 75.7
Dire Dawa * 8 14.2 45.7 100.0
*
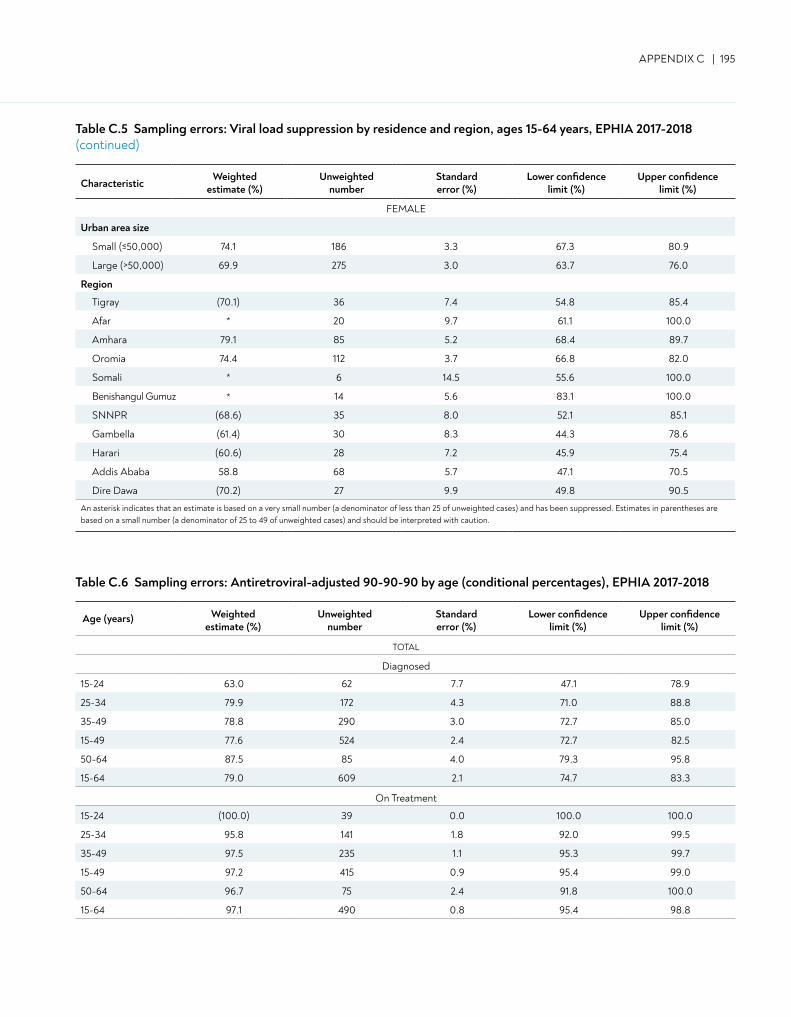
APPENDIX C | 195
CharacteristicWeighted
estimate (%) Unweighted
numberStandard error (%)
Lower confidence limit (%)
Upper confidence limit (%)
FEMALE
Urban area size
Small (≤50,000) 74.1 186 3.3 67.3 80.9
Large (>50,000) 69.9 275 3.0 63.7 76.0
Region
Tigray (70.1) 36 7.4 54.8 85.4
Afar * 20 9.7 61.1 100.0
Amhara 79.1 85 5.2 68.4 89.7
Oromia 74.4 112 3.7 66.8 82.0
Somali * 6 14.5 55.6 100.0
Benishangul Gumuz 14 5.6 83.1 100.0
SNNPR (68.6) 35 8.0 52.1 85.1
Gambella (61.4) 30 8.3 44.3 78.6
Harari (60.6) 28 7.2 45.9 75.4
Addis Ababa 58.8 68 5.7 47.1 70.5
Dire Dawa (70.2) 27 9.9 49.8 90.5
An asterisk indicates that an estimate is based on a very small number (a denominator of less than 25 of unweighted cases) and has been suppressed. Estimates in parentheses are based on a small number (a denominator of 25 to 49 of unweighted cases) and should be interpreted with caution.
Table C.5 Sampling errors: Viral load suppression by residence and region, ages 15-64 years, EPHIA 2017-2018(continued)
Table C.6 Sampling errors: Antiretroviral-adjusted 90-90-90 by age (conditional percentages), EPHIA 2017-2018
Age (years) Weighted estimate (%)
Unweighted number
Standard error (%)
Lower confidence limit (%)
Upper confidence limit (%)
TOTAL
Diagnosed
15-24 63.0 62 7.7 47.1 78.9
25-34 79.9 172 4.3 71.0 88.8
35-49 78.8 290 3.0 72.7 85.0
15-49 77.6 524 2.4 72.7 82.5
50-64 87.5 85 4.0 79.3 95.8
15-64 79.0 609 2.1 74.7 83.3
On Treatment
15-24 (100.0) 39 0.0 100.0 100.0
25-34 95.8 141 1.8 92.0 99.5
35-49 97.5 235 1.1 95.3 99.7
15-49 97.2 415 0.9 95.4 99.0
50-64 96.7 75 2.4 91.8 100.0
15-64 97.1 490 0.8 95.4 98.8
*
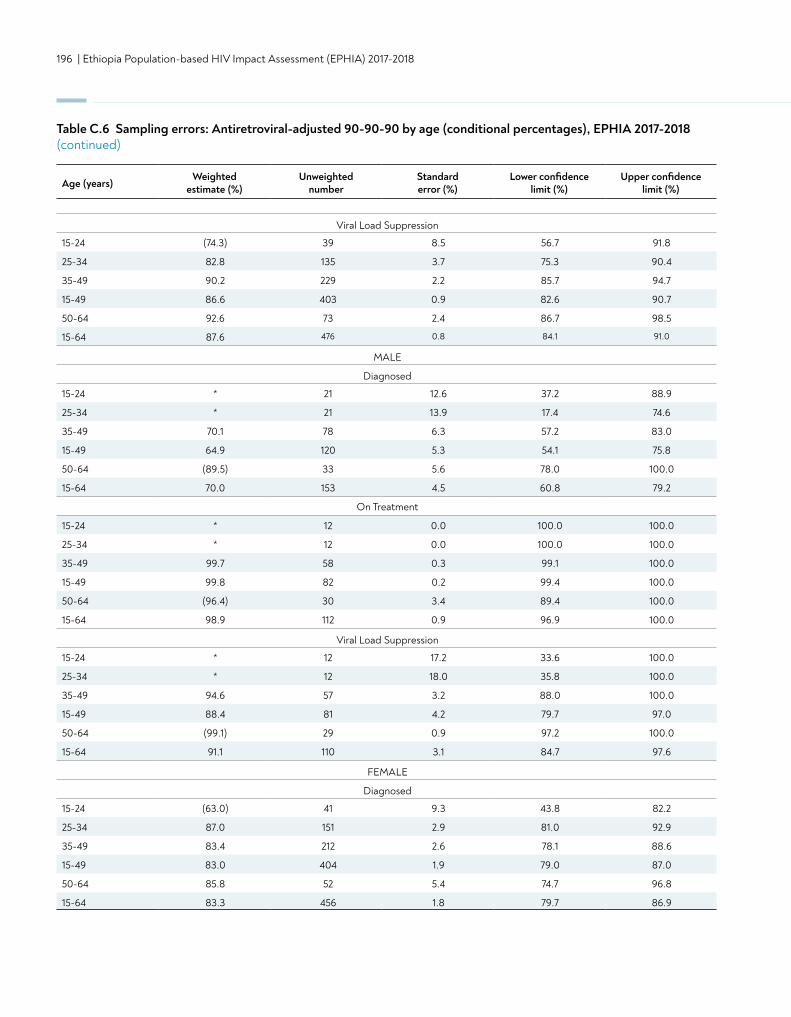
196 | Ethiopia Population-based HIV Impact Assessment (EPHIA) 2017-2018
Viral Load Suppression
15-24 (74.3) 39 8.5 56.7 91.8
25-34 82.8 135 3.7 75.3 90.4
35-49 90.2 229 2.2 85.7 94.7
15-49 86.6 403 0.9 82.6 90.7
50-64 92.6 73 2.4 86.7 98.5
15-64 87.6 476 0.8 84.1 91.0
MALE
Diagnosed
15-24 * 21 12.6 37.2 88.9
25-34 * 21 13.9 17.4 74.6
35-49 70.1 78 6.3 57.2 83.0
15-49 64.9 120 5.3 54.1 75.8
50-64 (89.5) 33 5.6 78.0 100.0
15-64 70.0 153 4.5 60.8 79.2
On Treatment
15-24 * 12 0.0 100.0 100.0
25-34 * 12 0.0 100.0 100.0
35-49 99.7 58 0.3 99.1 100.0
15-49 99.8 82 0.2 99.4 100.0
50-64 (96.4) 30 3.4 89.4 100.0
15-64 98.9 112 0.9 96.9 100.0
Viral Load Suppression
15-24 * 12 17.2 33.6 100.0
25-34 * 12 18.0 35.8 100.0
35-49 94.6 57 3.2 88.0 100.0
15-49 88.4 81 4.2 79.7 97.0
50-64 (99.1) 29 0.9 97.2 100.0
15-64 91.1 110 3.1 84.7 97.6
FEMALE
Diagnosed
15-24 (63.0) 41 9.3 43.8 82.2
25-34 87.0 151 2.9 81.0 92.9
35-49 83.4 212 2.6 78.1 88.6
15-49 83.0 404 1.9 79.0 87.0
50-64 85.8 52 5.4 74.7 96.8
15-64 83.3 456 1.8 79.7 86.9
Table C.6 Sampling errors: Antiretroviral-adjusted 90-90-90 by age (conditional percentages), EPHIA 2017-2018(continued)
Age (years)Weighted
estimate (%)Unweighted
numberStandard error (%)
Lower confidence limit (%)
Upper confidence limit (%)
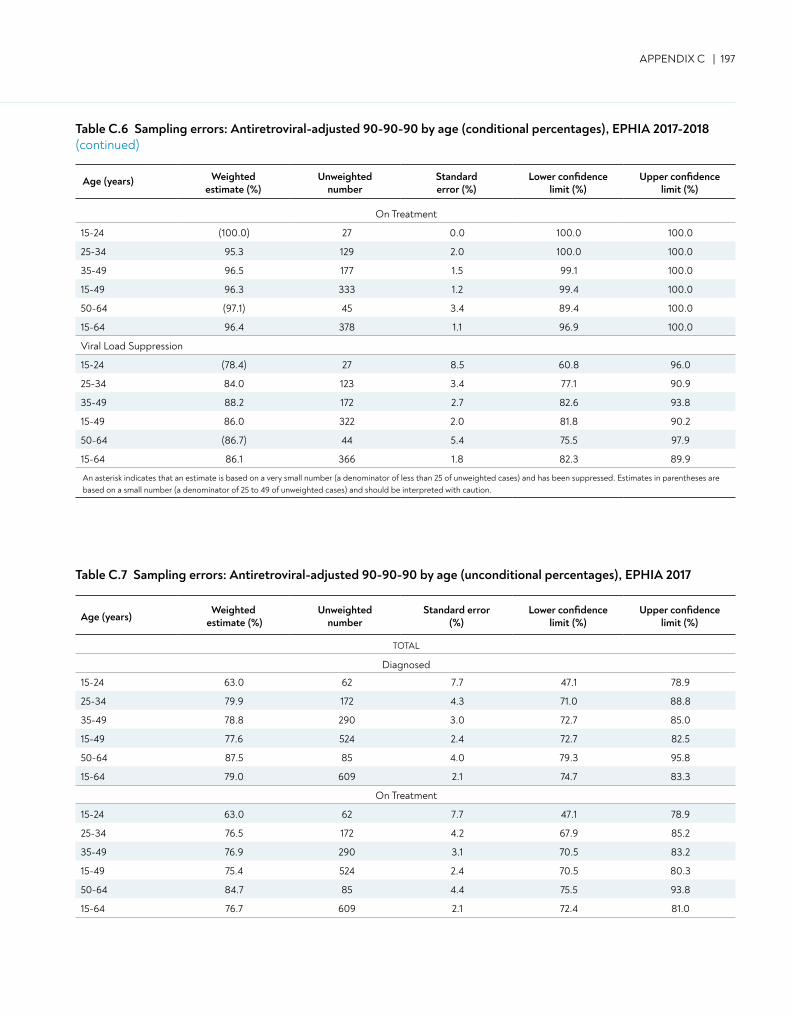
APPENDIX C | 197
Table C.6 Sampling errors: Antiretroviral-adjusted 90-90-90 by age (conditional percentages), EPHIA 2017-2018(continued)
Table C.7 Sampling errors: Antiretroviral-adjusted 90-90-90 by age (unconditional percentages), EPHIA 2017
Age (years)Weighted
estimate (%)Unweighted
numberStandard error
(%)Lower confidence
limit (%)Upper confidence
limit (%)
TOTAL
Diagnosed
15-24 63.0 62 7.7 47.1 78.9
25-34 79.9 172 4.3 71.0 88.8
35-49 78.8 290 3.0 72.7 85.0
15-49 77.6 524 2.4 72.7 82.5
50-64 87.5 85 4.0 79.3 95.8
15-64 79.0 609 2.1 74.7 83.3
On Treatment
15-24 63.0 62 7.7 47.1 78.9
25-34 76.5 172 4.2 67.9 85.2
35-49 76.9 290 3.1 70.5 83.2
15-49 75.4 524 2.4 70.5 80.3
50-64 84.7 85 4.4 75.5 93.8
15-64 76.7 609 2.1 72.4 81.0
On Treatment
15-24 (100.0) 27 0.0 100.0 100.0
25-34 95.3 129 2.0 100.0 100.0
35-49 96.5 177 1.5 99.1 100.0
15-49 96.3 333 1.2 99.4 100.0
50-64 (97.1) 45 3.4 89.4 100.0
15-64 96.4 378 1.1 96.9 100.0
Viral Load Suppression
15-24 (78.4) 27 8.5 60.8 96.0
25-34 84.0 123 3.4 77.1 90.9
35-49 88.2 172 2.7 82.6 93.8
15-49 86.0 322 2.0 81.8 90.2
50-64 (86.7) 44 5.4 75.5 97.9
15-64 86.1 366 1.8 82.3 89.9
An asterisk indicates that an estimate is based on a very small number (a denominator of less than 25 of unweighted cases) and has been suppressed. Estimates in parentheses are based on a small number (a denominator of 25 to 49 of unweighted cases) and should be interpreted with caution.
Age (years) Weighted estimate (%)
Unweightednumber
Standard error (%)
Lower confidence limit (%)
Upper confidence limit (%)
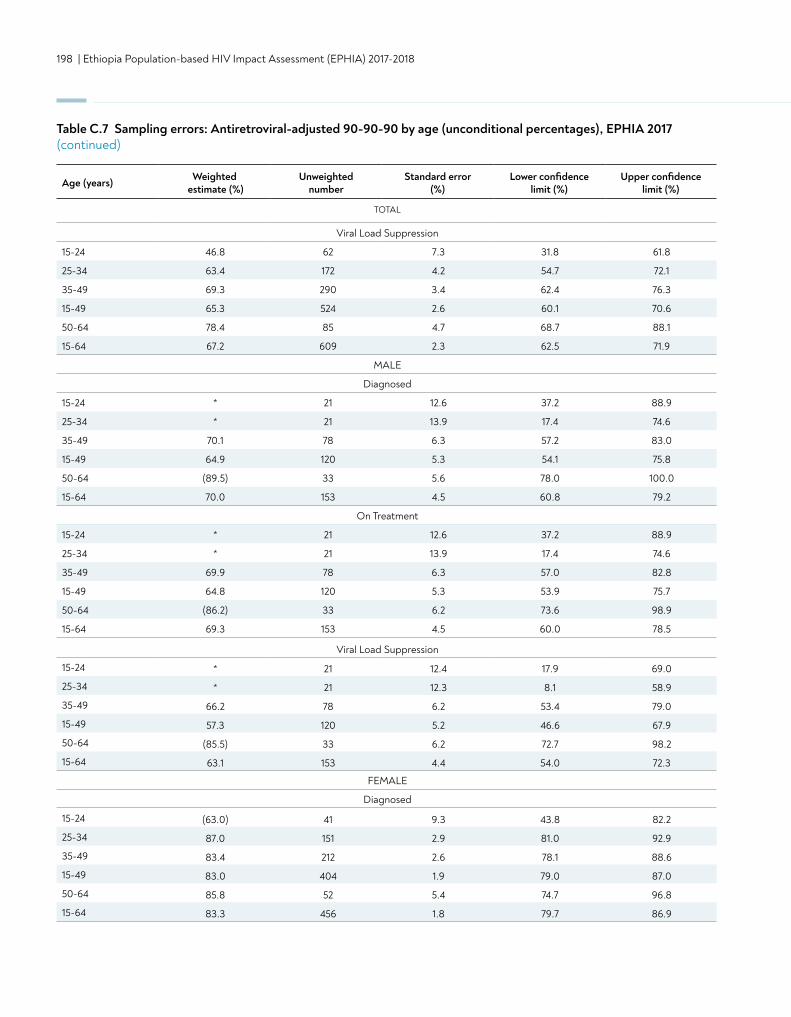
198 | Ethiopia Population-based HIV Impact Assessment (EPHIA) 2017-2018
Table C.7 Sampling errors: Antiretroviral-adjusted 90-90-90 by age (unconditional percentages), EPHIA 2017 (continued)
Viral Load Suppression
15-24 46.8 62 7.3 31.8 61.8
25-34 63.4 172 4.2 54.7 72.1
35-49 69.3 290 3.4 62.4 76.3
15-49 65.3 524 2.6 60.1 70.6
50-64 78.4 85 4.7 68.7 88.1
15-64 67.2 609 2.3 62.5 71.9
MALE
Diagnosed
15-24 * 21 12.6 37.2 88.9
25-34 * 21 13.9 17.4 74.6
35-49 70.1 78 6.3 57.2 83.0
15-49 64.9 120 5.3 54.1 75.8
50-64 (89.5) 33 5.6 78.0 100.0
15-64 70.0 153 4.5 60.8 79.2
On Treatment
15-24 * 21 12.6 37.2 88.9
25-34 * 21 13.9 17.4 74.6
35-49 69.9 78 6.3 57.0 82.8
15-49 64.8 120 5.3 53.9 75.7
50-64 (86.2) 33 6.2 73.6 98.9
15-64 69.3 153 4.5 60.0 78.5
Viral Load Suppression
15-24 * 21 12.4 17.9 69.0
25-34 * 21 12.3 8.1 58.9
35-49 66.2 78 6.2 53.4 79.0
15-49 57.3 120 5.2 46.6 67.9
50-64 (85.5) 33 6.2 72.7 98.2
15-64 63.1 153 4.4 54.0 72.3
FEMALE
Diagnosed
15-24 (63.0) 41 9.3 43.8 82.2
25-34 87.0 151 2.9 81.0 92.9
35-49 83.4 212 2.6 78.1 88.6
15-49 83.0 404 1.9 79.0 87.0
50-64 85.8 52 5.4 74.7 96.8
15-64 83.3 456 1.8 79.7 86.9
Age (years) Weighted estimate (%)
Unweighted number
Standard error (%)
Lower confidence limit (%)
Upper confidence limit (%)
TOTAL
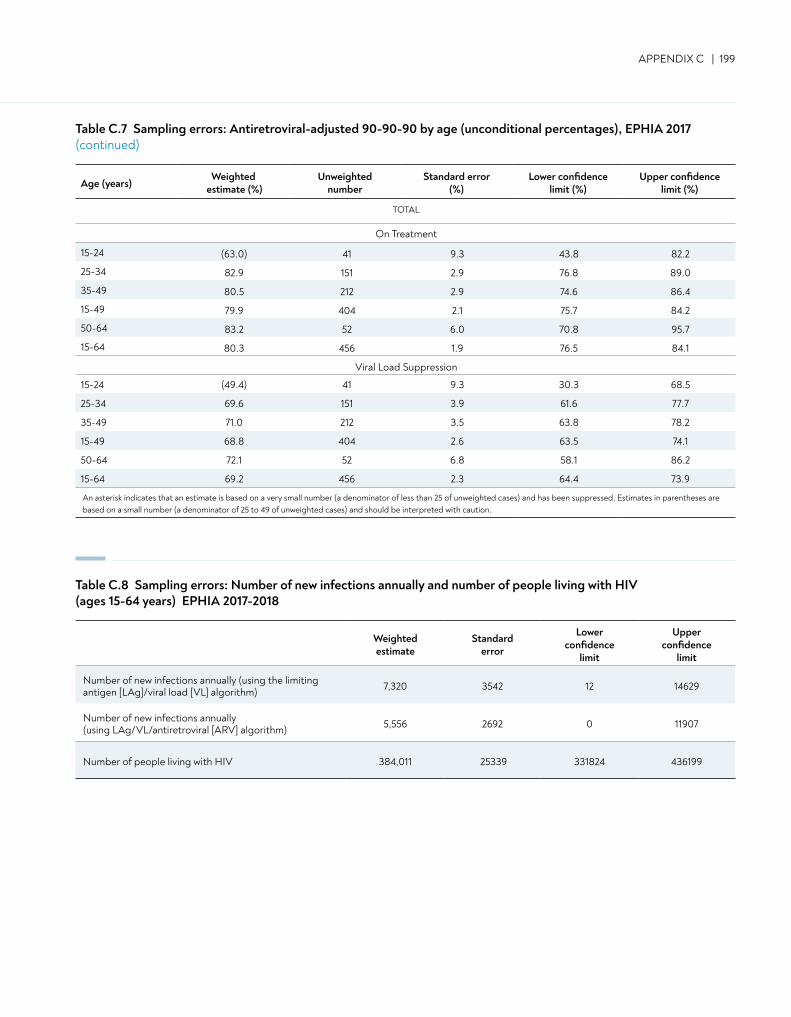
APPENDIX C | 199
Table C.7 Sampling errors: Antiretroviral-adjusted 90-90-90 by age (unconditional percentages), EPHIA 2017 (continued)
On Treatment
15-24 (63.0) 41 9.3 43.8 82.2
25-34 82.9 151 2.9 76.8 89.0
35-49 80.5 212 2.9 74.6 86.4
15-49 79.9 404 2.1 75.7 84.2
50-64 83.2 52 6.0 70.8 95.7
15-64 80.3 456 1.9 76.5 84.1
Viral Load Suppression
15-24 (49.4) 41 9.3 30.3 68.5
25-34 69.6 151 3.9 61.6 77.7
35-49 71.0 212 3.5 63.8 78.2
15-49 68.8 404 2.6 63.5 74.1
50-64 72.1 52 6.8 58.1 86.2
15-64 69.2 456 2.3 64.4 73.9
An asterisk indicates that an estimate is based on a very small number (a denominator of less than 25 of unweighted cases) and has been suppressed. Estimates in parentheses are based on a small number (a denominator of 25 to 49 of unweighted cases) and should be interpreted with caution.
Age (years)Weighted
estimate (%)Unweighted
numberStandard error
(%)Lower confidence
limit (%)Upper confidence
limit (%)
TOTAL
Weighted estimate
Standard error
Lower confidence
limit
Upper confidence
limit
Number of new infections annually (using the limiting antigen [LAg]/viral load [VL] algorithm) 7,320 3542 12 14629
Number of new infections annually (using LAg/VL/antiretroviral [ARV] algorithm) 5,556 2692 0 11907
Number of people living with HIV 384,011 25339 331824 436199
Table C.8 Sampling errors: Number of new infections annually and number of people living with HIV (ages 15-64 years) EPHIA 2017-2018
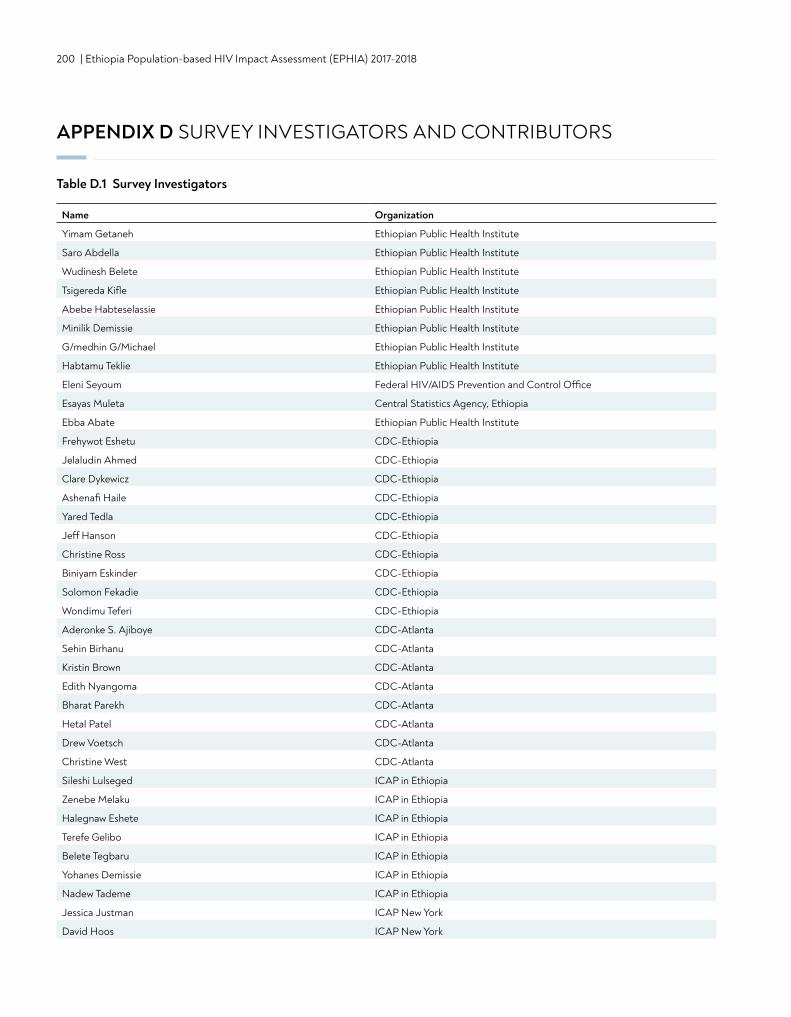
200 | Ethiopia Population-based HIV Impact Assessment (EPHIA) 2017-2018
APPENDIX D SURVEY INVESTIGATORS AND CONTRIBUTORS
Name Organization
Yimam Getaneh Ethiopian Public Health Institute
Saro Abdella Ethiopian Public Health Institute
Wudinesh Belete Ethiopian Public Health Institute
Tsigereda Kifle Ethiopian Public Health Institute
Abebe Habteselassie Ethiopian Public Health Institute
Minilik Demissie Ethiopian Public Health Institute
G/medhin G/Michael Ethiopian Public Health Institute
Habtamu Teklie Ethiopian Public Health Institute
Eleni Seyoum Federal HIV/AIDS Prevention and Control Office
Esayas Muleta Central Statistics Agency, Ethiopia
Ebba Abate Ethiopian Public Health Institute
Frehywot Eshetu CDC-Ethiopia
Jelaludin Ahmed CDC-Ethiopia
Clare Dykewicz CDC-Ethiopia
Ashenafi Haile CDC-Ethiopia
Yared Tedla CDC-Ethiopia
Jeff Hanson CDC-Ethiopia
Christine Ross CDC-Ethiopia
Biniyam Eskinder CDC-Ethiopia
Solomon Fekadie CDC-Ethiopia
Wondimu Teferi CDC-Ethiopia
Aderonke S. Ajiboye CDC-Atlanta
Sehin Birhanu CDC-Atlanta
Kristin Brown CDC-Atlanta
Edith Nyangoma CDC-Atlanta
Bharat Parekh CDC-Atlanta
Hetal Patel CDC-Atlanta
Drew Voetsch CDC-Atlanta
Christine West CDC-Atlanta
Sileshi Lulseged ICAP in Ethiopia
Zenebe Melaku ICAP in Ethiopia
Halegnaw Eshete ICAP in Ethiopia
Terefe Gelibo ICAP in Ethiopia
Belete Tegbaru ICAP in Ethiopia
Yohanes Demissie ICAP in Ethiopia
Nadew Tademe ICAP in Ethiopia
Jessica Justman ICAP New York
David Hoos ICAP New York
Table D.1 Survey Investigators
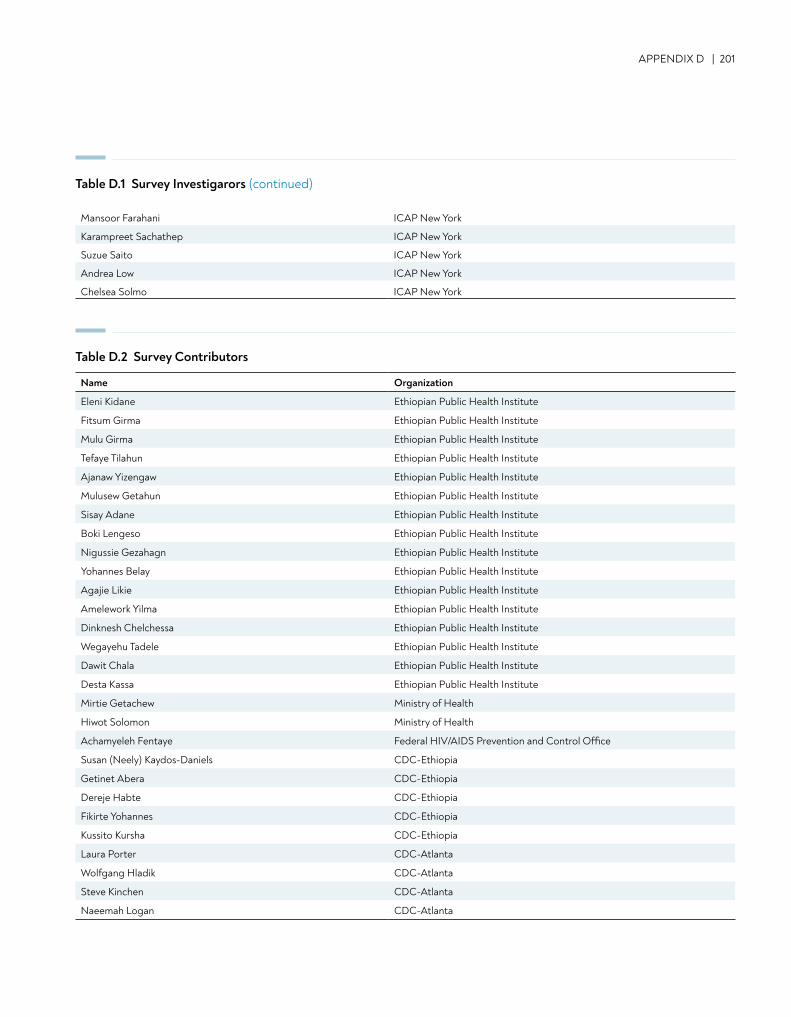
APPENDIX D | 201
Mansoor Farahani ICAP New York
Karampreet Sachathep ICAP New York
Suzue Saito ICAP New York
Andrea Low ICAP New York
Chelsea Solmo ICAP New York
Name Organization
Eleni Kidane Ethiopian Public Health Institute
Fitsum Girma Ethiopian Public Health Institute
Mulu Girma Ethiopian Public Health Institute
Tefaye Tilahun Ethiopian Public Health Institute
Ajanaw Yizengaw Ethiopian Public Health Institute
Mulusew Getahun Ethiopian Public Health Institute
Sisay Adane Ethiopian Public Health Institute
Boki Lengeso Ethiopian Public Health Institute
Nigussie Gezahagn Ethiopian Public Health Institute
Yohannes Belay Ethiopian Public Health Institute
Agajie Likie Ethiopian Public Health Institute
Amelework Yilma Ethiopian Public Health Institute
Dinknesh Chelchessa Ethiopian Public Health Institute
Wegayehu Tadele Ethiopian Public Health Institute
Dawit Chala Ethiopian Public Health Institute
Desta Kassa Ethiopian Public Health Institute
Mirtie Getachew Ministry of Health
Hiwot Solomon Ministry of Health
Achamyeleh Fentaye Federal HIV/AIDS Prevention and Control Office
Susan (Neely) Kaydos-Daniels CDC-Ethiopia
Getinet Abera CDC-Ethiopia
Dereje Habte CDC-Ethiopia
Fikirte Yohannes CDC-Ethiopia
Kussito Kursha CDC-Ethiopia
Laura Porter CDC-Atlanta
Wolfgang Hladik CDC-Atlanta
Steve Kinchen CDC-Atlanta
Naeemah Logan CDC-Atlanta
Table D.1 Survey Investigarors (continued)
Table D.2 Survey Contributors
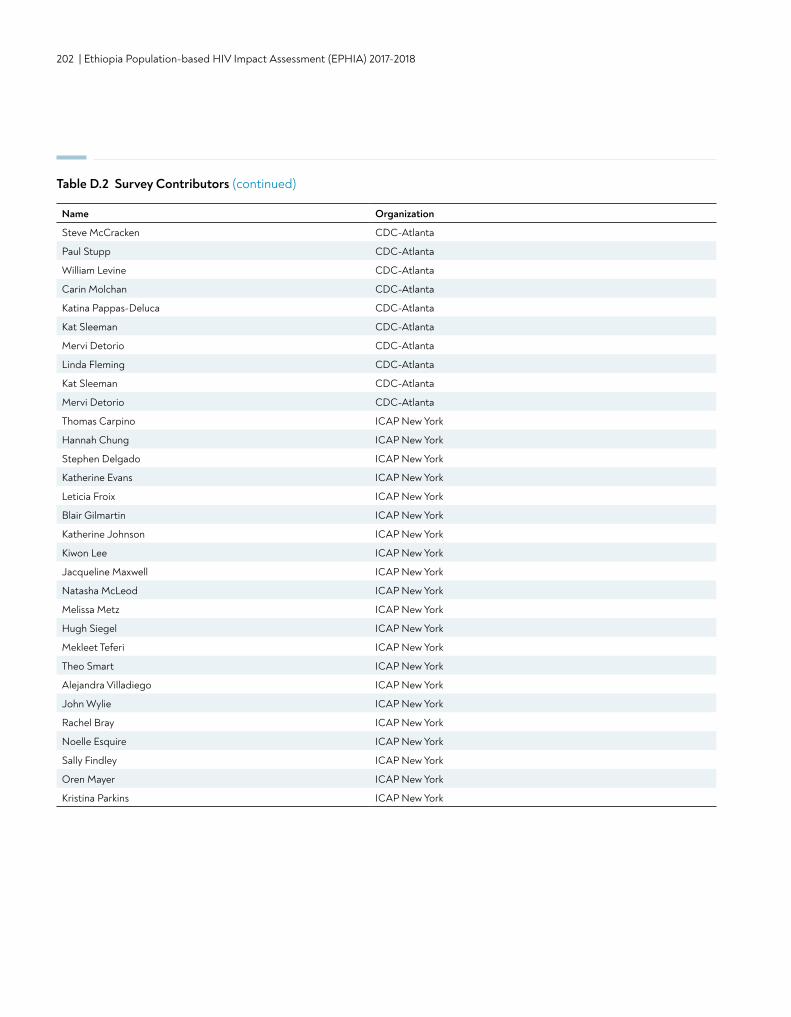
202 | Ethiopia Population-based HIV Impact Assessment (EPHIA) 2017-2018
Name Organization
Steve McCracken CDC-Atlanta
Paul Stupp CDC-Atlanta
William Levine CDC-Atlanta
Carin Molchan CDC-Atlanta
Katina Pappas-Deluca CDC-Atlanta
Kat Sleeman CDC-Atlanta
Mervi Detorio CDC-Atlanta
Linda Fleming CDC-Atlanta
Kat Sleeman CDC-Atlanta
Mervi Detorio CDC-Atlanta
Thomas Carpino ICAP New York
Hannah Chung ICAP New York
Stephen Delgado ICAP New York
Katherine Evans ICAP New York
Leticia Froix ICAP New York
Blair Gilmartin ICAP New York
Katherine Johnson ICAP New York
Kiwon Lee ICAP New York
Jacqueline Maxwell ICAP New York
Natasha McLeod ICAP New York
Melissa Metz ICAP New York
Hugh Siegel ICAP New York
Mekleet Teferi ICAP New York
Theo Smart ICAP New York
Alejandra Villadiego ICAP New York
John Wylie ICAP New York
Rachel Bray ICAP New York
Noelle Esquire ICAP New York
Sally Findley ICAP New York
Oren Mayer ICAP New York
Kristina Parkins ICAP New York
Table D.2 Survey Contributors (continued)
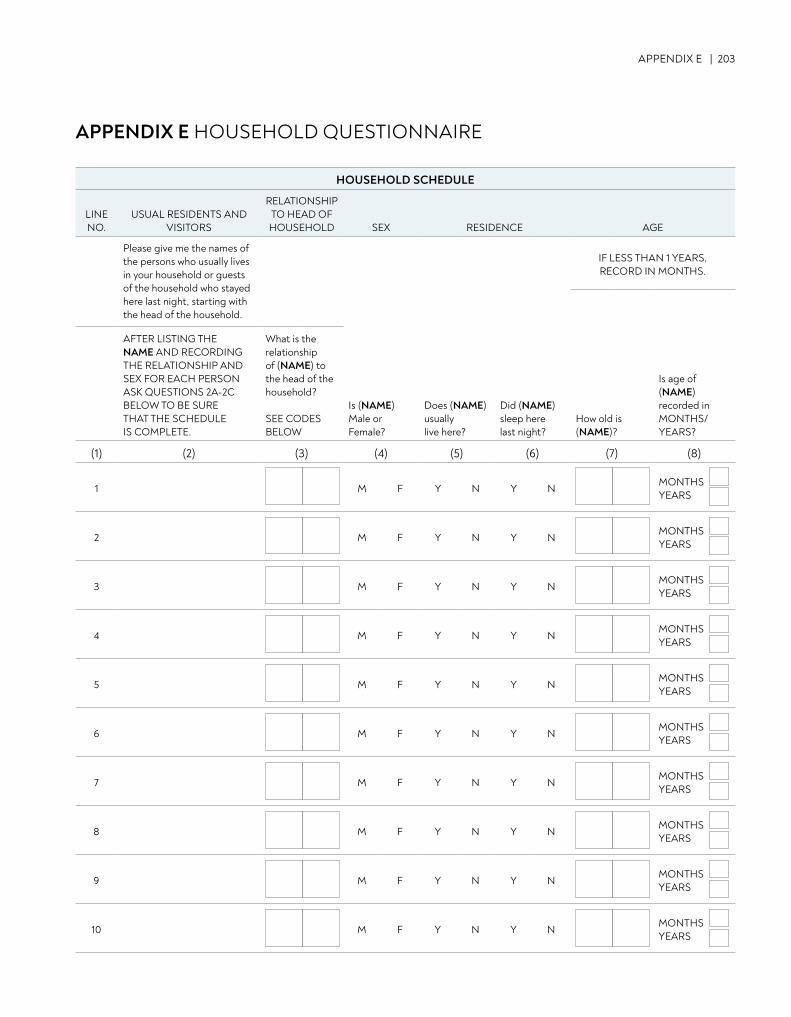
APPENDIX E | 203
APPENDIX E HOUSEHOLD QUESTIONNAIRE
HOUSEHOLD SCHEDULE
LINE NO.
USUAL RESIDENTS AND VISITORS
RELATIONSHIP TO HEAD OFHOUSEHOLD SEX RESIDENCE AGE
Please give me the names of the persons who usually lives in your household or guests of the household who stayed here last night, starting with the head of the household.
IF LESS THAN 1 YEARS, RECORD IN MONTHS.
AFTER LISTING THE NAME AND RECORDING THE RELATIONSHIP AND SEX FOR EACH PERSON ASK QUESTIONS 2A-2C BELOW TO BE SURE THAT THE SCHEDULE IS COMPLETE.
What is the relationship of (NAME) to the head of the household?
SEE CODES BELOW
Is (NAME)Male or Female?
Does (NAME)usually live here?
Did (NAME)sleep here last night?
How old is (NAME)?
Is age of (NAME)recorded in MONTHS/YEARS?
(1) (2) (3) (4) (5) (6) (7) (8)
1 M F Y N Y NMONTHS YEARS
2 M F Y N Y NMONTHSYEARS
3 M F Y N Y NMONTHSYEARS
4 M F Y N Y NMONTHSYEARS
5 M F Y N Y NMONTHSYEARS
6 M F Y N Y NMONTHSYEARS
7 M F Y N Y NMONTHSYEARS
8 M F Y N Y NMONTHSYEARS
9 M F Y N Y NMONTHSYEARS
10 M F Y N Y NMONTHSYEARS
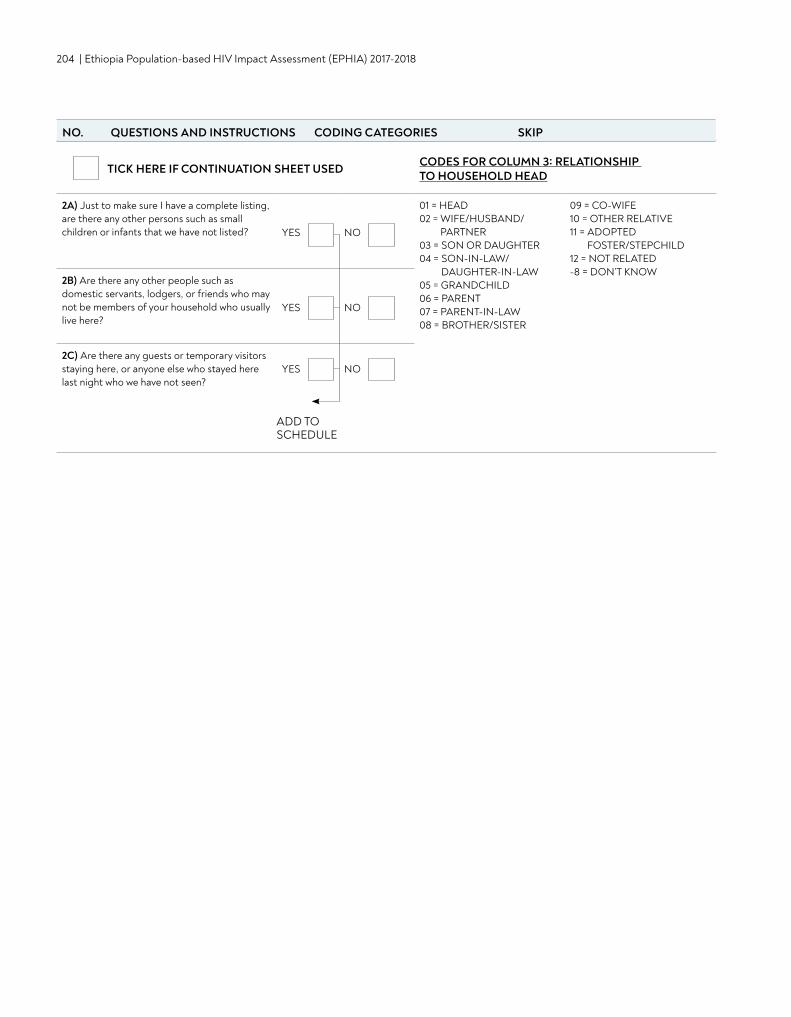
204 | Ethiopia Population-based HIV Impact Assessment (EPHIA) 2017-2018
TICK HERE IF CONTINUATION SHEET USED CODES FOR COLUMN 3: RELATIONSHIP TO HOUSEHOLD HEAD
2A) Just to make sure I have a complete listing, are there any other persons such as small children or infants that we have not listed? YES NO
01 = HEAD02 = WIFE/HUSBAND/
PARTNER03 = SON OR DAUGHTER04 = SON-IN-LAW/
DAUGHTER-IN-LAW05 = GRANDCHILD06 = PARENT07 = PARENT-IN-LAW08 = BROTHER/SISTER
09 = CO-WIFE10 = OTHER RELATIVE11 = ADOPTED
FOSTER/STEPCHILD12 = NOT RELATED-8 = DON’T KNOW
2B) Are there any other people such as domestic servants, lodgers, or friends who may not be members of your household who usually live here?
YES NO
2C) Are there any guests or temporary visitors staying here, or anyone else who stayed here last night who we have not seen?
YES NO
ADD TO SCHEDULE
NO. QUESTIONS AND INSTRUCTIONS CODING CATEGORIES SKIP
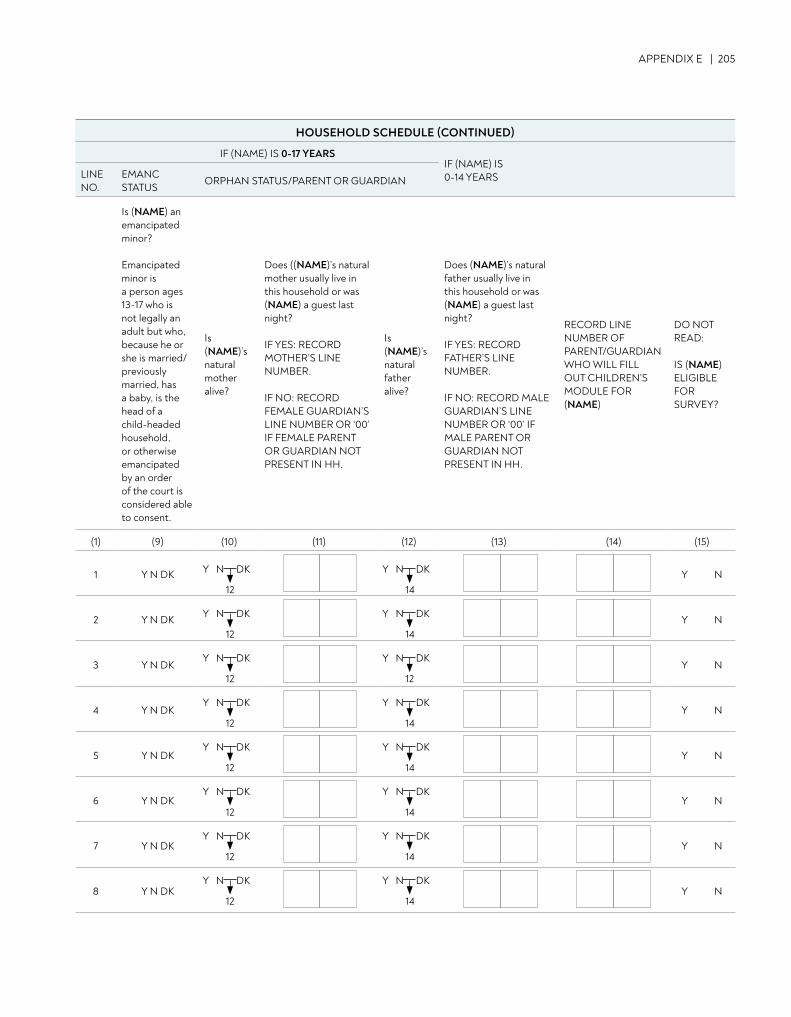
APPENDIX E | 205
NO. QUESTIONS AND INSTRUCTIONS CODING CATEGORIES SKIPHOUSEHOLD SCHEDULE (CONTINUED)
IF (NAME) IS 0-17 YEARSIF (NAME) IS 0-14 YEARSLINE
NO.EMANC STATUS
ORPHAN STATUS/PARENT OR GUARDIAN
Is (NAME) an emancipated minor?
Emancipated minor isa person ages 13-17 who is not legally an adult but who, because he or she is married/previously married, has a baby, is the head of a child-headed household, or otherwise emancipated by an order of the court is considered able to consent.
Is (NAME)’s natural mother alive?
Does ((NAME)’s natural mother usually live in this household or was (NAME) a guest last night?
IF YES: RECORD MOTHER’S LINE NUMBER.
IF NO: RECORD FEMALE GUARDIAN’S LINE NUMBER OR ‘00’ IF FEMALE PARENT OR GUARDIAN NOT PRESENT IN HH.
Is (NAME)’s natural father alive?
Does (NAME)’s natural father usually live in this household or was (NAME) a guest last night?
IF YES: RECORD FATHER’S LINE NUMBER.
IF NO: RECORD MALE GUARDIAN’S LINE NUMBER OR ‘00’ IF MALE PARENT OR GUARDIAN NOT PRESENT IN HH.
RECORD LINE NUMBER OF PARENT/GUARDIAN WHO WILL FILL OUT CHILDREN’S MODULE FOR (NAME)
DO NOT READ:
IS (NAME) ELIGIBLEFOR SURVEY?
(1) (9) (10) (11) (12) (13) (14) (15)
1 Y N DK Y N
2 Y N DK Y N
3 Y N DK Y N
4 Y N DK Y N
5 Y N DK Y N
6 Y N DK Y N
7 Y N DK Y N
8 Y N DK Y N
12
Y N DK
12
Y N DK
14
Y N DK
14
Y N DK
12
Y N DK
12
Y N DK
12
Y N DK
14
Y N DK
12
Y N DK
14
Y N DK
12
Y N DK
14
Y N DK
12
Y N DK
14
Y N DK
12
Y N DK
14
Y N DK
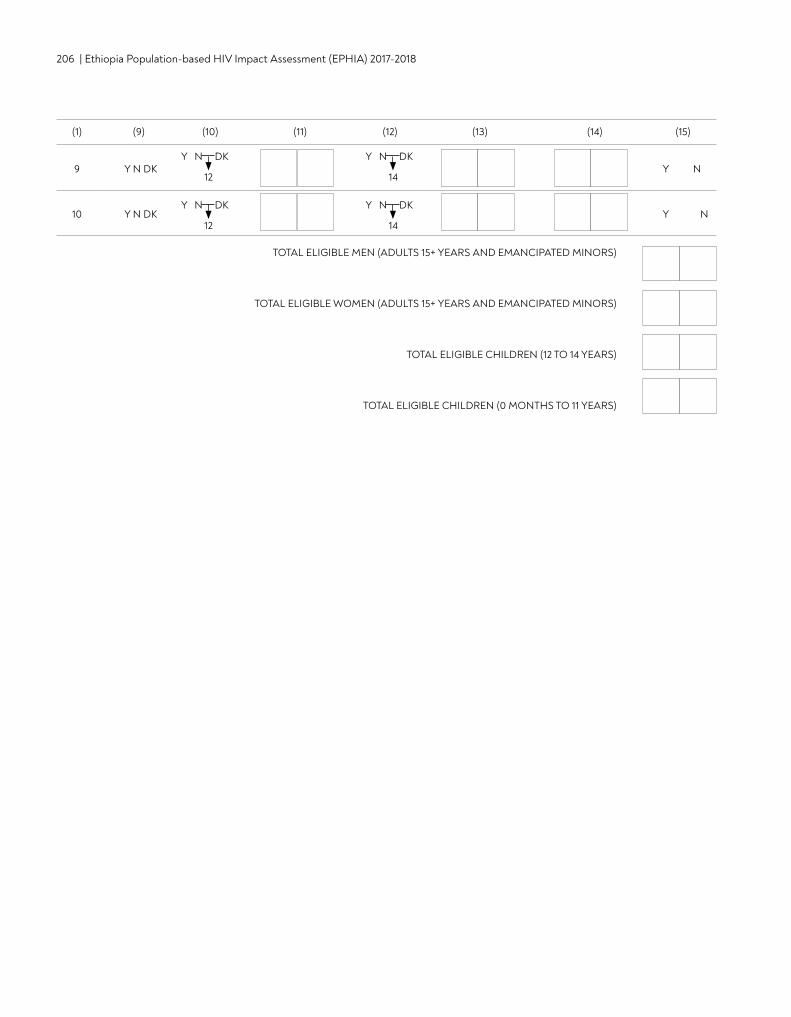
206 | Ethiopia Population-based HIV Impact Assessment (EPHIA) 2017-2018
9 Y N DK Y N
10 Y N DK Y N
TOTAL ELIGIBLE MEN (ADULTS 15+ YEARS AND EMANCIPATED MINORS)
TOTAL ELIGIBLE WOMEN (ADULTS 15+ YEARS AND EMANCIPATED MINORS)
TOTAL ELIGIBLE CHILDREN (12 TO 14 YEARS)
TOTAL ELIGIBLE CHILDREN (0 MONTHS TO 11 YEARS)
14
Y N DK
12
Y N DK
14
Y N DK
12
Y N DK
(1) (9) (10) (11) (12) (13) (14) (15)
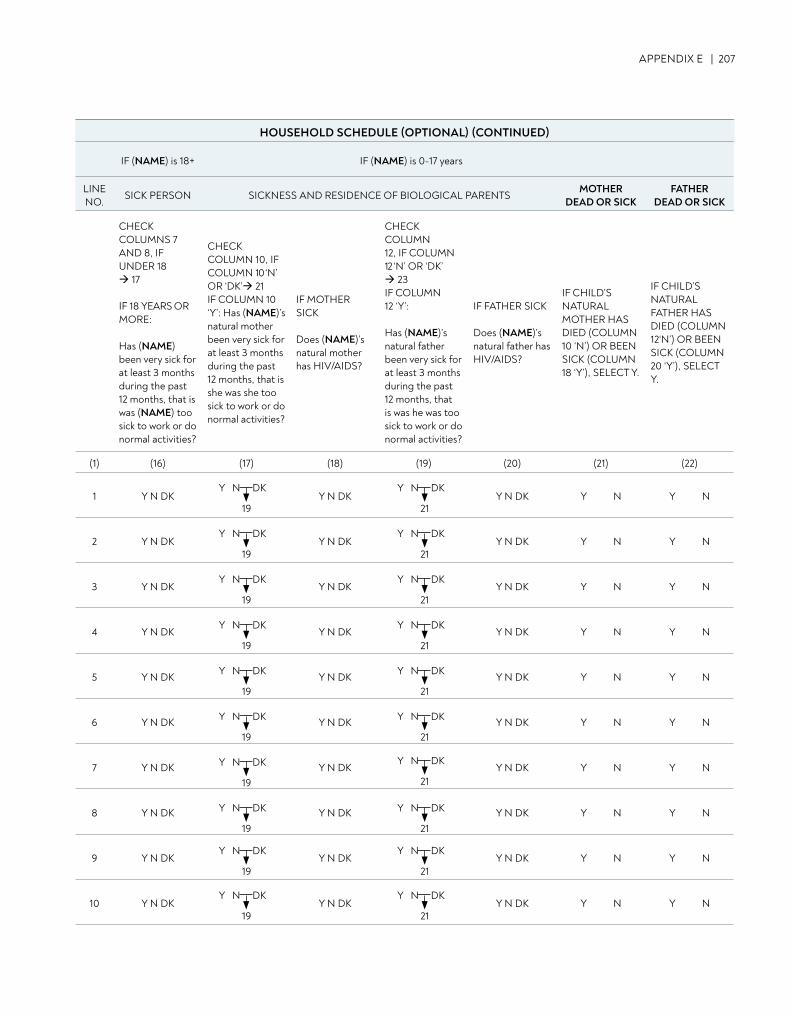
APPENDIX E | 207
NO. QUESTIONS AND INSTRUCTIONS CODING CATEGORIES SKIPHOUSEHOLD SCHEDULE (OPTIONAL) (CONTINUED)
IF (NAME) is 18+ IF (NAME) is 0-17 years
LINE NO.
SICK PERSON SICKNESS AND RESIDENCE OF BIOLOGICAL PARENTSMOTHER
DEAD OR SICKFATHER
DEAD OR SICK
CHECK COLUMNS 7AND 8, IFUNDER 18 17
IF 18 YEARS OR MORE:
Has (NAME)been very sick for at least 3 months during the past 12 months, that is was (NAME) too sick to work or do normal activities?
CHECK COLUMN 10, IF COLUMN 10 ‘N’ OR ‘DK’ 21 IF COLUMN 10 ‘Y’: Has (NAME)’snatural mother been very sick for at least 3 months during the past 12 months, that is she was she too sick to work or do normal activities?
IF MOTHER SICK
Does (NAME)’s natural mother has HIV/AIDS?
CHECK COLUMN12, IF COLUMN 12 ‘N’ OR ‘DK’ 23IF COLUMN 12 ‘Y’:
Has (NAME)’snatural father been very sick for at least 3 months during the past 12 months, that is was he was too sick to work or do normal activities?
IF FATHER SICK
Does (NAME)’s natural father has HIV/AIDS?
IF CHILD’S NATURAL MOTHER HAS DIED (COLUMN 10 ‘N’) OR BEEN SICK (COLUMN 18 ‘Y’), SELECT Y.
IF CHILD’S NATURAL FATHER HAS DIED (COLUMN 12‘N’) OR BEEN SICK (COLUMN 20 ‘Y’), SELECT Y.
(1) (16) (17) (18) (19) (20) (21) (22)
1 Y N DK Y N DK Y N DK Y N Y N
2 Y N DK Y N DK Y N DK Y N Y N
3 Y N DK Y N DK Y N DK Y N Y N
4 Y N DK Y N DK Y N DK Y N Y N
5 Y N DK Y N DK Y N DK Y N Y N
6 Y N DK Y N DK Y N DK Y N Y N
7 Y N DK Y N DK Y N DK Y N Y N
8 Y N DK Y N DK Y N DK Y N Y N
9 Y N DK Y N DK Y N DK Y N Y N
10 Y N DK Y N DK Y N DK Y N Y N
19
Y N DK
21
Y N DK
21
Y N DK
21
Y N DK
21
Y N DK
21
Y N DK
21
Y N DK
21
Y N DK
21
Y N DK
21
Y N DK
21
Y N DK
19
Y N DK
19
Y N DK
19
Y N DK
19
Y N DK
19
Y N DK
19
Y N DK
19
Y N DK
19
Y N DK
19
Y N DK
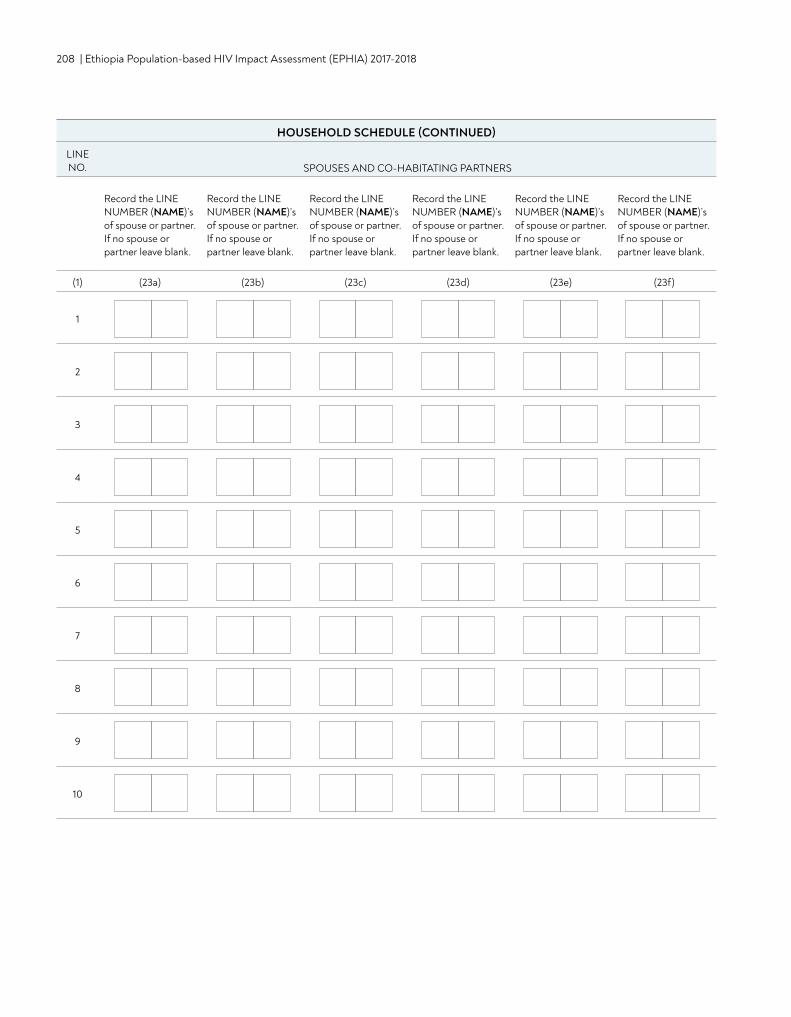
208 | Ethiopia Population-based HIV Impact Assessment (EPHIA) 2017-2018
NO. QUESTIONS AND INSTRUCTIONS CODING CATEGORIES SKIPHOUSEHOLD SCHEDULE (CONTINUED)
LINE NO. SPOUSES AND CO-HABITATING PARTNERS
Record the LINE NUMBER (NAME)’sof spouse or partner. If no spouse or partner leave blank.
Record the LINE NUMBER (NAME)’sof spouse or partner. If no spouse or partner leave blank.
Record the LINE NUMBER (NAME)’sof spouse or partner. If no spouse or partner leave blank.
Record the LINE NUMBER (NAME)’sof spouse or partner. If no spouse or partner leave blank.
Record the LINE NUMBER (NAME)’sof spouse or partner. If no spouse or partner leave blank.
Record the LINE NUMBER (NAME)’sof spouse or partner. If no spouse or partner leave blank.
(1) (23a) (23b) (23c) (23d) (23e) (23f)
1
2
3
4
5
6
7
8
9
10
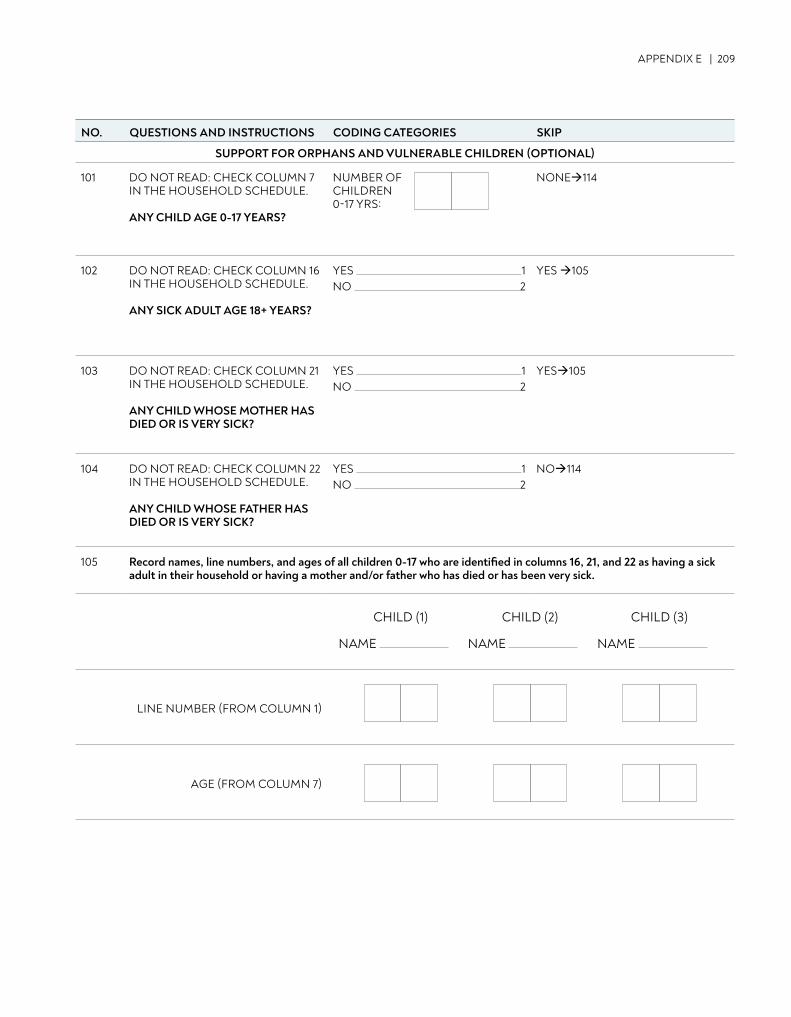
APPENDIX E | 209
NO. QUESTIONS AND INSTRUCTIONS CODING CATEGORIES SKIP
SUPPORT FOR ORPHANS AND VULNERABLE CHILDREN (OPTIONAL)
101 DO NOT READ: CHECK COLUMN 7 IN THE HOUSEHOLD SCHEDULE.
ANY CHILD AGE 0-17 YEARS?
NUMBER OF CHILDREN0-17 YRS:
NONE114
102 DO NOT READ: CHECK COLUMN 16 IN THE HOUSEHOLD SCHEDULE.
ANY SICK ADULT AGE 18+ YEARS?
YES 1 NO 2
YES 105
103 DO NOT READ: CHECK COLUMN 21 IN THE HOUSEHOLD SCHEDULE.
ANY CHILD WHOSE MOTHER HAS DIED OR IS VERY SICK?
YES 1 NO 2
YES105
104 DO NOT READ: CHECK COLUMN 22 IN THE HOUSEHOLD SCHEDULE.
ANY CHILD WHOSE FATHER HAS DIED OR IS VERY SICK?
YES 1 NO 2
NO114
105 Record names, line numbers, and ages of all children 0-17 who are identified in columns 16, 21, and 22 as having a sick adult in their household or having a mother and/or father who has died or has been very sick.
LINE NUMBER (FROM COLUMN 1)
AGE (FROM COLUMN 7)
CHILD (1)
NAME
CHILD (2)
NAME
CHILD (3)
NAME
NO. QUESTIONS AND INSTRUCTIONS CODING CATEGORIES SKIP
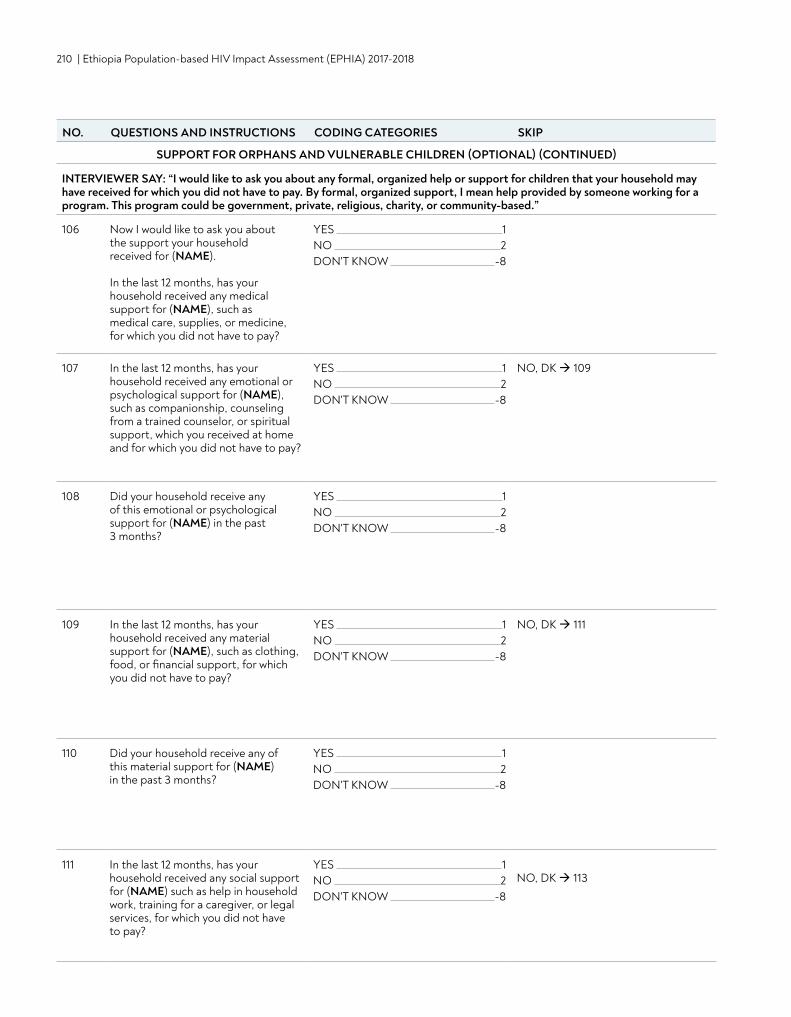
210 | Ethiopia Population-based HIV Impact Assessment (EPHIA) 2017-2018
NO. QUESTIONS AND INSTRUCTIONS CODING CATEGORIES SKIP
SUPPORT FOR ORPHANS AND VULNERABLE CHILDREN (OPTIONAL) (CONTINUED)
INTERVIEWER SAY: “I would like to ask you about any formal, organized help or support for children that your household may have received for which you did not have to pay. By formal, organized support, I mean help provided by someone working for a program. This program could be government, private, religious, charity, or community-based.”
106 Now I would like to ask you about the support your household received for (NAME).
In the last 12 months, has your household received any medical support for (NAME), such as medical care, supplies, or medicine, for which you did not have to pay?
YES 1 NO 2DON'T KNOW -8
107 In the last 12 months, has your household received any emotional or psychological support for (NAME), such as companionship, counseling from a trained counselor, or spiritual support, which you received at home and for which you did not have to pay?
YES 1 NO 2DON'T KNOW -8
NO, DK 109
108 Did your household receive any of this emotional or psychological support for (NAME) in the past 3 months?
YES 1 NO 2DON'T KNOW -8
109 In the last 12 months, has your household received any material support for (NAME), such as clothing, food, or financial support, for which you did not have to pay?
YES 1 NO 2DON'T KNOW -8
NO, DK 111
110 Did your household receive any of this material support for (NAME) in the past 3 months?
YES 1 NO 2DON'T KNOW -8
111 In the last 12 months, has your household received any social support for (NAME) such as help in household work, training for a caregiver, or legal services, for which you did not have to pay?
YES 1 NO 2DON'T KNOW -8
NO, DK 113
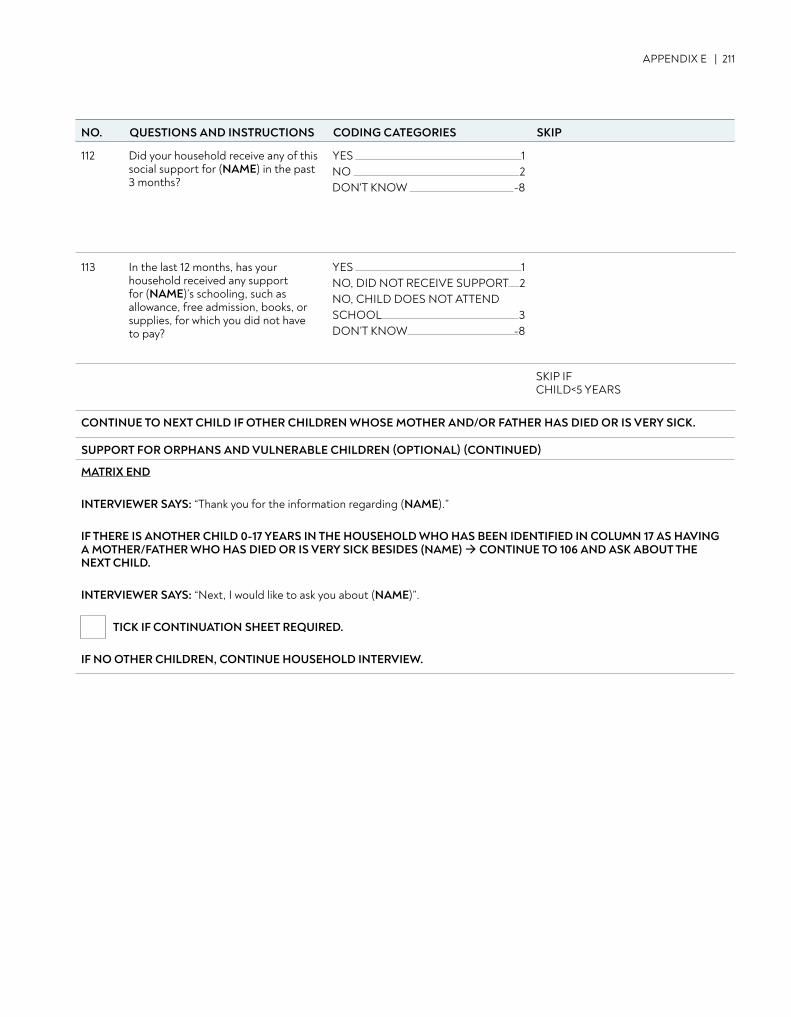
APPENDIX E | 211
NO. QUESTIONS AND INSTRUCTIONS CODING CATEGORIES SKIP
112 Did your household receive any of this social support for (NAME) in the past 3 months?
YES 1 NO 2DON'T KNOW -8
113 In the last 12 months, has your household received any support for (NAME)’s schooling, such as allowance, free admission, books, or supplies, for which you did not have to pay?
YES 1NO, DID NOT RECEIVE SUPPORT 2NO, CHILD DOES NOT ATTEND SCHOOL 3DON’T KNOW -8
SKIP IF CHILD<5 YEARS
CONTINUE TO NEXT CHILD IF OTHER CHILDREN WHOSE MOTHER AND/OR FATHER HAS DIED OR IS VERY SICK.
SUPPORT FOR ORPHANS AND VULNERABLE CHILDREN (OPTIONAL) (CONTINUED)
MATRIX END
INTERVIEWER SAYS: “Thank you for the information regarding (NAME).”
IF THERE IS ANOTHER CHILD 0-17 YEARS IN THE HOUSEHOLD WHO HAS BEEN IDENTIFIED IN COLUMN 17 AS HAVING A MOTHER/FATHER WHO HAS DIED OR IS VERY SICK BESIDES (NAME) CONTINUE TO 106 AND ASK ABOUT THE NEXT CHILD.
INTERVIEWER SAYS: “Next, I would like to ask you about (NAME)”.
TICK IF CONTINUATION SHEET REQUIRED.
IF NO OTHER CHILDREN, CONTINUE HOUSEHOLD INTERVIEW.
NO. QUESTIONS AND INSTRUCTIONS CODING CATEGORIES SKIP
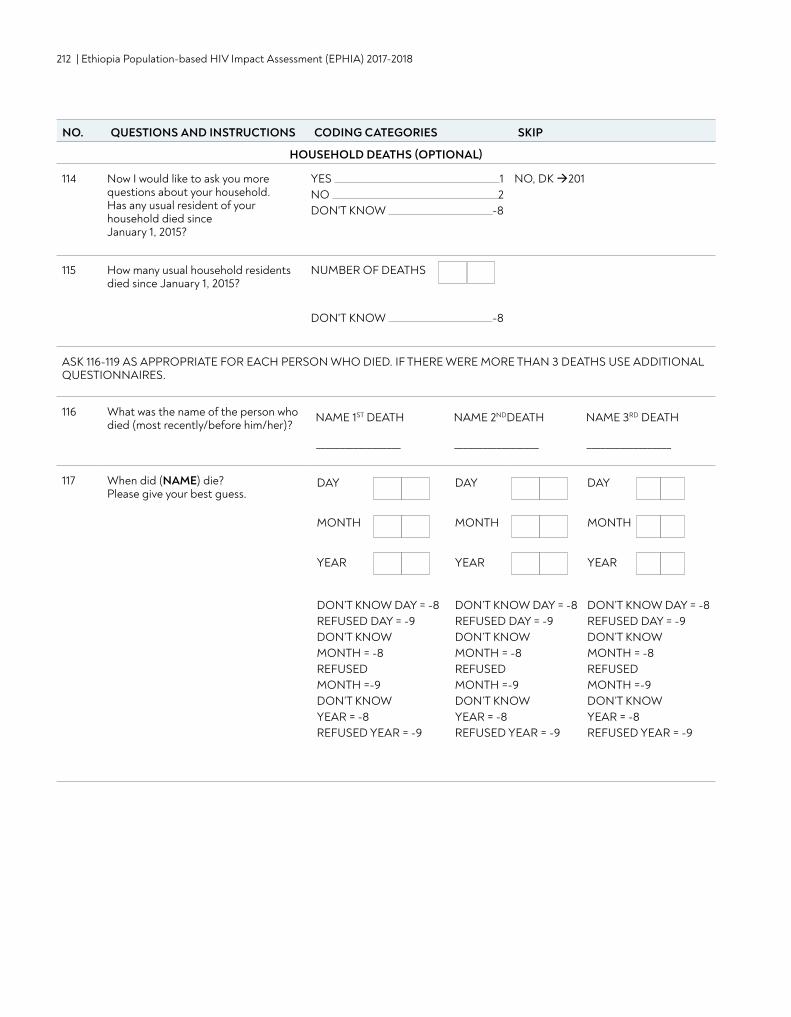
212 | Ethiopia Population-based HIV Impact Assessment (EPHIA) 2017-2018
NO. QUESTIONS AND INSTRUCTIONS CODING CATEGORIES SKIP
HOUSEHOLD DEATHS (OPTIONAL)
114 Now I would like to ask you more questions about your household. Has any usual resident of your household died since January 1, 2015?
YES 1 NO 2DON'T KNOW -8
NO, DK 201
115 How many usual household residents died since January 1, 2015?
NUMBER OF DEATHS
DON'T KNOW -8
ASK 116-119 AS APPROPRIATE FOR EACH PERSON WHO DIED. IF THERE WERE MORE THAN 3 DEATHS USE ADDITIONAL QUESTIONNAIRES.
116 What was the name of the person who died (most recently/before him/her)?
117 When did (NAME) die? Please give your best guess.
DAY
MONTH
YEAR
DON’T KNOW DAY = -8REFUSED DAY = -9DON’T KNOW MONTH = -8REFUSED MONTH =-9DON’T KNOW YEAR = -8REFUSED YEAR = -9
DAY
MONTH
YEAR
DON’T KNOW DAY = -8REFUSED DAY = -9DON’T KNOW MONTH = -8REFUSED MONTH =-9DON’T KNOW YEAR = -8REFUSED YEAR = -9
DAY
MONTH
YEAR
DON’T KNOW DAY = -8REFUSED DAY = -9DON’T KNOW MONTH = -8REFUSED MONTH =-9DON’T KNOW YEAR = -8REFUSED YEAR = -9
NAME 1ST DEATH
__________________
NAME 2NDDEATH
__________________
NAME 3RD DEATH
__________________
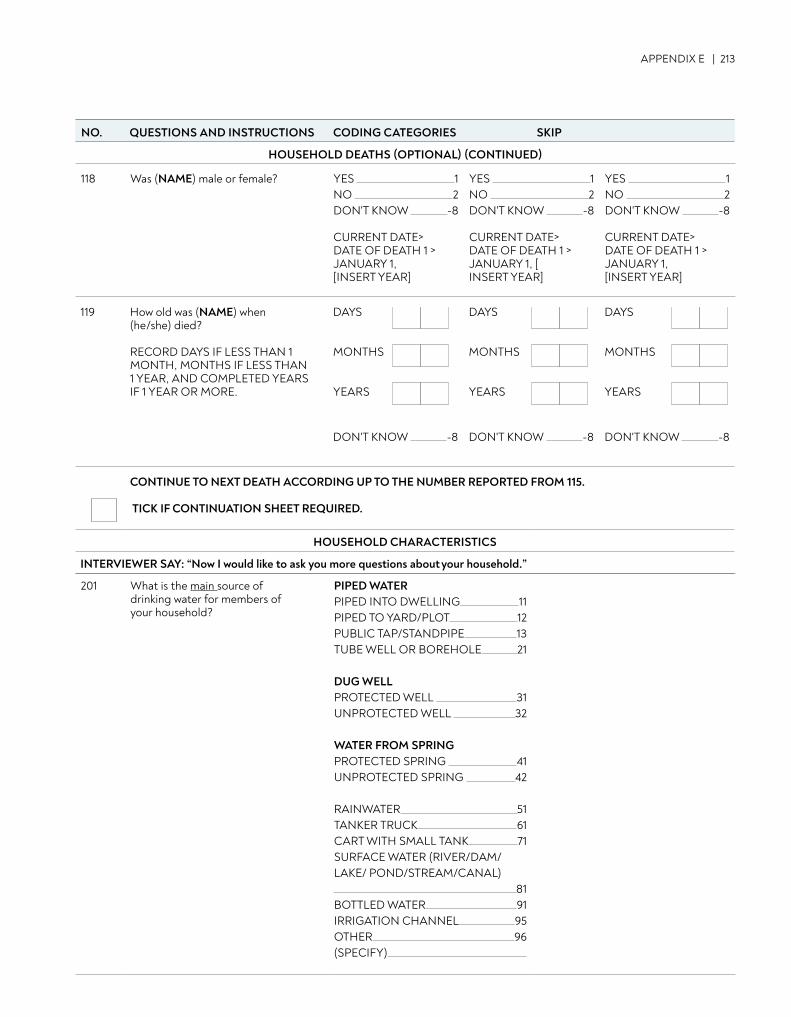
APPENDIX E | 213
NO. QUESTIONS AND INSTRUCTIONS CODING CATEGORIES SKIPNO. QUESTIONS AND INSTRUCTIONS CODING CATEGORIES SKIP
119 How old was (NAME) when (he/she) died?
RECORD DAYS IF LESS THAN 1 MONTH, MONTHS IF LESS THAN 1 YEAR, AND COMPLETED YEARS IF 1 YEAR OR MORE.
DAYS
MONTHS
YEARS
DON'T KNOW -8
DAYS
MONTHS
YEARS
DON'T KNOW -8
DAYS
MONTHS
YEARS
DON'T KNOW -8
CONTINUE TO NEXT DEATH ACCORDING UP TO THE NUMBER REPORTED FROM 115.
TICK IF CONTINUATION SHEET REQUIRED.
HOUSEHOLD CHARACTERISTICS
INTERVIEWER SAY: “Now I would like to ask you more questions about your household.”
201 What is the main source of drinking water for members of your household?
PIPED WATERPIPED INTO DWELLING 11PIPED TO YARD/PLOT 12PUBLIC TAP/STANDPIPE 13TUBE WELL OR BOREHOLE 21
DUG WELLPROTECTED WELL 31UNPROTECTED WELL 32
WATER FROM SPRINGPROTECTED SPRING 41UNPROTECTED SPRING 42
RAINWATER 51TANKER TRUCK 61CART WITH SMALL TANK 71SURFACE WATER (RIVER/DAM/LAKE/ POND/STREAM/CANAL) 81BOTTLED WATER 91IRRIGATION CHANNEL 95OTHER 96(SPECIFY)
HOUSEHOLD DEATHS (OPTIONAL) (CONTINUED)
118 Was (NAME) male or female? YES 1 NO 2DON'T KNOW -8
CURRENT DATE> DATE OF DEATH 1 > JANUARY 1, [INSERT YEAR]
YES 1 NO 2DON'T KNOW -8
CURRENT DATE> DATE OF DEATH 1 > JANUARY 1, [ INSERT YEAR]
YES 1 NO 2DON'T KNOW -8
CURRENT DATE> DATE OF DEATH 1 > JANUARY 1, [INSERT YEAR]
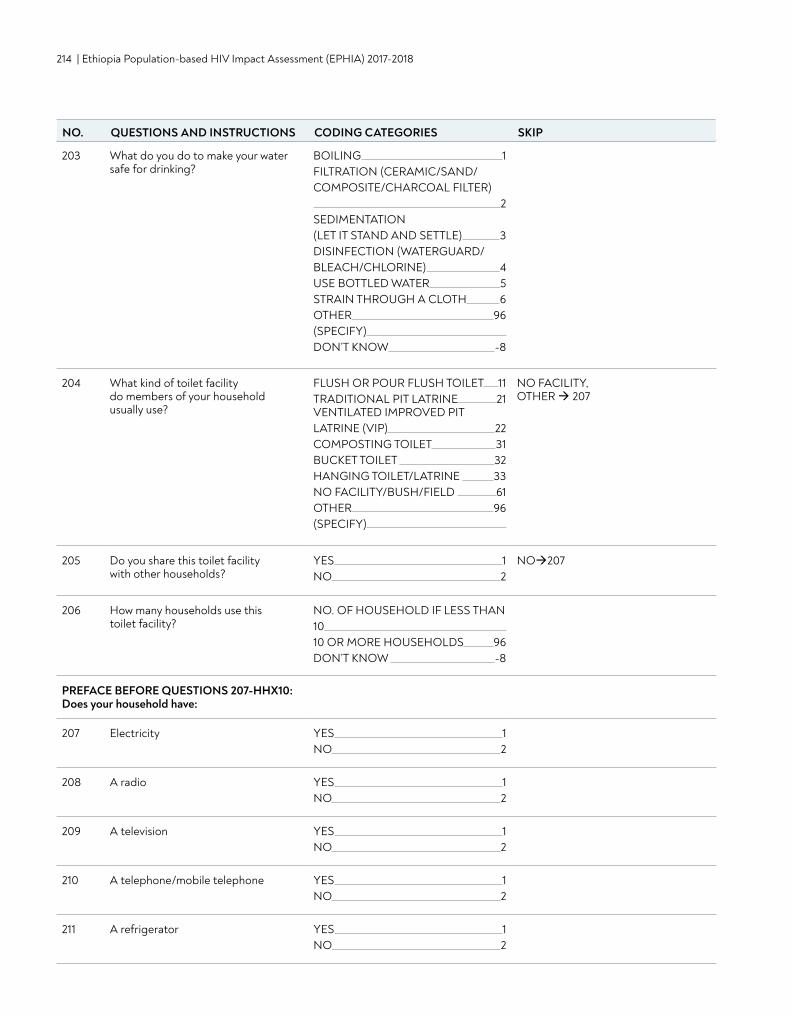
214 | Ethiopia Population-based HIV Impact Assessment (EPHIA) 2017-2018
203 What do you do to make your water safe for drinking?
BOILING 1FILTRATION (CERAMIC/SAND/COMPOSITE/CHARCOAL FILTER) 2SEDIMENTATION (LET IT STAND AND SETTLE) 3DISINFECTION (WATERGUARD/BLEACH/CHLORINE) 4USE BOTTLED WATER 5STRAIN THROUGH A CLOTH 6OTHER 96(SPECIFY) DON’T KNOW -8
204 What kind of toilet facility do members of your household usually use?
FLUSH OR POUR FLUSH TOILET 11TRADITIONAL PIT LATRINE 21VENTILATED IMPROVED PIT LATRINE (VIP) 22COMPOSTING TOILET 31BUCKET TOILET 32HANGING TOILET/LATRINE 33NO FACILITY/BUSH/FIELD 61OTHER 96(SPECIFY)
NO FACILITY, OTHER 207
205 Do you share this toilet facility with other households?
YES 1NO 2
NO207
206 How many households use this toilet facility?
NO. OF HOUSEHOLD IF LESS THAN 10 10 OR MORE HOUSEHOLDS 96DON’T KNOW -8
PREFACE BEFORE QUESTIONS 207-HHX10:Does your household have:
207 Electricity YES 1NO 2
208 A radio YES 1NO 2
209 A television YES 1NO 2
210 A telephone/mobile telephone YES 1NO 2
211 A refrigerator YES 1NO 2
NO. QUESTIONS AND INSTRUCTIONS CODING CATEGORIES SKIP
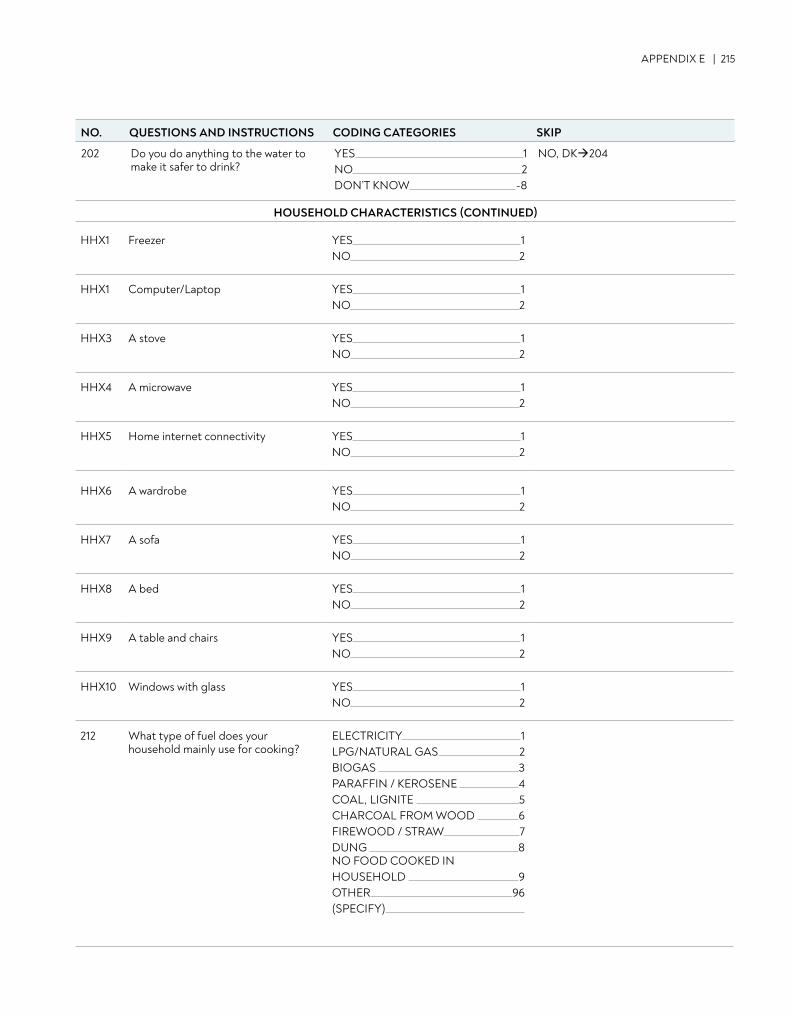
APPENDIX E | 215
HHX1 Freezer YES 1NO 2
HHX1 Computer/Laptop YES 1NO 2
HHX3 A stove YES 1NO 2
HHX4 A microwave YES 1NO 2
HHX5 Home internet connectivity YES 1NO 2
HHX6 A wardrobe YES 1NO 2
HHX7 A sofa YES 1NO 2
HHX8 A bed YES 1NO 2
HHX9 A table and chairs YES 1NO 2
HHX10 Windows with glass YES 1NO 2
212 What type of fuel does your household mainly use for cooking?
ELECTRICITY 1LPG/NATURAL GAS 2BIOGAS 3PARAFFIN / KEROSENE 4COAL, LIGNITE 5CHARCOAL FROM WOOD 6FIREWOOD / STRAW 7DUNG 8NO FOOD COOKED IN HOUSEHOLD 9OTHER 96(SPECIFY)
202 Do you do anything to the water to make it safer to drink?
YES 1NO 2DON’T KNOW -8
NO, DK204
HOUSEHOLD CHARACTERISTICS (CONTINUED)
NO. QUESTIONS AND INSTRUCTIONS CODING CATEGORIES SKIP
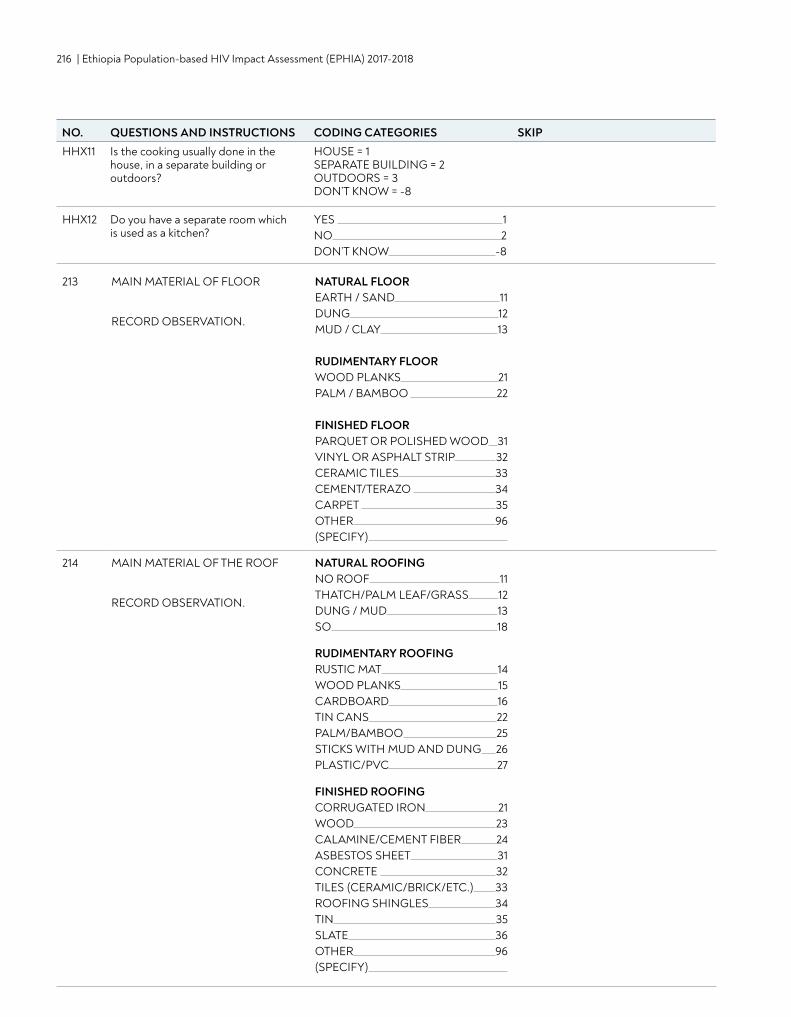
216 | Ethiopia Population-based HIV Impact Assessment (EPHIA) 2017-2018
NO. QUESTIONS AND INSTRUCTIONS CODING CATEGORIES SKIPHHX11 Is the cooking usually done in the
house, in a separate building or outdoors?
HOUSE = 1SEPARATE BUILDING = 2 OUTDOORS = 3DON’T KNOW = -8
HHX12 Do you have a separate room which is used as a kitchen?
YES 1NO 2DON’T KNOW -8
213 MAIN MATERIAL OF FLOOR
RECORD OBSERVATION.
NATURAL FLOOREARTH / SAND 11DUNG 12MUD / CLAY 13
RUDIMENTARY FLOORWOOD PLANKS 21PALM / BAMBOO 22
FINISHED FLOORPARQUET OR POLISHED WOOD 31VINYL OR ASPHALT STRIP 32CERAMIC TILES 33CEMENT/TERAZO 34CARPET 35OTHER 96(SPECIFY)
214 MAIN MATERIAL OF THE ROOF
RECORD OBSERVATION.
NATURAL ROOFINGNO ROOF 11THATCH/PALM LEAF/GRASS 12DUNG / MUD 13SO 18
RUDIMENTARY ROOFINGRUSTIC MAT 14WOOD PLANKS 15CARDBOARD 16TIN CANS 22PALM/BAMBOO 25STICKS WITH MUD AND DUNG 26PLASTIC/PVC 27
FINISHED ROOFINGCORRUGATED IRON 21WOOD 23CALAMINE/CEMENT FIBER 24ASBESTOS SHEET 31CONCRETE 32TILES (CERAMIC/BRICK/ETC.) 33ROOFING SHINGLES 34TIN 35SLATE 36OTHER 96(SPECIFY)
NO. QUESTIONS AND INSTRUCTIONS CODING CATEGORIES SKIP
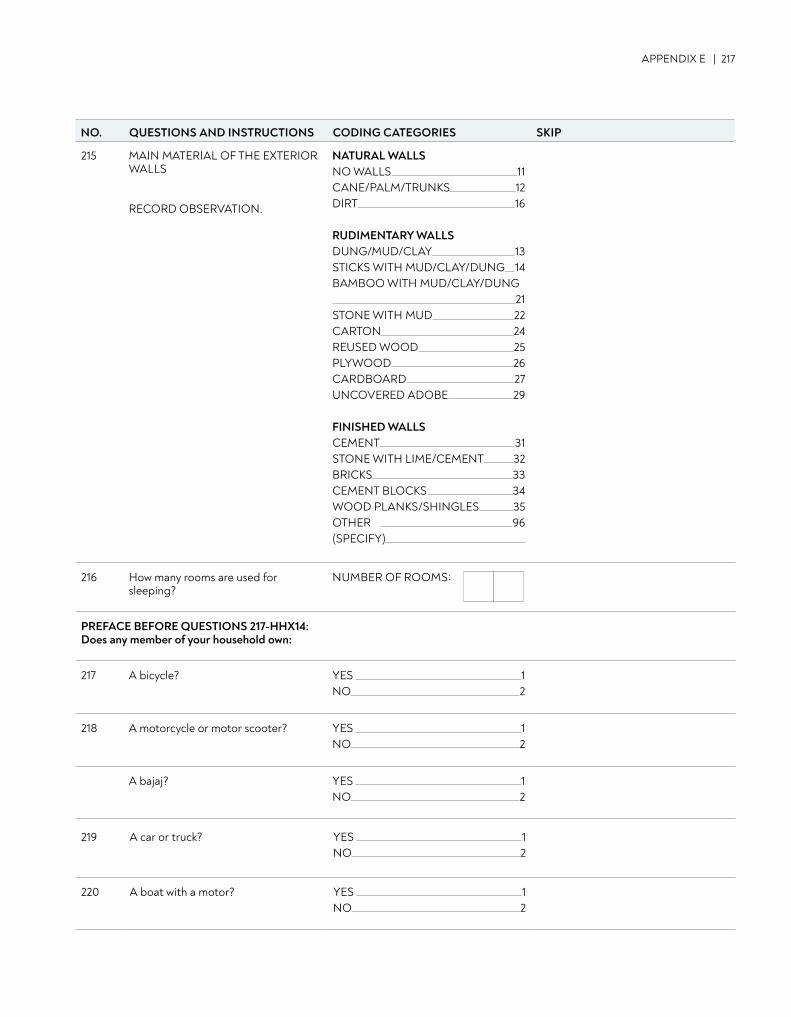
APPENDIX E | 217
215 MAIN MATERIAL OF THE EXTERIOR WALLS
RECORD OBSERVATION.
NATURAL WALLSNO WALLS 11CANE/PALM/TRUNKS 12DIRT 16
RUDIMENTARY WALLSDUNG/MUD/CLAY 13STICKS WITH MUD/CLAY/DUNG 14BAMBOO WITH MUD/CLAY/DUNG 21STONE WITH MUD 22CARTON 24REUSED WOOD 25PLYWOOD 26CARDBOARD 27UNCOVERED ADOBE 29
FINISHED WALLSCEMENT 31STONE WITH LIME/CEMENT 32BRICKS 33CEMENT BLOCKS 34WOOD PLANKS/SHINGLES 35OTHER 96(SPECIFY)
216 How many rooms are used for sleeping?
NUMBER OF ROOMS:
PREFACE BEFORE QUESTIONS 217-HHX14:Does any member of your household own:
217 A bicycle? YES 1NO 2
218 A motorcycle or motor scooter? YES 1NO 2
A bajaj? YES 1NO 2
219 A car or truck? YES 1NO 2
220 A boat with a motor? YES 1NO 2
NO. QUESTIONS AND INSTRUCTIONS CODING CATEGORIES SKIP
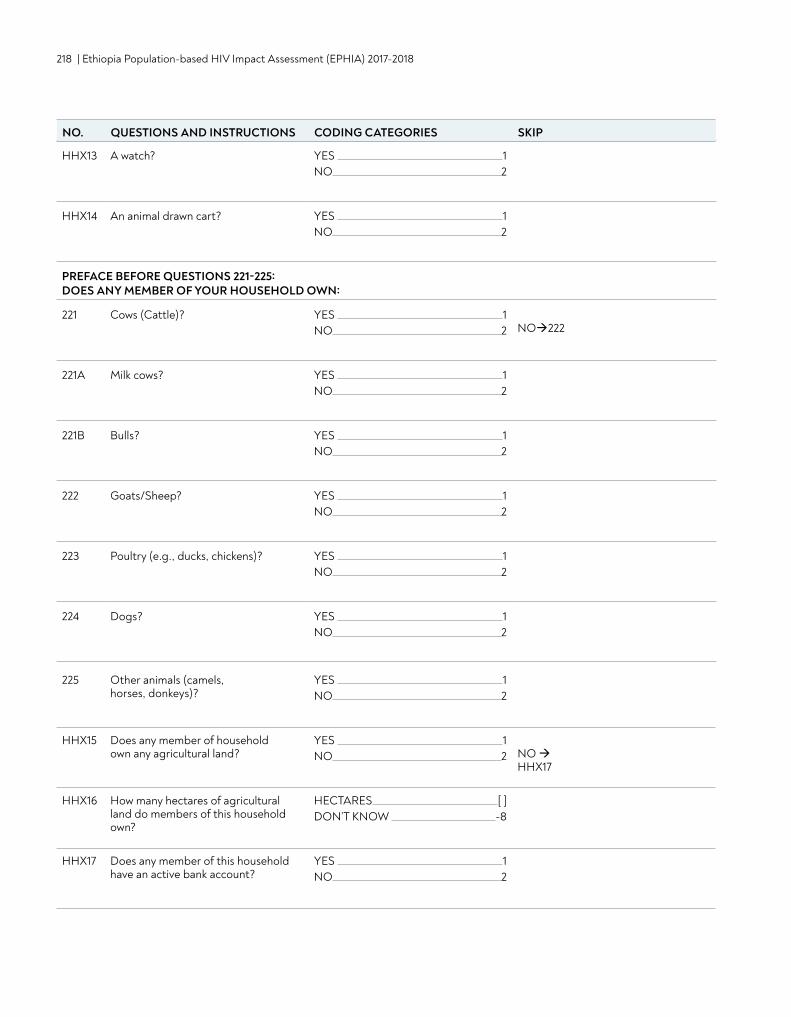
218 | Ethiopia Population-based HIV Impact Assessment (EPHIA) 2017-2018
HHX13 A watch? YES 1NO 2
HHX14 An animal drawn cart? YES 1NO 2
PREFACE BEFORE QUESTIONS 221-225: DOES ANY MEMBER OF YOUR HOUSEHOLD OWN:
221 Cows (Cattle)? YES 1NO 2 NO222
221A Milk cows? YES 1NO 2
221B Bulls? YES 1NO 2
222 Goats/Sheep? YES 1NO 2
223 Poultry (e.g., ducks, chickens)? YES 1NO 2
224 Dogs? YES 1NO 2
225 Other animals (camels, horses, donkeys)?
YES 1NO 2
HHX15 Does any member of household own any agricultural land?
YES 1NO 2 NO
HHX17
HHX16 How many hectares of agricultural land do members of this household own?
HECTARES [ ] DON’T KNOW -8
HHX17 Does any member of this household have an active bank account?
YES 1NO 2
NO. QUESTIONS AND INSTRUCTIONS CODING CATEGORIES SKIP
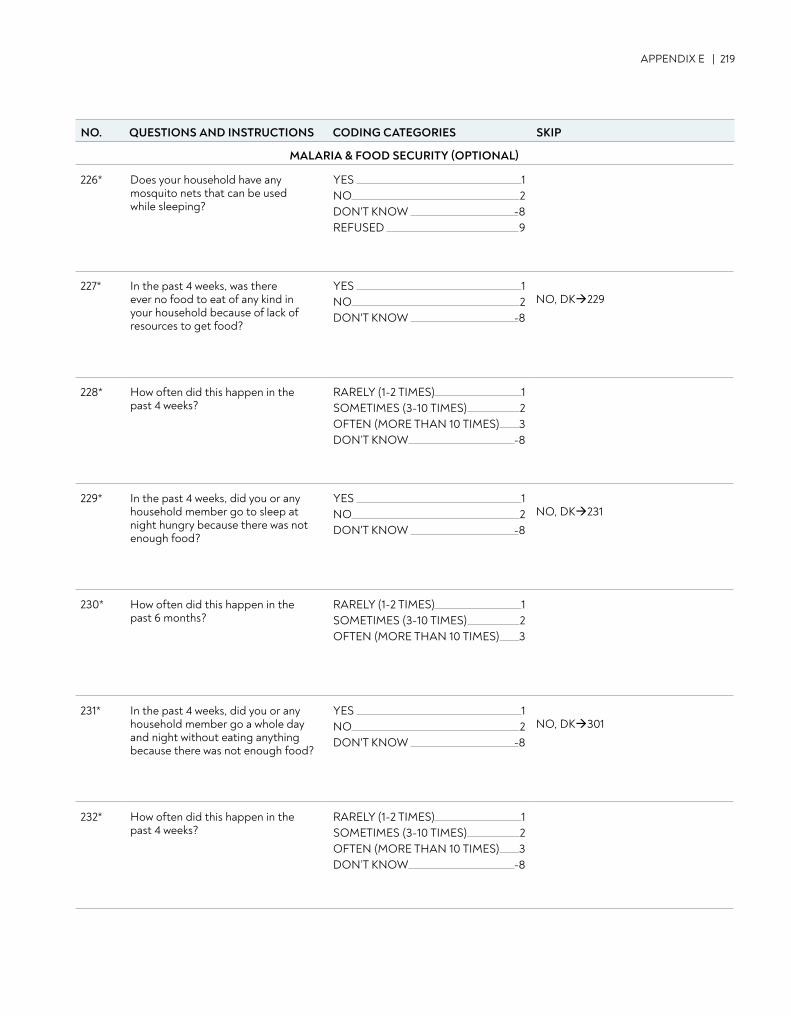
APPENDIX E | 219
MALARIA & FOOD SECURITY (OPTIONAL)
226* Does your household have any mosquito nets that can be used while sleeping?
YES 1NO 2DON'T KNOW -8REFUSED 9
227* In the past 4 weeks, was there ever no food to eat of any kind in your household because of lack of resources to get food?
YES 1NO 2DON'T KNOW -8
NO, DK229
228* How often did this happen in the past 4 weeks?
RARELY (1-2 TIMES) 1SOMETIMES (3-10 TIMES) 2OFTEN (MORE THAN 10 TIMES) 3DON’T KNOW -8
229* In the past 4 weeks, did you or any household member go to sleep at night hungry because there was not enough food?
YES 1NO 2DON'T KNOW -8
NO, DK231
230* How often did this happen in the past 6 months?
RARELY (1-2 TIMES) 1SOMETIMES (3-10 TIMES) 2OFTEN (MORE THAN 10 TIMES) 3
231* In the past 4 weeks, did you or any household member go a whole day and night without eating anything because there was not enough food?
YES 1NO 2DON'T KNOW -8
NO, DK301
232* How often did this happen in the past 4 weeks?
RARELY (1-2 TIMES) 1SOMETIMES (3-10 TIMES) 2OFTEN (MORE THAN 10 TIMES) 3DON’T KNOW -8
NO. QUESTIONS AND INSTRUCTIONS CODING CATEGORIES SKIP
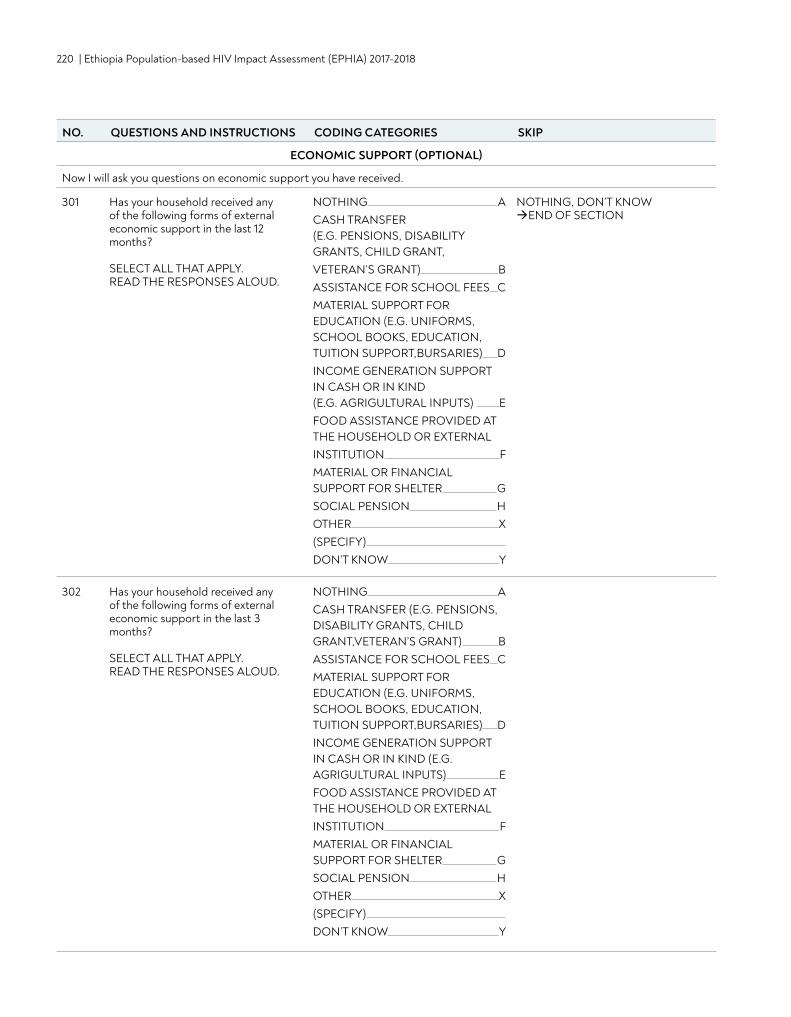
220 | Ethiopia Population-based HIV Impact Assessment (EPHIA) 2017-2018
NO. QUESTIONS AND INSTRUCTIONS CODING CATEGORIES SKIP
ECONOMIC SUPPORT (OPTIONAL)
Now I will ask you questions on economic support you have received.
301 Has your household received any of the following forms of external economic support in the last 12 months?
SELECT ALL THAT APPLY. READ THE RESPONSES ALOUD.
NOTHING ACASH TRANSFER (E.G. PENSIONS, DISABILITY GRANTS, CHILD GRANT,VETERAN’S GRANT) BASSISTANCE FOR SCHOOL FEES CMATERIAL SUPPORT FOR EDUCATION (E.G. UNIFORMS, SCHOOL BOOKS, EDUCATION, TUITION SUPPORT,BURSARIES) DINCOME GENERATION SUPPORT IN CASH OR IN KIND (E.G. AGRIGULTURAL INPUTS) EFOOD ASSISTANCE PROVIDED AT THE HOUSEHOLD OR EXTERNALINSTITUTION FMATERIAL OR FINANCIAL SUPPORT FOR SHELTER GSOCIAL PENSION HOTHER X(SPECIFY) DON’T KNOW Y
NOTHING, DON’T KNOWEND OF SECTION
302 Has your household received any of the following forms of external economic support in the last 3 months?
SELECT ALL THAT APPLY. READ THE RESPONSES ALOUD.
NOTHING ACASH TRANSFER (E.G. PENSIONS, DISABILITY GRANTS, CHILD GRANT,VETERAN’S GRANT) BASSISTANCE FOR SCHOOL FEES CMATERIAL SUPPORT FOR EDUCATION (E.G. UNIFORMS, SCHOOL BOOKS, EDUCATION, TUITION SUPPORT,BURSARIES) DINCOME GENERATION SUPPORT IN CASH OR IN KIND (E.G. AGRIGULTURAL INPUTS) EFOOD ASSISTANCE PROVIDED AT THE HOUSEHOLD OR EXTERNALINSTITUTION FMATERIAL OR FINANCIAL SUPPORT FOR SHELTER GSOCIAL PENSION HOTHER X(SPECIFY) DON’T KNOW Y
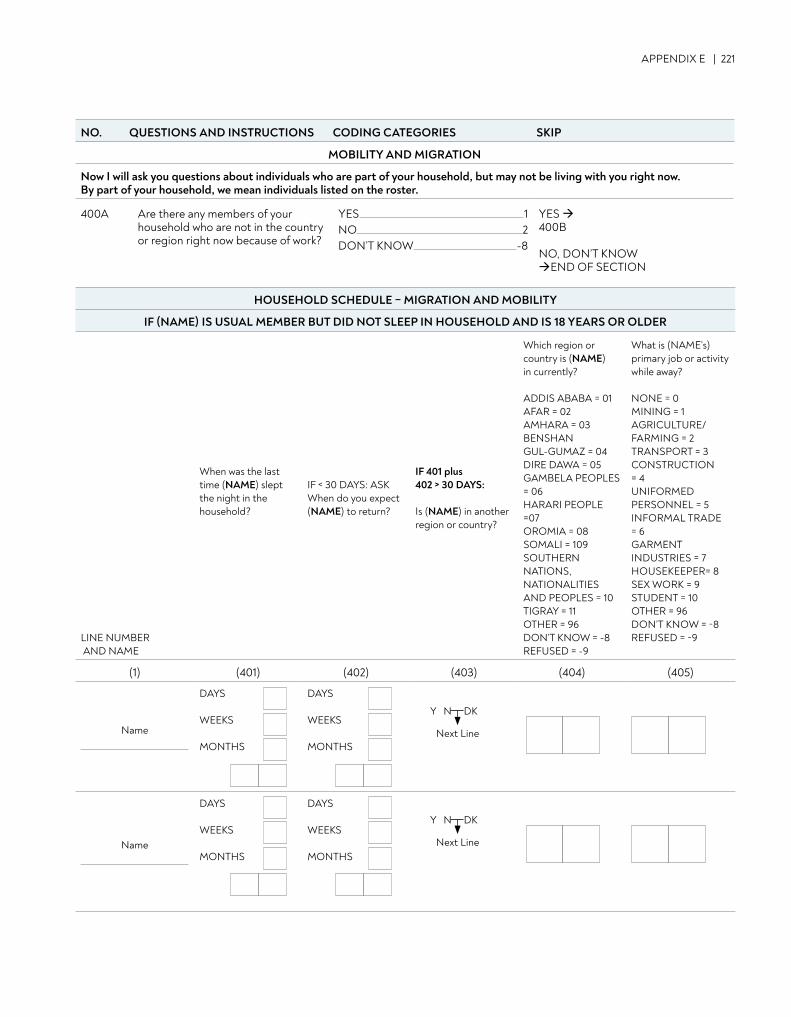
APPENDIX E | 221
NO. QUESTIONS AND INSTRUCTIONS CODING CATEGORIES SKIP
MOBILITY AND MIGRATION
Now I will ask you questions about individuals who are part of your household, but may not be living with you right now. By part of your household, we mean individuals listed on the roster.
400A Are there any members of your household who are not in the country or region right now because of work?
YES 1NO 2DON’T KNOW -8
YES 400B
NO, DON’T KNOWEND OF SECTION
HOUSEHOLD SCHEDULE – MIGRATION AND MOBILITY
IF (NAME) IS USUAL MEMBER BUT DID NOT SLEEP IN HOUSEHOLD AND IS 18 YEARS OR OLDER
LINE NUMBER AND NAME
When was the last time (NAME) slept the night in the household?
IF < 30 DAYS: ASKWhen do you expect (NAME) to return?
IF 401 plus 402 > 30 DAYS:
Is (NAME) in another region or country?
Which region or country is (NAME)in currently?
ADDIS ABABA = 01 AFAR = 02AMHARA = 03 BENSHAN GUL-GUMAZ = 04DIRE DAWA = 05 GAMBELA PEOPLES = 06 HARARI PEOPLE =07 OROMIA = 08SOMALI = 109 SOUTHERN NATIONS, NATIONALITIES AND PEOPLES = 10TIGRAY = 11OTHER = 96 DON’T KNOW = -8REFUSED = -9
What is (NAME’s) primary job or activity while away?
NONE = 0MINING = 1AGRICULTURE/FARMING = 2TRANSPORT = 3CONSTRUCTION = 4UNIFORMED PERSONNEL = 5INFORMAL TRADE = 6GARMENT INDUSTRIES = 7HOUSEKEEPER= 8SEX WORK = 9STUDENT = 10OTHER = 96DON’T KNOW = -8REFUSED = -9
(1) (401) (402) (403) (404) (405)
Name
DAYS
WEEKS
MONTHS
DAYS
WEEKS
MONTHS
Name
DAYS
WEEKS
MONTHS
DAYS
WEEKS
MONTHS
Next Line
Y N DK
Next Line
Y N DK
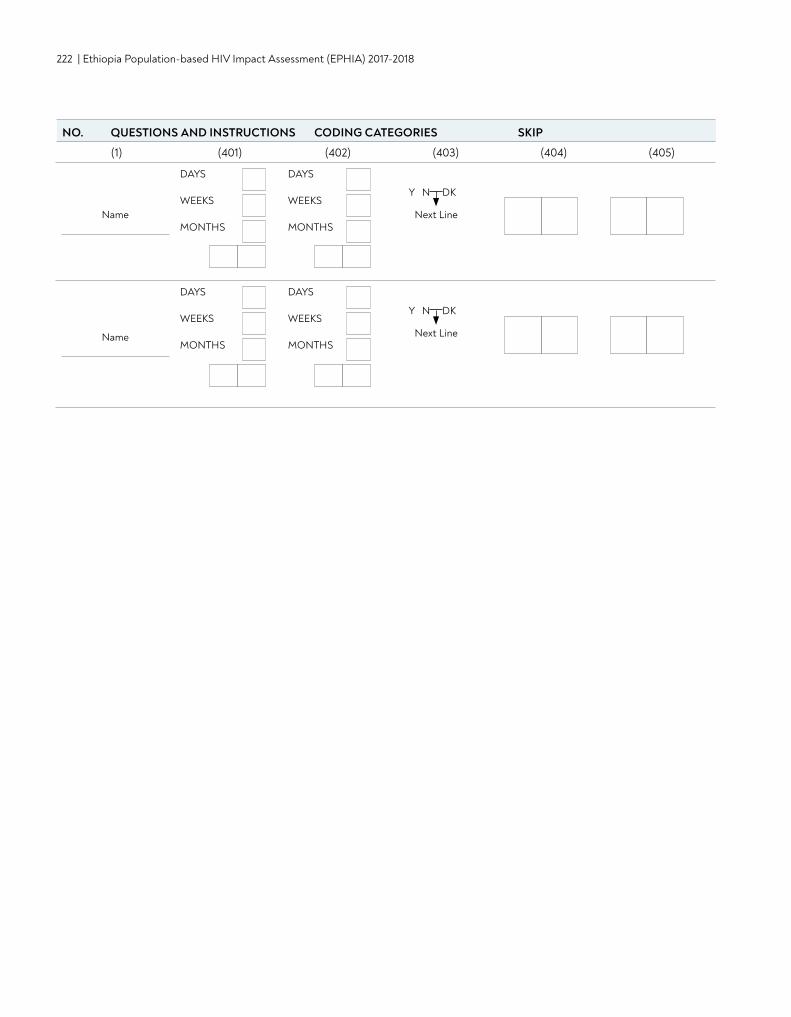
222 | Ethiopia Population-based HIV Impact Assessment (EPHIA) 2017-2018
Name
DAYS
WEEKS
MONTHS
DAYS
WEEKS
MONTHS
Name
DAYS
WEEKS
MONTHS
DAYS
WEEKS
MONTHS
Next Line
Y N DK
Next Line
Y N DK
(1) (401) (402) (403) (404) (405)
NO. QUESTIONS AND INSTRUCTIONS CODING CATEGORIES SKIP
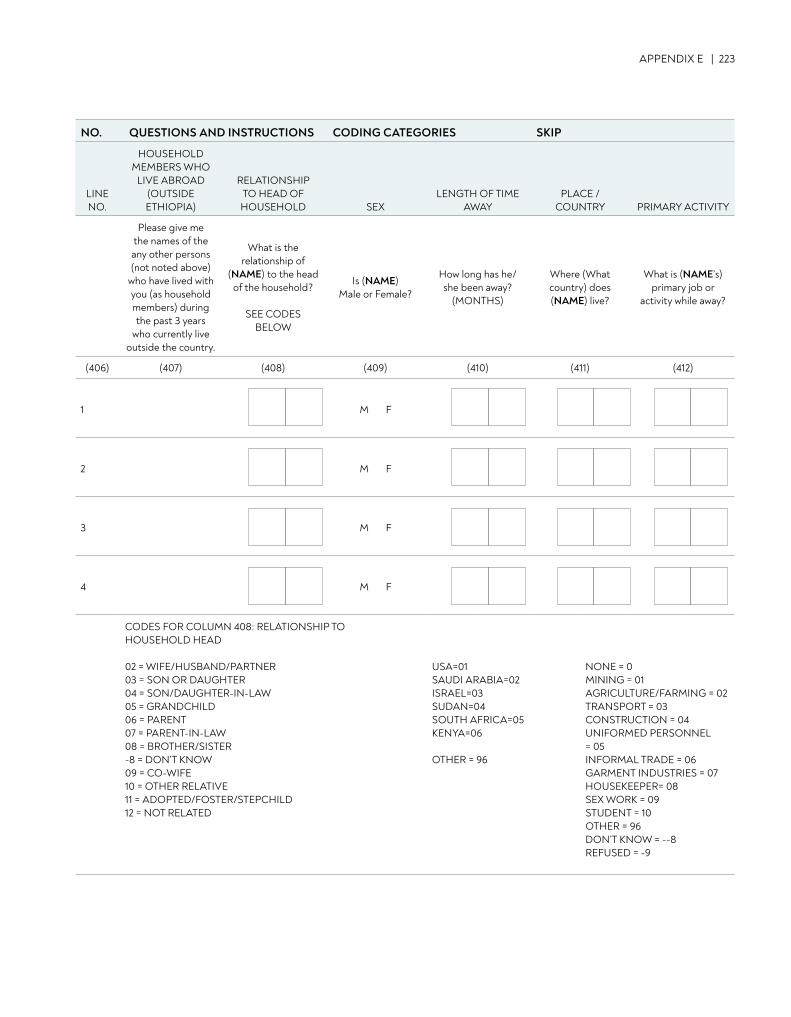
APPENDIX E | 223
NO. QUESTIONS AND INSTRUCTIONS CODING CATEGORIES SKIP
LINE NO.
HOUSEHOLD MEMBERS WHO
LIVE ABROAD (OUTSIDE ETHIOPIA)
RELATIONSHIP TO HEAD OF HOUSEHOLD SEX
LENGTH OF TIME AWAY
PLACE / COUNTRY PRIMARY ACTIVITY
Please give me the names of the any other persons (not noted above)
who have lived with you (as household members) during the past 3 years
who currently live outside the country.
What is the relationship of
(NAME) to the head of the household?
SEE CODES BELOW
Is (NAME) Male or Female?
How long has he/she been away?
(MONTHS)
Where (What country) does (NAME) live?
What is (NAME’s) primary job or
activity while away?
(406) (407) (408) (409) (410) (411) (412)
1 M F
2 M F
3 M F
4 M F
CODES FOR COLUMN 408: RELATIONSHIP TO HOUSEHOLD HEAD
02 = WIFE/HUSBAND/PARTNER03 = SON OR DAUGHTER 04 = SON/DAUGHTER-IN-LAW05 = GRANDCHILD06 = PARENT 07 = PARENT-IN-LAW08 = BROTHER/SISTER-8 = DON’T KNOW09 = CO-WIFE10 = OTHER RELATIVE11 = ADOPTED/FOSTER/STEPCHILD12 = NOT RELATED
USA=01SAUDI ARABIA=02 ISRAEL=03 SUDAN=04SOUTH AFRICA=05 KENYA=06
OTHER = 96
NONE = 0MINING = 01AGRICULTURE/FARMING = 02TRANSPORT = 03CONSTRUCTION = 04UNIFORMED PERSONNEL = 05INFORMAL TRADE = 06GARMENT INDUSTRIES = 07HOUSEKEEPER= 08SEX WORK = 09STUDENT = 10OTHER = 96DON’T KNOW = --8REFUSED = -9
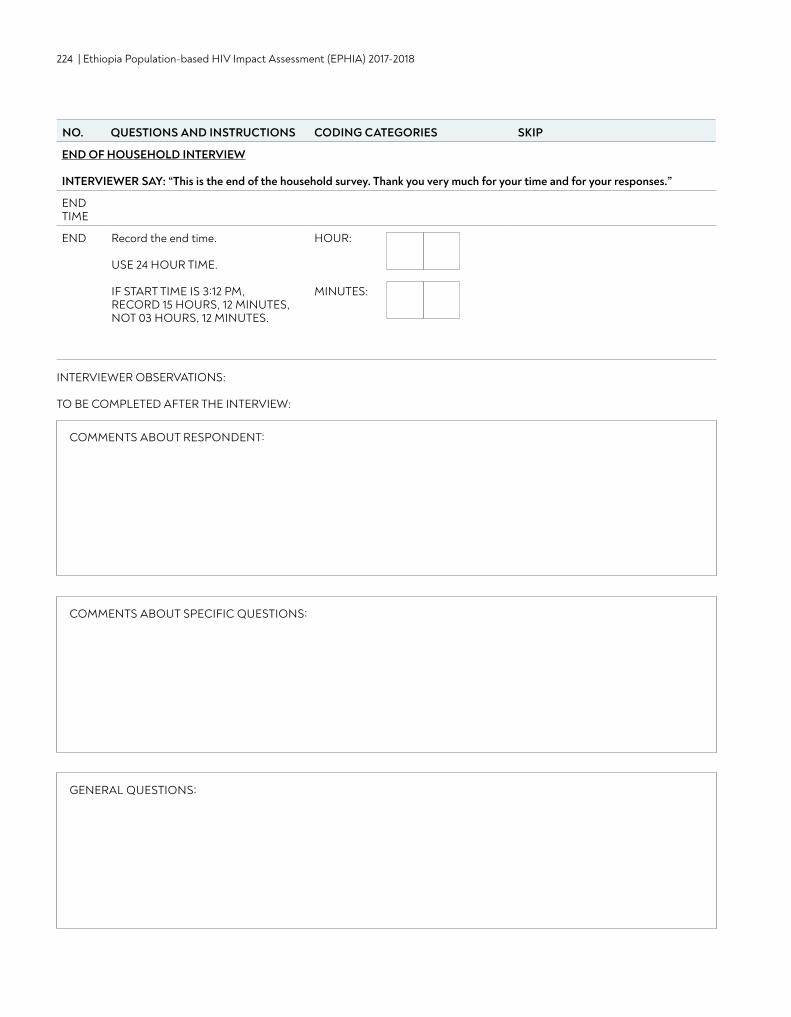
224 | Ethiopia Population-based HIV Impact Assessment (EPHIA) 2017-2018
NO. QUESTIONS AND INSTRUCTIONS CODING CATEGORIES SKIP
END OF HOUSEHOLD INTERVIEW
INTERVIEWER SAY: “This is the end of the household survey. Thank you very much for your time and for your responses.”
END TIME
END Record the end time.
USE 24 HOUR TIME.
IF START TIME IS 3:12 PM, RECORD 15 HOURS, 12 MINUTES, NOT 03 HOURS, 12 MINUTES.
HOUR:
MINUTES:
INTERVIEWER OBSERVATIONS: TO BE COMPLETED AFTER THE INTERVIEW:
COMMENTS ABOUT RESPONDENT:
COMMENTS ABOUT SPECIFIC QUESTIONS:
GENERAL QUESTIONS:
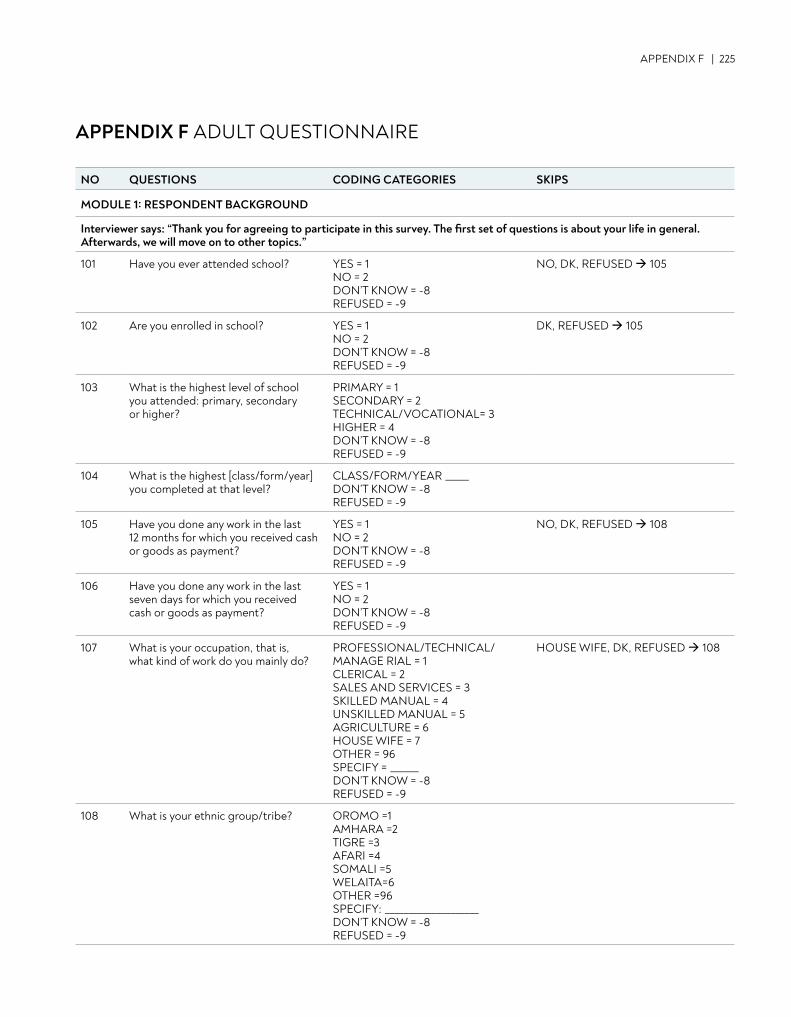
APPENDIX F | 225
APPENDIX F ADULT QUESTIONNAIRE
NO QUESTIONS CODING CATEGORIES SKIPS
MODULE 1: RESPONDENT BACKGROUND
Interviewer says: “Thank you for agreeing to participate in this survey. The first set of questions is about your life in general. Afterwards, we will move on to other topics.”
101 Have you ever attended school? YES = 1 NO = 2 DON’T KNOW = -8 REFUSED = -9
NO, DK, REFUSED 105
102 Are you enrolled in school? YES = 1 NO = 2 DON’T KNOW = -8 REFUSED = -9
DK, REFUSED 105
103 What is the highest level of school you attended: primary, secondary or higher?
PRIMARY = 1 SECONDARY = 2 TECHNICAL/VOCATIONAL= 3 HIGHER = 4 DON’T KNOW = -8 REFUSED = -9
104 What is the highest [class/form/year] you completed at that level?
CLASS/FORM/YEAR _____ DON’T KNOW = -8 REFUSED = -9
105 Have you done any work in the last 12 months for which you received cash or goods as payment?
YES = 1 NO = 2 DON’T KNOW = -8 REFUSED = -9
NO, DK, REFUSED 108
106 Have you done any work in the last seven days for which you received cash or goods as payment?
YES = 1 NO = 2 DON’T KNOW = -8 REFUSED = -9
107 What is your occupation, that is, what kind of work do you mainly do?
PROFESSIONAL/TECHNICAL/MANAGE RIAL = 1 CLERICAL = 2 SALES AND SERVICES = 3 SKILLED MANUAL = 4 UNSKILLED MANUAL = 5 AGRICULTURE = 6 HOUSE WIFE = 7 OTHER = 96 SPECIFY = ______ DON’T KNOW = -8 REFUSED = -9
HOUSE WIFE, DK, REFUSED 108
108 What is your ethnic group/tribe? OROMO =1 AMHARA =2 TIGRE =3 AFARI =4 SOMALI =5 WELAITA=6 OTHER =96 SPECIFY: ____________________ DON’T KNOW = -8 REFUSED = -9
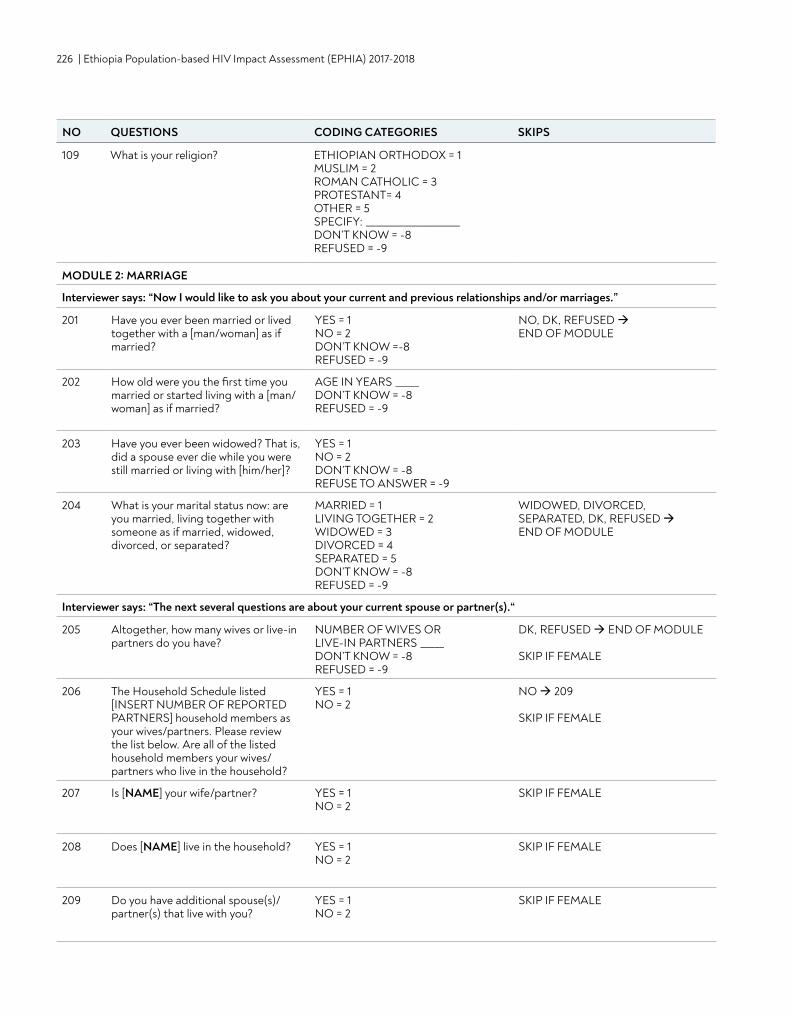
226 | Ethiopia Population-based HIV Impact Assessment (EPHIA) 2017-2018
109 What is your religion? ETHIOPIAN ORTHODOX = 1 MUSLIM = 2 ROMAN CATHOLIC = 3 PROTESTANT= 4 OTHER = 5 SPECIFY: ____________________ DON’T KNOW = -8 REFUSED = -9
MODULE 2: MARRIAGE
Interviewer says: “Now I would like to ask you about your current and previous relationships and/or marriages.”
201 Have you ever been married or lived together with a [man/woman] as if married?
YES = 1 NO = 2 DON’T KNOW =-8 REFUSED = -9
NO, DK, REFUSED END OF MODULE
202 How old were you the first time you married or started living with a [man/woman] as if married?
AGE IN YEARS _____ DON’T KNOW = -8 REFUSED = -9
203 Have you ever been widowed? That is, did a spouse ever die while you were still married or living with [him/her]?
YES = 1 NO = 2 DON’T KNOW = -8 REFUSE TO ANSWER = -9
204 What is your marital status now: are you married, living together with someone as if married, widowed, divorced, or separated?
MARRIED = 1 LIVING TOGETHER = 2WIDOWED = 3 DIVORCED = 4 SEPARATED = 5 DON’T KNOW = -8 REFUSED = -9
WIDOWED, DIVORCED, SEPARATED, DK, REFUSED END OF MODULE
Interviewer says: “The next several questions are about your current spouse or partner(s).“
205 Altogether, how many wives or live-in partners do you have?
NUMBER OF WIVES OR LIVE-IN PARTNERS _____ DON’T KNOW = -8 REFUSED = -9
DK, REFUSED END OF MODULE SKIP IF FEMALE
206 The Household Schedule listed [INSERT NUMBER OF REPORTED PARTNERS] household members as your wives/partners. Please review the list below. Are all of the listed household members your wives/partners who live in the household?
YES = 1 NO = 2
NO 209 SKIP IF FEMALE
207 Is [NAME] your wife/partner? YES = 1 NO = 2
SKIP IF FEMALE
208 Does [NAME] live in the household? YES = 1 NO = 2
SKIP IF FEMALE
209 Do you have additional spouse(s)/partner(s) that live with you?
YES = 1 NO = 2
SKIP IF FEMALE
NO QUESTIONS CODING CATEGORIES SKIPS
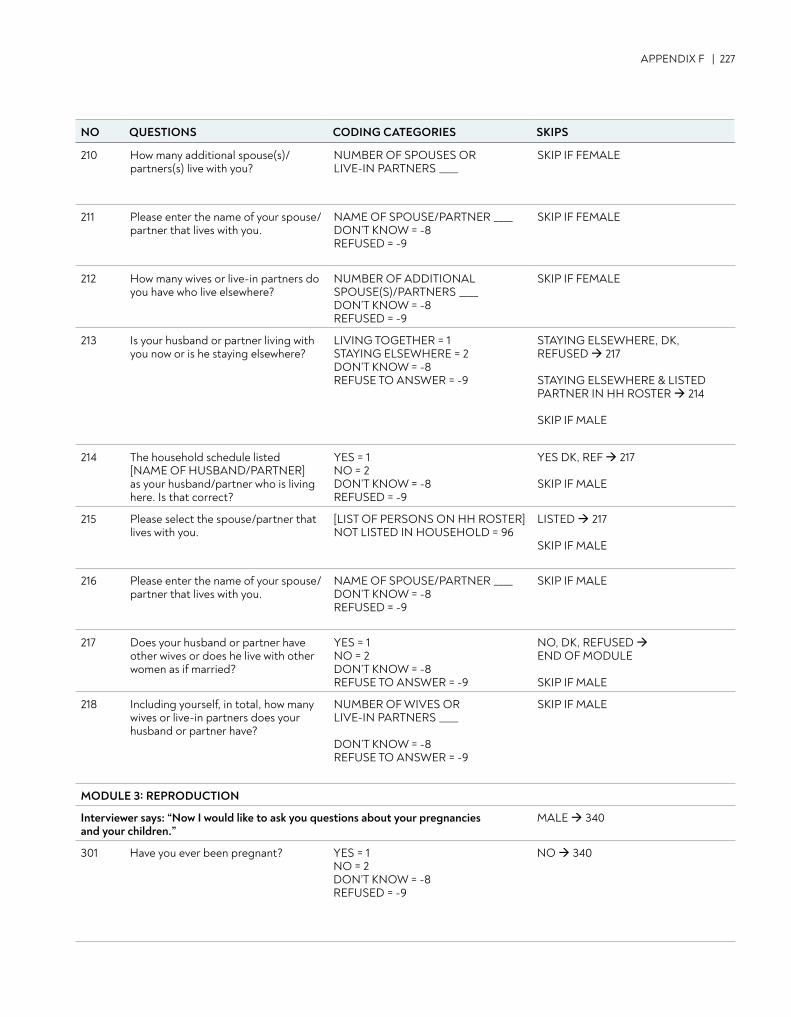
APPENDIX F | 227
NO QUESTIONS CODING CATEGORIES SKIPS
210 How many additional spouse(s)/partners(s) live with you?
NUMBER OF SPOUSES OR LIVE-IN PARTNERS ____
SKIP IF FEMALE
211 Please enter the name of your spouse/partner that lives with you.
NAME OF SPOUSE/PARTNER ____ DON’T KNOW = -8 REFUSED = -9
SKIP IF FEMALE
212 How many wives or live-in partners do you have who live elsewhere?
NUMBER OF ADDITIONAL SPOUSE(S)/PARTNERS ____ DON’T KNOW = -8 REFUSED = -9
SKIP IF FEMALE
213 Is your husband or partner living with you now or is he staying elsewhere?
LIVING TOGETHER = 1 STAYING ELSEWHERE = 2 DON’T KNOW = -8 REFUSE TO ANSWER = -9
STAYING ELSEWHERE, DK, REFUSED 217 STAYING ELSEWHERE & LISTED PARTNER IN HH ROSTER 214 SKIP IF MALE
214 The household schedule listed [NAME OF HUSBAND/PARTNER] as your husband/partner who is living here. Is that correct?
YES = 1 NO = 2 DON’T KNOW = -8 REFUSED = -9
YES DK, REF 217 SKIP IF MALE
215 Please select the spouse/partner that lives with you.
[LIST OF PERSONS ON HH ROSTER] NOT LISTED IN HOUSEHOLD = 96
LISTED 217
SKIP IF MALE
216 Please enter the name of your spouse/partner that lives with you.
NAME OF SPOUSE/PARTNER ____ DON’T KNOW = -8 REFUSED = -9
SKIP IF MALE
217 Does your husband or partner have other wives or does he live with other women as if married?
YES = 1 NO = 2 DON’T KNOW = -8 REFUSE TO ANSWER = -9
NO, DK, REFUSED END OF MODULE SKIP IF MALE
218 Including yourself, in total, how many wives or live-in partners does your husband or partner have?
NUMBER OF WIVES OR LIVE-IN PARTNERS ____ DON’T KNOW = -8 REFUSE TO ANSWER = -9
SKIP IF MALE
MODULE 3: REPRODUCTION
Interviewer says: “Now I would like to ask you questions about your pregnancies and your children.”
MALE 340
301 Have you ever been pregnant? YES = 1 NO = 2 DON’T KNOW = -8 REFUSED = -9
NO 340
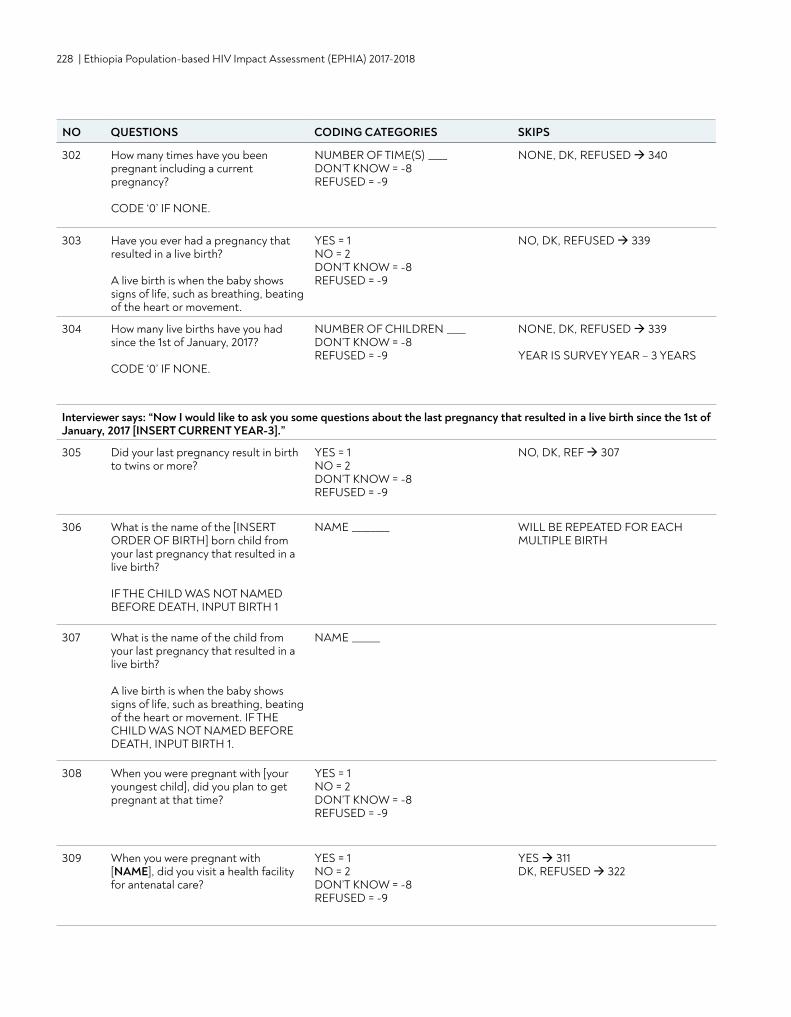
228 | Ethiopia Population-based HIV Impact Assessment (EPHIA) 2017-2018
NO QUESTIONS CODING CATEGORIES SKIPS
302 How many times have you been pregnant including a current pregnancy? CODE ‘0’ IF NONE.
NUMBER OF TIME(S) ____ DON’T KNOW = -8 REFUSED = -9
NONE, DK, REFUSED 340
303 Have you ever had a pregnancy that resulted in a live birth? A live birth is when the baby shows signs of life, such as breathing, beating of the heart or movement.
YES = 1 NO = 2 DON’T KNOW = -8 REFUSED = -9
NO, DK, REFUSED 339
304 How many live births have you had since the 1st of January, 2017? CODE ‘0’ IF NONE.
NUMBER OF CHILDREN ____ DON’T KNOW = -8 REFUSED = -9
NONE, DK, REFUSED 339 YEAR IS SURVEY YEAR – 3 YEARS
Interviewer says: “Now I would like to ask you some questions about the last pregnancy that resulted in a live birth since the 1st of January, 2017 [INSERT CURRENT YEAR-3].”
305 Did your last pregnancy result in birth to twins or more?
YES = 1 NO = 2 DON’T KNOW = -8REFUSED = -9
NO, DK, REF 307
306 What is the name of the [INSERT ORDER OF BIRTH] born child from your last pregnancy that resulted in a live birth? IF THE CHILD WAS NOT NAMED BEFORE DEATH, INPUT BIRTH 1
NAME ________ WILL BE REPEATED FOR EACH MULTIPLE BIRTH
307 What is the name of the child from your last pregnancy that resulted in a live birth? A live birth is when the baby shows signs of life, such as breathing, beating of the heart or movement. IF THE CHILD WAS NOT NAMED BEFORE DEATH, INPUT BIRTH 1.
NAME ______
308 When you were pregnant with [your youngest child], did you plan to get pregnant at that time?
YES = 1 NO = 2 DON’T KNOW = -8 REFUSED = -9
309 When you were pregnant with [NAME], did you visit a health facility for antenatal care?
YES = 1 NO = 2 DON’T KNOW = -8 REFUSED = -9
YES 311 DK, REFUSED 322
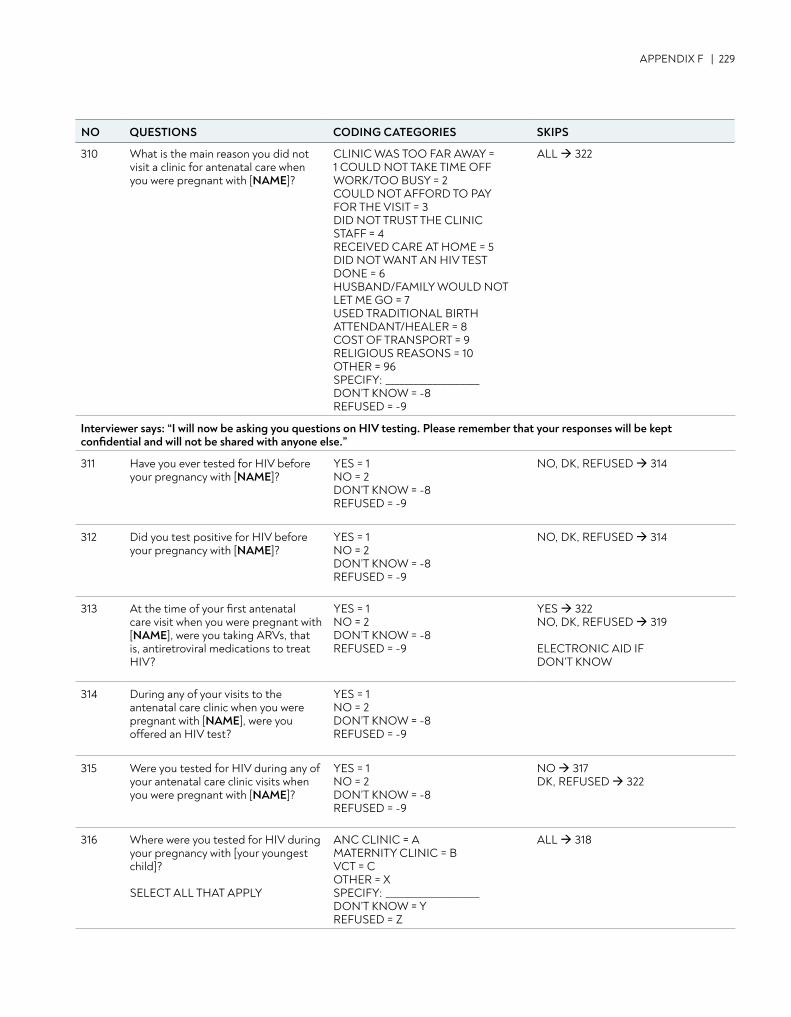
APPENDIX F | 229
NO QUESTIONS CODING CATEGORIES SKIPS
310 What is the main reason you did not visit a clinic for antenatal care when you were pregnant with [NAME]?
CLINIC WAS TOO FAR AWAY = 1 COULD NOT TAKE TIME OFF WORK/TOO BUSY = 2 COULD NOT AFFORD TO PAY FOR THE VISIT = 3 DID NOT TRUST THE CLINIC STAFF = 4 RECEIVED CARE AT HOME = 5DID NOT WANT AN HIV TEST DONE = 6 HUSBAND/FAMILY WOULD NOT LET ME GO = 7 USED TRADITIONAL BIRTH ATTENDANT/HEALER = 8 COST OF TRANSPORT = 9 RELIGIOUS REASONS = 10 OTHER = 96 SPECIFY: ____________________ DON’T KNOW = -8 REFUSED = -9
ALL 322
Interviewer says: “I will now be asking you questions on HIV testing. Please remember that your responses will be kept confidential and will not be shared with anyone else.”
311 Have you ever tested for HIV before your pregnancy with [NAME]?
YES = 1 NO = 2 DON’T KNOW = -8 REFUSED = -9
NO, DK, REFUSED 314
312 Did you test positive for HIV before your pregnancy with [NAME]?
YES = 1 NO = 2 DON’T KNOW = -8 REFUSED = -9
NO, DK, REFUSED 314
313 At the time of your first antenatal care visit when you were pregnant with [NAME], were you taking ARVs, that is, antiretroviral medications to treat HIV?
YES = 1 NO = 2 DON’T KNOW = -8 REFUSED = -9
YES 322 NO, DK, REFUSED 319 ELECTRONIC AID IF DON’T KNOW
314 During any of your visits to the antenatal care clinic when you were pregnant with [NAME], were you offered an HIV test?
YES = 1 NO = 2 DON’T KNOW = -8 REFUSED = -9
315 Were you tested for HIV during any of your antenatal care clinic visits when you were pregnant with [NAME]?
YES = 1 NO = 2 DON’T KNOW = -8 REFUSED = -9
NO 317 DK, REFUSED 322
316 Where were you tested for HIV during your pregnancy with [your youngest child]? SELECT ALL THAT APPLY
ANC CLINIC = A MATERNITY CLINIC = B VCT = C OTHER = X SPECIFY: ____________________ DON’T KNOW = Y REFUSED = Z
ALL 318
NO QUESTIONS CODING CATEGORIES SKIPS
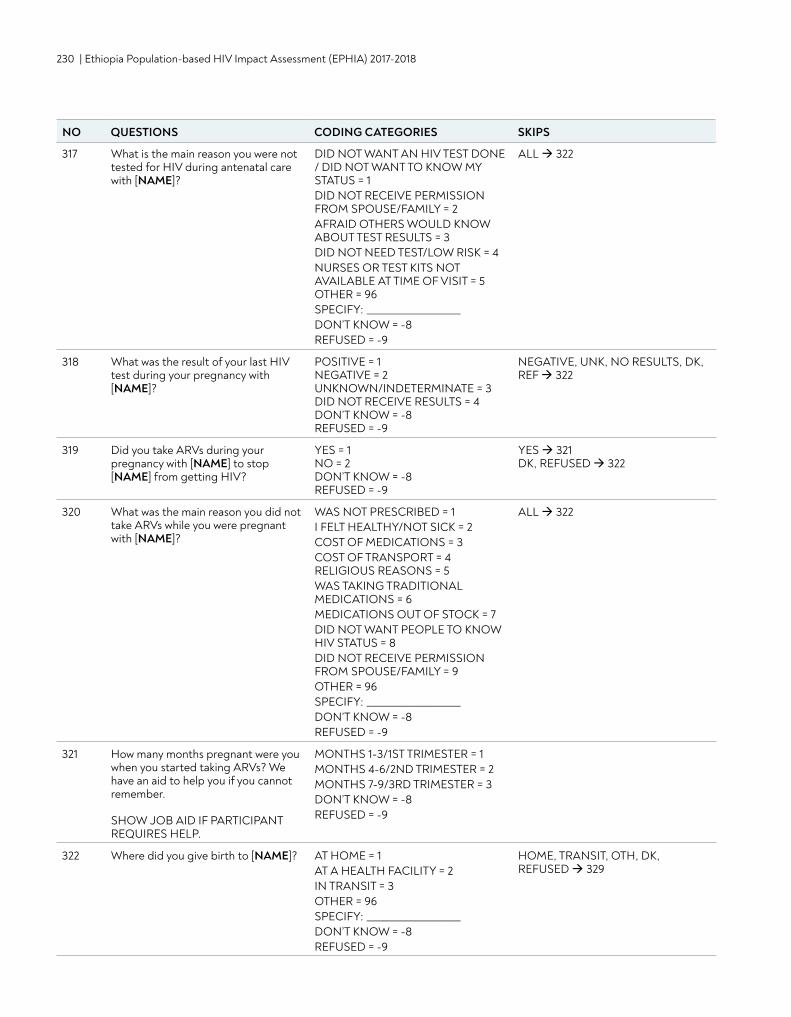
230 | Ethiopia Population-based HIV Impact Assessment (EPHIA) 2017-2018
317 What is the main reason you were not tested for HIV during antenatal care with [NAME]?
DID NOT WANT AN HIV TEST DONE / DID NOT WANT TO KNOW MY STATUS = 1 DID NOT RECEIVE PERMISSION FROM SPOUSE/FAMILY = 2 AFRAID OTHERS WOULD KNOW ABOUT TEST RESULTS = 3 DID NOT NEED TEST/LOW RISK = 4 NURSES OR TEST KITS NOT AVAILABLE AT TIME OF VISIT = 5 OTHER = 96 SPECIFY: ____________________ DON’T KNOW = -8 REFUSED = -9
ALL 322
318 What was the result of your last HIV test during your pregnancy with [NAME]?
POSITIVE = 1 NEGATIVE = 2 UNKNOWN/INDETERMINATE = 3 DID NOT RECEIVE RESULTS = 4 DON’T KNOW = -8 REFUSED = -9
NEGATIVE, UNK, NO RESULTS, DK, REF 322
319 Did you take ARVs during your pregnancy with [NAME] to stop [NAME] from getting HIV?
YES = 1 NO = 2 DON’T KNOW = -8 REFUSED = -9
YES 321 DK, REFUSED 322
320 What was the main reason you did not take ARVs while you were pregnant with [NAME]?
WAS NOT PRESCRIBED = 1 I FELT HEALTHY/NOT SICK = 2 COST OF MEDICATIONS = 3 COST OF TRANSPORT = 4 RELIGIOUS REASONS = 5 WAS TAKING TRADITIONAL MEDICATIONS = 6 MEDICATIONS OUT OF STOCK = 7 DID NOT WANT PEOPLE TO KNOW HIV STATUS = 8 DID NOT RECEIVE PERMISSION FROM SPOUSE/FAMILY = 9 OTHER = 96SPECIFY: ____________________ DON’T KNOW = -8 REFUSED = -9
ALL 322
321 How many months pregnant were you when you started taking ARVs? We have an aid to help you if you cannot remember. SHOW JOB AID IF PARTICIPANT REQUIRES HELP.
MONTHS 1-3/1ST TRIMESTER = 1 MONTHS 4-6/2ND TRIMESTER = 2 MONTHS 7-9/3RD TRIMESTER = 3 DON’T KNOW = -8 REFUSED = -9
322 Where did you give birth to [NAME]? AT HOME = 1 AT A HEALTH FACILITY = 2 IN TRANSIT = 3 OTHER = 96 SPECIFY: ____________________ DON’T KNOW = -8 REFUSED = -9
HOME, TRANSIT, OTH, DK, REFUSED 329
NO QUESTIONS CODING CATEGORIES SKIPS
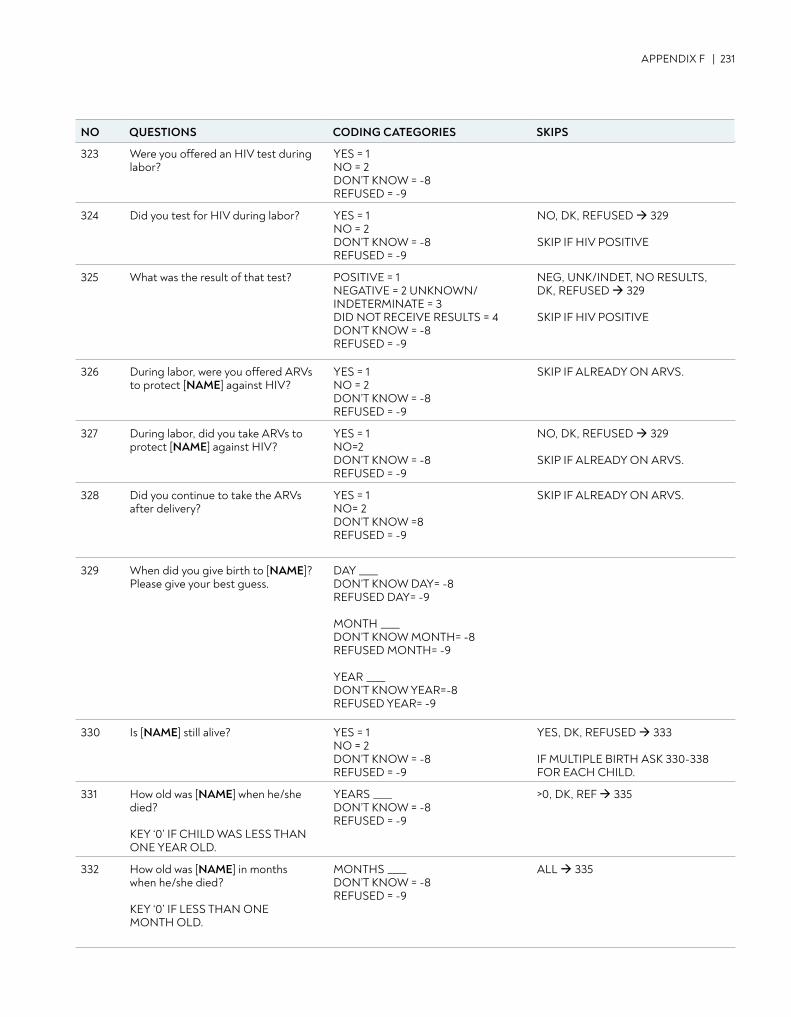
APPENDIX F | 231
323 Were you offered an HIV test during labor?
YES = 1 NO = 2 DON’T KNOW = -8 REFUSED = -9
324 Did you test for HIV during labor? YES = 1 NO = 2 DON’T KNOW = -8 REFUSED = -9
NO, DK, REFUSED 329 SKIP IF HIV POSITIVE
325 What was the result of that test? POSITIVE = 1 NEGATIVE = 2 UNKNOWN/INDETERMINATE = 3 DID NOT RECEIVE RESULTS = 4 DON’T KNOW = -8 REFUSED = -9
NEG, UNK/INDET, NO RESULTS, DK, REFUSED 329 SKIP IF HIV POSITIVE
326 During labor, were you offered ARVs to protect [NAME] against HIV?
YES = 1 NO = 2 DON’T KNOW = -8 REFUSED = -9
SKIP IF ALREADY ON ARVS.
327 During labor, did you take ARVs to protect [NAME] against HIV?
YES = 1 NO=2 DON’T KNOW = -8 REFUSED = -9
NO, DK, REFUSED 329 SKIP IF ALREADY ON ARVS.
328 Did you continue to take the ARVs after delivery?
YES = 1 NO= 2 DON’T KNOW =8 REFUSED = -9
SKIP IF ALREADY ON ARVS.
329 When did you give birth to [NAME]? Please give your best guess.
DAY ____ DON’T KNOW DAY= -8 REFUSED DAY= -9 MONTH ____ DON’T KNOW MONTH= -8 REFUSED MONTH= -9 YEAR ____ DON’T KNOW YEAR=-8 REFUSED YEAR= -9
330 Is [NAME] still alive? YES = 1 NO = 2 DON’T KNOW = -8 REFUSED = -9
YES, DK, REFUSED 333 IF MULTIPLE BIRTH ASK 330-338 FOR EACH CHILD.
331 How old was [NAME] when he/she died? KEY ‘0’ IF CHILD WAS LESS THAN ONE YEAR OLD.
YEARS ____ DON’T KNOW = -8 REFUSED = -9
>0, DK, REF 335
332 How old was [NAME] in months when he/she died? KEY ‘0’ IF LESS THAN ONE MONTH OLD.
MONTHS ____ DON’T KNOW = -8 REFUSED = -9
ALL 335
NO QUESTIONS CODING CATEGORIES SKIPS
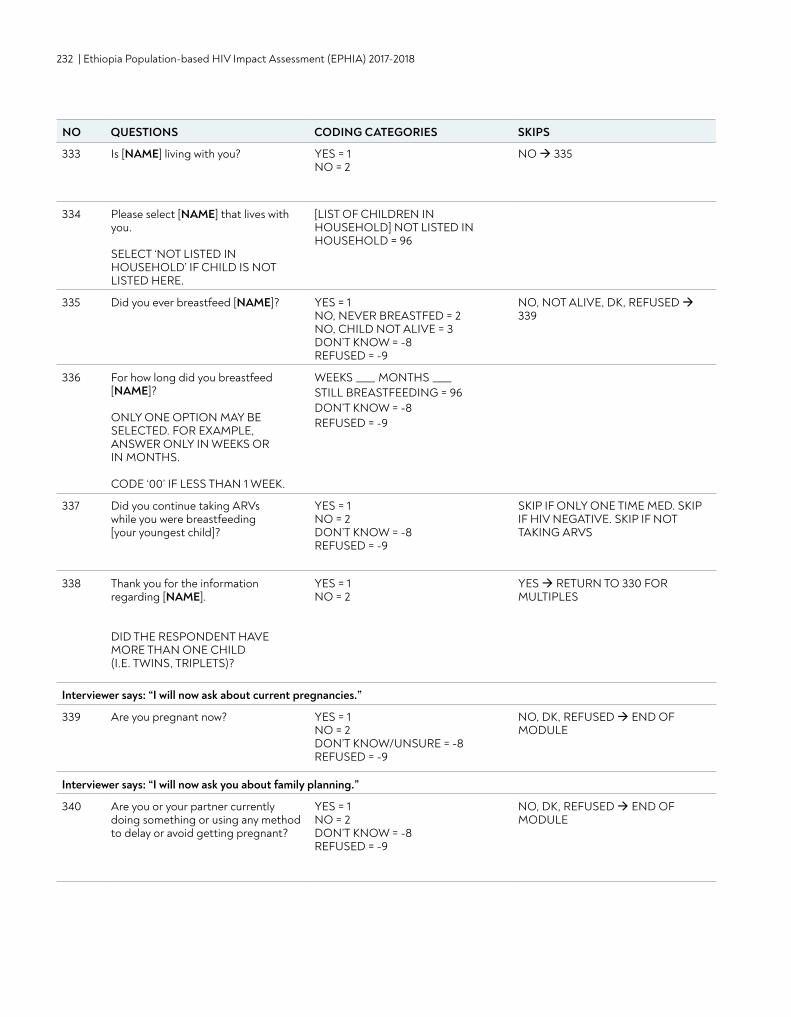
232 | Ethiopia Population-based HIV Impact Assessment (EPHIA) 2017-2018
333 Is [NAME] living with you? YES = 1 NO = 2
NO 335
334 Please select [NAME] that lives with you. SELECT ‘NOT LISTED IN HOUSEHOLD’ IF CHILD IS NOT LISTED HERE.
[LIST OF CHILDREN IN HOUSEHOLD] NOT LISTED IN HOUSEHOLD = 96
335 Did you ever breastfeed [NAME]? YES = 1 NO, NEVER BREASTFED = 2 NO, CHILD NOT ALIVE = 3 DON’T KNOW = -8 REFUSED = -9
NO, NOT ALIVE, DK, REFUSED 339
336 For how long did you breastfeed [NAME]? ONLY ONE OPTION MAY BE SELECTED. FOR EXAMPLE, ANSWER ONLY IN WEEKS OR IN MONTHS. CODE ‘00’ IF LESS THAN 1 WEEK.
WEEKS ____ MONTHS ____ STILL BREASTFEEDING = 96 DON’T KNOW = -8 REFUSED = -9
337 Did you continue taking ARVs while you were breastfeeding [your youngest child]?
YES = 1 NO = 2 DON’T KNOW = -8 REFUSED = -9
SKIP IF ONLY ONE TIME MED. SKIP IF HIV NEGATIVE. SKIP IF NOT TAKING ARVS
338 Thank you for the information regarding [NAME]. DID THE RESPONDENT HAVE MORE THAN ONE CHILD (I.E. TWINS, TRIPLETS)?
YES = 1 NO = 2
YES RETURN TO 330 FOR MULTIPLES
Interviewer says: “I will now ask about current pregnancies.”
339 Are you pregnant now? YES = 1 NO = 2 DON’T KNOW/UNSURE = -8 REFUSED = -9
NO, DK, REFUSED END OF MODULE
Interviewer says: “I will now ask you about family planning.”
340 Are you or your partner currently doing something or using any method to delay or avoid getting pregnant?
YES = 1 NO = 2 DON’T KNOW = -8 REFUSED = -9
NO, DK, REFUSED END OF MODULE
NO QUESTIONS CODING CATEGORIES SKIPS
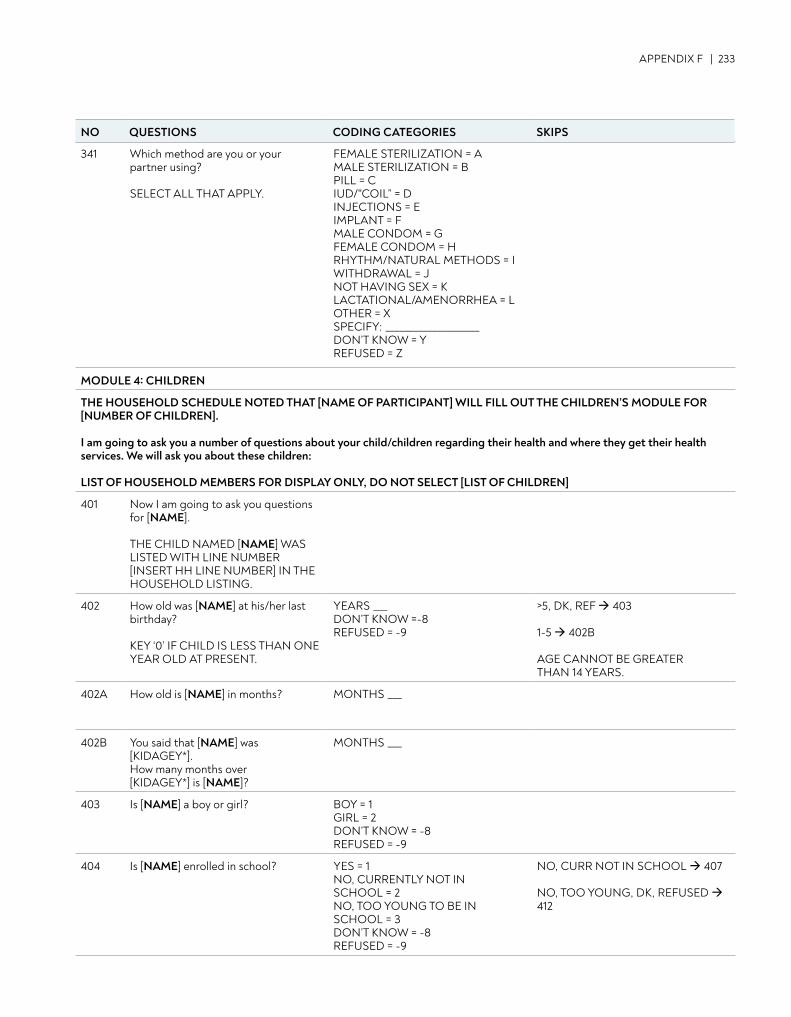
APPENDIX F | 233
341 Which method are you or your partner using? SELECT ALL THAT APPLY.
FEMALE STERILIZATION = A MALE STERILIZATION = B PILL = C IUD/"COIL” = D INJECTIONS = E IMPLANT = F MALE CONDOM = G FEMALE CONDOM = H RHYTHM/NATURAL METHODS = I WITHDRAWAL = J NOT HAVING SEX = K LACTATIONAL/AMENORRHEA = L OTHER = X SPECIFY: ____________________ DON’T KNOW = Y REFUSED = Z
MODULE 4: CHILDREN
THE HOUSEHOLD SCHEDULE NOTED THAT [NAME OF PARTICIPANT] WILL FILL OUT THE CHILDREN’S MODULE FOR [NUMBER OF CHILDREN]. I am going to ask you a number of questions about your child/children regarding their health and where they get their health services. We will ask you about these children: LIST OF HOUSEHOLD MEMBERS FOR DISPLAY ONLY, DO NOT SELECT [LIST OF CHILDREN]
401 Now I am going to ask you questions for [NAME]. THE CHILD NAMED [NAME] WAS LISTED WITH LINE NUMBER [INSERT HH LINE NUMBER] IN THE HOUSEHOLD LISTING.
402 How old was [NAME] at his/her last birthday? KEY ‘0’ IF CHILD IS LESS THAN ONE YEAR OLD AT PRESENT.
YEARS ___ DON’T KNOW =-8 REFUSED = -9
>5, DK, REF 403 1-5 402B AGE CANNOT BE GREATER THAN 14 YEARS.
402A How old is [NAME] in months? MONTHS ___
402B You said that [NAME] was [KIDAGEY*]. How many months over [KIDAGEY*] is [NAME]?
MONTHS ___
403 Is [NAME] a boy or girl? BOY = 1 GIRL = 2 DON’T KNOW = -8 REFUSED = -9
404 Is [NAME] enrolled in school? YES = 1 NO, CURRENTLY NOT IN SCHOOL = 2 NO, TOO YOUNG TO BE IN SCHOOL = 3 DON’T KNOW = -8 REFUSED = -9
NO, CURR NOT IN SCHOOL 407 NO, TOO YOUNG, DK, REFUSED 412
NO QUESTIONS CODING CATEGORIES SKIPS
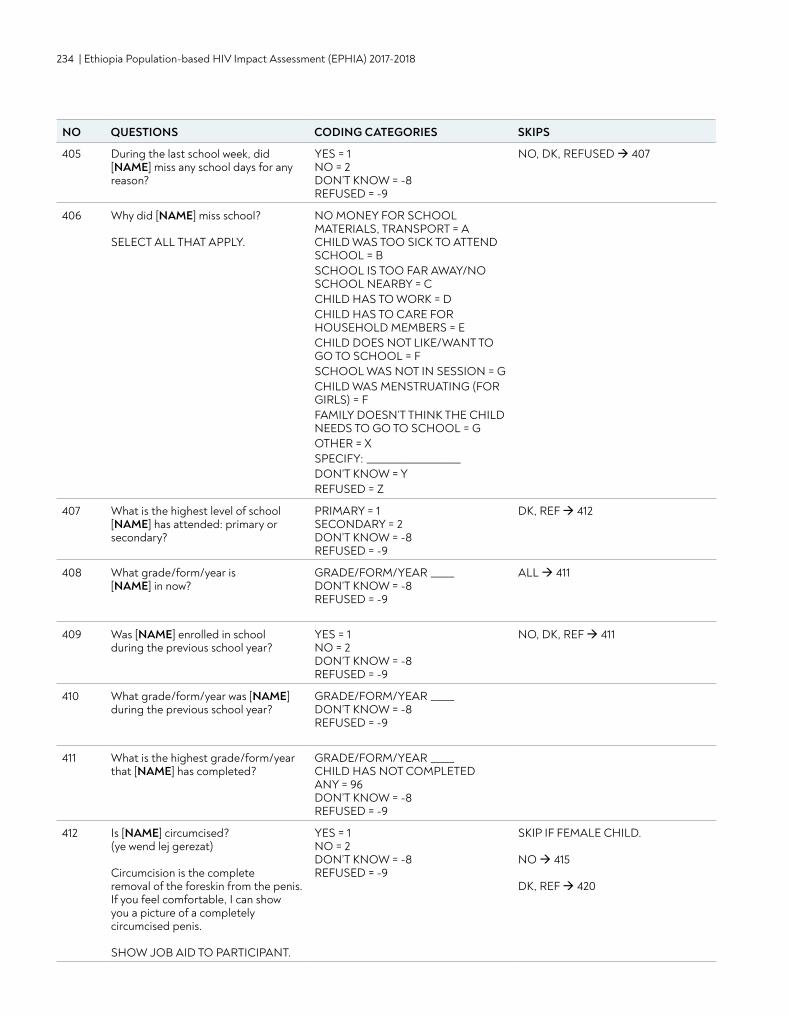
234 | Ethiopia Population-based HIV Impact Assessment (EPHIA) 2017-2018
405 During the last school week, did [NAME] miss any school days for any reason?
YES = 1 NO = 2 DON’T KNOW = -8 REFUSED = -9
NO, DK, REFUSED 407
406 Why did [NAME] miss school? SELECT ALL THAT APPLY.
NO MONEY FOR SCHOOL MATERIALS, TRANSPORT = A CHILD WAS TOO SICK TO ATTEND SCHOOL = B SCHOOL IS TOO FAR AWAY/NO SCHOOL NEARBY = C CHILD HAS TO WORK = DCHILD HAS TO CARE FOR HOUSEHOLD MEMBERS = E CHILD DOES NOT LIKE/WANT TO GO TO SCHOOL = F SCHOOL WAS NOT IN SESSION = G CHILD WAS MENSTRUATING (FOR GIRLS) = F FAMILY DOESN’T THINK THE CHILD NEEDS TO GO TO SCHOOL = G OTHER = X SPECIFY: ____________________ DON’T KNOW = Y REFUSED = Z
407 What is the highest level of school [NAME] has attended: primary or secondary?
PRIMARY = 1 SECONDARY = 2 DON’T KNOW = -8 REFUSED = -9
DK, REF 412
408 What grade/form/year is [NAME] in now?
GRADE/FORM/YEAR _____ DON’T KNOW = -8 REFUSED = -9
ALL 411
409 Was [NAME] enrolled in school during the previous school year?
YES = 1 NO = 2 DON’T KNOW = -8 REFUSED = -9
NO, DK, REF 411
410 What grade/form/year was [NAME] during the previous school year?
GRADE/FORM/YEAR _____ DON’T KNOW = -8 REFUSED = -9
411 What is the highest grade/form/year that [NAME] has completed?
GRADE/FORM/YEAR _____ CHILD HAS NOT COMPLETED ANY = 96 DON’T KNOW = -8 REFUSED = -9
412 Is [NAME] circumcised? (ye wend lej gerezat) Circumcision is the complete removal of the foreskin from the penis. If you feel comfortable, I can show you a picture of a completely circumcised penis. SHOW JOB AID TO PARTICIPANT.
YES = 1 NO = 2 DON’T KNOW = -8 REFUSED = -9
SKIP IF FEMALE CHILD. NO 415 DK, REF 420
NO QUESTIONS CODING CATEGORIES SKIPS
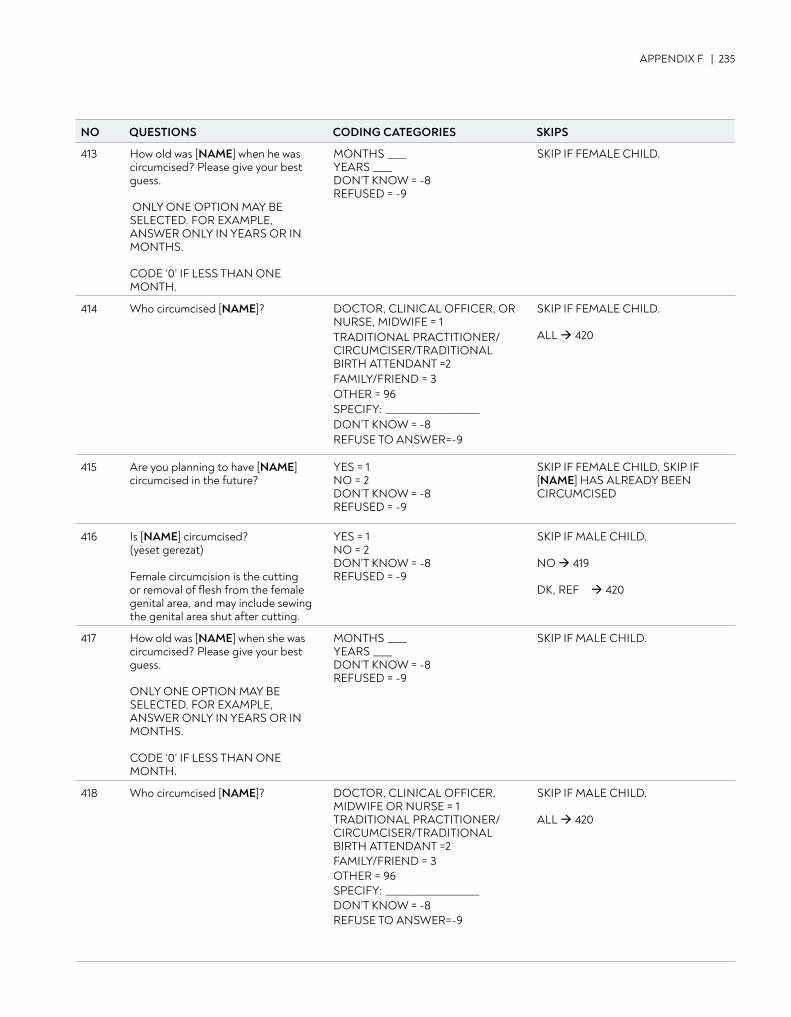
APPENDIX F | 235
413 How old was [NAME] when he was circumcised? Please give your best guess. ONLY ONE OPTION MAY BE SELECTED. FOR EXAMPLE, ANSWER ONLY IN YEARS OR IN MONTHS. CODE ‘0’ IF LESS THAN ONE MONTH.
MONTHS ____ YEARS ____ DON’T KNOW = -8 REFUSED = -9
SKIP IF FEMALE CHILD.
414 Who circumcised [NAME]? DOCTOR, CLINICAL OFFICER, OR NURSE, MIDWIFE = 1 TRADITIONAL PRACTITIONER/ CIRCUMCISER/TRADITIONAL BIRTH ATTENDANT =2 FAMILY/FRIEND = 3 OTHER = 96 SPECIFY: ____________________ DON’T KNOW = -8 REFUSE TO ANSWER=-9
SKIP IF FEMALE CHILD. ALL 420
415 Are you planning to have [NAME] circumcised in the future?
YES = 1 NO = 2 DON’T KNOW = -8 REFUSED = -9
SKIP IF FEMALE CHILD. SKIP IF [NAME] HAS ALREADY BEEN CIRCUMCISED
416 Is [NAME] circumcised? (yeset gerezat) Female circumcision is the cutting or removal of flesh from the female genital area, and may include sewing the genital area shut after cutting.
YES = 1 NO = 2 DON’T KNOW = -8 REFUSED = -9
SKIP IF MALE CHILD. NO 419 DK, REF 420
417 How old was [NAME] when she was circumcised? Please give your best guess. ONLY ONE OPTION MAY BE SELECTED. FOR EXAMPLE, ANSWER ONLY IN YEARS OR IN MONTHS. CODE ‘0’ IF LESS THAN ONE MONTH.
MONTHS ____ YEARS ____ DON’T KNOW = -8 REFUSED = -9
SKIP IF MALE CHILD.
418 Who circumcised [NAME]? DOCTOR, CLINICAL OFFICER, MIDWIFE OR NURSE = 1 TRADITIONAL PRACTITIONER/ CIRCUMCISER/TRADITIONAL BIRTH ATTENDANT =2 FAMILY/FRIEND = 3 OTHER = 96 SPECIFY: ____________________ DON’T KNOW = -8 REFUSE TO ANSWER=-9
SKIP IF MALE CHILD. ALL 420
NO QUESTIONS CODING CATEGORIES SKIPS
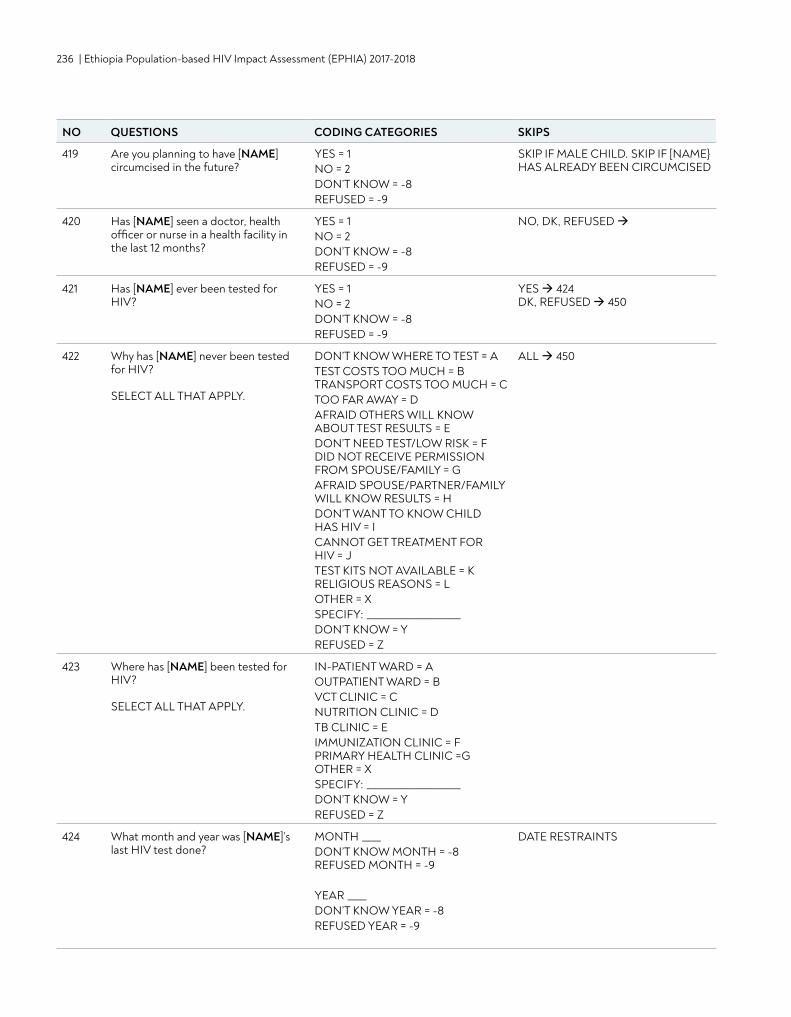
236 | Ethiopia Population-based HIV Impact Assessment (EPHIA) 2017-2018
419 Are you planning to have [NAME] circumcised in the future?
YES = 1 NO = 2 DON’T KNOW = -8 REFUSED = -9
SKIP IF MALE CHILD. SKIP IF [NAME} HAS ALREADY BEEN CIRCUMCISED
420 Has [NAME] seen a doctor, health officer or nurse in a health facility in the last 12 months?
YES = 1 NO = 2 DON’T KNOW = -8 REFUSED = -9
NO, DK, REFUSED
421 Has [NAME] ever been tested for HIV?
YES = 1 NO = 2 DON’T KNOW = -8 REFUSED = -9
YES 424 DK, REFUSED 450
422 Why has [NAME] never been tested for HIV? SELECT ALL THAT APPLY.
DON’T KNOW WHERE TO TEST = A TEST COSTS TOO MUCH = B TRANSPORT COSTS TOO MUCH = C TOO FAR AWAY = D AFRAID OTHERS WILL KNOW ABOUT TEST RESULTS = E DON’T NEED TEST/LOW RISK = F DID NOT RECEIVE PERMISSION FROM SPOUSE/FAMILY = G AFRAID SPOUSE/PARTNER/FAMILY WILL KNOW RESULTS = H DON’T WANT TO KNOW CHILD HAS HIV = I CANNOT GET TREATMENT FOR HIV = J TEST KITS NOT AVAILABLE = K RELIGIOUS REASONS = L OTHER = X SPECIFY: ____________________ DON’T KNOW = Y REFUSED = Z
ALL 450
423 Where has [NAME] been tested for HIV? SELECT ALL THAT APPLY.
IN-PATIENT WARD = A OUTPATIENT WARD = B VCT CLINIC = C NUTRITION CLINIC = D TB CLINIC = E IMMUNIZATION CLINIC = F PRIMARY HEALTH CLINIC =G OTHER = X SPECIFY: ____________________ DON’T KNOW = Y REFUSED = Z
424 What month and year was [NAME]’s last HIV test done?
MONTH ____ DON’T KNOW MONTH = -8 REFUSED MONTH = -9 YEAR ____ DON’T KNOW YEAR = -8 REFUSED YEAR = -9
DATE RESTRAINTS
NO QUESTIONS CODING CATEGORIES SKIPS
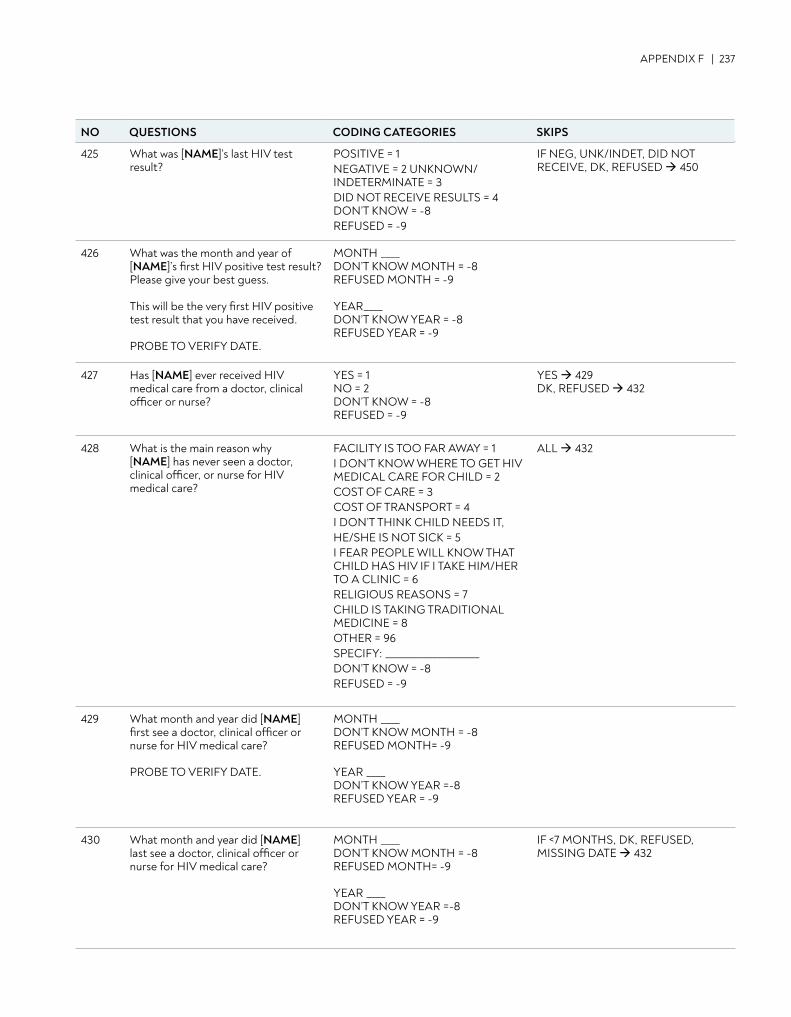
APPENDIX F | 237
425 What was [NAME]’s last HIV test result?
POSITIVE = 1 NEGATIVE = 2 UNKNOWN/INDETERMINATE = 3 DID NOT RECEIVE RESULTS = 4 DON’T KNOW = -8 REFUSED = -9
IF NEG, UNK/INDET, DID NOT RECEIVE, DK, REFUSED 450
426 What was the month and year of [NAME]’s first HIV positive test result? Please give your best guess. This will be the very first HIV positive test result that you have received.
PROBE TO VERIFY DATE.
MONTH ____DON’T KNOW MONTH = -8 REFUSED MONTH = -9 YEAR____DON’T KNOW YEAR = -8 REFUSED YEAR = -9
427 Has [NAME] ever received HIV medical care from a doctor, clinical officer or nurse?
YES = 1 NO = 2 DON’T KNOW = -8 REFUSED = -9
YES 429 DK, REFUSED 432
428 What is the main reason why [NAME] has never seen a doctor, clinical officer, or nurse for HIV medical care?
FACILITY IS TOO FAR AWAY = 1 I DON’T KNOW WHERE TO GET HIV MEDICAL CARE FOR CHILD = 2 COST OF CARE = 3 COST OF TRANSPORT = 4 I DON’T THINK CHILD NEEDS IT,HE/SHE IS NOT SICK = 5 I FEAR PEOPLE WILL KNOW THAT CHILD HAS HIV IF I TAKE HIM/HER TO A CLINIC = 6 RELIGIOUS REASONS = 7 CHILD IS TAKING TRADITIONAL MEDICINE = 8 OTHER = 96 SPECIFY: ____________________ DON’T KNOW = -8 REFUSED = -9
ALL 432
429 What month and year did [NAME] first see a doctor, clinical officer or nurse for HIV medical care? PROBE TO VERIFY DATE.
MONTH ____ DON’T KNOW MONTH = -8 REFUSED MONTH= -9 YEAR ____ DON’T KNOW YEAR =-8 REFUSED YEAR = -9
430 What month and year did [NAME] last see a doctor, clinical officer or nurse for HIV medical care?
MONTH ____DON’T KNOW MONTH = -8 REFUSED MONTH= -9 YEAR ____ DON’T KNOW YEAR =-8 REFUSED YEAR = -9
IF <7 MONTHS, DK, REFUSED, MISSING DATE 432
NO QUESTIONS CODING CATEGORIES SKIPS
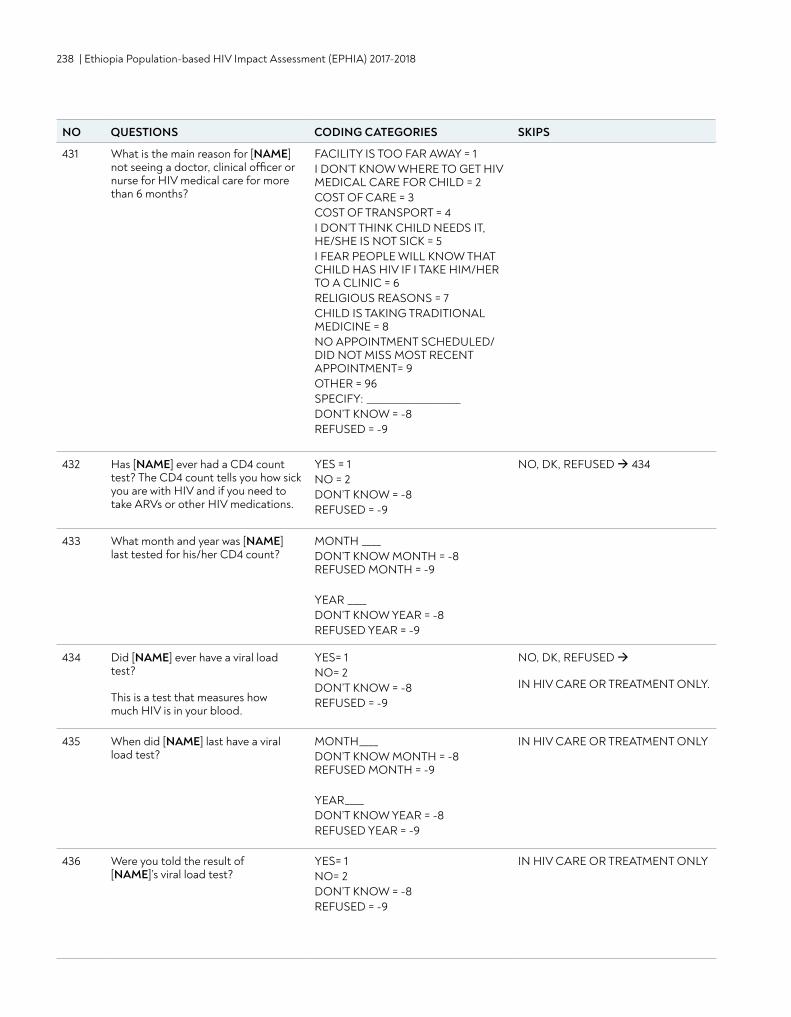
238 | Ethiopia Population-based HIV Impact Assessment (EPHIA) 2017-2018
431 What is the main reason for [NAME] not seeing a doctor, clinical officer or nurse for HIV medical care for more than 6 months?
FACILITY IS TOO FAR AWAY = 1 I DON’T KNOW WHERE TO GET HIV MEDICAL CARE FOR CHILD = 2 COST OF CARE = 3 COST OF TRANSPORT = 4 I DON’T THINK CHILD NEEDS IT, HE/SHE IS NOT SICK = 5 I FEAR PEOPLE WILL KNOW THAT CHILD HAS HIV IF I TAKE HIM/HER TO A CLINIC = 6 RELIGIOUS REASONS = 7 CHILD IS TAKING TRADITIONAL MEDICINE = 8 NO APPOINTMENT SCHEDULED/DID NOT MISS MOST RECENT APPOINTMENT= 9 OTHER = 96 SPECIFY: ____________________ DON’T KNOW = -8 REFUSED = -9
432 Has [NAME] ever had a CD4 count test? The CD4 count tells you how sick you are with HIV and if you need to take ARVs or other HIV medications.
YES = 1 NO = 2 DON’T KNOW = -8 REFUSED = -9
NO, DK, REFUSED 434
433 What month and year was [NAME] last tested for his/her CD4 count?
MONTH ____ DON’T KNOW MONTH = -8 REFUSED MONTH = -9 YEAR ____ DON’T KNOW YEAR = -8 REFUSED YEAR = -9
434 Did [NAME] ever have a viral load test? This is a test that measures how much HIV is in your blood.
YES= 1 NO= 2 DON’T KNOW = -8 REFUSED = -9
NO, DK, REFUSED IN HIV CARE OR TREATMENT ONLY.
435 When did [NAME] last have a viral load test?
MONTH____ DON’T KNOW MONTH = -8 REFUSED MONTH = -9 YEAR____DON’T KNOW YEAR = -8 REFUSED YEAR = -9
IN HIV CARE OR TREATMENT ONLY
436 Were you told the result of [NAME]’s viral load test?
YES= 1 NO= 2 DON’T KNOW = -8 REFUSED = -9
IN HIV CARE OR TREATMENT ONLY
NO QUESTIONS CODING CATEGORIES SKIPS
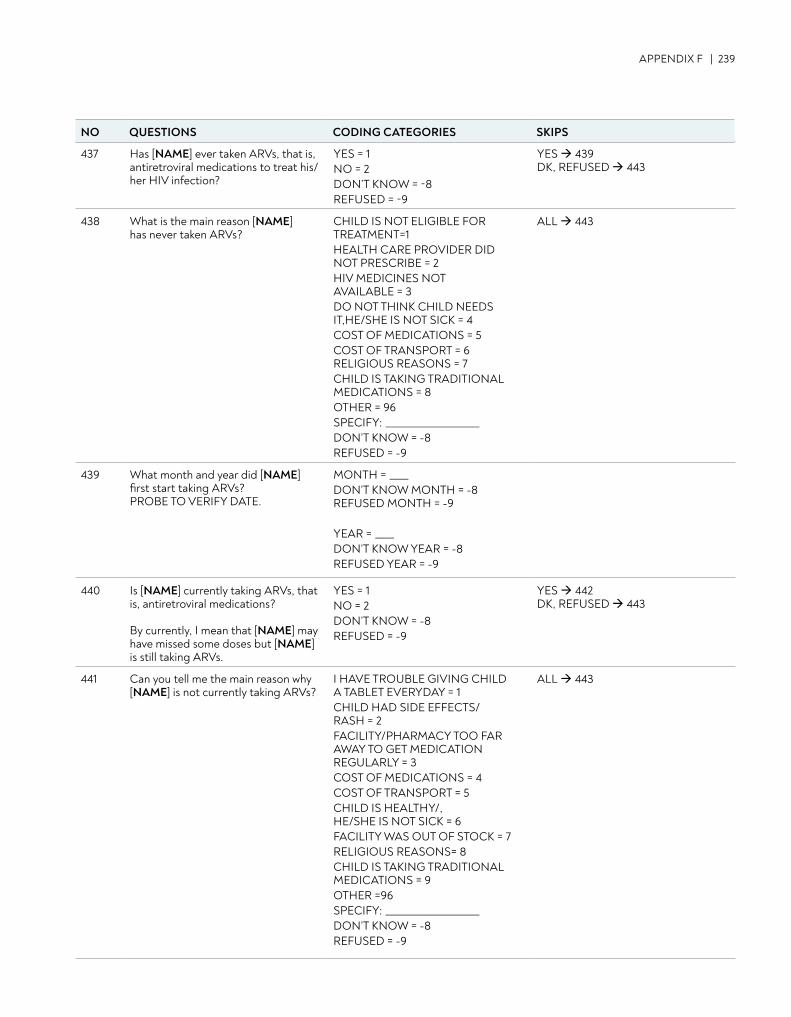
APPENDIX F | 239
437 Has [NAME] ever taken ARVs, that is, antiretroviral medications to treat his/her HIV infection?
YES = 1 NO = 2 DON’T KNOW = -8 REFUSED = -9
YES 439 DK, REFUSED 443
438 What is the main reason [NAME] has never taken ARVs?
CHILD IS NOT ELIGIBLE FOR TREATMENT=1 HEALTH CARE PROVIDER DID NOT PRESCRIBE = 2 HIV MEDICINES NOT AVAILABLE = 3 DO NOT THINK CHILD NEEDS IT,HE/SHE IS NOT SICK = 4 COST OF MEDICATIONS = 5 COST OF TRANSPORT = 6 RELIGIOUS REASONS = 7 CHILD IS TAKING TRADITIONAL MEDICATIONS = 8 OTHER = 96 SPECIFY: ____________________ DON’T KNOW = -8 REFUSED = -9
ALL 443
439 What month and year did [NAME] first start taking ARVs? PROBE TO VERIFY DATE.
MONTH = ____DON’T KNOW MONTH = -8 REFUSED MONTH = -9 YEAR = ____ DON’T KNOW YEAR = -8 REFUSED YEAR = -9
440 Is [NAME] currently taking ARVs, that is, antiretroviral medications? By currently, I mean that [NAME] may have missed some doses but [NAME] is still taking ARVs.
YES = 1 NO = 2 DON’T KNOW = -8 REFUSED = -9
YES 442DK, REFUSED 443
441 Can you tell me the main reason why [NAME] is not currently taking ARVs?
I HAVE TROUBLE GIVING CHILD A TABLET EVERYDAY = 1 CHILD HAD SIDE EFFECTS/ RASH = 2 FACILITY/PHARMACY TOO FAR AWAY TO GET MEDICATION REGULARLY = 3 COST OF MEDICATIONS = 4 COST OF TRANSPORT = 5 CHILD IS HEALTHY/, HE/SHE IS NOT SICK = 6 FACILITY WAS OUT OF STOCK = 7 RELIGIOUS REASONS= 8 CHILD IS TAKING TRADITIONAL MEDICATIONS = 9 OTHER =96 SPECIFY: ____________________ DON’T KNOW = -8 REFUSED = -9
ALL 443
NO QUESTIONS CODING CATEGORIES SKIPS
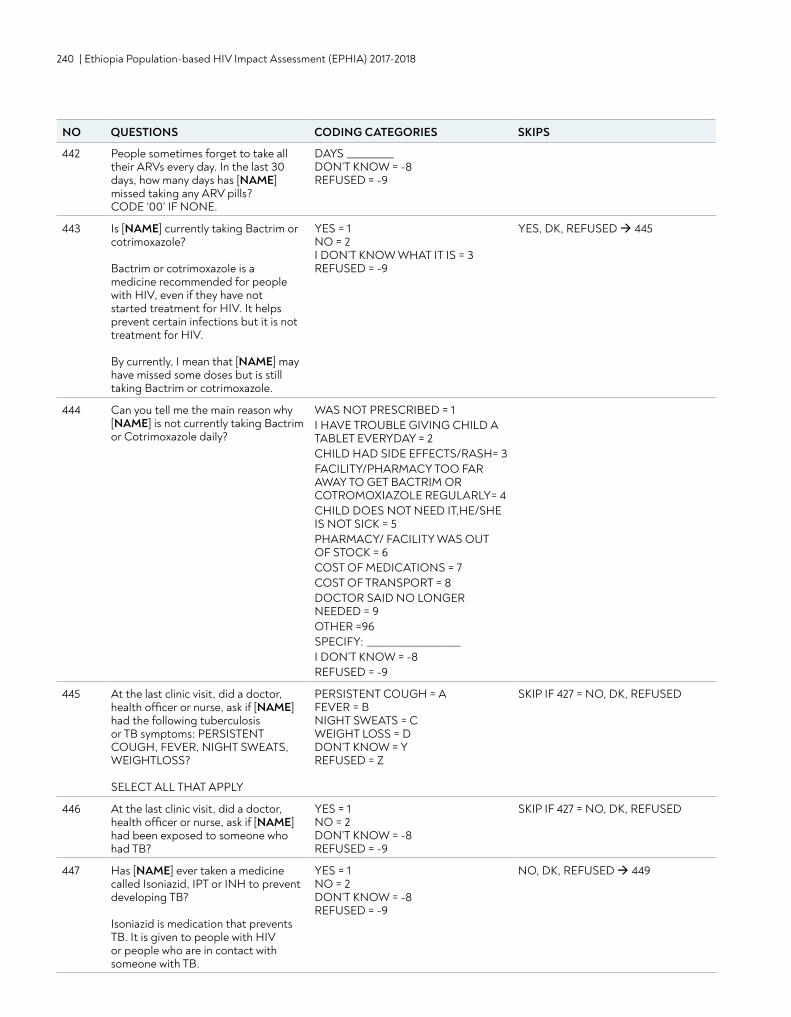
240 | Ethiopia Population-based HIV Impact Assessment (EPHIA) 2017-2018
442 People sometimes forget to take all their ARVs every day. In the last 30 days, how many days has [NAME] missed taking any ARV pills? CODE ‘00’ IF NONE.
DAYS __________ DON’T KNOW = -8 REFUSED = -9
443 Is [NAME] currently taking Bactrim or cotrimoxazole?
Bactrim or cotrimoxazole is a medicine recommended for people with HIV, even if they have not started treatment for HIV. It helps prevent certain infections but it is not treatment for HIV. By currently, I mean that [NAME] may have missed some doses but is still taking Bactrim or cotrimoxazole.
YES = 1 NO = 2 I DON’T KNOW WHAT IT IS = 3 REFUSED = -9
YES, DK, REFUSED 445
444 Can you tell me the main reason why [NAME] is not currently taking Bactrim or Cotrimoxazole daily?
WAS NOT PRESCRIBED = 1 I HAVE TROUBLE GIVING CHILD A TABLET EVERYDAY = 2 CHILD HAD SIDE EFFECTS/RASH= 3 FACILITY/PHARMACY TOO FAR AWAY TO GET BACTRIM OR COTROMOXIAZOLE REGULARLY= 4 CHILD DOES NOT NEED IT,HE/SHE IS NOT SICK = 5 PHARMACY/ FACILITY WAS OUT OF STOCK = 6 COST OF MEDICATIONS = 7 COST OF TRANSPORT = 8 DOCTOR SAID NO LONGER NEEDED = 9 OTHER =96 SPECIFY: ____________________ I DON’T KNOW = -8 REFUSED = -9
445 At the last clinic visit, did a doctor, health officer or nurse, ask if [NAME] had the following tuberculosis or TB symptoms: PERSISTENT COUGH, FEVER, NIGHT SWEATS, WEIGHTLOSS? SELECT ALL THAT APPLY
PERSISTENT COUGH = A FEVER = B NIGHT SWEATS = C WEIGHT LOSS = D DON’T KNOW = Y REFUSED = Z
SKIP IF 427 = NO, DK, REFUSED
446 At the last clinic visit, did a doctor, health officer or nurse, ask if [NAME] had been exposed to someone who had TB?
YES = 1 NO = 2 DON’T KNOW = -8 REFUSED = -9
SKIP IF 427 = NO, DK, REFUSED
447 Has [NAME] ever taken a medicine called Isoniazid, IPT or INH to prevent developing TB? Isoniazid is medication that prevents TB. It is given to people with HIV or people who are in contact with someone with TB.
YES = 1 NO = 2 DON’T KNOW = -8 REFUSED = -9
NO, DK, REFUSED 449
NO QUESTIONS CODING CATEGORIES SKIPS
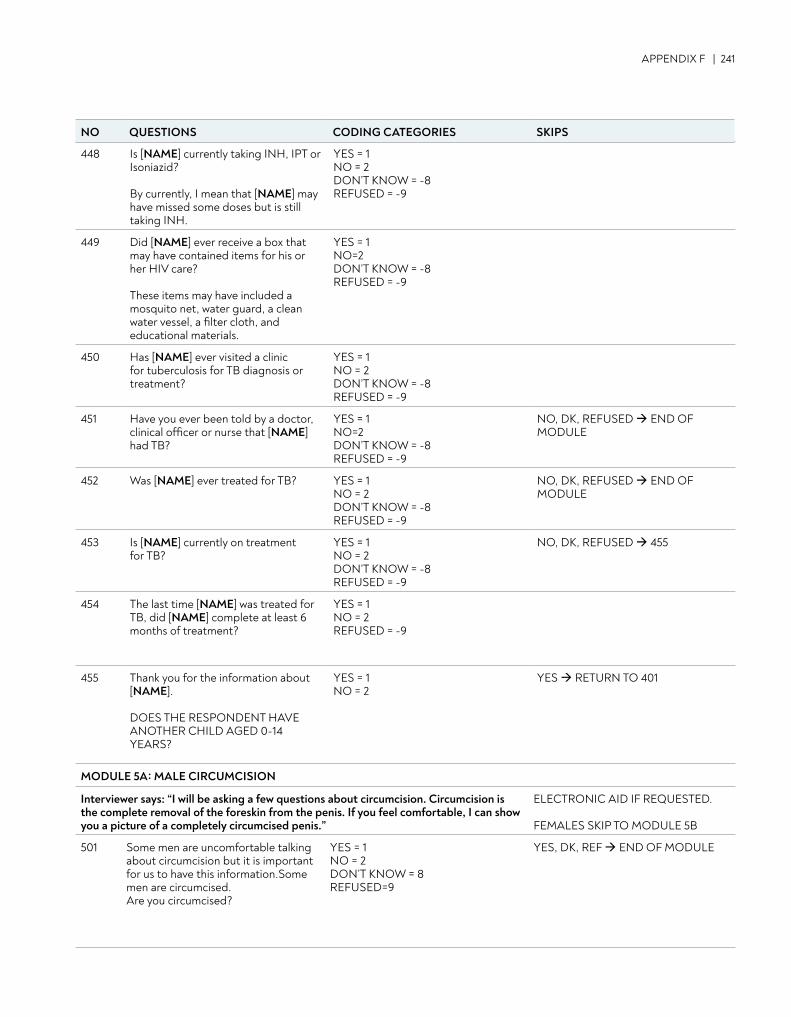
APPENDIX F | 241
448 Is [NAME] currently taking INH, IPT or Isoniazid? By currently, I mean that [NAME] may have missed some doses but is still taking INH.
YES = 1 NO = 2 DON’T KNOW = -8 REFUSED = -9
449 Did [NAME] ever receive a box that may have contained items for his or her HIV care? These items may have included a mosquito net, water guard, a clean water vessel, a filter cloth, and educational materials.
YES = 1 NO=2 DON’T KNOW = -8 REFUSED = -9
450 Has [NAME] ever visited a clinic for tuberculosis for TB diagnosis or treatment?
YES = 1 NO = 2 DON’T KNOW = -8 REFUSED = -9
451 Have you ever been told by a doctor, clinical officer or nurse that [NAME] had TB?
YES = 1 NO=2 DON’T KNOW = -8 REFUSED = -9
NO, DK, REFUSED END OF MODULE
452 Was [NAME] ever treated for TB? YES = 1 NO = 2 DON’T KNOW = -8 REFUSED = -9
NO, DK, REFUSED END OF MODULE
453 Is [NAME] currently on treatment for TB?
YES = 1 NO = 2 DON’T KNOW = -8 REFUSED = -9
NO, DK, REFUSED 455
454 The last time [NAME] was treated for TB, did [NAME] complete at least 6 months of treatment?
YES = 1 NO = 2 REFUSED = -9
455 Thank you for the information about [NAME]. DOES THE RESPONDENT HAVE ANOTHER CHILD AGED 0-14 YEARS?
YES = 1 NO = 2
YES RETURN TO 401
MODULE 5A: MALE CIRCUMCISION
Interviewer says: “I will be asking a few questions about circumcision. Circumcision is the complete removal of the foreskin from the penis. If you feel comfortable, I can show you a picture of a completely circumcised penis.”
ELECTRONIC AID IF REQUESTED. FEMALES SKIP TO MODULE 5B
501 Some men are uncomfortable talking about circumcision but it is important for us to have this information.Some men are circumcised. Are you circumcised?
YES = 1 NO = 2 DON’T KNOW = 8 REFUSED=9
YES, DK, REF END OF MODULE
NO QUESTIONS CODING CATEGORIES SKIPS
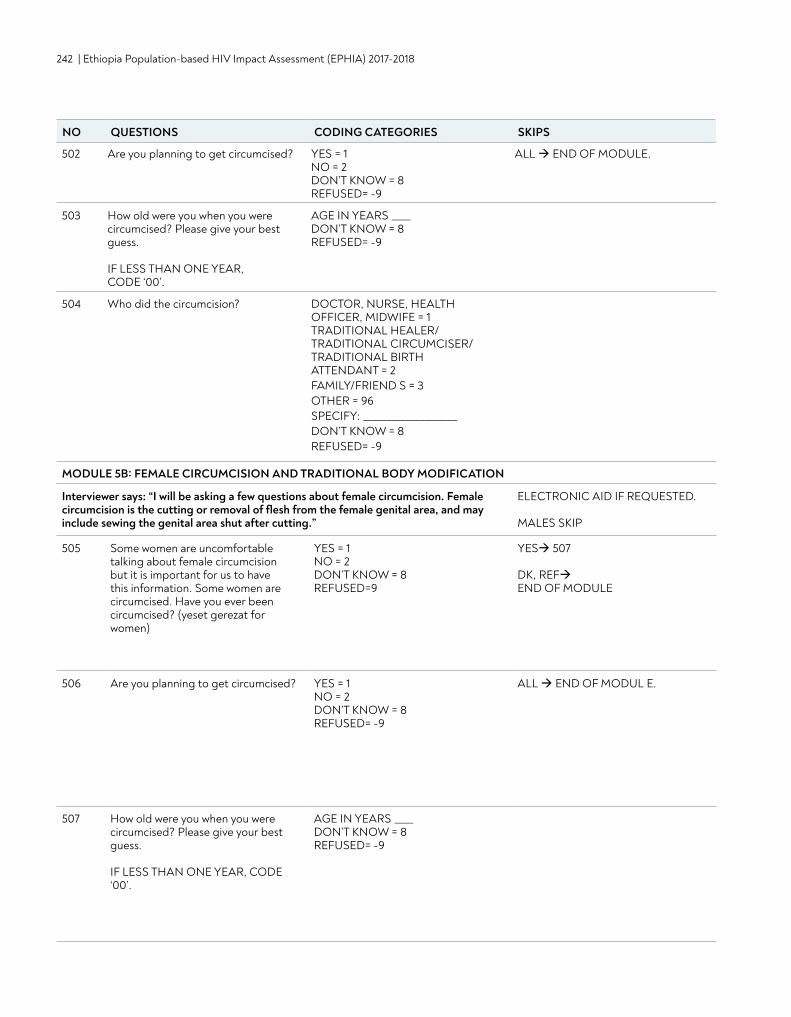
242 | Ethiopia Population-based HIV Impact Assessment (EPHIA) 2017-2018
502 Are you planning to get circumcised? YES = 1 NO = 2 DON’T KNOW = 8 REFUSED= -9
ALL END OF MODULE.
503 How old were you when you were circumcised? Please give your best guess. IF LESS THAN ONE YEAR, CODE ‘00’.
AGE IN YEARS ____ DON’T KNOW = 8 REFUSED= -9
504 Who did the circumcision? DOCTOR, NURSE, HEALTH OFFICER, MIDWIFE = 1 TRADITIONAL HEALER/ TRADITIONAL CIRCUMCISER/ TRADITIONAL BIRTH ATTENDANT = 2 FAMILY/FRIEND S = 3 OTHER = 96 SPECIFY: ____________________ DON’T KNOW = 8 REFUSED= -9
MODULE 5B: FEMALE CIRCUMCISION AND TRADITIONAL BODY MODIFICATION
Interviewer says: “I will be asking a few questions about female circumcision. Female circumcision is the cutting or removal of flesh from the female genital area, and may include sewing the genital area shut after cutting.”
ELECTRONIC AID IF REQUESTED. MALES SKIP
505 Some women are uncomfortable talking about female circumcision but it is important for us to have this information. Some women are circumcised. Have you ever been circumcised? (yeset gerezat for women)
YES = 1 NO = 2 DON’T KNOW = 8 REFUSED=9
YES 507 DK, REF END OF MODULE
506 Are you planning to get circumcised? YES = 1 NO = 2 DON’T KNOW = 8 REFUSED= -9
ALL END OF MODUL E.
507 How old were you when you were circumcised? Please give your best guess. IF LESS THAN ONE YEAR, CODE ‘00’.
AGE IN YEARS ____ DON’T KNOW = 8 REFUSED= -9
NO QUESTIONS CODING CATEGORIES SKIPS
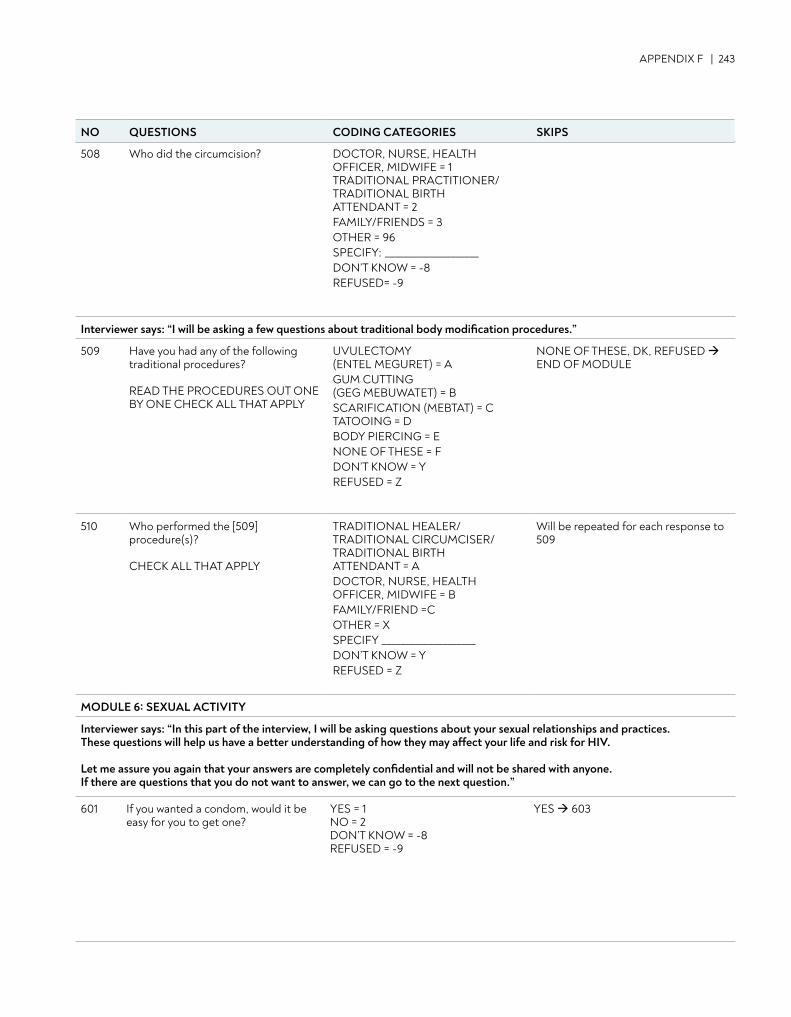
APPENDIX F | 243
508 Who did the circumcision? DOCTOR, NURSE, HEALTH OFFICER, MIDWIFE = 1 TRADITIONAL PRACTITIONER/ TRADITIONAL BIRTH ATTENDANT = 2 FAMILY/FRIENDS = 3 OTHER = 96 SPECIFY: ____________________ DON’T KNOW = -8 REFUSED= -9
Interviewer says: “I will be asking a few questions about traditional body modification procedures.”
509 Have you had any of the following traditional procedures?
READ THE PROCEDURES OUT ONE BY ONE CHECK ALL THAT APPLY
UVULECTOMY (ENTEL MEGURET) = A GUM CUTTING (GEG MEBUWATET) = B SCARIFICATION (MEBTAT) = C TATOOING = D BODY PIERCING = E NONE OF THESE = F DON’T KNOW = Y REFUSED = Z
NONE OF THESE, DK, REFUSED END OF MODULE
510 Who performed the [509] procedure(s)? CHECK ALL THAT APPLY
TRADITIONAL HEALER/ TRADITIONAL CIRCUMCISER/ TRADITIONAL BIRTH ATTENDANT = A DOCTOR, NURSE, HEALTH OFFICER, MIDWIFE = B FAMILY/FRIEND =C OTHER = X SPECIFY ____________________ DON’T KNOW = Y REFUSED = Z
Will be repeated for each response to 509
MODULE 6: SEXUAL ACTIVITY
Interviewer says: “In this part of the interview, I will be asking questions about your sexual relationships and practices. These questions will help us have a better understanding of how they may affect your life and risk for HIV.
Let me assure you again that your answers are completely confidential and will not be shared with anyone. If there are questions that you do not want to answer, we can go to the next question.”
601 If you wanted a condom, would it be easy for you to get one?
YES = 1 NO = 2 DON’T KNOW = -8 REFUSED = -9
YES 603
NO QUESTIONS CODING CATEGORIES SKIPS
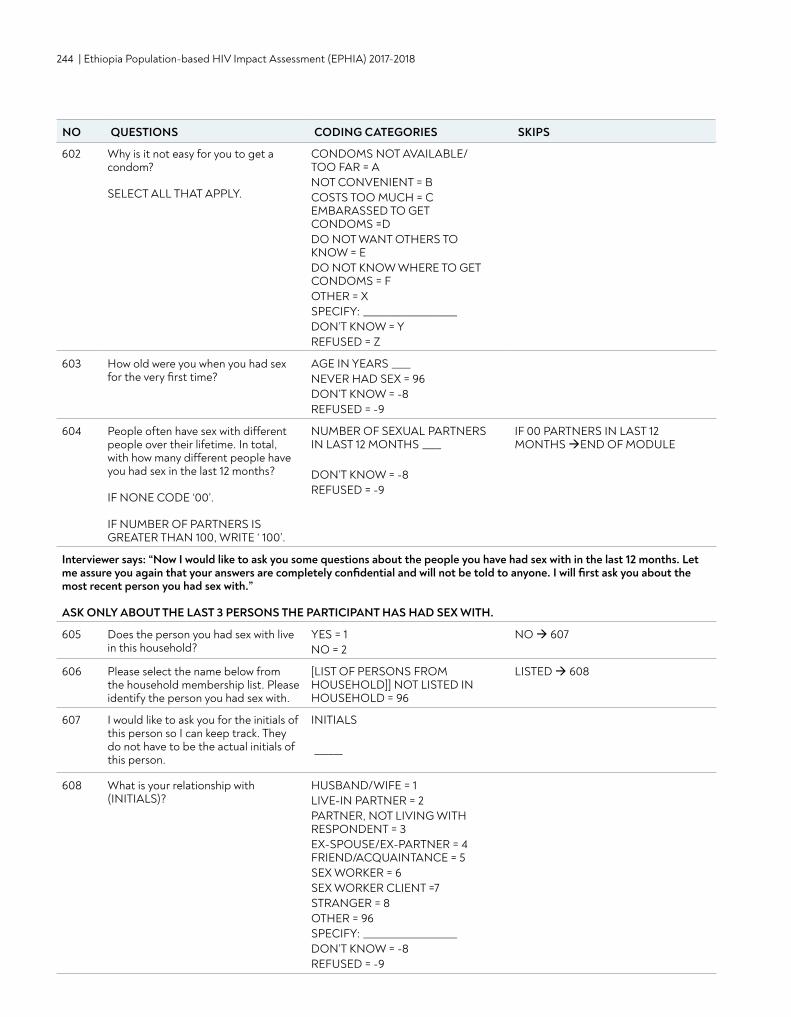
244 | Ethiopia Population-based HIV Impact Assessment (EPHIA) 2017-2018
602 Why is it not easy for you to get a condom? SELECT ALL THAT APPLY.
CONDOMS NOT AVAILABLE/ TOO FAR = A NOT CONVENIENT = B COSTS TOO MUCH = C EMBARASSED TO GET CONDOMS =D DO NOT WANT OTHERS TO KNOW = E DO NOT KNOW WHERE TO GET CONDOMS = F OTHER = X SPECIFY: ____________________ DON’T KNOW = Y REFUSED = Z
603 How old were you when you had sex for the very first time?
AGE IN YEARS ____ NEVER HAD SEX = 96 DON’T KNOW = -8 REFUSED = -9
604 People often have sex with different people over their lifetime. In total, with how many different people have you had sex in the last 12 months? IF NONE CODE ‘00’. IF NUMBER OF PARTNERS IS GREATER THAN 100, WRITE ‘ 100’.
NUMBER OF SEXUAL PARTNERS IN LAST 12 MONTHS ____ DON’T KNOW = -8 REFUSED = -9
IF 00 PARTNERS IN LAST 12 MONTHS END OF MODULE
Interviewer says: “Now I would like to ask you some questions about the people you have had sex with in the last 12 months. Let me assure you again that your answers are completely confidential and will not be told to anyone. I will first ask you about the most recent person you had sex with.” ASK ONLY ABOUT THE LAST 3 PERSONS THE PARTICIPANT HAS HAD SEX WITH.
605 Does the person you had sex with live in this household?
YES = 1 NO = 2
NO 607
606 Please select the name below from the household membership list. Please identify the person you had sex with.
[LIST OF PERSONS FROM HOUSEHOLD]] NOT LISTED IN HOUSEHOLD = 96
LISTED 608
607 I would like to ask you for the initials of this person so I can keep track. They do not have to be the actual initials of this person.
INITIALS ______
608 What is your relationship with (INITIALS)?
HUSBAND/WIFE = 1 LIVE-IN PARTNER = 2 PARTNER, NOT LIVING WITH RESPONDENT = 3 EX-SPOUSE/EX-PARTNER = 4 FRIEND/ACQUAINTANCE = 5 SEX WORKER = 6 SEX WORKER CLIENT =7 STRANGER = 8 OTHER = 96 SPECIFY: ____________________ DON’T KNOW = -8 REFUSED = -9
NO QUESTIONS CODING CATEGORIES SKIPS
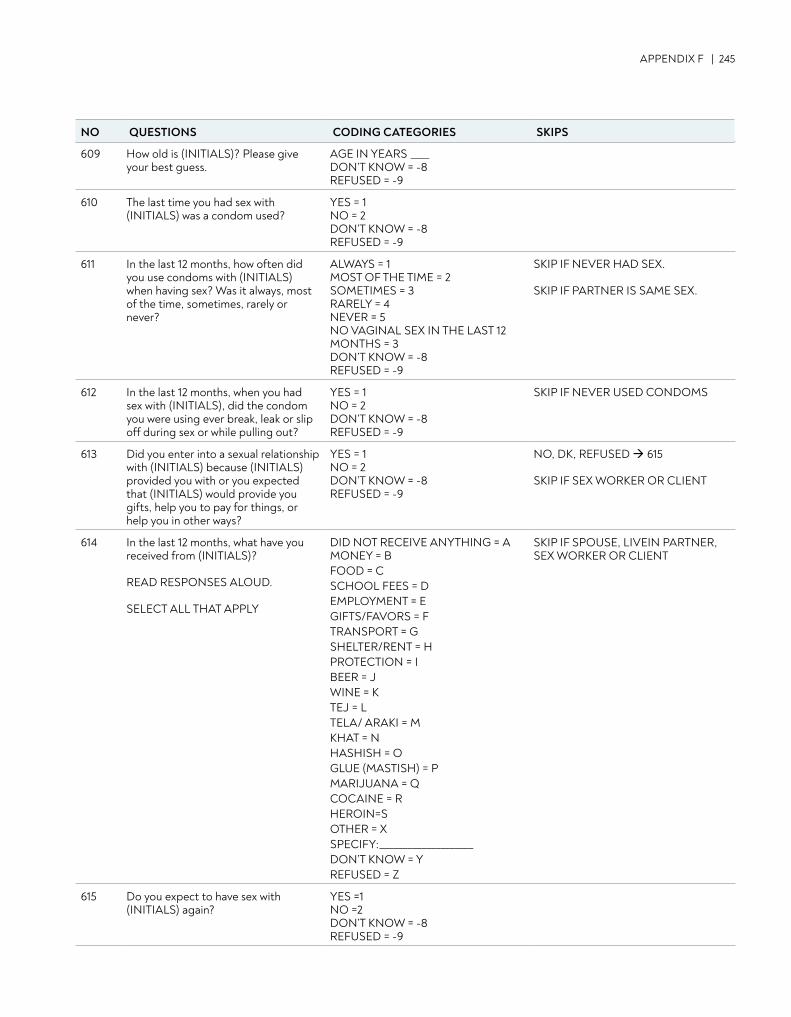
APPENDIX F | 245
609 How old is (INITIALS)? Please give your best guess.
AGE IN YEARS ____ DON’T KNOW = -8 REFUSED = -9
610 The last time you had sex with (INITIALS) was a condom used?
YES = 1 NO = 2 DON’T KNOW = -8 REFUSED = -9
611 In the last 12 months, how often did you use condoms with (INITIALS) when having sex? Was it always, most of the time, sometimes, rarely or never?
ALWAYS = 1 MOST OF THE TIME = 2 SOMETIMES = 3 RARELY = 4 NEVER = 5 NO VAGINAL SEX IN THE LAST 12 MONTHS = 3 DON’T KNOW = -8 REFUSED = -9
SKIP IF NEVER HAD SEX. SKIP IF PARTNER IS SAME SEX.
612 In the last 12 months, when you had sex with (INITIALS), did the condom you were using ever break, leak or slip off during sex or while pulling out?
YES = 1 NO = 2 DON’T KNOW = -8 REFUSED = -9
SKIP IF NEVER USED CONDOMS
613 Did you enter into a sexual relationship with (INITIALS) because (INITIALS) provided you with or you expected that (INITIALS) would provide you gifts, help you to pay for things, or help you in other ways?
YES = 1 NO = 2 DON’T KNOW = -8 REFUSED = -9
NO, DK, REFUSED 615 SKIP IF SEX WORKER OR CLIENT
614 In the last 12 months, what have you received from (INITIALS)? READ RESPONSES ALOUD. SELECT ALL THAT APPLY
DID NOT RECEIVE ANYTHING = A MONEY = B FOOD = C SCHOOL FEES = D EMPLOYMENT = E GIFTS/FAVORS = F TRANSPORT = G SHELTER/RENT = H PROTECTION = I BEER = J WINE = K TEJ = L TELA/ ARAKI = M KHAT = N HASHISH = O GLUE (MASTISH) = P MARIJUANA = Q COCAINE = R HEROIN=S OTHER = X SPECIFY:____________________ DON’T KNOW = Y REFUSED = Z
SKIP IF SPOUSE, LIVEIN PARTNER, SEX WORKER OR CLIENT
615 Do you expect to have sex with (INITIALS) again?
YES =1 NO =2 DON’T KNOW = -8 REFUSED = -9
NO QUESTIONS CODING CATEGORIES SKIPS
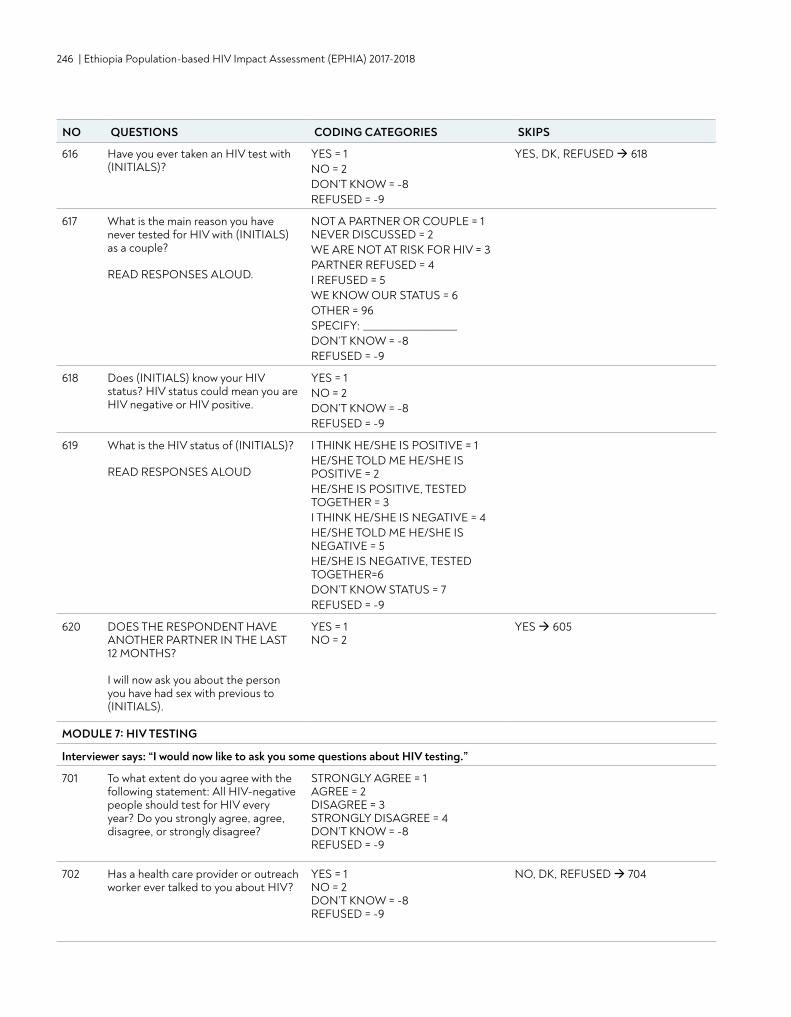
246 | Ethiopia Population-based HIV Impact Assessment (EPHIA) 2017-2018
616 Have you ever taken an HIV test with (INITIALS)?
YES = 1 NO = 2 DON’T KNOW = -8 REFUSED = -9
YES, DK, REFUSED 618
617 What is the main reason you have never tested for HIV with (INITIALS) as a couple? READ RESPONSES ALOUD.
NOT A PARTNER OR COUPLE = 1 NEVER DISCUSSED = 2 WE ARE NOT AT RISK FOR HIV = 3 PARTNER REFUSED = 4 I REFUSED = 5 WE KNOW OUR STATUS = 6 OTHER = 96 SPECIFY: ____________________ DON’T KNOW = -8 REFUSED = -9
618 Does (INITIALS) know your HIV status? HIV status could mean you are HIV negative or HIV positive.
YES = 1 NO = 2 DON’T KNOW = -8 REFUSED = -9
619 What is the HIV status of (INITIALS)? READ RESPONSES ALOUD
I THINK HE/SHE IS POSITIVE = 1 HE/SHE TOLD ME HE/SHE IS POSITIVE = 2 HE/SHE IS POSITIVE, TESTED TOGETHER = 3 I THINK HE/SHE IS NEGATIVE = 4HE/SHE TOLD ME HE/SHE IS NEGATIVE = 5 HE/SHE IS NEGATIVE, TESTED TOGETHER=6 DON’T KNOW STATUS = 7 REFUSED = -9
620 DOES THE RESPONDENT HAVE ANOTHER PARTNER IN THE LAST 12 MONTHS? I will now ask you about the person you have had sex with previous to (INITIALS).
YES = 1 NO = 2
YES 605
MODULE 7: HIV TESTING
Interviewer says: “I would now like to ask you some questions about HIV testing.”
701 To what extent do you agree with the following statement: All HIV-negative people should test for HIV every year? Do you strongly agree, agree, disagree, or strongly disagree?
STRONGLY AGREE = 1 AGREE = 2 DISAGREE = 3 STRONGLY DISAGREE = 4 DON’T KNOW = -8 REFUSED = -9
702 Has a health care provider or outreach worker ever talked to you about HIV?
YES = 1 NO = 2 DON’T KNOW = -8 REFUSED = -9
NO, DK, REFUSED 704
NO QUESTIONS CODING CATEGORIES SKIPS
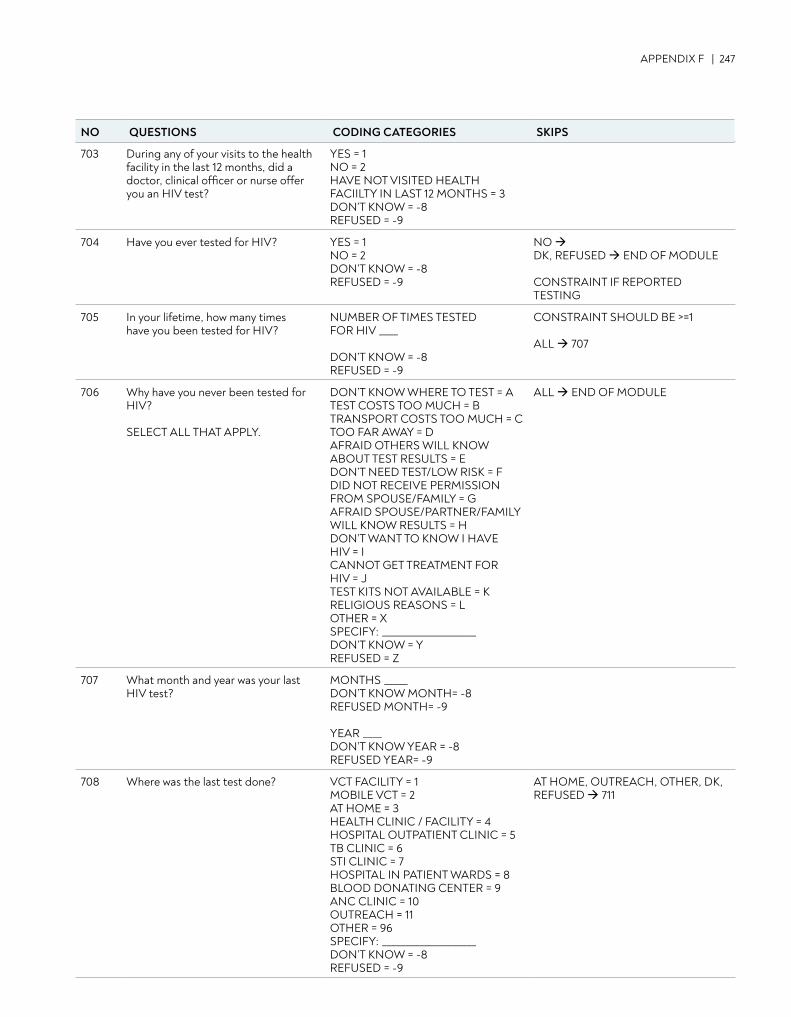
APPENDIX F | 247
703 During any of your visits to the health facility in the last 12 months, did a doctor, clinical officer or nurse offer you an HIV test?
YES = 1 NO = 2 HAVE NOT VISITED HEALTH FACIILTY IN LAST 12 MONTHS = 3 DON’T KNOW = -8 REFUSED = -9
704 Have you ever tested for HIV? YES = 1 NO = 2 DON’T KNOW = -8 REFUSED = -9
NO DK, REFUSED END OF MODULE CONSTRAINT IF REPORTED TESTING
705 In your lifetime, how many times have you been tested for HIV?
NUMBER OF TIMES TESTED FOR HIV ____ DON’T KNOW = -8 REFUSED = -9
CONSTRAINT SHOULD BE >=1 ALL 707
706 Why have you never been tested for HIV? SELECT ALL THAT APPLY.
DON’T KNOW WHERE TO TEST = A TEST COSTS TOO MUCH = B TRANSPORT COSTS TOO MUCH = C TOO FAR AWAY = D AFRAID OTHERS WILL KNOW ABOUT TEST RESULTS = EDON’T NEED TEST/LOW RISK = F DID NOT RECEIVE PERMISSION FROM SPOUSE/FAMILY = G AFRAID SPOUSE/PARTNER/FAMILY WILL KNOW RESULTS = H DON’T WANT TO KNOW I HAVE HIV = I CANNOT GET TREATMENT FOR HIV = J TEST KITS NOT AVAILABLE = K RELIGIOUS REASONS = L OTHER = X SPECIFY: ____________________ DON’T KNOW = Y REFUSED = Z
ALL END OF MODULE
707 What month and year was your last HIV test?
MONTHS _____ DON’T KNOW MONTH= -8 REFUSED MONTH= -9 YEAR ____ DON’T KNOW YEAR = -8 REFUSED YEAR= -9
708 Where was the last test done? VCT FACILITY = 1 MOBILE VCT = 2 AT HOME = 3 HEALTH CLINIC / FACILITY = 4 HOSPITAL OUTPATIENT CLINIC = 5 TB CLINIC = 6 STI CLINIC = 7 HOSPITAL IN PATIENT WARDS = 8 BLOOD DONATING CENTER = 9 ANC CLINIC = 10 OUTREACH = 11 OTHER = 96 SPECIFY: ____________________ DON’T KNOW = -8REFUSED = -9
AT HOME, OUTREACH, OTHER, DK, REFUSED 711
NO QUESTIONS CODING CATEGORIES SKIPS
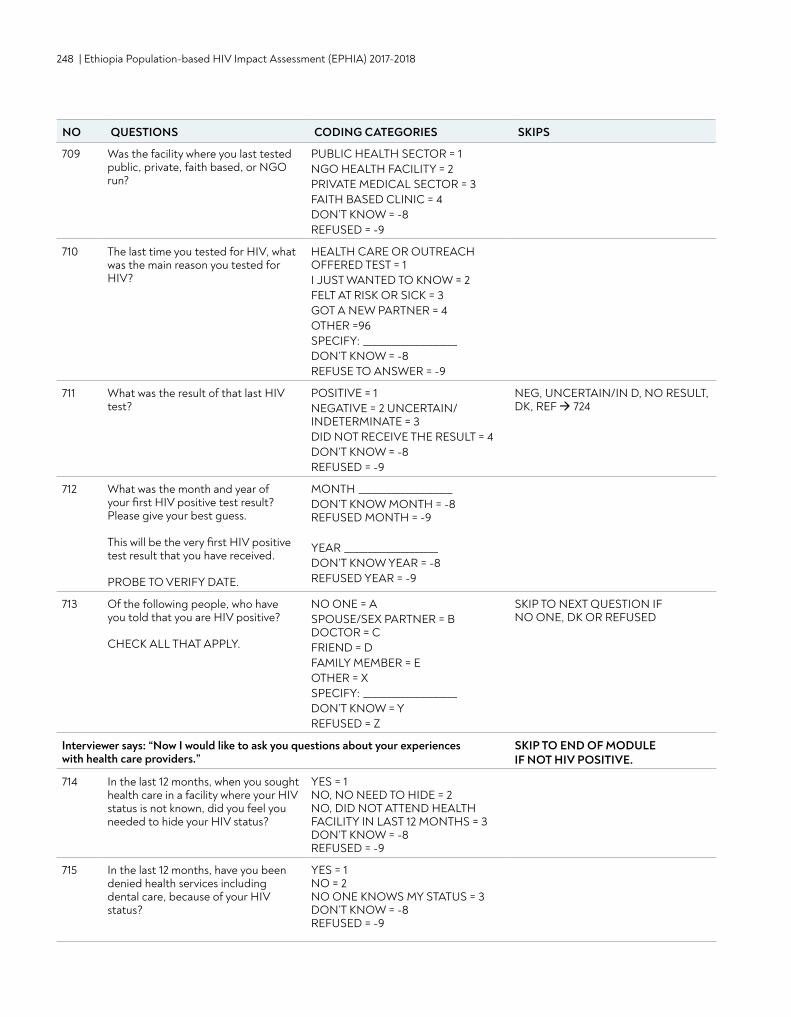
248 | Ethiopia Population-based HIV Impact Assessment (EPHIA) 2017-2018
709 Was the facility where you last tested public, private, faith based, or NGO run?
PUBLIC HEALTH SECTOR = 1 NGO HEALTH FACILITY = 2 PRIVATE MEDICAL SECTOR = 3 FAITH BASED CLINIC = 4 DON’T KNOW = -8 REFUSED = -9
710 The last time you tested for HIV, what was the main reason you tested for HIV?
HEALTH CARE OR OUTREACH OFFERED TEST = 1 I JUST WANTED TO KNOW = 2 FELT AT RISK OR SICK = 3 GOT A NEW PARTNER = 4 OTHER =96 SPECIFY: ____________________ DON’T KNOW = -8 REFUSE TO ANSWER = -9
711 What was the result of that last HIV test?
POSITIVE = 1 NEGATIVE = 2 UNCERTAIN/INDETERMINATE = 3DID NOT RECEIVE THE RESULT = 4 DON’T KNOW = -8 REFUSED = -9
NEG, UNCERTAIN/IN D, NO RESULT, DK, REF 724
712 What was the month and year of your first HIV positive test result? Please give your best guess. This will be the very first HIV positive test result that you have received. PROBE TO VERIFY DATE.
MONTH ____________________ DON’T KNOW MONTH = -8 REFUSED MONTH = -9 YEAR ____________________ DON’T KNOW YEAR = -8 REFUSED YEAR = -9
713 Of the following people, who have you told that you are HIV positive? CHECK ALL THAT APPLY.
NO ONE = A SPOUSE/SEX PARTNER = B DOCTOR = C FRIEND = D FAMILY MEMBER = E OTHER = X SPECIFY: ____________________ DON’T KNOW = Y REFUSED = Z
SKIP TO NEXT QUESTION IF NO ONE, DK OR REFUSED
Interviewer says: “Now I would like to ask you questions about your experiences with health care providers.”
SKIP TO END OF MODULE IF NOT HIV POSITIVE.
714 In the last 12 months, when you sought health care in a facility where your HIV status is not known, did you feel you needed to hide your HIV status?
YES = 1 NO, NO NEED TO HIDE = 2 NO, DID NOT ATTEND HEALTH FACILITY IN LAST 12 MONTHS = 3 DON’T KNOW = -8 REFUSED = -9
715 In the last 12 months, have you been denied health services including dental care, because of your HIV status?
YES = 1 NO = 2 NO ONE KNOWS MY STATUS = 3 DON’T KNOW = -8 REFUSED = -9
NO QUESTIONS CODING CATEGORIES SKIPS
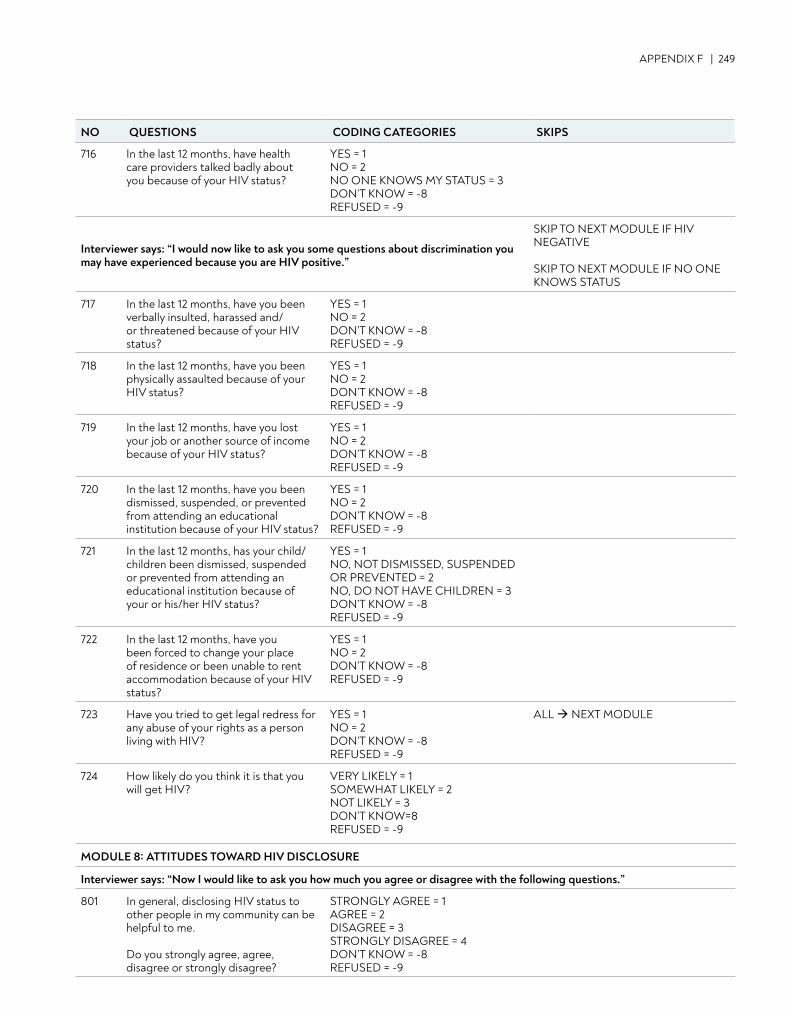
APPENDIX F | 249
716 In the last 12 months, have health care providers talked badly about you because of your HIV status?
YES = 1 NO = 2 NO ONE KNOWS MY STATUS = 3 DON’T KNOW = -8 REFUSED = -9
Interviewer says: “I would now like to ask you some questions about discrimination you may have experienced because you are HIV positive.”
SKIP TO NEXT MODULE IF HIV NEGATIVE SKIP TO NEXT MODULE IF NO ONE KNOWS STATUS
717 In the last 12 months, have you been verbally insulted, harassed and/or threatened because of your HIV status?
YES = 1 NO = 2 DON’T KNOW = -8 REFUSED = -9
718 In the last 12 months, have you been physically assaulted because of your HIV status?
YES = 1 NO = 2 DON’T KNOW = -8 REFUSED = -9
719 In the last 12 months, have you lost your job or another source of income because of your HIV status?
YES = 1 NO = 2 DON’T KNOW = -8 REFUSED = -9
720 In the last 12 months, have you been dismissed, suspended, or prevented from attending an educational institution because of your HIV status?
YES = 1 NO = 2 DON’T KNOW = -8 REFUSED = -9
721 In the last 12 months, has your child/children been dismissed, suspended or prevented from attending an educational institution because of your or his/her HIV status?
YES = 1 NO, NOT DISMISSED, SUSPENDED OR PREVENTED = 2 NO, DO NOT HAVE CHILDREN = 3 DON’T KNOW = -8 REFUSED = -9
722 In the last 12 months, have you been forced to change your place of residence or been unable to rent accommodation because of your HIV status?
YES = 1 NO = 2 DON’T KNOW = -8 REFUSED = -9
723 Have you tried to get legal redress for any abuse of your rights as a person living with HIV?
YES = 1 NO = 2 DON’T KNOW = -8 REFUSED = -9
ALL NEXT MODULE
724 How likely do you think it is that you will get HIV?
VERY LIKELY = 1 SOMEWHAT LIKELY = 2 NOT LIKELY = 3 DON’T KNOW=8 REFUSED = -9
MODULE 8: ATTITUDES TOWARD HIV DISCLOSURE
Interviewer says: “Now I would like to ask you how much you agree or disagree with the following questions.”
801 In general, disclosing HIV status to other people in my community can be helpful to me. Do you strongly agree, agree, disagree or strongly disagree?
STRONGLY AGREE = 1 AGREE = 2 DISAGREE = 3 STRONGLY DISAGREE = 4 DON’T KNOW = -8 REFUSED = -9
NO QUESTIONS CODING CATEGORIES SKIPS
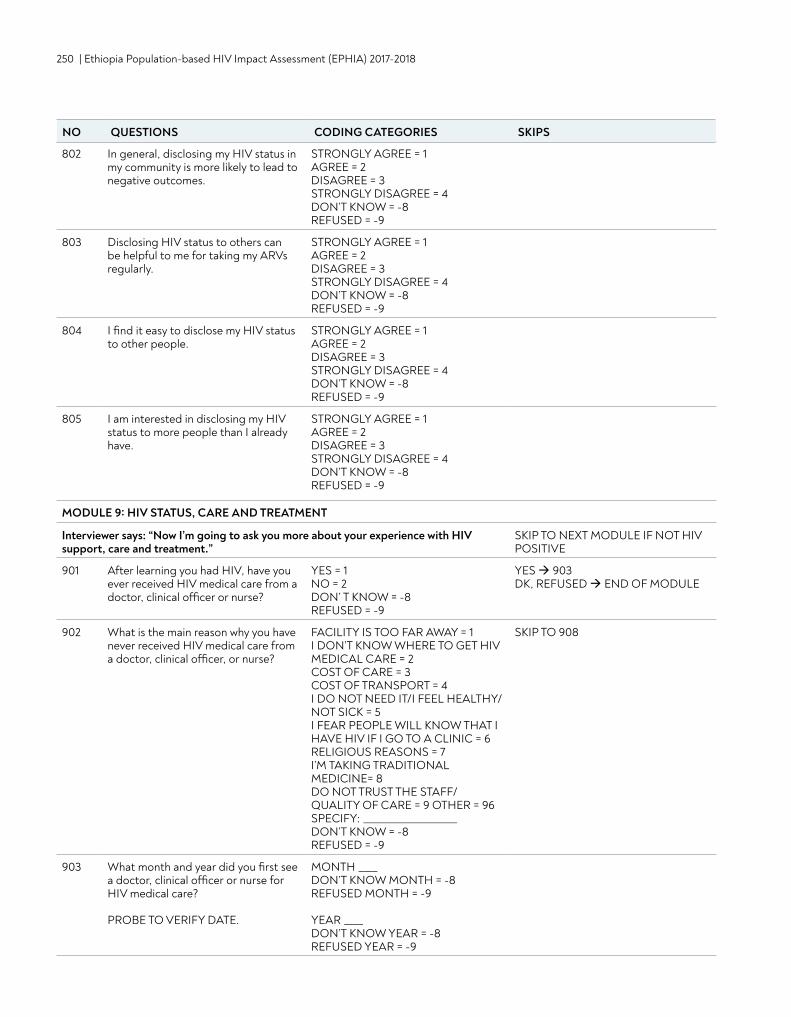
250 | Ethiopia Population-based HIV Impact Assessment (EPHIA) 2017-2018
802 In general, disclosing my HIV status in my community is more likely to lead to negative outcomes.
STRONGLY AGREE = 1 AGREE = 2 DISAGREE = 3 STRONGLY DISAGREE = 4 DON’T KNOW = -8 REFUSED = -9
803 Disclosing HIV status to others can be helpful to me for taking my ARVs regularly.
STRONGLY AGREE = 1 AGREE = 2 DISAGREE = 3 STRONGLY DISAGREE = 4 DON’T KNOW = -8 REFUSED = -9
804 I find it easy to disclose my HIV status to other people.
STRONGLY AGREE = 1 AGREE = 2 DISAGREE = 3 STRONGLY DISAGREE = 4 DON’T KNOW = -8 REFUSED = -9
805 I am interested in disclosing my HIV status to more people than I already have.
STRONGLY AGREE = 1 AGREE = 2 DISAGREE = 3 STRONGLY DISAGREE = 4 DON’T KNOW = -8 REFUSED = -9
MODULE 9: HIV STATUS, CARE AND TREATMENT
Interviewer says: “Now I’m going to ask you more about your experience with HIV support, care and treatment.”
SKIP TO NEXT MODULE IF NOT HIV POSITIVE
901 After learning you had HIV, have you ever received HIV medical care from a doctor, clinical officer or nurse?
YES = 1 NO = 2 DON’ T KNOW = -8 REFUSED = -9
YES 903DK, REFUSED END OF MODULE
902 What is the main reason why you have never received HIV medical care from a doctor, clinical officer, or nurse?
FACILITY IS TOO FAR AWAY = 1 I DON’T KNOW WHERE TO GET HIV MEDICAL CARE = 2 COST OF CARE = 3 COST OF TRANSPORT = 4 I DO NOT NEED IT/I FEEL HEALTHY/NOT SICK = 5 I FEAR PEOPLE WILL KNOW THAT I HAVE HIV IF I GO TO A CLINIC = 6 RELIGIOUS REASONS = 7 I’M TAKING TRADITIONAL MEDICINE= 8 DO NOT TRUST THE STAFF/QUALITY OF CARE = 9 OTHER = 96 SPECIFY: ____________________ DON’T KNOW = -8 REFUSED = -9
SKIP TO 908
903 What month and year did you first see a doctor, clinical officer or nurse for HIV medical care? PROBE TO VERIFY DATE.
MONTH ____ DON’T KNOW MONTH = -8 REFUSED MONTH = -9 YEAR ____ DON’T KNOW YEAR = -8 REFUSED YEAR = -9
NO QUESTIONS CODING CATEGORIES SKIPS
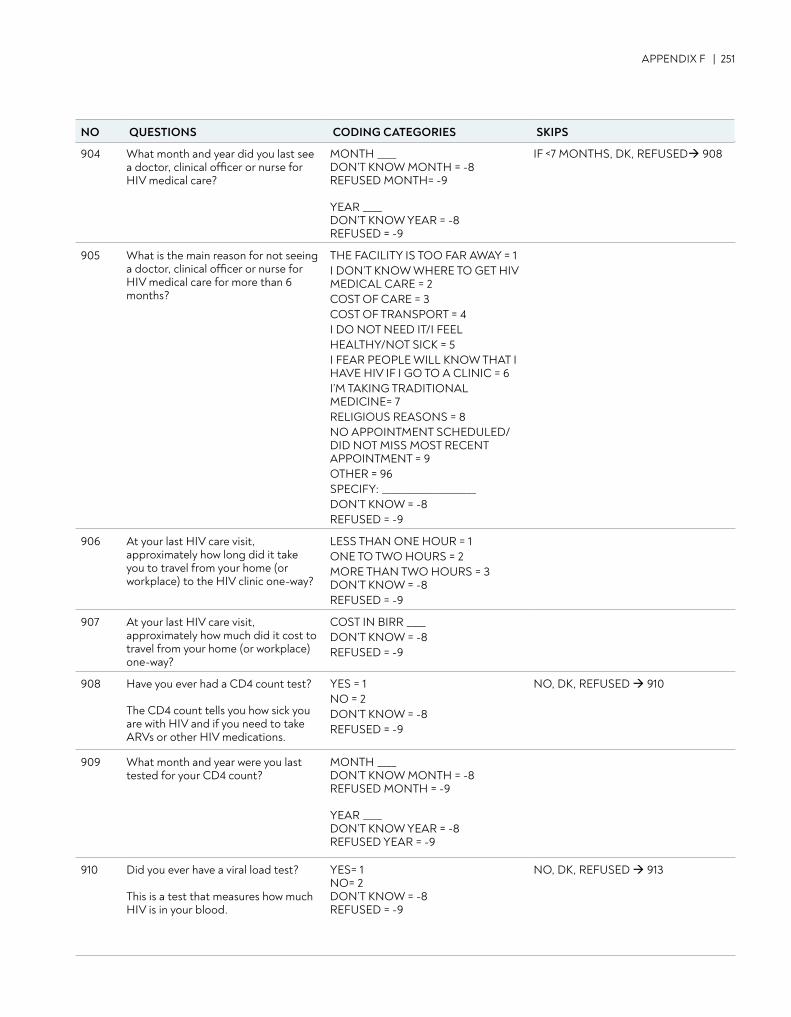
APPENDIX F | 251
904 What month and year did you last see a doctor, clinical officer or nurse for HIV medical care?
MONTH ____ DON’T KNOW MONTH = -8 REFUSED MONTH= -9 YEAR ____ DON’T KNOW YEAR = -8 REFUSED = -9
IF <7 MONTHS, DK, REFUSED 908
905 What is the main reason for not seeing a doctor, clinical officer or nurse for HIV medical care for more than 6 months?
THE FACILITY IS TOO FAR AWAY = 1 I DON’T KNOW WHERE TO GET HIV MEDICAL CARE = 2 COST OF CARE = 3 COST OF TRANSPORT = 4 I DO NOT NEED IT/I FEELHEALTHY/NOT SICK = 5 I FEAR PEOPLE WILL KNOW THAT I HAVE HIV IF I GO TO A CLINIC = 6 I’M TAKING TRADITIONAL MEDICINE= 7 RELIGIOUS REASONS = 8 NO APPOINTMENT SCHEDULED/DID NOT MISS MOST RECENT APPOINTMENT = 9 OTHER = 96 SPECIFY: ____________________ DON’T KNOW = -8 REFUSED = -9
906 At your last HIV care visit, approximately how long did it take you to travel from your home (or workplace) to the HIV clinic one-way?
LESS THAN ONE HOUR = 1 ONE TO TWO HOURS = 2 MORE THAN TWO HOURS = 3 DON’T KNOW = -8 REFUSED = -9
907 At your last HIV care visit, approximately how much did it cost to travel from your home (or workplace) one-way?
COST IN BIRR ____ DON’T KNOW = -8 REFUSED = -9
908 Have you ever had a CD4 count test? The CD4 count tells you how sick you are with HIV and if you need to take ARVs or other HIV medications.
YES = 1 NO = 2 DON’T KNOW = -8 REFUSED = -9
NO, DK, REFUSED 910
909 What month and year were you last tested for your CD4 count?
MONTH ____ DON’T KNOW MONTH = -8 REFUSED MONTH = -9 YEAR ____DON’T KNOW YEAR = -8 REFUSED YEAR = -9
910 Did you ever have a viral load test? This is a test that measures how much HIV is in your blood.
YES= 1 NO= 2 DON’T KNOW = -8 REFUSED = -9
NO, DK, REFUSED 913
NO QUESTIONS CODING CATEGORIES SKIPS
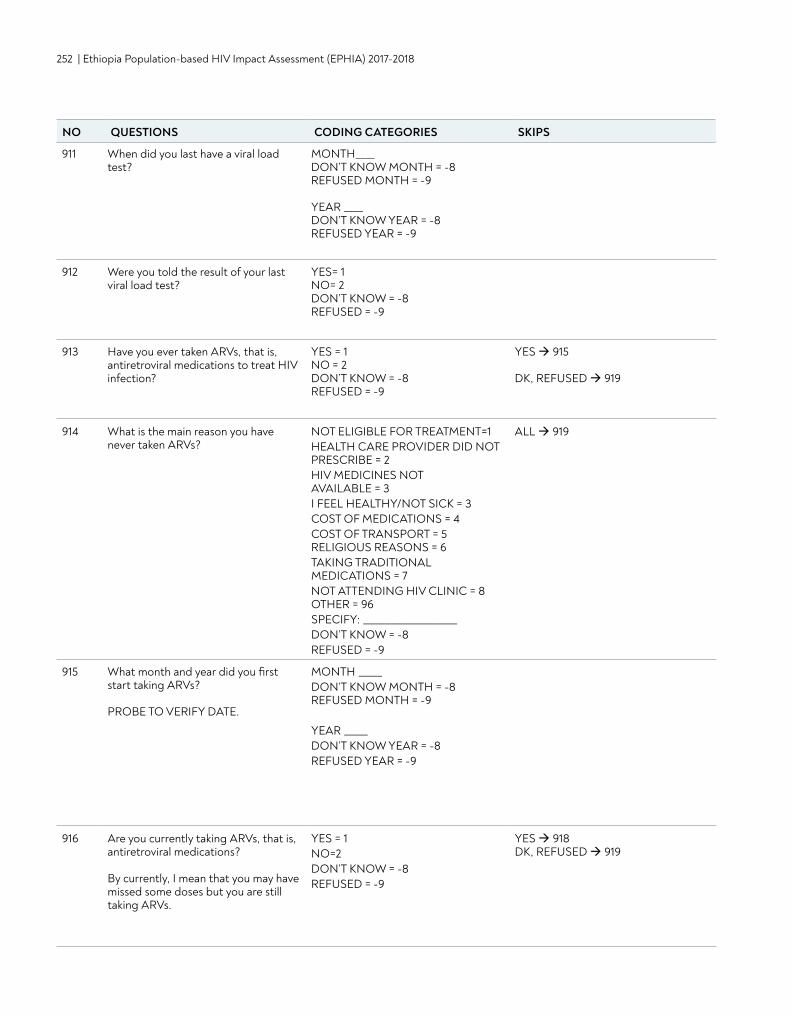
252 | Ethiopia Population-based HIV Impact Assessment (EPHIA) 2017-2018
911 When did you last have a viral load test?
MONTH____ DON’T KNOW MONTH = -8 REFUSED MONTH = -9 YEAR ____ DON’T KNOW YEAR = -8 REFUSED YEAR = -9
912 Were you told the result of your last viral load test?
YES= 1 NO= 2 DON’T KNOW = -8 REFUSED = -9
913 Have you ever taken ARVs, that is, antiretroviral medications to treat HIV infection?
YES = 1 NO = 2 DON’T KNOW = -8 REFUSED = -9
YES 915 DK, REFUSED 919
914 What is the main reason you have never taken ARVs?
NOT ELIGIBLE FOR TREATMENT=1 HEALTH CARE PROVIDER DID NOT PRESCRIBE = 2 HIV MEDICINES NOT AVAILABLE = 3 I FEEL HEALTHY/NOT SICK = 3 COST OF MEDICATIONS = 4 COST OF TRANSPORT = 5 RELIGIOUS REASONS = 6 TAKING TRADITIONAL MEDICATIONS = 7 NOT ATTENDING HIV CLINIC = 8 OTHER = 96 SPECIFY: ____________________ DON’T KNOW = -8 REFUSED = -9
ALL 919
915 What month and year did you first start taking ARVs? PROBE TO VERIFY DATE.
MONTH _____ DON’T KNOW MONTH = -8 REFUSED MONTH = -9 YEAR _____ DON’T KNOW YEAR = -8 REFUSED YEAR = -9
916 Are you currently taking ARVs, that is, antiretroviral medications? By currently, I mean that you may have missed some doses but you are still taking ARVs.
YES = 1 NO=2 DON’T KNOW = -8 REFUSED = -9
YES 918DK, REFUSED 919
NO QUESTIONS CODING CATEGORIES SKIPS
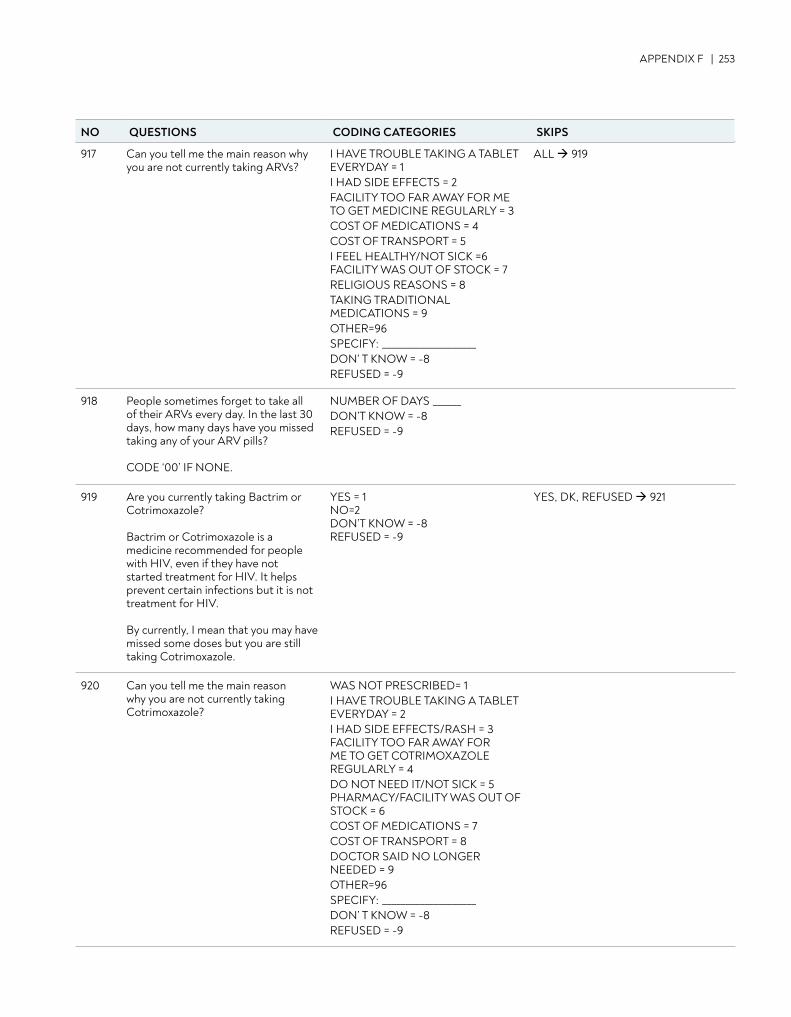
APPENDIX F | 253
917 Can you tell me the main reason why you are not currently taking ARVs?
I HAVE TROUBLE TAKING A TABLET EVERYDAY = 1 I HAD SIDE EFFECTS = 2 FACILITY TOO FAR AWAY FOR ME TO GET MEDICINE REGULARLY = 3COST OF MEDICATIONS = 4 COST OF TRANSPORT = 5 I FEEL HEALTHY/NOT SICK =6 FACILITY WAS OUT OF STOCK = 7 RELIGIOUS REASONS = 8 TAKING TRADITIONAL MEDICATIONS = 9 OTHER=96 SPECIFY: ____________________DON’ T KNOW = -8 REFUSED = -9
ALL 919
918 People sometimes forget to take all of their ARVs every day. In the last 30 days, how many days have you missed taking any of your ARV pills? CODE ‘00’ IF NONE.
NUMBER OF DAYS ______ DON’T KNOW = -8 REFUSED = -9
919 Are you currently taking Bactrim or Cotrimoxazole? Bactrim or Cotrimoxazole is a medicine recommended for people with HIV, even if they have not started treatment for HIV. It helps prevent certain infections but it is not treatment for HIV. By currently, I mean that you may have missed some doses but you are still taking Cotrimoxazole.
YES = 1 NO=2 DON’T KNOW = -8 REFUSED = -9
YES, DK, REFUSED 921
920 Can you tell me the main reason why you are not currently taking Cotrimoxazole?
WAS NOT PRESCRIBED= 1 I HAVE TROUBLE TAKING A TABLET EVERYDAY = 2 I HAD SIDE EFFECTS/RASH = 3 FACILITY TOO FAR AWAY FOR ME TO GET COTRIMOXAZOLE REGULARLY = 4 DO NOT NEED IT/NOT SICK = 5 PHARMACY/FACILITY WAS OUT OF STOCK = 6 COST OF MEDICATIONS = 7 COST OF TRANSPORT = 8 DOCTOR SAID NO LONGER NEEDED = 9 OTHER=96 SPECIFY: ____________________ DON’ T KNOW = -8 REFUSED = -9
NO QUESTIONS CODING CATEGORIES SKIPS
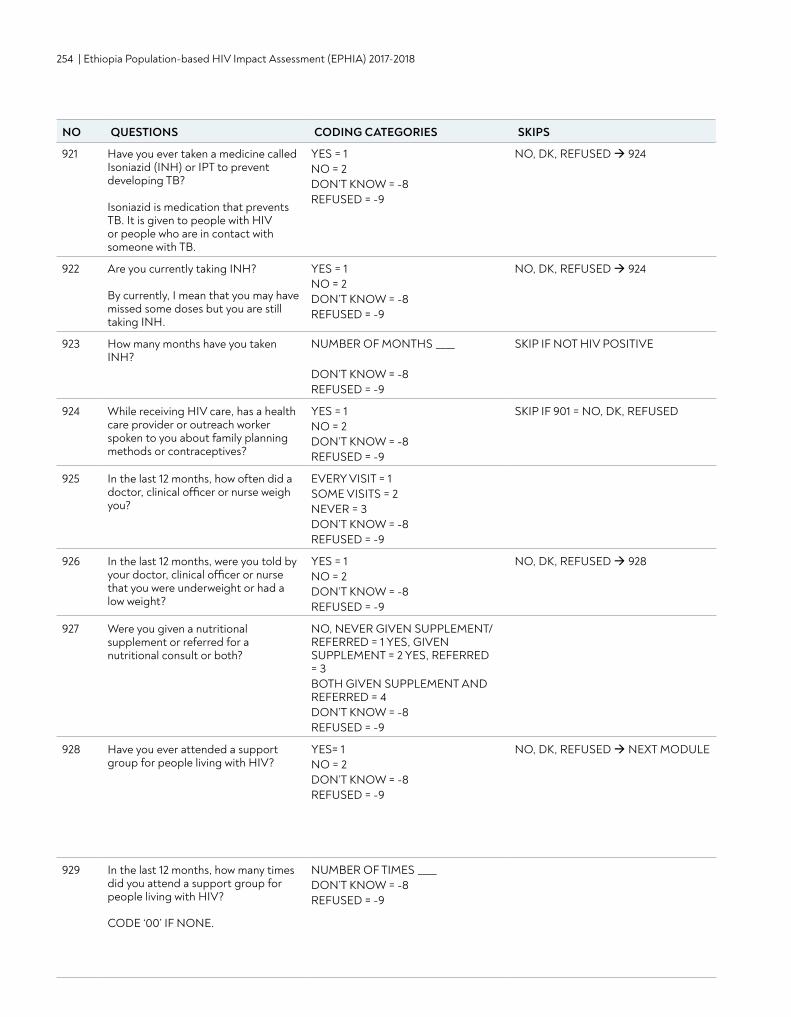
254 | Ethiopia Population-based HIV Impact Assessment (EPHIA) 2017-2018
921 Have you ever taken a medicine called Isoniazid (INH) or IPT to prevent developing TB? Isoniazid is medication that prevents TB. It is given to people with HIV or people who are in contact with someone with TB.
YES = 1 NO = 2 DON’T KNOW = -8 REFUSED = -9
NO, DK, REFUSED 924
922 Are you currently taking INH? By currently, I mean that you may have missed some doses but you are still taking INH.
YES = 1 NO = 2 DON’T KNOW = -8 REFUSED = -9
NO, DK, REFUSED 924
923 How many months have you taken INH?
NUMBER OF MONTHS ____ DON’T KNOW = -8 REFUSED = -9
SKIP IF NOT HIV POSITIVE
924 While receiving HIV care, has a health care provider or outreach worker spoken to you about family planning methods or contraceptives?
YES = 1 NO = 2 DON’T KNOW = -8 REFUSED = -9
SKIP IF 901 = NO, DK, REFUSED
925 In the last 12 months, how often did a doctor, clinical officer or nurse weigh you?
EVERY VISIT = 1 SOME VISITS = 2 NEVER = 3 DON’T KNOW = -8 REFUSED = -9
926 In the last 12 months, were you told by your doctor, clinical officer or nurse that you were underweight or had a low weight?
YES = 1 NO = 2 DON’T KNOW = -8 REFUSED = -9
NO, DK, REFUSED 928
927 Were you given a nutritional supplement or referred for a nutritional consult or both?
NO, NEVER GIVEN SUPPLEMENT/REFERRED = 1 YES, GIVEN SUPPLEMENT = 2 YES, REFERRED = 3 BOTH GIVEN SUPPLEMENT AND REFERRED = 4 DON’T KNOW = -8 REFUSED = -9
928 Have you ever attended a support group for people living with HIV?
YES= 1 NO = 2 DON’T KNOW = -8 REFUSED = -9
NO, DK, REFUSED NEXT MODULE
929 In the last 12 months, how many times did you attend a support group for people living with HIV? CODE ‘00’ IF NONE.
NUMBER OF TIMES ____ DON’T KNOW = -8 REFUSED = -9
NO QUESTIONS CODING CATEGORIES SKIPS
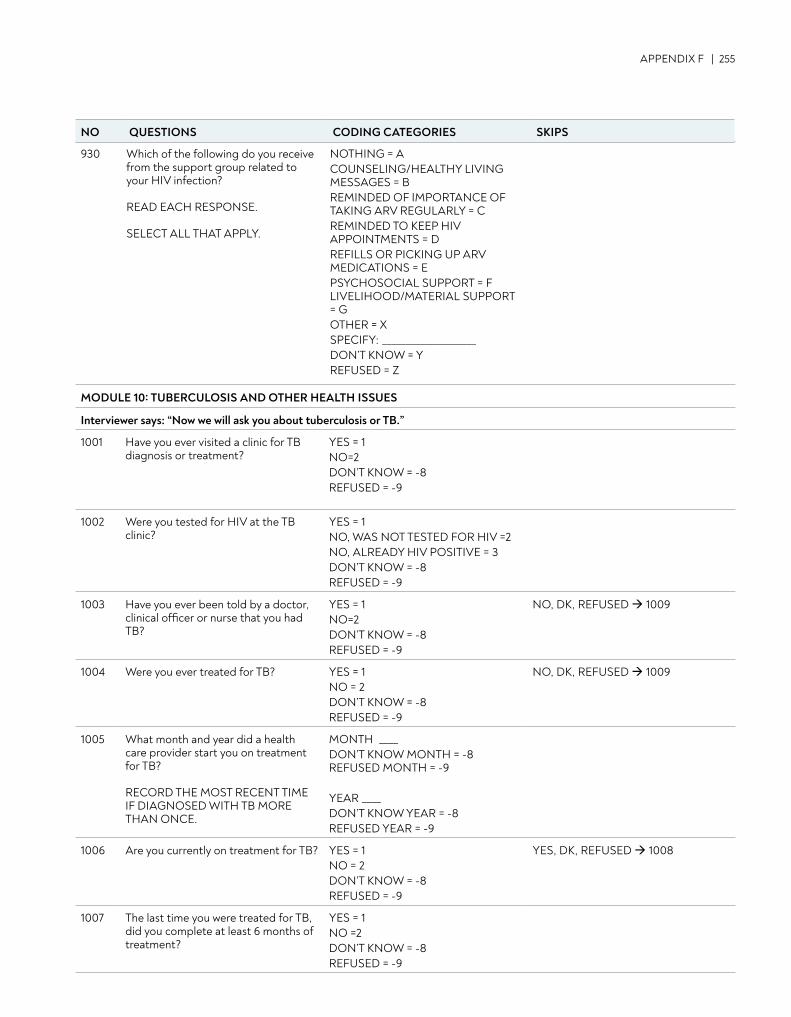
APPENDIX F | 255
930 Which of the following do you receive from the support group related to your HIV infection? READ EACH RESPONSE. SELECT ALL THAT APPLY.
NOTHING = A COUNSELING/HEALTHY LIVING MESSAGES = B REMINDED OF IMPORTANCE OF TAKING ARV REGULARLY = C REMINDED TO KEEP HIV APPOINTMENTS = D REFILLS OR PICKING UP ARV MEDICATIONS = E PSYCHOSOCIAL SUPPORT = F LIVELIHOOD/MATERIAL SUPPORT = G OTHER = X SPECIFY: ____________________ DON’T KNOW = Y REFUSED = Z
MODULE 10: TUBERCULOSIS AND OTHER HEALTH ISSUES
Interviewer says: “Now we will ask you about tuberculosis or TB.”
1001 Have you ever visited a clinic for TB diagnosis or treatment?
YES = 1 NO=2 DON’T KNOW = -8 REFUSED = -9
1002 Were you tested for HIV at the TB clinic?
YES = 1 NO, WAS NOT TESTED FOR HIV =2 NO, ALREADY HIV POSITIVE = 3 DON’T KNOW = -8 REFUSED = -9
1003 Have you ever been told by a doctor, clinical officer or nurse that you had TB?
YES = 1 NO=2 DON’T KNOW = -8 REFUSED = -9
NO, DK, REFUSED 1009
1004 Were you ever treated for TB? YES = 1 NO = 2 DON’T KNOW = -8 REFUSED = -9
NO, DK, REFUSED 1009
1005 What month and year did a health care provider start you on treatment for TB? RECORD THE MOST RECENT TIME IF DIAGNOSED WITH TB MORE THAN ONCE.
MONTH ____DON’T KNOW MONTH = -8 REFUSED MONTH = -9 YEAR ____DON’T KNOW YEAR = -8 REFUSED YEAR = -9
1006 Are you currently on treatment for TB? YES = 1 NO = 2 DON’T KNOW = -8 REFUSED = -9
YES, DK, REFUSED 1008
1007 The last time you were treated for TB, did you complete at least 6 months of treatment?
YES = 1 NO =2 DON’T KNOW = -8 REFUSED = -9
NO QUESTIONS CODING CATEGORIES SKIPS
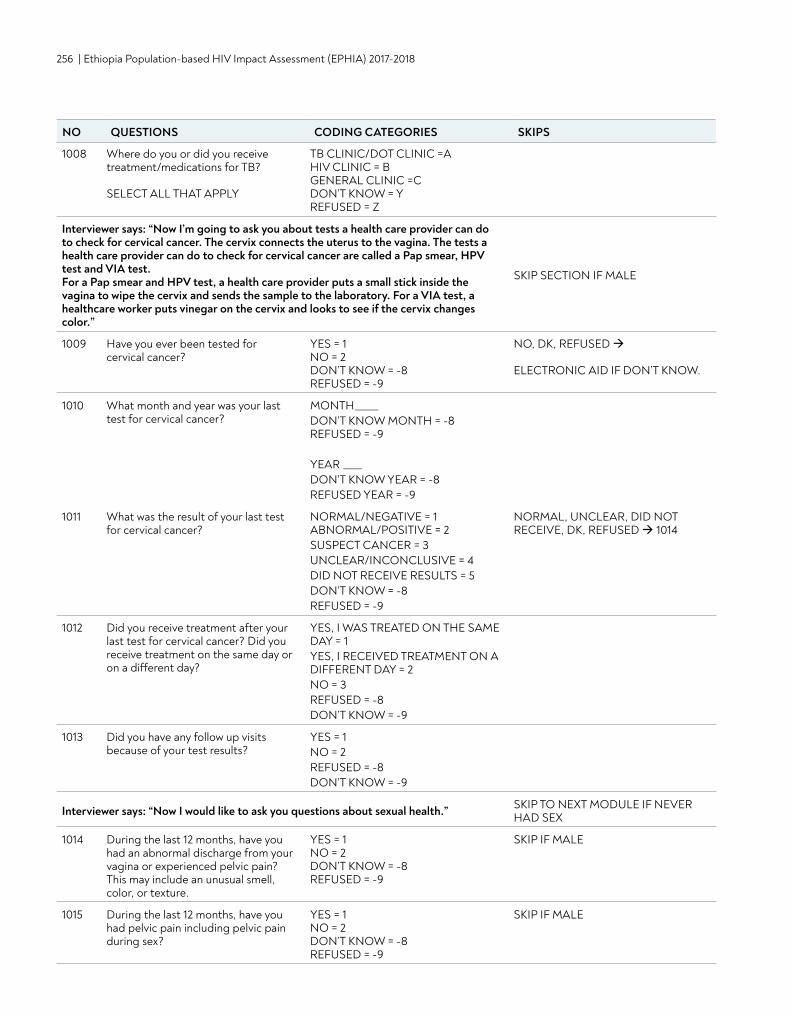
256 | Ethiopia Population-based HIV Impact Assessment (EPHIA) 2017-2018
1008 Where do you or did you receive treatment/medications for TB? SELECT ALL THAT APPLY
TB CLINIC/DOT CLINIC =A HIV CLINIC = B GENERAL CLINIC =C DON’T KNOW = Y REFUSED = Z
Interviewer says: “Now I’m going to ask you about tests a health care provider can do to check for cervical cancer. The cervix connects the uterus to the vagina. The tests a health care provider can do to check for cervical cancer are called a Pap smear, HPV test and VIA test. For a Pap smear and HPV test, a health care provider puts a small stick inside the vagina to wipe the cervix and sends the sample to the laboratory. For a VIA test, a healthcare worker puts vinegar on the cervix and looks to see if the cervix changes color.”
SKIP SECTION IF MALE
1009 Have you ever been tested for cervical cancer?
YES = 1 NO = 2 DON’T KNOW = -8 REFUSED = -9
NO, DK, REFUSED ELECTRONIC AID IF DON’T KNOW.
1010 What month and year was your last test for cervical cancer?
MONTH_____ DON’T KNOW MONTH = -8 REFUSED = -9 YEAR ____ DON’T KNOW YEAR = -8 REFUSED YEAR = -9
1011 What was the result of your last test for cervical cancer?
NORMAL/NEGATIVE = 1 ABNORMAL/POSITIVE = 2 SUSPECT CANCER = 3 UNCLEAR/INCONCLUSIVE = 4 DID NOT RECEIVE RESULTS = 5 DON’T KNOW = -8 REFUSED = -9
NORMAL, UNCLEAR, DID NOT RECEIVE, DK, REFUSED 1014
1012 Did you receive treatment after your last test for cervical cancer? Did you receive treatment on the same day or on a different day?
YES, I WAS TREATED ON THE SAME DAY = 1 YES, I RECEIVED TREATMENT ON A DIFFERENT DAY = 2 NO = 3 REFUSED = -8 DON’T KNOW = -9
1013 Did you have any follow up visits because of your test results?
YES = 1 NO = 2 REFUSED = -8 DON’T KNOW = -9
Interviewer says: “Now I would like to ask you questions about sexual health.” SKIP TO NEXT MODULE IF NEVER HAD SEX
1014 During the last 12 months, have you had an abnormal discharge from your vagina or experienced pelvic pain? This may include an unusual smell, color, or texture.
YES = 1 NO = 2 DON’T KNOW = -8 REFUSED = -9
SKIP IF MALE
1015 During the last 12 months, have you had pelvic pain including pelvic pain during sex?
YES = 1 NO = 2 DON’T KNOW = -8 REFUSED = -9
SKIP IF MALE
NO QUESTIONS CODING CATEGORIES SKIPS
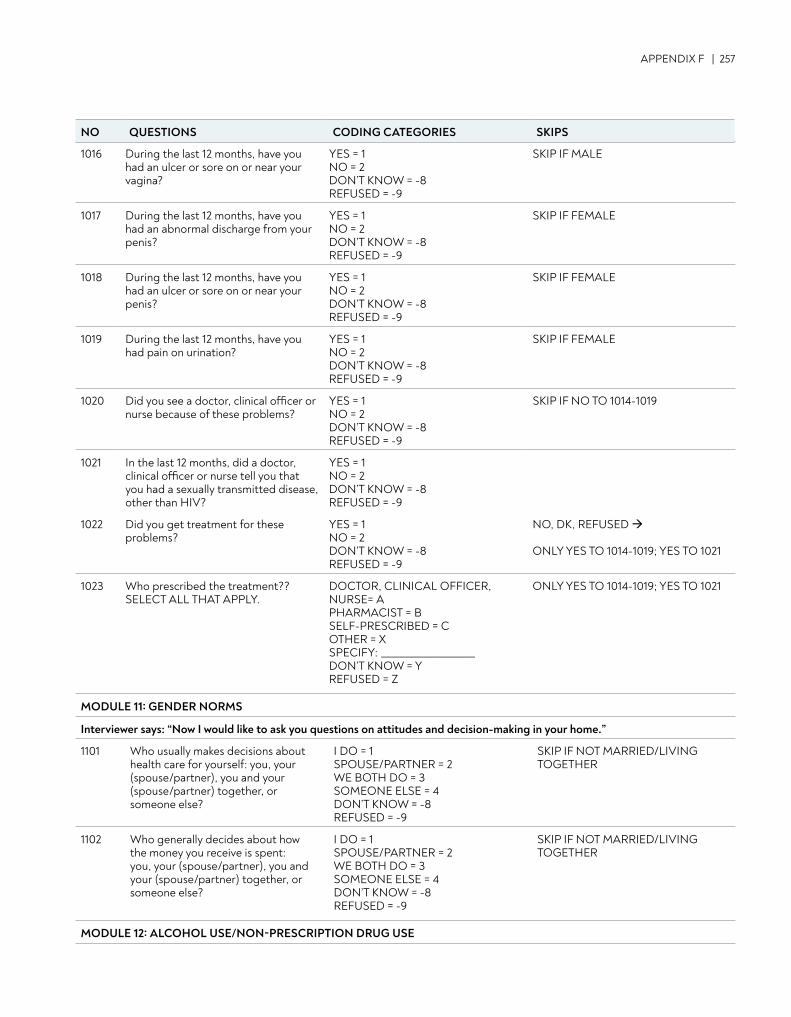
APPENDIX F | 257
1016 During the last 12 months, have you had an ulcer or sore on or near your vagina?
YES = 1 NO = 2 DON’T KNOW = -8 REFUSED = -9
SKIP IF MALE
1017 During the last 12 months, have you had an abnormal discharge from your penis?
YES = 1 NO = 2 DON’T KNOW = -8 REFUSED = -9
SKIP IF FEMALE
1018 During the last 12 months, have you had an ulcer or sore on or near your penis?
YES = 1 NO = 2 DON’T KNOW = -8 REFUSED = -9
SKIP IF FEMALE
1019 During the last 12 months, have you had pain on urination?
YES = 1 NO = 2 DON’T KNOW = -8 REFUSED = -9
SKIP IF FEMALE
1020 Did you see a doctor, clinical officer or nurse because of these problems?
YES = 1 NO = 2 DON’T KNOW = -8 REFUSED = -9
SKIP IF NO TO 1014-1019
1021 In the last 12 months, did a doctor, clinical officer or nurse tell you that you had a sexually transmitted disease, other than HIV?
YES = 1 NO = 2 DON’T KNOW = -8 REFUSED = -9
1022 Did you get treatment for these problems?
YES = 1 NO = 2 DON’T KNOW = -8 REFUSED = -9
NO, DK, REFUSED ONLY YES TO 1014-1019; YES TO 1021
1023 Who prescribed the treatment?? SELECT ALL THAT APPLY.
DOCTOR, CLINICAL OFFICER, NURSE= A PHARMACIST = B SELF-PRESCRIBED = C OTHER = X SPECIFY: ____________________ DON’T KNOW = Y REFUSED = Z
ONLY YES TO 1014-1019; YES TO 1021
MODULE 11: GENDER NORMS
Interviewer says: “Now I would like to ask you questions on attitudes and decision-making in your home.”
1101 Who usually makes decisions about health care for yourself: you, your (spouse/partner), you and your (spouse/partner) together, or someone else?
I DO = 1 SPOUSE/PARTNER = 2 WE BOTH DO = 3 SOMEONE ELSE = 4 DON’T KNOW = -8 REFUSED = -9
SKIP IF NOT MARRIED/LIVING TOGETHER
1102 Who generally decides about how the money you receive is spent: you, your (spouse/partner), you and your (spouse/partner) together, or someone else?
I DO = 1 SPOUSE/PARTNER = 2 WE BOTH DO = 3 SOMEONE ELSE = 4 DON’T KNOW = -8 REFUSED = -9
SKIP IF NOT MARRIED/LIVING TOGETHER
MODULE 12: ALCOHOL USE/NON-PRESCRIPTION DRUG USE
NO QUESTIONS CODING CATEGORIES SKIPS
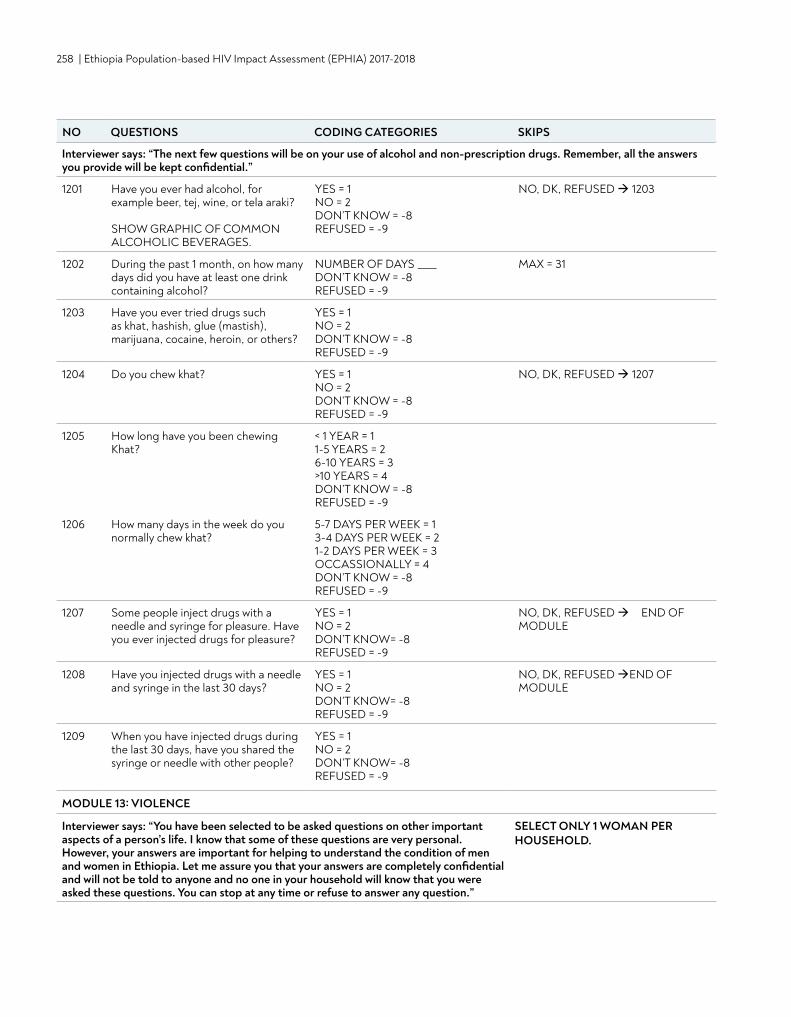
258 | Ethiopia Population-based HIV Impact Assessment (EPHIA) 2017-2018
Interviewer says: “The next few questions will be on your use of alcohol and non-prescription drugs. Remember, all the answers you provide will be kept confidential.”
1201 Have you ever had alcohol, for example beer, tej, wine, or tela araki? SHOW GRAPHIC OF COMMON ALCOHOLIC BEVERAGES.
YES = 1 NO = 2 DON’T KNOW = -8 REFUSED = -9
NO, DK, REFUSED 1203
1202 During the past 1 month, on how many days did you have at least one drink containing alcohol?
NUMBER OF DAYS ____ DON’T KNOW = -8 REFUSED = -9
MAX = 31
1203 Have you ever tried drugs such as khat, hashish, glue (mastish), marijuana, cocaine, heroin, or others?
YES = 1 NO = 2 DON’T KNOW = -8 REFUSED = -9
1204 Do you chew khat? YES = 1 NO = 2 DON’T KNOW = -8 REFUSED = -9
NO, DK, REFUSED 1207
1205 How long have you been chewing Khat?
< 1 YEAR = 1 1-5 YEARS = 2 6-10 YEARS = 3 >10 YEARS = 4 DON’T KNOW = -8 REFUSED = -9
1206 How many days in the week do you normally chew khat?
5-7 DAYS PER WEEK = 1 3-4 DAYS PER WEEK = 2 1-2 DAYS PER WEEK = 3 OCCASSIONALLY = 4 DON’T KNOW = -8 REFUSED = -9
1207 Some people inject drugs with a needle and syringe for pleasure. Have you ever injected drugs for pleasure?
YES = 1 NO = 2 DON’T KNOW= -8 REFUSED = -9
NO, DK, REFUSED END OF MODULE
1208 Have you injected drugs with a needle and syringe in the last 30 days?
YES = 1 NO = 2 DON’T KNOW= -8 REFUSED = -9
NO, DK, REFUSED END OF MODULE
1209 When you have injected drugs during the last 30 days, have you shared the syringe or needle with other people?
YES = 1 NO = 2 DON’T KNOW= -8REFUSED = -9
MODULE 13: VIOLENCE
Interviewer says: “You have been selected to be asked questions on other important aspects of a person’s life. I know that some of these questions are very personal. However, your answers are important for helping to understand the condition of men and women in Ethiopia. Let me assure you that your answers are completely confidential and will not be told to anyone and no one in your household will know that you were asked these questions. You can stop at any time or refuse to answer any question.”
SELECT ONLY 1 WOMAN PER HOUSEHOLD.
NO QUESTIONS CODING CATEGORIES SKIPS
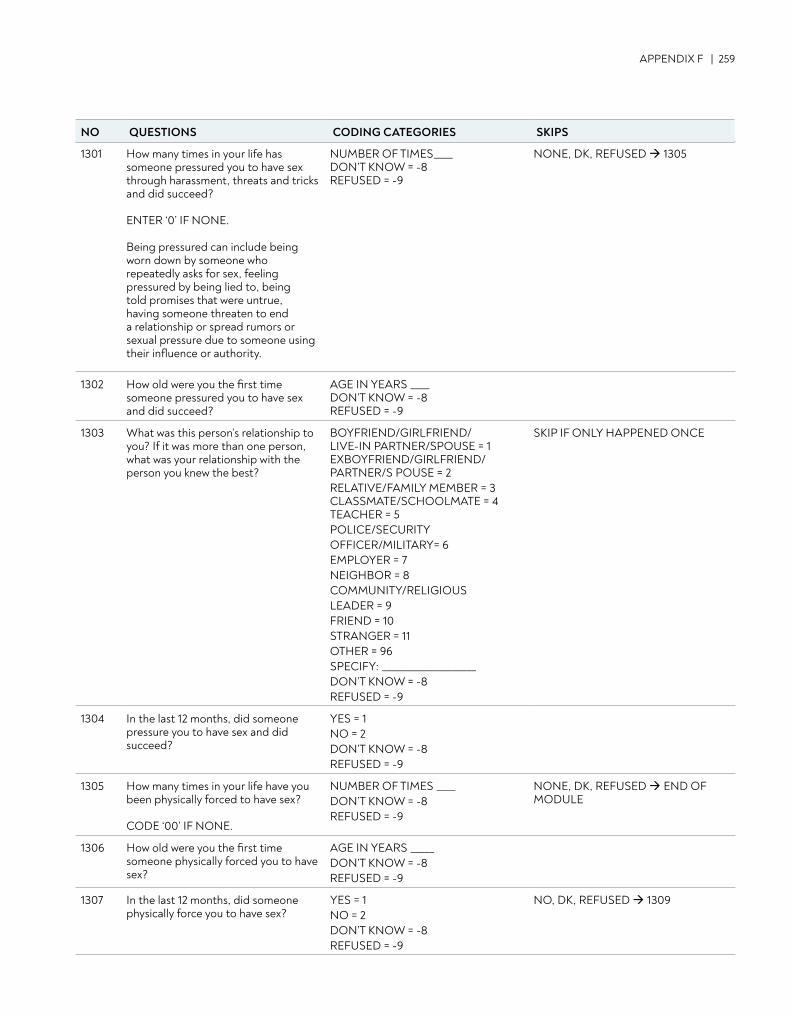
APPENDIX F | 259
1301 How many times in your life has someone pressured you to have sex through harassment, threats and tricks and did succeed? ENTER ‘0’ IF NONE. Being pressured can include being worn down by someone who repeatedly asks for sex, feeling pressured by being lied to, being told promises that were untrue, having someone threaten to end a relationship or spread rumors or sexual pressure due to someone using their influence or authority.
NUMBER OF TIMES____ DON’T KNOW = -8 REFUSED = -9
NONE, DK, REFUSED 1305
1302 How old were you the first time someone pressured you to have sex and did succeed?
AGE IN YEARS ____ DON’T KNOW = -8 REFUSED = -9
1303 What was this person’s relationship to you? If it was more than one person, what was your relationship with the person you knew the best?
BOYFRIEND/GIRLFRIEND/LIVE-IN PARTNER/SPOUSE = 1 EXBOYFRIEND/GIRLFRIEND/PARTNER/S POUSE = 2 RELATIVE/FAMILY MEMBER = 3 CLASSMATE/SCHOOLMATE = 4 TEACHER = 5 POLICE/SECURITYOFFICER/MILITARY= 6 EMPLOYER = 7 NEIGHBOR = 8 COMMUNITY/RELIGIOUS LEADER = 9 FRIEND = 10 STRANGER = 11 OTHER = 96 SPECIFY: ____________________ DON’T KNOW = -8 REFUSED = -9
SKIP IF ONLY HAPPENED ONCE
1304 In the last 12 months, did someone pressure you to have sex and did succeed?
YES = 1 NO = 2 DON’T KNOW = -8 REFUSED = -9
1305 How many times in your life have you been physically forced to have sex? CODE ‘00’ IF NONE.
NUMBER OF TIMES ____ DON’T KNOW = -8 REFUSED = -9
NONE, DK, REFUSED END OF MODULE
1306 How old were you the first time someone physically forced you to have sex?
AGE IN YEARS _____ DON’T KNOW = -8 REFUSED = -9
1307 In the last 12 months, did someone physically force you to have sex?
YES = 1 NO = 2 DON’T KNOW = -8 REFUSED = -9
NO, DK, REFUSED 1309
NO QUESTIONS CODING CATEGORIES SKIPS
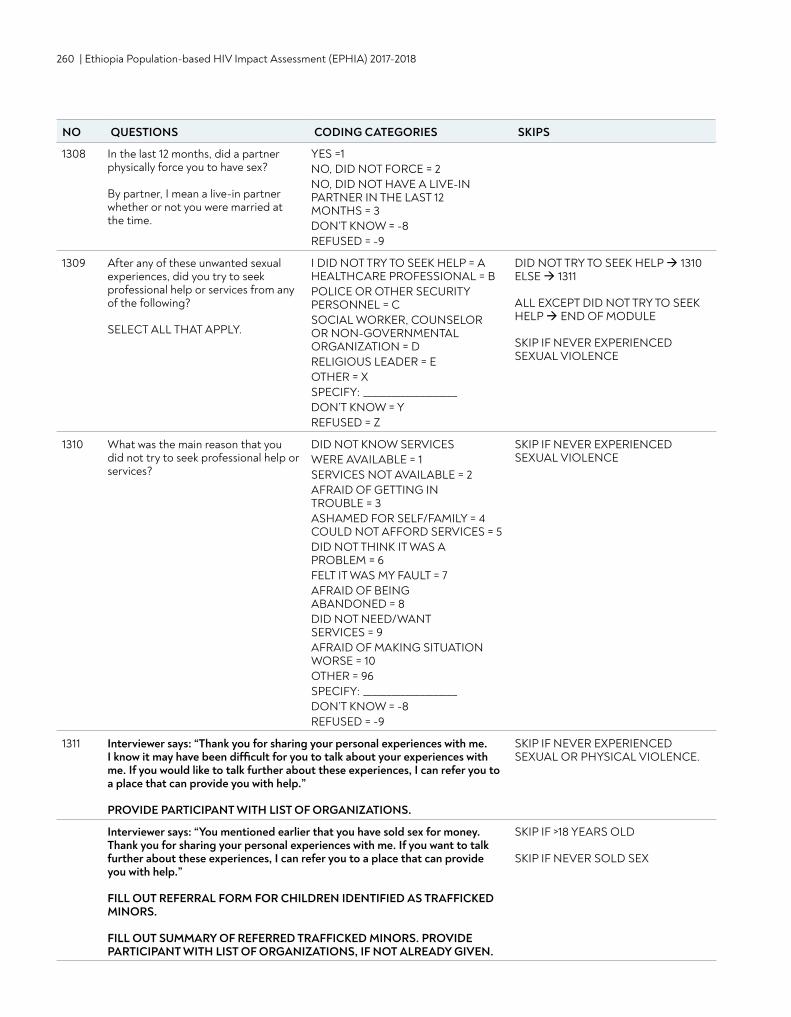
260 | Ethiopia Population-based HIV Impact Assessment (EPHIA) 2017-2018
1308 In the last 12 months, did a partner physically force you to have sex? By partner, I mean a live-in partner whether or not you were married at the time.
YES =1 NO, DID NOT FORCE = 2 NO, DID NOT HAVE A LIVE-IN PARTNER IN THE LAST 12 MONTHS = 3 DON’T KNOW = -8 REFUSED = -9
1309 After any of these unwanted sexual experiences, did you try to seek professional help or services from any of the following? SELECT ALL THAT APPLY.
I DID NOT TRY TO SEEK HELP = A HEALTHCARE PROFESSIONAL = B POLICE OR OTHER SECURITY PERSONNEL = C SOCIAL WORKER, COUNSELOR OR NON-GOVERNMENTAL ORGANIZATION = D RELIGIOUS LEADER = E OTHER = X SPECIFY: ____________________ DON’T KNOW = Y REFUSED = Z
DID NOT TRY TO SEEK HELP 1310 ELSE 1311 ALL EXCEPT DID NOT TRY TO SEEK HELP END OF MODULE SKIP IF NEVER EXPERIENCED SEXUAL VIOLENCE
1310 What was the main reason that you did not try to seek professional help or services?
DID NOT KNOW SERVICES WERE AVAILABLE = 1 SERVICES NOT AVAILABLE = 2 AFRAID OF GETTING IN TROUBLE = 3 ASHAMED FOR SELF/FAMILY = 4 COULD NOT AFFORD SERVICES = 5 DID NOT THINK IT WAS A PROBLEM = 6 FELT IT WAS MY FAULT = 7 AFRAID OF BEING ABANDONED = 8 DID NOT NEED/WANT SERVICES = 9AFRAID OF MAKING SITUATION WORSE = 10 OTHER = 96 SPECIFY: ____________________ DON’T KNOW = -8 REFUSED = -9
SKIP IF NEVER EXPERIENCED SEXUAL VIOLENCE
1311 Interviewer says: “Thank you for sharing your personal experiences with me. I know it may have been difficult for you to talk about your experiences with me. If you would like to talk further about these experiences, I can refer you to a place that can provide you with help.” PROVIDE PARTICIPANT WITH LIST OF ORGANIZATIONS.
SKIP IF NEVER EXPERIENCED SEXUAL OR PHYSICAL VIOLENCE.
Interviewer says: “You mentioned earlier that you have sold sex for money. Thank you for sharing your personal experiences with me. If you want to talk further about these experiences, I can refer you to a place that can provide you with help.” FILL OUT REFERRAL FORM FOR CHILDREN IDENTIFIED AS TRAFFICKED MINORS.
FILL OUT SUMMARY OF REFERRED TRAFFICKED MINORS. PROVIDE PARTICIPANT WITH LIST OF ORGANIZATIONS, IF NOT ALREADY GIVEN.
SKIP IF >18 YEARS OLD SKIP IF NEVER SOLD SEX
NO QUESTIONS CODING CATEGORIES SKIPS
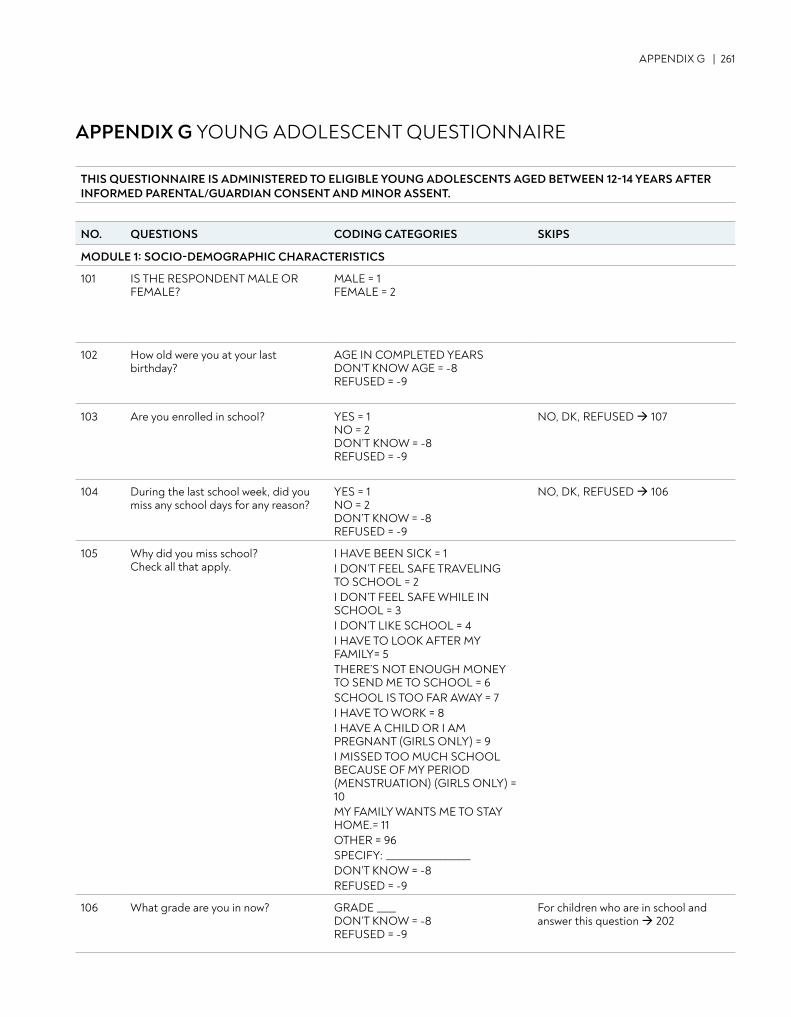
APPENDIX G | 261
APPENDIX G YOUNG ADOLESCENT QUESTIONNAIRE
THIS QUESTIONNAIRE IS ADMINISTERED TO ELIGIBLE YOUNG ADOLESCENTS AGED BETWEEN 12-14 YEARS AFTER INFORMED PARENTAL/GUARDIAN CONSENT AND MINOR ASSENT.
NO. QUESTIONS CODING CATEGORIES SKIPS
MODULE 1: SOCIO-DEMOGRAPHIC CHARACTERISTICS
101 IS THE RESPONDENT MALE OR FEMALE?
MALE = 1FEMALE = 2
102 How old were you at your last birthday?
AGE IN COMPLETED YEARS DON'T KNOW AGE = -8REFUSED = -9
103 Are you enrolled in school? YES = 1NO = 2DON’T KNOW = -8REFUSED = -9
NO, DK, REFUSED 107
104 During the last school week, did you miss any school days for any reason?
YES = 1 NO = 2 DON’T KNOW = -8 REFUSED = -9
NO, DK, REFUSED 106
105 Why did you miss school? Check all that apply.
I HAVE BEEN SICK = 1 I DON’T FEEL SAFE TRAVELING TO SCHOOL = 2 I DON’T FEEL SAFE WHILE IN SCHOOL = 3 I DON’T LIKE SCHOOL = 4 I HAVE TO LOOK AFTER MY FAMILY= 5 THERE’S NOT ENOUGH MONEY TO SEND ME TO SCHOOL = 6 SCHOOL IS TOO FAR AWAY = 7 I HAVE TO WORK = 8 I HAVE A CHILD OR I AM PREGNANT (GIRLS ONLY) = 9 I MISSED TOO MUCH SCHOOL BECAUSE OF MY PERIOD (MENSTRUATION) (GIRLS ONLY) = 10 MY FAMILY WANTS ME TO STAY HOME.= 11 OTHER = 96 SPECIFY: __________________ DON’T KNOW = -8 REFUSED = -9
106 What grade are you in now? GRADE ____ DON’T KNOW = -8 REFUSED = -9
For children who are in school and answer this question 202
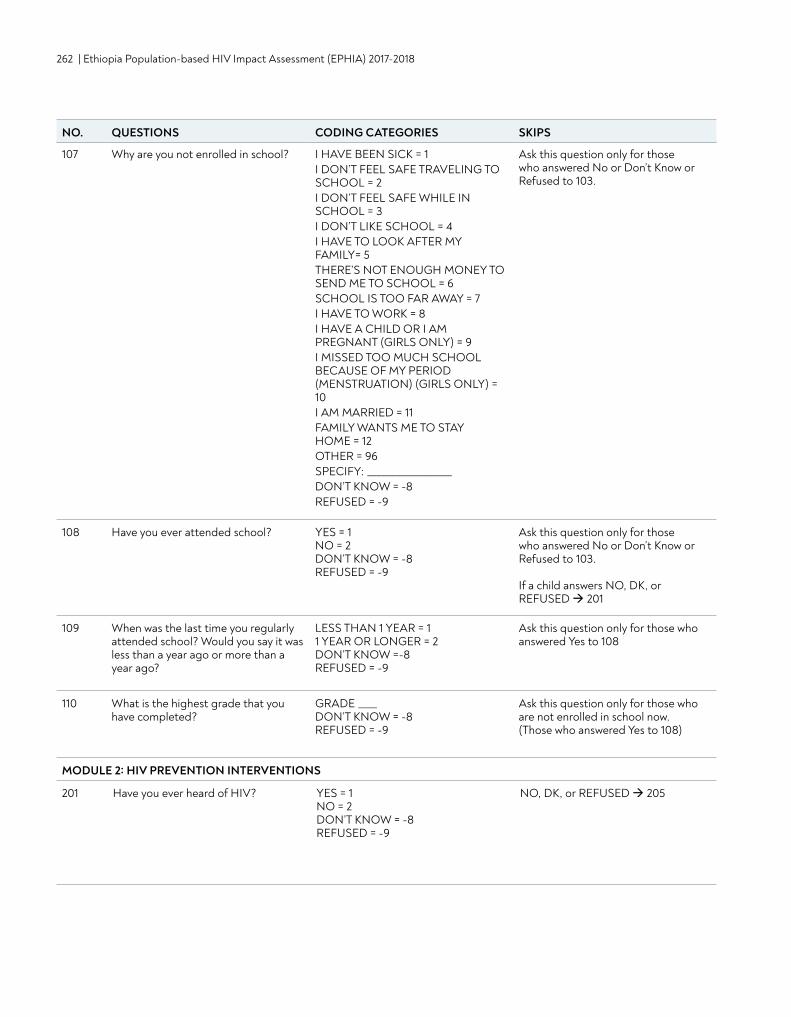
262 | Ethiopia Population-based HIV Impact Assessment (EPHIA) 2017-2018
107 Why are you not enrolled in school? I HAVE BEEN SICK = 1 I DON’T FEEL SAFE TRAVELING TO SCHOOL = 2 I DON’T FEEL SAFE WHILE IN SCHOOL = 3 I DON’T LIKE SCHOOL = 4 I HAVE TO LOOK AFTER MY FAMILY= 5 THERE’S NOT ENOUGH MONEY TO SEND ME TO SCHOOL = 6 SCHOOL IS TOO FAR AWAY = 7 I HAVE TO WORK = 8 I HAVE A CHILD OR I AM PREGNANT (GIRLS ONLY) = 9 I MISSED TOO MUCH SCHOOL BECAUSE OF MY PERIOD (MENSTRUATION) (GIRLS ONLY) = 10I AM MARRIED = 11 FAMILY WANTS ME TO STAY HOME = 12 OTHER = 96 SPECIFY: __________________ DON’T KNOW = -8 REFUSED = -9
Ask this question only for those who answered No or Don’t Know or Refused to 103.
108 Have you ever attended school? YES = 1 NO = 2 DON’T KNOW = -8 REFUSED = -9
Ask this question only for those who answered No or Don’t Know or Refused to 103. If a child answers NO, DK, or REFUSED 201
109 When was the last time you regularly attended school? Would you say it was less than a year ago or more than a year ago?
LESS THAN 1 YEAR = 1 1 YEAR OR LONGER = 2 DON’T KNOW =-8 REFUSED = -9
Ask this question only for those who answered Yes to 108
110 What is the highest grade that you have completed?
GRADE ____ DON’T KNOW = -8 REFUSED = -9
Ask this question only for those who are not enrolled in school now. (Those who answered Yes to 108)
MODULE 2: HIV PREVENTION INTERVENTIONS
201 Have you ever heard of HIV? YES = 1 NO = 2 DON’T KNOW = -8 REFUSED = -9
NO, DK, or REFUSED 205
NO. QUESTIONS CODING CATEGORIES SKIPS
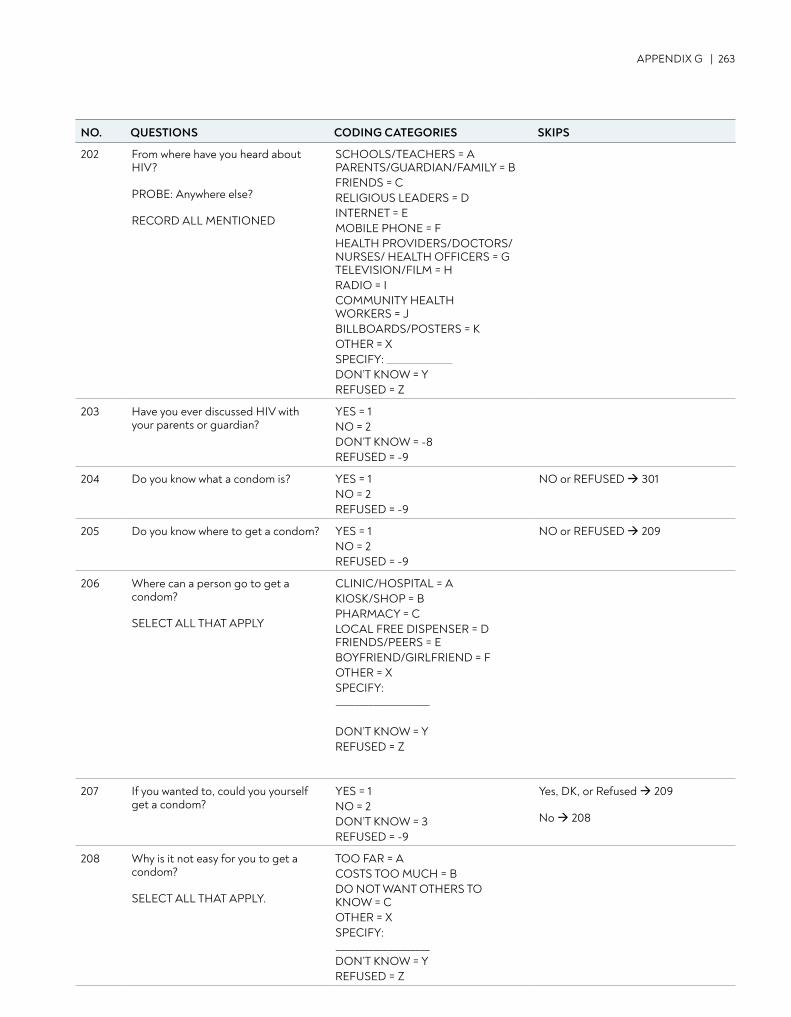
APPENDIX G | 263
NO. QUESTIONS CODING CATEGORIES SKIPS
202 From where have you heard about HIV? PROBE: Anywhere else? RECORD ALL MENTIONED
SCHOOLS/TEACHERS = A PARENTS/GUARDIAN/FAMILY = B FRIENDS = C RELIGIOUS LEADERS = D INTERNET = E MOBILE PHONE = F HEALTH PROVIDERS/DOCTORS/NURSES/ HEALTH OFFICERS = G TELEVISION/FILM = H RADIO = I COMMUNITY HEALTH WORKERS = JBILLBOARDS/POSTERS = KOTHER = X SPECIFY: DON’T KNOW = Y REFUSED = Z
203 Have you ever discussed HIV with your parents or guardian?
YES = 1 NO = 2 DON’T KNOW = -8 REFUSED = -9
204 Do you know what a condom is? YES = 1 NO = 2 REFUSED = -9
NO or REFUSED 301
205 Do you know where to get a condom? YES = 1 NO = 2 REFUSED = -9
NO or REFUSED 209
206 Where can a person go to get a condom? SELECT ALL THAT APPLY
CLINIC/HOSPITAL = A KIOSK/SHOP = B PHARMACY = C LOCAL FREE DISPENSER = D FRIENDS/PEERS = E BOYFRIEND/GIRLFRIEND = F OTHER = X SPECIFY: ____________________
DON’T KNOW = Y REFUSED = Z
207 If you wanted to, could you yourself get a condom?
YES = 1 NO = 2 DON’T KNOW = 3 REFUSED = -9
Yes, DK, or Refused 209 No 208
208 Why is it not easy for you to get a condom? SELECT ALL THAT APPLY.
TOO FAR = A COSTS TOO MUCH = B DO NOT WANT OTHERS TO KNOW = C OTHER = X SPECIFY: ____________________DON’T KNOW = Y REFUSED = Z
NO. QUESTIONS CODING CATEGORIES SKIPS
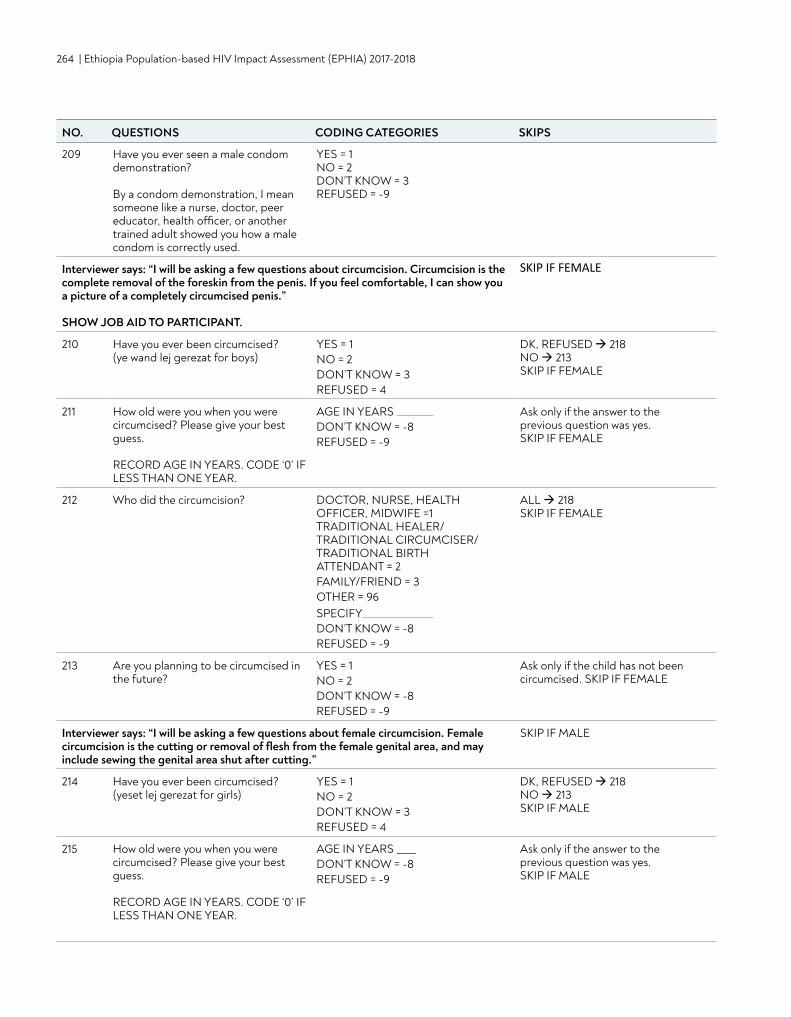
264 | Ethiopia Population-based HIV Impact Assessment (EPHIA) 2017-2018
NO. QUESTIONS CODING CATEGORIES SKIPS
209 Have you ever seen a male condom demonstration? By a condom demonstration, I mean someone like a nurse, doctor, peer educator, health officer, or another trained adult showed you how a male condom is correctly used.
YES = 1 NO = 2 DON’T KNOW = 3 REFUSED = -9
Interviewer says: “I will be asking a few questions about circumcision. Circumcision is the complete removal of the foreskin from the penis. If you feel comfortable, I can show you a picture of a completely circumcised penis.” SHOW JOB AID TO PARTICIPANT.
SKIP IF FEMALE
210 Have you ever been circumcised? (ye wand lej gerezat for boys)
YES = 1 NO = 2 DON’T KNOW = 3 REFUSED = 4
DK, REFUSED 218 NO 213 SKIP IF FEMALE
211 How old were you when you were circumcised? Please give your best guess. RECORD AGE IN YEARS. CODE ‘0’ IF LESS THAN ONE YEAR.
AGE IN YEARS DON’T KNOW = -8 REFUSED = -9
Ask only if the answer to the previous question was yes. SKIP IF FEMALE
212 Who did the circumcision? DOCTOR, NURSE, HEALTH OFFICER, MIDWIFE =1 TRADITIONAL HEALER/ TRADITIONAL CIRCUMCISER/ TRADITIONAL BIRTH ATTENDANT = 2 FAMILY/FRIEND = 3 OTHER = 96 SPECIFY DON’T KNOW = -8 REFUSED = -9
ALL 218SKIP IF FEMALE
213 Are you planning to be circumcised in the future?
YES = 1 NO = 2 DON’T KNOW = -8 REFUSED = -9
Ask only if the child has not been circumcised. SKIP IF FEMALE
Interviewer says: “I will be asking a few questions about female circumcision. Female circumcision is the cutting or removal of flesh from the female genital area, and may include sewing the genital area shut after cutting.”
SKIP IF MALE
214 Have you ever been circumcised? (yeset lej gerezat for girls)
YES = 1 NO = 2 DON’T KNOW = 3 REFUSED = 4
DK, REFUSED 218 NO 213 SKIP IF MALE
215 How old were you when you were circumcised? Please give your best guess. RECORD AGE IN YEARS. CODE ‘0’ IF LESS THAN ONE YEAR.
AGE IN YEARS ____ DON’T KNOW = -8 REFUSED = -9
Ask only if the answer to the previous question was yes. SKIP IF MALE
NO. QUESTIONS CODING CATEGORIES SKIPS
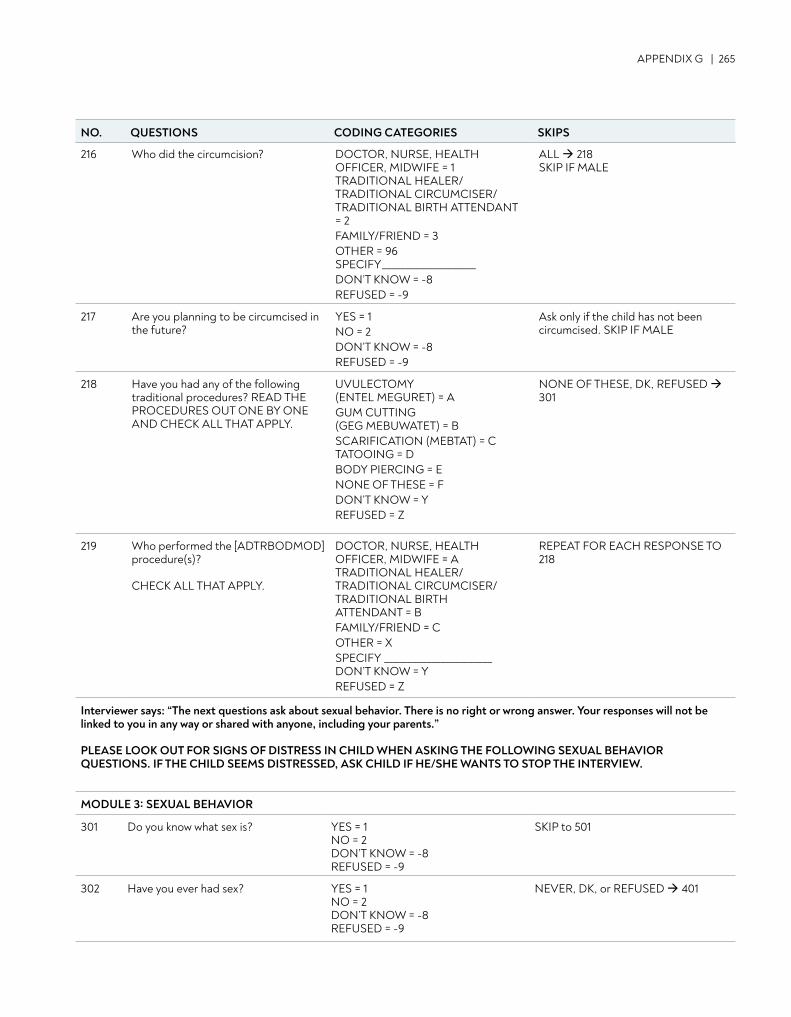
APPENDIX G | 265
216 Who did the circumcision? DOCTOR, NURSE, HEALTH OFFICER, MIDWIFE = 1 TRADITIONAL HEALER/ TRADITIONAL CIRCUMCISER/ TRADITIONAL BIRTH ATTENDANT = 2 FAMILY/FRIEND = 3 OTHER = 96 SPECIFY____________________DON’T KNOW = -8 REFUSED = -9
ALL 218SKIP IF MALE
217 Are you planning to be circumcised in the future?
YES = 1 NO = 2 DON’T KNOW = -8 REFUSED = -9
Ask only if the child has not been circumcised. SKIP IF MALE
218 Have you had any of the following traditional procedures? READ THE PROCEDURES OUT ONE BY ONE AND CHECK ALL THAT APPLY.
UVULECTOMY (ENTEL MEGURET) = A GUM CUTTING (GEG MEBUWATET) = B SCARIFICATION (MEBTAT) = C TATOOING = D BODY PIERCING = E NONE OF THESE = F DON’T KNOW = Y REFUSED = Z
NONE OF THESE, DK, REFUSED 301
219 Who performed the [ADTRBODMOD] procedure(s)? CHECK ALL THAT APPLY.
DOCTOR, NURSE, HEALTH OFFICER, MIDWIFE = A TRADITIONAL HEALER/ TRADITIONAL CIRCUMCISER/ TRADITIONAL BIRTH ATTENDANT = B FAMILY/FRIEND = C OTHER = X SPECIFY _______________________ DON’T KNOW = Y REFUSED = Z
REPEAT FOR EACH RESPONSE TO 218
Interviewer says: “The next questions ask about sexual behavior. There is no right or wrong answer. Your responses will not be linked to you in any way or shared with anyone, including your parents.”
PLEASE LOOK OUT FOR SIGNS OF DISTRESS IN CHILD WHEN ASKING THE FOLLOWING SEXUAL BEHAVIOR QUESTIONS. IF THE CHILD SEEMS DISTRESSED, ASK CHILD IF HE/SHE WANTS TO STOP THE INTERVIEW.
MODULE 3: SEXUAL BEHAVIOR
301 Do you know what sex is? YES = 1 NO = 2 DON’T KNOW = -8 REFUSED = -9
SKIP to 501
302 Have you ever had sex? YES = 1 NO = 2 DON’T KNOW = -8 REFUSED = -9
NEVER, DK, or REFUSED 401
NO. QUESTIONS CODING CATEGORIES SKIPS
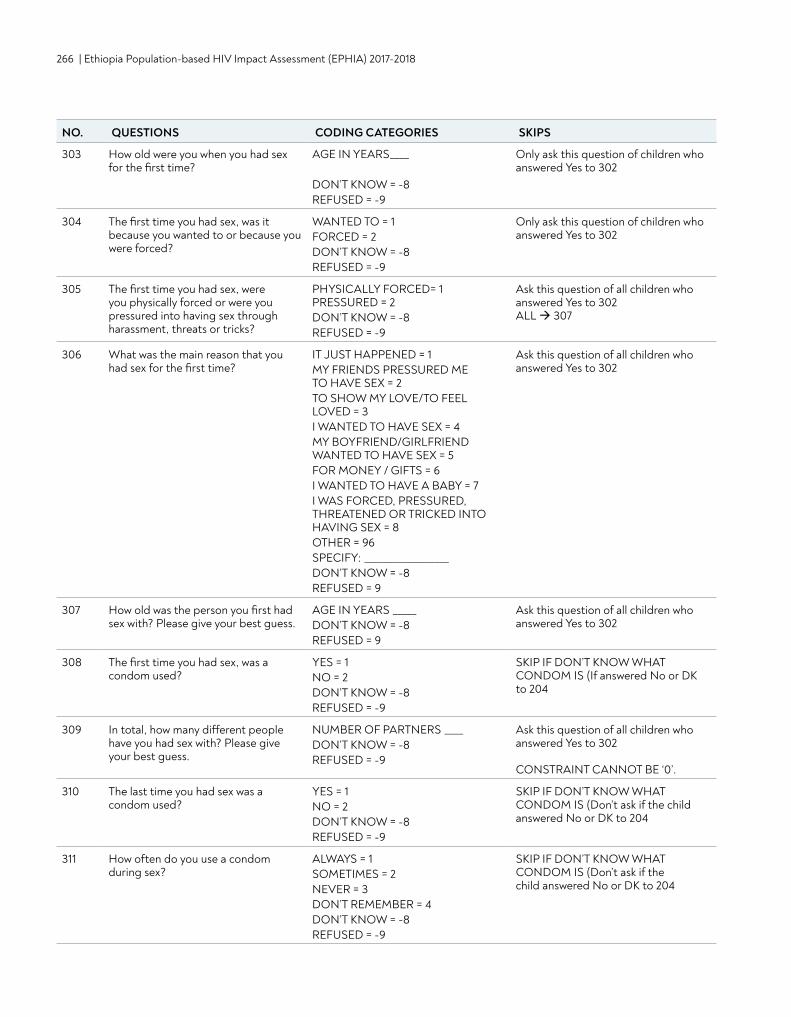
266 | Ethiopia Population-based HIV Impact Assessment (EPHIA) 2017-2018
303 How old were you when you had sex for the first time?
AGE IN YEARS____ DON’T KNOW = -8 REFUSED = -9
Only ask this question of children who answered Yes to 302
304 The first time you had sex, was it because you wanted to or because you were forced?
WANTED TO = 1 FORCED = 2 DON’T KNOW = -8 REFUSED = -9
Only ask this question of children who answered Yes to 302
305 The first time you had sex, were you physically forced or were you pressured into having sex through harassment, threats or tricks?
PHYSICALLY FORCED= 1 PRESSURED = 2 DON’T KNOW = -8 REFUSED = -9
Ask this question of all children who answered Yes to 302 ALL 307
306 What was the main reason that you had sex for the first time?
IT JUST HAPPENED = 1 MY FRIENDS PRESSURED ME TO HAVE SEX = 2 TO SHOW MY LOVE/TO FEEL LOVED = 3 I WANTED TO HAVE SEX = 4 MY BOYFRIEND/GIRLFRIEND WANTED TO HAVE SEX = 5 FOR MONEY / GIFTS = 6 I WANTED TO HAVE A BABY = 7 I WAS FORCED, PRESSURED, THREATENED OR TRICKED INTO HAVING SEX = 8 OTHER = 96 SPECIFY: __________________ DON’T KNOW = -8 REFUSED = 9
Ask this question of all children who answered Yes to 302
307 How old was the person you first had sex with? Please give your best guess.
AGE IN YEARS _____ DON’T KNOW = -8 REFUSED = 9
Ask this question of all children who answered Yes to 302
308 The first time you had sex, was a condom used?
YES = 1 NO = 2 DON’T KNOW = -8 REFUSED = -9
SKIP IF DON’T KNOW WHAT CONDOM IS (If answered No or DK to 204
309 In total, how many different people have you had sex with? Please give your best guess.
NUMBER OF PARTNERS ____DON’T KNOW = -8 REFUSED = -9
Ask this question of all children who answered Yes to 302 CONSTRAINT CANNOT BE ‘0’.
310 The last time you had sex was a condom used?
YES = 1 NO = 2 DON’T KNOW = -8 REFUSED = -9
SKIP IF DON’T KNOW WHAT CONDOM IS (Don’t ask if the child answered No or DK to 204
311 How often do you use a condom during sex?
ALWAYS = 1 SOMETIMES = 2 NEVER = 3 DON’T REMEMBER = 4 DON’T KNOW = -8 REFUSED = -9
SKIP IF DON’T KNOW WHAT CONDOM IS (Don’t ask if the child answered No or DK to 204
NO. QUESTIONS CODING CATEGORIES SKIPS
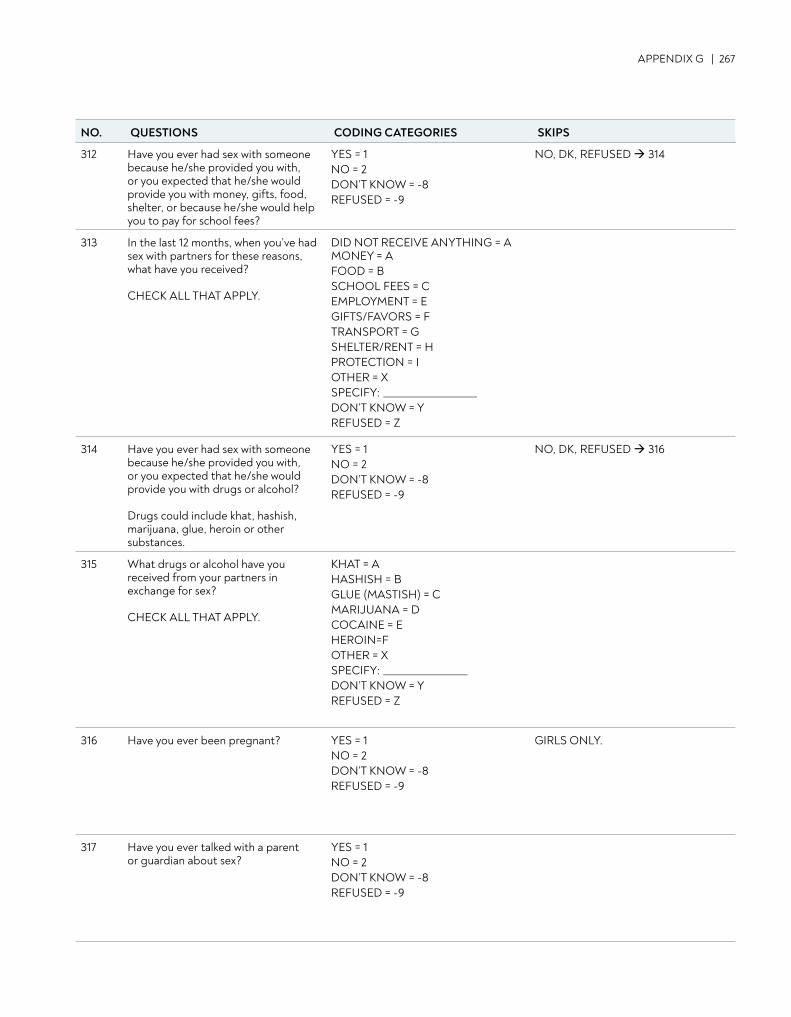
APPENDIX G | 267
312 Have you ever had sex with someone because he/she provided you with, or you expected that he/she would provide you with money, gifts, food, shelter, or because he/she would help you to pay for school fees?
YES = 1 NO = 2 DON’T KNOW = -8 REFUSED = -9
NO, DK, REFUSED 314
313 In the last 12 months, when you’ve had sex with partners for these reasons, what have you received? CHECK ALL THAT APPLY.
DID NOT RECEIVE ANYTHING = A MONEY = A FOOD = B SCHOOL FEES = CEMPLOYMENT = E GIFTS/FAVORS = F TRANSPORT = G SHELTER/RENT = H PROTECTION = I OTHER = X SPECIFY: ____________________ DON’T KNOW = YREFUSED = Z
314 Have you ever had sex with someone because he/she provided you with, or you expected that he/she would provide you with drugs or alcohol? Drugs could include khat, hashish, marijuana, glue, heroin or other substances.
YES = 1 NO = 2 DON’T KNOW = -8 REFUSED = -9
NO, DK, REFUSED 316
315 What drugs or alcohol have you received from your partners in exchange for sex? CHECK ALL THAT APPLY.
KHAT = A HASHISH = B GLUE (MASTISH) = C MARIJUANA = D COCAINE = E HEROIN=F OTHER = X SPECIFY: __________________ DON’T KNOW = Y REFUSED = Z
316 Have you ever been pregnant? YES = 1 NO = 2 DON’T KNOW = -8 REFUSED = -9
GIRLS ONLY.
317 Have you ever talked with a parent or guardian about sex?
YES = 1 NO = 2 DON’T KNOW = -8 REFUSED = -9
NO. QUESTIONS CODING CATEGORIES SKIPS
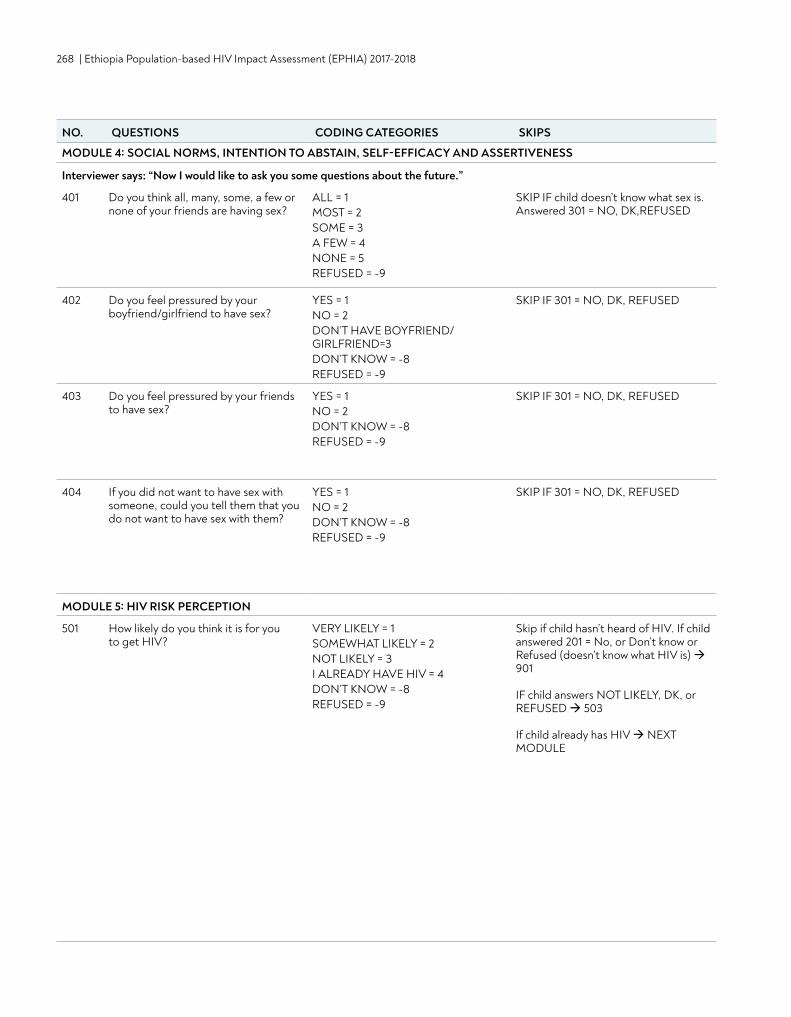
268 | Ethiopia Population-based HIV Impact Assessment (EPHIA) 2017-2018
MODULE 4: SOCIAL NORMS, INTENTION TO ABSTAIN, SELF-EFFICACY AND ASSERTIVENESS
Interviewer says: “Now I would like to ask you some questions about the future.”
401 Do you think all, many, some, a few or none of your friends are having sex?
ALL = 1 MOST = 2 SOME = 3 A FEW = 4 NONE = 5REFUSED = -9
SKIP IF child doesn’t know what sex is. Answered 301 = NO, DK,REFUSED
402 Do you feel pressured by your boyfriend/girlfriend to have sex?
YES = 1 NO = 2 DON’T HAVE BOYFRIEND/GIRLFRIEND=3 DON’T KNOW = -8 REFUSED = -9
SKIP IF 301 = NO, DK, REFUSED
403 Do you feel pressured by your friends to have sex?
YES = 1 NO = 2 DON’T KNOW = -8 REFUSED = -9
SKIP IF 301 = NO, DK, REFUSED
404 If you did not want to have sex with someone, could you tell them that you do not want to have sex with them?
YES = 1 NO = 2 DON’T KNOW = -8 REFUSED = -9
SKIP IF 301 = NO, DK, REFUSED
MODULE 5: HIV RISK PERCEPTION
501 How likely do you think it is for you to get HIV?
VERY LIKELY = 1 SOMEWHAT LIKELY = 2 NOT LIKELY = 3 I ALREADY HAVE HIV = 4 DON’T KNOW = -8 REFUSED = -9
Skip if child hasn’t heard of HIV. If child answered 201 = No, or Don’t know or Refused (doesn’t know what HIV is) 901
IF child answers NOT LIKELY, DK, or REFUSED 503 If child already has HIV NEXT MODULE
NO. QUESTIONS CODING CATEGORIES SKIPS
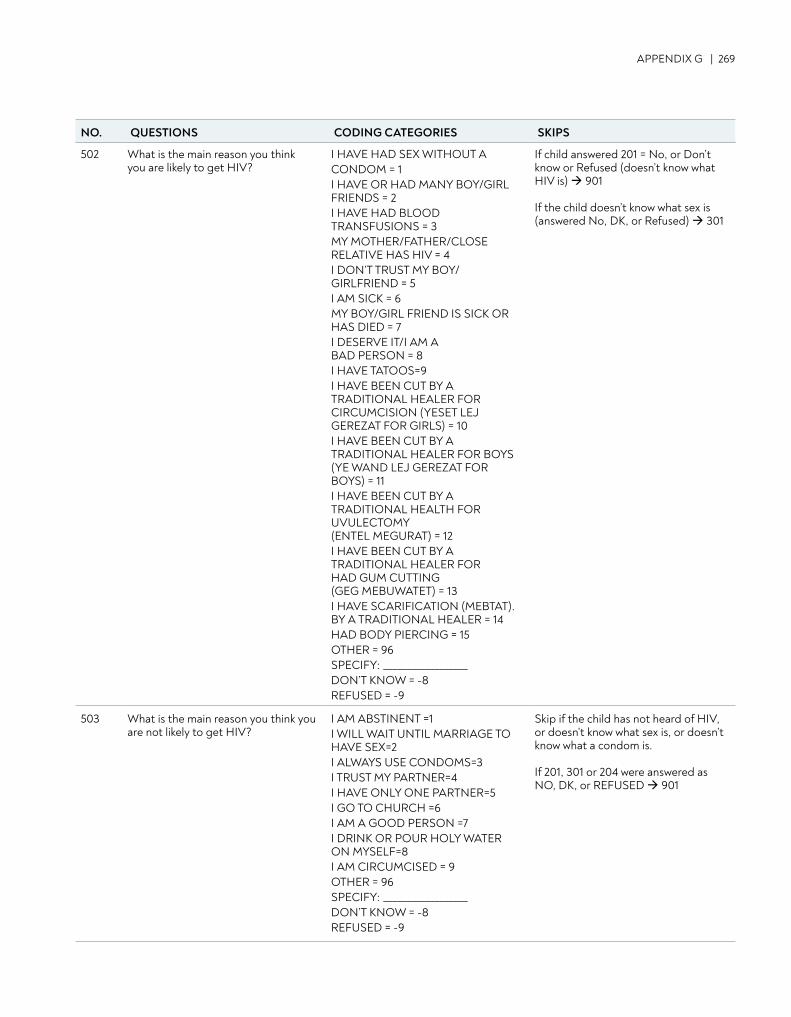
APPENDIX G | 269
502 What is the main reason you think you are likely to get HIV?
I HAVE HAD SEX WITHOUT ACONDOM = 1 I HAVE OR HAD MANY BOY/GIRL FRIENDS = 2 I HAVE HAD BLOOD TRANSFUSIONS = 3 MY MOTHER/FATHER/CLOSE RELATIVE HAS HIV = 4 I DON’T TRUST MY BOY/GIRLFRIEND = 5I AM SICK = 6 MY BOY/GIRL FRIEND IS SICK OR HAS DIED = 7 I DESERVE IT/I AM A BAD PERSON = 8 I HAVE TATOOS=9 I HAVE BEEN CUT BY A TRADITIONAL HEALER FOR CIRCUMCISION (YESET LEJ GEREZAT FOR GIRLS) = 10 I HAVE BEEN CUT BY A TRADITIONAL HEALER FOR BOYS (YE WAND LEJ GEREZAT FOR BOYS) = 11 I HAVE BEEN CUT BY A TRADITIONAL HEALTH FOR UVULECTOMY (ENTEL MEGURAT) = 12 I HAVE BEEN CUT BY A TRADITIONAL HEALER FOR HAD GUM CUTTING (GEG MEBUWATET) = 13 I HAVE SCARIFICATION (MEBTAT).BY A TRADITIONAL HEALER = 14 HAD BODY PIERCING = 15 OTHER = 96 SPECIFY: __________________ DON’T KNOW = -8 REFUSED = -9
If child answered 201 = No, or Don’t know or Refused (doesn’t know what HIV is) 901 If the child doesn’t know what sex is (answered No, DK, or Refused) 301
503 What is the main reason you think you are not likely to get HIV?
I AM ABSTINENT =1 I WILL WAIT UNTIL MARRIAGE TO HAVE SEX=2 I ALWAYS USE CONDOMS=3 I TRUST MY PARTNER=4 I HAVE ONLY ONE PARTNER=5 I GO TO CHURCH =6 I AM A GOOD PERSON =7I DRINK OR POUR HOLY WATER ON MYSELF=8 I AM CIRCUMCISED = 9 OTHER = 96 SPECIFY: __________________ DON’T KNOW = -8 REFUSED = -9
Skip if the child has not heard of HIV, or doesn’t know what sex is, or doesn’t know what a condom is.
If 201, 301 or 204 were answered as NO, DK, or REFUSED 901
NO. QUESTIONS CODING CATEGORIES SKIPS
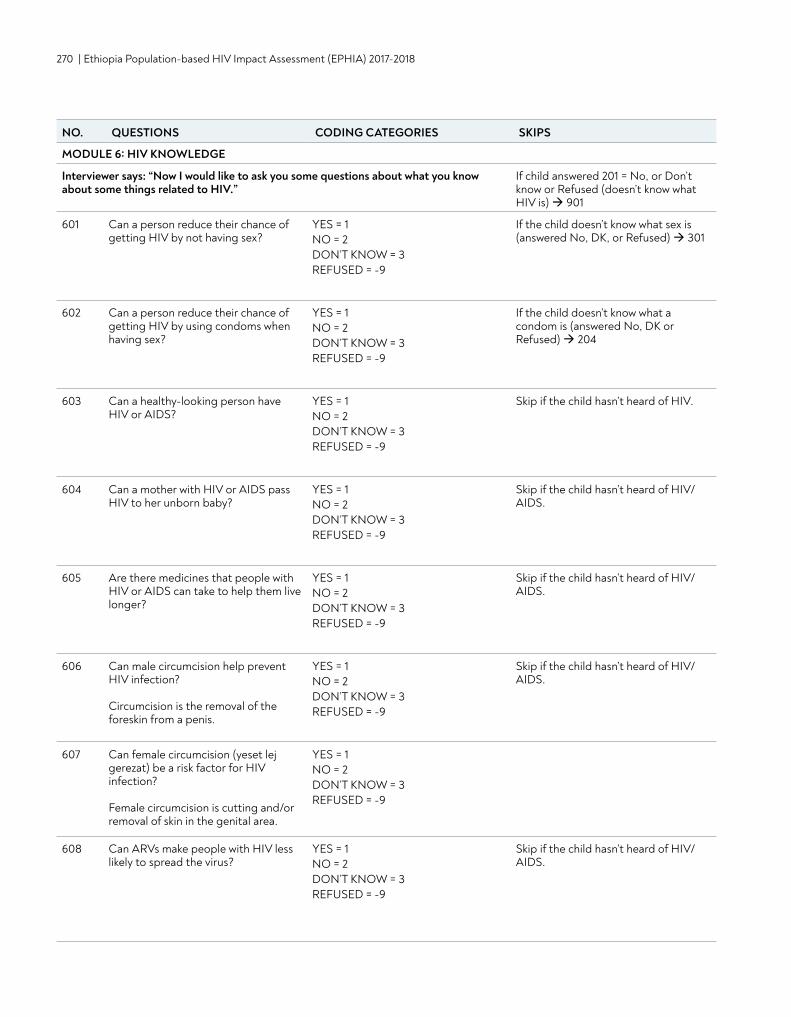
270 | Ethiopia Population-based HIV Impact Assessment (EPHIA) 2017-2018
MODULE 6: HIV KNOWLEDGE
Interviewer says: “Now I would like to ask you some questions about what you know about some things related to HIV.”
If child answered 201 = No, or Don’t know or Refused (doesn’t know what HIV is) 901
601 Can a person reduce their chance of getting HIV by not having sex?
YES = 1 NO = 2 DON’T KNOW = 3 REFUSED = -9
If the child doesn’t know what sex is (answered No, DK, or Refused) 301
602 Can a person reduce their chance of getting HIV by using condoms when having sex?
YES = 1 NO = 2 DON’T KNOW = 3 REFUSED = -9
If the child doesn’t know what a condom is (answered No, DK or Refused) 204
603 Can a healthy-looking person have HIV or AIDS?
YES = 1 NO = 2 DON’T KNOW = 3 REFUSED = -9
Skip if the child hasn’t heard of HIV.
604 Can a mother with HIV or AIDS pass HIV to her unborn baby?
YES = 1 NO = 2 DON’T KNOW = 3 REFUSED = -9
Skip if the child hasn’t heard of HIV/AIDS.
605 Are there medicines that people with HIV or AIDS can take to help them live longer?
YES = 1 NO = 2 DON’T KNOW = 3 REFUSED = -9
Skip if the child hasn’t heard of HIV/AIDS.
606 Can male circumcision help prevent HIV infection? Circumcision is the removal of the foreskin from a penis.
YES = 1 NO = 2 DON’T KNOW = 3 REFUSED = -9
Skip if the child hasn’t heard of HIV/AIDS.
607 Can female circumcision (yeset lej gerezat) be a risk factor for HIV infection? Female circumcision is cutting and/or removal of skin in the genital area.
YES = 1 NO = 2 DON’T KNOW = 3 REFUSED = -9
608 Can ARVs make people with HIV less likely to spread the virus?
YES = 1 NO = 2 DON’T KNOW = 3 REFUSED = -9
Skip if the child hasn’t heard of HIV/AIDS.
NO. QUESTIONS CODING CATEGORIES SKIPS
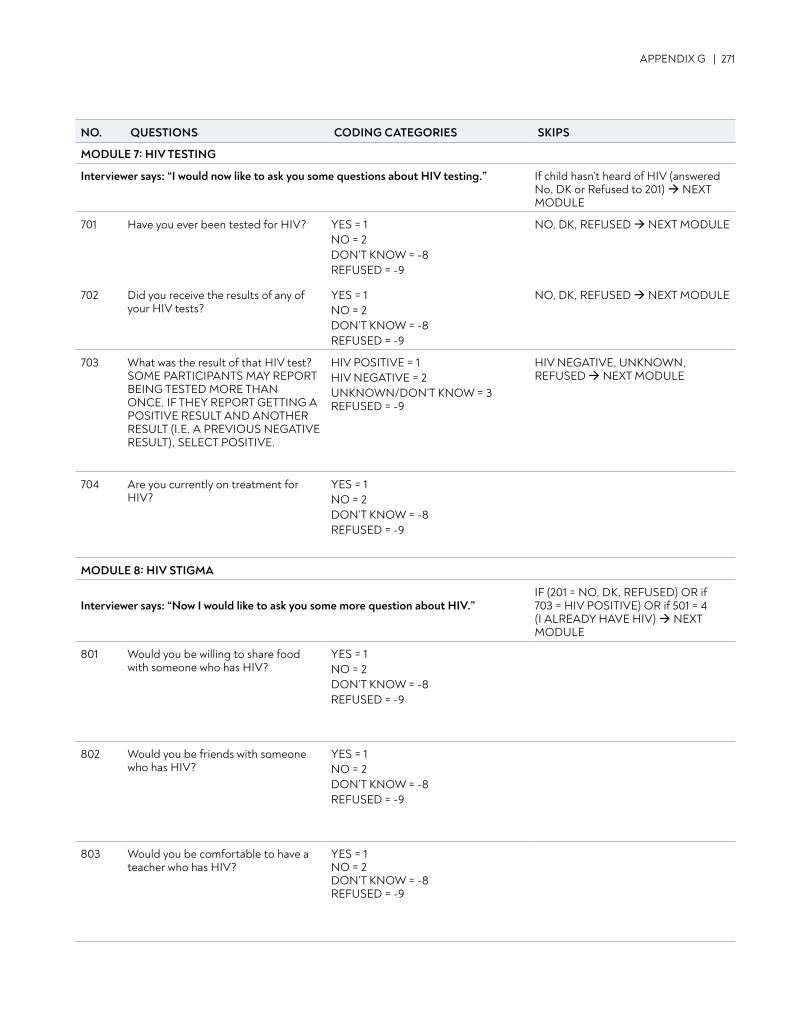
APPENDIX G | 271
MODULE 7: HIV TESTING
Interviewer says: “I would now like to ask you some questions about HIV testing.” If child hasn’t heard of HIV (answered No, DK or Refused to 201) NEXT MODULE
701 Have you ever been tested for HIV? YES = 1 NO = 2 DON’T KNOW = -8 REFUSED = -9
NO, DK, REFUSED NEXT MODULE
702 Did you receive the results of any of your HIV tests?
YES = 1 NO = 2 DON’T KNOW = -8 REFUSED = -9
NO, DK, REFUSED NEXT MODULE
703 What was the result of that HIV test? SOME PARTICIPANTS MAY REPORT BEING TESTED MORE THAN ONCE. IF THEY REPORT GETTING A POSITIVE RESULT AND ANOTHER RESULT (I.E. A PREVIOUS NEGATIVE RESULT), SELECT POSITIVE.
HIV POSITIVE = 1 HIV NEGATIVE = 2 UNKNOWN/DON’T KNOW = 3 REFUSED = -9
HIV NEGATIVE, UNKNOWN, REFUSED NEXT MODULE
704 Are you currently on treatment for HIV?
YES = 1 NO = 2 DON’T KNOW = -8REFUSED = -9
MODULE 8: HIV STIGMA
Interviewer says: “Now I would like to ask you some more question about HIV.”IF (201 = NO, DK, REFUSED) OR if 703 = HIV POSITIVE) OR if 501 = 4 (I ALREADY HAVE HIV) NEXT MODULE
801 Would you be willing to share food with someone who has HIV?
YES = 1 NO = 2 DON’T KNOW = -8 REFUSED = -9
802 Would you be friends with someone who has HIV?
YES = 1 NO = 2 DON’T KNOW = -8 REFUSED = -9
803 Would you be comfortable to have a teacher who has HIV?
YES = 1 NO = 2 DON’T KNOW = -8 REFUSED = -9
NO. QUESTIONS CODING CATEGORIES SKIPS
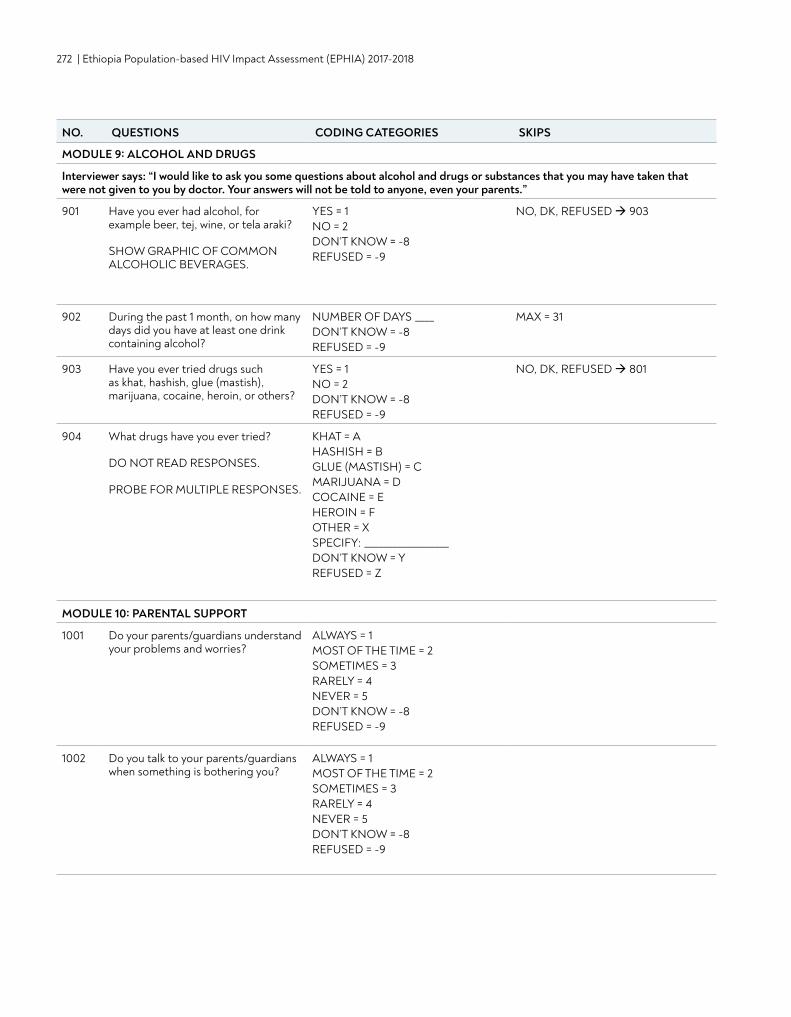
272 | Ethiopia Population-based HIV Impact Assessment (EPHIA) 2017-2018
MODULE 9: ALCOHOL AND DRUGS
Interviewer says: “I would like to ask you some questions about alcohol and drugs or substances that you may have taken that were not given to you by doctor. Your answers will not be told to anyone, even your parents.”
901 Have you ever had alcohol, for example beer, tej, wine, or tela araki? SHOW GRAPHIC OF COMMON ALCOHOLIC BEVERAGES.
YES = 1 NO = 2 DON’T KNOW = -8 REFUSED = -9
NO, DK, REFUSED 903
902 During the past 1 month, on how many days did you have at least one drink containing alcohol?
NUMBER OF DAYS ____ DON’T KNOW = -8 REFUSED = -9
MAX = 31
903 Have you ever tried drugs such as khat, hashish, glue (mastish), marijuana, cocaine, heroin, or others?
YES = 1 NO = 2 DON’T KNOW = -8 REFUSED = -9
NO, DK, REFUSED 801
904 What drugs have you ever tried? DO NOT READ RESPONSES. PROBE FOR MULTIPLE RESPONSES.
KHAT = A HASHISH = B GLUE (MASTISH) = C MARIJUANA = D COCAINE = EHEROIN = F OTHER = X SPECIFY: __________________ DON’T KNOW = Y REFUSED = Z
MODULE 10: PARENTAL SUPPORT
1001 Do your parents/guardians understand your problems and worries?
ALWAYS = 1 MOST OF THE TIME = 2 SOMETIMES = 3 RARELY = 4 NEVER = 5 DON’T KNOW = -8 REFUSED = -9
1002 Do you talk to your parents/guardians when something is bothering you?
ALWAYS = 1 MOST OF THE TIME = 2 SOMETIMES = 3 RARELY = 4 NEVER = 5 DON’T KNOW = -8 REFUSED = -9
NO. QUESTIONS CODING CATEGORIES SKIPS
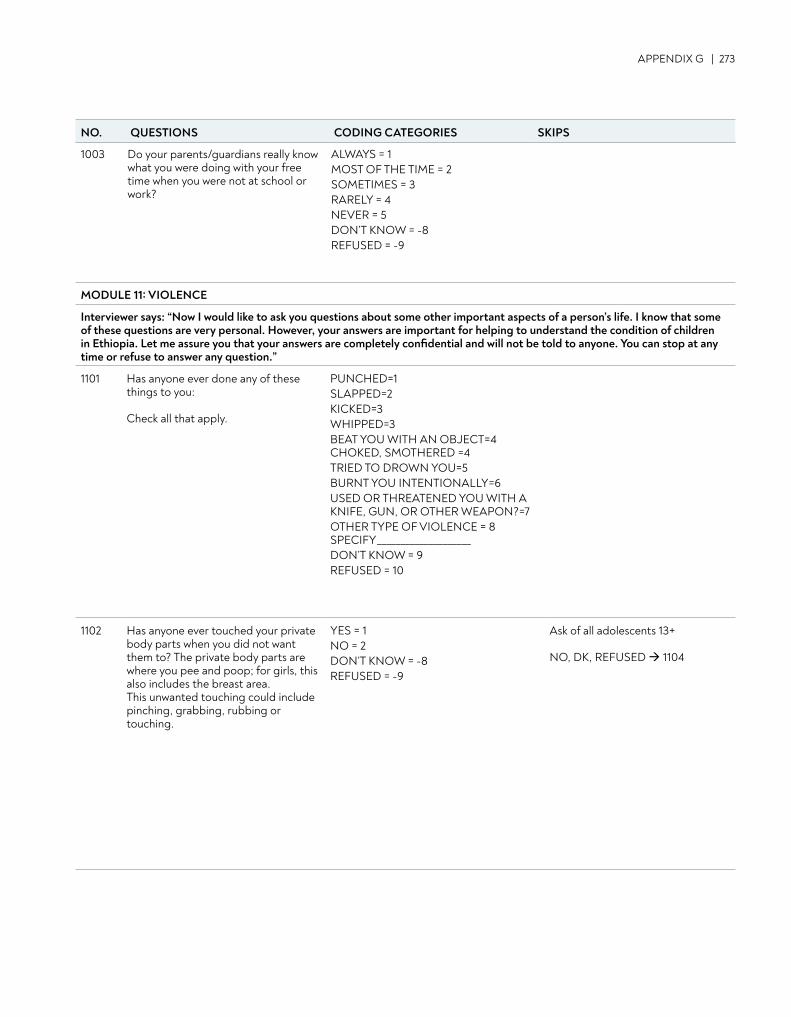
APPENDIX G | 273
1003 Do your parents/guardians really know what you were doing with your free time when you were not at school or work?
ALWAYS = 1 MOST OF THE TIME = 2 SOMETIMES = 3 RARELY = 4 NEVER = 5 DON’T KNOW = -8REFUSED = -9
MODULE 11: VIOLENCE
Interviewer says: “Now I would like to ask you questions about some other important aspects of a person’s life. I know that some of these questions are very personal. However, your answers are important for helping to understand the condition of children in Ethiopia. Let me assure you that your answers are completely confidential and will not be told to anyone. You can stop at any time or refuse to answer any question.”
1101 Has anyone ever done any of these things to you: Check all that apply.
PUNCHED=1 SLAPPED=2 KICKED=3 WHIPPED=3 BEAT YOU WITH AN OBJECT=4 CHOKED, SMOTHERED =4 TRIED TO DROWN YOU=5 BURNT YOU INTENTIONALLY=6 USED OR THREATENED YOU WITH A KNIFE, GUN, OR OTHER WEAPON?=7 OTHER TYPE OF VIOLENCE = 8 SPECIFY____________________DON’T KNOW = 9 REFUSED = 10
1102 Has anyone ever touched your private body parts when you did not want them to? The private body parts are where you pee and poop; for girls, this also includes the breast area. This unwanted touching could include pinching, grabbing, rubbing or touching.
YES = 1 NO = 2 DON’T KNOW = -8 REFUSED = -9
Ask of all adolescents 13+ NO, DK, REFUSED 1104
NO. QUESTIONS CODING CATEGORIES SKIPS
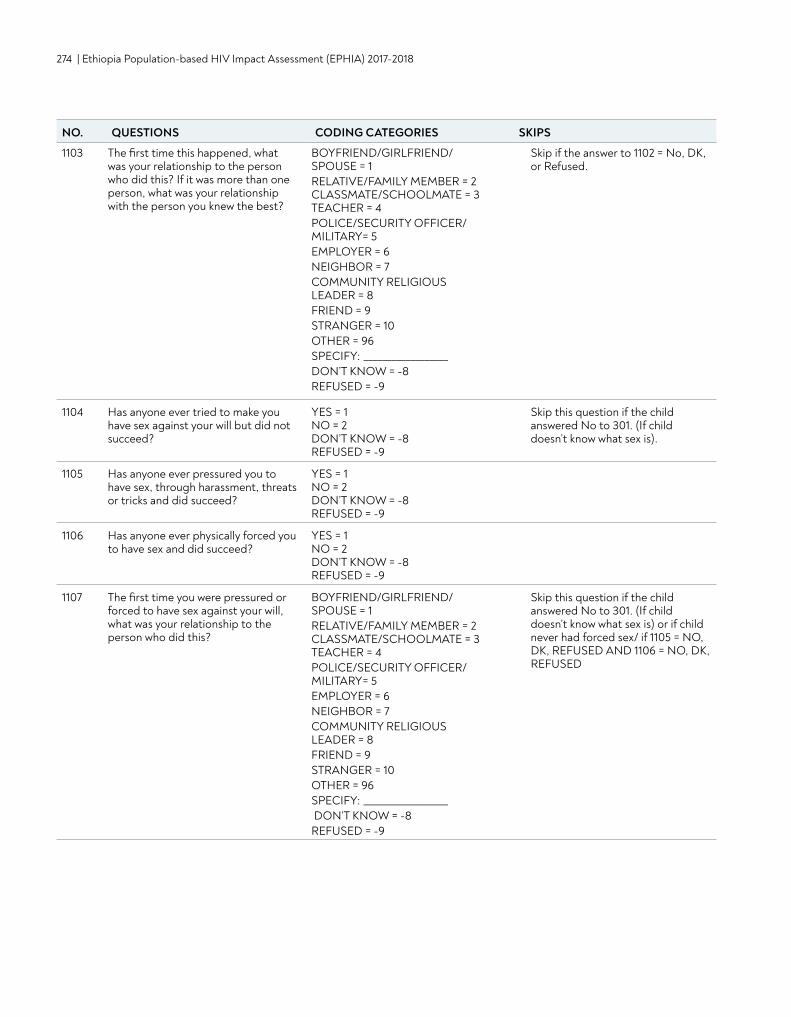
274 | Ethiopia Population-based HIV Impact Assessment (EPHIA) 2017-2018
1103 The first time this happened, what was your relationship to the person who did this? If it was more than one person, what was your relationship with the person you knew the best?
BOYFRIEND/GIRLFRIEND/ SPOUSE = 1 RELATIVE/FAMILY MEMBER = 2 CLASSMATE/SCHOOLMATE = 3 TEACHER = 4 POLICE/SECURITY OFFICER/MILITARY= 5 EMPLOYER = 6 NEIGHBOR = 7 COMMUNITY RELIGIOUS LEADER = 8 FRIEND = 9 STRANGER = 10 OTHER = 96 SPECIFY: __________________DON’T KNOW = -8 REFUSED = -9
Skip if the answer to 1102 = No, DK, or Refused.
1104 Has anyone ever tried to make you have sex against your will but did not succeed?
YES = 1 NO = 2 DON’T KNOW = -8 REFUSED = -9
Skip this question if the child answered No to 301. (If child doesn’t know what sex is).
1105 Has anyone ever pressured you to have sex, through harassment, threats or tricks and did succeed?
YES = 1 NO = 2 DON’T KNOW = -8 REFUSED = -9
1106 Has anyone ever physically forced you to have sex and did succeed?
YES = 1 NO = 2 DON’T KNOW = -8 REFUSED = -9
1107 The first time you were pressured or forced to have sex against your will, what was your relationship to the person who did this?
BOYFRIEND/GIRLFRIEND/ SPOUSE = 1 RELATIVE/FAMILY MEMBER = 2 CLASSMATE/SCHOOLMATE = 3 TEACHER = 4 POLICE/SECURITY OFFICER/MILITARY= 5 EMPLOYER = 6 NEIGHBOR = 7 COMMUNITY RELIGIOUS LEADER = 8 FRIEND = 9 STRANGER = 10 OTHER = 96 SPECIFY: __________________ DON’T KNOW = -8 REFUSED = -9
Skip this question if the child answered No to 301. (If child doesn’t know what sex is) or if child never had forced sex/ if 1105 = NO, DK, REFUSED AND 1106 = NO, DK, REFUSED
NO. QUESTIONS CODING CATEGORIES SKIPS
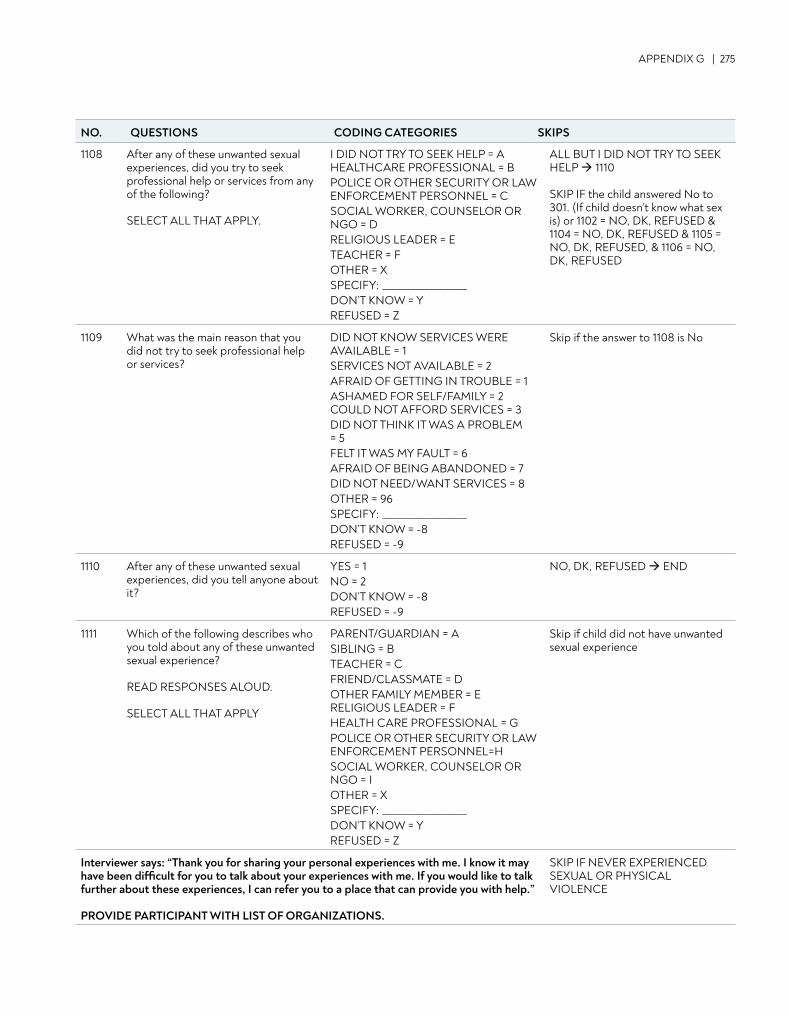
APPENDIX G | 275
1108 After any of these unwanted sexual experiences, did you try to seek professional help or services from any of the following? SELECT ALL THAT APPLY.
I DID NOT TRY TO SEEK HELP = A HEALTHCARE PROFESSIONAL = B POLICE OR OTHER SECURITY OR LAW ENFORCEMENT PERSONNEL = C SOCIAL WORKER, COUNSELOR OR NGO = D RELIGIOUS LEADER = E TEACHER = F OTHER = X SPECIFY: __________________ DON’T KNOW = Y REFUSED = Z
ALL BUT I DID NOT TRY TO SEEK HELP 1110 SKIP IF the child answered No to 301. (If child doesn’t know what sex is) or 1102 = NO, DK, REFUSED & 1104 = NO, DK, REFUSED & 1105 = NO, DK, REFUSED, & 1106 = NO, DK, REFUSED
1109 What was the main reason that you did not try to seek professional help or services?
DID NOT KNOW SERVICES WERE AVAILABLE = 1 SERVICES NOT AVAILABLE = 2 AFRAID OF GETTING IN TROUBLE = 1 ASHAMED FOR SELF/FAMILY = 2 COULD NOT AFFORD SERVICES = 3 DID NOT THINK IT WAS A PROBLEM = 5 FELT IT WAS MY FAULT = 6 AFRAID OF BEING ABANDONED = 7 DID NOT NEED/WANT SERVICES = 8 OTHER = 96 SPECIFY: __________________ DON’T KNOW = -8 REFUSED = -9
Skip if the answer to 1108 is No
1110 After any of these unwanted sexual experiences, did you tell anyone about it?
YES = 1 NO = 2 DON’T KNOW = -8 REFUSED = -9
NO, DK, REFUSED END
1111 Which of the following describes who you told about any of these unwanted sexual experience? READ RESPONSES ALOUD. SELECT ALL THAT APPLY
PARENT/GUARDIAN = A SIBLING = B TEACHER = C FRIEND/CLASSMATE = D OTHER FAMILY MEMBER = E RELIGIOUS LEADER = F HEALTH CARE PROFESSIONAL = G POLICE OR OTHER SECURITY OR LAW ENFORCEMENT PERSONNEL=H SOCIAL WORKER, COUNSELOR OR NGO = I OTHER = X SPECIFY: __________________ DON’T KNOW = Y REFUSED = Z
Skip if child did not have unwanted sexual experience
Interviewer says: “Thank you for sharing your personal experiences with me. I know it may have been difficult for you to talk about your experiences with me. If you would like to talk further about these experiences, I can refer you to a place that can provide you with help.” PROVIDE PARTICIPANT WITH LIST OF ORGANIZATIONS.
SKIP IF NEVER EXPERIENCED SEXUAL OR PHYSICAL VIOLENCE
NO. QUESTIONS CODING CATEGORIES SKIPS
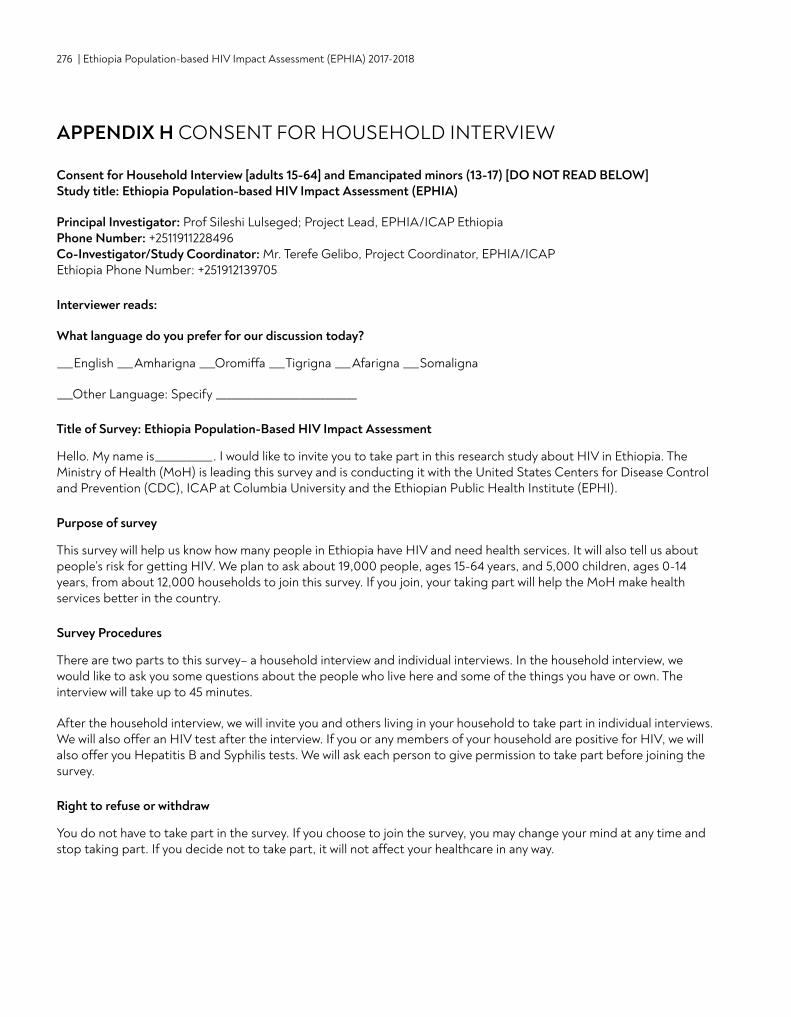
276 | Ethiopia Population-based HIV Impact Assessment (EPHIA) 2017-2018
APPENDIX H CONSENT FOR HOUSEHOLD INTERVIEW
Consent for Household Interview [adults 15-64] and Emancipated minors (13-17) [DO NOT READ BELOW] Study title: Ethiopia Population-based HIV Impact Assessment (EPHIA)
Principal Investigator: Prof Sileshi Lulseged; Project Lead, EPHIA/ICAP Ethiopia Phone Number: +2511911228496 Co-Investigator/Study Coordinator: Mr. Terefe Gelibo, Project Coordinator, EPHIA/ICAP Ethiopia Phone Number: +251912139705
Interviewer reads:
What language do you prefer for our discussion today?
___English ___Amharigna ___Oromiffa ___Tigrigna ___Afarigna ___Somaligna
___Other Language: Specify ___________________________
Title of Survey: Ethiopia Population-Based HIV Impact Assessment
Hello. My name is___________. I would like to invite you to take part in this research study about HIV in Ethiopia. The Ministry of Health (MoH) is leading this survey and is conducting it with the United States Centers for Disease Control and Prevention (CDC), ICAP at Columbia University and the Ethiopian Public Health Institute (EPHI).
Purpose of survey
This survey will help us know how many people in Ethiopia have HIV and need health services. It will also tell us about people’s risk for getting HIV. We plan to ask about 19,000 people, ages 15-64 years, and 5,000 children, ages 0-14 years, from about 12,000 households to join this survey. If you join, your taking part will help the MoH make health services better in the country.
Survey Procedures
There are two parts to this survey– a household interview and individual interviews. In the household interview, we would like to ask you some questions about the people who live here and some of the things you have or own. The interview will take up to 45 minutes.
After the household interview, we will invite you and others living in your household to take part in individual interviews. We will also offer an HIV test after the interview. If you or any members of your household are positive for HIV, we will also offer you Hepatitis B and Syphilis tests. We will ask each person to give permission to take part before joining the survey.
Right to refuse or withdraw
You do not have to take part in the survey. If you choose to join the survey, you may change your mind at any time and stop taking part. If you decide not to take part, it will not affect your healthcare in any way.
APPENDIX H | 277
Risks and Benefits
The risks to taking part in the household interview are small. You may feel uncomfortable about some of the questions we will ask. You can refuse to answer any question. Maximum effort will be made to keep your information private. If you take part, you and your household members will get free testing for HIVin your own home. If you or any members of your household are positive for HIV, you may also receive free testing for Hepatitis B and Syphilis in your own home. The information you provide will also be used to improve the health of Ethiopia. Your responses will help us develop more effective programs to fight HIV and other diseases in Ethiopia.
There is no cost to you for being part of the survey. You will not be paid.
Confidentiality and Access to Your Health Information
What we talk about will be kept private, even from your family, and will not be shown to anyone outside of the survey team. Your answers to the questions will be identified only by a number and not your name. Your name or any other identifying information will not appear on any survey results that we share with the MoH, the public or in data analysis. The information we collect during the survey will not be released outside of the survey groups listed unless there is an issue of safety.
[DO NOT READ ALOUD]
The following individuals and/or agencies will be able to look at your interview records to help oversee the conduct of this survey:
• Staff members from the Institutional Review Boards or Ethics Committees overseeing the conduct of this survey to ensure that we are protecting your rights as a person taking part. These include CDC, Columbia University, Westat (a statistical survey research organization, EPHI IRB and the National Research Ethics Review Committee (NRERC) of Ethiopia
• The U.S. Office of Human Research Protections and other government agencies that oversee the safety of human subjects to ensure we are protecting your rights as a person taking part in this survey
• Study staff and study monitors
Your permission to allow us to use and share your information with the groups above will expire five years after the end of the survey. If you want to leave the study, have any questions about the survey, or feel that you have been harmed by taking part, you should contact:
Yimam GetanehAddress: Ethiopian Public Health Institute, PO Box 1242, Addis Ababa, Ethiopia. Office Phone: +251 112788058; Mobile Phone: Tel: +251 912 002053; Fax: 25112758634. E-mail: [email protected]
If you have any questions about your rights as a person taking part in this survey, you can contact:
Dr. Getachew Addis Address: EPHI Scientific and Ethics Review Office, P.O Box 1242, Addis Ababa, Ethiopia Office Phone: +251-118-685503/15; Mobile Phone: +251 944123110 E-mail: [email protected];
Mr. Yohannes Sitotaw Address: National Research Ethics Review Committee, P.O Box 2490, Addis Ababa, Ethiopia Office Phone: +251011-4-674353; Mobile Phone: +251 913906779 E-mail: [email protected]; Fax: +251-011-4-660241
278 | Ethiopia Population-based HIV Impact Assessment (EPHIA) 2017-2018
Do you want to ask me anything about the survey?
Consent Statement
Any questions that I had have been answered satisfactorily.. I have been offered a copy of this consent form.
Do you agree to do the household interview? ‘YES’ means that you agree to do the interview. ‘NO’ means that you will NOT do the interview.
______Yes ______No
Head of household signature or mark________________________________ Date: ___/___/___
Printed name of head of household_________________________________
Household ID number ____________________________
[For illiterate participants]
Signature of witness______________________________________________ Date: ___/___/___
Printed name of witness__________________________________________
Signature of person obtaining consent________________________________ Date: ___/___/___
Printed name of person obtaining consent_____________________________
Survey staff ID number _________________________________
APPENDIX H | 279
Adult (18 years and older) and Emancipated Minors (13-17 years); individual consent for interview and blood testing
Interviewer reads:
Hello. My name is ___________. I would like to invite you to take part in this survey about HIV in Ethiopia. The Government of Ethiopia is leading this survey in partnership with the United States Centers for Disease Control and Prevention and ICAP at Columbia University.
What language do you prefer for our discussion today?
English ____, Amharigna ____, Oromiffa ___, Tigrigna ____, Afarigna ____, Somaligna ____.
Title of Survey: This survey is called the Ethiopia Population Based Impact Assessment (EPHIA, 2017)
Purpose of the survey
This survey will help us to know how many people in Ethiopia are living with HIV and need health services. It will also tell us about people’s risk for HIV and who has been infected recently. We will approach about 25,000 men, women, and children from about 12,000 households throughout the urban areas of Ethiopia to take part in this survey. We would like to invite you to join the survey too, even if you already know your HIV status. Your taking part will help the Ministry of Health make health services better in the country.
This form might have some words in it that are not familiar to you. Please ask me to explain anything that you do not understand.
Survey Procedures
If you join this survey, we will ask you questions and your answers will be kept between us. The questions will be about your age, what kind of work you do, whether you have had any experience with health services, and your social and sexual behavior. The interview will take about 45 minutes.
The information is collected on this tablet. The information is stored securely and can only be accessed by selected survey staff. The interview will take place in private here in your house or an area around your house.
Survey procedures also include blood draw, an HIV test and storage of that blood for future testing if you agree to this. The testing and counseling will take about 45 minutes. You may agree to the interview without agreeing to give your blood.
If you agree to the testing, a survey staff member who has been trained to draw blood will take about 14 milliliters (less than 1 tablespoon) of blood from your arm into two tubes. If it is not possible to take blood from your arm, then we will try to take a few drops of blood from your finger. We will give you the results of your HIV test, and provide counseling on the same day.
280 | Ethiopia Population-based HIV Impact Assessment (EPHIA) 2017-2018
For adults who test positive for HIV and some randomly selected adults without HIV, we will measure the amount of CD4 cells in your blood. CD4 cells help your body fight HIV infection and other diseases. If you are HIV positive, we will give you a referral form and information so that you can consult with a doctor or nurse to learn more about the test result and your health.
For adults who test positive for HIV, we may also offer Hepatitis B and Syphilis tests. Like HIV, Hepatitis B and Syphilis are infections that can cause very serious illnesses if left untreated. We will give you the results of your Hepatitis B and Syphilis tests and provide counseling about the results on the same day as the test. If you are positive for Hepatitis B and/or Syphilis, we will give you a referral form and information so that you can consult with a doctor or nurse to learn more about the test result and where you can access treatment and care.
If you test positive for HIV, we will send your blood to a laboratory to measure your viral load. Viral load is the amount of HIV in your blood. The results will be sent to a health facility of your choosing in about 8-12 weeks from now. You will be able to talk to a nurse or doctor at that facility about your viral load. Some of your blood will be sent to a laboratory out of the country for some additional tests related to HIV because there are no laboratories in Ethiopia that can do the tests. If we have test results that might help guide your treatment, and if you have given us your contact information, we will contact you to tell you how you and your doctor or nurse may get these results.
Additionally we will ask you to take part in possible future research if you want to. If you agree, your contact information will be retained by approved researchers and you may be contacted for a period of up to 5 years and invited to take part in future research, if you still want to. If you do not agree to take part in future research you can still continue to take part in the research today.
We would also like your consent to store your leftover blood for future research tests. These tests may be about HIV, or other health issues important for the health of people living in Ethiopia. This sample will be stored for 5- 10 years. The sample will not have your name on it and so we will not be able to tell you the results of the future research tests. Your leftover blood will not be sold or used for commercial reasons. If you do not agree to long- term storage of your blood samples, you can still take part in the survey today and we will destroy your blood samples after survey-related testing has been completed.
Conditions of the study: Taking part in the survey is voluntary and you will not be given money or gifts for your taking part. You can leave the survey at any time for any reason. If you decide to leave the survey, no more information will be collected from you. However, we will not be able to take back the information that has already been collected and used within the survey.
Costs for being in the survey: There is no cost to you for being in the survey, apart from your time.
Use of survey findings
The overall survey findings, which will not contain any personal information that would identify you, will be shared with the Government of the Kingdom of Ethiopia and the Ministry of Health. This information will be used to improve the health care for the people of Ethiopia. Finally, the findings will be shared with international partners to assist in the delivery of health services all over the world.
Right to refuse or withdraw
You do not have to take part in the survey interview or give blood and you are free to change your mind even after you have started the interview and/or the blood draw. If some of the questions make you feel uncomfortable you may decide not to answer or you may skip them and move to the next question. You may agree to let us test your blood for HIV, CD4 counts, and other lab testing but not agree to have your blood stored for future research tests. Your taking part is voluntary. If you decide not to take part, it will not affect your healthcare in any way.
APPENDIX H | 281
Risks
The risks involved with taking part in the survey are small. Maximum effort will be made to keep your information private. You may feel uncomfortable about some of the questions we will ask. You can refuse to answer any question.
The risks to you from having your blood drawn are very small. They include brief pain from the needle stick, bruising, lightheadedness, bleeding and rarely, infection where the needle enters the skin. The survey staff member who will take your blood has received training on how to draw blood. If you experience any discomfort or any of the symptoms mentioned above, please let us know, and especially if there is any bleeding or swelling.
Learning that you have HIV may cause some emotional distress. You will receive counseling on how to cope with learning that you have HIV. If you test HIV positive, we will help you identify where to go and explain the options available for care and treatment. Care and treatment is available at government facilities free of charge.
Benefits
The main benefit for you to be in the survey is the chance to learn more about your health today. Some people who take part will test HIV positive. If you test HIV positive, the benefit is that you will learn your HIV-positive status and where to go for HIV services. HIV care and treatment provided by the Ministry of Health is free. If you already know you have HIV and are not on treatment, you will get information to help your doctor or nurse determine if you are ready to start treatment. If you already know that you are HIV positive and you are on HIV treatment, the CD4 and viral load tests can help your nurse or doctor judge how well your treatment is working. If you test HIV negative, you will learn about what you can do to stay HIV negative. Your taking part in this research could help us learn more about HIV in Ethiopia. It can also help us learn about how HIV prevention and treatment programs are working in the country. Your taking part is important, and you are invited to participate even if you already know that you are HIV negative or positive.
Confidentiality
We will do everything we can to keep your taking part in the survey and your answers private. The information we collect from you will be identified by a number and not by your name. The information entered into the tablet will be identified only by the number. Your name will not appear when we share survey results. Only survey staff will have access to the data during the survey.
The following individuals and/or agencies will be able to look at your interview records to help oversee the conduct of this survey:
• Staff members from the Institutional Review Boards or Ethics Committees which oversee the conduct of this survey to ensure that we are protecting your rights as a person taking part, the staff members include:
• EPHI• The Centers for Disease Control and Prevention (CDC; Atlanta, USA) • Columbia University Medical Center• Westat (a statistical survey research organization).
• The U.S. Office of Human Research Protections may examine the study records to ensure we are protecting your rights as a person taking part in this survey.
• Selected survey staff and survey monitors.
282 | Ethiopia Population-based HIV Impact Assessment (EPHIA) 2017-2018
This survey has received approval from EPHI, The Centers for Disease Control and Prevention, and the Institutional Review Boards of Columbia University Medical Center, and of Westat.
The information we collect during the survey will not be released outside of the survey groups listed above unless there is an issue of safety. Your permission to allow us to use and share your name and contact information with the groups above will expire five years after the end of the survey. You can leave the survey at any time for any reason. If you want to leave the survey or if you have any questions about the survey or feel that you have been harmed by taking part, you can contact:
Dr. Desta Kassa Address: Ethiopian Public Health Institute, PO Box 1242, Addis Ababa, Ethiopia. Office Phone: +251 112788058; Mobile Phone: Tel : +251 911 479212; Fax: 25112758634. E-mail: [email protected]
If you have any questions about your rights as a person taking part in this survey you can contact:
Dr. Getachew Addis Address: EPHI Scientific and Ethics Review Office, P.O Box 1242, Addis Ababa, Ethiopia Office Phone: +251-118-685503/15; Mobile Phone: +251 944123110 E-mail: [email protected];
Mr. Yohannes Sitotaw Address: National Research Ethics Review Committee, P.O Box 2490, Addis Ababa, Ethiopia Office Phone: +251011-4-674353; Mobile Phone: +251 913906779 E-mail: [email protected]; Fax: +251-011-4-660241
Do you want to ask me anything about the survey?
Consent Statement
I have read this form or someone has read it to me. I was encouraged to ask questions and given time to ask questions. Any questions that I had were answered satisfactorily. I agree to be in this survey. I know that after choosing to be in this survey, I may withdraw at any time. My taking part is voluntary. I have been offered a copy of this consent form.
Make your initial or mark if you agree to take part in the survey interview, ‘YES’ means that you agree to participate in the survey interview. ‘NO’ means that you will NOT take part in the survey interview.
______Yes ______No (If “Yes” proceed to the next question)
Make your initial or mark if you agree to give blood for testing, ‘YES’ means that you agree to give blood for testing. ‘NO’ means that you will NOT give blood for testing.
______Yes ______No (If “Yes” proceed to the next question)
Make your initial or mark if you agree to be contacted for future research, ‘YES’ means that you agree to be contacted for future research. ‘NO’ means that you won’t be contacted for future research. ______Yes ______No
Make your initial or mark if you agree to have your leftover blood stored, ‘YES’ means that you agree to have these blood samples stored. ‘NO’ means that these blood samples will NOT be stored. ______Yes ______No
APPENDIX H | 283
[Tablet summary statement]
To confirm, you have agreed to <INSERT ALL OPTIONS MARKED YES: INTERVIEW, BLOOD TESTING, FUTURE RESEARCH, BLOOD STORAGE>, is this correct? ______Yes ______No
Participant signature or mark_______________________________________ Date: ___/___/___
Printed name of participant________________________________________
[For participants who cannot read and/or write]
Signature of witness______________________________________________ Date: ___/___/___
Printed name of witness___________________________________________
Signature of person obtaining consent________________________________ Date: ___/___/___
Printed name of person obtaining consent_____________________________
Survey staff EPHIA ID number _________________________________
284 | Ethiopia Population-based HIV Impact Assessment (EPHIA) 2017-2018
Parental permission/consent from adult parent/guardian to interview participants 12-17 years and conduct blood testing on participants 0-17 years Participation duration: 45 min Anticipated number of research participants at this site: 24,846 Sponsor/Supporter: PEPFAR Award #1U2GGH001226
Principal Investigator: Prof Sileshi Lulseged; Project Lead, EPHIA/ICAP Ethiopia Phone Number: +2511911228496 Co-Investigator/Study Coordinator: Mr. Terefe Gelibo, Project Coordinator, EPHIA/ICAP Ethiopia Phone Number: +251912139705
Interviewer reads:
Hello. My name is ___________. I would like to invite you to take part in this survey about HIV in Ethiopia. The Govern-ment of Ethiopia is leading this survey in partnership with the United States Centers for Disease Control and Preven-tion and ICAP at Columbia University.
Study title: Ethiopia Population-based HIV Impact Assessment (EPHIA)
Purpose of the survey
HIV is the virus that causes AIDS. AIDS is a very serious illness. This study will help us know how many people in Ethiopia have HIV and need health services. It will also tell us about people’s risk for getting HIV. This survey will also help us learn more about the health of children in Ethiopia. We plan to ask about 5,000 children like your son/daughter to join this survey. We would like to invite him/her to join the survey too, even if his/her HIV status is already known. His/her taking part will help the Ministry of Health (MoH) make health services better in the country.
Now I would like to ask you to let your child take part in the survey. Your child’s taking part will help the MoH make HIV services for children and families better.
Survey Procedures
[For children ages <18 months old]
We would like to test your child for HIV. We are doing this for all children in the survey regardless of their parent or guardian’s HIV status. A nurse, who has been trained to draw blood, will take about 5 to 10 drops of blood from your child’s heel into a small tube. The blood will be used to perform a test here today to assess whether your child has been exposed to HIV. We will also place a few drops of blood onto a card which will be sent to the National Laboratory at Ethiopia Public Health Institute (EPHI).
The body makes antibodies to fight HIV. Antibodies from a mother with HIV can enter the baby’s blood during preg-nancy. The test we perform on your child today will let us know if your child has been exposed to HIV. If it is positive, it does not mean your child has the virus in his/her blood. It just confirms that he/she has been exposed to HIV. We will need to send your child’s blood to a lab at EPHI for a special test for children younger than 18 months old, to confirm if he/she has HIV. . If you provide us with the name of a health facility, we can send the result there in about 8 weeks if the result is positive and 10 weeks if the result is negative. We will also contact you to inform you that the results have been sent to the facility, if you provide us with your contact information. You will be able to talk to a doctor or nurse at the facility about the test result.
For all children who test positive for HIV and some randomly selected children without HIV, we will also test the amount of CD4 cells in his/her blood and give you the result on the same day as the test. CD4 cells are the part of your immune
APPENDIX H | 285
system that fights HIV infection and other diseases. We will give you a referral form and information so that your child can consult with a doctor or nurse to learn more about his/her HIV test, CD4 counts, and health.
If your child tests positive for HIV, we will also send his/her blood to a laboratory for more tests. One of these tests will be to measure his/her viral load. Viral load is the amount of HIV in the blood. If you provide us with the name of a health facility, we can send your child’s viral load results there in about 10-12 weeks from now. Some of your child’s blood will be sent to a laboratory out of the country for some additional tests related to HIV because there are no lab-oratories in Ethiopia that can do the tests. If we have test results that might guide your child’s care or treatment, we will contact you to tell you how you and your child’s doctor or nurse may get these results.
We would like to ask your consent to store your child’s leftover blood for future research tests. These tests may be about HIV or other health issues important for the health of people living in Ethiopia. This sample will be stored for 5-10 years. The sample will not have your child’s name on it and so we will not be able to tell you the results of the future re-search tests. Your child’s leftover blood samples will not be sold or used for commercial reasons. If you do not agree to long-term storage of your child’s blood samples, your child can still take part in the survey. We will destroy your child’s blood samples after survey-related testing has been completed.
[For children ages 18 months – 23 months old]
We would like to test your child for HIV. We are doing this for all children in the survey regardless of their parent or guardian’s HIV status. A survey staff member, who has been trained to draw blood, will take about 5 to 10 drops of blood from your child’s heel into a small tube and perform an HIV test here in your home. We will give you the results and provide counseling about the results on the same day as the test. We will also discuss with you how to share the results with your child if you decide to discuss the results with him/her. The entire testing and counseling session will take about 45 minutes.
For all children who test positive for HIV and some randomly selected children without HIV, we will also test the amount of CD4 cells in his/her blood and give you the result on the same day as the test. CD4 cells are the part of your immune system that fights HIV infection and other diseases. We will give you a referral form and information so that your child can consult with a doctor or nurse to learn more about his/her HIV test, CD4 counts, and health.
We will also send his/her blood to a laboratory for more tests. One of these tests will be to measure his/her viral load. Viral load is the amount of HIV in the blood. If you provide us with the name of a health facility, we can send your child’s viral load results there in about 10-12weeks from now. Some of your child’s blood will be sent to a laboratory out of the country for some additional tests related to HIV because there are no laboratories in Ethiopia that can do the tests. If we have test results that might guide your child’s care or treatment, we will contact you to tell you how you and your child’s doctor or nurse may get these results.
We would like to ask your consent to store your child’s leftover blood for future research tests. These tests may be about HIV or other health issues important for the health of people living in Ethiopia. This sample will be stored for 5-10 years. The sample will not have your child’s name on it and so we will not be able to tell you the results of the future re-search tests. Your child’s leftover blood samples will not be sold or used for commercial reasons. If you do not agree to long-term storage of your child’s blood samples, your child can still take part in the survey. We will destroy your child’s blood samples after survey-related testing has been completed.
286 | Ethiopia Population-based HIV Impact Assessment (EPHIA) 2017-2018
[For children ages 24 months -11 years old]
We would like to test your child for HIV. We are doing this for all children in the survey regardless of their parent or guardian’s HIV status. A survey staff member, who has been trained to draw blood, will take about 6 milliliters of blood (a little over a teaspoonful) from your child’s arm into two tubes and perform an HIV test here in your home. If it is not possible to take blood from your child’s arm, then we will take a few drops of blood from your child’s finger and then perform the HIV test here in your home. We will give you the results and provide counseling about the results on the same day as the test. We will also discuss with you how to share the results with your child if you decide to discuss the results with him/her. If you would like, we can discuss the test results together with your child. The entire testing and counseling session will take about 45 minutes.
For all children who test positive for HIV and some randomly selected children without HIV, we will also test the amount of CD4 cells in his/her blood and give you the result on the same day as the test. CD4 cells are the part of your immune system that fights HIV infection and other diseases. We will give you a referral form and information so that your child can consult with a doctor or nurse to learn more about his/her HIV test, CD4 counts, and health.
We will also send his/her blood to a laboratory for more tests. One of these tests will be to measure his/her viral load. Viral load is the amount of HIV in the blood. If you provide us with the name of a health facility, we can send your child’s viral load results there in about 10-12weeks from now. Some of your child’s blood may be sent to a laboratory out of the country for some additional tests related to HIV because there are no laboratories in Ethiopia that can do the tests. If we have test results that might guide your child’s care or treatment, we will contact you to tell you how you and your child’s doctor or nurse may get these results.
We would like to ask your consent to store your child’s leftover blood for future research tests. These tests may be about HIV, or other health issues important for the health of people living in Ethiopia. This sample will be stored for at least 10 years. The sample will not have your child’s name on it and so we will not be able to tell you the results of the future research tests. Your child’s leftover blood samples will not be sold or used for commercial reasons. If you do not agree to long term storage of your child’s blood samples, your child can still take part in the survey. We will destroy your child’s blood samples after survey-related testing has been completed.
[For children ages 12-14 years old]
If both you and your child agree for him/her to join the survey, we will ask your child some questions. The interview will be conducted in private with only the child and a survey staff member. The interview will include questions about education, HIV prevention and treatment, social behavior, and his/her experiences in the household. It will take about 45 minutes.
We would like to test your child for HIV. We are doing this for all children in the survey, whether they are sexually active or not. We will test all children regardless of their parent or guardian’s HIV status. A survey staff member, who has been trained to draw blood, will take about 6 milliliters of blood (a little over a teaspoonful) from your child’s arm into two tubes and perform an HIV test here in your home. If it is not possible to take blood from your child’s arm, then we will try to take a few drops of blood from your child’s finger and then perform the HIV test here in your home. We will give you the results and provide counseling about the results on the same day as the test. We will also discuss with you how to share the results with your child if you decide to discuss the results with him/her. If you would like, we can discuss the test results together with your child. The entire testing and counseling session will take about 45 minutes.
For all children who test positive for HIV and some randomly selected children without HIV, we will also test the amount of CD4 cells in his/her blood and give you the result on the same day as the test. CD4 cells are the part of your immune system that fights HIV infection and other diseases. We will give you a referral form and information so that your child can consult with a doctor or nurse to learn more about his/her HIV test, CD4 counts, and health.
We will also send his/her blood to a laboratory for other tests. One of these tests will be to measure his/her viral load.
APPENDIX H | 287
Viral load is the amount of HIV in the blood. If you provide us with the name of a health facility, we can send your child’s viral load results there in about 10-12 weeks from now. Some of your child’s blood may be sent to a laboratory out of the country for some additional tests related to HIV because there are no laboratories in Ethiopia that can do the tests. If we have test results that might guide your child’s care or treatment, we will contact you to tell you how you and your child’s doctor or nurse may get these results.
We would like to ask your consent to store your child’s leftover blood for future research tests. These tests may be about HIV, or other health issues important for the health of people living in Ethiopia. This sample will be stored for 5-10 years. The sample will not have your child’s name on it and so we will not be able to tell you the results of the future research tests. Your child’s leftover blood samples will not be sold or used for commercial reasons. If you do not agree to long term storage of your child’s blood samples, your child can still take part in the survey. We will destroy your child’s blood samples after survey-related testing has been completed.
Additionally we would like to ask your consent for your child to take part in possible future research if you want to. If you agree, your child’s contact information will be retained by approved researchers and you may be contacted for a period of up to 5 years and invited to take part in future research, if you still want to. If you do not agree to take part in future research you can still continue to take part in the research today.
[Children 15-17 years old]
If both you and your child agree for him/her to join the survey, we will ask your child some questions. The interview will be conducted in private with only the child and a survey staff member. The interview questions will be the same as the ones that we ask adults who agree to take part in the survey. The questions will be about what kind of work they do, whether they have had any experience with health services, and their social and sexual behaviors. It will take about 45 minutes.
We would like to test your child for HIV. We are doing this for all children in the survey, whether they are sexually active or not. We will test all children regardless of their parent or guardian’s HIV status. A survey staff member, who has been trained to draw blood, will take about 14 milliliters of blood (less than 1 tablespoonful) from your child’s arm into two tubes and perform an HIV test here in your home. If it is not possible to take blood from your child’s arm, then we will try to take a few drops of blood from your child’s finger and then perform the HIV test here in your home. We will give the results to your child and provide counseling about the results on the same day as the test. We will also discuss with him/her how to share the results with you if he/she decides to discuss the results with you. The entire testing and coun-seling session will take about 45 minutes.
For all children who test positive for HIV and some randomly selected children without HIV, we will also test the amount of CD4 cells in his/her blood and give your child the result on the same day as the test. CD4 cells are the part of his/her immune system that fights HIV infection and other diseases. We will give him/her a referral form and information so that he/she can consult with a doctor or nurse to learn more about his/her HIV test, CD4 counts, and health.
Children ages 15-17 who test positive for HIV we will also be tested for Hepatitis B and Syphilis infections. Like HIV, Hepatitis B and Syphilis are infections that can cause very serious illnesses if left untreated. We will give the Hepatitis B and Syphilis test results to your child and provide counseling about the results on the same day as the test. We will also discuss with him/her how to share the results with you if he/she decides to discuss the results with you. We will give him/her a referral form and information so that he/she can consult with a doctor or nurse to learn more about his/her Syphilis or Hepatitis B test.
We will also send his/her blood to a laboratory for additional tests. One of these tests is to measure his/her viral load. Viral load is the amount of HIV in the blood. If he/she provides us with the name of a health facility, we can send his/her viral load results there in about 8-10 weeks from now. Some of your child’s blood will be sent to a laboratory out of the country for some additional tests related to HIV because there are no laboratories in Ethiopia that can do the tests. If we have test results that might guide your child’s care or treatment, we will contact him/her to tell him/her how he/she
288 | Ethiopia Population-based HIV Impact Assessment (EPHIA) 2017-2018
and a doctor or nurse at the preferred health facility may get these results.
We would like to ask your consent to store your child’s leftover blood for future research tests. These tests may be about HIV or other health issues important for the health of people living in Ethiopia. This sample will be stored for 5-10 years. The sample will not have your child’s name on it and so we will not be able to tell you the results of the future re-search tests. Your child’s leftover blood samples will not be sold or used for commercial reasons. If you do not agree to long term storage of your child’s blood samples, your child can still take part in the survey. We will destroy your child’s blood samples after survey-related testing has been completed.
Additionally we would like to ask your consent for your child to take part in possible future research if you want to. If you agree, your child’s contact information will be retained by approved researchers and you may be contacted for a period of up to 5 years and invited to take part in future research, if you still want to. If you do not agree to take part in future research you can still continue to take part in the research today.
Conditions of the study: Taking part in the survey is voluntary and you or your child will not be given money or gifts for taking part. Your child can leave the survey at any time for any reason. If you or your child decides to leave the survey, no more information will be collected from you. However, we will not be able to take back the information that has already been collected and shared.
Costs for being in the survey: There is no cost to you or your child for being in the survey, apart from your time.
Use of survey findings
The overall survey findings, which will not contain any personal information that would identify you or your child, will be shared with the Government of Ethiopia and the MoH. This information will be used to improve health care for the peo-ple of Ethiopia. Finally, the findings will be shared with international partners to assist in the delivery of health services all over the world.
Right to refuse and to withdraw
It is your decision about whether you will allow us to invite your child to join the survey. Your child does not have to be in the survey or give blood. You or your child may stop taking part at any time. If your child is in the age group interviewed and does not want to answer some of the questions he/she may skip them and move to the next question. If your child does not take part, it will not affect your child’s healthcare in any way.
You may agree for your child’s blood to be tested in relation to this survey, but not agree for the blood to be stored for future research tests. Your child’s taking part is voluntary. If you or your child decides not to take part, it will not affect your healthcare in any way.
Risks [For children 12-17] During the interview, your child may feel uncomfortable answering some of the questions. We do not wish this to happen, and your child does not have to answer questions he/she feels are too personal or that make them feel uncomfortable.
[For all children 0-17] The risks to your child from having his/her blood drawn are very small. They include brief pain from the needle stick, bruising, lightheadedness, bleeding and rarely, infection where the needle enters the skin. The survey staff member who will take his/her blood has received training on how to draw blood. If he/she has any dis-comfort or any of the symptoms we’ve mentioned above, please let us know, and especially if there is any bleeding or swelling.
[For children 15-17] Your child may learn that he/she is HIV, Syphilis or Hepatitis B positive. Learning that he/she has
APPENDIX H | 289
these diseases may cause some emotional and/or psychological distress. He/she will receive counseling on how to cope with learning that he/she has HIV, Syphilis, or Hepatitis B. If he/she tests positive with any of the HIV, Hepatitis B or Syphilis tests, , we will help identify where to go and explain the options available for care and treatment.
[For children 0 -14 years] You may learn that your child is HIV positive. Learning that your child has HIV may cause you some emotional and/or psychological distress. You will decide when and where to give your child the test results. We will provide you with counseling on how to cope with learning that your child has HIV. If your child tests HIV positive, we will help you identify where to go and explain the options available for care and treatment. Care and treatment for HIV is available at government facilities free of charge.
Benefits
[For children 0-14] The main benefit for your child to be in the survey is the chance to learn more about his/her health today. If your child tests as part of the survey you will learn his/her HIV status. Some children who take part will test HIV positive. If this happens to your child, the benefit is that you will learn his/her HIV-positive status and you will learn where to take your child for HIV services. HIV care and treatment provided by government facilities is free of charge. If you already know that your child is HIV positive and he/she is on treatment, the CD4 and viral load tests can help your doctor or nurse judge how well the treatment is working. If your child tests HIV negative, you will learn about what you can do to keep your child HIV negative. Your child’s taking part in this research could help us learn more about children and HIV in Ethiopia. It can also help us learn about how HIV prevention and treatment programs are working in the country. You and your child’s taking part are important, even if you already know that your child is HIV negative or positive.
[For children 15-17] The main benefit for your child to be in the survey is the chance for your child to learn more about his/her health today. If your child takes part in the survey he/she will learn his/her HIV status. Some children who take part will test HIV positive. If this happens to your child, the benefit is that he/she will learn about his/her HIV-positive status and he/she will learn where to go for HIV services. HIV care and treatment provided by government facilities is free of charge. If you or your child already knows that he/she is HIV positive and he/she is on treatment, the CD4 and viral load tests can help his/her doctor or nurse judge how well the treatment is working.
If your child tests positive for HIV, he/she will also be offered tests for Hepatitis B and Syphilis. He/she will learn about Hepatitis B and Syphilis and will learn where to go for care and treatment for Hepatitis B and Syphilis services.
If your child tests HIV negative, your child will learn about what he/she can do to keep himself/herself HIV negative. Your child’s taking part in this research could help us learn more about children and HIV in Ethiopia. It can also help us learn about how HIV prevention and treatment programs are working in the country. You and your child’s taking part are important, even if you already know that your child is HIV negative or positive.
Confidentiality
We will do everything we can to keep your child’s taking part in the survey confidential. The information we collect from you and your child in this computer will be identified by a number and not by your name or your child’s name. Your child’s name and other personal information will be stored in a confidential manner, accessible only by survey staff. Your name and your child’s name will not appear when we share survey results. Only survey staff will have access to the data during the survey. However, in accordance with the Children’s Protection and Welfare Act, we are required to report any instances of children in imminent danger to the appropriate authority.
[For children 12-17] Your child may choose to tell you about the interview but he/she does not have to do this. We will not be sharing with you responses given by your child. The following individuals and/or agencies will be able to look at your interview records to help oversee the conduct of this survey:
• Staff members from the Institutional Review Boards or Ethics Committees which oversee the conduct of this
290 | Ethiopia Population-based HIV Impact Assessment (EPHIA) 2017-2018
survey to ensure that we are protecting your rights as a person taking part, the staff members include:
• EPHI
• The Centers for Disease Control and Prevention (CDC; Atlanta, USA)• Columbia University Medical Center• Westat (a statistical survey research organization).
• The U.S. Office of Human Research Protections may examine the study records to ensure we are protecting your rights as a person taking part in this survey.
• Selected survey staff and survey monitors.
This survey has received approval from the EPHI, The Centers for Disease Control and Prevention, and the Institutional Review Boards of Columbia University Medical Center, and of Westat.
The information we collect during the survey will not be released outside of the survey groups listed above unless there is an issue of safety. Your consent to allow us to use and share your name and contact information with the groups above will expire five years after the end of the survey.
If you have any questions about the survey or feel that you have been harmed by taking part, you can contact:
Yimam Getabeh Address: Ethiopian Public Health Institute, PO Box 1242, Addis Ababa, Ethiopia. Office Phone: +251 112788058; Mobile Phone: Tel: +251 912 002053; Fax: 25112758634. E-mail: [email protected]
If you have any questions about your rights as a person taking part in this survey you can contact:
Dr. Getachew Addis Address: EPHI Scientific and Ethics Review Office, P.O Box 1242, Addis Ababa, Ethiopia Office Phone: +251-118-685503/15; Mobile Phone: +251 944123110 E-mail: [email protected];
Mr. Yohannes Sitotaw Address: National Research Ethics Review Committee, P.O Box 2490, Addis Ababa, Ethiopia Office Phone: +251011-4-674353; Mobile Phone: +251 913906779 E-mail: [email protected]; Fax: +251-011-4-660241
Do you want to ask me anything about the survey?
Consent Statement
I have read this form, and someone has read it to me. I was encouraged to ask questions and given time to ask questions. Any questions that I had were answered satisfactorily. I agree for my child to take part in this survey. I know that after allowing my child to take part I may change my mind and withdraw him/her from taking part in this survey at any time. I have been offered a copy of this consent form.
[For children 12-17] I agree to allow you to ask my child to be in this survey. I know that after allowing my child to decide whether he/she wants to be in this survey, he/she may withdraw at any time. His/her taking part is voluntary.
[For children 0-12] I agree for my child to be in this survey. I know that after allowing my child to be in this survey, I may withdraw him/her at any time. Taking part is voluntary.
APPENDIX H | 291
1. [For children 12-17] Do you agree that we can approach your child to ask that he/she do the interview? ‘YES’ means that you give your consent to have the survey staff ask your child to take part in the interview, and to participate if the child agrees. ‘NO’ means that you will NOT give consent for your child to be interviewed.
______Yes ______No (If “No” then STOP)
2. [For children 12-14 years] Do you agree that we can approach your child to give blood for HIV and related testing? ‘YES’ means that you give your consent to have the trained survey staff to ask your child to collect a sample of your child’s blood for HIV and related testing, and to collect the blood and perform the tests if the child agrees. ‘NO’ means that your child will NOT give blood for HIV and related testing.
______Yes ______No
3. [For children 15-17 years] Do you agree that we can approach your child to give blood for Syphilis, and Hepatitis B testing and related testing? ‘YES’ means that you give your consent to have the trained survey staff to ask your child to collect a sample of your child’s blood for Syphilis, and Hepatitis B testing and related testing, and to collect the blood and perform the tests if the child agrees. ‘NO’ means that your child will NOT give blood for Syphilis, and Hepatitis B testing and related testing.
______Yes ______No (If “NO” then STOP)
4. [For children 0-11 years] Do you agree for your child give blood for HIV testing and related testing? ‘YES’ means that you give your consent to have the trained survey staff collect a sample of your child’s blood for HIV and related testing. ‘NO’ means that your child will NOT give blood for HIV testing and related testing.
______Yes ______No (If “NO” then STOP)
5. [For children 12-17 years] Do you agree to allow us to ask your child to have his/her leftover blood stored for future research? ‘YES’ means that you give consent for us to ask your child to allow us store leftover blood samples for future research, and to store it if the child agrees. ‘NO’ means that your child’s blood samples will NOT be stored for future research.
______Yes ______No
6. [For children 0-11 years] Do you agree to have your child’s leftover blood stored for future research? ‘YES’ means that you give consent for your child’s leftover blood samples to be stored for future research. ‘NO’ means that your child’s blood samples will NOT be stored for future research.
______Yes ______No
7. [For children 15-17 years] Do you agree to allow us to ask your child to retain his/her contact information for future research? ‘YES’ means that you give consent for us to ask your child to allow us to retain his/her contact information for future research, and to retain the information if the child agrees. ‘NO’ means that your child’s contact information will NOT be retained for future research.
______Yes ______No
[Tablet summary statement]
To confirm, you have agreed to <INSERT ALL OPTIONS MARKED YES: APPROACH CHILD FOR INTERVIEW, APPROACH CHILD FOR BLOOD TESTING, CHILD INTERVIEW, CHILD BLOOD TEST, APPROACH CHILD FOR BLOOD STORAGE, CHILD BLOOD STORAGE, APPROACH CHILD FOR STORAGE CONTACT INFORMATION,
292 | Ethiopia Population-based HIV Impact Assessment (EPHIA) 2017-2018
CHILD CONTACT INFORMATION STORAGE>, is this correct? ______Yes ______No
Parent/guardian signature or mark_______________________________________ Date: ___/___/___
Printed name of parent/guardian________________________________________
[For illiterate participants]
Signature of witness______________________________________________ Date: ___/___/___
Printed name of witness___________________________________________
Signature of person obtaining consent_______________________________ Date: ___/___/___
Printed name of person obtaining consent____________________________
Survey staff ID number _________________________________
Child’s name (print) ___________________________________
Child’s participant ID number ___________________________
Assent for Interview from Children ages 12-17 Participation duration: 45 min Anticipated number of research participants at this site: 24,846 Sponsor/Supporter: PEPFAR Award #1U2GGH001226
APPENDIX H | 293
Principal Investigator: Prof Sileshi Lulseged; Project Lead, EPHIA/ICAP Ethiopia Phone Number: +2511911228496 Co-Investigator/Study Coordinator: Mr. Terefe Gelibo, Project Coordinator, EPHIA/ICAP Ethiopia Phone Number: +251912139705
Study title: Ethiopia Population-based HIV Impact Assessment (EPHIA)
What language do you prefer for our discussion today?
___English
___Amharigna
___Oromiffa
___Tigrigna
___Afarigna
___Somaligna
___Other Language: Specify ___________________________
Interviewer reads:
Hello. My name is_________________. We are doing a research study throughout Ethiopia to learn more about HIV in the country. We have talked to your parents/guardian and they said it was okay to invite you take part in a research study.
Purpose of the survey
This survey will help us learn more about the health of young people in Ethiopia. It will also tell us about young people’s risk for getting HIV, Syphilis, and Hepatitis B. We plan to ask about 19,000 people, ages 15-64 years, and 5,000 children, ages 0-14 years, from about 12,000 households to join this survey. A survey is a way to learn new information about something by interviewing and testing many people. If you join, your taking part will help the Ministry of Health (MoH) to make health services better in the country.
This form might have some words in it that are not familiar to you. Please ask us to explain anything that you do not understand.
294 | Ethiopia Population-based HIV Impact Assessment (EPHIA) 2017-2018
What would happen if you join this survey?
If you decide to join the survey, here is what would happen:
• We will ask you questions about your age, what you know about HIV, Syphilis, and Hepatitis B and whether you have experience with behavior that may put you at risk of HIV, Syphilis, and Hepatitis B.
• The interview will take place in private here in your house or an area around your house.
• The interview will take about 45 minutes.
• After we ask you the questions, if you have agreed, we will take some of your blood to test for HIV and to store for future research tests.
• [Children 12-14] We will use a needle to take about 6 milliliters of blood (a little more than a teaspoonful) from your arm into two tubes. If it’s not possible to take blood from your arm, then we will try to take a few drops of blood from your finger. Then we will test your blood for HIV here in your home.
• [Children 15-17] We will use a needle to take about 14 milliliters of blood (less than a tablespoonful) from your arm into two tubes. If it’s not possible to take blood from your arm, then we will try to take a few drops of blood from your finger. Then we will test your blood for HIV here in your home.
• It will take about 45 minutes to do the test and to talk to you about the results.
• If you have HIV, we will measure how well your body can fight HIV and other infections. We can do this test here in your home. We will also measure this in the blood of some people without HIV. This is known as a CD4 test.
• If you test positive for HIV, we will also offer you Hepatitis B and Syphilis tests. Like HIV, Hepatitis B and Syphilis are infections that can make someone very sick if left untreated. If you test positive for HIV, we will send your blood to the National Laboratory in Addis Ababa to measure the amount of HIV in your blood. Some of your blood will be sent to a laboratory out of the country for some additional tests related to HIV because there are no laboratories in Ethiopia that can do these tests.
• You may be eligible to take part in future studies related to health in Ethiopia. We are asking for your permission to contact you in the next five years if such an opportunity occurs. To do this, approved researchers will be able to request access to your contact information. If we contact you, we will give you details about the new study and ask you to sign a separate assent/consent form at that time. You may decide at that time that you do not want to take part in that study. If you do not wish to be contacted about future studies, it does not affect your taking part in this survey.
• We will ask you if we can store some of your blood for future testing. These tests will help us learn about the health of people in Ethiopia. This sample will be stored for 5-10 years. Your leftover blood will not be used for anything other than these tests. Your blood will not be sold. If you do not agree to future storage and testing of your blood, we will destroy your blood after survey-related testing has finished and you can still receive your test results and conduct the survey interview.
Could bad things happen if you join this survey?
You may feel uncomfortable answering some of the questions we will ask. You can refuse to answer any question at any time and we will stop.
The needle may hurt when it is put into and taken out of your arm. This pain will go away quickly. Sometimes the needle can leave a bruise on the skin. You might bleed a little or feel a little dizzy afterwards. Rarely, an infection might occur where the needle enters the skin. We may have to try more than one time in order to get the right amount of blood. We will do our best to make it as painless as possible.
APPENDIX H | 295
We will test for HIV and you may learn that you have HIV. Learning that you have HIV may cause you to feel worried. We will talk to you and try to make you feel better to help you with this. What we talk about we will not tell anyone else but there is a small chance other people might find out.
Could the survey help me?
You may not get anything yourself by being in the survey. But you may help us figure out ways to help other children and learn more about HIV, Syphilis, and Hepatitis B in Ethiopia. Your taking part is important, even if you already know that you have or you don’t have these diseases.
[For children 12-14 years]
Being in the survey may help you by learning whether or not you have HIV. We would give your results to your parent/guardian and you can talk to him/her about your test result. If your parent wants us to tell you about your test results, we would talk with you about any questions that you might have about the results. If you are HIV positive, we will tell your parent/guardian where to take you for your medical care and the Government of Ethiopia will pay for your care. We hope to learn about HIV health care needs in this survey. And we hope it will help other children in Ethiopia in the future.
[For children 15-17 years]
Being in the survey may help you by learning whether or not you have HIV. We will give you your results of your HIV, tests and provide counseling to you and discuss with you how to share these results with your parent/guardian, if you decide to. If you test positive for HIV, you will learn about it and you will learn where to go for care and treatment of HIV. Care and treatment for HIV provided by the Government of Ethiopia is free. If you already know you have HIV and are not on treatment, you will get information to help your doctor/nurse determine if you are ready to start treatment. If you already know that you have HIV and you are on HIV treatment, the tests may help your doctor/nurse judge how well your treatment is working.
If you test positive for HIV, you may also be offered free testing for Hepatitis B and Syphilis. If you test positive for Hepatitis B and/or Syphilis, you will learn about Hepatitis B and Syphilis and where to go treatment.
If you test negative for HIV, you will learn about what you can do to stay that way. Your taking part in this survey is important, even if you already know your HIV status as it will help us learn more about HIV in Ethiopia. If you test positive for Hepatitis B, or Syphilis you will be referred to a health facility for treatment.
Conditions of the study: Taking part in the survey is voluntary and you will not be given money or gifts for your taking part. You can leave the survey at any time for any reason. If you decide to leave the survey, no more information will be collected from you. However, we will not be able to take back the information that has already been collected and shared.
Costs for being in the survey: There is no cost to you for being in the survey, apart from your time.
Use of survey findings
The overall survey findings, which will not contain any personal information that would identify you, will be shared with the Government of Ethiopia and the MoH. This information will be used to improve the health care for the people of Ethiopia. The findings will also be shared with international partners to assist in the delivery of health services all over the world.
296 | Ethiopia Population-based HIV Impact Assessment (EPHIA) 2017-2018
What else should you know about this survey?
If you don’t want to be in the survey study, you don’t have to be. Nobody will get upset with you if you do not want to join the survey.
It is also OK to say ‘Yes’ and change your mind later. You can stop being in the survey at any time. If you want to stop, please tell us.
Confidentiality
[For children 15-17] We will do everything we can to keep your test results confidential. The blood we collect from you will be identified by a number, not by your name. Besides you, no one else will know your test results except the people working on the survey and people you decide to tell.
[For children 12-14,] We will do everything we can to keep your test results confidential. The blood we collect from you will be identified by a number, not by your name. Besides you and your guardian/parent, no one else will know your test results except the people working on the survey.
We will not tell other people that you are in this survey and will not share information about you to anyone who does not work in the survey. Any information about you will have a number on it instead of your name. Only selected survey staff will have access to the information we collect during the survey.
The following individuals and/or agencies will be able to look at your research records:
• Survey staff collecting data and monitoring data quality
• Staff members analyzing data within Ethiopia and internationally.
• Staff members from groups that protect your rights as a person taking part in a survey who check that we are protecting your rights like Ethiopia Public Health Institute (EPHI) and similar agencies in the United States of America.
This survey has been approved by committees that protect your rights in Ethiopia and internationally.
Is there anything else?
If you want to be to take part in the survey after we finish talking now, please write your name below. We will write our name too. This shows we talked about the survey and that you want to take part.
If you have any questions about the survey or feel that you have been harmed by taking part, you can contact:
Yimam Getabeh Address: Ethiopian Public Health Institute, PO Box 1242, Addis Ababa, Ethiopia. Office Phone: +251 112788058; Mobile Phone: Tel: +251 912 002053; Fax: 25112758634. E-mail: [email protected]
If you have any questions about your rights as a person taking part in this survey you can contact:
Dr. Getachew Addis Address: EPHI Scientific and Ethics Review Office, P.O Box 1242, Addis Ababa, Ethiopia Office Phone: +251-118-685503/15; Mobile Phone: +251 944123110 E-mail: [email protected];
APPENDIX H | 297
Mr. Yohannes Sitotaw Address: National Research Ethics Review Committee, P.O Box 2490, Addis Ababa, Ethiopia Office Phone: +251011-4-674353; Mobile Phone: +251 913906779 E-mail: [email protected]; Fax: +251-011-4-660241
Do you want to ask me anything about the survey?
Assent statement
Any questions that I had were answered satisfactorily. I have been offered a copy of this consent form.
Do you agree to do the interview? ‘YES’ means that you agree to do the interview. ‘NO’ means that you will NOT do the interview. ______Yes ______No (If “No” then STOP)
[For children 12-14] Make your initial or mark if you agree to give blood for testing and have your parent/guardian receive your result, ‘YES’ means that you agree to give blood for testing. ‘NO’ means that you will NOT give blood for testing. ______Yes ______No (If “No” then STOP)
[For children 15-17] Make your initial or mark if you agree to give blood for testing, ‘YES’ means that you agree to give blood for testing. ‘NO’ means that you will NOT give blood for testing. ______Yes ______No (If “No” then STOP)
Make your initial or mark if you agree to have your leftover blood stored, ‘YES’ means that you agree to have these blood samples stored. ‘NO’ means that these blood samples will NOT be stored. ______Yes ______No
[For children 15-17] Do you agree to be contacted in the future? ‘YES’ means that you agree to be contacted in the future if a study opportunity arises. ‘NO’ means that you will NOT be contacted about future studies. ________YES ________NO
[Tablet summary statement]
To confirm, you have agreed to <INSERT ALL OPTIONS MARKED YES: INTERVIEW, BLOOD TESTING AND RESULT TO PARENT (12-14YEARS), BLOOD TESTING AND RESULT TO YOU (15-17 YEARS), CHILD INTERVIEW, FUTURE RESEARCH, BLOOD STORAGE>, is this correct? ______Yes ______No
Child signature or mark_______________________________ Date: ___/___/___
Printed name of child ________________________________________
298 | Ethiopia Population-based HIV Impact Assessment (EPHIA) 2017-2018
Printed name of parent/guardian_____________________________
Signature of person obtaining consent_______________________________ Date: ___/___/___
Printed name of person obtaining consent____________________________
Survey staff ID number _________________________________
Consent to Share Contact Information for Active Linkage to Care of PHIA Participants, [15-64 years] Participation duration: 45 min Anticipated number of research participants at this site: 24,846 Sponsor/Supporter: PEPFAR Award #1U2GGH001226
Principal Investigator: Prof Sileshi Lulseged; Project Lead, EPHIA/ICAP Ethiopia Phone Number: +2511911228496 Co-Investigator/Study Coordinator: Mr. Terefe Gelibo, Project Coordinator, EPHIA/ICAP Ethiopia Phone Number: +251912139705
Study title: Ethiopia Population-based HIV Impact Assessment (EPHIA)
Consent to Share Contact Information of EPHIA Participants with Ministry of Health or their Partner Organizations (Ages 15-64).
Purpose of consent
You had a positive HIV test today. We have provided you with a referral form to bring to a health clinic and seek HIV treatment and care. We would like to help you in accessing the health care that you need. If you agree, we may be able to provide your contact information and HIV test results to health workers or counselors from the Ministry of Health (MoH) or to a partner that the MoH works with. This counselor will contact you to talk to you about HIV and help you go for HIV care. Anyone who is provided with your details will be experienced in providing support to people living with HIV and will be trained in maintaining confidentiality.
What do you have to do if you agree to take part?
If you agree for your information to be shared and to be contacted, we will provide your name, phone number (if you provided it to us) and your address to those counselors to provide you with support. The counselor can contact you by a text message sent to your phone, phone call, or in person.
What about confidentiality?
Your HIV test results and your contact information will not be shared with any other parties aside from what was specified in the other consent forms, and with this support organization. Maximum effort will be made to maintain your confidentiality.
What are the potential risks?
As with all surveys, there is a chance that confidentiality could be compromised. We are doing everything we can to
minimize this risk.
What are the potential benefits?
A trained health worker or counselor will assist you in accessing the health care that you need.
Who should you contact if you have questions?
If you have any questions about the survey or feel that you have been harmed by taking part, you can contact:
Yimam Getaneh Address: Ethiopian Public Health Institute, PO Box 1242, Addis Ababa, Ethiopia. Office Phone: +251 112788058; Mobile Phone: Tel: +251 912002053; Fax: 25112758634. E-mail: [email protected]
If you have any questions about your rights as a person taking part in this survey you can contact:
Dr. Getachew Addis Address: EPHI Scientific and Ethics Review Office, P.O Box 1242, Addis Ababa, Ethiopia Office Phone: +251-118-685503/15; Mobile Phone: +251 944123110 E-mail: [email protected];
Mr. Yohannes Sitotaw Address: National Research Ethics Review Committee, P.O Box 2490, Addis Ababa, Ethiopia Office Phone: +251011-4-674353; Mobile Phone: +251 913906779 E-mail: [email protected]; Fax: +251-011-4-660241
Do you want to ask me anything about the survey?
Consent Statement
Any questions that I had were answered satisfactorily. I have been offered a copy of this consent form.
1. Do you agree to allow us to share your contact information with the MoH or a partner that the MoH works with, who may contact you to assist and support you in seeking HIV care? ‘YES’ means that you agree for your information to be shared. ‘NO’ means that you do not agree for your information to be shared.
______Yes ______No (If “No’ then STOP)
2. If yes, do you agree to be contacted by? [MUST SELECT AT LEAST ONE]
Text message sent to your phone ______Yes ______No
Phone call ______Yes ______No
In person ______Yes ______No
Participant signature or mark_______________________________________ Date: ___/___/___
Printed name of participant________________________________________
Participant ID number ____________________________________________
APPENDIX H | 299
300 | Ethiopia Population-based HIV Impact Assessment (EPHIA) 2017-2018
Signature of person obtaining consent________________________________ Date: ___/___/___
Printed name of person obtaining consent_____________________________
Survey staff ID number _________________________________
Consent from Parent or Guardian to Share Contact Information for Active Linkage to Care of PHIA Participants, [Age 0-14] Participation duration: 45 min Anticipated number of research participants at this site: 24,846 Sponsor/Supporter: PEPFAR Award #1U2GGH001226
Principal Investigator: Prof Sileshi Lulseged; Project Lead, EPHIA/ICAP Ethiopia Phone Number: +2511911228496 Co-Investigator/Study Coordinator: Mr. Terefe Gelibo, Project Coordinator, EPHIA/ICAP Ethiopia Phone Number: +251912139705
Study title: Ethiopia Population-based HIV Impact Assessment (EPHIA)
Consent to from Parent or Guardian to Share Contact Information of EPHIA Participants [aged 0-14] with Ministry of Health or their Partner Organizations.
Purpose of consent
Your child/teenager had a positive HIV test today. We have provided you with a referral form to bring him/her to a health clinic and seek HIV treatment and care. We would like to help you in accessing the health care that your child needs. If you agree, we may be able to provide your contact information and HIV test results to health workers or counselors from the Ministry of Health (MoH) or to a partner that the MoH work with. This counselor will contact you and your child to talk to you about HIV and help you go for HIV care. Anyone who is provided with your details will be experienced in providing support to people living with HIV and will be trained in maintaining confidentiality.
What do you have to do if you agree to take part?
If you agree for your child’s information to be shared and to be contacted, we will provide you and your child’s name, phone number (if you provided it to us) and address to those counselors to provide you and your child with support. The counselor can contact you by text message sent to your phone, phone call, or in person.
What about confidentiality?
Your child’s HIV test results and your contact information will not be shared with any other parties aside from what was specified in the other consent forms, and with this support organization. Maximum effort will be made to maintain your confidentiality.
APPENDIX H | 301
What are the potential risks?
As with all surveys, there is a chance that confidentiality could be compromised. We are doing everything we can to minimize this risk.
What are the potential benefits?
A trained health worker or counselor will assist your child in accessing the health care that he/she needs.
If your child is less than 18 months, they will need to have another test as soon as possible. You need to take your child to a health facility as soon as possible and you should not wait for the result from us, or for someone else to contact you.
Who should you contact if you have questions?
If you want your child to leave the study, have any questions about the survey, or feel that you or your child have been harmed by taking part, you should contact:
Yimam Getaneh Address: Ethiopian Public Health Institute, PO Box 1242, Addis Ababa, Ethiopia. Office Phone: +251 112788058; Mobile Phone: Tel: +251 912 002053; Fax: 25112758634. E-mail: [email protected]
If you have any questions about your child’s rights as a person taking part in this survey, you can contact:
Dr. Getachew Addis Address: EPHI Scientific and Ethics Review Office, P.O Box 1242, Addis Ababa, Ethiopia Office Phone: +251-118-685503/15; Mobile Phone: +251 944123110 E-mail: [email protected];
Mr. Yohannes Sitotaw Address: National Research Ethics Review Committee, P.O Box 2490, Addis Ababa, Ethiopia Office Phone: +251011-4-674353; Mobile Phone: +251 913906779 E-mail: [email protected]; Fax: +251-011-4-660241
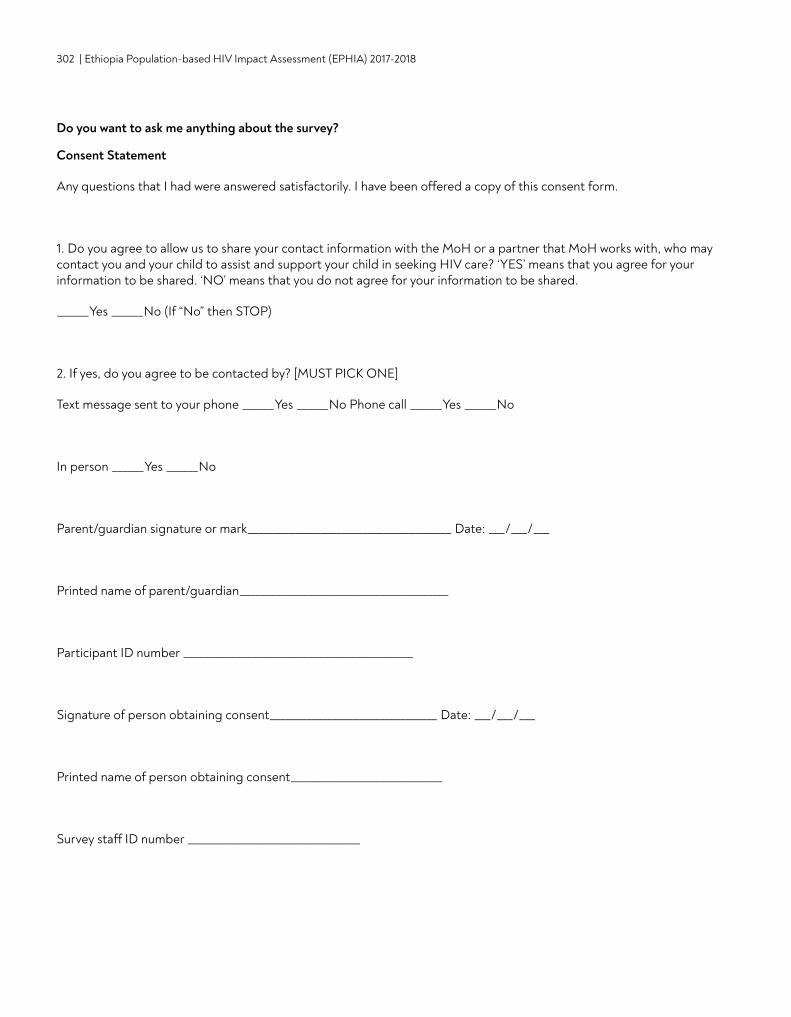
302 | Ethiopia Population-based HIV Impact Assessment (EPHIA) 2017-2018
Do you want to ask me anything about the survey?
Consent Statement
Any questions that I had were answered satisfactorily. I have been offered a copy of this consent form.
1. Do you agree to allow us to share your contact information with the MoH or a partner that MoH works with, who may contact you and your child to assist and support your child in seeking HIV care? ‘YES’ means that you agree for your information to be shared. ‘NO’ means that you do not agree for your information to be shared.
______Yes ______No (If “No” then STOP)
2. If yes, do you agree to be contacted by? [MUST PICK ONE]
Text message sent to your phone ______Yes ______No Phone call ______Yes ______No
In person ______Yes ______No
Parent/guardian signature or mark_______________________________________ Date: ___/___/___
Printed name of parent/guardian________________________________________
Participant ID number ____________________________________________
Signature of person obtaining consent________________________________ Date: ___/___/___
Printed name of person obtaining consent_____________________________
Survey staff ID number _________________________________

Ethiopian Public Health InstituteP.O. Box-1242Addis AbabaEthiopia
Ethiopia Population-based HIV Impact Assessment EPHIA 2017-2018
This project is supported by the U.S. President’s Emergency Plan for AIDS Relief (PEPFAR) through CDC under the terms of cooperative agreement #U2GGH001226. The findings and conclusions in this report are those of the authors and do not necessarily represent the official position of the funding agencies.
The mark "CDC" is owned by the US Dept. of Health and Human Services and is used with permission. Use of this logo is not an endorsement by HHS or CDC of any particular product, service or enterprise.
Related Documents


![Trends and spatial distributions of HIV prevalence in Ethiopia · 2019. 10. 17. · global total HIV cases [1, 2]. In Ethiopia, the annual number of HIV infected people showed declining](https://static.cupdf.com/doc/110x72/609e9b454ed3b073201976f1/trends-and-spatial-distributions-of-hiv-prevalence-in-ethiopia-2019-10-17-global.jpg)