Ethanol: Facts, Ethanol: Facts, Fiction, and Questions Fiction, and Questions Robert Hauser Robert Hauser University of Illinois University of Illinois May 2007 May 2007

Ethanol: Facts, Fiction, and Questions Robert Hauser University of Illinois May 2007.
Dec 26, 2015
Welcome message from author
This document is posted to help you gain knowledge. Please leave a comment to let me know what you think about it! Share it to your friends and learn new things together.
Transcript

Ethanol: Facts, Fiction, and Ethanol: Facts, Fiction, and QuestionsQuestions
Robert HauserRobert Hauser
University of IllinoisUniversity of Illinois
May 2007May 2007

Crude Oil Prices, Cushing, OK WTI Spot Crude Oil Prices, Cushing, OK WTI Spot Price, Jan. 2, 1986 – Nov. 21, 2006Price, Jan. 2, 1986 – Nov. 21, 2006
0
15
30
45
60
75
90
Cru
de
Oil P
ric
e (
$/b
arr
el)
Source: U.S. Department of Energy, Energy Information Administration


Corn used for ethanolCorn used for ethanol
200
600
1,000
1,400
1,800
2,200
2,600
3,000
3,400
3,800
4,200
4,600
mill
ion
bu
shel
s
96-97 97-98 98-99 99-200 2000-01
2001-02
2002-03
2003-04
2004-05
2005-06
2006-07
2007-08
2008-09
Year

Ethanol CapacityEthanol Capacity
PlantsPlants CapacityCapacity
Existing 118 6.09 bil. GalExisting 118 6.09 bil. Gal..
Construction 87 6.43 bil. Construction 87 6.43 bil. Gal.Gal.
----------------------------------------------------------------------------------------------
12.52 bil. gal.= 4.5 bil. bu. of corn12.52 bil. gal.= 4.5 bil. bu. of corn
Source: RFA 5/8/2007Source: RFA 5/8/2007


Ethanol production cost per Ethanol production cost per gallongallon Non-corn costNon-corn cost
at 12% ROE: at 12% ROE: $0.89$0.89 Corn costCorn cost
at $2 - $4/bu:at $2 - $4/bu: $0.73 to $1.45$0.73 to $1.45
TOTAL COST:TOTAL COST: @ $2 corn -- $1.62 per @ $2 corn -- $1.62 per galgal
@ $4 corn -- $2.34 per @ $4 corn -- $2.34 per galgal

Revenue from Ethanol Revenue from Ethanol ProductionProduction
Ethanol value based on:Ethanol value based on: Substitute for gasoline (67% BTU)Substitute for gasoline (67% BTU) Federal government subsidyFederal government subsidy Other subsidiesOther subsidies DDGS valueDDGS value CO2 valueCO2 value Octane boosterOctane booster OxygenateOxygenate Meets RFS requirementMeets RFS requirement

Effects on break-even gasoline Effects on break-even gasoline priceprice Corn price/buCorn price/bu $2.00 corn $2.00 corn $4.00 corn $4.00 corn
Ethanol cost:Ethanol cost: $1.62 $2.34$1.62 $2.34
Co-products Co-products $1.39$1.39 $1.90 $1.90
Subsidy Subsidy $0.88$0.88 $1.39 $1.39
Additive value $0.58-$0.88 $1.09-$1.39Additive value $0.58-$0.88 $1.09-$1.39
BTU inefficiency $0.86-$1.31 $1.62-2.07BTU inefficiency $0.86-$1.31 $1.62-2.07

With versus without subsidyWith versus without subsidy $2 corn $4 corn$2 corn $4 corn
$1.62 eth$1.62 eth $2.34 eth$2.34 eth
With subsidyWith subsidy $0.86-$1.31 $1.62-2.07 $0.86-$1.31 $1.62-2.07
Without subsidy $1.62-$2.07 $2.38-$2.83Without subsidy $1.62-$2.07 $2.38-$2.83
--------------------------------------------------------------------------------------------------------
$80 crude oil => $2.61 wholesale gasoline$80 crude oil => $2.61 wholesale gasoline
$60 crude oil => $1.98 wholesale gasoline$60 crude oil => $1.98 wholesale gasoline
$40 crude oil => $1.36 wholesale gasoline$40 crude oil => $1.36 wholesale gasoline
PerspectivePerspective
The effect of the federal government The effect of the federal government tax credit subsidy, under the tax credit subsidy, under the assumptions used here, has the assumptions used here, has the same effect on the break even same effect on the break even gasoline price as changing the gasoline price as changing the market price for corn from $2 per market price for corn from $2 per bushel to $4 per bushel.bushel to $4 per bushel.
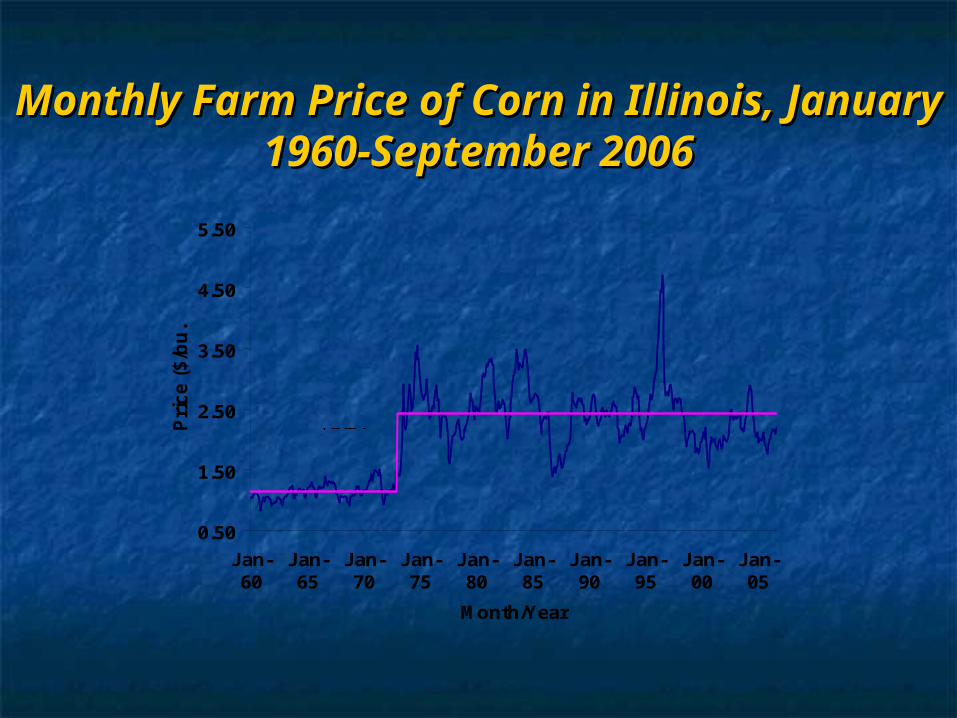
Monthly Farm Price of Corn in Illinois, Monthly Farm Price of Corn in Illinois, January 1960-September 2006January 1960-September 2006
0.50
1.50
2.50
3.50
4.50
5.50
Jan-60
Jan-65
Jan-70
Jan-75
Jan-80
Jan-85
Jan-90
Jan-95
Jan-00
Jan-05
Month/Year
Pri
ce
($
/bu
.)
Source: USDA
$1.14
$2.42


Corn price expectations:Corn price expectations:short versus long termshort versus long term
Short term: depends mostly on U.S. supplyShort term: depends mostly on U.S. supply
Current expected 2007 production: 12.3 bil Current expected 2007 production: 12.3 bil bubu
Probability of a 10% or more negative Probability of a 10% or more negative deviation: 19%deviation: 19%
Probability of a 10% or more positive Probability of a 10% or more positive deviation: 13.5%deviation: 13.5%

Potential Supply and Consumption Balance Potential Supply and Consumption Balance Sheets for the 2007-08 U.S. Corn Marketing Sheets for the 2007-08 U.S. Corn Marketing
YearYear2006-07 2006-07 USDA USDA WASDEWASDE
2007-08: 2007-08: Expected Expected ProductionProduction
2007-08: 2007-08: 10% 10% Larger Larger ProductionProduction
2007-08: 2007-08: 10% 10% Smaller Smaller ProductionProduction
2007-08: 2007-08: 20% Smaller 20% Smaller ProductionProduction
Supply (million bushels)Supply (million bushels)
BeginningBeginning 1,9271,927 937937 937937 937937 937937
ImportsImports 1010 1515 1010 1515 1515
ProductionProduction 10,53510,535 12,29012,290 13,51913,519 11,06111,061 10,78410,784
Consumption (million bushels)Consumption (million bushels)
Feed and ResidualFeed and Residual 5,8505,850 5,7505,750 5,8505,850 5,0905,090 4,4504,450
ExportsExports 2,2002,200 2,1502,150 1,8001,800 160160 1,6001,600
EthanolEthanol 2,1502,150 3,4003,400 3,5003,500 3,3003,300 3,0603,060
OtherOther 1,3751,375 1,4001,400 1,4001,400 1,3601,360 1,2601,260
TOTALTOTAL 11,57511,575 12,55012,550 12,90012,900 11,55011,550 10,37010,370
Ending StocksEnding Stocks 937937 692692 1,5661,566 463463 414414
Ending StocksEnding Stocks 8.1%8.1% 5.5%5.5% 12.1%12.1% 4.0%4.0% 4.0%4.0%
Average FarmAverage Farm $3.10$3.10 $3.30$3.30 $2.60$2.60 $4.25$4.25 $5.25$5.25
NOTENOTE: USDA WASDE estimates for 2006-07 were released on May 11, 2007.: USDA WASDE estimates for 2006-07 were released on May 11, 2007.
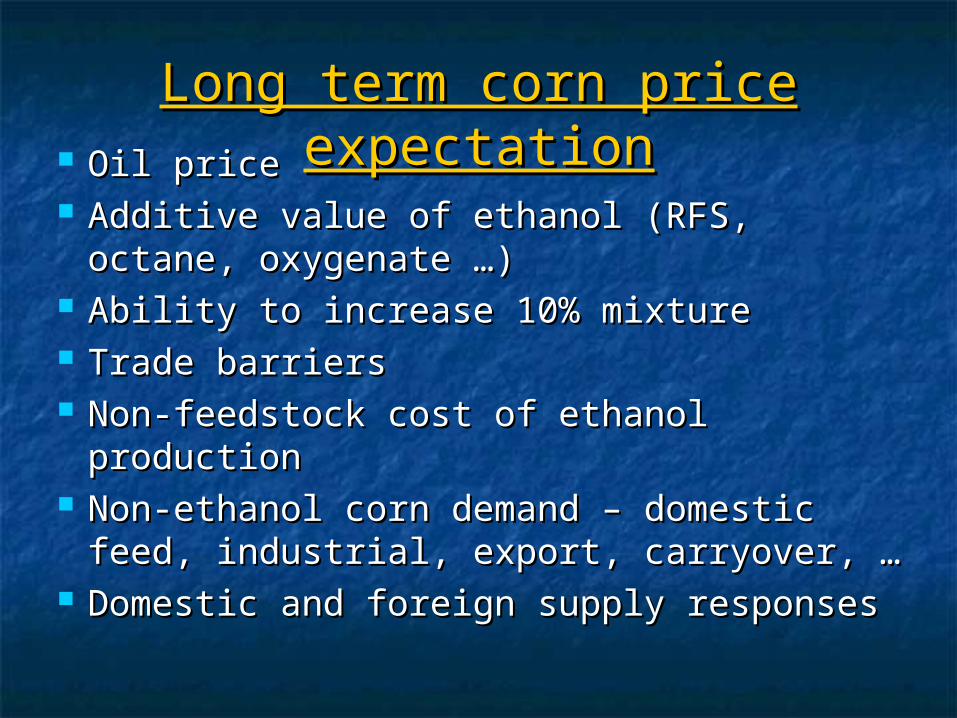
Long term corn price Long term corn price expectationexpectation Oil priceOil price
Additive value of ethanol (RFS, octane, Additive value of ethanol (RFS, octane, oxygenate …)oxygenate …)
Ability to increase 10% mixtureAbility to increase 10% mixture Trade barriersTrade barriers Non-feedstock cost of ethanol Non-feedstock cost of ethanol
productionproduction Non-ethanol corn demand – domestic Non-ethanol corn demand – domestic
feed, industrial, export, carryover, …feed, industrial, export, carryover, … Domestic and foreign supply responsesDomestic and foreign supply responses

Long-run exampleLong-run example Expect the long run wholesale price Expect the long run wholesale price
of gasoline to be $2.00 per galof gasoline to be $2.00 per gal With subsidy, no additive value, and With subsidy, no additive value, and
a 12% return on equity, this implies a 12% return on equity, this implies that the “break even” corn price is that the “break even” corn price is $3.50 per bushel.$3.50 per bushel. If long-run price of corn is below $3.50, If long-run price of corn is below $3.50,
firms enter market. firms enter market. If long-run price of corn is above $3.50, If long-run price of corn is above $3.50,
firms exit market.firms exit market.

Why is entry/exit so important Why is entry/exit so important with ethanol and not other with ethanol and not other
uses?uses?1. Long run equilibrium price has been 1. Long run equilibrium price has been
well below $3.50well below $3.50

Monthly Farm Price of Corn in Illinois, Monthly Farm Price of Corn in Illinois, January 1960-September 2006January 1960-September 2006
0.50
1.50
2.50
3.50
4.50
5.50
Jan-60
Jan-65
Jan-70
Jan-75
Jan-80
Jan-85
Jan-90
Jan-95
Jan-00
Jan-05
Month/Year
Pri
ce
($
/bu
.)
Source: USDA
$1.14
$2.42

Why is entry/exit so important Why is entry/exit so important with ethanol and not other with ethanol and not other
uses?uses?1.1. Long run equilibrium price has been Long run equilibrium price has been
well below $3.50well below $3.50
2.2. Ethanol production will have a Ethanol production will have a negligible effect on gasoline price, negligible effect on gasoline price, yetyet
3.3. It is a significant part (greater than It is a significant part (greater than 20%) of corn production20%) of corn production

What adjustments will be What adjustments will be needed to reach the new, needed to reach the new,
$3.50 equilibrium$3.50 equilibrium1.1. Depends on the elasticity of Depends on the elasticity of
demand of other usesdemand of other uses
2.2. Depends on the elasticity of supply Depends on the elasticity of supply of corn and other cropsof corn and other crops

Demand elasticitiesDemand elasticities Assume the following price elasticities Assume the following price elasticities
of demand:of demand: U.S. meat: -0.5 U.S. meat: -0.5 Exports = -1.0Exports = -1.0 Industrial = 0.0Industrial = 0.0
If feed is 25% of retail price and If feed is 25% of retail price and ethanol causes a 50% increase in feed ethanol causes a 50% increase in feed costs then the resulting 12.5% costs then the resulting 12.5% increase in meat price causes a 6.25% increase in meat price causes a 6.25% reduction in meat consumption.reduction in meat consumption.

Demand effects, ceteris Demand effects, ceteris paribusparibus
Corn exports (at unitary elasticity) Corn exports (at unitary elasticity) falls by 50%falls by 50%
Virtually no effect on industrial useVirtually no effect on industrial use The feed and export demand The feed and export demand
implications represent a 13.5% implications represent a 13.5% diversion away from traditional uses diversion away from traditional uses to ethanol to ethanol
Represents about 11 million acresRepresents about 11 million acres
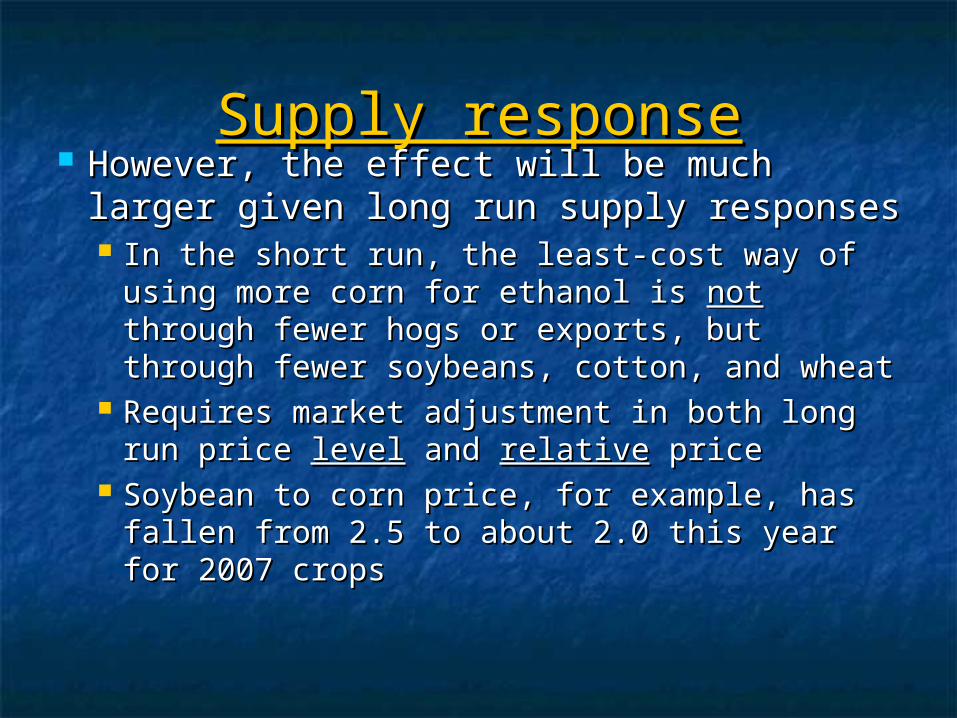
Supply responseSupply response However, the effect will be much However, the effect will be much
larger given long run supply responseslarger given long run supply responses In the short run, the least-cost way of In the short run, the least-cost way of
using more corn for ethanol is using more corn for ethanol is notnot through through fewer hogs or exports, but through fewer fewer hogs or exports, but through fewer soybeans, cotton, and wheatsoybeans, cotton, and wheat
Requires market adjustment in both long Requires market adjustment in both long run price run price levellevel and and relativerelative price price
Soybean to corn price, for example, has Soybean to corn price, for example, has fallen from 2.5 to about 2.0 this year for fallen from 2.5 to about 2.0 this year for 2007 crops2007 crops
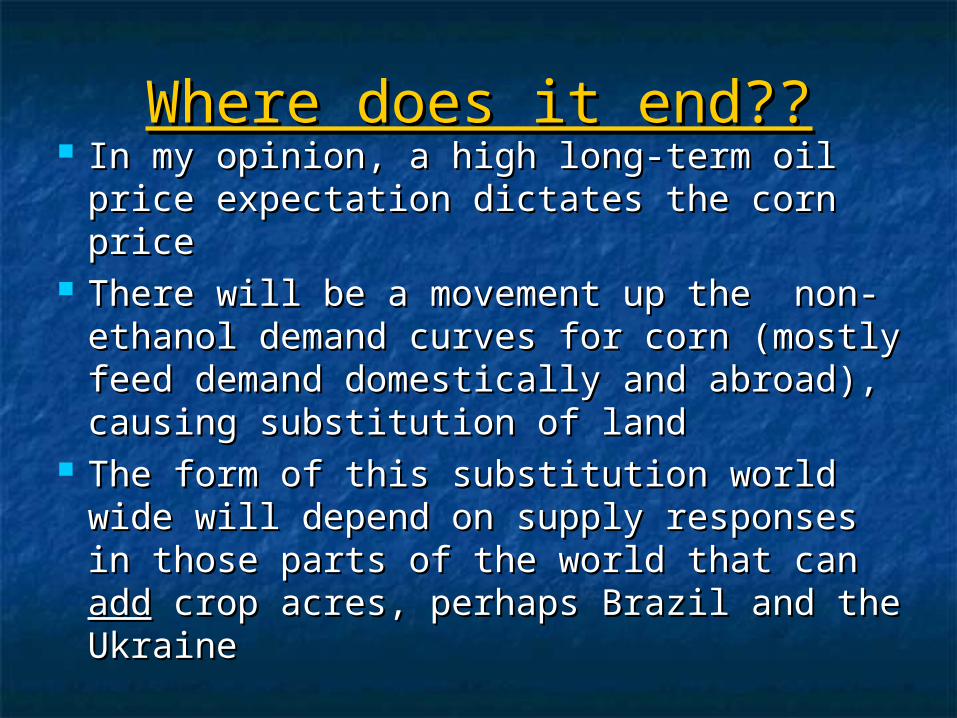
Where does it end??Where does it end?? In my opinion, a high long-term oil price In my opinion, a high long-term oil price
expectation dictates the corn price expectation dictates the corn price There will be a movement up the non-There will be a movement up the non-
ethanol demand curves for corn ethanol demand curves for corn (mostly feed demand domestically and (mostly feed demand domestically and abroad), causing substitution of land abroad), causing substitution of land
The form of this substitution world wide The form of this substitution world wide will depend on supply responses in will depend on supply responses in those parts of the world that can those parts of the world that can addadd crop acres, perhaps Brazil and the crop acres, perhaps Brazil and the UkraineUkraine

Other factors determining the Other factors determining the new state of equilibriumnew state of equilibrium
U.S. subsidy policy – very importantU.S. subsidy policy – very important RFS level -- ??RFS level -- ?? 10% ethanol versus …?10% ethanol versus …? Tariff policies – important but unlikely Tariff policies – important but unlikely
to changeto change Breakthroughs in cellulosic technology. Breakthroughs in cellulosic technology.
That is, reducing the cost of making That is, reducing the cost of making ethanol from fiber as opposed to ethanol from fiber as opposed to starchstarch

Cost of Production of Biofuels Cost of Production of Biofuels from Alternative Feedstocksfrom Alternative Feedstocks
Feedstock Feedstock sourcessources
Feedstock Feedstock cost ($/gal)cost ($/gal)Based onBased on
$2.05 corn$2.05 corn
Opportunity Opportunity Cost of Land Cost of Land
for for Producing Producing Feedstock Feedstock
($/gal)($/gal)
Non-Non-FeedstocFeedstoc
k Cost k Cost ($/gal)($/gal)
Co-Co-Product Product Credit Credit ($/gal)($/gal)
Total Total cost ($/ cost ($/
gal)gal)
CornCorn 0.750.75 0.58-.780.58-.78 0.270.27 1.05 – 1.05 –
1.251.25
Corn StoverCorn Stover 0.580.58 0.360.36 1.381.38 0.110.11 2.222.22
SwitchgrassSwitchgrass 0.740.74 0.380.38 1.381.38 0.110.11 2.392.39
MiscanthusMiscanthus 0.570.57 0.110.11 1.381.38 0.110.11 1.951.95

Alternative feedstocksAlternative feedstocks We know little about cellulosic We know little about cellulosic
processing, transportation, or processing, transportation, or production costsproduction costs
Implication here is that energy costs Implication here is that energy costs could make big difference in its could make big difference in its absolute advantageabsolute advantage
Valuation of carbon may also make a Valuation of carbon may also make a big differencebig difference

Life Cycle Carbon EmissionsLife Cycle Carbon Emissions
Production phase Production phase
KgCOKgCO22e/Gallon of Ethanole/Gallon of Ethanol
Biorefinery Biorefinery phasephase
KgCOKgCO22e/Gallon e/Gallon
of Ethanolof Ethanol
Feedstock Feedstock sourcesource
FeedstocFeedstockk
DisplacemeDisplacement nt of of
alternative alternative land useland use
Net Net SequestratiSequestrati
ononProcessinProcessing phaseg phase
Co-Co-product product creditcredit
Total Total KgCOKgCO22e/e/
Gallon Gallon of of
EthanolEthanol
CornCorn 3.053.05 -0.73-0.73 4.924.92 -1.99-1.99 5.255.25
Corn Corn stoverstover 1.091.09 3.453.45 0.400.40 0.260.26 -0.40-0.40 4.814.81
SwitchgrasSwitchgrasss 3.293.29 -3.68-3.68 -5.06-5.06 0.260.26 -0.40-0.40 -5.58-5.58
MiscanthusMiscanthus 0.900.90 -1.07-1.07 -0.98-0.98 0.260.26 -0.40-0.40 -1.28-1.28
Gasoline*Gasoline* 7.157.15* Emissions from gasoline are calculated for a gasoline equivalent to a gallon of ethanol.

Sensitivity of Costs of Sensitivity of Costs of Production to Crop and Carbon Production to Crop and Carbon
PricesPricesCrop PricesCrop Prices
$2/bu Corn;$2/bu Corn;$5/bu Soybean$5/bu Soybean
$3/bu Corn;$3/bu Corn;$5/bu Soybean$5/bu Soybean
$3.50/bu Corn;$3.50/bu Corn;$7/bu Soybean$7/bu Soybean
Price of COPrice of CO22
($ metric ($ metric ton COton CO22)) 00 1010 5050 00 1010 5050 00 1010 5050
Cost of Ethanol ($/gal 100E fuel)Cost of Ethanol ($/gal 100E fuel)
CornCorn 1.041.04 1.021.02 0.940.941.41.400 1.211.21 1.311.31 1.581.58 1.561.56 1.491.49
Corn StoverCorn Stover 2.222.22 2.202.20 2.102.101.81.866 1.631.63 1.741.74 1.991.99 1.971.97 1.871.87
SwitchgrassSwitchgrass 2.362.36 2.232.23 1.721.722.72.711 1.441.44 2.082.08 3.143.14 3.013.01 2.502.50
MiscanthusMiscanthus 1.941.94 1.851.85 1.521.522.02.044 1.201.20 1.621.62 2.162.16 2.082.08 1.741.74

Some concluding “facts”Some concluding “facts” Ethanol is here to stay at a significant Ethanol is here to stay at a significant
level (in terms of corn use) for the level (in terms of corn use) for the foreseeable futureforeseeable future
Why? High oil prices; significant Why? High oil prices; significant subsidies subsidies
Under reasonable assumptions, the Under reasonable assumptions, the effect of the current subsidies is the effect of the current subsidies is the make the break-even gasoline price make the break-even gasoline price for $4-corn ethanol the same as the for $4-corn ethanol the same as the break-even price for $2-corn ethanol break-even price for $2-corn ethanol without subsidywithout subsidy

Concluding facts, continuedConcluding facts, continued The resulting higher price of crops The resulting higher price of crops
will get incorporated into land values, will get incorporated into land values, meaning that land owners will be one meaning that land owners will be one of the biggest winners. of the biggest winners.
The long term use of ethanol from The long term use of ethanol from corn will facilitate and encourage the corn will facilitate and encourage the development of other feedstocks development of other feedstocks
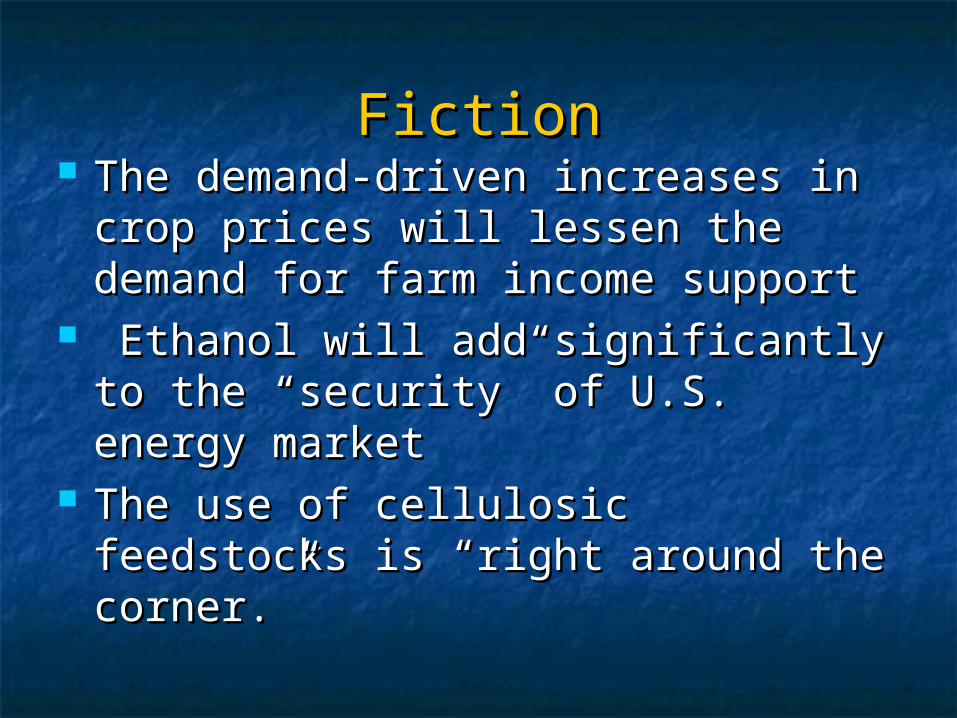
FictionFiction The demand-driven increases in crop The demand-driven increases in crop
prices will lessen the demand for prices will lessen the demand for farm income supportfarm income support
Ethanol will add significantly to the Ethanol will add significantly to the “security” of U.S. energy market“security” of U.S. energy market
The use of cellulosic feedstocks is The use of cellulosic feedstocks is “right around the corner.”“right around the corner.”

Some critical questionsSome critical questions Long run price of oil?Long run price of oil?

World energy World energy consumption will consumption will increase 70 percent by increase 70 percent by 2030. 2030.
Transport accounts for Transport accounts for 60% of growth in oil 60% of growth in oil consumption.consumption.
70 percent of energy 70 percent of energy demand growth outside demand growth outside OECD countriesOECD countries 1/5 of demand 1/5 of demand
growth will be in growth will be in Mainland China. Mainland China.
18 cars per 1000 18 cars per 1000 persons in Mainland persons in Mainland China--800 in USChina--800 in US
World Energy Outlook
Economic growth in Mainland China is creating greater demand for automobiles, creating traffic and air quality problems.

Some critical questionsSome critical questions Long run price of oil?Long run price of oil? Subsidy policies?Subsidy policies? 10% to xx?% ethanol?10% to xx?% ethanol? Long run equilibrium crop Long run equilibrium crop
adjustments?adjustments? Cellulosic technology?Cellulosic technology?

Related Documents


![Q ;¤CeW27m[oRek¨Uì]Ë. .÷ Endress+Hauser * 2Ý...Endress+Hauser 中国 鸟瞰图 Endress+Hauser 工程师在现场 4 Q ;£CdW17l[nRdk Uë]Ê. .ö Endress+Hauser * 2Ý5 Endress+Hauser](https://static.cupdf.com/doc/110x72/61269abbaa2e0357dc52fda9/q-cew27moreku-endresshauser-2-endresshauser-ec.jpg)