Report Prepared By: Chong Zohan Jeong Hyeon Lucy Park Loh Kah Seng Poh Mun Lee Teo Kean Hui ARC70903105954 Environment and Technology

Welcome message from author
This document is posted to help you gain knowledge. Please leave a comment to let me know what you think about it! Share it to your friends and learn new things together.
Transcript

Report Prepared By:
Chong ZohanJeong Hyeon Lucy Park
Loh Kah SengPoh Mun Lee Teo Kean Hui
ARC70903105954 Environment and Technology

Content
1.0 Introduction1.1 Aims and Objectives
2.0 Methodology2.1 Sequence of Working
3.0 Climate Behavior3.1 Meteorological Data (Macro-Data Collection & Analysis)
4.0 Case Study4.1 Introduction4.2 Materials Palette4.3 Lighting4.4 Temperature & Humidity4.5 OTTV
4.5.1 Case 1 & 2 Area Calculation4.5.2 Proposal & Recommendation
4.6 BEI4.6.1 Data Analysis4.6.2 Proposal and Recommendations
4.7 Post Occupancy Evaluation (POE)4.7.1 Sample Questionnaire4.7.2 Questionnaire Data Collection4.7.3 Data Analysis – Temperature4.7.4 Data Analysis – Lighting4.7.5 Data Analysis – Air Quality4.7.6 Data Analysis - Design4.7.7 Proposal 14.7.8 Proposal 1a4.7.9 Proposal 24.7.10 Proposal 34.7.11 Proposal 4
5.0 Site Analysis5.1 Introduction5.2 Site Images5.3 Sun Orientation5.4 Wind Rose5.5 Lighting Data Collection, Organization & Analysis5.6 Shadow Analysis & Recommendations5.7 Temperature Data Collection, Organization & Analysis
5.7.1 Humidity Data Collection, Organization & Analysis

The aim and objective of conducting this study is to understand and explore on climate with temperature, day lighting, artificial lightingrequirement and performances and requirement of a certain space. In order to analyse and report the quality of the climate withtemperature, lighting of the space, the characteristics and function of day lighting, artificial lighting of the intended space has to bedetermined. Understanding of the surrounding of site plays a vital role for this report and analysis.
1.0 Introduction1.1 Aim and Objectives

2.0 Methodology
Precedent Studies
2.1 Sequence of Working
Took documentation and study research paper that consisted lighting and acoustic study similar to the hotel case study that we choose.Read through and identified the important criteria of lighting design in difference spaces that consisted in hotel, for example: lobby, corridor,rooms and entrance. See how evaluation and critique are given to the existing lighting design.
Drawings Preparation
Most of the plans, section and elevation drawings are provided by the architect of the building ,ZLG Design some drawings are drawn byourselves. Grid lines with 1meter apart were then applied for the later data collecting and recording purposes.
Site visit
For the three floor Lantern Hotel (located above a two floor Hong Leong Bank),we decided to collecting data only for the 2nd floor and 4thfloor as 2nd floor is the main spaces with reception and balcony. The spatial arrangement of 3rd floor is similar to 4th floor ,therefore westudy this floor as there are rooms with glass box and is nearer to the skylight.
Recording Data
Data Collection for lighting was conducted using the Lux Meter. Reading were taken at 1meter intervals at a position of 1meter and 1.5meterheight. Since most of the rooms layout are the same, we picked two rooms for each floor to collecting data .The respective rooms are roomwithout window and room with lanai located at 2nd floor ,room with glass box and room without glass box located at 4th floor. Themateriality of each components of the spaces was also recorded.
Questionnaires for Post-Occupancy Evaluation• Questionnaires are distributed between occupants at the case study site to collect data from the occupants of the space.• P.O.E questionnaire have a rating of 1 (unsatisfied) to 5 (satisfied) to inform satisfactory level ratings.• Qualitative data collected via the survey is separated into the following categories: Temperature, noise, lighting, air quality, safety,
design, needs, accessibility, image to visitors, health & productivity.

2.0 Methodology
2.1 Sequence of Working
Tabulation of data and diagramming
Light and sound contour diagram were established to understand the concentration of noise and lightings for different zone using Ecotect2011.
Calculations
For lighting analysis, we are using formula :
Daylight Factor 𝐸 = Index RI = Room Index RI = Illuminance level 𝐸 =
Figure 2.1 a Figure 2.1 b Figure 2.1 c
3.0 Climatic Behavior
3.1 Meteorological Data (Macro – Data Collection)
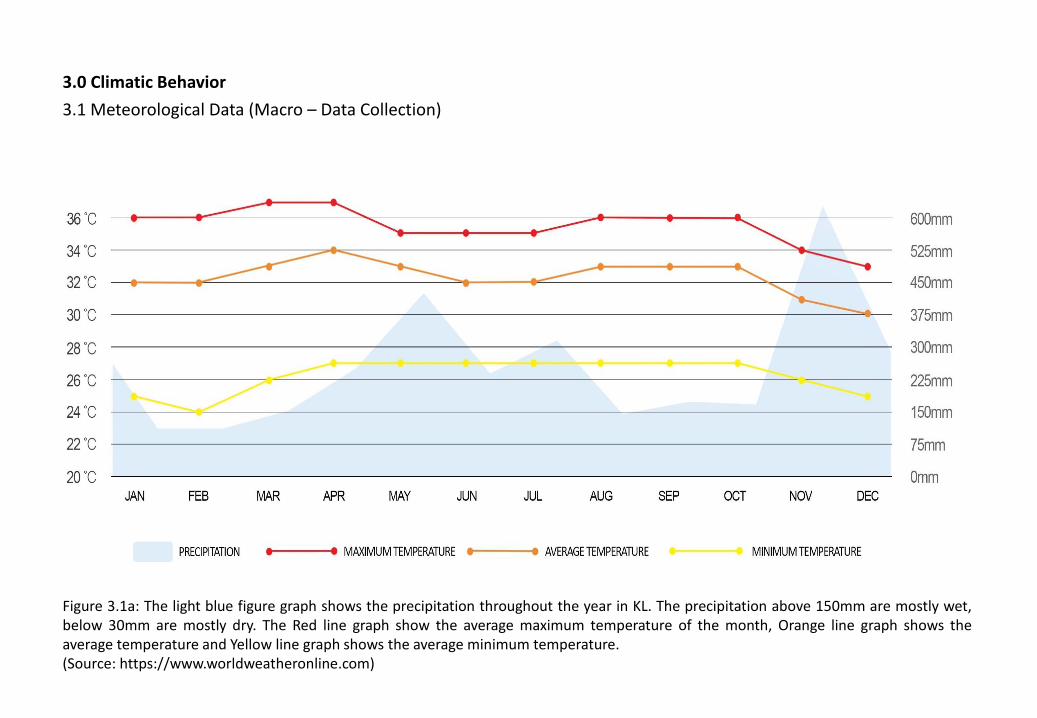
Figure 3.1a: The light blue figure graph shows the precipitation throughout the year in KL. The precipitation above 150mm are mostly wet,below 30mm are mostly dry. The Red line graph show the average maximum temperature of the month, Orange line graph shows theaverage temperature and Yellow line graph shows the average minimum temperature.(Source: https://www.worldweatheronline.com)

3.0 Climatic Behavior
3.1 Meteorological Data (Analysis)
Figure 3.1b: Starting from middle of January to begin of March have least amount of precipitation and from middle of October to Decemberhave most amount of precipitation. From the graph, the hottest months and coolest months also can be analyzed which are middle ofMarch to April and Middle of October to December respectively.

3.0 Climatic Behavior
3.1 Meteorological Data (Macro – Data Collection)
Figure 3.1c: The precipitation diagram for Kuala Lumpur shows on how many days per month, certain precipitation amounts are reached. Intropical and monsoon climates, the amounts may be underestimated.(Source: https://www.meteoblue.com)

3.0 Climatic Behavior
3.1 Meteorological Data (Analysis)
Figure 3.1d: From the graph, according to the number of the days that have rainfall, from September to December have the most amount ofprecipitation.

3.0 Climatic Behavior
3.1 Meteorological Data (Macro – Data)
Figure 3.1e: The diagram for Kuala Lumpur shows how many days within one month can be expected to reach certain wind speeds.(Source: https://www.meteoblue.com)

3.0 Climatic Behavior
3.1 Meteorological Data (Analysis)
Figure 3.1f: From the graph, from March to May have the fastest wind speed throughout the year.

3.0 Climatic Behavior
3.1 Meteorological Data (Macro – Data Collection)
Figure 3.1g: Statistics based on observations taken between 01/2008 - 08/2017 dailyfrom 7am to 7pm local time. (Source: https://www.windfinder.com)

3.0 Climatic Behavior
3.1 Meteorological Data (Analysis)
Figure 3.1h: The wind mostly blows to South and South –East Direction in a year.

3.0 Climatic Behavior
3.1 Meteorological Data (Macro-Data Collection)
Malaysia Climate:The characteristic features of the climate of Malaysia are uniform temperature, high humidity and copious rainfall. Winds are generally light.Situated in the equatorial doldrums area, it is extremely rare to have a fully day with completely clear sky even during periods of severedrought. Though the wind over the country is generally light and variable, however there are some uniform periodic changes in the wind flowpattern as shown in Figure 3.1i.
As Malaysia is mainly a maritime country, the effect of land and sea breezes on the general wind flow pattern is very marked especially duringdays with clear skies. Besides that, the seasonal wind flow patterns occupied with the local topographic features determine the rainfalldistribution patterns over the country. (Source: www.mel.gov.my)
Figure 3.1i: The diagram for Kuala Lumpur shows how many days within one month can be expected to reach certain wind speeds. (Source:https://www.meteoblue.com)

Date 16-Oct-17 17-Oct-17
Time Morning Afternoon Evening Morning Afternoon Evening
Forecast
Temperature (℃) 29.3 32.2 32 33 35 30
Wind Speed (km/h)
3.6 2.2 8.7 6 7 6
Wind Direction WSW S SW South SSW SE
Humidity (%) 71 54 54 65 49 73
Dew Point (℃) 23 22 24 22 22 19
Visibility (km) 10 10 10 10 10 10
Precipitation (mm)
0 0 0 2 16 1
Amount of rain 0 0 0 0 0 0
3.0 Climate Behavior3.2 Site Microclimate Data
mainly clearcloud and sun cloud and sun
Figure 3.2a: Weather history in Kuala Lumour, Malaysia from 17th -18th October 2017. (source: https://www.accuweather.com)
mainly clearcloud and sun cloud and sun

3.0 Climate Behavior3.2 Site Microclimate Data Collection
Figure 3.2b: Chart shown site microclimate date for temperature, humidity, total precipitation and wind speed in Kuala Lumpur. (source:https://www.meteoblue.com)
On-siteData
(Surrounding)
Temperature ℃
Humidity %
Site Microclimate
Data
Temperature℃
Humidity%
Highest 35.5 75 Highest 35 71
Average 32 65 Average 33 60
Lowest 30 50 Lowest 29.3 49
Figure 3.2c: Chart shown comparison between on-site date (surrounding in front of Lantern Hotel) and site microclimate data
Average temperature for the surrounding on site data (32℃)shows lower than the site microclimate data (33℃). Thiscould be due to the roof above Petaling Street is shaded onthe surrounding and the entrance of lantern hotel is fullyshaded by five foot walk way. The humidity is 75% whichhigher than microclimate data, which possibly affect by theF&B service surround on site, steaming and heat causes theonsite humidity higher than microclimate data. Due tosurrounding area of Lantern hotel is fully occupied by hawkerfood stalls and trading business, which cause lack of naturalVentilation, therefore, suggest to allow natural ventilation onSite, this reduce the humidity on site.

4.0 Case Study4.1 Introduction
Figure 4.1a: Site Plan
Figure 4.1b: Lantern Hotel (Above Hong Leong Bank, Jalan Petaling)
Lantern Hotel is a budget boutique hotel located in a shop lot at the heart ofthe busy Petaling Street. It is located at the second, third and fourth floor ofthe shop, above Hong Leong Bank. The shop is stylishly renovated, with anindustrial-meets-tropical design touch. The hotel consist of 49 rooms andhouses mostly foreign tourists as the essence of the Chinatown can beexperienced at the hotel – the sound of the people, smell of food and thelights of the lanterns can be heard, smelled, and seen from the hotel.

4.0 Case Study
4.2 Material Palette – 2nd Floor
Location Wall Finish Floor Finish Ceiling Finish
A - Reception Exposed brickwall
Tiles Plaster ceiling finish with white paint
B– Atrium Clay tiles TImberflooring
Roof glazing
C– Corridor Clay tiles & exposed brickwall
Cement rendered
Plaster ceiling finish with white paint
D– Deck N/A Engineered timber flooring
N/A
E – Room without windows
Clay tiles Tiles Plaster ceiling finish with white paint
F– Room with Lanai Clay tiles Tiles Plaster ceiling finish with white paint
G– Public Toilets Clay tiles Tiles Plaster ceiling finish with white paint
A
B C
E
DF
G
Figure 4.2a: Second Floor Plan Table 4.2a: Material Palette (Second Floor)

4.0 Case Study
4.2 Material Palette – 3rd & 4th Floor
Location Wall Finish Floor Finish Ceiling Finish
A – Corridor Clay tiles & exposed brickwall
Cement rendered
Plaster ceiling finish with white paint
B – Atrium Clay tile N/A Roof glazing
C – Room without glassbox
Clay tile Tiles Plaster ceiling finish with white paint
D – Room with glassbox
Clay tile Tiles Plaster ceiling finish with white paint
E – Male Dorm Clay tile Tukes Plaster ceiling finish with white paint
F – Public Toilet Clay tile Tukes Plaster ceiling finish with white paint
A B
D C
EF
Figure 4.2b: Third and Forth Floor Plan Table 4.2b: Material Palette (Third & Forth Floor)

4.0 Case Study4.3 Lighting (Data Analysis)
Figure 4.3a: 2nd Floor Plan (12pm) Figure 4.3b: 3rd & 4thFloor Plan (12pm)
From the contour diagram, the atrium at 4th floor received maximum 80% of natural lighting (refer to Figure 4.3e). However, the maximumnatural lighting received at 2nd floor drop to 70% at a different of 10.8 meter height. For the rooms at both side of atrium at level 2, they receivea range of daylighting from 0- 30%. However, the room at level 4 receive a range of lighting from 20% - 70%. There is a great different betweenthe daylighting level of these two floors.

4.0 Case Study4.3 Lighting (Data Analysis)
Figure 4.3c: 2nd Floor Plan (8pm) Figure 4.3d: 3rd & 4thFloor Plan (8pm)
From the contour diagram , the maximum artificial lighting achieved is up to 840 lux at the reception area (refer to Figure 4.3f). The lighting levelof toilets achieved up to 600lux ,However ,the lighting level of corridor have relatively low lux level,150lux .From the result of light analysis ,wecan conclude that the artificial lighting level varies according the hierarchy of space and type of activities carried out in the area.

Figure 4.3e: Natural lighting from the skylight at the atrium Figure 4.3f: Reception area
4.0 Case Study4.3 Lighting (Data Analysis)

4.0 Case Study
4.4 Temperature Data Tabulation Analysis (2nd floor)
Temperature (2nd floor)
Area Time
Zone Location 9.30-10.30am
3.00-4.00pm
6.00-7.00pm
11.00-12.00am
A Reception 27.8°C 30°C 28.8°C 25.8°C
B Atrium 26°C 30°C 28°C 24.5°C
C Corridor 27.2°C 29.8°C 28.6°C 25.5°C
D Deck 30.5°C 34°C 29°C 27.5°C
E Room without window
25.3°C 26.4 25.5°C 24.6°C
F Room with lanai
24.5°C 26°C 25°C 23.8°C
G Public toilet
27.2°C 29.8°C 28.6°C 25.5°C
A
B C
E
DF
G
Figure 4.4a: Second Floor Plan Table 4.4a: Temperature Data Tabulation (Second Floor)

4.0 Case Study
4.4 Temperature Data Tabulation Analysis (3rd & 4th floor)
Temperature (3rd & 4th floor)
Area Time
Zone Location 9.30-10.30am
3.00-4.00pm
6.00-7.00pm
11.00-12.00am
A Corridor 27.2°C 29.8°C 28.6°C 25.5°C
B Atrium N/A N/A N/A N/A
C Room without
glassbox
24.5°C 26°C 25°C 23.8°C
D Room with
glassbox
25.3°C 26.4 25.5°C 24.6°C
E Male Dorm
28.2°C 29.5°C 27.8°C 27.5°C
F Public Toilet
27°C 28.5°C 27.5°C 26°C
A B
D C
FE
Figure 4.4b: Third and Forth Floor Plan Table 4.4b: Temperature Data Tabulation (Third & Forth Floor)

Humidity(2nd floor)
Area Time
Zone Location 9.30-10.30am
3.00-4.00pm
6.00-7.00pm
11.00-12.00am
A Reception 56% 51% 63% 56%
B Atrium 69% 65% 73% 70%
C Corridor 67% 64% 70% 68%
D Deck 74% 67% 72% 73%
E Room without window
60% 55% 61% 60%
F Room with lanai
64% 60% 67% 65%
G Public toilet
75% 70% 78% 70%
A
B C
E
DF
G
4.0 Case Study4.4 Humidity Data Tabulation Analysis (2nd floor)
Figure 4.4c: Second Floor Plan Table 4.4c: Humidity Data Tabulation (Second Floor)

Humidty (3rd & 4th floor)
Area Time
Zone Location 9.30-10.30am
3.00-4.00pm
6.00-7.00pm
11.00-12.00am
A Corridor 65% 64% 69% 68%
B Atrium N/A N/A N/A N/A
C Room without
glassbox
60% 54% 62% 58%
D Room with
glassbox
62% 59% 65% 64%
E Male Dorm
62% 60% 66% 59%
F Public Toilet
76% 71% 78% 71%
A B
D C
FE
4.0 Case Study4.4 Humidity Data Tabulation Analysis (3rd & 4th floor)
Figure 4.4d: Third and Forth Floor Plan Table 4.4d: Humidity Data Tabulation (Third & Forth Floor)

4.0 Case Study4.5 OTTV4.5.1 Area calculation (Case 1- 3 Facades)
Figure 4.5.1a: West Façade
Wall areaSecond Floor : 33.37m²Third Floor : 52.1m²Fourth Floor : 43.37m²
Window areaSecond Floor : 20.52m²Third Floor : 13.44m²Fourth Floor : 13.44m²
Figure 4.5.1b: East Façade
Wall areaSecond Floor : 61.48m²Third Floor : 61.48m²Fourth Floor : 61.48m²
Window areaSecond Floor : 6.72m²Third Floor : 6.72m²Fourth Floor : 6.72m²
Figure 4.5.1c: South Façade
Wall areaSecond Floor : 71.1m²Third Floor : 84.54m²Fourth Floor : 84.54m²
Window areaSecond Floor : 26.88m²Third Floor : 13.44m²Fourth Floor : 13.44m²

4.0 Case Study4.5 OTTV4.5.1 Data Analysis

4.0 Case Study4.5 OTTV4.5.1 Data Analysis
Façade Area OTTV A x OTTV
South 293.940 43.098 12668.213
East 204.6 37.832 7740.487
West 182.238 54.322 9899.490
OTTV for 3 facade 680.778 / 30308.190 44.520 Wm²
OTTV tabulation for West, South and East façade:

4.0 Case Study4.5 OOTV4.5.1 Area calculation (Case 2 – 4 Facades)
Figure 4.5.1d: West Façade
Wall areaSecond Floor : 33.37m²Third Floor : 52.1m²Fourth Floor : 43.37m²
Window areaSecond Floor : 20.52m²Third Floor : 13.44m²Fourth Floor : 13.44m²
Figure 4.5.1f: East Façade
Wall areaSecond Floor : 61.48m²Third Floor : 61.48m²Fourth Floor : 61.48m²
Window areaSecond Floor : 6.72m²Third Floor : 6.72m²Fourth Floor : 6.72m²
Figure 4.5.1e: South Façade
Wall areaSecond Floor : 71.1m²Third Floor : 84.54m²Fourth Floor : 84.54m²
Window areaSecond Floor : 26.88m²Third Floor : 13.44m²Fourth Floor : 13.44m²
Figure 4.5.1g: North Façade
Wall areaSecond Floor : 71.1m²Third Floor : 84.54m²Fourth Floor : 84.54m²
Window areaSecond Floor : 26.88m²Third Floor : 13.44m²Fourth Floor : 13.44m²

4.0 Case Study4.5 OTTV4.5.1 Data Analysis

4.0 Case Study4.5 OTTV4.5.1 Data Analysis
Façade Area OTTV A x OTTVSouth 293.940 43.098 12668.213East 204.6 37.832 7740.487West 182.238 54.322 9899.490North 293.94 42.665 12540.974
OTTV for 4 facade 974.718 / 42849.164 43.961Wm²
OTTV tabulation for North, South, East and West façade:
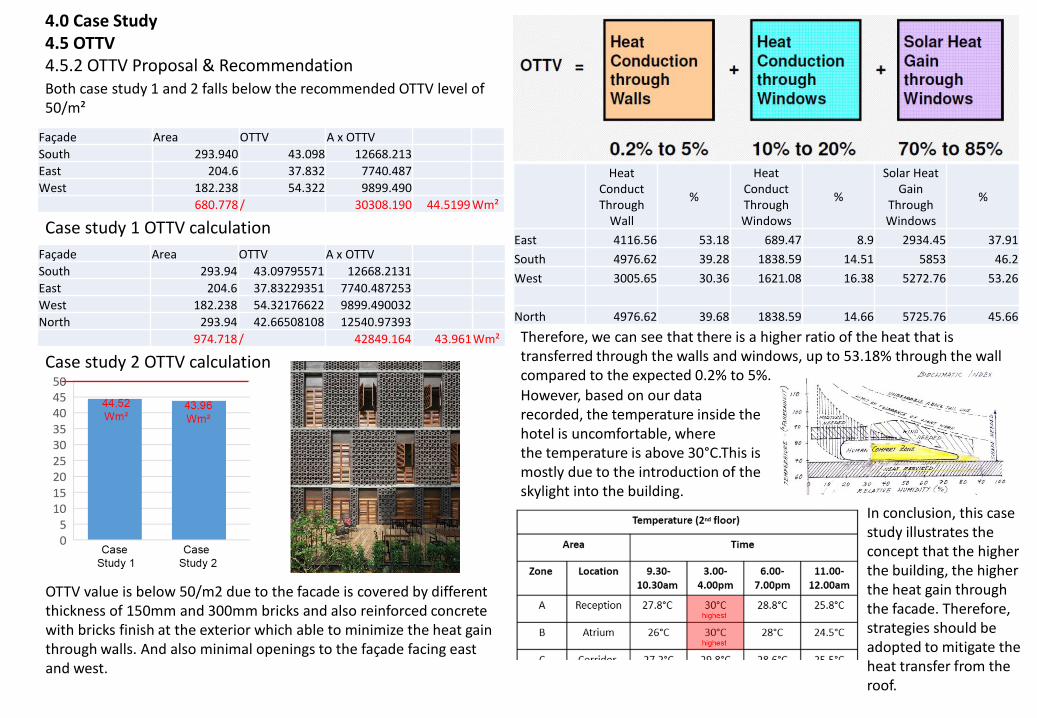
4.0 Case Study4.5 OTTV4.5.2 OTTV Proposal & Recommendation Both case study 1 and 2 falls below the recommended OTTV level of 50/m²
Façade Area OTTV A x OTTV
South 293.940 43.098 12668.213
East 204.6 37.832 7740.487
West 182.238 54.322 9899.490
680.778 / 30308.190 44.5199 Wm²
Façade Area OTTV A x OTTV
South 293.94 43.09795571 12668.2131
East 204.6 37.83229351 7740.487253
West 182.238 54.32176622 9899.490032
North 293.94 42.66508108 12540.97393
974.718/ 42849.164 43.961Wm²
Case study 1 OTTV calculation
Case study 2 OTTV calculation
OTTV value is below 50/m2 due to the facade is covered by different thickness of 150mm and 300mm bricks and also reinforced concrete with bricks finish at the exterior which able to minimize the heat gain through walls. And also minimal openings to the façade facing east and west.
Heat Conduct Through
Wall
%
Heat Conduct Through Windows
%
Solar Heat Gain
Through Windows
%
East 4116.56 53.18 689.47 8.9 2934.45 37.91
South 4976.62 39.28 1838.59 14.51 5853 46.2
West 3005.65 30.36 1621.08 16.38 5272.76 53.26
North 4976.62 39.68 1838.59 14.66 5725.76 45.66
However, based on our datarecorded, the temperature inside the hotel is uncomfortable, wherethe temperature is above 30°C.This is mostly due to the introduction of the skylight into the building.
Therefore, we can see that there is a higher ratio of the heat that is transferred through the walls and windows, up to 53.18% through the wall compared to the expected 0.2% to 5%.
In conclusion, this case study illustrates the concept that the higherthe building, the higher the heat gain through the facade. Therefore, strategies should be adopted to mitigate the heat transfer from the roof.

Based on the Lantern Hotel’s electricity bill which isRM10,000 per month, the total energy consumption is :-
4.6 (BEI) Building Energy Index [kWh/m2/year]
4.6.1 Data Analysis
Tariff CategoryCurrent Rates(1. Jan 2014)
Low voltage commercial Tariff
For the first 200kWh [1-200 kWh ] per month
For the next kWh [ 201kWh onwards ] per month
The minimum monthly charge is RM7.20
43.5 sen/kWh
50.9 sen/kWh
The source below is from the TNB’s tariff rate for commercial.Link - https://www.tnb.com.my/commercial-industrial/pricing-tariffs1
First 200kWh :
Energy Used Tariff Rate Money Spent
200 kWh 43.5 sen/kWh RM 87
Subsequent 200kWh :
Energy UsedTariff RateMoney Spent
RM 9913 50.9 sen/kWh 19,475 kWh
Therefore, total energy consumption per month is = 200 + 19,475 (kWh)= 19,675 kWh
Estimated energy used per year
= 19,675 kWh * 12
= energy used per month * 12
= 236,100 kWh
There are two floors in Lantern hotel which take up the2850.0m2 for net floor area.
BEI =TOTAL ENERGY CONSUMPTION A YEAR [KWH/YEAR]
TOTAL OCCUPIED OR NET FLOOR AREA [M2]
Building Energy Index = 236,100kWh / 2850m2
= 82.84 kWh/m2/year
Based on MS1525-2007, recommended building energy index,BEI is 135 kWh/m²/year. Therefore, the BEI of82.84kWh/m²/year meet the recommended index.
Conclusion
4.0 Case Study

Refrigerator21.48%
3 Strategies can be applied to lower the energy consumption ofthe building :-
Average Electricity Consumption Break (%)
Obtained from Centre for Environment, Technology & Development, Malaysia (CETDEM), PROJECT – WCPJ. Link: http://cetdem.org.my/wordpress/?page_id=2367
Cooking4.96%
Washing machine2.47%
Heating11.03%
Others4.49%
Lighting7.12%
Entertainment4.22%
Cooling44.23%
Although the Lantern hotel’s Building Energy Index is lowerthan the recommended BEI, to maintain it or to reduce moreof the energy load for the building, few strategies could beapplied into building.
1. MS 1525 : 2007 8.4.4 OFF – HOUR CONTROLThe case study has already applied this technique, where theair-conditioning in the hotel room is automatically closedbetween 11am to 6pm.
2. USE ENERGY EFIFICIENT AIR-CONDITIONING In order to reduce the energy consumed by air-conditioning,energy saving air-conditioning could be used. Technologies suchas inverter and also reusing the chilled air from the interior ofthe air could potentially lower the energy used.
3. INSTALL FAN & PROMOTE NATURAL VENTILATION
Based on our observation, no fans were provided for the guestsin the hotel rooms. Installing the fan could have helped toreduce the energy load. Fan would be more sufficient than aircondition during the sleeping time.
In addition, with the right selection of the ceiling fan, we cansave up to 47% on air conditioning costs.
https://www.hunterfan.com/Our-Promise/Row-Two/Energy-Efficiency
4.6 (BEI) Building Energy Index [kWh/m2/year]
4.6.2 Proposal and Recommendation
4.0 Case Study

4.7 Post Occupancy Evaluation (POE)4.7.1 Sample Questionnaire POE
Very Unsatisfied
Very Satisfied
Neutral
Day
1 2 3 4 5Temperature
Night
Common area
Lighting
Private area
Common area
Air Quality
Private area
Built form and open space
Design
Material selection
Green / innovative features
Very Unsatisfied
Very Satisfied
Neutral
Facilities
1 2 3 4 5Need
Equipment
Entrance / Exit
Accessibility
To room
Disabled
Cleanliness & hygiene
Health
Maintenance
Security
Safety
Staff performance
Productivity
4.0 Case Study

0
2
4
6
8
10
12
14
16
Very Unsatisfied Unsatisfied Neutral Satisfied Very Satisfied
Temp
erature
Day
Nigh
t
Lightin
gC
om
mo
n area
Air Q
uality
Co
mm
on
area
Private
area
De
signB
uilt fo
rm an
d o
pen
space
Material selectio
n
Green
/ inn
ovative featu
res
Need
Facilities
Equ
ipm
ent
Health
Clean
liness &
hygien
e
Main
ten
ance
SafetySecu
rity
Pro
du
ctivityStaff p
erform
ance
Acce
ssibility
Entran
ce / Exit
To ro
om
Disab
led
4.7 Post Occupancy Evaluation (POE)4.7.2 Questionnaire Data Collection
Private
area
No
. of
peo
ple
4.0 Case Study

4.7 Post Occupancy Evaluation (POE)4.7.3 Data Analysis – Temperature
0
2
4
6
8
10
12
VeryUnsatisfied
Unsatisfied Neutral Satisfied VerySatisfied
No
. of
peo
ple
Day Night
4.0 Case Study
Most of the spaces are considerably providing comfortabletemperature throughout. To achieve even better, the atriumspace should be attempted to lower the room temperaturein the day as the sunlight is allowed to directly penetratefrom above and warm up the space to certain extent. Figure 4.7.3a: Sunlight penetration and warm up the space

4.7 Post Occupancy Evaluation (POE)4.7.4 Data Analysis – Lighting
0
2
4
6
8
10
VeryUnsatisfied
Unsatisfied Neutral Satisfied VerySatisfied
No
. of
peo
ple
Common area Private area
Most of the spaces have natural lighting due to the longskylight at the atrium and the porous façade of the building.The façades are wrapped with a layer of bricks laid in such amanner that there are pockets of holes which allow daylightto enter. Averagely, the lighting is sufficient except for thehotel rooms on the 2nd floor. The rooms are fully dependenton artificial lighting whereas those on the 3rd and 4th floorhave various kinds of openings.
Figure 4.7.4a: Barely sufficient lighting at the corridor
Figure 4.7.4b:Queens room without window
Figure 4.7.4c: Skylight and various room openings
4.0 Case Study

4.7 Post Occupancy Evaluation (POE)4.7.5 Data Analysis – Air Quality
0
2
4
6
8
10
12
14
VeryUnsatisfied
Unsatisfied Neutral Satisfied VerySatisfied
No
. of
peo
ple
Common area Private area
Figure 4.7.5a Porous building facade
Figure 4.7.5b: Air conditioned reception area
Figure 4.7.5c: Atrium skylight
The air quality inside the building is mainly controlled by thenatural ventilation through the porous façade and atriumfaçade. Air circulators are also used such as ceiling fan at thecorridor and air-conditioner at the reception area. There isno direct air pollution from the external street due to thelevel difference as the hotel is located on the 2nd floor andabove.
4.0 Case Study

4.7 Post Occupancy Evaluation (POE)4.7.6 Data Analysis – Design
0
2
4
6
8
10
12
VeryUnsatisfied
Unsatisfied Neutral Satisfied VerySatisfied
No
. of
peo
ple
Built form and open space Material Selection
Green / innovative feature
The users and guests are satisfied with the design of theLantern Hotel in terms of the built form and open space, theselection of materials and also the green features.
Figure 4.7.6a: Brick exposing wall
Figure 4.76b: Open decking on the 2nd floor
Figure 4.76c: Green curtains
4.0 Case Study

4.7 Post Occupancy Evaluation4.7.7 Proposal 1
Figure 4.7.7a: Skylight (before edited) Figure 4.7.7b: Skylight (after edited)
Some glazing panels on the roof canpotentially be changed into either solid orsemi-transparent panels to filter direct andluminous sunlight upon the atrium space.Lesser penetration of direct sunlight wouldindirectly lower the indoor temperature aswell.
The play of arrangement, or design orderof the paneling can be thoughtfullymaneuver to achieve aesthetic quality tocertain extent.
4.0 Case Study

Figure 4.7.8a: Atrium Space (before edited) Figure 4.7.8b: Atrium Space (after edited)
To filter the direct sunlight, another alternativecould well be the integration of green plantingson/from the roof. Not only it is more convenient formaintenance, the plantings can also adds toaesthetic purpose and experiential quality due tothe tones of shade casted by shadow.
Figure 4.7.2c: Atrium Space (before edited)
Figure 4.7.2d: Atrium Space (after edited)
4.7 Post Occupancy Evaluation4.7.8 Proposal 1a
4.0 Case Study

Issue:Existing corridor located at 2F, 3F and 4F have to rely on artificial lighting even during daytime. User experience is very much differentas they entered from the center courtyard as the strong and natural sunlight penetrate into the building. Upon turning into corridorthey experience dark, long and narrow corridor which evokes discomfort.
Figure 4.7.9a: Image above shows insufficient natural lighting penetrated into corridor, therefore artificial corridor light have to be switched on during daytime.
Figure 4.7.9b: Section above highlights lack ofnatural lighting in existing corridors, andamendment can be done to allow penetration ofsunlight.
4.7 Post Occupancy Evaluation4.7.9 Proposal 2
4.0 Case Study

Figure 4.7.9c: Show the idea of frosted glass walkway from highest floor to allow direct sunlight penetration to lower floor.
Proposal for the corridor:In order to allow more natural light penetration into the corridor, we proposal to install a minimum 300mm width frosted glass walk way on the slab of corridor. This allow penetration of direct natural Sunlight from highest floor down to 2F.
Risk: Possibility of poor workmanship and obstruction of services such as sanitary piping and structure beam crossing through the floor slab. The proposed frosted glass walk way is suggested to not exceed more than 1500mm length in order to not obstruct the room entrances.
Figure 4.7.8e: Plans above show the location of proposal glass walkway.
4.7 Post Occupancy Evaluation4.7.9 Proposal 2
Figure 4.7.9d: Proposal of installed frosted glass walkway on the existing corridor.
4.0 Case Study

All the hotel rooms on the 2nd floor are fully enclosed without any openings. The rooms are relatively darkercompared to the rooms above. Hence, openable windows could be added above eye level to allow natural lightingand ventilation yet maintaining the privacy of the room.
Figure 4.7.10a: Before adding window Figure 4.7.10b: After adding window
4.7 Post Occupancy Evaluation4.7.10 Proposal 3
4.0 Case Study

Figure 4.7.11a: New locations of windows
The current locations of the windows on the east wall are not aligned with the corridor. Cross ventilation is not efficiently achieved. Windows are then suggested to be relocated or added to align with corridor in order to maximize the natural ventilation across the building.
4.7 Post Occupancy Evaluation4.7.11 Proposal 4
4.0 Case Study

5.0 Site Analysis 5.1 Introduction
The site situated in between Jalan Hs Lee and Jalan Petaling (Petaling Street Flea Market) which used to be the high streetsin the past and the populated areas today. In the past, the site itself was occupied by the famous Madras Theatreoperated by Shaw Brothers between 1939 and 1978. It was considered the main gather point for the Chineseentertainment. However, on 1978, a huge fire destroyed the theatre and left the land empty until today serving as parkinglot to the public.
Figure 5.1a: Site Plan Figure5.1b: Madras Theatre

5.0 Site Analysis 5.2 Site Images
Figure 5.2b : View of South Entrance
Figure 5.2d: Panoramic view at North of the site
Figure 5.2a: View of North West Entrance
Figure 5.2c: View towards South

5.0 Site Analysis 5.3 Sun Orientation
The sun path diagram indicates the positioning of sun changes in the sky through the day and year. The sun rise, sun set, orthe duration of sun being above the horizon may vary on different days in a year as well as the latitude.
Figure 5.3a: Sun Path Diagram on site plan
Gaisma.com115.134.142.37, 2017-10-17TO7:46

5.0 Site Analysis 5.4 Wind Rose
Figure 5.4a: Wind Rose Diagram on site plan
The wind rose diagram indicates the frequency and speed of wind blowing from every direction. In this speed distributionwind rose, winds from the ENE and S are the most regular which falls into the range of >12.

5.0 Site Analysis 5.5 Lighting Data Collection
Figure 5.5a: Lighting Testing Points on Site Plan
Area/Time
9 AM 1 PM 5 PM 8 PM
A 200 200 120 11
B 150 150 90 0
C 150 150 3600 0
D 7100 10250 6500 0
E 13500 11105 6500 51
F 13500 11115 45000 0
G 3800 10200 25000 0
H 3500 11500 6500 3
I 6900 10350 15000 2
J 5000 10580 6500 80
K 7100 10250 6500 0
L 13250 11115 6500 0
M 5000 10580 6500 3
N 6500 11500 7800 50
O 13250 11115 6500 2
P 11250 11115 6500 3
Table 5.5a: Lighting (Lux) Table of Site
Highest
Lowest

Figure 5.5b: Lighting Level Indications On Site
9a.m 1p.m 5p.m 8p.m
EAST SOUTH
CENTER
NORTH WEST
NORTH
5.0 Site Analysis 5.5 Lighting Data Organization

0
5000
10000
15000
20000
25000
30000
35000
40000
45000
50000
A B C D E F G H I J K L M N O P
9.00AM
1.00PM
5.00PM
8.00PM
5.0 Site Analysis 5.5 Lighting Data Analysis
Graph 5.5a: Comparisons of Lighting (Lux) of Site
Finding 1:Area “A”, is least illuminated at all timedue to narrow alley neighbored by tallhotel building.
Areas “B” and “C” are the leastilluminated at all times due to thegreen buffer in the South-West of site.
Finding 2:Area “F” is most illuminated in theevening due to the more exposure atcenter of site.
Area “G” is second most illuminateddue to the more exposure to thewestern sun.
Common Findings:All areas at site are generally lowilluminated at night, and besides areas“A”, “B”, “C”, remaining areas haveconsistent illumination in the noon.
Finding 1 Finding 2

5.0 Site Analysis 5.6 Shadow Analysis
Figure 5.6a: Summer Solstice Shadow Analysis
Maximum shading:Central Top Portion
Moderate shading:South-West, South-East, North-West
Minimal Shading:Central Bottom Portion (South), North, North-East

Figure 5.6b: Winter Solstice Shadow Analysis
Maximum shading:South-West, North
Moderate shading:East, South-East
Minimal Shading:West, Central
5.0 Site Analysis 5.6 Shadow Analysis

Case study
Site
Proposed building orientation
Strong wind
Proposed green buffer/ public area
5.0 Site Analysis 5.6 Shadow Analysis (Proposal & Recommendation)
The building on site is recommended to be located within theshaded area, while the area that is more exposed to sunlight isrecommended for green buffer or public space to reduce theheat gained in the area.
The building is recommended to be orientated towards North-East, to capture the strong wind flow coming from North-Eastand South of the site. More openings can be designed on thesefacades to manipulate cross ventilation and thus lower energy.Figure 5.6c: Superimposed Summer & Winter Solstice Shadow Analysis

5.0 Site Analysis 5.7 Temperature Data Collection
Figure 5.7a: Temperature Testing Points on Site Plan
Area/Time
9 AM 1 PM 5 PM 8 PM
A 30 33.5 32 30.8
B 28.2 32.6 35.4 31.5
C 28 33.4 34.1 31.6
D 28.7 34.8 34.4 32.5
E 32 34 34.5 31.5
F 31.5 34.8 38.8 31.5
G 29.1 35.3 36.5 31.7
H 29.1 32.6 34.8 31.5
I 32.7 35.5 35.6 31.5
J 29.5 35.4 35.4 31.7
K 29.5 33 34 31.5
L 28.5 33 34 31.5
M 30 32 35 31
N 32.7 35.5 35.6 31.5
O 29.1 32.6 34.8 31.5
P 29.1 32.6 34.8 31.5
Table 5.7b: Temperature (°C) Table of Site
Highest
Lowest

5.0 Site Analysis 5.7 Temperature Data Organization
Figure 5.7b: Temperature Level Indications On Site
9a.m 1p.m 5p.m 8p.m
EAST SOUTH
CENTER
NORTH WEST
NORTH

0
5
10
15
20
25
30
35
40
45
A B C D E F G H I J K L M N O P
9.00AM
1.00PM
5.00PM
8.00PM
5.0 Site Analysis 5.7 Temperature Data Analysis
Graph 5.7a: Comparisons of Temperature (°C) of Site
Finding 1:Areas “F” and “G” have the highesttemperature in the evening due to themore exposure of western sun.
Common Findings:All areas at site have generally lowtemperature in the morning, andhighest temperature in the eveningfollowed by afternoon.
Finding 1

5.0 Site Analysis 5.7.1 Humidity Data Collection
Figure 5.7.1a: Humidity Testing Points on Site Plan
Area/Time
9 AM 1 PM 5 PM 8 PM
A 75 55 38 65
B 86 63 52 67
C 86 63 55 71
D 82 57 55 72
E 84 61 50 68
F 75 57 40 68
G 82 60 48 68
H 82 57 48 68
I 67 56 49 69
J 79 56 56 69
K 75 55 38 65
L 82 57 48 68
M 79 56 56 69
N 78 53 53 68
O 80 56 56 69
P 80 56 56 69
Table 5.7.1a: Humidity (%) Table of Site
Highest
Lowest

9a.m 1p.m 5p.m 8p.m
5.0 Site Analysis 5.7.1 Humidity Data Organization
Figure 5.7b: Humidity Level Indications On Site
EAST SOUTH
CENTER
NORTH WEST
NORTH

0
10
20
30
40
50
60
70
80
90
100
A B C D E F G H I J K L M N O P
9.00AM
1.00PM
5.00PM
8.00PM
5.0 Site Analysis 5.7.1 Humidity Data Analysis
Graph 5.7.1a: Comparisons of Humidity (%) of Site
Finding 1:Humidity level is generally high in themorning as compared to other hours, butlowest in area “I” due to its exposure inthe center of the site.
Common Findings:Humidity level is generally low in theevening at site due to the fact the site isexposed more towards the evening sun.
Finding 1
Related Documents


