Estonian mires J. PAAL Abstract: In Estonia altogether 1.626 peatlands with an area over 10 ha are recorded, 143 mires extend over more than 1.000 ha. Mires occur all across the country but the species-rich fen areas are situated mainly on Saaremaa Island and in the western part of the Estonian mainland, mixotrophic bogs are found first of all in western and central Estonia, larger raised bogs are located in the southwestern, northeastern and central parts. The flora of vascular plants of Estonian natural mires includes 280 species; from these 230 occur in fens, 103 in transitional mires and 45 species in raised bogs, respec- tively. Among the Estonian mires five habitat site types and 11 subtypes have been established. Due to their species richness the most conspicuous mires on the North European scale are calcareous fens and spring fens. By 1980 about 1,006.300 ha of lands were ameliorated. Peat is one of the most important natural re- sources for Estonia; the yearly production in 1970-1990 reached about 2.5X10 6 tons (with 40% water content). In the recent years the amount of annual peat excavation has been 1.2-1.5 x 10 6 tons that ex- ceeds the natural peat accumulation rate two-three times. Moreover, comparing the annual emission range (0.8-1.6 x 10 6 tons of CO 2 -C) with the possible total annual carbon storing by peat accumulation (0.25-0.32 x 10 6 t CO 2 -C), it follows that the emission from drained fen sites alone is on the average four times higher than its total annual carbon accumulation. Adding the areas drained for forestry and industry purposes, we may reckon with up to 8-10 times higher emissions. Nearly natural conditions (in at least 2 / 3 part of a mire) have still been preserved in some 200 mires cov- ering a total area of about 310.000 ha. More than 100.000 ha of areas with mire vegetation are protected in Estonia by now, over 3 / 4 of which are ombrotrophic areas. Actual problems in wise usage of the Es- tonian mires are (1) overexploitation of peat resources, (2) increasing commercial pressure, (3) insuffi- cient rehabilitation of spoiled areas, (4) industrial pollution, (5) fires, (6) long-term drainage effects, (7) evolvement of protected mires network. Key words: biodiversity, classification, drainage, excavation, human impaxt, rehabilitation. Nomenclature: LAASIMER et al. (1993), INGERPUU et al. (1994), KUUSK et al. (1996, 2003). General features of Estonian nature Landforms and soils Although the territory of Estonia covers only 47.450 km 2 , its landscapes are of a var- ied and original character. The topography has developed its contemporary form as a re- sult of the erasing and accumulating action of the continental ice sheet and the subse- quent postglacial transgressions of the Baltic Sea. Estonia was freed from the glacier 13.500 -11.000 years ago (RAUKAS 1986). The crystalline basement lies deeper than 110 meters and so has no influence on re- cent landforms. The bedrock in North, East and Central Estonia consists mainly of Ordovician and Silurian carbonate lime- stones, marls and dolomites, whereas South Estonia is the region of Devonian sand- stones and locally of carbonate rocks. Moraines attain a more significant thickness (up to 200 m) in South Estonia. Orographically Estonia is a section of the East European Plain, being situated on- ly 0 to 317 m above sea level. The territory can be divided into two parts - Lower Esto- nia and Upper Estonia. The former was, fol- lowing the retreat of the ice, inundated by the sea for a considerably longer time than Upper Estonia (VAREP 1968). The western part of the country, includ- ing numerous islands and bays, and the big lake depressions in the eastern part belong Stapfia 85, zugleich Kataloge der OÖ. Landesmuseen Neue Serie 35 (2005), 117-146 117 © Biologiezentrum Linz/Austria; download unter www.biologiezentrum.at

Welcome message from author
This document is posted to help you gain knowledge. Please leave a comment to let me know what you think about it! Share it to your friends and learn new things together.
Transcript

Estonian mires
J. PAAL
Abstract: In Estonia altogether 1.626 peatlands with an area over 10 ha are recorded, 143 mires extend
over more than 1.000 ha. Mires occur all across the country but the species-rich fen areas are situated
mainly on Saaremaa Island and in the western part of the Estonian mainland, mixotrophic bogs are
found first of all in western and central Estonia, larger raised bogs are located in the southwestern,
northeastern and central parts. The flora of vascular plants of Estonian natural mires includes 280
species; from these 230 occur in fens, 103 in transitional mires and 45 species in raised bogs, respec-
tively. Among the Estonian mires five habitat site types and 11 subtypes have been established. Due to
their species richness the most conspicuous mires on the North European scale are calcareous fens and
spring fens.
By 1980 about 1,006.300 ha of lands were ameliorated. Peat is one of the most important natural re-
sources for Estonia; the yearly production in 1970-1990 reached about 2.5X10⁶ tons (with 40% water
content). In the recent years the amount of annual peat excavation has been 1.2-1.5 x 10⁶ tons that ex-
ceeds the natural peat accumulation rate two-three times. Moreover, comparing the annual emission
range (0.8-1.6 x 10⁶ tons of CO2-C) with the possible total annual carbon storing by peat accumulation
(0.25-0.32 x 10⁶ t CO2-C), it follows that the emission from drained fen sites alone is on the average
four times higher than its total annual carbon accumulation. Adding the areas drained for forestry and
industry purposes, we may reckon with up to 8-10 times higher emissions.
Nearly natural conditions (in at least 2/3 part of a mire) have still been preserved in some 200 mires cov-
ering a total area of about 310.000 ha. More than 100.000 ha of areas with mire vegetation are protected
in Estonia by now, over 3/4 of which are ombrotrophic areas. Actual problems in wise usage of the Es-
tonian mires are (1) overexploitation of peat resources, (2) increasing commercial pressure, (3) insuffi-
cient rehabilitation of spoiled areas, (4) industrial pollution, (5) fires, (6) long-term drainage effects, (7)
evolvement of protected mires network.
Key words: biodiversity, classification, drainage, excavation, human impaxt, rehabilitation.
Nomenclature: LAASIMER et al. (1993), INGERPUU et al. (1994), KUUSK et al. (1996, 2003).
General featuresof Estonian nature
Landforms and soils
Although the territory of Estonia covers
only 47.450 km2, its landscapes are of a var-
ied and original character. The topography
has developed its contemporary form as a re-
sult of the erasing and accumulating action
of the continental ice sheet and the subse-
quent postglacial transgressions of the Baltic
Sea. Estonia was freed from the glacier
13.500 -11.000 years ago (RAUKAS 1986).
The crystalline basement lies deeper than
110 meters and so has no influence on re-
cent landforms. The bedrock in North, East
and Central Estonia consists mainly of
Ordovician and Silurian carbonate lime-
stones, marls and dolomites, whereas South
Estonia is the region of Devonian sand-
stones and locally of carbonate rocks.
Moraines attain a more significant thickness
(up to 200 m) in South Estonia.
Orographically Estonia is a section of
the East European Plain, being situated on-
ly 0 to 317 m above sea level. The territory
can be divided into two parts - Lower Esto-
nia and Upper Estonia. The former was, fol-
lowing the retreat of the ice, inundated by
the sea for a considerably longer time than
Upper Estonia (VAREP 1968).
The western part of the country, includ-
ing numerous islands and bays, and the big
lake depressions in the eastern part belong
Stapfia 85, zugleich Katalogeder OÖ. Landesmuseen
Neue Serie 35 (2005), 117-146
117
© Biologiezentrum Linz/Austria; download unter www.biologiezentrum.at

Photo 1: Ridge-hollow-pool subtypeombrotrophic bog. Pöltsamaa bog, Alam-Pedja Nature Reserve.
to Lower Estonia. The limestone bedrock ofthe West Estonian islands and of the WestEstonian Lowland is mostly covered by thincalcareous soils overgrown with juniper,while forest areas, bogs, fens and marshes arealso represented. The depressions of LakePeipsi and Lake Vörtsjärv are covered by ex-tensive floodplain meadows, wetlands, andforests.
The landscapes of Upper Estonia aremore diverse, the moraine cover is thick,the soil more fertile, and the human popula-tion denser when compared with that ofLower Estonia. The uplands and heights areintersected by a number of river valleys withoutcrops of Devonian red sandstone onhigh river banks.
Calcareous (rendzina) and peat soilspredominate in North, Central and WestEstonia. In South Estonia podzols, peatypodzols and peat soils on tills and sands arewidespread. The most fertile sandy clayey-soils, related to brown soils, occur on yel-lowish-gray calcareous tills (REINTAM 1995).
Climate
Estonia is situated climatically in themixed forest subdistrict of the temperatezone. It is characterized by warm summersand by moderately mild winters. The vege-tation period with average twenty-four-hourair temperatures above +5°C lasts 165-185days; the period with average air tempera-ture above +10°C lasts 110-135 days. The
climate is humid, especially in coastal re-gions. The mean annual amount of precipi-tation is highest in South Estonia and in thearea of the Pandivere Upland (up to 700mm per year), and lowest on the large is-lands of the Baltic Sea (about 550 mm)(EESTI NSV KLllMAATLAS 1969). Since theannual precipitation exceeds evaporationroughly twofold, the climate is excessivelydamp.
Vegetation
The vegetation of Estonia is rather di-verse. Forests, mires and grasslands alternatewith cultivated land. Forests make up 44-47% of the territory, including about 7% ofcoppices and brushwood (ETVERK & SEIN1995), grasslands up to 20% (PETERSON1994). Peatlands with peat deposits thickerthan 30 cm cover approximately 21.5% ofthe territory. If water-logged areas with peatdeposits less than 30 cm are included, 31%of Estonia could be considered to be coveredby peat or peaty soils (VALK 1988). Thus, bythe proportion of territory paludification Es-tonia has the second place in the northernEurope after Finland (ALLIKVEE & ILOMETS1995).
Geobotanically, Estonia belongs to theboreo-nemoral vegetation zone, as doesLatvia, the northern part of Lithuania, theadjacent part of European Russia, the south-ernmost part of Finland, a broad belt acrossSweden and the southern part of Norway(MOEN 1999). In forests tree canopy Nor-way spruce (Picea abies), silver birch (Betula
pendula) and Scotch pine (Pinus sylvestris)
are the dominating species, to a lesser ex-tent also small leaved lime (Tilia cordata),
pedunculate oak (Quercus robur), commonash (Fraxinus excelsior) and European aspen(Populus tremula) are represented.
Black alder (AInus giuonosa) and downy
birch (Betula pubescens), rarely spruce, dom-
inate in the canopy layer of swamp forests in
which Crepis paludosa, Thelypteris palustris,
Caüa palusms, Crrsium oleracevm, Filipmdula
uhnaria etc. are characteristic of the herb
layer. Birch, aspen and grey alder (AInus in-
cana) forests are, as a rule, secondary in Es-
tonia, replacing other forest types after
clearcutting or covering abandoned fields
and grasslands.
118
© Biologiezentrum Linz/Austria; download unter www.biologiezentrum.at

Grasslands have appeared in Estonia as a
consequence of the felling of forests and
subsequent continuous mowing or pastur-
ing. Paludified grasslands (with a peat layer
less than 30 cm) on calcium-poor tills are
characterized by communities of Carex nigra
and C . panicea, Deschampsia cespitosa, and
Nardus stricta. They have evolved mostly
from swampy birch forests. Fens and wet
meadows, particularly rich in plant species,
are found on calcareous tills or bedrock. For
these habitats typical communities are such
as Primulo-Seslerietum, Caricetum hos-
tianae and Caricetum davallianae (PAAL
1997).
Mire biodiversity
Levels of biodiversity
The most prevalent usage of the term'biodiversity1 is a synonym for 'variety of life'(GASTON 1996). The multiple dimensionsand levels at which this variety, diversity orheterogeneity can be observed has oftenbeen emphasized. The Convention on Bio-logical Diversity (GLOWKA et al. 1994) de-
clares that "'biological diversity' means thevariability among living organisms from allsources including, inter alia, terrestrial, ma-rine and other aquatic ecosystems and theecological complexes of which they are part;this includes diversity within species, be-tween species and of ecosystems."
Thus, in contemporary ecology and itsapplications the subject under investigationis more and more differentiated, making itreasonable to deal with the biodiversity ofnature on different levels and to use ade-quate classification approaches for it. Instudies of mire biodiversity six basic levelscan be differentiated according to the scaleand objects under investigation (MASING &PAAL 1998, MASING et al. 2000). Tab. 1
presents these levels in mires biodiversityresearch together with corresponding exam-ples from Estonian mire studies.
Species diversity
The fist attempts to analyse the totalnumber of species characteristic to the Es-tonian mires were undertaken in the 1980s.It was estimated that in mires grow 35bryophyte species of Marchantiopsiaa, 118
Photo 2: Selaginellaselaginoides is growingmainly in calcareous fens innortheastern and northernEstonia.
Tab. 1: Levels and subjects in mires biodiversity study and Estonian literature referenceswhere they are discussed.
Levels and * subjectsunder investigation
Population level* clone development* reproduction strategies
Species level
* species of plants.fungi andanimals
* life and growth forms
* consortia, guilds, synusia
Coenotic level* plant communities
(phytocoenoses)
* fungal communities(mycocoenoses)
* animal communities as partsof biotic communities(biocoenoses)
Ecosystem level* biotopes, ecotopes, habitats,
sites
Landscape level
* mire complexes
Regional level* mire provinces and zones
Classification approachesand units
population structure and types
traditional taxonomical unitsand types of their
geographical ranges
life form classification
ecological groups with certainstatus in food chains andother relationships
syntaxonomical units
habitat or site types, mire types,forest types
landscape units,mire typology (s.l.)
regional units
References
MASING 1982, REIER 1982
TRASS 1960, 1994, JARVA& PARMASTO 1980, KALA MEES &RAITVIIR 1982, LAASIMER et al.1993, INGERPUU et al. 1994, LEIBAKetal . 1994, KUUSK et al. 1996,2003, VIIDALEPP & REMM 1996
BOTCH & MASING 1983
MASING 1981, PAAL 1994,REIER 1995
LJWMAA 1933, TRASS 1958, 1994,LAASIMER 1965, MASING 1982,1984, MASING & PAAL 1998
KALAMEES 1982
HABERMAN 1959, LJLLELEHT 1998,MASING et al. 2000
MASING 1975, LOHMUS 1984,PAAL1997
AAVIKSOO et al. 1997,2000,MASING 1972, 1974,1982, 1984
THOMSON 1924,BOTCH & MASING 1983, VALK 1988
119
© Biologiezentrum Linz/Austria; download unter www.biologiezentrum.at

Photo 4: Quacking fens are often surrounding lakes. Latsejärve Lake, Karula National Park.
Photo 3: Treed fen in early spring. Alam-Pedja Nature Reserve.
species of Bryopsida, among them 35 Sphag-num spp. (KANNUKENE & KASK 1982). From
vascular plants are represented 18 species ofPteridophyta, 3 species of Gymnospermae and355 species of Angiospermae (KASK 1982).Moreover, in mires occur more than 300species of Aranei (ViLBASTE 1980, 1981),more than 1600 species of Insecta, 4 speciesof Amphibia, 3 species of Reptilia, more than200 species of Aves, 11 species of Mammalia
(MAAVARA 1988)
Still, TRASS (1994) has pointed out thatthis compendiums do not help very much inunderstanding mire flora because the au-thors do not define what is a "true" mireplant, and the typology of mire plants islacking in cited publications. According tohis analysis, the flora of vascular plants ofEstonian natural mires includes 280 species;from these 230 occur in fens, 103 in transi-tional mires and 45 species in raised bogs,respectively. 52% of the 280 species are fac-ultative, 36% obligate-facultative and only12% obligate telmatophytes, which demon-strates the very low specific character of themire flora.
Typological diversity
Result of communities, habitats, ecosys-tems or landscapes diversity assessment de-pends directly on the applied classificationsystems; the same objects can be classifiedby different parameters and from differentaspects. Therefore, it is necessary to charac-terize briefly the main approaches used forEstonian mire classification.
I. The most popular classification ofmires has been derived from C. WEBER'S(1908) fundamental division and is based onthe developmental stage and trophic condi-tions as follows:
• Eutrophic mires, rich in nutrients, low-ly-ing in depressions (Niedermoore,Niedemngsmoore in German),
• Mesotrophic or transitional mires (Uber-gangsmoore),
Photo 5: Spring fen in early spring. Völlinguspring, Endla Nature Reserve.
120
© Biologiezentrum Linz/Austria; download unter www.biologiezentrum.at

• Oligotrophic mires, poor in nutrients andmostly situated "high" in watershed areas(Hochmoore), named also bogs.This division was adapted to Estonianconditions using also vegetation charac-ters (MASING 1975; Tab. 2).
II. When hydrological characteristicswere recognized as the main factor for mireformation, a classification based on the hy-drochemical conditions and water sourceswas introduced. Following this approach,Estonian mires were classified (MASING1975, ILOMETS & KALLAS 1995) as :
• Minerotrophic mires, supplied by variouswater sources;
• Soligenous, supplied by springs,
• Topogenous, supplied by normal groundwater,
• Limnogenous, supplied by floods or form-ing through the overgrowing of waterbod-ies,
• Ombrotrophic mires, supplied by rain wa-ter only.
The same principle has been widely usedin Scandinavian and other Baltic countries,in Russia and Germany.
III. In the course of vegetation map-ping, geobotanical studies and aerial surveysof mires, the prevailing vegetation layer hasbeen found to be the best suitable basis formire classification (AAV1KSOO et al. 1997,2000, MASING et al. 2000):
• Forests on peatland (swamp forest, carr,
Moorwald, Bruch etc.) - with a continu-
ous tree layer,
• Wooded peatlands with sparse trees,• Shrub peatlands with dominating Sdix
spp., Myrica gale etc.,• Dwarf-shrub peatlands with dominating
Cailuna vulgaris, Ledum palustre, Vactinium
uliginosum etc.,
• Grass-covered peatlands with Carex spp.,Trichophorum spp. and Eriophorum spp.,
• Moss-rich peatlands with prevailingSphagnum spp. cover.
IV. Defining in nature homogeneous ar-eas representing a comparatively steadycomplex of ecological conditions is alwaysdisputable and depends on the spatial ortemporal scale considered. Still, one of themost striking physiognomic features ofraised bogs is their mosaicness or patchiness,
Tab. 2: Differences in mires due to trophic conditions (after LAASIMER & MASING 1995).
Characters
Water supply andtrophic states
Land form of themire as a whole
Microtopography
Tree layer
Shrub layer
Dwarf shrub layer
Grass and herblayer (field layer)
Moss layer
Peat
Eutrophk
precipitation, ground,surface and flood water
flat or concave
even or with grass(sedge) tussocks
Mesotrophic
precipitation, littleinfluence of groundwater
flat
cotton-grass tussocksand moss hummocks
Betula pubescens, Betula pubescens andAlnus glutinosa. sparse Pinus sylvesths onlyPicea abies, seldom Pinus sylvestris
Betula humilis, Myricagale, Salix ssp.
absent
various grasses, herbsand forbs, especiallyCarex ssp.
mainly Bryales
mainly sedge or woodypeat suitable for fueland fertilising
Oligotrophic
precipitationwater only
convex or flat
a mosaic of mosshummocks anddepressions
Pinus sylvestris only,or/and sparse Betulapubescens
Myrica gale, sparse Salix ssp. absent
Cailuna vulgaris, Ledum palustre, Andromedapolifolia, Chamaedaphne calyculata, Vacciniumuliginosum on hummocks
in depressions eutrophicplants, often Comarumpalustre, Menyanthestrifoliata, Trichophorumalpinum, Carexlasiocarpa
Eriophorum vaginatum,Trichophorum cespi-tosum, Rhynchosporaalba, Rubus chamae-morus and Drosera ssp.
mainly Sphagnales, often Polytrichum strictum,Aulacomnium palustre
mainly sedge peatsuitable for fuel andlitter
only sphagnum peatsuitable for litter andgardening
especially well determinable from air. This
mosaicness has often rather regular concen-
tric, eccentric, or striped structure, and is
closely associated with the partition of bog
surface into areas of different ecological
quality. Thus, it seems logical to establish
the bogs classification just on the basis of
these quite easily distingushable morpholog-
ical components (MASING 1975, MASING et
al. 2000). It has already been done so in thePhoto 6: Spring fen in early spring.Oostriku spring, Endla Nature Reserve.
121
© Biologiezentrum Linz/Austria; download unter www.biologiezentrum.at

Photo 7: Bog forest. Meenikunno bog,Pölvamaa district.
Photo 8: Mock-hollow subtypeombrotrophic bog. Tolkuse bog, Pärnumaadistrict.
course of almost a century by numerous mire
researchers and usually the scope and rank-
ing of bog components by various authors
has been remarkably overlapping, only the
terminology differs.
According to the proposal of IMCG
Workshop on Global Mire Classification,
Greifswald, March 1998, the elementary
components of mire landscapes or ecosys-
tems, (1) corresponding to the spatial scale
10 '-10' m2, (2) having a relative homoge-
neous vegetation or a homogeneous small-
scale mosaic of that and, (3) having a cer-
tain quality of abiotic conditions, should to
be called a 'nanotope'. Earlier they were
named as bog features (SjÖRS 1948), micro-forms (MASING 1982) etc. It is commonlyrecognized that the main nanotopes ofraised bogs are hummocks or hummockridges, hollows and pools. In addition, fun-nels, rivulets and pool islands having usual-ly a comparatively limited area can be alsodelineated here (MASING 1975, MASING etal. 2000). It is also well known, that on thenanotope level a good correlation exists be-tween the vegetation, water level, water in-filtration, flow and evaporation, pH, redoxpotential, decomposition rate of the plantlitter etc. (e.g. SjÖRS 1950, IVANOV 1981,LINDSAY et al. 1985, MALMER 1985, JENIK &
SOUKUPOVÄ 1992, KAROFELD 1999). Thus, a
classification system of nanotopes will large-ly be at once a classification of environmen-tal conditions as well as of vegetation. Ofcourse, the hierarchical classification ofnanotopes cannot totally satisfy the de-mands of hydrologic or vegetation classifica-tion, so as the nanotopes are distinguishedin a quite a rough manner and are not so nu-merous as the plant communities, or theywill not reflect all the initimate peculiaritiesof water and nutrient conditions. For thatpurpose special classifications are needed.
On a larger spatial scale (lOMO6 m2)
the nanotopes form the next hierarchical
level of bog structure, 'microtope', either
combining mutually or alone (if they occu-
py a larger area); earlier synonyms: complex
- OSVALD 1923; microlandscape - GALKINA
1946; site - SjÖRS 1948, facies - LOPATIN
1954 etc.). The microtopes constitute on
the spatial scale 105—10" m2 a bog, or meso-
tope (synonyms: mesolandscape - GALKINA
1946; complex - SjÖRS 1948; urochishche -
LOPATIN 1954 etc.).
However, it seems that the spatial scale
limits of microtopes need a correction at
least for two reasons. First, in the discussed
system the scale from 10' to 104 m2 is not
covered at all and, second, the lower limit
for microtopes - 104 m2 - is obviously too
large. In nature (e.g. in southern Estonia
hilly landscape) we can find numerous
raised bogs (mesotopes) having a size about
1 ha (i.e. 104 nr) or even less and being
made up of numerous microtopes. There-
fore, according to my experience, the lower
limit of the microtope spatial scale should
122
© Biologiezentrum Linz/Austria; download unter www.biologiezentrum.at

be diminished up to the upper limit of nan-
otopes and, correspondingly, the corrected
spatial scale for microtopes would be
lO'-lO6 m2.
Traditionally, raised bogs are classifiedaccording to (1) whether there does exist atree layer or not (open bog expanse, treedbog, bog forest), (2) whether they includewaterbodies and, (3) what kind of micro-topes (microtopography) they prevailinglyinclude. It is possible to represent all thesecomponents on a two-dimensional simplescheme (Fig. 1) that gives us at once also akey for naming the mesotopes, i.e. the bogstructures of higher hierarchical levels. Thebog mesotopes (complexes, massifs) differmainly by their surface form (concave, flat,convex) and by the regularity of microtopeslocation in the direction from the mire cen-tre towards the mire margin. Therefore, thetype of a bog mesotope could be character-ized with an average percentage of areas ofdifferent microtopes, and the mesotopescould be named according to the dominat-ing microtopes. The less prominent compo-nents (e.g. those covering less than 10% ofthe considered area) could be skipped in thenames. Establishing of microtopes propor-tion constituting the mesotope will give us,moreover, information about the develop-mental stage of the bogs, so as the pattern ofbog mesotope surface depends on the ageand inclination. ELINA (1971) has estab-lished that hummock-hollow complexes willdevelop by inclination of bog surface0.0005-0.006%. With increasing the bogsurface inclination from 0.001 to 0.005%,the percentage of ridges increases from 20 to80 and the percentage of hollows corre-spondingly decreases; in concordance withthat the vegetation will change as well. Forexample, a Sphagnum-Eriophorum-Scheuchz-
eria-community will develop usually only ina case when the per cent of ridges is lessthan 50 and bog surface inclination lessthan 0.003% (ROMANOVA 1961). This phys-iognomic-structural principle of raised bogsclassification is convenient and easy to usefor carthographic purposes, or for the analy-sis of aerophotos as well.
It should be mentioned also, that if acertain structural component covers a re-markably larger area than the conventional
Components:
Bog forest Treedcommunity
Hummockor ridge
community
Hollow (lawnand/or carpet)
community
Bog lake/poolcommunity
I I 1 1 1Micro- or mesotopes consisting of predominantly one component:
Bog forestmicro/mesotope
Treedmicro/mesotope
Hummockmicro/mesotope
Hollowmicro/mesotope
Bog lake/poolmicro/mesotope
Micro- or mesotopes consisting of two components:
Treed-hum-mock micro/
mesotope
Hummock-hollow micro/
mesotope
Hummock-poolmicro/mesotope
Hollow-poolmicro/mesotope
Micro- or mesotopes consisting of three components:
Treed-ridge(hummock)-hollow micro/mesotope
Treed-ridge(hummock)-pool micro/mesotope
Ridge(hummock)-hollow-pool micro/mesotope
Micro- or mesotopes consisting of four components:
Treed-ridge(hummock)-hollow-pool micro/mesotope
scale limits mentioned above, it would be
treated as a component of the next higher
hierarchical level. Rather often, e.g. a com-
paratively large raised bog (mesotope), hav-
ing for example an area of approximately 106
mz, can consist only of hummock-hollow
microtopes, and then the mesotope type will
be named in the same manner as the micro-
tope type (Fig. 1).
The regular distribution of mosaicness is
inherent for some types of minerotrophic
mires (e.g. aapa-mires) too, and so the prin-
ciples discussed above could be, at least to
some extent, useful also for classification of
mires in a broader sense.
V. Certain synthesis of the approaches
discussed above can be achieved using the
concept of a hierarchical habitat site type
classification where the topography, soil,
water regime, trophic conditions and also
species composition of communities are all
considered (PAAL 1997, MASING et al.
Fig. 1: Components of raised bogs -forested/treed bog communities, usuallycharacteristic for bog margin, and typicalbog expanse communities connected withparticular nanotopes - forming independency of spatial scale microtopesand/or mesotopes. Modified after MASING(1982, 1984).
123
© Biologiezentrum Linz/Austria; download unter www.biologiezentrum.at

Photo 10: Ridge-hollowsubtype ombrotrophic bog.
Tolkuse bog, Pärnumaadistrict.
Photo 9: Hummock subtype ombrotrophicbog. Alam-Pedja Nature Reserve.
2000). The mire habitat site types are dis-tinguished by prevailing trophic conditionsand by genesis (heath moors versus raisedbogs) of mires, the site subtypes are differen-tiated further by hydrological and landscapepeculiarities (eutrophic fens), by develop-ment stage and topographical features(quaking fens and bogs) or by microtopes(resp. mesotopes) characteristics (raisedbogs), while the plant community types areestimated by their dominanting species, be-ing in mire plant cover almost always the in-dicator species as well.
Among the Estonian mires five habitatsite types and 11 subtypes have been estab-lished (Tab. 3; PAAL 2001). The evaluationof species richness of site types in Tab. 3 isderived mostly indirectly from published da-ta, since they have been collected for otherpurposes and are not dealing specificallywith problems of diversity.
For better international communicationthe plant community names in Tab. 3 ares iven in Latin following the pattern of theinternational code of phytosociologicalnomenclature (BARKMAN et al. 1986).
However, since only some groups ofcommunities in Estonia have so far been in-vestigated and classified on the basis of theZürich-Montpellier phytosociological me-thodology, the communities referred to donot always correspond to those in CentralEuropean vegetation classification systems.
Distribution of mires
Mires occur all across the country (Fig.2). The average thickness of the peat depos-it is 3.2 m (VALK 1988), while the maximumdepth recorded is up to 18 m (PUNNING etal. 1995). Minerotrophic fens are the mostwidespread, occupying 515.000 ha or 57% ofthe total mire area. Mixotrophic (transi-tional) mires are represented on 114.000 ha(12%) and bogs on 278.000 ha (31%)(TRUU et al. 1964). There are altogether1,626 peatlands with an area over 10 ha and
Photo 11: Ridge-hollow-pool subtypeombrotrophic bog. Männikjärve bog, EndlaNature Reserve.
124
© Biologiezentrum Linz/Austria; download unter www.biologiezentrum.at

Tab. 3: Typological diversity and species richness of Estonian mires. Species richness intervals (number of vascular plant species, Bryalesand Sphagnales in 4 m2): * < 15, ** 15-30, * * * > 30. Human impact classes: W - without direct human impact, F - former human impact(e. g. drainage, fire), P - permanent human impact (e.g. hay making, grazing), S - strong human impact (e. g. intensive drainage, forestplantation). In parenthesis a synonymous name is presented, in brackets is a possible attribute of the name.
Type group Site type Site subtype Main communities Species richness Human impact
Eutrophic to meso-eutrophic minero-trophic) fens
Eutrophic fenPrimulo-SeslerietumCaricetum davallianaeSchoeno-OrepanocladetumCaricetum appropiquatae-cespitosaeCarici paniceae-SeslerietumMolinietum caeruleaeCladietum marisciCaricetum hostianaeCaricetum buxbaumiiSchoenetum nigricantis
** (*") W (F, P)
Floodplain fenCalamagrostietum strictaeCaricetum distichaePolygono-CircietumCaricetum acutaeCaricetum vesicario-rostrataeCarici paniceae-SeslerietumCaricetum diandro-nigraeCaricetum appropinquato-cespitosaeCaricetum elataeDrepanocalado-Caricetum lasiocarpaePhragmitetum australisPhragmiteo-Schoenoplectetum
F(W)
Spring fen WCarici lasiocarpae-EriophoretumCaricetum davallianaeCaricetum diandraeScorpidio-Schoenetum
Meso-eutrophic fenGeranio palustris-FilipenduletumCaricetum appropinquatae-cespitosaeCaricetum vesicariae-rostrataeCaricetum acutiformisCaricetum elataeEriophoretum angustifoliiCaricetum paniceae-nigraeDrepanoclado-Caricetum lasiocarpaeCalamagrostetum canescentis
'(**) W, F
Meso-eutrophicquaking fen Scorpidio-Schoenetum
Phragmitetum australisEquisetetum fluviatilis
'(**) W
Mesotrophic [Wooded] meso(mixotrophic) bogs- trophicbog
Sphagno-Trichophoretum alpiniSphagno-Caricetum lasiocarpaeSphagno-Caricetum rostrataeSphagno-Eriophoretum vaginatiSphagno-Trichophoretum cespitosaeSphagno-Caricetum limosae
*(") W
Mesotrophic quakingbog Scorpidio-Caricetum lasiocarpae
Caricetum diandraeCariceto limosae-Menyanthetum
' ( * * ) W
Oligotrophic(ombrotrophic) bogs Heath moor
Calluno-[Sphagno]-PinetumLedo-[Sphagno]-Pinetum
F, P, S
Raised bog [Wooded] hummockbog Calluno-Cladinetum
Calluno-Sphagnetum fusciEriophoro-Sphagnetum fusciTrichophoro-Sphagnetum fusciCalluno-Sphagnetum magellanici
W, F, P
125
© Biologiezentrum Linz/Austria; download unter www.biologiezentrum.at
Tab. 3 coninued
Type group Site type
[Wooded] pool-ridge bog
Hollow-pool bog
[Wooded] hollow-pool-ridge bog
Site subtypeHollow bog
[Wooded] hollow-ridgebog
Pool bog
Main communities Species richness Human impact
* WRhynchosporo-Sphagnetum cuspidatumRhynchosporo- Spagnetum balticiScheuchzerio-Sphagnetum cuspidatumSphagno baltici-rubelluetumSphagnetum majus
the same communities as intwo previous subtypes
* WNupharo-NympahaetumSphagnetum cuspidatum
same communities as inprevious subtypes
same communities as inprevious subtypes
same communities as inprevious subtypes
Photo 12: Carex lasiocarpa dominated fen. Soomaa National Park.
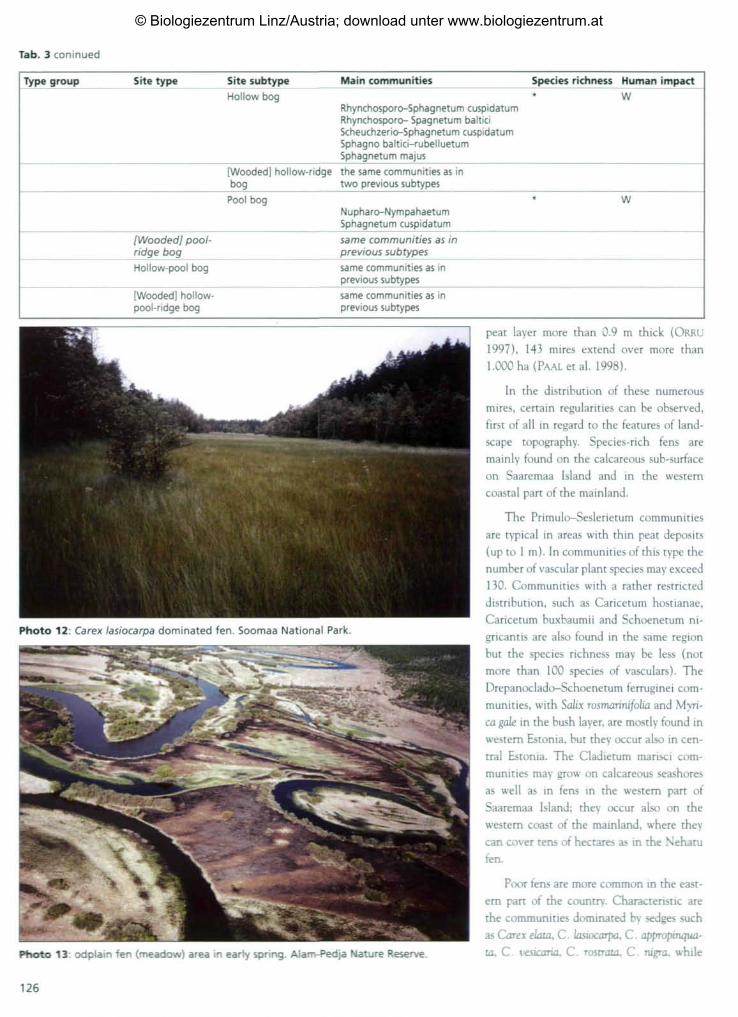
13: odplain fen (meadow) area in early spring. Alam-Pedja Nature Reserve.
peat layer more than 0.9 m thick (ORRU
1997), 143 mires extend over more than
1.000ha(PAALetal. 1998).
In the distribution of these numerous
mires, certain regularities can be observed,
tirst of all in regard to the features of land-
scape topography. Species-rich fens are
mainly found on the calcareous sub-surface
on Saaremaa Island and in the western
coastal part of the mainland.
The Primulo-Seslerietum communities
are typical in areas with thin peat deposits
(up to 1 m). In communities of this type the
number of vascular plant species may exceed
130. Communities with a rather restricted
distribution, such as Caricetum hostianae,
Caricetum buxbaumii and Schoenetum ni-
gricantis are also found in the same region
but the species richness may be less (not
more than 100 species of vasculars). The
Drepanoclado-Schoenetum ferruginei com-
munities, with Saiix rosmarinifolia and Myri-
ca gale in the bush layer, are mostly found in
western Estonia, but they occur also in cen-
tral Estonia. The Cladietum marisci com-
munities may grow on calcareous seashores
as well as in fens in the western part of
Saaremaa Island; they occur also on the
western coast of the mainland, where they
can cover tens of hectares as in the Nehatu
ten.
Poor fens are more common in the east-
ern part of the country. Characteristic are
the communities dominated by sedges such
as Carex ekua, C. lasiocarpa, C. appropmqua-
ta, C. vesicaria, C. rostrata, C. nigra, while
126
© Biologiezentrum Linz/Austria; download unter www.biologiezentrum.at

C. panicea is more characteristic in the west-
ern, central and northeastern parts.
Floodplain (limnogenous) fens are most
widely represented in the lowermost part of
the western and southwestern Estonian riv-
er valleys as well as in the eastern and south-
eastern Estonia.
Spring fens are distributed rather sparse-
ly over the country; they are mostly located
on the marginal slopes of the Pandivere and
Sakala Uplands and on Saaremaa Island.
The water of these soligenous fens is usually
calcium-rich and supports communities
such as Schoenetum nigricantis, Scor-
pidio-Schoenetum, Juncetum subnodulosae
(on Saaremaa Island), etc.
Communities of mixotrophic bogs with
Carex lasiocarpa, C. rostrata, C. limosa are
found mainly in western and central Estonia.
They are rather scattered, except around
lakes, where they are common. The Sphag-
no-Eriophoretum vaginati communities of
the wooded mixotrophic bogs often form a
belt around large ombrotrophic bogs, espe-
cially in northern Estonia (PAAL et al. 1998).
The larger bogs are located in the south-western, northeastern and central parts ofthe Estonian mainland. The largest miresystems are Puhatu with 468 km2, Epu-Kak-erdi with 417 km2, Lihula-Lavassaare with383 km2 and Sangla with 342 km2 (ORRU1995). Two regional types of ombrotrophicbog complexes are distinguished in Estonia- the "western" type and the "eastern" type(THOMSON 1924, MASING 1984). The mar-
ginal slopes of the western type have a steeprise. The bog expanse is relatively flat withan irregular pattern of compound micro-forms. The bogs of the eastern type are con-vex, with a well developed concentric pat-tern and without a steep slope. Eastern typebogs have favourable conditions forChamaedaphne calycuiata, which does notgrow in western bogs. On the other hand,Trichophorum cespitosum and Drosera inter-
media grow mainly in the bogs of the west-ern type. Certain differences can also befound in the distribution of Sphagnum
species: S. fuscum is characteristic for theeastern type raised bogs while S. rubeüum, S.
imbricatum and S. teneüum are more com-mon in the West-Estonian bogs.
Fig. 2: Mire distribution in Estonia
Heath moors, where thin peat (usuallynot more than 0.5 m) lies on pure sand, withan ortstein horizon between them obstruct-ing water infiltration, occur in depressionsbetween sandy dunes on the western coastand on the islands but also between olddunes located far from the recent coastline(PAAL 1997).
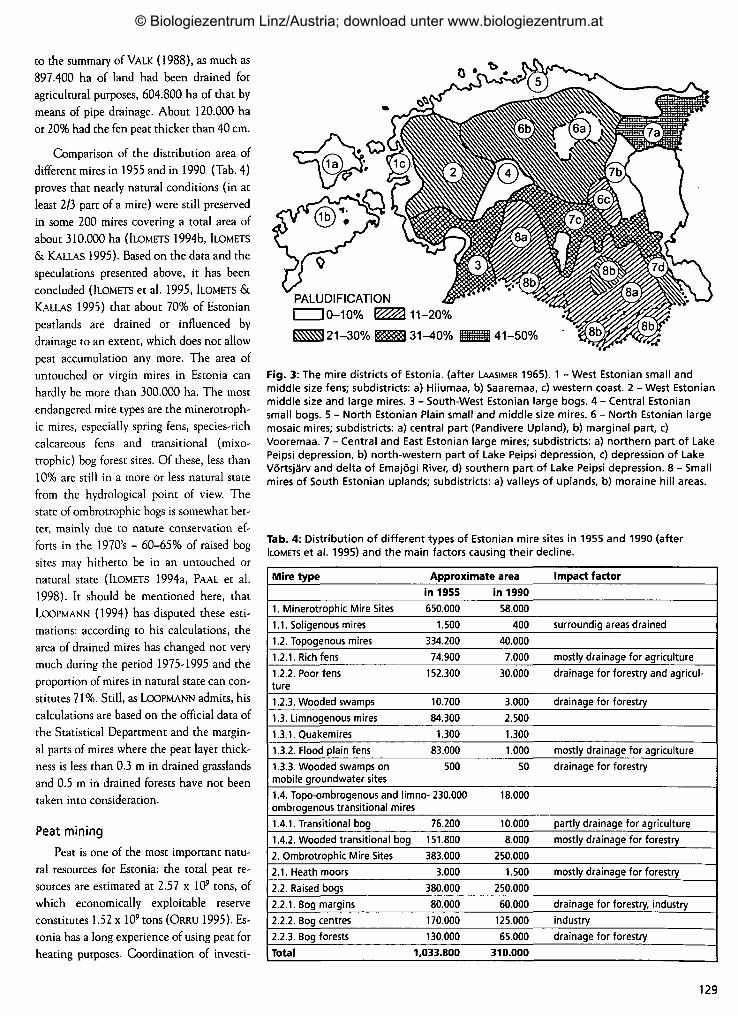
According to the distribution pattern ofmires and their general features, Estonia canbe divided into eight mire districts(LAASIMER 1965, ALLIKVEE & ILOMETS
1995; Fig. 3).
Photo 14: Floodplain fen (meadow) areain early spring. Alam-Pedja Nature Reserve.
127
© Biologiezentrum Linz/Austria; download unter www.biologiezentrum.at

Photo 15: Floodplain fen (meadow) areain early spring. Alam-Pedja Nature Reserve.
Photo 16: Ridge-hollow-pool subtypeombrotrophic bog. Männikjärve bog, EndlaNature Reserve.
Destroying of mire areas
Drainage for agriculture and forestry
In Estonia exploitation of mires for peat
mining and agriculture started in the 17th
century. At the beginning of the 19th centu-
ry, drainage and burning of mires was com-
monly practiced for agricultural purposes
(VALK 1988).
In 1839 the Estonian Agricultural Soci-
ety was founded. One of its aims was to in-
troduce and extend the drainage of mires.
The first drainage system, where pipes made
of burnt clay were used, was constructed as
early as in the 1850's. In 1908, the BalticPeatland Improvement Society was foundedin Tartu, with the purpose of promoting andfacilitating mire cultivation. In 1910, theTooma Experimental Bog Station wasopened, which specialized in the develop-ment of mire cultivation and the study ofmire hydrometeorology.
From 1918 to 1940, more than 350.000ha of peatlands were ameliorated, predomi-nantly for agricultural purposes (RATT1985), forest drainage accounted for perhapsless than 5% of this area (ILOMETS et al.1995).
After 1947, there was a significant in-crease in mire drainage, as powerful machin-ery became available. In the 1950's, almostall undrained mires were bordered by ditch-es. This means that the hydrological regimeof the marginal parts of the mire, mostly ofminerotrophic ones, was damaged. In1960-1970, open drainage was constructedin numerous fens with thin peat layer (about1 m thick); this was frequently made by ex-cavating one or a few ditches across themire. As a result of that the hydrologicalregime and plant cover of the marginal partsof the mire was damaged. This kind of con-structions were not regarded as the creationof a drainage system and therefore were notincluded in the official statistics. The mar-ginal part of fens, accounting for some20-25% of the total fen area, where thethickness of peat layer was less than 40 cm,was classified as peaty soil and was not con-sidered by statistics as a "real" mire. Conse-quently, for getting an approximate figurefor the extent of drained fens in that period,it may be more correct to double the offi-cially announced area (ILOMETS et al. 1995,PAAL et al. 1998).
At the beginning of the 1970's the peat-covered area which belonged to the collec-tive and state farms equaled 379.800 ha(KOKK & ROOMA 1974). During six years(1970-1975), 100.000 ha of peat soils weredrained (HOMMK 1982). In die 197C's, theannual drainage of wetlands for forestry pur-poses reached 15.000 - 20.000 ha (KoLUST1988). RATT (1985) reports that by 1980about 1,006.300 ha of lands were ameliorat-ed, including 338.400 ha of forests and584.400 ha of agricultural lands. According
128
© Biologiezentrum Linz/Austria; download unter www.biologiezentrum.at
to the summary of VALK (1988), as much as
897-400 ha of land had been drained for
agricultural purposes, 604.800 ha of that by
means of pipe drainage. About 120.000 ha
or 20% had the fen peat thicker than 40 cm.
Comparison of the distribution area of
different mires in 1955 and in 1990 (Tab. 4)
proves that nearly natural conditions (in at
least 2/3 part of a mire) were still preserved
in some 200 mires covering a total area of
about 310.000 ha (ILOMETS 1994b, ILOMETS
& KALLAS 1995). Based on the data and the
speculations presented above, it has been
concluded (ILOMETS et al. 1995, ILOMETS &
KALLAS 1995) that about 70% of Estonian
peatlands are drained or influenced by
drainage to an extent, which does not allow
peat accumulation any more. The area of
untouched or virgin mires in Estonia can
hardly be more than 300.000 ha. The most
endangered mire types are the minerotroph-
ic mires, especially spring fens, species-rich
calcareous fens and transitional (mixo-
trophic) bog forest sites. Of these, less than
10% are still in a more or less natural state
from the hydrological point of view. The
state of ombrotrophic bogs is somewhat bet-
ter, mainly due to nature conservation ef-
forts in the 1970's - 60-65% of raised bog
sites may hitherto be in an untouched or
natural state (ILOMETS 1994a, PAAL et al.
1998). It should be mentioned here, that
LOOPMANN (1994) has disputed these esti-
mations: according to his calculations, the
area of drained mires has changed not very
much during the period 1975-1995 and the
proportion of mires in natural state can con-
stitutes 71%. Still, as LOOPMANN admits, his
calculations are based on the official data of
the Statistical Department and the margin-
al parts of mires where the peat layer thick-
ness is less than 0.3 m in drained grasslands
and 0.5 m in drained forests have not been
taken into consideration.
Peat mining
Peat is one of the most important natu-
ral resources for Estonia: the total peat re-
sources are estimated at 2.57 x 10' tons, of
which economically exploitable reserve
constitutes 1.52 x 10⁹ tons (ORRU 1995). Es-
tonia has a long experience of using peat for
heating purposes. Coordination of investi-
PALUDIFICATIONI 10-10%
31-40%
Fig. 3: The mire districts of Estonia, (after LAASIMER 1965). 1 -West Estonian small andmiddle size fens; subdistricts: a) Hiiumaa, b) Saaremaa, c) western coast. 2 - West Estonianmiddle size and large mires. 3 - South-West Estonian large bogs. 4 - Central Estoniansmall bogs. 5 - North Estonian Plain small and middle size mires. 6 - North Estonian largemosaic mires; subdistricts: a) central part (Pandivere Upland), b) marginal part, c)Vooremaa. 7 - Central and East Estonian large mires; subdistricts: a) northern part of LakePeipsi depression, b) north-western part of Lake Peipsi depression, c) depression of LakeVörtsjärv and delta of Emajögi River, d) southern part of Lake Peipsi depression. 8 - Smallmires of South Estonian uplands; subdistricts: a) valleys of uplands, b) moraine hill areas.
Tab. 4: Distribution of different types of Estonian mire sites in 1955 and 1990 (afterILOMETS et al. 1995) and the main factors causing their decline.
Mire type
1. Minerotrophic Mire Sites
1.1. Soligenous mires
1.2. Topogenous mires
1.2.1. Rich fens
1.2.2. Poor fensture
1.2.3. Wooded swamps
1.3. Limnogenous mires
1.3.1. Quakemires
1.3.2. Flood plain fens
1.3.3. Wooded swamps onmobile groundwater sites
Approximate area
in 1955
650.000
1.500
334.200
74.900
152.300
10.700
84.300
1.300
83.000
500
1.4. Topo-ombrogenous and limno- 230.000ombrogenous transitional mires
1.4.1. Transitional bog
1.4.2. Wooded transitional bog
2. Ombrotrophic Mire Sites
2.1. Heath moors
2.2. Raised bogs
2.2.1. Bog margins
2.2.2. Bog centres
2.2.3. Bog forests
Total
76.200
151.800
383.000
3.000
380.000
80.000
170.000
130.000
1,033.800
in 1990
58.000
400
40.000
7.000
30.000
3.000
2.500
1.300
1.000
50
18.000
10.000
8.000
250.000
1.500
250.000
60.000
125.000
65.000
310.000
Impact factor
surroundig areas drained
mostly drainage for agriculture
drainage for forestry and agricul-
drainage for forestry
mostly drainage for agriculture
drainage for forestry
partly drainage for agriculture
mostly drainage for forestry
mostly drainage for forestry
drainage for forestry, industry
industry
drainage for forestry
129
© Biologiezentrum Linz/Austria; download unter www.biologiezentrum.at

Photo 17: Milled peat excavation area.Sangla bog, Tartumaa district.
gations and economical usage ut peat in theBaltic countries was already one of the pur-poses of the Livonian Nonprofit EconomicalSociety (Livländische Gemeinnützige undÖkonomische Sozietät), founded in 1772 inRiga (Latvia) and settled at 1813 in Tartu(Estonia). In the middle of the 19th centurymore than 300 pits of hand-cut peat wereregistered. These were located mostly on thelands of former estates (ANIMAGI 1995).
At the beginning of the 20th century,the use of peat as fuel and as a means of pro-ducing electricity increased remarkably, asin the 1920's peat served as the main fuel forpower stations; in 1926 it provided 10% ofthe total amount of industrial fuel (ILOMETSet al. 1995). In 1922, in order to organizeand coordinate peat excavation, the StatePeat Industry Enterprise was founded, unit-ing the biggest peat excavating entrepre-neurs; smaller peat excavating companiesjoined into local societies, the total numberof them being 916 in 1939 (ANIMÄGI 1995).
In several local industries the use of peat
as fuel increased considerably after World
War II. Peat excavation units associated
Tab. 5: Peat excavation in Estonia in 1980-1996 (after ILOMETS et al. 1995).
Year
1980
1981
1982
1983
1984
1985
10* tons
2.430
1.520
2.700
2.700
2.100
2.100
Year
1986
1987
1988
1989
1990
1991
IVtons
2.900
2.500
2.400
3.600
2.080
1.800
Year
1992
1993
1994
1995
1996
IPtons
1.360
621
1.053
1.020
1.124
with factories, amounting to 20 in number,were put into operation. In 1959, a newcomplex of the briquette factory was com-pleted in Tootsi, with an annual output ofabout 420.000 tons. Later, two other facto-ries were built - in 1964 the Oru peat bri-quette factory with an annual production of250.000 tons, and in 1975 the Sangla facto-ry with an annual output of 50.000 tons.Thus, preconditions were created for bri-quette production with a full capacity of420.000 tons. The maximum output of540.000 tons was achieved in 1976, butsince the beginning of 1990's the factorieshave been working at a reduced capacity(Tab. 5; PAAL et al. 1998).
Milled peat excavation was initiated inEstonia in 1938. The output of milled peatstarted to increase rapidly in 1950-1960 onthe basis of new products, horticultural andlitter peat. In 1975, milled peat made up98.6% of the total amount of peat excavat-ed annually. The production of litter peatincreased in the 1960's, when local agricul-tural associations were established in dis-tricts and excavation of peat became fi-nanced from the state budget. In 1975, therewere 96 fields from which as much as1,264-000 tons (40% humidity) of litter peatwere excavated. That kind of peat exploita-tion has presently decreased remarkably (in1994 only 345.300 tons) and the peat-fieldsare only partly used. In 1990, excavation ofblock peat was started for horticulturalneeds, and formed some 4% of the total an-nual peat output (ANIMÄGI 1995).
According to RAMST (1995) the produc-tion area exploited in 1970-1990 was10.000-15.000 ha. The yearly productionreached about 2.5x10* t (with 40% watercontent). The production of litter moss ac-counted for about half of it, that of milledpeat for heating the other half. Since 1990the production rapidly decreased becausethe demand for peat dwindled. The produc-tion was minimal in 1993 when only0.6x106 tons was produced (0.4x10* tons offuel peat). In 1994 the production increasedagain up to 1.1x10* tons.
As the domestic use of milled peat is de-clining, excavation for export (mainly tothe Netherlands, Germany, U.K., France,Sweden, Finland) has increased from
130
© Biologiezentrum Linz/Austria; download unter www.biologiezentrum.at

116.000 tons in 1993 to 400.000 tons in
1996 (PAAL et al. 1998, Tab. 5). This in-
creasing trend continues as the high quality
horticultural Sphagnum peat resources are
very limited in western Europe (HAMMER
1998). In the recent years 90% of the horti-
cultural peat production and 65% of the fu-
el peat is exported (ORRU 2003).
In Estonian subnatural minerotrophicfens and mixotrophic bogs the mean annualgrowth of (air-dry) peat is 0.8-1.2 tons andin ombrotrophic bogs 1.1-1.9 tons (lLOMETS1994c), or about 0.5 x 10⁶ tons in total(lLOMETS 2003). In the recent years theamount of annual peat excavation has been1.2-1.5 x 10⁶ tons that exceeds the peatgrowth two-three times (lLOMETS 2001).
Industry and pollution
Significant areas of valuable mires havebeen destroyed through excavation of oilshale in open-cast mines in north-easternEstonia. In order to get to the oil shale lay-er the surface has to be removed. Due tothis, about 2.000 ha of mires have been de-stroyed and an additional area of 100 ha willbe destroyed annually (lLOMETS et al. 1995).
A special problem is the flue gas con-taining calcium-rich, alkaline compoundsfrom the cement factory and power plantsburning oil shale (kukersite) in north-east-ern Estonia. The gas contains, in addition toCa, several heavy metals such as As, Zn, Th,Hf, V, which accumulate in plant tissues andpeat (PUNNING et al. 1987). About 200.000ha of land in a 30 km radius around thepower plants have been affected. It has beenestimated that 30.000 tons of Ca are de-posited in dust falling on this area, resultingin the disappearance of the Sphagnum car-pet, which in turn has halted the peat form-ing process and increased the decompositionof organic matter in the bogs within 10-15km of the pollution source (KAROFELD 1994,lLOMETS & KALLAS 1995). Still, the produc-tion and the emission of gases at the powerplants has during the last five-six years beenreduced considerably.
Peat mineralization and CO2 emission
One of the most important parametersindicating the state and functional peculiar-ities of a mire ecosystem is peat increment
(lLOMETS et al. 1995). If the mire is drained,the peat accumulation stops and an exten-sive denudation of the peat layer takes placein the process of peat thickening. Accordingto TOMBERG (1970, 1992), who has moni-tored this process on drained fen sites forseveral decades, the rate of peat surface de-composition is about 1 to 3 mm per year.The annual loss of organic matter due tomineralization is 15-20 tons ha yr' ' duringthe first decade after drainage not depend-ing on the manner of explotation (pasture,cropfield, grassland). Later, the rate of lossstabilizes at about 10-15 tons ha yr oncropland and 5-10 tons ha yr on grass-lands. The leaching of nitrogen may amountto 150-250 kg N ha 'V ' 1 and 100-200 kgN ha yr , respectively. On grasslands thedrained peat layer subsidence will be 1 me-ter for the first 20 years, during a century 2meters of peat layer will vanish. In drainedforests the peat layer decreases 6-15 mm peryear(PlKK 1997).
LOOPMANN (1994) has calculated thatpeat increment has ceased in Estonia at leaston 383.000 ha drained agricultural landwhere potentially 4 x 10⁶ m' of raw peat hadbeen produced. By lLOMETS (2001, 2003)the peat loss on this area constitutes ca 2.56x 10⁶ tons per year due to mineralization.Even if the peat loss in drained forests is nottaken into account, this figure is roughlyfive times bigger than of for peat increment.
Assuming that the mean annual value of
Photo 18: Milled peat field abandoned foreight years, llmatsalu bog, Tartumaadistrict.
131
© Biologiezentrum Linz/Austria; download unter www.biologiezentrum.at

organic matter mineralization is about 5-10tons ha''yr' and the average carbon contentin peat constitutes 53%, the annual emis-sion of CO2-C only from ameliorated fen ar-eas may reach the quantity 0.8-1.6 x 10*tons of CO2-C. Comparing this emissionrange with the possible total annual carbonstoring by peat accumulation (0.25-0.32 x10⁶ tons CO2-C), it follows that the emis-sion from drained fen sites alone is on theaverage four times higher than its total an-nual carbon accumulation. Adding thedrained areas for forestry and industry pur-poses we may reckon with up to 8-10 timeshigher emissions. (ILOMETS et al. 1995). Inany case, the total CO2-C emission from ourwetlands may be about 9.6 x 10' tons yr1
with corresponding ca 4-0 x 106 tons CH4-Cemission only (PUNNING et al. 1995).Therefore it is not surprising if wetlands areconsidered to be as the second importantcarbon source after industry in Estonia.
Urban development
The expansion of built up areas influ-encing the state of mires is most actual inbigger towns, especially in the surroundingsof Tallinn. In several places, holiday campsare built on paludified areas but this kind ofimpact on the mires is still comparativelyunimportant.
Vegetation changesdue to human impact
Amelioration of the floodplain mires
started more widely in the 1920's and the
1930's with dredging and straightening of
smaller rivers and rivulets. According to the
geobotanical mapping carried out in
1930-1955, most of the floodplain areas had
been turned into grasslands. In that time
they covered 83.000 ha or 7.5% of the total
area of semi-natural grasslands (L.AASIMER
1965). The inventory of grasslands in the
late 1970's (AUG & KoKK 1983) assessed the
area of floodplain grasslands to be 27.584
ha, which comprises about 35% of that in
the first half of the century. At present,
floodplain grasslands (like other semi-natu-
ral vegetation types) are mostly abandoned
and overgrowing with bushes or trees is
widely in progress. The result is that com-
munities of some types, e.g. Caricetum
davallianae, become gradually rarer.
The fen flora and vegetation in western
Estonia has been intensively studied in
1948-1955 and re-studied in 1991-1992.
On this basis it is possible to characterize
the main trends in the composition of flora
during the last 35-40 years. According to
TRASS (1994), four groups of species should
be distinguished:
• species with unchanged frequency: Jun-
cus subnodulosus, Myrica gale, Rhinanthus
osilinensis, Cladium mariscus, and several
common obligate telmatophytes such as
Comarum palustre, Peucedanum palustre,
Carex lasiocarpa, C. data etc.,
• species with increased frequency: Molinia
caerulea, Deschampsia cespitosa, Carex ni-
gra, C. panicea, C. canescens, Epipacas
palustris,
• species wit slightly declined frequency:
Tofieldia calyculata, Carex buxbaumii, C.
hosaana, C. davalliana, C. heleonastes,
Eriophorum gracile, Schoenus ferrugineus,
Liparis loeselii, Malaxis paludosa, Drosera
intermedia, Saussurea esthonica, Pedicularis
sceptrum-carolinum, Utricularia minor, Eq-
uisetum variegatum, Euphorbia palustris,
• species with frequency fallen to the criti-
cal limit: Gymnodenia odoratissima, Se-
laginella selaginoides, Pinguicula alpina,
Malaxis monophyllos.
Notable changes had taken place also in
vegetation, TRASS (1994) has established
five change-groups:
• communities met on approximately as
large an area and with the same frequen-
cy as 35-40 years ago: Phragmitetum aus-
tralis, Drepanoclado-Caricetum lasio-
carpae, Scorpidio-Caricetum lasio-
carpae, Caricetum diandrae, Cladietum
marici, Primulo—Seslerietum, Caricetum
cespitoso-appropinquatae, Caricetum
flavae, Caricetum acutae, Juncetum
subnodulosi, Equisetetum fluviatilis,
• communities the area of which has di-
minished to some extent (mostly only for
some hecatares on certain fen): Drepan-
oclado-Schoenetum, Caricetum hos-
tianae, Caricetum dioicae, Caricetum
elatae, Caricetum vesicariae, Schoene-
tum nigricantis, Eriophoretum polysta-
chionis, Scorpidio-Schoenetum, Men-
yandieto-Caricenim limosae,
132
© Biologiezentrum Linz/Austria; download unter www.biologiezentrum.at

• communities the area of which has con-siderably decreased (for hundreds or eventhousands hectares, or if the communitytype is rare, more than 50%): Caricetumdavallianae, Caricetum buxbaumii, Cal-loso-Alnetum glutinosae, Filipendu-lo-Alnetum glutinosae,
• communities the area of which has some-what increased (on some fens for tens orhundreds of hectares): Myrico-Schoene-tum, Seslerio-Caricetum paniceae, Cala-magrostietum canescentis, Caricetumpaniceo-nigrae, Myrico-Betuletum pu-bescentis,
• communites the area of which has re-markably increased (for hundreds orthousands of hectars): Molinietumcaerulea, Deschampsio-Caricetum pan-iceae, Caricoso-Betuletum pubescenti,Phragmitoso-Betuletum pubescentis.
The reason for the decrease of areas ofthe 13 community types is in the secondarysuccessions, which replaced natural commu-nities after amelioration. The increase ofMolinia caerulea dominance on calcareousfens and swamps after drainage has beenrecorded also by ROOSALUSTE (1984).
After a long period of drainage when theupper layer of peat has been mineralized, theformer mire forests converge into so-called'decayed' types where the characteristicmire plants cover less than 20%. The olig-otrophic mire forests form Vaccinium myr-
tillus drained peatland forest site type, whilethe meso-eutrophic and eutrophic mire for-est converge into Oxalis drained forest peat-land site type (LÖHMUS 1981, 1982). Thesmall number of drained forest site types ismotivated by the post-drainage successionalconvergency - species composition of plantcommunities of drained sites gradually be-comes more similar (ZOBEL 1992).
On burned raised bogs the microformsare almost levelled, the uppermost peat lay-er becomes thicker, capillary raise of water isimpeded, peat water-holding capacity aswell as aeration will considerably decrease,the soil chemistry will change significantly -the ash contains quite a lot of mineral com-ponents what increase for some period thesoil pH and trophicity. Still, these addition-al nutrients will be rather quickly carriedaway by water and the peat becomes even
poorer for plant growth than before fire(MASING 1960). To the vegetation of thefirst successional stages after fires severalnon-mire species are characteristic, first ofall Chamaenerion angustifoUum, due to lackof competition also Rubus chamaemorus andRhynchospora alba can grow abundantly insome localities.
After 4-5 years all the burned area willbe covered by vegetation: instead of formerPinus sylves tris, tree layer is formed now byBetula spp., in field layer Ledum palustre,
Calluna vulgaris, Andromeda poUfolia, insome cases also Vaccinium uliginosum willdominate. Development of the bottom layerstarts often several years later; the common-est species is there Polytrichum strictum asso-ciated with lichens such as Cladonia
squamosa, C. cenotea, C. comuta, C. fto-
erkeana, C. deformis, C. incrassata etc. Reha-bilitation of Sphagnum-carpet begins usuallywith growth of some patches of S. acutifoli'
urn, then also S. magellanicum, S. fuscum etc.will appear (MASING 1960,1964, MASING &VALK 1968).
Then a long period of stabilization ofvegetation structure follows. Into the fieldlayer return Oxycoccus spp., Empetrum ni-grum etc., in bottom layer the pioneerspecies will be replaced by Sphagnum spp.and partly by forest mosses like Pleuroxium
schreberi, Hybcomiwn spkndens etc. A fur-ther development of plant cover dependslargely on the formation of tree layer: if thisremains scattered then the characteristicfeatures of bog fires will be obvious for longyears. The rehabilitation of burned bogs andrecovery of pre-fire communities structuretakes form 50 to 100 years (MASING 1964).
Rehabilitationof spoiled mire areas
Rehabilitation and reclamation of de-stroyed peat areas has become a seriousproblem not only in northern Europe (VASANDER et al. 2000, KORPELA 2002) but
also in Canada and USA (MALTERER et al.2002, ROCHEFORT & CAMPEAU 2002). Re-habilitation of spoiled mires is an ethical aswell as aesthetical problem (LODE 1998).
If in 1996 the total area of peat fieldsunder excavation was in Estonia approxi-
133
© Biologiezentrum Linz/Austria; download unter www.biologiezentrum.at

Photo 19: Eriophorumvaginatum, typicallygrowing in transitionaland raised bogs isrevegetating abandonedpeat excavations as apioneer species.
mately 18.600 ha (RAMST 1997) then in
1998 the area of mires spoiled with peat ex-
cavation constituted 21.350 ha and in next
two decades the area of exhausted peat fields
will be doubled. According to the data of
Statistical Department in the last decade in
Estonia is recultivated 1.500 ha exhausted
peat fields. Still, it is not clear what nestles
behind these data: was there planted a for-
est, were some ditches simple filled up or
something else (ILOMETS 2001).
The natural revegetation of abandoned
peatlands does not have the attributes of
natural bog vegetation. The natural plant
cover on abandoned peat fields is develop-
ing extremely slowly and sometimes does
not occur at all (SALONEN 1987, LAVOIE &
ROCHEFORT 1996). Several decades of at-
tempts to recultivate them by planting for-
est culture have resulted with any success ei-
ther. In many places the forestation is al-
most hopeless due to high water level and/or
due to a thick and little decomposed peat
layer. Another alternative is to plant an en-
ergy coppice or to turn the area into a pond.
A very promising possibility for re-estab-
lishing of plant cover, stopping the carbon
emission and turning the areas into eco-nomically useful ones is to establish planta-tions of domestic cranberry Oxycoccus palus-
rris. The detailed methods for foundingcranberry plantations were elaborated in theNigula Nature Reserve as early as in the be-ginning 1970's (VILBASTE 1972, 1974). Inthe last 5-6 years about 4 ha of cranberryfields have been planted with Estonian vari-eties, the crop can be up to 10 tons ha'1
(PAAL et al. 2002).
About 10 years ago experiments were al-so started with the seedlings of Vaccinium
tmgustifolium originating from Canada. Theygrow very well on exhausted milled peat ar-eas and the first crop can be picked in the4th year (STARAST et al. 2005). Up to nowabout 4 ha of blueberry plantations has beenfounded and the area is rather quickly in-creasing.
Cultivation of other acidophilous berryplants such as Vaccinium vitis-idaea, Rubus
arcacus, R. chamaemorus and herbs likeDrosera spp., Ledum palustre has also a goodperspective (JAADLA 1994).
Sustainable usage of mires
Tourism and recreation
Estonian bogs possess quite importantrecreational potential and many local peo-ple visit bogs, especially during their sum-mer holiday. As bogs are distributed ratherevenly over the country, there has not beenany significant negative impact to the bogwildlife up to now due to tourism. Duringthe last decade in numerous big bogs specialwooden paths have been constructed to easecrossing of the bog landscape and for sever-al areas informational materials for touristsvisiting the bogs have been published. Es-tonian tourist agencies include some mireareas in their tourism packages. Neverthe-less, it can be said that mire tourism is stillin a rather embryonic state, considering itsperspectives and the vast mire areas.
Collection of berries and othernatural products
At the beginning of the 1970's, the in-ventory oi Estonian cranberry resources wasorganized. It was concluded that in Estoniathere are not less than 70 mires covering
134
© Biologiezentrum Linz/Austria; download unter www.biologiezentrum.at

Photo 20: Abandoned milled peat arearecultivated with planted Oxycoccus palustris
for three years. Sapi-Lulii bog, Tartumaadistrict.
about 25.750 ha in total with a cranberryyield of over 50 kg ha1 (Ruus 1975). Thepotential overall annual production mayreach up to at least 5 million tons.
The mires with the best cranberry crops
are located in Tartu and Ida-Viru districts,
where approximately 70% of the potential
resources can be found. Furthermore, two
mires - Emajöe Suursoo (transitional) mire
on ca 6.200 ha and Muraka bog on ca 5.000
ha - give about 50% of the annual yield of
Estonian cranberries - 1.5 and 1.0 million
tons respectively. In certain places, picking
of cranberries is one of the extra income
sources for the local people. According to
the official data, the state purchase of cran-
berries during some years of the Soviet peri-
od in Estonia was ca 300-1.300 tons (Tab.
6).
Much less is known about the distribu-tion and yields of cloudberry (Rubus chamae-
morus) resources. Perhaps some 30^40 sitesare of commercial interest. Cowberry {Vac-
cinium vitis-idaea) and bilberry (Vaccinium
myrtiüus) are also important as they arepicked by local people and often bought upfor the food industry.
During the recent years, interest in sun-dew (Drosera spp.) has been increased andrepresentatives from the western pharma-ceutical companies have approached the lo-cal institutions. Up to now, the amounts
Tab. 6: State purchases of cranberriesduring 1963-1975 in Estonia (afterCHERKASOV et al. 1981).
Year
1963
1964
1965
1966
1967
1968
1969
Tons
315-417
1.218
315-417
315-417
315-417
570-576
570-576
Year
1970
1971
1972
1973
1974
1975
Tons
870
1.305
657
918
717
199
Photo 21: Abandoned milled peat area recultivated with planted Oxycoccus palustris forfive years. Sapi-Lulli bog, Tartumaa district.
Photo 22: Abandoned milled peat arearecultivated with sowed Oxycoccus palustrisin 1976. Mättaraba bog, Pärnumaa district.
135
© Biologiezentrum Linz/Austria; download unter www.biologiezentrum.at

Photo 23: Ridge-pool subtypeombrotrophic bog. Pöltsamaa bog, Alam-Pedja Nature Reserve.
gathered are still small, but will increase in
the nearest future. The collecting ofDrosera
species, which have disappeared in most of
the western Europe, therefore, must be regu-
lated, otherwise the impact on bogs could
rise critically (ILOMETS 1994a).
Rare and threatenedcommunities, conservation ofmires
Rare and threatened communities
The EC Council directive 92/43/EEC of
21 May 1992 (EC 1992) on the conserva-
tion of natural habitats and of wild fauna
and flora stresses the need for assessment at
a national level of the relative importance
of sites for each natural habitat type accord-
ing to four criteria: (i) degree of representa-
tivity, (ii) extent of area, (iii) degree of con-
servation, and (iv) global assessment. These
criteria overlap largely with the criteria
most emphasized in the assessment of the
conservation value of biotopes (MARGULES
1986): representativeness, diversity, rarity,
naturalness, area and threat of interference.
Proceeding from the biodiversity concept of
plant communities protection, three com-
ponents must be taken into account: rarity,
level of threat and typicalness, each of
which is a 'complex phenomenon' (JACKEL
& POSCHLOD 1996). Quite often in nature
conservation 'rare' is used more or less as a
synonym for 'threatened', the latter being
the main criterion for compilation of Red
Data Books of Biotopes (e.g. BLAB et al.1993, RIECKEN & SSYMANK 1993). The
problem of discordant use of 'rarity' and'threatenedness' in categorization of speciesis thoroughly discussed by MUNTON (1987)and GASTON (1994), usage of these con-cepts in assessment of plant communities isdiscussed by PAAL (1998a,b, 1999).
The inconsistent use of 'threatened' and'vulnerable' in one sequence is also obvious.The latter is a term with a comparativelynarrow meaning; it is a synonym for 'fragile',while 'threatened' can in some situationsdescribe even comparatively stable andwidespread community types or even typegroups. This was the case, for example, withour wetlands in the period 1950-1979,when in the course of a campaign started bySoviet rulers huge areas were drained andseveral hitherto common mire vegetationtypes turned to be threatened.
In Estonia, following these ideas, raritycategories for plant community types areproposed without merging them with'threatened' or 'vulnerable':
0 - Extinct or probably extinct. Communi-ties that are no longer known to exist inthe wild within the territory of the repub-lic after repeated search,
1 - Very rare. Communities that are knownin 1-5 localities with a total area less than
10 ha,
2 - Rare. Communities that occur in 6-15localities with a total area less than 50 hafor woodlands or less than 100 for grass-lands and mires,
3 - Fairly rare. Communities that are repre-sented in 16—40 localities with a totalarea less than 300 ha,
4 - Approaching rare. Communities
* that are likely to move into the previouscategories in 5-10 years if the casual fac-tors continue to operate, or
* that are growing in a restricted number ofhabitats but about which there is insuffi-cient information to decide which of thecategories are appropriate; the localitiesmust, consequently, be checked.
It should be pointed out that in compar-
ison with our previous papers where the
136
© Biologiezentrum Linz/Austria; download unter www.biologiezentrum.at

plant communities rarity categories werediscussed (PAAL 1998a,b), later ones, basedon more basic data the criteria for categories1, 2 and 3 were considerably weakened, fit-ting them better in with the reality (PAAL1999).
By defining categories of threatenedplant community types the concepts 'rare'and 'vulnerable' are in place, and the cate-gories can be estimated as follows:
1 - Very threatened. Community types that
are at very great risk of total disappear-
ance at least due to one of following fac-
tors:
* total area of communities has decreased in
course of 10 last years 75%,
* communities are substituted to the adversecausal factors continuation of which willprobably decrease the total area in next10 years up to 75%,
* due to the extremely fragmented occur-rence, communities are obviously loosingthe inherently characteristic features ofstructure (content of species, abundanceproportions between species, layering,mosaicness etc.),
* communities belong to the rarity category1.
2 - Threatened. Community types that areat great risk of total disappearance at leastdue to one of the following factors:
* total area of communities has decreased inthe course of 10 last years 50%,
* communities are substituted to the adversecausal factors which continuation willprobably decrease the total area in next10 years up to 50%,
* fragmentation of these communities has in10 last years increased up to three times,
* communities belong to the rarity category
2 or 3.
3 - Fairly threatened. Communities that arein considerable danger due to the one offollowing factors:
* total area of communities has decreased inthe course of 10 last years 25%,
* communities are substituted to the adversecausal factors which continuation will
Tab. 7: Threatened mire communities in Estonia. R - category of rarity, T - category ofthreatenedness (cf. PAAL 1998a, 2001). Notations: Est. - Estonia, Isl. - Island. Nomenclatureof the site types and communities follows PAAL (1997).
Site type
Poor fens
Rich fens
Minerotrophicquagmires
Spring fens
Community
Caricetum flavae
Caricetum davallianae
Caricetum hostianae
Caricetum buxbaumii
Cladietum marisci
Schoenetum nigricantis
Rhynchosporetum fuscae
Primulo-Seslerietum
Scorpidio-Schoenetumferruginei
Scorpidio-Schoenetumferruginei
Juncetum subnodulosae
Caricetum davallianae
Distribution
locally, mainly in E Estonia
mainly on western islands, in mainland;scattered on northern limit of its areal
in W and NW Estonia, seldom in otherlocalities; near the northeasternlimit of its areal
in W Estonia
mainly on western islands, locally onmainland; on northern limit of its areal
in western part of Saaremaa Isl. andon Hiiumaa Isl.; on northern limitof its areal
in NW Estonia
mainly in W, N and NE Estonia,on western islands
in W Estonia and on western islands
in W Estonia and western islands
in western part o f Saaremaa Island;on northeastern limit of its areal
mainly on western islands, locally onmainland; on northern limit of its areal
R
4
4
3
3
3
2
1
4
3
3
1
3
T
3
3
2
2
2
2
1
3
2
2
1
2
probably decrease the total area in next
10 years up to 25%,
* fragmentation of these communities has in
10 last years increased twofold,
* to this category should be qualified also
communities being in Estonia rather fre-
quent and having here not a very restrict-
ed area, but which are rare or greatly en-
dangered in neighbouring countries, i.e.
responsibility communities.
Due to their species richness the most
conspicuous mires in Estonia, on a North
European scale, are calcareous fens and
spring fens (TRASS 1975). Here grow nu-
merous Red Data Book species such as Se-
lagineüa selaginoides, Pinguicula alpina, Juncus
subnodubsus, Liparis loeselii, Gymnadenia
odoratissima, Dactylor/u'za incamata, D. fuch-
sii, D. macuiata, Epipacas palustris, Cladium
mariscus and Schoenus nigricans. Several fen
types more widely distributed in western and
central Europe reach the northern distribu-
tion limit in Estonia (Tab. 7).
Over the last 30-35 years fens on shal-
low peat, formely mown annually and then
grazed, have become extensively overgrown
with bushes (mainly Salix spp. and birch).
Spring fens, where they are still preserved,
137
© Biologiezentrum Linz/Austria; download unter www.biologiezentrum.at
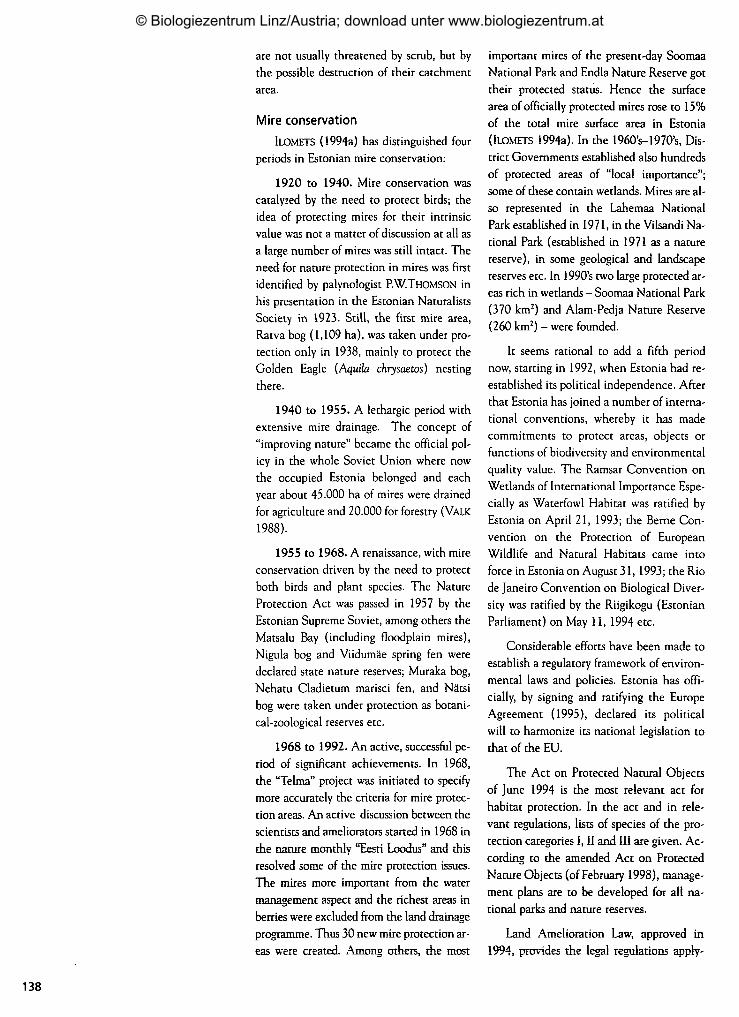
are not usually threatened by scrub, but by
the possible destruction of their catchment
area.
Mire conservation
ILOMETS (1994a) has distinguished fourperiods in Estonian mire conservation:
1920 to 1940. Mire conservation was
catalyzed by the need to protect birds; the
idea of protecting mires for their intrinsic
value was not a matter of discussion at all as
a large number of mires was still intact. The
need for nature protection in mires was first
identified by palynologist P.W.THOMSON in
his presentation in the Estonian Naturalists
Society in 1923. Still, the first mire area,
Ratva bog (1,109 ha), was taken under pro-
tection only in 1938, mainly to protect the
Golden Eagle (Aquila chrysaetos) nesting
there.
1940 to 1955. A lethargic period with
extensive mire drainage. The concept of
"improving nature" became the official pol-
icy in the whole Soviet Union where now
the occupied Estonia belonged and each
year about 45.000 ha of mires were drained
for agriculture and 20.000 for forestry (VALK
1988).
1955 to 1968. A renaissance, with mire
conservation driven by the need to protect
both birds and plant species. The Nature
Protection Act was passed in 1957 by the
Estonian Supreme Soviet, among others the
Matsalu Bay (including floodplain mires),
Nigula bog and Viidumäe spring fen were
declared state nature reserves; Muraka bog,
Nehatu Cladietum marisci fen, and Nätsi
bog were taken under protection as botani-
cal-zoological reserves etc.
1968 to 1992. An active, successful pe-
riod of significant achievements. In 1968,
the "Telma" project was initiated to specify
more accurately the criteria for mire protec-
tion areas. An active discussion between the
scientists and ameliorators started in 1968 in
the nature monthly "Eesti Loodus" and this
resolved some of the mire protection issues.
The mires more important from the water
management aspect and the richest areas in
berries were excluded from the land drainage
programme. Thus 30 new mire protection ar-
eas were created. Among others, the most
important mires of the present-day Soomaa
National Park and Endla Nature Reserve got
their protected status. Hence the surface
area of officially protected mires rose to 15%
of the total mire surface area in Estonia
(ILOMETS 1994a). In the 196O's-197O's, Dis-
trict Governments established ako hundreds
of protected areas of "local importance";
some of these contain wetlands. Mires are al-
so represented in the Lahemaa National
Park established in 1971, in the Vilsandi Na-
tional Park (established in 1971 as a nature
reserve), in some geological and landscape
reserves etc. In 1990's two large protected ar-
eas rich in wetlands - Soomaa National Park
(370 km2) and Alam-Pedja Nature Reserve
(260 km2) - were founded.
It seems rational to add a fifth period
now, starting in 1992, when Estonia had re-
established its political independence. After
that Estonia has joined a number of interna-
tional conventions, whereby it has made
commitments to protect areas, objects or
functions of biodiversity and environmental
quality value. The Ramsar Convention on
Wetlands of International Importance Espe-
cially as Waterfowl Habitat was ratified by
Estonia on April 21, 1993; the Berne Con-
vention on the Protection of European
Wildlife and Natural Habitats came into
force in Estonia on August 31, 1993; the Rio
de Janeiro Convention on Biological Diver-
sity was ratified by the Riigikogu (Estonian
Parliament) on May 11, 1994 etc.
Considerable efforts have been made to
establish a regulatory framework of environ-
mental laws and policies. Estonia has offi-
cially, by signing and ratifying the Europe
Agreement (1995), declared its political
will to harmonize its national legislation to
that of the EU.
The Act on Protected Natural Objects
of June 1994 is the most relevant act for
habitat protection. In the act and in rele-
vant regulations, lists of species of the pro-
tection categories I, II and III are given. Ac-
cording to the amended Act on Protected
Nature Objects (of February 1998), manage-
ment plans are to be developed for all na-
tional parks and nature reserves.
Land Amelioration Law, approved in
1994, provides the legal regulations apply-
138
© Biologiezentrum Linz/Austria; download unter www.biologiezentrum.at

ing to land amelioration. It states that the
building of amelioration systems (AS) can
be started only after the project has been ap-
proved and building permission granted.
The project of AS can be rejected and per-
mission for building the AS refused in cases
where the building of the AS would damage
conditions for nature protection, or bring
about economic loss for other landowners or
users of the land and water. The project of
AS must prescribe nature protection meas-
ures as well as the preservation of natural re-
sources, the environment and historical ob-
jects.
The Sustainable Development Act
(1995) defines inter alia the "critical reserve
of renewable natural resources" as the small-
est quantity, which guarantees the natural
balance and renewal of biological and land-
scape diversity. One of its primary goals is to
promote sustainable use of nature resources
that are historically part of Estonia.
The National Environmental Strategywas approved by the parliament on March12th, 1997. This strategy specifies the trendsand priority goals of environmental manage-ment and protection, and sets the mainshort-term and long-term tasks to beachieved by 2000 and 2010, respectively.The National Environmental Strategy pro-ceeds from the main traditional goal of en-vironmental protection - which is to pro-vide people with a healthy environment andnatural resources necessary to promote eco-nomic development without causing signifi-cant damage to nature, and to preserve thediversity of landscapes and biodiversitywhile taking into consideration the level ofeconomic development. The priorities pre-sented in the strategy are to be taken intoaccount when planning environmental ac-tivities, developing international coopera-tion and allocating national funds.
Estonian Biodiversity Strategy and Ac-
tion Plan was completed in 1999.
Considering the drastic changes in land-use practice in connection with the collapseof the collective farm system and the re-pri-vatization of land from one side, and re-quirement for establishing an effective na-ture management planning and protectionsystem from the other side, several large
scale nature inventory projects have been
carried out between 1993 and 2000 (PAAL
2003). From the standpoint of promotion
the mires protection here the following
projects should be mentioned: (1) WET-
STONIA - Estonian Coastal and Flood-
plain Meadows, 1993-1996 (LEIBAK & LUT-
SAR 1996), (2) Estonian Biodivesity Coun-
try Study, 1996-1997 (PAAL 1997, KOLVIK
& TAMBETS 1998, KUKK 1999, KULL 1999),
and (3) Estonian Wetlands Conservation
and Management Strategy, 1997 (PAAL et
al. 1998). Results of these inventories were
largely used for Estonian Natura 2000 State
Programme, approved by the Estonian Gou-
vernment for years 2000-2007 in July 25th,
2000. The general aim of the program is to
establish the Estonian Natura 2000 network
in accordance with the Bird Directive and
Habitats Directive.
More than 100.000 ha of areas with mire
vegetation are protected in Estonia by now,
over 3/4 of which are ombrotrophic areas.
For a long time, mire conservation policy in
Estonia was essentially designed to protect
large ombrotrophic mire systems and it was
difficult to preserve fens due to their use as
potential agricultural land, despite their
high natural value and their high level of
vulnerability (ILOMETS &. KALLAS 1995,
PAAL et al. 1998). The actual number of cur-
rently protected mires in Estonia is more
than 90, their very recent number and/or
area was not attainable for the author as
Photo 24: Ridge-hollow-pool subtypeombrotrophic bog. Männikjärve bog, EndlaNature Reserve.
139
© Biologiezentrum Linz/Austria; download unter www.biologiezentrum.at
they have been increasing in the course ofthe last decade step by step and the amend-ment of databases needs some time. Thearea of protected mires will certainly in-crease when the Natura 2000 project will befinished.
Actual problems
Overexploitation of peat resources. Asit was said in 4-2, in the recent years 1.2-1.5x 10⁶ tons of peat has been harvested in Es-tonia annually. This figure is more than twotimes less than the annual peat productionquota (2.78 x 10⁶ tons), established by theGovernment of Estonia in 1996 accordingto the Sustainable Development Act, and sothe firms excavating peat have a serious ex-cuse to apply for additional excavation areasand for supplementary excavation licences.At the same time, we stress once more, thatthe Estonian unspoiled mires can produceannually about 0.5 x 10⁶ tons of peat. In thatway, the peat excavation exceeds the peataccumulation already now two-three times.Let's us hope that this scandalous situationis provisional and connected with someweakness of the state statistical databasesand some discrepancies between the legisla-tion and practice, and is not based on lobbyof certain businessmen or on corruption.Anyway, the peat production quota must becorrected to ensure a sustainable manage-ment of resources but efforts must be madealso for improving the statistical data aboutpeat resources; if necessary, additional re-search work for that purpose must be under-taken. Quite doubtful is also the EstonianGovernment energy policy, treating the peatas a renewable bioresource and enhancing itusage for heating.
Commercial pressure. A serious prob-lem is further commercial pressure and lob-bywork of some western entrepreneurs inconnection with the increasing need forhorticultural peat in those countries but al-so in Japan. While in western Europeancountries the industrial peat resources arealmost exhausted and the remaining subnat-ural mires are under protection, the com-mercial orders for peat are addressed moreand more to the eastern and northern Euro-pean countries, consequently causing therea continuous and intensive pressure on pris-
tine bogs (GAUDIG & JOOSTEN 2002). Thelobby and avarice of businessmen and un-dertakers must be strongly restricted here byquotas, by persistence in following the ju-ridical acts, as well as by common accept-ance of the ideas and demands expressed inthe document "Wise use and conservationof wetlands", addressed to the Council andthe European Parliament (cf. http://euro-pa.eu.int/comm/environment/nature/wet-lands/wetlands_en. pdf)-
Insufficient rehabilitation. In USA,under the federal and state regulations, peatproducers must agree to compensate for wet-land losses and the ultimate goal is to restorethe wetland conditions that historically ex-isted in a peat bog before drainage and peatharvesting (MALTERER et al. 2002). In Esto-nia even the simple reclamation or rehabili-tation of spoiled peat areas is going veryslowly, and so the spoiled areas are continu-ously large sources of CO2 emission into at-mosphere as well as destroying the aesthet-ics of landscapes.
Pollution. In Estonia in the recent yearsconsiderable efforts have been made to di-minish the alkaline flue gas emission fromthe cement factory and power stations innorthern and north-eastern regions. Never-theless, pollution is continuing and the situ-ation is far from satisfactory.
Fires. Fires occur in raised bogs andheath moors in spring and summer periodrather frequently and pose a considerablethreat for mire ecosystems.
Long-term drainage effects. Some seri-ous effects of the former extensive drainagewill appear only decades later. That con-cerns especially successional changes of mirevegetation structure due to lowering of thewater table in the surrounding areas; even inprotected mires the characteristic communi-ties will be replaced by others, having a sim-ple structure. In that way communities ofseveral types as well as numerous plant andanimal species turn to be threatened andrare.
Evolvement of protected mires net-
work. Although raised bogs are compara-
tively well protected in Estonia within the
existing nature reserves (KALLAS 1995,
KOLVIK 1996), several fens, likewise some
140
© Biologiezentrum Linz/Austria; download unter www.biologiezentrum.at
well-developed bog complexes or even bogsystems in different parts of the countryhave unique features and should also be tak-en under protection. According to theHABITATS DIRECTIVE (1992), all Estonian
mires represent the habitats of EU impor-tance and so as Estonia has still large num-ber of unprotected natural or subnaturalmires, most of them should be included intoNatura 2000 network; even if from the Es-tonian viewpoint mires of some types (e.g.raised bogs) are protected rather satisfactori-ly, the remaining mires deserve protection asour responsibility communities/habitats. Be-fore the Estonian Nature 2000 State Pro-gramme started, nature protectionists saw init a great and last possibility to take underprotection what still is worth of protectingin our nature. Nevertheless, the planned Es-tonian contribution to the Natura 2000 net-work seems to be too much oriented on thealready existing protected areas the future ofwhich should be guaranteed anyhow. Sitescorresponding to Natura 2000 criteria out-side the currently protected areas are oftennot paid enough attention to, especially ifthey are situated on private lands. Withsuch an attitude, Natura 2000 program isplanned to be used mainly for achieving ad-ditional „quality labels" for the existing net-work of protected areas, and not so much tocontribute to the pan-European networkwith valuable new sites.
Zusammenfassung
Moore in Estland - In Estland gibt es1.626 Moore, die größer als 10 ha sind, 143davon sogar größer als 1.000 ha. Moore sindim ganzen Land zu finden, wobei die arten-reichen Niedermoorgebiete vorwiegend aufder Saaremaainsel und im Westteil Estlandszu finden sind, Ubergangsmoore in West-und Zentralestland und Hochmoore in densüdwestlichen, nordöstlichen und zentralenLandesteilen. Die Flora der Gefäßpflanzender estnischen Moore umfasst 280 Arten,230 davon findet man in den Niedermoo-ren, 103 in den Übergangsmooren und 45 inHochmooren. Die estnischen Moore wer-den in fünf Standortstypen mit insgesamt elfUntertypen gegliedert. Besonders auffälligwegen ihres Artenreichtums sind dabei diekalkreichen Niedermoore und Quellmoore.
Um 1980 waren etwa 1,006.300 haMoorland melioriert und damit entwässert.Torf ist eine der wichtigsten natürlichen Re-sourcen Estlands, der jährliche Torfabbauerreichte in den Jahren 1970 bis 1990 unge-fähr 2,500.000 Tonnen (mit 40 % Wasserge-halt). Gegenwärtig beträgt der Torfabbau1,200.000 Tonnen, was zwischen dem Zwei-und Dreifachen der natürlichen Torfakku-mulation ausmacht. Vergleicht man die ausdem Torfabbau resultierende jährliche COyKohlenstoffemission (0.8-1.6 x 10⁶ t CO2-C) mit der möglichen Kohlenstoffspeiche-rung im Zuge der Torfakkumulation (0.25-0.32 x 1061 CGyC), ist das Missverhältnisnoch deutlicher: Alleine von den entwäs-serten Niedermooren wird durchschnittlichpro Jahr vier Mal so viel CO2-C emittiertwie gebunden. Zählt man noch die Flächendazu, die für forstliche und industrielle Zwe-cke entwässert werden, steigen die Emissio-nen auf des Acht- bis Zehnfache der jähr-lichen COyC-Speicherung an.
Naturnahe Verhältnisse in wenigstens2/3 der Moorfläche findet man nur noch inetwa 200 Mooren mit einer Gesamtflächevon 310.000 ha. Bis heute sind davon etwa100.000 ha mit intakter Moorvegetation ge-schützt, etwa 2/3 davon sind Hochmoore.Die größten Herausforderungen für dienachhaltige Nutzung und den Schutz derestnischen Moore sind derzeit (1) übermäßi-ge Ausbeutung der Torfvorräte, (2) zuneh-mender ökonomischer Druck, (3) ungenü-gende Regeneration zerstörter Gebiete, (4)Luftverunreinigung durch Industrieabgase,(5) Brände, (6) Langzeitfolgen der Entwäs-serungen in der Vergangenheit und (7) dieEntwicklung eines Netzwerkes geschützterMoore.
141
© Biologiezentrum Linz/Austria; download unter www.biologiezentrum.at

ReferencesAAVIKSOO K., KAOARIK H. & V. MASING (1997): Aerial
views and close up pictures of 30 Estonianmires. — Environment Information Centre,Tallinn: 1-96.
AAVIKSOO K., PAAL J. & T. Oi?us (2000): Mapping ofwetland habitat diversity using satellite dataand GIS: an example from the Alam-Pedja Na-ture Reserve, Estonia. — Proc. Estonian Acad.Sei. Biol. Ecol. 49: 177-193.
ALUKVEE H. & M. ILOMETS (1995): Sood ja needareng. — In: RAUKAS A. (Ed.), Eesti. Loodus.Valgus & Eesti EntsOklopeediakirjastus,Tallinn: 327-347.
ANIMAGI J. (1995): Development of peat industry.— In: ILOMETS M., ANIMAGI J. & R. KALLAS (Eds.),
Estonian peatlands, a brief review of their de-velopment, state, conservation, peat re-sources and management. Ministry of Envi-ronment, Tallinn: 36-41.
AUG H. & R. KOKK (1983): Eesti NSV looduslike ro-humaade levik ja saagikus. — Eesti NSVAgrotööstuskoondise Informatsiooni ja Juu-rutamise Valitsus, Tallinn: 1-100.
BARKMAN 1.1., MORAVEC J. & S. RAUSCHERT (1986):
Code of phytosociological nomenclature. —Vegetatio67: 145-195.
BLAB J., RIECKEN U. & A. SSYMANK (1993): Vorschlag
eines Kriteriensystems für eine Rote ListeBiotope auf Bundesebene. — Schr.-R. Land-schaftspflege Naturschutz 38: 265-273.
BOTCH M. & V. MASING (1983): Mire ecosystems inthe U.S.S.R. — In: Gore A.J.P. (Ed.), Ecosystemsof the world. 4B. Mires: swamp, bog, fen andmoor. Elsevier, Amsterdam: 95-152.
CHERKASOV A.F., BUTKUS V.F. & A.V. GORBUNOV (1981):
Klyukva. — Nauka, Moskva: 1-214.
EESTI NSV KLIIMAATLAS (1969) — Bit, Tallinn: 1-209.
ELINA G.A. (1971): Tipy bolot Pribelomorskoi niz-mennosti. — In: LOPATIN V.D. (Ed.), BolotaKarelii i puti ikh osvoeniya. Karel'skii filial ANSSSR, Petrozavodsk: 51-79.
ETVERK I. & H. SEIN (1995): Eesti metsasus. — In:RAUKAS A. (Ed.), Eesti. Loodus. Valgus S EestiEntsüklopeediakirjastus, Tallinn: 405-416.
GALKINA E.A. (1946): Bolotnye landshafty i prinzipyikh klassifikazii. — Sbornik nauchnykh rabotBotanicheskogo instituta imeni V.LKomarovaAN SSSR. Nauka, Leningrad: 139-156.
GASTON K.J. (1994): Rarity. — Chapman & Hall, Lon-don: 1-205.
GASTON K.J. (1996): What is biodiversity? — In: GAS-TON KJ. (Ed.), Biodiversity. A biology of num-bers and difference. Blackwell Science, Ox-ford: 1-9.
GAUDIG G. & H. JOOSTEN (2002): Peat moss {Sphag-num) as a renewable resource - an alterna-tive to sphagnum peat in horticulture? — In:SCHMILEWSKI G. & L ROCHEFORT (Eds.), Proceed-ings of the International Peat Symposium"Peat rn Horticulture. Quality and Environ-
mental Challenges". Pärnu, Estonia, 3-6 Sept.2002. International Peat Society, Jyväskylä:117-125.
GLOWKA L., BURHENNE-GUILMIN F., MCNEELY A.M. & L.
GRONGUNG (Eds.) (1994): A guide to the Con-vention on Biodiversity. — IUCN, Gland, Cam-bridge: xii + 1-161.
HABERMAN H. (Ed.) (1959): Entomoloogiline kogu-mik, I. — ENSV Teaduste Akadeemia, Tartu: 1-214.
HABITATS DIRECTIVE (1992): Council Directive92/43/EEC of 21 May 1992 on the conserva-tion of natural habitats and of wild faunaand flora. — Official Journal of the EuropeanCommunities L 206: 7-50.
HAMMER H. (1998): Eesti aiandusturba turundus:
ettevötte äriidee, SWOT-analüüs, tootestra-
teegia ja turustuspoliitika. — Eesti Turvas 3/4:
23-30.
HOMMIK K. (1982): Mis siis ikkagi juhtus paran-
datud maadel? — Sotsialistlik Pöllumajandus
8: 18-20.
ILOMETS M. (1994a): Flexible policies in a changing
world: 70 years of mire conservation in Esto-
nia. — In: GRCINIG A. (Ed.), Mires and man.
Mire conservation in a densely populated
country - the Swiss experience. Swiss Federal
Institute for Forest, Snow and Landscape Re-
search, Birmensdorf: 324-327.
ILOMETS M. (1994b): Miks peame hoidma Eestimaa
soid? — Eesti Loodus 3: 80-83.
ILOMETS M. (1994C): Turba juurdekasvust Eestis. —
Eesti Geograafia Seltsi Aastaraamat 26: 13-18.
ILOMETS M. (2001): Mis saab jääksoodest? — Eesti
Loodus 6: 218-221.
ILOMETS M. (2003): Mille arvel kaevandame tur-
vast? — Eesti Loodus 2/3: 20-24.
ILOMETS M., ANIMAGI J. S R. KALLAS (1995): Estonian
peatlands, a brief review of their develop-
ment, state, conservation, peat resources and
management. — Ministry of Environment,
Tallinn: 1-48.
ILOMETS M. & R. KALLAS (1995): Estonian mires -
past, present and future alternatives. — Gun-
neria70: 117-126.
INGERPUU N., KALDA A., KANNUKEHE L., KRALL H., LEIS
M. & K. VEUAK (1994): Eesti sammalde ni-
mestik. — Abiks Loodusevaatlejale 94: 1-175.
IVANOV K.E. (1981): Water movement in mirelands.
— Academic Press, London: 1-276.
JAADLA T. (1994): Jöhvikakasvatus turbaväljadel. —
Eesti Turvas 1: 19.
JAOCEL A.K. & P. POSCHLOD (1996): Why are some
plant species of fragmented continental dry
grasslands frequent and some rare? — In: SET-
TELE J., MARGULES CR., POSCHLOD P. & K. HENLE
(Eds.), Species survival in fragmented land-
scapes. Kluwer Academic, The Netherlands:
194-203.
142
© Biologiezentrum Linz/Austria; download unter www.biologiezentrum.at

JARVA L. & E. PARMASTO (1980): List of Estonian fun-
gi with host index and bibliography. — Scrip-
ta Mycologica 7. Academy of Sciences of the
Estonian S.S.R., Tartu: 1-331.
JENIK J. & L. SOUKUPOVA (1992): Microtopography of
subalpine mires in the Krkono?e Mountains,
the Sudetes. — Preslia, Praha 64: 313-326.
KALAMEES K. & A. RAITVIIR (1982): A list of higher
fungi of Estonian peatlands. — In: MASING V.
(Ed.), Peatland ecosystems. Valgus, Tallinn:
30-33.
KALAMEES K. (1982): The composition and seasonal
dynamics of fungal cover on peat soils. — In:
MASING V. (Ed.). Peatland ecosystems. Valgus,
Tallinn: 12-29.
KALLAS R. (1995): Contemporary stage of mire na-
ture protection in Estonia. — In: AAVIKSOO K.,
KULL K., PAAL J. & H. TRASS (Eds.), Consortium
Masingii. A Festschrift for Viktor Masing. Tar-
tu University, Tartu: 51-57.
KANNUKENEL. & M. KASK (1982): A preliminary list of
bryophytes of Estonian peatlands. — In: MAS-
ING V. (Ed.), Peatland ecosystems. Valgus,
Tallinn: 34-38.
KAROFELD E. (1994): Human impact on bogs. — In:PUNNING J.-M. (Ed.), The influence of naturaland anthropogenic factors on the develop-ment of landscapes (The results of a compre-hensive study in NE Estonia). Institute of Ecol-ogy, Publication 2, 1994, Tallinn: 133-149.
KAROFELD E. (1999): Formation and development ofmicrotopography on Estonian raised bogs. —Tallinn Pedagogical University, Dissertationson Natural Sciences 2: 1-56.
KASK M. (1982): A list of vascular plants in Estonian
peatlands. — In: MASING V. (Ed.), Peatland
ecosystems. Valgus, Tallinn: 39-49.
KOKK R. & I. ROOMA (1974): Eesti NSV mullastik
arvudes. — Valgus, Tallinn: 1-87.
KOLLIST P. (1988): Soode metsamajanduslik kasuta-
mine. — In: VALK U. (Ed.), Eesti sood. Valgus,
Tallinn: 198-210.
KORPELA L. (2002): Structural diversity of sprucemires - view of restoration. — In: SCHMILEWSKIG. & L. ROCHEFORT (Eds.), Proceedings of the In-ternational Peat Symposium "Peat in Horti-culture. Quality and Environmental Chal-lenges". Pärnu, Estonia, 3-6 Sept. 2002. Inter-national Peat Society, Jyväskylä: 333-339.
KUKK T. (1999): Eesti taimestik. — Teaduste
Akadeemia Kirjastus, Tartu-Tallinn: 1-646.
KULL T. (1999): Estonian Biodivesity Strategy andAction Plan. — Estonian Ministry of the Envi-ronment & UNEP, Tallinn-Tartu: 1-165.
KUUSK V., TABAKA L. & R. JANKEVICIENE (1996): Flora of
the Baltic countries, II. — Eesti LoodusPhoto
AS, Tartu: 1-372.
KUUSK V., TABAKA L. & R. JANKEVICIENE (2003): Flora of
the Baltic countries, III. — Estonian Agricul-
tural University, Tartu: 1-406.
KOLVIK M. (1996): Status of biological resources. —In: RAUKAS A. (Ed.), Estonian environment.Past, present and future. Ministry of the Envi-ronmnet of Estonia & Environment Informa-tion Centre, Tallinn: 36-40.
KOLVIK M. & J. TAMBETS (Eds.) (1998): Eesti bi-oloogilise mitmekesisuse Qlevaate (countrystudy) materjale. — Eesti Keskkonnaminis-teerium, Tallinn-Tartu: 1-327.
LAASIMER L. (1965): Eesti NSV taimkate. — Valgus,
Tallinn: 1-397.
LAASIMER L., KUUSK V., TABAKA L. & A. LEKAVICIUS (Eds.)
(1993): Flora of the Baltic countries, I. — Es-
tonian Academy of Sciences, Tartu: 1-362.
LAASIMER L. & V. MASING (1995): Taimestik ja
taimkate. — In: RAUKAS A. (Ed.), Eesti. Loodus.
Valgus & Eesti Entsuklopeediakirjastus,
Tallinn: 364-396.
LAVOIE C. & L. ROCHEFORT (1996): The natural reveg-
etation of a harvested peatland in southern
Quebec: A spatial and dendroecological
analysis. — Ecoscience 3: 101-111.
LEIBAK E., LILLELEHT V. & H. VEROMANN (1994): Birds of
Estonia: status, distribution and numbers. —
Estonian Academy of Sciences, Tallinn: 1-287.
LEIBAK E. & L. LUTSAR (Eds.) (1996): Estonian coastal
and floodplain meadows. — Kirjameeste Kir-
jastus, Tallinn: 1-247.
LILLELEHT V. (1998): Eesti linnustik, seile muutused
ja mitmekesisus erinevates biotoopides. — In:
LILLELEHT V. (Ed.), Eesti looduse mitmekesisus ja
seile kaitse. Eesti TA Looduskaitse Komisjon,
Tartu-Tallinn: 87-104.
LINDSAY R.A., RIGGALL J. & F. BURD (1985): The use of
small-scale surface patterns in the classifica-
tion of British peatlands. — Aquilo, Ser. Bot.
21: 69-79.
LIPPMAA T. (1933): Taimeühingute uurimise
metoodika ja Eesti taimeühingute klassifikat-
siooni pöhijooni. — Loodusuurijate Seltsi
Aruanded40: 1-169.
LODE E. (1998): Soode taastamine - eetika, esteeti-
ka ja keskonnateadvuse küsimus! — Eesti Tur-
vas3/4: 11-14.
LOOPMANN A. (1994): Kui palju on Eestis kuiven-
damata soid? — Eesti Turvas 4: 17-19.
LOPATIN, V.D. (1954): "Gladkoe" boloto (Torfyanaya
zalezh i bolotnye facii. — Uchenye zapiski
Leningradskogo Gosudarstvennogo Univer-
siteta, Ser. geograficheskikh nauk 9: 95-181.
LOHMUS E. (1981): Anthropogenous forest site
types on drained peatlands. — In: LAASIMER L.
(Ed.), Anthropogenous changes in the plant
cover of Estonia. Academy of Sciences of the
Estonian S.S.R., Tartu: 77-90.
LOHMUS E. (1982): Ködusoometsade geneesist,
klassifitseerimisest ja diagnostikast. — In:
TAMM 0. (Ed.), Metsamajandus. Metsade ma-
jandamine, kaitse ja rekreatiivne kasutamine.
Valgus, Tallinn: 3-25.
143
© Biologiezentrum Linz/Austria; download unter www.biologiezentrum.at

LOHMUS E. (1984): Eesti metsakasvukohatüübid. —ENSV Agrotööstuskoondise Info- ja Juurutus-valitsus, Tallinn: 1-88.
MAAVARA V. (1988): Loomastik. — In: VALK U. (Ed.),Eesti sood. Valgus, Tallinn: 110-117, 151-157.
MALMER N. (1985): Remarks to the classification ofmires and mire vegetation - Scandinavian ar-guments. — Aquilo, Ser. Bot. 21 : 9-17.
MALTERER T.J.. JOHNSON K.W. & D.S. GRUBICH (2002):
Wise use of peatlands in the USA: policy andregulatory aspects. — In: SCHMILEWSKI G. & L.ROCHEFORT (Eds.), Proceedings of the Interna-tional Peat Symposium "Peat in Horticulture.Quality and Environmental Challenges". Pär-nu, Estonia, 3-6 Sept. 2002. International PeatSociety, Jyväskylä: 309-313.
MARGULES C.R. (1986): Conservation evaluation inpractice. — In: USHER M.B. (Ed.), Wildlife con-servation evaluation. Chapman & Hall, Lon-don, New York: 297-314.
MASING V. (1960): Rabade pölemine japölemisjärgsed taimkatte muutused. — TartuRiikliku Cllikooli Toim. 93. Botaanika-alasedtööd 4: 96-122.
MASING V. (1964): Rastitel'nost' verkhovykh bolotostrova Saaremaa. — In: KUUSK V. (Ed.), Izy-chenie rastitel'nosti ostrova Saaremaa.Akademiya Nauk Estonskoi SSR, Tartu: 255-280.
MASING V. (1972): Typological approach in mirelandscape study (with a brief multilingual vo-cabulary of mire landscape structure). — In:KAARE T. & J.-M. PUNNING (Eds.), Estonia. Geo-graphical Studies. Valgus, Tallinn: 61-84.
MASING V. (1974): Proposal for unified and speci-fied terminology to designate mires meritingconservation. — In: KUMARI E. (Ed.), Estonianwetlands and their life. Estonian contribu-tions to the IBP 7, Valgus, Tallinn: 183-190.
MASING V. (1975): Mire typology of the EstonianS.S.R. — In: LAASIMER L. (Ed.), Some aspects ofbotanical research in the Estonian S.S.R.Academy of Sciences of the Estonian S.S.R.,Tartu: 123-138.
MASING V. (1981): Consortia as elements of thefunctional structure of biocoenoses. — In:LAASIMER L. (Ed.), Anthropogenous changes inthe plant cover of Estonia. Academy of Sci-ences of the Estonian S.S.R., Tartu: 64-76.
MASING V. (1982): The plant cover of Estonianbogs: a structural analysis. — In: MASING V.(Ed.), Peatland ecosystems. Valgus, Tallinn:50-92.
MASING V. (1984): Estonian bogs: plant cover, suc-cession and classification. — In: MOORE P.D.(Ed.), European mires. Academic Press, Lon-don: 119-148.
MASING V. (1988): Eesti soode valdkonnad. — In:VAUC U. (Ed.), Eesti sood. Valgus, Tallinn: 247-251.
MASMG V. & J. PAAL (1998): Estniska vätmarker -klassificering och biodiversitet — Svensk Bot.Tidskr. 92: 147-161.
MASING V., PAAL J. & A. KURESOO (2000): Biodiversity
of Estonian wetlands. — In: GOPAL B., JUNKW.J. & J.A. DAVIS (Eds.), Biodiversity in wet-lands: assessment function and conservation.Vol. 1. Backhuys Publishers, The Netherlands,Leiden: 259-279.
MASING V. & U. VALK (1968): Rabade taimkattemuutumine inimtegevuse möjul. — Metsan-duslikud Uurimused 6: 66-92.
MOEN A. (1999): National atlas of Norway: vegeta-tion. — Norwegian Mapping Authority,Honefoss: 1-200.
MUNTON P. (1987): Concepts of threat to survival ofspecies used in Red Data books and similarcompilations. — In: FITTER R. & M. FITTER (Eds.),The road to extinction. IUCN and UNEP,Gland: 72-95.
ORRU M. (1995): Eesti turbasood. — Eesti Ge-
oloogiakeskus, Tallinn: 1-240.
ORRU M. (1997): Peat resources of Estonia. — In:LAPPALAINEN E. (Ed.), Global peat resources. In-ternational Peat Society, UNESCO, GeologicalSurvey of Finland: 65-68.
ORRU M. (2003): Eesti turbavarud ja nende
keskkonnasäästlik kasutamine. — Eesti Lood-
US2/3: 12-13.
OSVALD H. (1923): Die Vegetation des HochmooresKomosse. — Sven. Växtsociol Sällsk. Handl. 1:1-436.
PAAL J. (1994): Moss synusiae in South Estonianforests. — Folia Geobot. Phytotax. 29: 497-509.
PAAL J. (1997): Eesti taimkatte kasvukohatüüpideklassifikatsioon. — Eesti Keskkonnaminis-teerium & ÜRO Keskkonnaprogramm, Tallinn:1-297.
PAAL J. (1998a): Rare and threatened plant com-munities of Estonia. — Biodiversity and Con-servation 7: 1027-1049.
PAAL J. (1998b): Plant communities meriting pro-tection in Estonia. II. Their criteria and net-work of typical communities. — Estonia Mar-itima 3: 93-104.
PAAL J. (1999): Haruldased ja kaitset vajavadtaimekooslused. — In: FREY T. (Ed.), Loodus-liku mitmekesisuse kaitse viisid ja vahendid.Eesti Ökoloogiakogu, Tartu: 35-46.
PAAL J. (2001): Classification of the Estonian vege-
tation site types; an amended version after
PAAL (1997). — http://www.botany.ut.ee/
jaanus.paal/etk klassifikatsioon.pdf.
PAAL J. (2003): Inventories for nature protection in
Estonia; problems and results. — In: HEKKHA R.
& T. UNDKOLM (Eds.), Biodiversity and conserva-
tion of boreal nature. Proc. of the 10 years an-
niversary symp. of the Nature Reserve Friend-
ship. The Finnish Environment 485: 37-49.
PAAL J., ILOMETS M., FREMSTAD E., MOEN A., BORSET E.,
KUUSEMETS V., TRUUS L & E. LH3AK (1998): Es-
tonian Wetlands Inventory 1997. — Publica-t ion of the project "Estonian Wetlands Con-
144
© Biologiezentrum Linz/Austria; download unter www.biologiezentrum.at

servation and Management". Eesti Loodus-Photo, Tartu: xxviii + 1-166.
PAAL T., STARAST M.. KARP K. & J. PAAL (2002): Reha-
bilitation of milled peat areas by cranberry(Vaccinium oxycoccos L.) and bluberry (Vac-cinium angustifolium Ait.) plantations. — In:VERGNE V. , DE FOUCAULT B. & P. JULVE (Eds. ) ,
Guide to field study in some mires of France:Limousin, Auvergne, Rhöne-Alpes andFranche-Comte regions. IMCG Biennal Inter-national Symposium - France 2002, 10ai-22"<!
of July 2002. Groupe d'Etude des Tourbieres,France: 130.
PETERSON K. (1994): Nature conservation in Estonia.— Juma, Tallinn: 1-48.
PIKK J. (1997): Öhukeseturbaliste soode kauakest-nud kuivendamise tulemusi. — Teadustöödekogumik 189. Metsandus, Eesti Pöllumajan-dusülikool, Tartu: 148-156.
PUNNING J.-M., ILOMETS M., KAROFELD E., TOOTS N., KO-
ZLOVA M., PELEKIS L. & I. TAURE (1987):
Möningate keemiliste elementide sisaldus Li-ivjärve raba turbalasundis ning Räätsma järvepöhjasetteis. — In: ILOMETS M. (Ed.), Kurtnajärvestiku looduslik seisund ja seile areng.Valgus, Tallinn: 62-67.
PUNNING J.-M., KOFF T, ILOMETS M. & J. JOGI (1995):
The relative influence of local, extra-local,and regional factors on organic sedimenta-tion in the Vällamäe kettle hole, Estonia. —Boreas 24: 65-80.
RAMST R. (1995): Turba tootmisest Eestis. — EestiTurvas 1/2: 8-9.
RAMST R. (1997): Löppes Eesti turbatootmisaladeinventariseerimine. — Eesti Turvas 1/2: 17-19.
RATT A. (1985): Mönda maaviljeluse arengustEestis läbi aegade. — Valgus, Tallinn: 1-272.
RAUKAS A. (1986): Deglaciation of the Gulf of Fin-land and adjoining areas. — Bull. Geol. Soc.Finland 58: 21-33.
REIER 0. (1982): Murakad. — Valgus, Tallinn: 1-138.
REIER 0. (1995): Consortium Rubi chamaemori inEstonia, Russian Karelia and Murmansk Dis-trict. — In: AAVIKSOO K., KULL K., PAAL J. & H.
TRASS (Eds), Consortium Masingii. A festschriftfor Viktor Masing. Tartu University, Tartu: 78-88.
REINTAM L. (1995): Soil in Estonia. — In: BOGUSLAVSKIE.V., LIMBERG P., REINTAM L. & H.-R. WEGENER
(Eds.), Boden und Düngung. Mitt, der Intern.Arbeitsgemeinschaft f. Bodenfruchtbarkeit d.IBG, Tartu: 122-131.
RIECKEN U. & A. SSYMANK (1993): Rote Liste Biotope- Übersicht über bestehende Ansätze, Ziele,Möglichkeiten and Probleme. — Schr.-R.Landschaftspflege Naturschutz 38: 9-23.
ROCHEFORT L. & S. CAMPEAU (2002): Recovery ofdonor sites used for peatland restoration. —In: SCHMILEWSKI G. & L. ROCHEFORT (Eds.), Pro-
ceedings of the International Peat Sympo-sium "Peat in Horticulture. Quality and Envi-ronmental Challenges". Pärnu, Estonia, 3-6Sept. 2002. International Peat Society,Jyväskylä: 244-250.
ROMANOVA E.A. (1961): Geobotanicheskie osnovygidrologicheskogo izucheniya verhovykhbolot. — Gidrometeoizdat, Leningrad: 1-244.
ROOSALUSTE E.I. (1984): Vlijanie osusheniya narastitel'nost' klyuchevogo bolota VI-idumyaeskogo zapovednika. — Flora irastitel'nost' ohranyaemykh territorii.Uchenye Zapiski Tartuskogo Gosudarstvenno-go Universiteta 662: 54-58.
Ruus E. (1975): Eesti NSV jöhvikasoode inventeer-imine. — In: REITALU M. (Ed.), Eesti NSV riiklikelooduskaitsealade tööd 2. Valgus, Tallinn:120-137.
SALONEN V. (1987): Revegetation of an area of Mus-tasuo-mire after clearing for peat harvesting.— Suo38: 1-3.
SJORS H. (1948): Myrvegetation i Bergslagen. — Ac-
ta Phytogeographica Suecia 21: 1-299.
SJÖRS H. (1950): Regional studies in North Swedishmire vegetation. — Botaniska Notiser 2: 173-222.
STARAST M., KARP K., PAAL T., VARNIK R. S E. VOOL
(2005): Kultuurmustikas ja seile kasvatamineEestis. — Eesti Pöllumajandusülikool, Tartu: 1-65.
THOMSON P.W. (1924): Vorläufige Mitteilung überneue Fundorte und Verbreitungsgebieteeiniger Moorpflanzen in Estland. — Loodusu-urijate Seltsi Aruanded 31 : 3-4.
TOMBERG U. (1970): Turba kulumine sookultuurideviljelemisel. — Eesti Maaviljeluse ja Maa-paranduse Teadusliku Uurimise InstituudiTeaduslike Tööde Kogumik 20: 134-139.
TOMBERG U. (1992): Turba vajumine soode kuiven-damisel. — Eesti Maaviljeluse ja Maaparan-duse Teadusliku Uurimise Instituut, Saku: 1-32.
TRASS H. (1958): Geobotaanika teooria probleemeseoses madalsoode taimkonna klassifitseer-imisega. — Tartu Riikliku Ülikooli Toimetised64: 38-62.
TRASS H. (1960): Lääne-Eesti madalsoode flooraanalüüs. — Tartu Riikliku Ülikooli Toimetised93. Botaanika-alased tööd 4: 35-95.
TRASS H. (1975): Sepsika-sood Eesti NSV-s. — EestiNSV TA Toimetised, Biol. 6: 134-145.
TRASS H. (1994): Fen flora and vegetation status inEstonia. — Proc. Intern. Symp. Conservationand Management of Fens, 6-10 June, War-saw-Biebrza, Poland. Institute for Land Recla-mation and Grassland Farming, Warsaw: 467-475.
TRUU A., KURM H. & K. VEBER (1964): Eesti NSV soodja nende pöllumajanduslik kasutamine. — In:JOHANDI E. (Ed.). Eesti NSV sood. EMMTUITeaduslike Tööde Kogumik 4: 3-136.
VALK U. (Ed.) (1988): Eesti sood. — Valgus, Tallinn:1-344.
VAREP E. (1968): Man and nature, as illustrated bysome problems of nature conservation in theEstonian S.S.R. — Valgus, Tallinn: 1-24.
145
© Biologiezentrum Linz/Austria; download unter www.biologiezentrum.at
VASANDER H., LODE E., LUNDIN L, ILOMETS M., SALLATAUS
T., TurmiA E.-S. & J. LAINE (2000): Restorationof peatlands in northern Europe. — In: CROWEA. & L. ROCHEFORT (Eds.), Quebec 2000: Milleni-um Wetland Event. August 6-12, 2000, Que-bec Canada. Program with abstracts, Que-bec: 222-223.
VIIDALEPP J. & H. REMM (1996): Eesti liblikate määra-
ja. — Valgus, Tallinn: 1-443.
VILBASTE A. (1980): The spider fauna of Estonianmires. — ENSV Teaduste Akadeemia Toim. 29,Biol. 4:313-327.
VILBASTE A. (1981): The spider fauna of Estonianmires. — ENSV Teaduste Akadeemia Toim. 30,Biol. 1: 7-17.
VIIBASTE H. (1972): Jöhvikas kodupeenrale. — EestiLoodus 9: 556-558.
VILBASTE H. (1974): Jöhvika kultiveerimise voimalus-test Eesti NSV-s. — In: ETVERK I. (Ed.), Met-samajandus 1974, 1. Teaduslik-tehnilinekogumik. Valgus, Tallinn: 73-79.
WEBER C. (1908): Aufbau und Vegetation derMoore Nordwestdeutschlands. — Engler'sBot. Jahrb. 40(1), Beiblatt 90: 19-34.
ZOBEL M. (1992): Estonian mires and their utiliza-tion. — Suo 43: 25-33.
Address of the author:
Jaanus PAAL
Institute of Botany and Ecology
University of Tartu
Lai St. 40, EE24O0, Estonia.E-Mail: [email protected]
146
© Biologiezentrum Linz/Austria; download unter www.biologiezentrum.at

ZOBODAT - www.zobodat.atZoologisch-Botanische Datenbank/Zoological-Botanical Database
Digitale Literatur/Digital Literature
Zeitschrift/Journal: Stapfia
Jahr/Year: 2005
Band/Volume: 0085
Autor(en)/Author(s): Paal Jaanus
Artikel/Article: Estonian mires / Moore in Estland 117-146
Related Documents