RESEARCH ARTICLE Estimation of years lived with disability due to noncommunicable diseases and injuries using a population-representative survey Ji In Park, Hae Hyuk Jung* Department of Medicine, Kangwon National University Hospital, Kangwon National University School of Medicine, Chuncheon, Gangwon-do, South Korea * [email protected] Abstract The Global Burden of Disease 2010 and the WHO Global Health Estimates of years lived with disability (YLDs) uses disability-weights obtained from lay health-state descriptions, which cannot fully reflect different disease manifestations, according to severity, treatment, and environment. The aim of this study was to provide population-representative YLDs of noncommunicable diseases and injuries using a prevalence-based approach, with the disability weight measured in subjects with specific diseases or injuries. We included a total of 44969 adults, who completed the EQ-5D questionnaire as participation in the Korea National Health and Nutrition Examination Survey 2007–2014. We estimated the preva- lence of each of 40 conditions identified from the noncommunicable diseases and injuries in the WHO list. Modified condition-specific disability-weight was determined from the adjusted mean difference of the EQ-5D index between the condition and reference groups. Condi- tion-specific YLDs were calculated as the condition’s prevalence multiplied by the condi- tion’s disability-weight. All-cause YLDs, estimated as “number of population × (1 − mean score of EQ-5D)” were 2165 thousands in 39044 thousand adults aged !20. The combined YLDs for all 40 conditions accounted for 67.6% of all-cause YLDs, and were 1604, 2126, 8749, and 12847 per 100000 young (age 20−59) males, young females, old (age !60) males, and old females, respectively. Back pain/osteoarthritis YLDs were exceptionally large (442/40, 864/146, 2037/836, and 4644/3039 per 100000 young males, young females, old males, and old females, respectively). Back pain, osteoarthritis, depression, diabetes, periodontitis, and stroke accounted for 22.3%, 9.1%, 4.6%, 3.3%, 3.2%, and 2.9% of all- cause YLDs, respectively. In conclusion, this estimation of YLDs using prevalence rates and disability-weights measured in a population-representative survey may form the basis for population-level strategies to prevent age-related worsening of disability. Introduction The World Health Organization (WHO) Global Health Estimates (GHE) and World Bank- commissioned Global Burden of Disease (GBD) study measure the overall burden of disease using disability-adjusted life years (DALYs) [1]. This time-based measure combines years of PLOS ONE | DOI:10.1371/journal.pone.0172001 February 14, 2017 1 / 25 a1111111111 a1111111111 a1111111111 a1111111111 a1111111111 OPEN ACCESS Citation: Park JI, Jung HH (2017) Estimation of years lived with disability due to noncommunicable diseases and injuries using a population- representative survey. PLoS ONE 12(2): e0172001. doi:10.1371/journal.pone.0172001 Editor: Mark H Vickers, University of Auckland, NEW ZEALAND Received: April 27, 2016 Accepted: January 30, 2017 Published: February 14, 2017 Copyright: © 2017 Park, Jung. This is an open access article distributed under the terms of the Creative Commons Attribution License, which permits unrestricted use, distribution, and reproduction in any medium, provided the original author and source are credited. Data Availability Statement: Data sets used in this study are available from the Korea Centers for Disease Control and Prevention database (2007- 2014). http://cdc.go.kr/CDC/contents/ CdcKrContentView.jsp?cid=60940&menuIds= HOME001-MNU1130-MNU1639-MNU1748- MNU1752 Funding: The authors received no specific funding for this work. Competing interests: The authors have declared that no competing interests exist.

Estimation of years lived with disability due to ......* [email protected] Abstract The Global Burden of Disease 2010 and the WHO Global Health Estimates of years lived with disability
Apr 16, 2020
Welcome message from author
This document is posted to help you gain knowledge. Please leave a comment to let me know what you think about it! Share it to your friends and learn new things together.
Transcript
RESEARCH ARTICLE
Estimation of years lived with disability due to
noncommunicable diseases and injuries using
a population-representative survey
Ji In Park, Hae Hyuk Jung*
Department of Medicine, Kangwon National University Hospital, Kangwon National University School of
Medicine, Chuncheon, Gangwon-do, South Korea
Abstract
The Global Burden of Disease 2010 and the WHO Global Health Estimates of years lived
with disability (YLDs) uses disability-weights obtained from lay health-state descriptions,
which cannot fully reflect different disease manifestations, according to severity, treatment,
and environment. The aim of this study was to provide population-representative YLDs of
noncommunicable diseases and injuries using a prevalence-based approach, with the
disability weight measured in subjects with specific diseases or injuries. We included a total
of 44969 adults, who completed the EQ-5D questionnaire as participation in the Korea
National Health and Nutrition Examination Survey 2007–2014. We estimated the preva-
lence of each of 40 conditions identified from the noncommunicable diseases and injuries in
the WHO list. Modified condition-specific disability-weight was determined from the adjusted
mean difference of the EQ-5D index between the condition and reference groups. Condi-
tion-specific YLDs were calculated as the condition’s prevalence multiplied by the condi-
tion’s disability-weight. All-cause YLDs, estimated as “number of population × (1 −mean
score of EQ-5D)” were 2165 thousands in 39044 thousand adults aged�20. The combined
YLDs for all 40 conditions accounted for 67.6% of all-cause YLDs, and were 1604, 2126,
8749, and 12847 per 100000 young (age 20−59) males, young females, old (age�60)
males, and old females, respectively. Back pain/osteoarthritis YLDs were exceptionally
large (442/40, 864/146, 2037/836, and 4644/3039 per 100000 young males, young females,
old males, and old females, respectively). Back pain, osteoarthritis, depression, diabetes,
periodontitis, and stroke accounted for 22.3%, 9.1%, 4.6%, 3.3%, 3.2%, and 2.9% of all-
cause YLDs, respectively. In conclusion, this estimation of YLDs using prevalence rates and
disability-weights measured in a population-representative survey may form the basis for
population-level strategies to prevent age-related worsening of disability.
Introduction
The World Health Organization (WHO) Global Health Estimates (GHE) and World Bank-
commissioned Global Burden of Disease (GBD) study measure the overall burden of disease
using disability-adjusted life years (DALYs) [1]. This time-based measure combines years of
PLOS ONE | DOI:10.1371/journal.pone.0172001 February 14, 2017 1 / 25
a1111111111
a1111111111
a1111111111
a1111111111
a1111111111
OPENACCESS
Citation: Park JI, Jung HH (2017) Estimation of
years lived with disability due to noncommunicable
diseases and injuries using a population-
representative survey. PLoS ONE 12(2): e0172001.
doi:10.1371/journal.pone.0172001
Editor: Mark H Vickers, University of Auckland,
NEW ZEALAND
Received: April 27, 2016
Accepted: January 30, 2017
Published: February 14, 2017
Copyright: © 2017 Park, Jung. This is an open
access article distributed under the terms of the
Creative Commons Attribution License, which
permits unrestricted use, distribution, and
reproduction in any medium, provided the original
author and source are credited.
Data Availability Statement: Data sets used in this
study are available from the Korea Centers for
Disease Control and Prevention database (2007-
2014). http://cdc.go.kr/CDC/contents/
CdcKrContentView.jsp?cid=60940&menuIds=
HOME001-MNU1130-MNU1639-MNU1748-
MNU1752
Funding: The authors received no specific funding
for this work.
Competing interests: The authors have declared
that no competing interests exist.

life lost due to premature mortality (YLLs) and years lost due to time lived in states of less than
full health (years lived with disability [YLDs]). YLDs are determined by non-fatal health out-
comes of diseases and injuries; chronic noncommunicable diseases and injuries with lifelong
consequences contribute markedly to non-fatal burdens of disease.
Condition-specific YLDs can be computed as the prevalence of disease or injury multiplied
by the disability-weight for that condition [2,3], and their reliable quantification requires pre-
cise estimates of prevalence rates and disability-weights for those conditions. However, unfor-
tunately, the epidemiological data currently available have limitations, including lack of
information on severity distributions, inconsistent methods for measuring disability-weights,
and wide variation in data sources, for most conditions [4–8]. The GBD 2010 employed lay
descriptions of the consequences of various diseases and injuries for developing universal mea-
sures of disability-weights, distinct from welfare and environments [9]. The WHO GHE also
used the GBD 2010-developed disability-weights to calculate global and regional YLDs, after
partially revising the values. However, it is arguable whether health and welfare can be sepa-
rated and whether a universal approach is possible or even desirable [10]. Additionally, a brief
lay description cannot reflect various manifestations of the same disease, the effect of treat-
ment on disability, and adaptation to environments.
The Korea National Health and Nutrition Examination Survey (KNHANES) can facilitate
estimation of condition-specific YLDs for noncommunicable diseases or injuries in the general
population. This large population-representative survey, conducted by the Korea Centers for
Disease Control and Prevention (KCDC), used the EQ-5D questionnaire to measure health-
related quality of life. The EQ-5D provides a simple descriptive profile and a single index value
for health status, simplifying disability-weight calculation. The survey also includes health
questionnaires and physical/laboratory examinations, allowing determination of prevalence
rate and disability-weight for specific diseases and injuries. Thus, numerous condition-specific
YLDs could be estimated from a single source.
The present study aimed to provide population-representative YLDs of noncommunicable
diseases and injuries, based on the KNHANES data. Additionally, we compared the YLDs of
this study to those of the GHE.
Materials and methods
Subjects and identification of conditions
The KNHANES is a population-based, cross-sectional study on the health and nutritional sta-
tus of the non-institutionalized Korean population. The KCDC conducted the survey using a
stratified, multistage, clustered probability design to select a representative, nationwide sample
[11]. KNHANES comprises a health questionnaire, physical/laboratory examinations, and a
nutrition survey; to date, phase I (1998), II (2001), III (2005), IV (2007−2009), V (2010−2012),
and VI (2013−2015) have been executed by the Korean government. Written informed con-
sent was obtained from each participant in the KNHANES at enrollment.
The present study protocol was approved by Kangwon national university hospital institu-
tional review board (IRB File No.: KNUH-2015-06-001). This study was based on KNHANES
2007−2014 data, as these surveys were conducted by a single organization, KCDC, using con-
sistent methodology since 2007, and KNHANES 2015 data were not available at the time of
this analysis.
Health-related quality of life was assessed using the Korean version of the EQ-5D health
questionnaire. The EQ-5D comprises five dimensions: mobility, self-care, usual activities,
pain/discomfort, and anxiety/depression. Each dimension comprised three levels: no prob-
lems, moderate problems, and extreme problems. The combination of all dimensions and
Years lived with disability
PLOS ONE | DOI:10.1371/journal.pone.0172001 February 14, 2017 2 / 25

levels yields 243 unique health states. The EQ-5D index scores were calculated based on the
Korean value set, which has been established based on a representative national sample using
the time−trade-off method [12]. Scores of 1 and 0 correspond to optimal and worst health,
judged to be equivalent to death, respectively.
Of the 65973 subjects participating in KNHANES 2007−2014, we excluded subjects youn-
ger than 20-years-old (n = 16444) and adults who did not complete the EQ-5D questionnaire
(n = 4560). Thus, a total of 44969 subjects (18984 males and 25985 females) were included in
this study (Fig 1).
Physical and laboratory examinations
Trained medical staff and medical specialists, including ophthalmologists, otolaryngologists,
and dentists performed the physical examinations, following standardized procedures. Oral
health examinations were conducted in mobile centers that traveled to each survey location.
Dentists conducted the examinations with the participant seated in a dental chair. Before the
Fig 1. Flow chart of the study participants.
doi:10.1371/journal.pone.0172001.g001
Years lived with disability
PLOS ONE | DOI:10.1371/journal.pone.0172001 February 14, 2017 3 / 25
oral examination, participants were informed about the procedures using intra-oral pictures,
tooth models, and simulation patients. Pulmonary function tests were performed in partici-
pants aged� 40 years, using dry rolling seal spirometers. The procedure was conducted by
trained medical personnel, who underwent education sessions on pulmonary function tests
and quality control prior to the study.
From July 2008 to December 2012, ophthalmological and otological examinations were
conducted in the Korea National Health and Nutrition Examination Survey (KNHANES).
These examinations were conducted by trained teams from mobile centers; use of such centers
provided a standardized environment and equipment. Presenting visual acuity was measured
using currently available refractive correction, if any, with an international standard vision
chart based on the Snellen scale. Best-corrected visual acuity was measured using autorefrac-
tion and/or a pinhole. Details of ophthalmologic examinations, including autorefractometry,
slit lamp biomicroscopy, fundus photography, intraocular pressure, and visual field (fre-
quency-doubling technology) tests have been published elsewhere [13]. Each fundus image
was reviewed twice: onsite by ophthalmologists or ophthalmological residents, and then by
retina specialists. An audiometry test was conducted by well-trained examiners, and the air-
conduction hearing threshold was measured in a soundproof booth using an automatic audi-
ometer at 500, 1000, 2000, 3000, 4000, and 6000 Hz.
Since 2010, plain radiographs of the knee, hip, and lumbar spine have been obtained in partici-
pants aged� 50 years. The radiographic images were reviewed by two radiologists. The degree of
radiographic osteoarthritis was assessed according to the Kellgren−Lawrence grading system.
Blood samples were collected after at least an 8-h fast, and random spot urine samples were
obtained. The samples were processed appropriately, immediately refrigerated, and trans-
ported in cold storage to the central laboratory within 24 h. Blood hemoglobin and routine
chemistries, including glucose and creatinine levels, were analyzed using standard methods.
From 2007 to 2012, serum ferritin levels were measured by immunoradiometric assay. Since
2008, serum creatinine levels have been standardized to isotope dilution mass spectrometry,
and urine albumin levels have been measured by turbidimetric immunoassay since 2011.
Identification of conditions
We identified noncommunicable diseases and injuries from the cause list of the World Health
Organization (WHO) Global Health Estimates (GHE).[2] The GHE list provides a set of mutu-
ally exclusive and collectively exhaustive categories. The causes in the list are categorized into
three broad groups: (I) communicable, maternal, perinatal, and nutritional conditions; (II)
noncommunicable diseases; and (III) injuries. Among a total of 79 individual diseases of
group II, we selected 30 diseases that could be identified using information available from the
KNHANES data. Those 30 diseases accounted for two-thirds of the total YLDs related to
group II. Nine of 10 individual injuries of group III could be identified, and those accounted
for nearly 100% of the total YLDs related to group III. Additionally, we selected iron-deficiency
anemia, which accounted for a fourth of the total YLDs related to group I. Of the 40 identified
conditions, five were divided into subcategories. Table 1 shows the study years and number of
subjects analyzed for each condition.
Definition of diseases and injuries
We defined and classified iron-deficiency anemia according to the WHO criteria [14]. Diabetes
mellitus was defined as fasting blood glucose levels� 126 mg/dl, being on medication for raised
blood glucose, or with a history of diagnosis of diabetes. Alcohol-use disorders were defined based
on the Alcohol-Use Disorders Identification Test scores according to the WHO guidelines [15].
Years lived with disability
PLOS ONE | DOI:10.1371/journal.pone.0172001 February 14, 2017 4 / 25

We defined glaucoma according to the criteria of the International Society of Geographical
and Epidemiological Ophthalmology classification scheme: Category 1, the presence of reliable
(fixation and false-positive error� 1) abnormal visual field testing (� one location of reduced
sensitivity) plus a vertical cup-to-disc ratio (VCDR)� 0.7, or asymmetry of the VCDR� 0.2,
or the presence of optic disk hemorrhage, or a retinal nerve fiber layer defect; Category 2, a
VCDR� 0.9 or asymmetry of the VCDR� 0.3, or the presence of a retinal nerve fiber layer
defect with violation of the inferior−superior−nasal−temporal rule; or Category 3, an intraocu-
lar pressure� 22 mmHg plus a visual acuity < 3/60. Cataract was defined as nuclear (Lens
Opacities Classification System [LOCS] III score� 4 for nuclear opalescence or nuclear
color), cortical (LOCS III score� 2 for cortical cataracts), posterior subcapsular (LOCS III
score� 2 for posterior subcapsular), or mixed (more than one type per eye) based on com-
parison with standard photographs. The diagnoses of diabetic retinopathy and age-related
macular degeneration were made by retina specialists based on fundus photography images
using protocols from the Early Treatment for Diabetic Retinopathy Study and International
Age-related Maculopathy Epidemiological Study Group. We defined visual impairment as a
visual acuity < 6/18 in the better eye, including uncorrected refractive errors according to the
International Classification of Diseases-10.
Disabling hearing impairment was defined as an audiometric International Society of
Otolaryngology value (average of values at 500, 1000, 2000, 4000 Hz)� 41 decibels in the
better ear, according to the WHO classification [16]. Chronic obstructive pulmonary disease
was defined and classified based on pulmonary function test results according to the Global
Initiative for Chronic Obstructive Lung Disease [17]. Chronic kidney disease was classified
into risk categories according to the Kidney Disease Improving Global Outcomes guidelines
[18]. Osteoarthritis was defined as the presence of knee or hip pain with Kellgren−Lawrence
grading scales score� 2 on the corresponding radiographic images. We assessed periodontitis
using the WHO Community Periodontal Index [19]. Periodontal disease was defined as a
Community Periodontal Index score� 3 with symptoms of difficulty in chewing and recent
toothache.
We defined cancers, depression, ischemic heart disease (myocardial infarction or angina),
stroke, current asthma, current peptic ulcer, cirrhosis, atopic dermatitis, and rheumatoid
Table 1. Study years and number of subjects analyzed for each condition.
Condition No. analyzed 2007 2008 2009 2010 2011 2012 2013 2014
Asthma, Cancers, Cirrhosis, Depression, Dermatitis, Ischemic heart disease,
Rheumatoid arthritis, Stroke
44,967
−44,969
p p p p p p p p
Iron-deficiency anemia 33,089p p p p p p
Diabetes mellitus 41,392p p p p p p p p
Alcohol-use disorders 33,969p p p p p p p
Visual impairment 25,884
−28,127
p p p p p
Hearing impairment 22,889p p p p p p
Chronic obstructive pulmonary disease (Age� 40 years) 21,425p p p p p p p p
Chronic kidney disease 19,166p p p p
Peptic ulcer 17,069p p p
Osteoarthritis, Back pain (Age� 50 years) 11,559p p p p
Back pain (Age 20−49 years) 8,955p p p
Dental caries, Periodontal disease 20,154p p p p p
Edentulism 43,536p p p p p p p p
Injuries 44,955p p p p p p p p
doi:10.1371/journal.pone.0172001.t001
Years lived with disability
PLOS ONE | DOI:10.1371/journal.pone.0172001 February 14, 2017 5 / 25
arthritis as a physician-based diagnosis of each disease. Unintentional or intentional injuries
were defined based on self-reported questionnaires.
We summarized the definition of each condition in Table 2.
Statistical analysis and computation of disability-weights and YLDs
Statistical analyses were performed with SPSS (version 22.0). Since the KCDC conducted the
KNHANES using a complex survey design, we used SPSS Complex Samples modules to pro-
duce reliable point estimates and robust standard errors.
We computed YLDs as follows. First, we estimated the prevalence of each condition in
every 2 × 2 age−sex group, arranged according to an age cutoff of 60 years and sex, as well as in
the total population. Composite sample weights were introduced separately in each of the anal-
yses to provide representative estimates of the Korean population. We calculated a total of
nine composite sample weights by multiplying the survey sample weights by the year weights,
according to KCDC’s guidebook. The survey sample weight for each examination was com-
puted using the sampling rate, response rate, and age−sex proportion of the Korean popula-
tion. The year weight for each examination was determined by the number of households that
participated in that year’s examination.
Second, a general linear model was used to test the effect of each condition on the EQ-5D
index, introducing the composite sample weight. Each adjusted mean difference from the ref-
erence group was computed using the estimated marginal means of the EQ-5D index; these
were estimated as the mean value, averaged over all cells generated by the age (and sex for the
analysis of the total population) category, after subdividing age into seven 10-year-width cate-
gories, from 20−29 years through to 70−79 years, as well as� 80 years. For comparison, all
other subjects without each condition served as the reference group. The differences in these
age (and sex)-adjusted mean scores between the condition and reference groups were obtained
for each of the 2 × 2 age−sex groups, as well as for the total population. As in the GBD 2010
and GHE [2,3], it was assumed that the conditions co-occurred independently of each other
within the age (and sex) category. However, for osteoarthritis and back pain (as well as caries
and periodontitis), which were most prevalent and which were substantially correlated with
each other, both conditions were introduced into the model together, to adjust for the effect of
dependence. If the two-tailed P value exceeded 0.10 (one-tailed P value > 0.05), the value of
the adjusted mean difference was excluded from further analyses.
Third, the “adjusted mean difference of the EQ-5D index” was used to establish a condi-
tion-specific disability-weight. To estimate the comorbidity-adjusted effect of each condition
on disability (“condition specific DW”), the disability-weight that included the condition of
interest (“combined DW”) was compared with the disability-weight that excluded the condi-
tion of interest (“comorbid DW”). Our approach was comparable to that of the GBD 2010 and
GHE. Assuming that comorbid conditions change the quantitative score for the health-related
quality of life multiplicatively rather than additively,
1 � ðcomorbid DWÞ � ð1 � condition specific DWÞ ¼ ð1 � combined DWÞ
2 � ð1 � comorbid DWÞ � ð1 � combined DWÞ ¼ condition specific DW � ð1 � comorbid DWÞ
Assuming that comorbidities were independently distributed in the condition and refer-
ence groups within the age (and sex) category, the value of “1 – comorbid DW” was replaced
with the estimated “marginal mean of EQ-5D index in the reference group”, and the value of
“1 – combined DW” was replaced with the “marginal mean in the group with the condition of
interest”.
Years lived with disability
PLOS ONE | DOI:10.1371/journal.pone.0172001 February 14, 2017 6 / 25
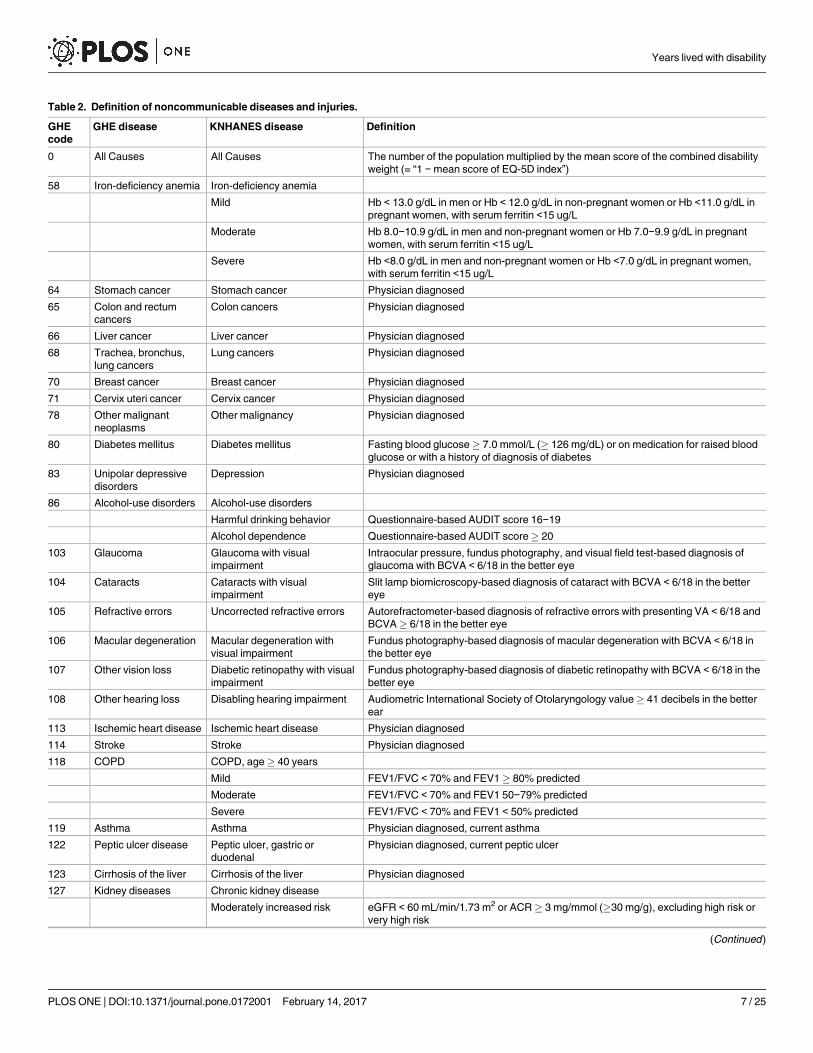
Table 2. Definition of noncommunicable diseases and injuries.
GHE
code
GHE disease KNHANES disease Definition
0 All Causes All Causes The number of the population multiplied by the mean score of the combined disability
weight (= “1 − mean score of EQ-5D index”)
58 Iron-deficiency anemia Iron-deficiency anemia
Mild Hb < 13.0 g/dL in men or Hb < 12.0 g/dL in non-pregnant women or Hb <11.0 g/dL in
pregnant women, with serum ferritin <15 ug/L
Moderate Hb 8.0−10.9 g/dL in men and non-pregnant women or Hb 7.0−9.9 g/dL in pregnant
women, with serum ferritin <15 ug/L
Severe Hb <8.0 g/dL in men and non-pregnant women or Hb <7.0 g/dL in pregnant women,
with serum ferritin <15 ug/L
64 Stomach cancer Stomach cancer Physician diagnosed
65 Colon and rectum
cancers
Colon cancers Physician diagnosed
66 Liver cancer Liver cancer Physician diagnosed
68 Trachea, bronchus,
lung cancers
Lung cancers Physician diagnosed
70 Breast cancer Breast cancer Physician diagnosed
71 Cervix uteri cancer Cervix cancer Physician diagnosed
78 Other malignant
neoplasms
Other malignancy Physician diagnosed
80 Diabetes mellitus Diabetes mellitus Fasting blood glucose� 7.0 mmol/L (� 126 mg/dL) or on medication for raised blood
glucose or with a history of diagnosis of diabetes
83 Unipolar depressive
disorders
Depression Physician diagnosed
86 Alcohol-use disorders Alcohol-use disorders
Harmful drinking behavior Questionnaire-based AUDIT score 16−19
Alcohol dependence Questionnaire-based AUDIT score� 20
103 Glaucoma Glaucoma with visual
impairment
Intraocular pressure, fundus photography, and visual field test-based diagnosis of
glaucoma with BCVA < 6/18 in the better eye
104 Cataracts Cataracts with visual
impairment
Slit lamp biomicroscopy-based diagnosis of cataract with BCVA < 6/18 in the better
eye
105 Refractive errors Uncorrected refractive errors Autorefractometer-based diagnosis of refractive errors with presenting VA < 6/18 and
BCVA� 6/18 in the better eye
106 Macular degeneration Macular degeneration with
visual impairment
Fundus photography-based diagnosis of macular degeneration with BCVA < 6/18 in
the better eye
107 Other vision loss Diabetic retinopathy with visual
impairment
Fundus photography-based diagnosis of diabetic retinopathy with BCVA < 6/18 in the
better eye
108 Other hearing loss Disabling hearing impairment Audiometric International Society of Otolaryngology value� 41 decibels in the better
ear
113 Ischemic heart disease Ischemic heart disease Physician diagnosed
114 Stroke Stroke Physician diagnosed
118 COPD COPD, age� 40 years
Mild FEV1/FVC < 70% and FEV1� 80% predicted
Moderate FEV1/FVC < 70% and FEV1 50−79% predicted
Severe FEV1/FVC < 70% and FEV1 < 50% predicted
119 Asthma Asthma Physician diagnosed, current asthma
122 Peptic ulcer disease Peptic ulcer, gastric or
duodenal
Physician diagnosed, current peptic ulcer
123 Cirrhosis of the liver Cirrhosis of the liver Physician diagnosed
127 Kidney diseases Chronic kidney disease
Moderately increased risk eGFR < 60 mL/min/1.73 m2 or ACR� 3 mg/mmol (�30 mg/g), excluding high risk or
very high risk
(Continued)
Years lived with disability
PLOS ONE | DOI:10.1371/journal.pone.0172001 February 14, 2017 7 / 25
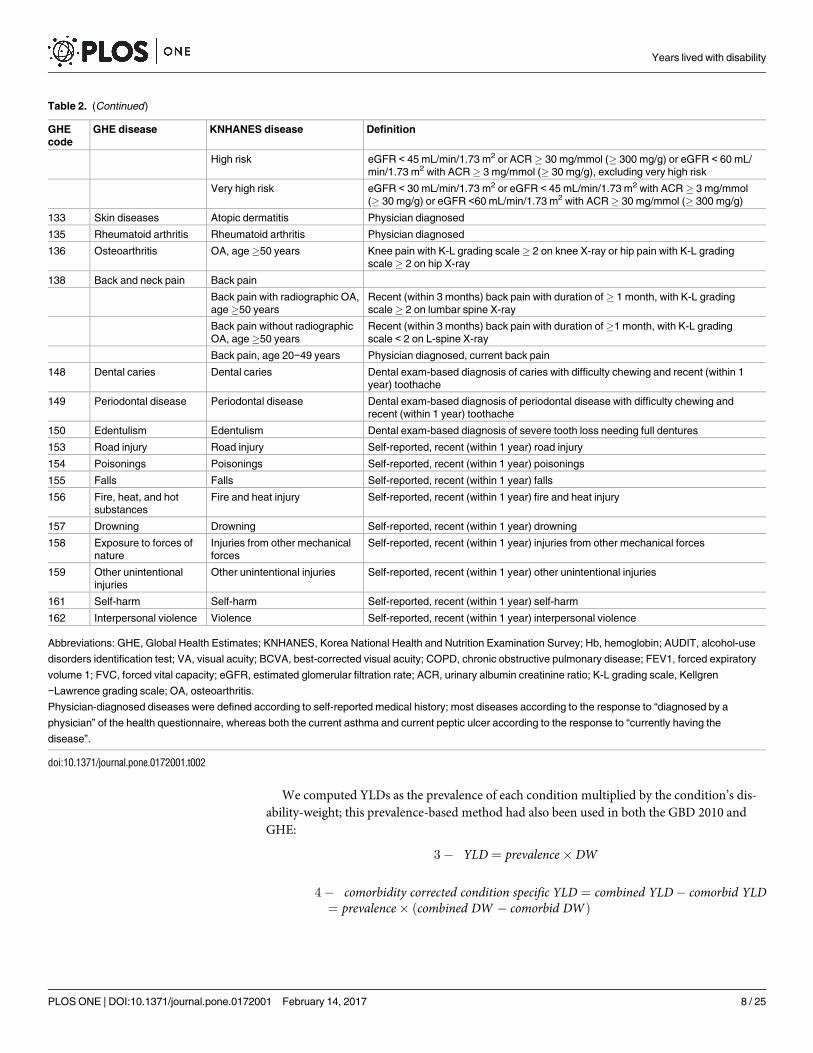
We computed YLDs as the prevalence of each condition multiplied by the condition’s dis-
ability-weight; this prevalence-based method had also been used in both the GBD 2010 and
GHE:
3 � YLD ¼ prevalence� DW
4 � comorbidity corrected condition specific YLD ¼ combined YLD � comorbid YLD¼ prevalence� ðcombined DW � comorbid DWÞ
Table 2. (Continued)
GHE
code
GHE disease KNHANES disease Definition
High risk eGFR < 45 mL/min/1.73 m2 or ACR� 30 mg/mmol (� 300 mg/g) or eGFR < 60 mL/
min/1.73 m2 with ACR� 3 mg/mmol (� 30 mg/g), excluding very high risk
Very high risk eGFR < 30 mL/min/1.73 m2 or eGFR < 45 mL/min/1.73 m2 with ACR� 3 mg/mmol
(� 30 mg/g) or eGFR <60 mL/min/1.73 m2 with ACR� 30 mg/mmol (� 300 mg/g)
133 Skin diseases Atopic dermatitis Physician diagnosed
135 Rheumatoid arthritis Rheumatoid arthritis Physician diagnosed
136 Osteoarthritis OA, age�50 years Knee pain with K-L grading scale� 2 on knee X-ray or hip pain with K-L grading
scale� 2 on hip X-ray
138 Back and neck pain Back pain
Back pain with radiographic OA,
age�50 years
Recent (within 3 months) back pain with duration of� 1 month, with K-L grading
scale� 2 on lumbar spine X-ray
Back pain without radiographic
OA, age�50 years
Recent (within 3 months) back pain with duration of�1 month, with K-L grading
scale < 2 on L-spine X-ray
Back pain, age 20−49 years Physician diagnosed, current back pain
148 Dental caries Dental caries Dental exam-based diagnosis of caries with difficulty chewing and recent (within 1
year) toothache
149 Periodontal disease Periodontal disease Dental exam-based diagnosis of periodontal disease with difficulty chewing and
recent (within 1 year) toothache
150 Edentulism Edentulism Dental exam-based diagnosis of severe tooth loss needing full dentures
153 Road injury Road injury Self-reported, recent (within 1 year) road injury
154 Poisonings Poisonings Self-reported, recent (within 1 year) poisonings
155 Falls Falls Self-reported, recent (within 1 year) falls
156 Fire, heat, and hot
substances
Fire and heat injury Self-reported, recent (within 1 year) fire and heat injury
157 Drowning Drowning Self-reported, recent (within 1 year) drowning
158 Exposure to forces of
nature
Injuries from other mechanical
forces
Self-reported, recent (within 1 year) injuries from other mechanical forces
159 Other unintentional
injuries
Other unintentional injuries Self-reported, recent (within 1 year) other unintentional injuries
161 Self-harm Self-harm Self-reported, recent (within 1 year) self-harm
162 Interpersonal violence Violence Self-reported, recent (within 1 year) interpersonal violence
Abbreviations: GHE, Global Health Estimates; KNHANES, Korea National Health and Nutrition Examination Survey; Hb, hemoglobin; AUDIT, alcohol-use
disorders identification test; VA, visual acuity; BCVA, best-corrected visual acuity; COPD, chronic obstructive pulmonary disease; FEV1, forced expiratory
volume 1; FVC, forced vital capacity; eGFR, estimated glomerular filtration rate; ACR, urinary albumin creatinine ratio; K-L grading scale, Kellgren
−Lawrence grading scale; OA, osteoarthritis.
Physician-diagnosed diseases were defined according to self-reported medical history; most diseases according to the response to “diagnosed by a
physician” of the health questionnaire, whereas both the current asthma and current peptic ulcer according to the response to “currently having the
disease”.
doi:10.1371/journal.pone.0172001.t002
Years lived with disability
PLOS ONE | DOI:10.1371/journal.pone.0172001 February 14, 2017 8 / 25

The value of “combined DW – comorbid DW” was replaced with the “adjusted mean differ-
ence of the EQ-5D index” between the condition and reference groups in our study. The same
value had been calculated from “condition specific DW × (1 – comorbid DW)” in the GBD 2010
and GHE [2,3].
All-cause YLDs were estimated as the number of the population multiplied by the mean
score of the combined disability-weight (= “1 – mean score of EQ5D index”).
We used the Korean population count released by Statistics Korea for 2012 in computing
YLDs. Our YLDs were then compared with those of the WHO GHE 2014, the WHO’s most
recent update of the GHE for 2012.
Results
Subject characteristics and EQ-5D index
The unweighted/weighted mean age of the study population was 50.4/45.6 years, and 57.8%/
50.7% were female. The mean score of unweighted EQ-5D index of the study sample was
0.930, and the mean score of weighted EQ-5D index for the Korean population was 0.945. The
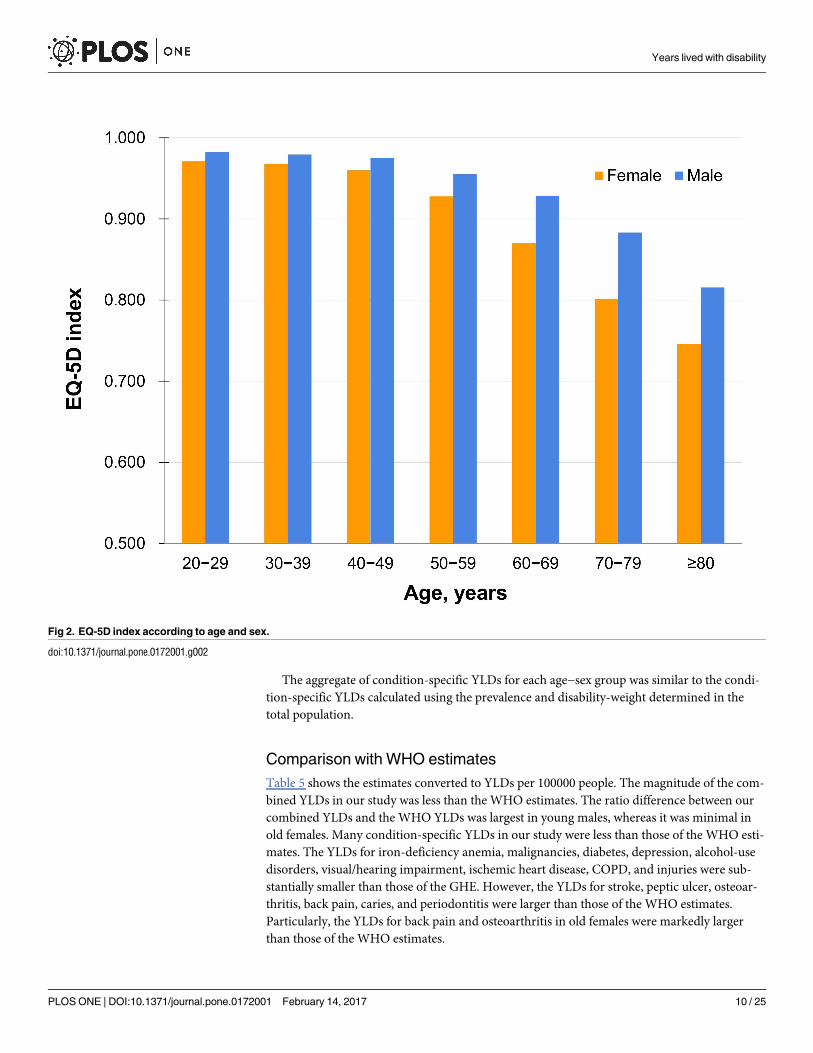
mean score of the EQ-5D index decreased with age, and the age-related decrease in EQ-5D
was more marked in females (Fig 2).
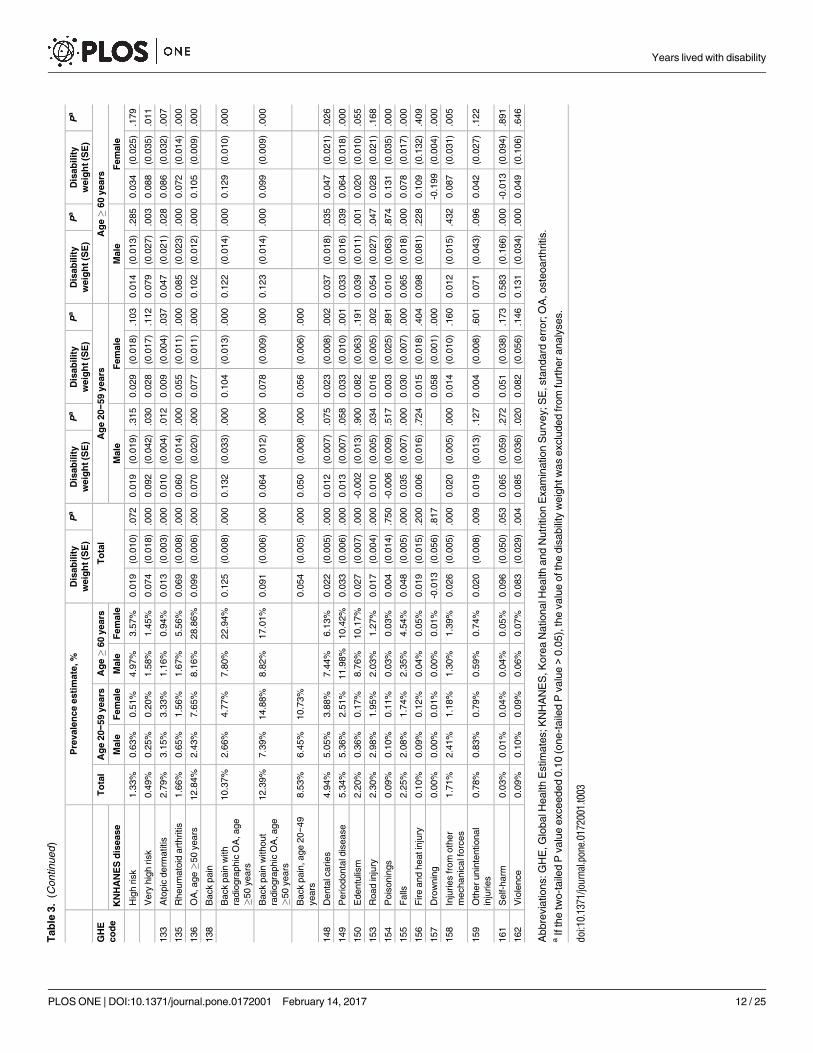
Prevalence and modified disability-weight
Table 3 shows the prevalence rates and the modified condition-specific disability-weights for
noncommunicable diseases and injuries. Diabetes, alcohol-use disorders, hearing impairment,
chronic obstructive pulmonary disease (COPD), chronic kidney disease (CKD), osteoarthritis,
back pain, and periodontitis were common conditions, with a prevalence� 5%. Iron-defi-
ciency anemia was most prevalent in young females. Depression was more prevalent in females
than in males. Alcohol-use disorders, road injury, other mechanical injuries, other uninten-
tional injuries, and violence were most prevalent in young males. The prevalence rates of dia-
betes, visual/hearing impairment, ischemic heart disease, stroke, COPD, CKD, osteoarthritis,
back pain, periodontitis, and edentulism were markedly higher in old than in young people.
Osteoarthritis and back pain were very common in old females. Dental caries was common in
all of the age−sex groups.
The modified disability-weights for visual impairments, stroke, osteoarthritis, back pain,
and self-harm were distinctly larger than those for other conditions. When the disability-
weight for each condition was compared between the age−sex groups, stroke, asthma, atopic
dermatitis, rheumatoid arthritis, osteoarthritis, back pain, caries, periodontitis, falls, and other
mechanical injuries had larger disability-weights in old than in young people. The disability-
weights for iron-deficiency anemia and lung cancers were significant only in males. Diabetes
had a relatively small disability-weight in young males, as compared to other age−sex groups.
All-cause and condition-specific YLD
All-cause YLDs in 39044 thousand adults aged�20 years were 2165 thousand years. The com-
bined YLDs (the sum of each condition-specific YLD) from noncommunicable diseases and
injuries were similar to all-cause YLDs in old males, whereas those in young females accounted
for about 50% of all-cause YLDs (Table 4).
YLDs due to back pain and osteoarthritis were about 487745 and 199650, respectively, and
were largest among all the condition-specific YLDs, particularly in old females. Additionally,
depression, diabetes, stroke, and periodontitis had YLDs> 50000 years.
Years lived with disability
PLOS ONE | DOI:10.1371/journal.pone.0172001 February 14, 2017 9 / 25
The aggregate of condition-specific YLDs for each age−sex group was similar to the condi-
tion-specific YLDs calculated using the prevalence and disability-weight determined in the
total population.
Comparison with WHO estimates
Table 5 shows the estimates converted to YLDs per 100000 people. The magnitude of the com-
bined YLDs in our study was less than the WHO estimates. The ratio difference between our
combined YLDs and the WHO YLDs was largest in young males, whereas it was minimal in
old females. Many condition-specific YLDs in our study were less than those of the WHO esti-
mates. The YLDs for iron-deficiency anemia, malignancies, diabetes, depression, alcohol-use
disorders, visual/hearing impairment, ischemic heart disease, COPD, and injuries were sub-
stantially smaller than those of the GHE. However, the YLDs for stroke, peptic ulcer, osteoar-
thritis, back pain, caries, and periodontitis were larger than those of the WHO estimates.
Particularly, the YLDs for back pain and osteoarthritis in old females were markedly larger
than those of the WHO estimates.
Fig 2. EQ-5D index according to age and sex.
doi:10.1371/journal.pone.0172001.g002
Years lived with disability
PLOS ONE | DOI:10.1371/journal.pone.0172001 February 14, 2017 10 / 25

Tab
le3.
Th
ep
revale
nce
rate
san
dth
em
od
ifie
dd
isab
ilit
yw
eig
hts
for
no
nco
mm
un
icab
led
iseases
an
din
juri
es.
Pre
vale
nce
esti
mate
,%
Dis
ab
ilit
y
weig
ht
(SE
)
Pa
Dis
ab
ilit
y
weig
ht
(SE
)
Pa
Dis
ab
ilit
y
weig
ht
(SE
)
Pa
Dis
ab
ilit
y
weig
ht
(SE
)
Pa
Dis
ab
ilit
y
weig
ht
(SE
)
Pa
GH
E
co
de
To
tal
Ag
e20−5
9years
Ag
e�
60
years
To
tal
Ag
e20−5
9years
Ag
e�
60
years
KN
HA
NE
Sd
isease
Male
Fem
ale
Male
Fem
ale
Male
Fem
ale
Male
Fem
ale
0A
llC
auses
0.0
55
(0.0
01)
0.0
26
(0.0
01)
0.0
43
(0.0
01)
0.0
95
(0.0
02)
0.1
71
(0.0
03)
58
Iron-d
eficie
ncy
anem
ia
Mild
2.1
8%
0.2
0%
4.8
1%
0.9
8%
1.1
8%
-0.0
09
(0.0
03)
.003
0.0
14
(0.0
16)
.402
-0.0
05
(0.0
03)
.060
-0.0
14
(0.0
21)
.506
0.0
11
(0.0
26)
.684
Modera
te2.4
4%
0.1
9%
4.9
0%
1.1
3%
3.2
5%
0.0
08
(0.0
05)
.146
0.0
42
(0.0
20)
.032
0.0
05
(0.0
05)
.374
0.1
03
(0.0
41)
.012
0.0
14
(0.0
15)
.362
Severe
0.1
9%
0.0
3%
0.3
6%
0.1
2%
0.2
1%
0.0
15
(0.0
14)
.296
-0.0
07
(0.0
21)
.740
0.0
07
(0.0
16)
.658
0.1
15
(0.0
66)
.083
0.0
66
(0.0
48)
.173
64
Sto
mach
cancer
0.5
4%
0.2
4%
0.2
1%
2.5
5%
1.1
6%
-0.0
01
(0.0
09)
.908
-0.0
13
(0.0
10)
.207
0.0
13
(0.0
20)
.523
0.0
09
(0.0
15)
.559
0.0
05
(0.0
21)
.793
65
Colo
ncancers
0.3
0%
0.1
8%
0.0
6%
1.4
9%
0.6
6%
0.0
11
(0.0
14)
.430
-0.0
09
(0.0
12)
.449
-0.0
11
(0.0
28)
.701
0.0
45
(0.0
26)
.087
0.0
03
(0.0
30)
.915
66
Liv
er
cancer
0.1
0%
0.1
1%
0.0
2%
0.4
2%
0.0
7%
0.0
08
(0.0
22)
.720
-0.0
24
(0.0
09)
.005
0.1
50
(0.0
39)
.000
0.0
25
(0.0
49)
.610
0.0
19
(0.0
27)
.467
68
Lung
cancers
0.0
7%
0.0
3%
0.0
2%
0.4
3%
0.0
8%
0.0
41
(0.0
35)
.249
0.0
61
(0.0
24)
.013
-0.0
31
(0.0
36)
.391
0.0
98
(0.0
59)
.099
-0.0
84
(0.0
28)
.003
70
Bre
astcancer
0.3
5%
0.0
0%
0.5
8%
0.0
0%
1.0
9%
0.0
35
(0.0
15)
.022
0.0
31
(0.0
15)
.039
0.0
28
(0.0
33)
.388
71
Cerv
ixcancer
0.3
7%
0.0
0%
0.4
9%
0.0
0%
1.5
5%
-0.0
04
(0.0
09)
.640
0.0
05
(0.0
09)
.605
-0.0
28
(0.0
15)
.071
78
Oth
er
malig
nancy
1.1
1%
0.4
3%
1.2
3%
2.6
5%
1.8
9%
0.0
02
(0.0
06)
.689
-0.0
04
(0.0
09)
.693
0.0
04
(0.0
07)
.557
0.0
10
(0.0
15)
.507
0.0
10
(0.0
19)
.604
80
Dia
bete
sm
elli
tus
8.7
1%
7.0
9%
4.1
1%
23.0
0%
20.7
3%
0.0
20
(0.0
03)
.000
0.0
15
(0.0
04)
.000
0.0
21
(0.0
06)
.000
0.0
26
(0.0
06)
.000
0.0
21
(0.0
07)
.002
83
Depre
ssio
n3.6
9%
1.7
1%
5.0
1%
2.4
9%
7.0
7%
0.0
72
(0.0
05)
.000
0.1
00
(0.0
15)
.000
0.0
65
(0.0
05)
.000
0.0
75
(0.0
16)
.000
0.0
60
(0.0
09)
.000
86
Alc
oholuse
dis
ord
ers
Harm
fuldrinkin
g
behavio
r
6.8
1%
12.1
1%
2.1
2%
6.6
9%
0.2
6%
0.0
04
(0.0
02)
.094
0.0
02
(0.0
02)
.369
0.0
15
(0.0
07)
.034
-0.0
11
(0.0
09)
.262
-0.0
09
(0.0
50)
.854
Alc
oholdependence
6.9
1%
11.9
5%
2.4
0%
7.2
2%
0.4
3%
0.0
17
(0.0
03)
.000
0.0
13
(0.0
03)
.000
0.0
33
(0.0
10)
.001
0.0
16
(0.0
10)
.099
0.0
56
(0.0
39)
.150
103
Gla
ucom
aw
ith
vis
ual
impairm
ent
0.2
1%
0.1
1%
0.0
6%
0.5
5%
0.7
9%
0.0
28
(0.0
30)
.338
0.0
40
(0.0
22)
.074
0.0
10
(0.0
23)
.672
0.0
61
(0.0
46)
.192
0.0
07
(0.0
65)
.915
104
Cata
racts
with
vis
ual
impairm
ent
1.2
8%
0.3
1%
0.2
2%
4.2
6%
6.2
1%
0.0
59
(0.0
12)
.000
0.0
51
(0.0
16)
.001
0.0
50
(0.0
23)
.028
0.0
93
(0.0
23)
.000
0.0
39
(0.0
17)
.026
105
Uncorr
ecte
dre
fractive
err
ors
3.8
5%
2.4
7%
4.2
6%
4.1
0%
7.2
7%
0.0
11
(0.0
05)
.015
0.0
22
(0.0
07)
.003
0.0
09
(0.0
06)
.097
-0.0
19
(0.0
15)
.201
0.0
14
(0.0
14)
.312
106
Macula
rdegenera
tion
with
vis
ualim
pairm
ent
0.1
7%
0.0
3%
0.0
1%
0.8
8%
0.8
6%
0.0
79
(0.0
38)
.039
-0.0
43
(0.0
03)
.000
0.0
15
(0.0
02)
.000
0.1
00
(0.0
67)
.137
0.0
87
(0.0
45)
.053
107
Dia
betic
retinopath
y
with
vis
ualim
pairm
ent
0.0
7%
0.0
1%
0.0
3%
0.2
3%
0.3
7%
0.0
71
(0.0
32)
.027
0.0
86
(0.0
02)
.000
-0.0
21
(0.0
38)
.587
0.1
24
(0.0
74)
.093
0.0
60
(0.0
38)
.111
108
Dis
ablin
ghearing
impairm
ent
6.9
2%
3.3
6%
2.6
8%
21.4
2%
18.6
9%
0.0
14
(0.0
05)
.002
0.0
08
(0.0
07)
.246
0.0
01
(0.0
06)
.875
0.0
32
(0.0
08)
.000
0.0
18
(0.0
11)
.097
113
Ischem
icheart
dis
ease
1.8
0%
0.8
7%
0.5
8%
6.7
1%
5.4
3%
0.0
52
(0.0
07)
.000
0.0
57
(0.0
18)
.000
0.0
41
(0.0
11)
.000
0.0
40
(0.0
11)
.001
0.0
68
(0.0
13)
.000
114
Str
oke
1.5
4%
0.6
8%
0.4
2%
6.3
1%
4.6
9%
0.1
02
(0.0
09)
.000
0.1
14
(0.0
22)
.000
0.0
75
(0.0
23)
.001
0.1
17
(0.0
13)
.000
0.0
96
(0.0
16)
.000
118
CO
PD
,age�
40
years
Mild
6.2
3%
4.3
8%
1.1
1%
20.5
6%
7.3
1%
-0.0
03
(0.0
05)
.502
0.0
07
(0.0
07)
.336
-0.0
04
(0.0
11)
.686
0.0
00
(0.0
07)
.976
0.0
13
(0.0
13)
.328
Modera
te6.5
5%
5.5
9%
1.7
5%
19.9
3%
6.2
3%
0.0
03
(0.0
04)
.455
0.0
11
(0.0
07)
.124
0.0
26
(0.0
10)
.010
0.0
09
(0.0
06)
.151
0.0
03
(0.0
15)
.863
Severe
0.6
8%
0.5
0%
0.2
1%
2.4
8%
0.4
7%
0.0
30
(0.0
15)
.043
0.0
62
(0.0
29)
.033
0.0
92
(0.0
72)
.202
0.0
34
(0.0
17)
.042
0.0
02
(0.0
41)
.969
119
Asth
ma
1.5
7%
0.9
4%
1.1
0%
2.8
8%
4.3
7%
0.0
61
(0.0
07)
.000
0.0
37
(0.0
13)
.004
0.0
44
(0.0
13)
.001
0.0
76
(0.0
16)
.000
0.0
83
(0.0
16)
.000
122
Peptic
ulc
er,
gastr
icor
duodenal
1.0
5%
0.8
2%
0.8
1%
1.7
3%
2.3
1%
0.0
77
(0.0
13)
.000
0.0
61
(0.0
23)
.007
0.0
56
(0.0
19)
.003
0.0
73
(0.0
43)
.092
0.1
19
(0.0
30)
.000
123
Cirrh
osis
ofth
eliv
er
0.2
3%
0.2
2%
0.1
0%
0.6
8%
0.3
3%
0.0
12
(0.0
11)
.278
0.0
09
(0.0
17)
.618
0.0
21
(0.0
28)
.464
0.0
33
(0.0
24)
.162
-0.0
03
(0.0
22)
.890
127
Chro
nic
kid
ney
dis
ease
Modera
tely
incre
ased
risk
7.2
0%
4.0
8%
4.7
2%
17.2
3%
18.4
6%
0.0
10
(0.0
04)
.011
0.0
10
(0.0
07)
.132
0.0
02
(0.0
05)
.758
0.0
30
(0.0
10)
.002
0.0
05
(0.0
09)
.582
(Continued
)
Years lived with disability
PLOS ONE | DOI:10.1371/journal.pone.0172001 February 14, 2017 11 / 25
Tab
le3.
(Continued
)
Pre
vale
nce
esti
mate
,%
Dis
ab
ilit
y
weig
ht
(SE
)
Pa
Dis
ab
ilit
y
weig
ht
(SE
)
Pa
Dis
ab
ilit
y
weig
ht
(SE
)
Pa
Dis
ab
ilit
y
weig
ht
(SE
)
Pa
Dis
ab
ilit
y
weig
ht
(SE
)
Pa
GH
E
co
de
To
tal
Ag
e20−5
9years
Ag
e�
60
years
To
tal
Ag
e20−5
9years
Ag
e�
60
years
KN
HA
NE
Sd
isease
Male
Fem
ale
Male
Fem
ale
Male
Fem
ale
Male
Fem
ale
Hig
hrisk
1.3
3%
0.6
3%
0.5
1%
4.9
7%
3.5
7%
0.0
19
(0.0
10)
.072
0.0
19
(0.0
19)
.315
0.0
29
(0.0
18)
.103
0.0
14
(0.0
13)
.285
0.0
34
(0.0
25)
.179
Very
hig
hrisk
0.4
9%
0.2
5%
0.2
0%
1.5
8%
1.4
5%
0.0
74
(0.0
18)
.000
0.0
92
(0.0
42)
.030
0.0
28
(0.0
17)
.112
0.0
79
(0.0
27)
.003
0.0
88
(0.0
35)
.011
133
Ato
pic
derm
atitis
2.7
9%
3.1
5%
3.3
3%
1.1
6%
0.9
4%
0.0
13
(0.0
03)
.000
0.0
10
(0.0
04)
.012
0.0
09
(0.0
04)
.037
0.0
47
(0.0
21)
.028
0.0
86
(0.0
32)
.007
135
Rheum
ato
idart
hritis
1.6
6%
0.6
5%
1.5
6%
1.6
7%
5.5
6%
0.0
69
(0.0
08)
.000
0.0
60
(0.0
14)
.000
0.0
55
(0.0
11)
.000
0.0
85
(0.0
23)
.000
0.0
72
(0.0
14)
.000
136
OA
,age�
50
years
12.8
4%
2.4
3%
7.6
5%
8.1
6%
28.8
6%
0.0
99
(0.0
06)
.000
0.0
70
(0.0
20)
.000
0.0
77
(0.0
11)
.000
0.1
02
(0.0
12)
.000
0.1
05
(0.0
09)
.000
138
Back
pain
Back
pain
with
radio
gra
phic
OA
,age
�50
years
10.3
7%
2.6
6%
4.7
7%
7.8
0%
22.9
4%
0.1
25
(0.0
08)
.000
0.1
32
(0.0
33)
.000
0.1
04
(0.0
13)
.000
0.1
22
(0.0
14)
.000
0.1
29
(0.0
10)
.000
Back
pain
without
radio
gra
phic
OA
,age
�50
years
12.3
9%
7.3
9%
14.8
8%
8.8
2%
17.0
1%
0.0
91
(0.0
06)
.000
0.0
64
(0.0
12)
.000
0.0
78
(0.0
09)
.000
0.1
23
(0.0
14)
.000
0.0
99
(0.0
09)
.000
Back
pain
,age
20−4
9
years
8.5
3%
6.4
5%
10.7
3%
0.0
54
(0.0
05)
.000
0.0
50
(0.0
08)
.000
0.0
56
(0.0
06)
.000
148
Denta
lcaries
4.9
4%
5.0
5%
3.8
8%
7.4
4%
6.1
3%
0.0
22
(0.0
05)
.000
0.0
12
(0.0
07)
.075
0.0
23
(0.0
08)
.002
0.0
37
(0.0
18)
.035
0.0
47
(0.0
21)
.026
149
Periodonta
ldis
ease
5.3
4%
5.3
6%
2.5
1%
11.9
8%
10.4
2%
0.0
33
(0.0
06)
.000
0.0
13
(0.0
07)
.058
0.0
33
(0.0
10)
.001
0.0
33
(0.0
16)
.039
0.0
64
(0.0
18)
.000
150
Edentu
lism
2.2
0%
0.3
6%
0.1
7%
8.7
6%
10.1
7%
0.0
27
(0.0
07)
.000
-0.0
02
(0.0
13)
.900
0.0
82
(0.0
63)
.191
0.0
39
(0.0
11)
.001
0.0
20
(0.0
10)
.055
153
Road
inju
ry2.3
0%
2.9
8%
1.9
5%
2.0
3%
1.2
7%
0.0
17
(0.0
04)
.000
0.0
10
(0.0
05)
.034
0.0
16
(0.0
05)
.002
0.0
54
(0.0
27)
.047
0.0
28
(0.0
21)
.168
154
Pois
onin
gs
0.0
9%
0.1
0%
0.1
1%
0.0
3%
0.0
3%
0.0
04
(0.0
14)
.750
-0.0
06
(0.0
09)
.517
0.0
03
(0.0
25)
.891
0.0
10
(0.0
63)
.874
0.1
31
(0.0
35)
.000
155
Falls
2.2
5%
2.0
8%
1.7
4%
2.3
5%
4.5
4%
0.0
48
(0.0
05)
.000
0.0
35
(0.0
07)
.000
0.0
30
(0.0
07)
.000
0.0
65
(0.0
18)
.000
0.0
78
(0.0
17)
.000
156
Fire
and
heatin
jury
0.1
0%
0.0
9%
0.1
2%
0.0
4%
0.0
5%
0.0
19
(0.0
15)
.200
0.0
06
(0.0
16)
.724
0.0
15
(0.0
18)
.404
0.0
98
(0.0
81)
.228
0.1
09
(0.1
32)
.409
157
Dro
wnin
g0.0
0%
0.0
0%
0.0
1%
0.0
0%
0.0
1%
-0.0
13
(0.0
56)
.817
0.0
58
(0.0
01)
.000
-0.1
99
(0.0
04)
.000
158
Inju
ries
from
oth
er
mechanic
alfo
rces
1.7
1%
2.4
1%
1.1
8%
1.3
0%
1.3
9%
0.0
26
(0.0
05)
.000
0.0
20
(0.0
05)
.000
0.0
14
(0.0
10)
.160
0.0
12
(0.0
15)
.432
0.0
87
(0.0
31)
.005
159
Oth
er
unin
tentional
inju
ries
0.7
8%
0.8
3%
0.7
9%
0.5
9%
0.7
4%
0.0
20
(0.0
08)
.009
0.0
19
(0.0
13)
.127
0.0
04
(0.0
08)
.601
0.0
71
(0.0
43)
.096
0.0
42
(0.0
27)
.122
161
Self-h
arm
0.0
3%
0.0
1%
0.0
4%
0.0
4%
0.0
5%
0.0
96
(0.0
50)
.053
0.0
65
(0.0
59)
.272
0.0
51
(0.0
38)
.173
0.5
83
(0.1
66)
.000
-0.0
13
(0.0
94)
.891
162
Vio
lence
0.0
9%
0.1
0%
0.0
9%
0.0
6%
0.0
7%
0.0
83
(0.0
29)
.004
0.0
85
(0.0
36)
.020
0.0
82
(0.0
56)
.146
0.1
31
(0.0
34)
.000
0.0
49
(0.1
06)
.646
Abbre
via
tions:G
HE
,G
lobalH
ealth
Estim
ate
s;K
NH
AN
ES
,K
ore
aN
ationalH
ealth
and
Nutr
itio
nE
xam
ination
Surv
ey;S
E,sta
ndard
err
or;
OA
,oste
oart
hritis.
aIf
the
two-t
aile
dP
valu
eexceeded
0.1
0(o
ne-t
aile
dP
valu
e>
0.0
5),
the
valu
eofth
edis
abili
tyw
eig
htw
as
exclu
ded
from
furt
heranaly
ses.
doi:10.1
371/jo
urn
al.p
one.
0172001.t003
Years lived with disability
PLOS ONE | DOI:10.1371/journal.pone.0172001 February 14, 2017 12 / 25
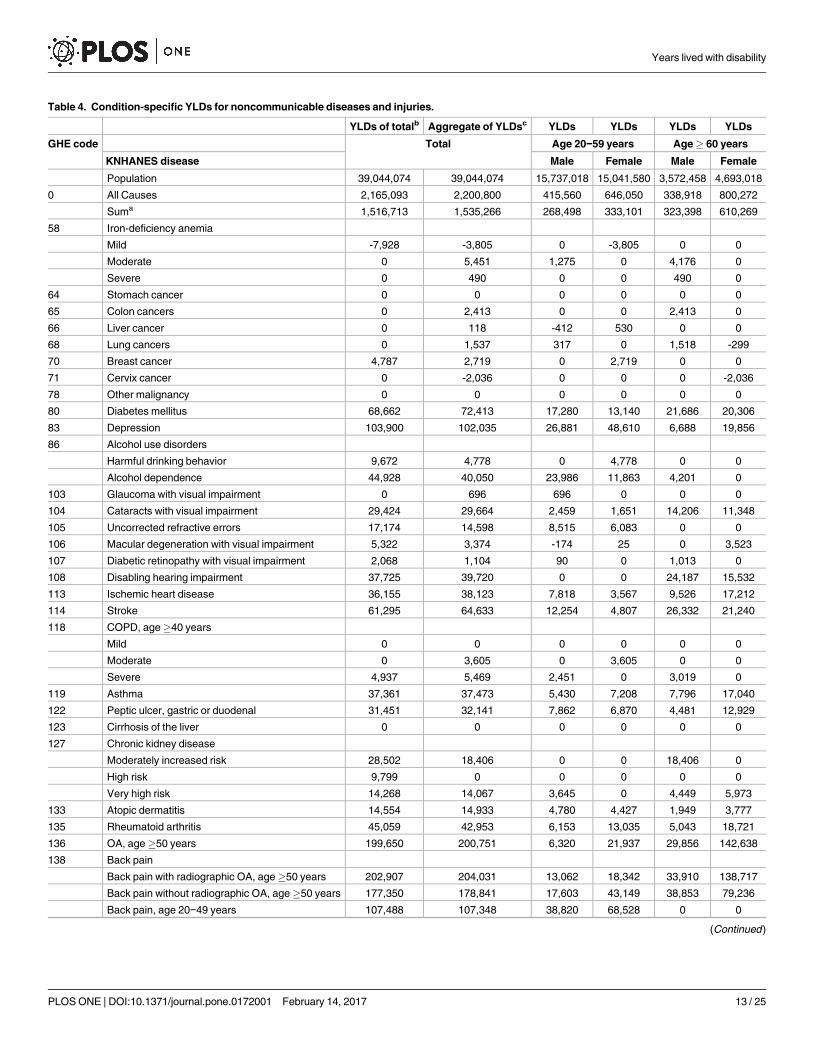
Table 4. Condition-specific YLDs for noncommunicable diseases and injuries.
YLDs of totalb Aggregate of YLDsc YLDs YLDs YLDs YLDs
GHE code Total Age 20−59 years Age� 60 years
KNHANES disease Male Female Male Female
Population 39,044,074 39,044,074 15,737,018 15,041,580 3,572,458 4,693,018
0 All Causes 2,165,093 2,200,800 415,560 646,050 338,918 800,272
Suma 1,516,713 1,535,266 268,498 333,101 323,398 610,269
58 Iron-deficiency anemia
Mild -7,928 -3,805 0 -3,805 0 0
Moderate 0 5,451 1,275 0 4,176 0
Severe 0 490 0 0 490 0
64 Stomach cancer 0 0 0 0 0 0
65 Colon cancers 0 2,413 0 0 2,413 0
66 Liver cancer 0 118 -412 530 0 0
68 Lung cancers 0 1,537 317 0 1,518 -299
70 Breast cancer 4,787 2,719 0 2,719 0 0
71 Cervix cancer 0 -2,036 0 0 0 -2,036
78 Other malignancy 0 0 0 0 0 0
80 Diabetes mellitus 68,662 72,413 17,280 13,140 21,686 20,306
83 Depression 103,900 102,035 26,881 48,610 6,688 19,856
86 Alcohol use disorders
Harmful drinking behavior 9,672 4,778 0 4,778 0 0
Alcohol dependence 44,928 40,050 23,986 11,863 4,201 0
103 Glaucoma with visual impairment 0 696 696 0 0 0
104 Cataracts with visual impairment 29,424 29,664 2,459 1,651 14,206 11,348
105 Uncorrected refractive errors 17,174 14,598 8,515 6,083 0 0
106 Macular degeneration with visual impairment 5,322 3,374 -174 25 0 3,523
107 Diabetic retinopathy with visual impairment 2,068 1,104 90 0 1,013 0
108 Disabling hearing impairment 37,725 39,720 0 0 24,187 15,532
113 Ischemic heart disease 36,155 38,123 7,818 3,567 9,526 17,212
114 Stroke 61,295 64,633 12,254 4,807 26,332 21,240
118 COPD, age�40 years
Mild 0 0 0 0 0 0
Moderate 0 3,605 0 3,605 0 0
Severe 4,937 5,469 2,451 0 3,019 0
119 Asthma 37,361 37,473 5,430 7,208 7,796 17,040
122 Peptic ulcer, gastric or duodenal 31,451 32,141 7,862 6,870 4,481 12,929
123 Cirrhosis of the liver 0 0 0 0 0 0
127 Chronic kidney disease
Moderately increased risk 28,502 18,406 0 0 18,406 0
High risk 9,799 0 0 0 0 0
Very high risk 14,268 14,067 3,645 0 4,449 5,973
133 Atopic dermatitis 14,554 14,933 4,780 4,427 1,949 3,777
135 Rheumatoid arthritis 45,059 42,953 6,153 13,035 5,043 18,721
136 OA, age�50 years 199,650 200,751 6,320 21,937 29,856 142,638
138 Back pain
Back pain with radiographic OA, age�50 years 202,907 204,031 13,062 18,342 33,910 138,717
Back pain without radiographic OA, age�50 years 177,350 178,841 17,603 43,149 38,853 79,236
Back pain, age 20−49 years 107,488 107,348 38,820 68,528 0 0
(Continued)
Years lived with disability
PLOS ONE | DOI:10.1371/journal.pone.0172001 February 14, 2017 13 / 25
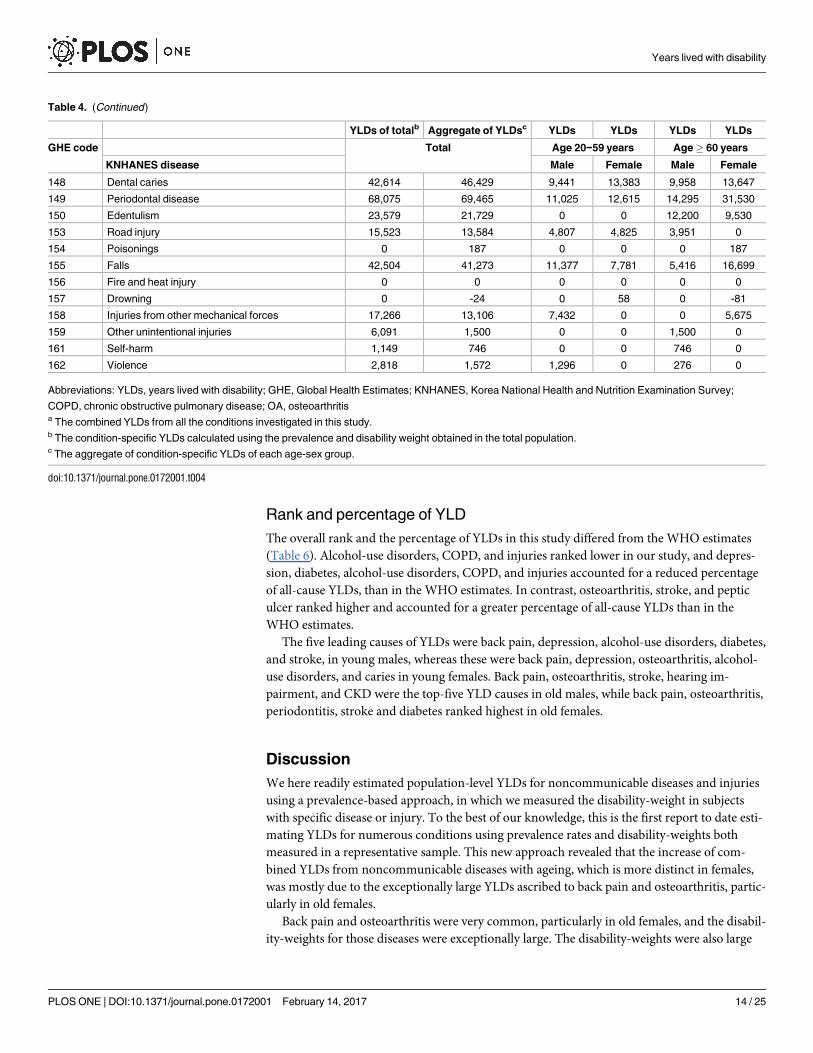
Rank and percentage of YLD
The overall rank and the percentage of YLDs in this study differed from the WHO estimates
(Table 6). Alcohol-use disorders, COPD, and injuries ranked lower in our study, and depres-
sion, diabetes, alcohol-use disorders, COPD, and injuries accounted for a reduced percentage
of all-cause YLDs, than in the WHO estimates. In contrast, osteoarthritis, stroke, and peptic
ulcer ranked higher and accounted for a greater percentage of all-cause YLDs than in the
WHO estimates.
The five leading causes of YLDs were back pain, depression, alcohol-use disorders, diabetes,
and stroke, in young males, whereas these were back pain, depression, osteoarthritis, alcohol-
use disorders, and caries in young females. Back pain, osteoarthritis, stroke, hearing im-
pairment, and CKD were the top-five YLD causes in old males, while back pain, osteoarthritis,
periodontitis, stroke and diabetes ranked highest in old females.
Discussion
We here readily estimated population-level YLDs for noncommunicable diseases and injuries
using a prevalence-based approach, in which we measured the disability-weight in subjects
with specific disease or injury. To the best of our knowledge, this is the first report to date esti-
mating YLDs for numerous conditions using prevalence rates and disability-weights both
measured in a representative sample. This new approach revealed that the increase of com-
bined YLDs from noncommunicable diseases with ageing, which is more distinct in females,
was mostly due to the exceptionally large YLDs ascribed to back pain and osteoarthritis, partic-
ularly in old females.
Back pain and osteoarthritis were very common, particularly in old females, and the disabil-
ity-weights for those diseases were exceptionally large. The disability-weights were also large
Table 4. (Continued)
YLDs of totalb Aggregate of YLDsc YLDs YLDs YLDs YLDs
GHE code Total Age 20−59 years Age� 60 years
KNHANES disease Male Female Male Female
148 Dental caries 42,614 46,429 9,441 13,383 9,958 13,647
149 Periodontal disease 68,075 69,465 11,025 12,615 14,295 31,530
150 Edentulism 23,579 21,729 0 0 12,200 9,530
153 Road injury 15,523 13,584 4,807 4,825 3,951 0
154 Poisonings 0 187 0 0 0 187
155 Falls 42,504 41,273 11,377 7,781 5,416 16,699
156 Fire and heat injury 0 0 0 0 0 0
157 Drowning 0 -24 0 58 0 -81
158 Injuries from other mechanical forces 17,266 13,106 7,432 0 0 5,675
159 Other unintentional injuries 6,091 1,500 0 0 1,500 0
161 Self-harm 1,149 746 0 0 746 0
162 Violence 2,818 1,572 1,296 0 276 0
Abbreviations: YLDs, years lived with disability; GHE, Global Health Estimates; KNHANES, Korea National Health and Nutrition Examination Survey;
COPD, chronic obstructive pulmonary disease; OA, osteoarthritisa The combined YLDs from all the conditions investigated in this study.b The condition-specific YLDs calculated using the prevalence and disability weight obtained in the total population.c The aggregate of condition-specific YLDs of each age-sex group.
doi:10.1371/journal.pone.0172001.t004
Years lived with disability
PLOS ONE | DOI:10.1371/journal.pone.0172001 February 14, 2017 14 / 25
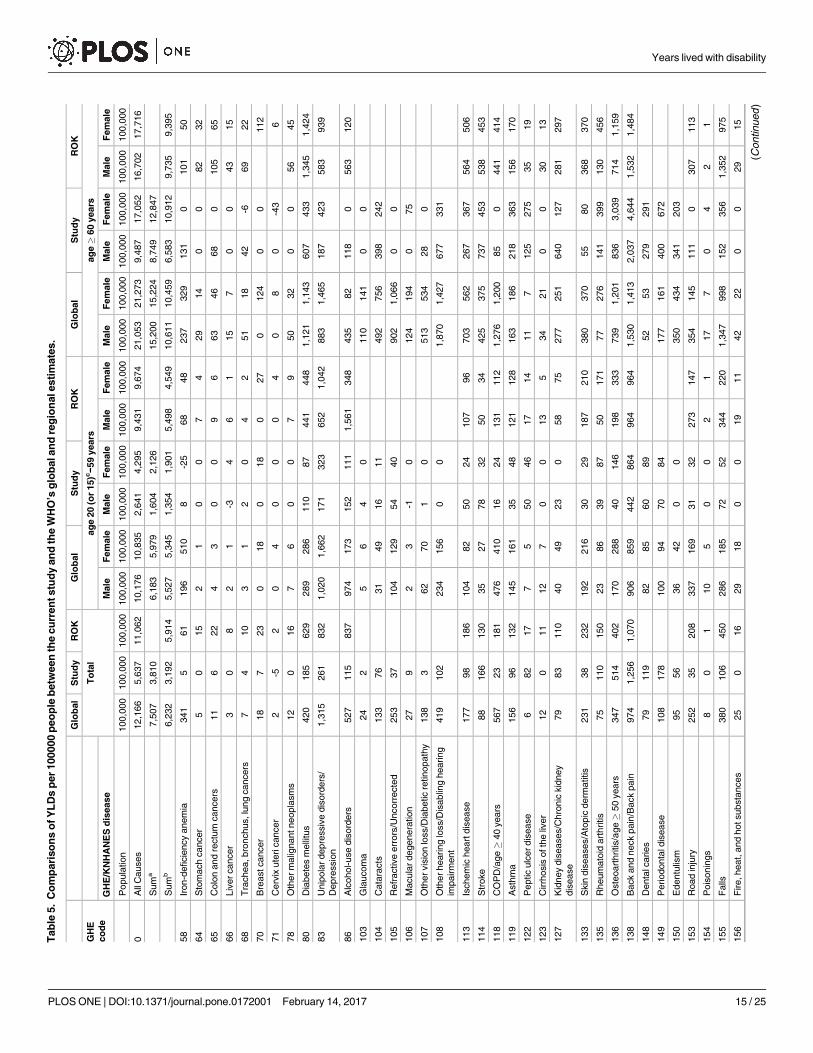
Tab
le5.
Co
mp
ari
so
ns
ofY
LD
sp
er
100000
peo
ple
betw
een
the
cu
rren
tstu
dy
an
dth
eW
HO
’sg
lob
alan
dre
gio
nalesti
mate
s.
Glo
bal
Stu
dy
RO
KG
lob
al
Stu
dy
RO
KG
lob
al
Stu
dy
RO
K
GH
E
co
de
To
tal
ag
e20
(or
15)c−5
9years
ag
e�
60
years
GH
E/K
NH
AN
ES
dis
ease
Male
Fem
ale
Male
Fem
ale
Male
Fem
ale
Male
Fem
ale
Male
Fem
ale
Male
Fem
ale
Popula
tion
100,0
00
100,0
00
100,0
00
100,0
00
100,0
00
100,0
00
100,0
00
100,0
00
100,0
00
100,0
00
100,0
00
100,0
00
100,0
00
100,0
00
100,0
00
0A
llC
auses
12,1
66
5,6
37
11,0
62
10,1
76
10,8
35
2,6
41
4,2
95
9,4
31
9,6
74
21,0
53
21,2
73
9,4
87
17,0
52
16,7
02
17,7
16
Sum
a7,5
07
3,8
10
6,1
83
5,9
79
1,6
04
2,1
26
15,2
00
15,2
24
8,7
49
12,8
47
Sum
b6,2
32
3,1
92
5,9
14
5,5
27
5,3
45
1,3
54
1,9
01
5,4
98
4,5
49
10,6
11
10,4
59
6,5
83
10,9
12
9,7
35
9,3
95
58
Iron-d
eficie
ncy
anem
ia341
561
196
510
8-2
568
48
237
329
131
0101
50
64
Sto
mach
cancer
50
15
21
00
74
29
14
00
82
32
65
Colo
nand
rectu
mcancers
11
622
43
00
96
63
46
68
0105
65
66
Liv
er
cancer
30
82
1-3
46
115
70
043
15
68
Tra
chea,bro
nchus,lu
ng
cancers
74
10
31
20
42
51
18
42
-669
22
70
Bre
astcancer
18
723
018
018
027
0124
00
112
71
Cerv
ixute
ricancer
2-5
20
40
00
40
80
-43
6
78
Oth
er
malig
nantneopla
sm
s12
016
76
00
79
50
32
00
56
45
80
Dia
bete
sm
elli
tus
420
185
629
289
286
110
87
441
448
1,1
21
1,1
43
607
433
1,3
45
1,4
24
83
Unip
ola
rdepre
ssiv
edis
ord
ers
/
Depre
ssio
n
1,3
15
261
832
1,0
20
1,6
62
171
323
652
1,0
42
883
1,4
65
187
423
583
939
86
Alc
ohol-use
dis
ord
ers
527
115
837
974
173
152
111
1,5
61
348
435
82
118
0563
120
103
Gla
ucom
a24
25
64
0110
141
00
104
Cata
racts
133
76
31
49
16
11
492
756
398
242
105
Refr
active
err
ors
/Uncorr
ecte
d253
37
104
129
54
40
902
1,0
66
00
106
Macula
rdegenera
tion
27
92
3-1
0124
194
075
107
Oth
er
vis
ion
loss/D
iabetic
retinopath
y138
362
70
10
513
534
28
0
108
Oth
er
hearing
loss/D
isablin
ghearing
impairm
ent
419
102
234
156
00
1,8
70
1,4
27
677
331
113
Ischem
icheart
dis
ease
177
98
186
104
82
50
24
107
96
703
562
267
367
564
506
114
Str
oke
88
166
130
35
27
78
32
50
34
425
375
737
453
538
453
118
CO
PD
/age�
40
years
567
23
181
476
410
16
24
131
112
1,2
76
1,2
00
85
0441
414
119
Asth
ma
156
96
132
145
161
35
48
121
128
163
186
218
363
156
170
122
Peptic
ulc
er
dis
ease
682
17
75
50
46
17
14
11
7125
275
35
19
123
Cirrh
osis
ofth
eliv
er
12
011
12
70
013
534
21
00
30
13
127
Kid
ney
dis
eases/C
hro
nic
kid
ney
dis
ease
79
83
110
40
49
23
058
75
277
251
640
127
281
297
133
Skin
dis
eases/A
top
icderm
atitis
231
38
232
192
216
30
29
187
210
380
370
55
80
368
370
135
Rheum
ato
idart
hritis
75
110
150
23
86
39
87
50
171
77
276
141
399
130
456
136
Oste
oart
hritis/a
ge�
50
years
347
514
402
170
288
40
146
198
333
739
1,2
01
836
3,0
39
714
1,1
59
138
Back
and
neck
pain
/Back
pain
974
1,2
56
1,0
70
906
859
442
864
964
964
1,5
30
1,4
13
2,0
37
4,6
44
1,5
32
1,4
84
148
Denta
lcaries
79
119
82
85
60
89
52
53
279
291
149
Periodonta
ldis
ease
108
178
100
94
70
84
177
161
400
672
150
Edentu
lism
95
56
36
42
00
350
434
341
203
153
Road
inju
ry252
35
208
337
169
31
32
273
147
354
145
111
0307
113
154
Pois
onin
gs
80
110
50
02
117
70
42
1
155
Falls
380
106
450
286
185
72
52
344
220
1,3
47
998
152
356
1,3
52
975
156
Fire,heat,
and
hotsubsta
nces
25
016
29
18
00
19
11
42
22
00
29
15
(Continued
)
Years lived with disability
PLOS ONE | DOI:10.1371/journal.pone.0172001 February 14, 2017 15 / 25
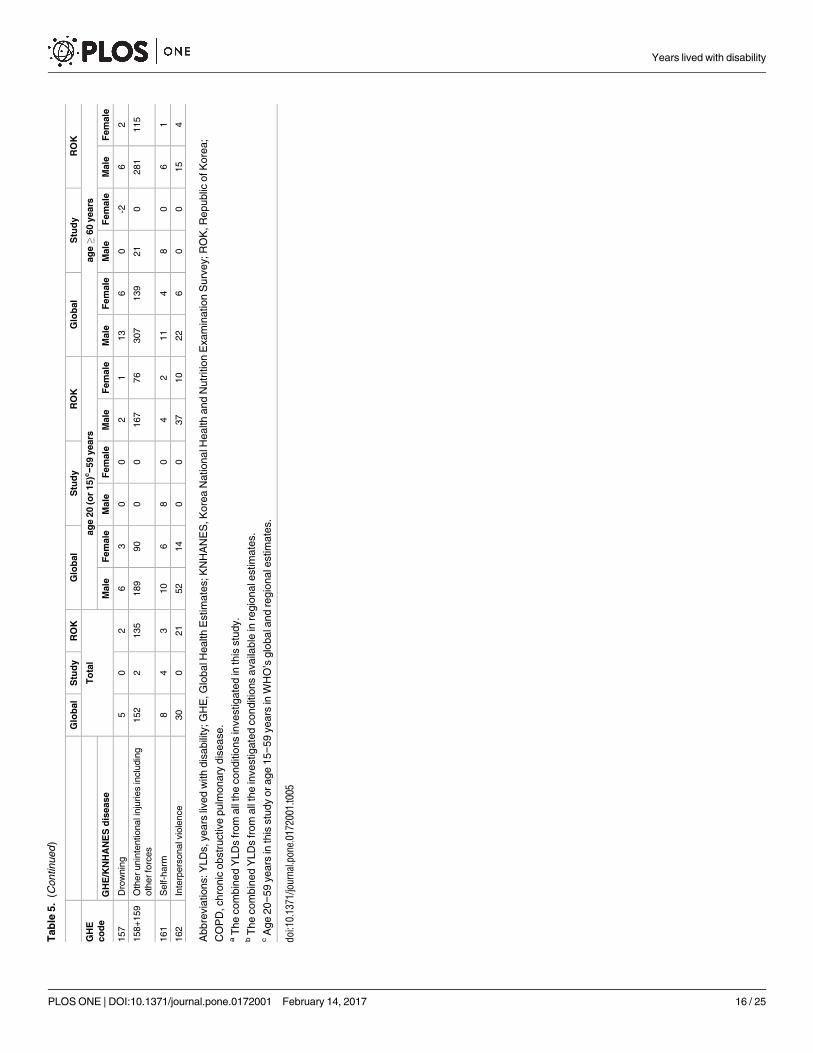
Tab
le5.
(Continued
)
Glo
bal
Stu
dy
RO
KG
lob
al
Stu
dy
RO
KG
lob
al
Stu
dy
RO
K
GH
E
co
de
To
tal
ag
e20
(or
15)c−5
9years
ag
e�
60
years
GH
E/K
NH
AN
ES
dis
ease
Male
Fem
ale
Male
Fem
ale
Male
Fem
ale
Male
Fem
ale
Male
Fem
ale
Male
Fem
ale
157
Dro
wnin
g5
02
63
00
21
13
60
-26
2
158+
159
Oth
er
unin
tentionalin
juries
inclu
din
g
oth
er
forc
es
152
2135
189
90
00
167
76
307
139
21
0281
115
161
Self-h
arm
84
310
68
04
211
48
06
1
162
Inte
rpers
onalvio
lence
30
021
52
14
00
37
10
22
60
015
4
Abbre
via
tions:Y
LD
s,years
lived
with
dis
abili
ty;G
HE
,G
lobalH
ealth
Estim
ate
s;K
NH
AN
ES
,K
ore
aN
ationalH
ealth
and
Nutr
itio
nE
xam
ination
Surv
ey;R
OK
,R
epublic
ofK
ore
a;
CO
PD
,chro
nic
obstr
uctive
pulm
onary
dis
ease.
aT
he
com
bin
ed
YLD
sfr
om
all
the
conditio
ns
investigate
din
this
stu
dy.
bT
he
com
bin
ed
YLD
sfr
om
all
the
investigate
dconditio
ns
availa
ble
inre
gio
nale
stim
ate
s.
cA
ge
20−5
9years
inth
isstu
dy
orage
15−5
9years
inW
HO
’sglo
bala
nd
regio
nale
stim
ate
s.
doi:10.1
371/jo
urn
al.p
one.
0172001.t005
Years lived with disability
PLOS ONE | DOI:10.1371/journal.pone.0172001 February 14, 2017 16 / 25

Tab
le6.
Th
era
nks
ofco
nd
itio
n-s
pecif
icY
LD
san
dth
ep
erc
en
tag
eo
fall-c
au
se
YL
Ds
acco
un
ted
for
by
each
co
nd
itio
n-s
pecif
icY
LD
%Y
LD
Ran
k%
YL
DR
an
k%
YL
D%
YL
D%
YL
D
Glo
bal
Stu
dy
RO
KG
lob
al
Stu
dy
RO
KG
lob
al
Stu
dy
RO
KG
lob
al
Stu
dy
RO
KG
lob
al
Stu
dy
RO
K
GH
E
co
de
To
tal
ag
e20
(or
15)c−5
9years
ag
e�
60
years
GH
E/K
NH
AN
ES
dis
ease
Male
Fem
ale
Male
Fem
ale
0A
llC
auses
100%
100%
100%
100%
100%
100%
100%
100%
100%
100%
100%
100%
100%
100%
100%
Sum
a61.7
%67.6
%60.8
%60.8
%55.2
%49.5
%72.2
%92.2
%71.6
%75.3
%
Sum
b51.2
%56.6
%53.5
%54.3
%51.3
%58.3
%49.3
%44.3
%47.0
%50.4
%69.4
%58.3
%49.2
%64.0
%53.0
%
138
Back
and
neck
pain
/Back
pain
8.0
%2
122.3
%1
19.7
%8.9
%16.7
%10.2
%7.9
%20.1
%10.0
%7.3
%21.5
%9.2
%6.6
%27.2
%8.4
%
136
Oste
oart
hritis/a
ge�
50
years
2.9
%8
29.1
%2
63.6
%1.7
%1.5
%2.1
%2.7
%3.4
%3.4
%3.5
%8.8
%4.3
%5.6
%17.8
%6.5
%
83
Unip
ola
rdepre
ssiv
edis
ord
ers
/
Depre
ssio
n
10.8
%1
34.6
%3
37.5
%10.0
%6.5
%6.9
%15.3
%7.5
%10.8
%4.2
%2.0
%3.5
%6.9
%2.5
%5.3
%
80
Dia
bete
sm
elli
tus
3.4
%5
43.3
%4
45.7
%2.8
%4.2
%4.7
%2.6
%2.0
%4.6
%5.3
%6.4
%8.1
%5.4
%2.5
%8.0
%
149
Periodonta
ldis
ease
0.9
%18
53.2
%1.0
%2.7
%0.9
%2.0
%0.8
%4.2
%0.8
%3.9
%
114
Str
oke
0.7
%20
62.9
%5
14
1.2
%0.3
%2.9
%0.5
%0.2
%0.7
%0.4
%2.0
%7.8
%3.2
%1.8
%2.7
%2.6
%
148
Denta
lcaries
0.6
%21
72.1
%0.8
%2.3
%0.8
%2.1
%0.2
%2.9
%0.2
%1.7
%
86
Alc
ohol-use
dis
ord
ers
4.3
%4
82.0
%6
27.6
%9.6
%5.8
%16.5
%1.6
%2.6
%3.6
%2.1
%1.2
%3.4
%0.4
%0.0
%0.7
%
135
Rheum
ato
idart
hritis
0.6
%23
92.0
%7
11
1.4
%0.2
%1.5
%0.5
%0.8
%2.0
%1.8
%0.4
%1.5
%0.8
%1.3
%2.3
%2.6
%
155
Falls
3.1
%7
10
1.9
%8
54.1
%2.8
%2.7
%3.6
%1.7
%1.2
%2.3
%6.4
%1.6
%8.1
%4.7
%2.1
%5.5
%
108
Oth
er
hearing
loss/D
isablin
ghearing
impairm
ent
3.4
%6
11
1.8
%2.3
%0.0
%1.4
%0.0
%8.9
%7.1
%6.7
%1.9
%
113
Ischem
icheart
dis
ease
1.5
%13
12
1.7
%9
91.7
%1.0
%1.9
%1.1
%0.8
%0.6
%1.0
%3.3
%2.8
%3.4
%2.6
%2.2
%2.9
%
119
Asth
ma
1.3
%14
13
1.7
%10
13
1.2
%1.4
%1.3
%1.3
%1.5
%1.1
%1.3
%0.8
%2.3
%0.9
%0.9
%2.1
%1.0
%
127
Kid
ney
dis
eases/C
hro
nic
kid
ney
dis
ease
0.6
%22
14
1.5
%11
15
1.0
%0.4
%0.9
%0.6
%0.5
%0.0
%0.8
%1.3
%6.7
%1.7
%1.2
%0.7
%1.7
%
122
Peptic
ulc
er
dis
ease
0.1
%35
15
1.5
%12
20
0.2
%0.1
%1.9
%0.2
%0.0
%1.1
%0.1
%0.1
%1.3
%0.2
%0.0
%1.6
%0.1
%
104
Cata
racts
1.1
%17
16
1.3
%0.3
%0.6
%0.5
%0.3
%2.3
%4.2
%3.6
%1.4
%
150
Edentu
lism
0.8
%19
17
1.0
%0.4
%0.0
%0.4
%0.0
%1.7
%3.6
%2.0
%1.2
%
133
Skin
dis
eases/A
topic
derm
atitis
1.9
%12
18
0.7
%13
72.1
%1.9
%1.2
%2.0
%2.0
%0.7
%2.2
%1.8
%0.6
%2.2
%1.7
%0.5
%2.1
%
105
Refr
active
err
ors
/Uncorr
ecte
d2.1
%10
19
0.7
%1.0
%2.0
%1.2
%0.9
%4.3
%0.0
%5.0
%0.0
%
153
Road
inju
ry2.1
%11
20
0.6
%14
81.9
%3.3
%1.2
%2.9
%1.6
%0.7
%1.5
%1.7
%1.2
%1.8
%0.7
%0.0
%0.6
%
118
CO
PD
/age�
40
years
4.7
%3
21
0.4
%15
10
1.6
%4.7
%0.6
%1.4
%3.8
%0.6
%1.2
%6.1
%0.9
%2.6
%5.6
%0.0
%2.3
%
106
Macula
rdegenera
tion
0.2
%25
22
0.2
%0.0
%0.0
%0.0
%0.0
%0.6
%0.0
%0.9
%0.4
%
70
Bre
astcancer
0.1
%28
23
0.1
%16
17
0.2
%0.0
%0.0
%0.0
%0.2
%0.4
%0.3
%0.0
%0.0
%0.0
%0.6
%0.0
%0.6
%
65
Colo
nand
rectu
mcancers
0.1
%31
24
0.1
%17
18
0.2
%0.0
%0.0
%0.1
%0.0
%0.0
%0.1
%0.3
%0.7
%0.6
%0.2
%0.0
%0.4
%
58
Iron-d
eficie
ncy
anem
ia2.8
%9
25
0.1
%18
16
0.6
%1.9
%0.3
%0.7
%4.7
%-0
.6%
0.5
%1.1
%1.4
%0.6
%1.5
%0.0
%0.3
%
162
Inte
rpers
onalvio
lence
0.2
%24
26
0.1
%19
19
0.2
%0.5
%0.3
%0.4
%0.1
%0.0
%0.1
%0.1
%0.1
%0.1
%0.0
%0.0
%0.0
%
68
Tra
chea,bro
nchus,lu
ng
cancers
0.1
%34
27
0.1
%20
25
0.1
%0.0
%0.1
%0.0
%0.0
%0.0
%0.0
%0.2
%0.4
%0.4
%0.1
%0.0
%0.1
%
107
Oth
er
vis
ion
loss/D
iabetic
retinopath
y1.1
%16
28
0.1
%0.6
%0.0
%0.6
%0.0
%2.4
%0.3
%2.5
%0.0
%
161
Self-h
arm
0.1
%33
29
0.0
%21
27
0.0
%0.1
%0.0
%0.0
%0.1
%0.0
%0.0
%0.1
%0.2
%0.0
%0.0
%0.0
%0.0
%
103
Gla
ucom
a0.2
%27
30
0.0
%0.0
%0.2
%0.1
%0.0
%0.5
%0.0
%0.7
%0.0
%
154
Pois
onin
gs
0.1
%32
31
0.0
%22
30
0.0
%0.1
%0.0
%0.0
%0.0
%0.0
%0.0
%0.1
%0.0
%0.0
%0.0
%0.0
%0.0
%
66
Liv
er
cancer
0.0
%38
32
0.0
%23
26
0.1
%0.0
%-0
.1%
0.1
%0.0
%0.1
%0.0
%0.1
%0.0
%0.3
%0.0
%0.0
%0.1
%
64
Sto
mach
cancer
0.0
%37
33
0.0
%24
23
0.1
%0.0
%0.0
%0.1
%0.0
%0.0
%0.0
%0.1
%0.0
%0.5
%0.1
%0.0
%0.2
%
78
Oth
er
malig
nantneopla
sm
s0.1
%30
34
0.0
%25
21
0.1
%0.1
%0.0
%0.1
%0.1
%0.0
%0.1
%0.2
%0.0
%0.3
%0.2
%0.0
%0.3
%
123
Cirrh
osis
ofth
eliv
er
0.1
%29
35
0.0
%26
24
0.1
%0.1
%0.0
%0.1
%0.1
%0.0
%0.0
%0.2
%0.0
%0.2
%0.1
%0.0
%0.1
%
156
Fire,heat,
and
hotsubsta
nces
0.2
%26
36
0.0
%27
22
0.1
%0.3
%0.0
%0.2
%0.2
%0.0
%0.1
%0.2
%0.0
%0.2
%0.1
%0.0
%0.1
%
(Continued
)
Years lived with disability
PLOS ONE | DOI:10.1371/journal.pone.0172001 February 14, 2017 17 / 25
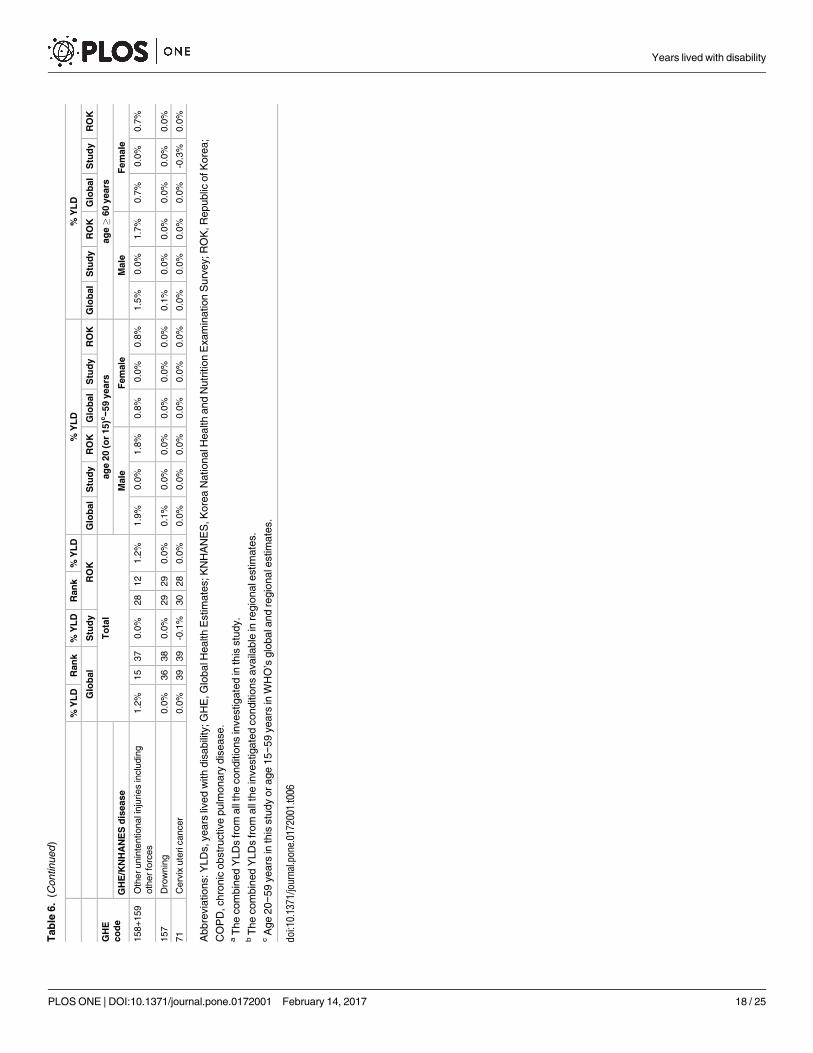
Tab
le6.
(Continued
)
%Y
LD
Ran
k%
YL
DR
an
k%
YL
D%
YL
D%
YL
D
Glo
bal
Stu
dy
RO
KG
lob
al
Stu
dy
RO
KG
lob
al
Stu
dy
RO
KG
lob
al
Stu
dy
RO
KG
lob
al
Stu
dy
RO
K
GH
E
co
de
To
tal
ag
e20
(or
15)c−5
9years
ag
e�
60
years
GH
E/K
NH
AN
ES
dis
ease
Male
Fem
ale
Male
Fem
ale
158+
159
Oth
er
unin
tentionalin
juries
inclu
din
g
oth
er
forc
es
1.2
%15
37
0.0
%28
12
1.2
%1.9
%0.0
%1.8
%0.8
%0.0
%0.8
%1.5
%0.0
%1.7
%0.7
%0.0
%0.7
%
157
Dro
wnin
g0.0
%36
38
0.0
%29
29
0.0
%0.1
%0.0
%0.0
%0.0
%0.0
%0.0
%0.1
%0.0
%0.0
%0.0
%0.0
%0.0
%
71
Cerv
ixute
ricancer
0.0
%39
39
-0.1
%30
28
0.0
%0.0
%0.0
%0.0
%0.0
%0.0
%0.0
%0.0
%0.0
%0.0
%0.0
%-0
.3%
0.0
%
Abbre
via
tions:Y
LD
s,years
lived
with
dis
abili
ty;G
HE
,G
lobalH
ealth
Estim
ate
s;K
NH
AN
ES
,K
ore
aN
ationalH
ealth
and
Nutr
itio
nE
xam
ination
Surv
ey;R
OK
,R
epublic
ofK
ore
a;
CO
PD
,chro
nic
obstr
uctive
pulm
onary
dis
ease.
aT
he
com
bin
ed
YLD
sfr
om
all
the
conditio
ns
investigate
din
this
stu
dy.
bT
he
com
bin
ed
YLD
sfr
om
all
the
investigate
dconditio
ns
availa
ble
inre
gio
nale
stim
ate
s.
cA
ge
20−5
9years
inth
isstu
dy
or
age
15−5
9years
inW
HO
’sglo
bala
nd
regio
nale
stim
ate
s.
doi:10.1
371/jo
urn
al.p
one.
0172001.t006
Years lived with disability
PLOS ONE | DOI:10.1371/journal.pone.0172001 February 14, 2017 18 / 25

for visual impairments (except in uncorrected refractive errors) and stroke, but the prevalence
rates of these conditions were much lower than those of back pain or osteoarthritis. Diabetes,
alcohol-use disorders, hearing impairment, COPD, CKD, and periodontitis were also very
common, but the disability-weights were not as large as those for back pain or osteoarthritis.
Our study findings differed somewhat from those of the GHE. The condition-specific YLDs
for many diseases and injuries (except for back pain, osteoarthritis, periodontitis, stroke, CKD,
caries, or peptic ulcer) were lower than those of the GHE, and the combined YLDs for all
conditions in most age−sex groups (except in old females) were also lower than those of the
WHO estimates. In contrast to the WHO estimates, the combined YLDs in our study differed
markedly between males and females. The differences in male and female health-related qual-
ity of life have been observed not only in our study of the Korean population, but also in stud-
ies of other ethnic populations [20–22].
The GBD 2010 used lay descriptions of the symptoms and dysfunctions resulting from dis-
eases or injuries to estimate disability-weights for those conditions, and obtained highly con-
sistent values across surveys performed in diverse communities [9]. Although these brief
descriptions were straightforward, they may fail to reflect different manifestations of any given
disease in terms of severity, treatment, or environment. A number of studies have evaluated
DALYs or YLDs for various diseases [23–27], and most have used health state descriptions to
estimate disability-weights, following the GBD and WHO method. It is doubtful that the
abstract values of disability-weights obtained using descriptions that assume typical manifesta-
tions of diseases could reflect a real-life health state. Previous YLDs differed markedly across
previous studies, particularly in the case of mild disease [28]. The manifestations of disease
may vary from asymptomatic to apparently symptomatic depending on individual conditions
and environments. In general, mild disease states, with no or vague symptoms, are common,
whereas severe states, with apparent symptoms, are relatively uncommon. If a disability-weight
for a severe, uncommon disease state is used to estimate the YLDs of a mild common disease
state, the YLDs may be erroneously overestimated. The lack of population information on the
severity distribution of most conditions may frequently lead to mismatch errors between prev-
alence rates and disability-weights in the calculation of YLDs. These types of mismatch errors
can be avoided by measuring both values from a single study sample.
A few studies have assessed DALYs or YLDs using a disability-weight that was directly mea-
sured in patients with specific diseases or injuries [5,29–33]. However, most of them evaluated
YLDs for only one or two conditions, and even did so without reasonable reference groups.
The aggregate of separate estimations of YLDs for various diseases, without relevant mutual
exclusions between disease categories, may result in overestimation of total YLDs, due to the
duplications of the YLDs. The GHE list, from which we identified specific diseases and injuries
for this study, may provide mutually exclusive and aggregative categories. In our study, the dis-
ability-weight was measured in subjects with a specific disease or injury; both the prevalence
and disability-weight were measured in a representative sample, and the YLDs from dozens of
conditions in the GHE list were estimated from the same source. Thus, our estimates of the
condition-specific and combined YLDs were more likely to reflect the real health state of the
population and to overcome erroneous estimation due to mismatch errors or duplicated
counts.
There was a marked, age-related increase in YLDs ascribed to osteoarthritis and back pain,
with a notable difference between males and females. The YLDs from osteoarthritis and back
pain were exceptionally large, particularly for older females. The combined YLDs from both
these conditions accounted for 31.5% of all-cause YLDs in adults aged� 20 years. In the
Global Burden of Disease (GBD) 2010 and WHO GHE, back pain and osteoarthritis also
ranked highest. However, the YLDs from those were not as marked as in our estimates, and
Years lived with disability
PLOS ONE | DOI:10.1371/journal.pone.0172001 February 14, 2017 19 / 25
did not differ between the sexes. Our finding of the sex differences in YLDs for back pain and
osteoarthritis could possibly explain the worse health-related quality of life in females, which
has also been demonstrated in previous studies performed in other ethnic groups [20–22]. For
osteoarthritis, the differences in YLDs for the two sexes resulted mainly from the difference in
prevalence rates. The prevalence of osteoarthritis in females was markedly higher than that in
males, while the disability-weight was similar between the sexes. As we confirmed osteoarthri-
tis from radiographs as well as from symptoms, our prevalence estimate is reliable.
On the other hand, back pain, the single highest-ranked condition, was common in young
people as well as in old people. However, the disability-weight from back pain was relatively
small in young people as compared to old people. Back pain has diverse causes, including oste-
oarthritis, herniated disks, instability, spinal stenosis, and the sequelae of spine surgery, and is
most frequently diagnosed as “nonspecific back pain” [34]. In our study, in half of old people
with back pain, this disorder was accompanied by radiographic osteoarthritis, but this accom-
panying rate was sharply decreased in young people. Further research is urgently needed to
define the broad category of “back pain” better.
Additionally, the YLD estimates of our study incorporate the effect of current treatments as
well as the severity of the disorder itself. This point should be considered when interpreting
our results. Back pain and osteoarthritis should receive greater emphasis in terms of disability,
particularly in older women. However, preventative strategies or brief supportive care, rather
than traditional or specialized treatments, may be more effective in reducing osteoarthritis and
back pain [35,36].
Diabetes is another important cause of disability. The YLDs from diabetes were 72000 years
and accounted for 3.3% of all-cause YLDs. Diabetes is a common disease that has various com-
plications. The GBD 2010 and WHO GHE used discrete disability-weights according to the
complication of diabetes (uncomplicated, diabetic foot, and diabetic neuropathy). However, it
may be difficult to establish the distribution of complications at the age, sex, and regional level.
In the KNHANES sample, the microvascular complication rates of diabetes differed according
to age and sex. Diabetic retinopathy/nephropathy (urine albumin-to-creatinine ratio� 30 mg/
g) was observed in 13.7%/19.1%, 13.9%/19.7%, 20.2/29.7%, and 19.5/24.7% of the young-male,
young-female, old-male, and old-female diabetics, respectively. In our study, the disability-
weight ascribed to diabetes was 0.015, 0.021, 0.026, and 0.021, in the young males, young
females, old males, and old females, respectively. We believe that our data represent more reli-
able disability-weights and YLDs for diabetes at the age and sex level.
Depression and alcohol-use disorders are well known to be major contributors to disability.
The YLDs from depression/alcohol-use disorders accounted for 4.6%/2.0% of all-cause YLDs,
respectively, and the values were notably different from the WHO’s global (10.8%/4.3%) and
regional (7.5%/7.6%) estimates. This large difference was caused by the marked differences in
the disability-weights between the GHE and our study. The GHE disability-weights for major
depression and alcohol-use disorders ranged from 0.159 to 0.655, but the overall disability-
weights for depression and alcohol-use disorders were 0.072 and 0.017, respectively, in our
study. The disability due to these mental and behavioral disorders could easily be affected by
the social or cultural environment. Moreover, the severity of the disorders could be differently
regarded by the patients themselves and by those around them. We obtained disability-weights
from a self-reported questionnaire (EQ-5D), using the Korean value set that was established
based on a representative national sample. The disability-weights and YLDs of our research
therefore incorporate cultural effects and self-assessments.
The overall YLDs from visual impairment (including uncorrected refractive errors)
accounted for 2.3% of all-cause YLDs. In adults aged� 20 years, the overall prevalence of
visual impairments (including blindness) with best-corrected visual acuity < 8/16 in the better
Years lived with disability
PLOS ONE | DOI:10.1371/journal.pone.0172001 February 14, 2017 20 / 25

eye was 1.58%, and the prevalence of uncorrected refractive errors was 3.85%. When each
cause was calculated as a percentage of total causes of visual impairment (excluding uncor-
rected refractive errors), the causes were cataract (62.0%), glaucoma (10.1%), age-related mac-
ular degeneration (8.3%), diabetic retinopathy (3.6%), and undetermined causes (16.0%).
Visual impairment from undetermined causes did not decrease the EQ-5D index scores in our
study (data not shown), although that was the largest global cause of YLDs ascribed to visual
impairment according to the GHE. Cataracts, uncorrected refractive errors, and macular
degeneration were the top three contributors to YLDs due to visual impairment. A total of
29487 adults underwent ophthalmologic examinations in the KNHANES from July 2008 to
December 2012, and trained medical staff and ophthalmologists conducted the examinations
using standardized equipment and protocols. Our results may be helpful for the estimation of
the global or regional burden of visual impairment.
The combined YLDs from all injuries accounted for 2.6% of all-cause YLDs. Falls and road
injury accounted for 95.7% of the total YLDs from all injuries. Falls and road injury were com-
mon in old women and in young men, respectively. Although the sequelae of injuries may
have a wide spectrum of severity, it may be very hard to identify the severity distribution of
sequelae at the population level. Previous studies performed in European countries have sug-
gested that injuries are main contributors to YLDs, as well as years of life lost (YLLs) [33,37].
Those studies analyzed the data based on the disability-weights obtained from patients in hos-
pital or emergency settings. The disability-weights obtained from hospitalized patients or
emergency department attendances would reflect disability for severe injuries, but would not
represent disability for injuries of various states. As mentioned earlier, if the disability-weight
for severe injuries was applied to a mild state, the YLDs may be overestimated. In contrast, our
research was based on the KNHANES, which involved non-institutionalized civilians only,
and investigated recent (within 1 year) injuries. People with severe conditions or lifelong
sequelae were more likely to be excluded, and our results may underestimate the YLDs from
injuries.
Stroke/ischemic heart disease accounted for 166/98 YLDs per 100000 adults and 2.9%/1.7%
of all-cause YLDs in our study, whereas they accounted for 130/186 YLDs per 100000 adults
and 1.2%/1.7% of all-cause YLDs in the WHO’s regional estimates. Percutaneous coronary
intervention is well known to provide a benefit in terms of quality of life in patients with ische-
mic heart disease [38]. The existence of effective treatment may result in the contrasting YLDs
between diseases. Disability due to hearing impairment could also be affected by the availabil-
ity of medical resources. A substantial improvement in the mental health quality of life after
cochlear implant or hearing aid use has been reported in patients with hearing impairments
[39]. It is quite possible that the YLDs from hearing impairment are smaller (our estimates)
than expected (WHO’s global estimates) with the aid of these modalities. The YLDs from
chronic obstructive pulmonary disease was less than the WHO’s global or regional estimates.
In old females the degree of decreased forced expiratory volume in 1 second did not correlate
with the severity of disability. It remains possible that the assessment of chronic obstructive
pulmonary disease based only on the results of a pulmonary function test cannot readily esti-
mate the severity in old females. Chronic kidney disease also contributes to YLDs. Interest-
ingly, chronic kidney disease with moderately increased risk significantly contributed to YLDs
only in old men, whereas a more advanced state (with high risk) did not in old men. The
potential overestimation of the glomerular filtration rate in the case of muscle wasting, a com-
mon problem in the elderly suffering from kidney disease, may influence the association
between disability and estimated kidney function in old people. Peptic ulcer accounted for
1.5% of all-cause YLDs, and the value was larger than the WHO’s global (0.1%) and regional
(0.2%) estimates. We believe that the relatively larger YLDs due to peptic ulcer reflect the
Years lived with disability
PLOS ONE | DOI:10.1371/journal.pone.0172001 February 14, 2017 21 / 25
regional differences in the characteristics of peptic ulcers [40]. Oral health disorders (dental
caries, periodontitis, and edentulism) were important contributors to YLDs. Oral health disor-
der is a preventable disease and is related to general hygiene. It is therefore necessary to
emphasize the importance of oral hygiene. The magnitude of YLDs due to cancers was rela-
tively small. Malignancy is a well-known major contributor to YLLs, but the YLDs due to
malignancy is not thought be large. Nevertheless, colorectal and lung cancers in old males and
breast cancer in females were significant contributors to YLDs. Interestingly, iron-deficiency
anemia, contributed to YLDs only in males. The causes of iron deficiency, physical activity, or
comorbidities may be involved in the association between iron-deficiency anemia and YLDs.
Overall, these findings suggest that multifactorial processes are involved in the determination
of health-related quality of life in the general population.
Taken together, the YLDs estimated in this study differed somewhat from those of the GBD
2010 and WHO GHE. The differences might arise from three different sources. First, we esti-
mated the prevalence rates of 40 conditions in a single representative sample, whereas those of
the GBD and GHE were obtained from various sources. Additionally, we confirmed many dis-
eases by objective physical/laboratory findings along with patient’s symptoms, to obtain more
precise estimates of disease prevalence. Our estimates might provide a more consistent and
reliable source for comparing disease burdens among numerous conditions. Second, we gener-
ated disability-weights from the EQ-5D index directly measured in a large sample from the
KNHANES, whereas the GBD 2010 measured disability-weights using lay health-state descrip-
tions, which could not reflect various manifestations of the same disease particularly in terms
of severity. Additionally, we computed disability-weights separately in each age and sex cate-
gory (young males, young females, old males, and old females). Disease burdens estimated in
our study might incorporate age-specific effects as well as the severity of the disorder. Finally,
we could overcome erroneous estimation of YLDs from mismatch errors between prevalence
rates and disability-weights through measuring them in a single study sample. The GBD rank-
ings are based on epidemiological data that may not be sufficiently robust for the calculation
of the YLDs; the lack of reliable information on severity distributions may lead to mismatch
errors in the calculation of YLDs. We believe that our YLD estimates are more likely to reflect
real health states of the population.
On the other hand, the use of computed disability-weights from people having health con-
ditions is not necessary an advantage compared to the weights that use lay health-state descrip-
tions as a basis. Since persons with health conditions tend to underestimate their level of
disability, the use of weights based on lay descriptions is the most conservative approach. In
addition, disability-weights based on lay descriptions have been preferred for the estimation of
disease burdens because they take into account the opinion of the general population.
There are several points to consider when interpreting our results. First, we did not investi-
gate all the causes of YLD in the GHE list. In addition to the investigated diseases, anxiety dis-
orders, migraine, schizophrenia, drug-use disorders, and gynecologic disorders are important
contributors to the global disease burden. We could not include such conditions, due to the
lack of relevant information in the KNHANES data. However, the combined YLDs from the
conditions included in this study accounted for 61.7% of all-cause YLDs in the WHO’s global
estimates. Additionally, we investigated visual/hearing impairments and oral health disorders,
which were not included in the WHO’s regional estimates. Second, certain diseases were
defined by a physician-based diagnosis of the disease, while many other diseases were con-
firmed by physical/laboratory examinations, in conjunction with the patient’s history. The
prevalence of a diagnosed disease could different from the true prevalence. Some diagnoses
may have been incorrect or missed. Third, as the survey enrolled non-institutionalized individ-
uals who volunteered to participate, persons with severe conditions were more likely to be
Years lived with disability
PLOS ONE | DOI:10.1371/journal.pone.0172001 February 14, 2017 22 / 25
excluded. Thus, the estimates would have been underestimated in the KNHANES. Finally, the
present study included subjects who resided in Korea, and the disability-weights were gener-
ated based on the EQ5D index scores calculated using the Korean value set, which were closer
to values of the Japanese study than those of studies in western countries [12]. Since there is
likely to be regional or ethnic differences in disease burdens, it is difficult to draw general con-
clusions applicable to the global population. Nevertheless, the values of prevalence, disability-
weight, and YLDs determined in our study may be helpful in estimating non-fatal burdens of
diseases in East Asia, where populations with similar ethnic and cultural backgrounds reside.
Conclusions
This relatively simple, prevalence-based approach, using a population-representative survey,
could readily estimate YLDs reflecting the real health state of the general population. The
results of this study may form the basis for population-level strategies to prevent age-related
worsening of disability, which is more severe in females.
Acknowledgments
We express our gratitude to all the survey respondents and to members of the KNHANES.
Author Contributions
Conceptualization: HHJ JIP.
Formal analysis: HHJ JIP.
Investigation: HHJ JIP.
Methodology: HHJ JIP.
Supervision: HHJ.
Visualization: HHJ JIP.
Writing – original draft: HHJ JIP.
Writing – review & editing: HHJ JIP.
References1. World Health Organization. WHO | Global Burden of Disease (GBD) [Internet]. World Health Organiza-
tion; 30 Jun 2014 [cited 26 Sep 2015]. Available: http://www.who.int/healthinfo/global_burden_disease/
gbd/en/
2. WHO methods and data sources for global burden of disease estimates 2000-2011 [Internet]. Depart-
ment of Health Statistics and Information Systems, World Health Organization; 2013 Nov. Report No.:
Global Health Estimates Technical Paper WHO/HIS/HSI/GHE/2013.4. Available: http://www.who.int/
healthinfo/statistics/GlobalDALYmethods_2000_2011.pdf
3. Vos T, Flaxman AD, Naghavi M, Lozano R, Michaud C, Ezzati M, et al. Years lived with disability
(YLDs) for 1160 sequelae of 289 diseases and injuries 1990-2010: a systematic analysis for the Global
Burden of Disease Study 2010. Lancet. 2012; 380: 2163–2196. doi: 10.1016/S0140-6736(12)61729-2
PMID: 23245607
4. Murray CJ, Lopez AD. Regional patterns of disability-free life expectancy and disability-adjusted life
expectancy: Global Burden of Disease Study. Lancet. 1997; 349: 1347–1352. doi: 10.1016/S0140-
6736(96)07494-6 PMID: 9149696
5. Begg SJ, Vos T, Barker B, Stanley L, Lopez AD. Burden of disease and injury in Australia in the new mil-
lennium: measuring health loss from diseases, injuries and risk factors. Med J Aust. 2008; 188: 36–40.
PMID: 18205562
Years lived with disability
PLOS ONE | DOI:10.1371/journal.pone.0172001 February 14, 2017 23 / 25
6. Michaud CM, McKenna MT, Begg S, Tomijima N, Majmudar M, Bulzacchelli MT, et al. The burden of
disease and injury in the United States 1996. Popul Health Metr. 2006; 4: 11. doi: 10.1186/1478-7954-
4-11 PMID: 17049081
7. Dodhia H, Phillips K. Measuring burden of disease in two inner London boroughs using Disability
Adjusted Life Years. J Public Health. 2008; 30: 313–321.
8. Kominski GF, Simon PA, Ho A, Luck J, Lim Y-W, Fielding JE. Assessing the burden of disease and
injury in Los Angeles County using disability-adjusted life years. Public Health Rep. 2002; 117: 185–
191. PMID: 12357003
9. Salomon JA, Vos T, Hogan DR, Gagnon M, Naghavi M, Mokdad A, et al. Common values in assessing
health outcomes from disease and injury: disability weights measurement study for the Global Burden
of Disease Study 2010. Lancet. 2012; 380: 2129–2143. doi: 10.1016/S0140-6736(12)61680-8 PMID:
23245605
10. Voigt K, King NB. Disability weights in the global burden of disease 2010 study: two steps forward, one
step back? Bull World Health Organ. 2014; 92: 226–228. doi: 10.2471/BLT.13.126227 PMID:
24700983
11. Kweon S, Kim Y, Jang M-J, Kim Y, Kim K, Choi S, et al. Data resource profile: the Korea National Health
and Nutrition Examination Survey (KNHANES). Int J Epidemiol. 2014; 43: 69–77. doi: 10.1093/ije/
dyt228 PMID: 24585853
12. Lee Y-K, Nam H-S, Chuang L-H, Kim K-Y, Yang H-K, Kwon I-S, et al. South Korean time trade-off val-
ues for EQ-5D health states: modeling with observed values for 101 health states. Value Health. 2009;
12: 1187–1193. doi: 10.1111/j.1524-4733.2009.00579.x PMID: 19659703
13. Yoon KC, Choi W, Lee HS, Kim S-D, Kim S-H, Kim CY, et al. An Overview of Ophthalmologic Survey
Methodology in the 2008-2015 Korean National Health and Nutrition Examination Surveys. Korean J
Ophthalmol. 2015; 29: 359–367. doi: 10.3341/kjo.2015.29.6.359 PMID: 26635451
14. Iron Deficiency Anaemia Assessment, Prevention, and Control A guide for programme managers [Inter-
net]. World Health Organization; 2001. Available: http://apps.who.int/iris/bitstream/10665/66914/1/
WHO_NHD_01.3.pdf
15. Babor TF, Higgins-Biddle JC, Saunders JB, Monteiro MG. The Alcohol Use Disorders Identification
Test Guidelines for Use in Primary Care [Internet]. Department of Mental Health and Substance Depen-
dence, World Health Organization; 2001. Available: http://apps.who.int/iris/bitstream/10665/67205/1/
WHO_MSD_MSB_01.6a.pdf
16. WHO | Deafness and hearing loss [Internet]. World Health Organization; 2 Mar 2015 [cited 5 Jan 2016].
Available: http://www.who.int/mediacentre/factsheets/fs300/en/
17. Global strategy for the diagnosis, management, and prevention of chronic obstructive pulmonary dis-
ease (updated 2016) [Internet]. Global Initiative for Chronic Obstructive Lung Disease; 2016. Available:
http://www.goldcopd.org/uploads/users/files/GOLD_Report 202016.pdf
18. Levin A, Stevens PE. Summary of KDIGO 2012 CKD Guideline: behind the scenes, need for guidance,
and a framework for moving forward. Kidney Int. 2014; 85: 49–61. doi: 10.1038/ki.2013.444 PMID:
24284513
19. Petersen PE, Ogawa H. Strengthening the prevention of periodontal disease: the WHO approach. J
Periodontol. 2005; 76: 2187–2193. doi: 10.1902/jop.2005.76.12.2187 PMID: 16332229
20. Szende A, Williams A. Measuring self-reported population health: an international perspective based on
EQ-5D [Internet]. EuroQol Group; 2004. Available: http://www.euroqol.org/fileadmin/user_upload/
Documenten/PDF/Books/Measuring_Self-Reported_Population_Health_-_An_International_
Perspective_based_on_EQ-5D.pdf
21. Sullivan PW, Lawrence WF, Ghushchyan V. A national catalog of preference-based scores for chronic
conditions in the United States. Med Care. 2005; 43: 736–749. PMID: 15970790
22. Tomlin, Stephania, Radomiljac, Ali and Kay, Alison. Health and Wellbeing of Adults in Western Australia
2014, Overview and Trends [Internet]. Department of Health, Western Australia; 2015. Available: http://
ww2.health.wa.gov.au/~/media/Files/Corporate/Reports and publications/Population surveys/2041-
HWSS-Adults-WA-Overview-and-Trends.ashx
23. Kruijshaar ME, Hoeymans N, Spijker J, Stouthard MEA, Essink-Bot M-L. Has the burden of depression
been overestimated? Bull World Health Organ. 2005; 83: 443–448. PMID: 15976895
24. Yoon S-J, Bae S-C, Lee S-I, Chang H, Jo HS, Sung J-H, et al. Measuring the burden of disease in
Korea. J Korean Med Sci. 2007; 22: 518–523. doi: 10.3346/jkms.2007.22.3.518 PMID: 17596664
25. Baltussen RMPM, Sanon M, Sommerfeld J, Wurthwein R. Obtaining disability weights in rural Burkina
Faso using a culturally adapted visual analogue scale. Health Econ. 2002; 11: 155–163. PMID:
11921313
Years lived with disability
PLOS ONE | DOI:10.1371/journal.pone.0172001 February 14, 2017 24 / 25
26. Schwarzinger M, Stouthard MEA, Burstrom K, Nord E. Cross-national agreement on disability weights:
the European Disability Weights Project. Popul Health Metr. 2003; 1: 9. doi: 10.1186/1478-7954-1-9
PMID: 14633276
27. Havelaar AH, de Wit MA, van Koningsveld R, van Kempen E. Health burden in the Netherlands due to
infection with thermophilic Campylobacter spp. Epidemiol Infect. 2000; 125: 505–522. PMID: 11218201
28. Haagsma JA, Polinder S, Cassini A, Colzani E, Havelaar AH. Review of disability weight studies: com-
parison of methodological choices and values. Popul Health Metr. 2014; 12: 20. doi: 10.1186/s12963-
014-0020-2 PMID: 26019690
29. Darbà J, Kaskens L, Perez-Alvarez N, Palacios S, Neyro JL, Rejas J. Disability-adjusted-life-years
losses in postmenopausal women with osteoporosis: a burden of illness study. BMC Public Health.
2015; 15: 324. doi: 10.1186/s12889-015-1684-7 PMID: 25880810
30. Holtslag HR, van Beeck EF, Lichtveld RA, Leenen LP, Lindeman E, van der Werken C. Individual and
population burdens of major trauma in the Netherlands. Bull World Health Organ. 2008; 86: 111–117.
doi: 10.2471/BLT.06.033803 PMID: 18297165
31. Brennan DS, Spencer AJ, Roberts-Thomson KF. Quality of life and disability weights associated with
periodontal disease. J Dent Res. 2007; 86: 713–717. PMID: 17652197
32. Jia T-W, Zhou X-N, Wang X-H, Utzinger J, Steinmann P, Wu X-H. Assessment of the age-specific dis-
ability weight of chronic schistosomiasis japonica. Bull World Health Organ. 2007; 85: 458–465. doi: 10.
2471/BLT.06.033035 PMID: 17639243
33. Lyons RA, Kendrick D, Towner EM, Christie N, Macey S, Coupland C, et al. Measuring the population
burden of injuries—implications for global and national estimates: a multi-centre prospective UK longitu-
dinal study. PLoS Med. 2011; 8: e1001140. doi: 10.1371/journal.pmed.1001140 PMID: 22162954
34. Clark LL, Hu Z. Low back pain, active component, U.S. Armed Forces, 2010-2014. MSMR. 2015; 22:
8–11.
35. Fransen M, Simic M, Harmer AR. Determinants of MSK health and disability: lifestyle determinants of
symptomatic osteoarthritis. Best Pract Res Clin Rheumatol. 2014; 28: 435–460. doi: 10.1016/j.berh.
2014.07.002 PMID: 25481425
36. Arora P, Vasa P, Brenner D, Iglar K, McFarlane P, Morrison H, et al. Prevalence estimates of chronic
kidney disease in Canada: results of a nationally representative survey. CMAJ. 2013; 185: E417–23.
doi: 10.1503/cmaj.120833 PMID: 23649413
37. Polinder S, Meerding WJ, Mulder S, Petridou E, van Beeck E, EUROCOST Reference Group. Assess-
ing the burden of injury in six European countries. Bull World Health Organ. 2007; 85: 27–34. doi: 10.
2471/BLT.06.030973 PMID: 17242755
38. Weintraub WS, Spertus JA, Kolm P, Maron DJ, Zhang Z, Jurkovitz C, et al. Effect of PCI on quality of
life in patients with stable coronary disease. N Engl J Med. 2008; 359: 677–687. doi: 10.1056/
NEJMoa072771 PMID: 18703470
39. Contrera KJ, Betz J, Li L, Blake CR, Sung YK, Choi JS, et al. Quality of life after intervention with a
cochlear implant or hearing aid. Laryngoscope. 2016;
40. Lam SK. Differences in peptic ulcer between East and West. Baillieres Best Pract Res Clin Gastroen-
terol. 2000; 14: 41–52. PMID: 10749088
Years lived with disability
PLOS ONE | DOI:10.1371/journal.pone.0172001 February 14, 2017 25 / 25
Related Documents