Estimation of the Uncertainty of the Robertson and Wride Model for Reliability Analysis of Soil Liquefaction C. Hsein Juang and Susan H. Yang Clemson University

Welcome message from author
This document is posted to help you gain knowledge. Please leave a comment to let me know what you think about it! Share it to your friends and learn new things together.
Transcript

Estimation of the Uncertainty of the Robertson and Wride Model for
Reliability Analysis of Soil Liquefaction
C. Hsein Juang and Susan H. YangClemson University

This study was sponsored by the National
Science Foundation through Grants No.
CMS-0218365.
ACKNOWLEDGMENT

Objectives of the Research
Develop a procedure for estimating model uncertainty of limit state modelsExplore the use of FORM for calculating reliability index and probability of liquefactionExamine the robustness of Bayesian mapping approach
Outline of the Presentation
Robertson and Wride Model
First Order Reliability Method
Parameter and Model Uncertainties
Bayesian Mapping Approach
Estimation of the Model Uncertainty
Conclusions

Review of the Robertson and Wride Model
Liquefaction loading: cyclic stress ratio (CSR)
v max7.5 d
v
aCSR 0.65 (r )/MSF
g
Liquefaction resistance: cyclic resistance ratio (CRR)CRR7.5 = 93(qc1N,cs/1000)3+0.08, if 50qc1N,cs<160
CRR7.5 = 0.833(qc1N,cs/1000)+0.05, if qc1N,cs< 50
CRR = f(qc, fs, v, v)
See Robertson and Wride (1998) for detail

Overview of the First Order Reliability Method
First order second moment (FOSM)
Advanced first order second moment (AFOSM)
First order reliability method (FORM)
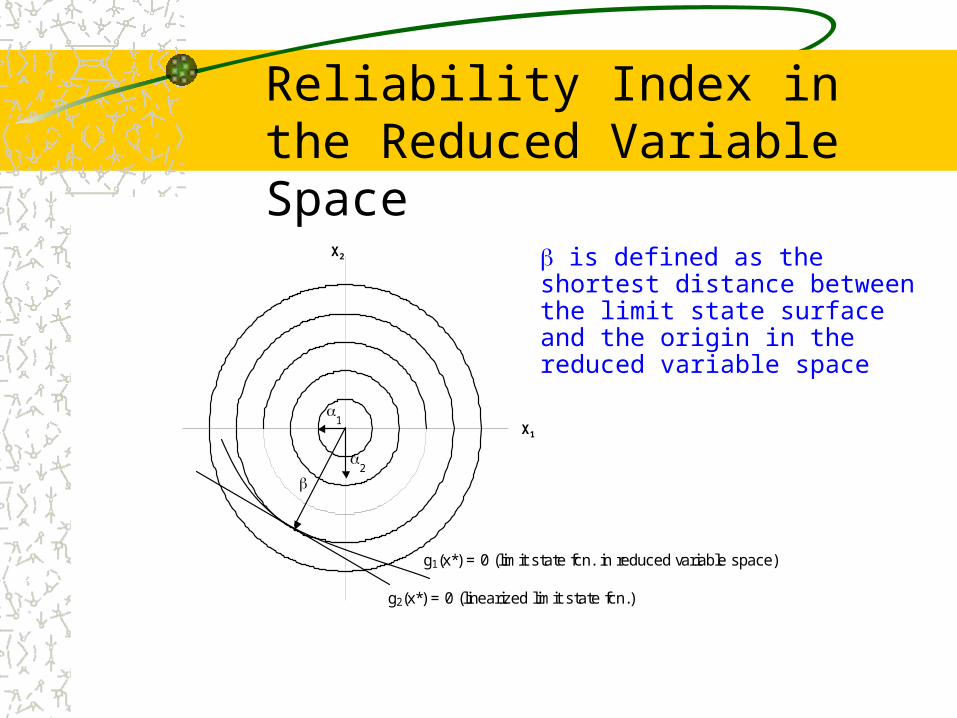
Reliability Index in the Reduced Variable Space
X1
X2
1
2
g1(x*) = 0 (limit state fcn. in reduced variable space)
g2(x*) = 0 (linearized limit state fcn.)
is defined as the shortest distance between the limit state surface and the origin in the reduced variable space
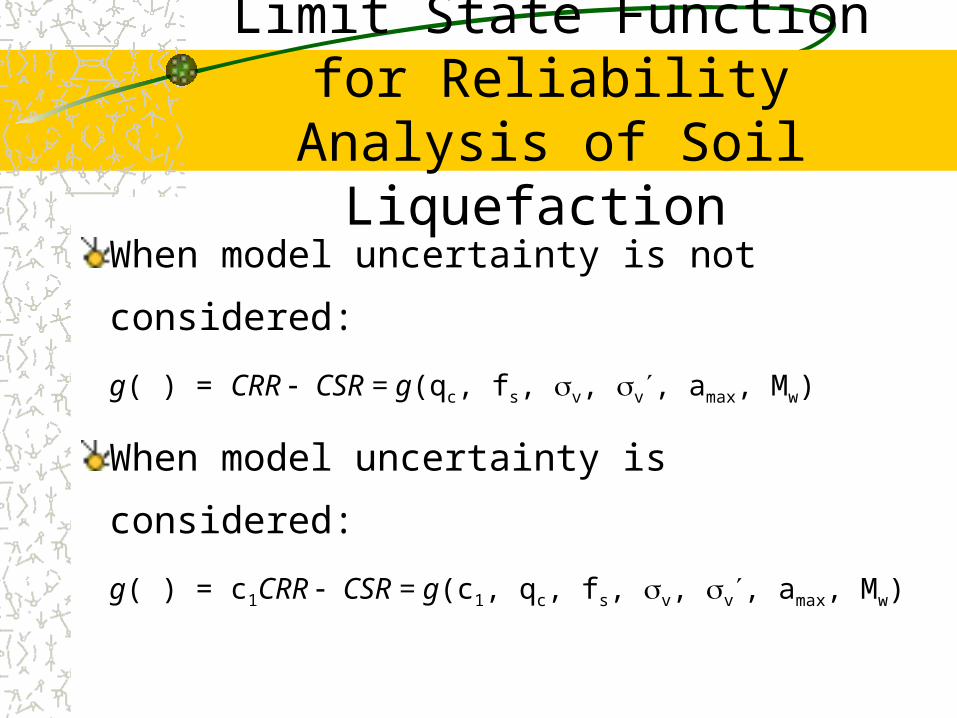
Limit State Function for Reliability Analysis of Soil Liquefaction
When model uncertainty is not considered:
g( ) = CRR CSR = g(qc, fs, v, v, amax, Mw)
When model uncertainty is considered:
g( ) = c1CRR CSR = g(c1, qc, fs, v, v, amax, Mw)

Model Uncertainty: the uncertainty in the limit state function
CSR is used as a reference in the development of the CRR model through calibration with field cases;Whatever uncertainty there is in the CSR model is eventually passed along to the uncertainty in the CRR model. The effect of the uncertainty associated with the CSR model is realized in the CRR model.
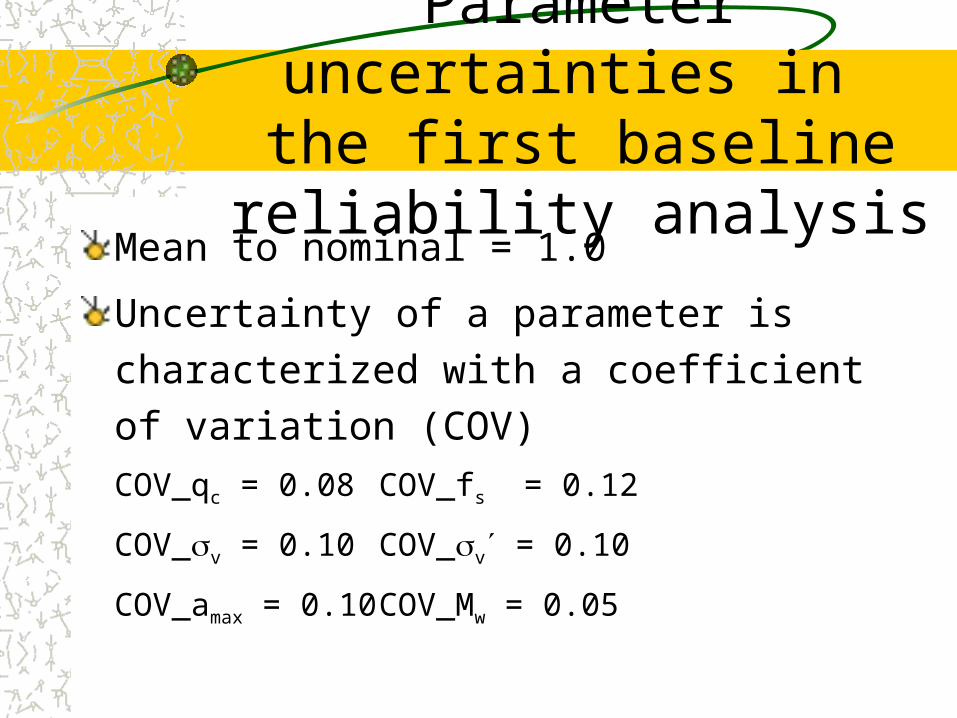
Parameter uncertainties in the first baseline reliability analysis
Mean to nominal = 1.0
Uncertainty of a parameter is characterized with a coefficient of variation (COV)
COV_qc = 0.08 COV_fs = 0.12
COV_v = 0.10 COV_v = 0.10
COV_amax = 0.10 COV_Mw = 0.05

Coefficient of correlation of the input parameters
qc fs
v
v amax Mw
qc 1.00 0.37 0.25 0.25 0.00 0.00
fs 0.37 1.00 0.54 0.52 0.00 0.00
v 0.25 0.54 1.00 0.93 0.00 0.00
v 0.25 0.52 0.93 1.00 0.00 0.00
amax 0.00 0.00 0.00 0.00 1.00 0.90
Mw 0.00 0.00 0.00 0.00 0.90 1.00

Probabilities of Liquefaction
By means of notional probability concept
1 (β)fp
By means of a Bayesian mapping function obtained through calibration of the calculated using a database of field observations
L
(β)P (Liq | β)
(β) (β)L
rL NL
fP
f f
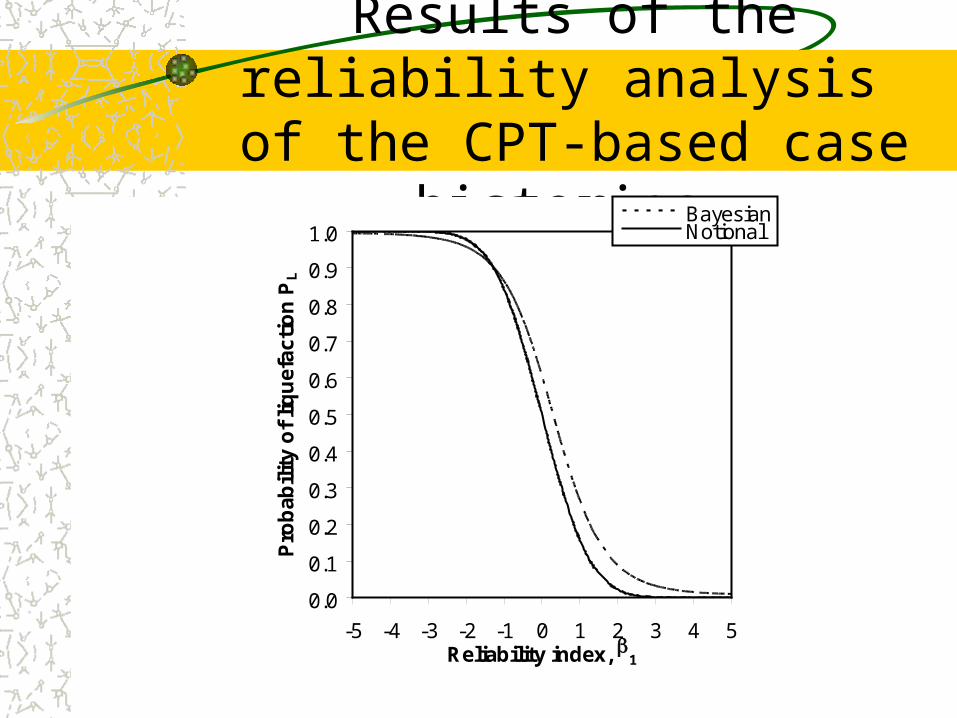
Results of the reliability analysis of the CPT-based case histories
0.0
0.1
0.2
0.3
0.4
0.5
0.6
0.7
0.8
0.9
1.0
-5 -4 -3 -2 -1 0 1 2 3 4 5Reliability index, 1
Pro
bab
ility
of
liqu
efac
tio
n P
L
BayesianNotional

Estimation of Model Uncertainty: Premise
The premise:
A fully calibrated Bayesian mapping function is a true probability or at least a close approximation of the true probability.
This premise stands as the calibration of the calculated reliability index is carried out with a sufficiently large database of case histories.

Estimation of Model Uncertainty: Methodology
Model uncertainty is obtained through a trial and error process.The “correct” model uncertainty:The one that produces the probabilities matching best with those produced by the Bayesian mapping function that has been calibrated with a database of field observations.

Effect of the COV component of model uncertainty onβ
3 = 1
R2 = 1
-5-4-3-2-1012345
-5 -4 -3 -2 -1 0 1 2 3 4 5
1
3
3 = 0.92
1 - 0.01
R2 = 1.00
-5-4-3-2-1012345
-5 -4 -3 -2 -1 0 1 2 3 4 5
1
3
3 = 0.85
1- 0.02
R2 = 1.00
-5-4-3-2-1012345
-5 -4 -3 -2 -1 0 1 2 3 4 5
1
3
3 = 0.77
1 - 0.03
R2 = 1.00
-5-4-3-2-1012345
-5 -4 -3 -2 -1 0 1 2 3 4 5
1
3
(a) c1 = 1.0, COV = 0% (b) c1 = 1.0, COV = 10%
(c) c1 = 1.0, COV = 15% (d) c1 = 1.0, COV = 20%

Effect of the c1 component of model uncertainty onβ
3 = 0.92
1 - 0.83
R2 = 1.00
-5-4-3-2-1012345
-5 -4 -3 -2 -1 0 1 2 3 4 5
1
3
3 = 0.92
1 - 0.40
R2 = 1.00
-5-4-3-2-1012345
-5 -4 -3 -2 -1 0 1 2 3 4 5
1
3
3 = 0.92
1 - 0.01
R2 = 1.00
-5-4-3-2-1012345
-5 -4 -3 -2 -1 0 1 2 3 4 5
1
3
3 = 0.92
1 + 0.67
R2 = 1.00
-5-4-3-2-1012345
-5 -4 -3 -2 -1 0 1 2 3 4 5
1
3
(c) c1 = 1.0, COV = 10% (d) c1 = 1.2, COV = 10%
(a) c1 = 0.8, COV = 10% (b) c1 = 0.9, COV = 10%
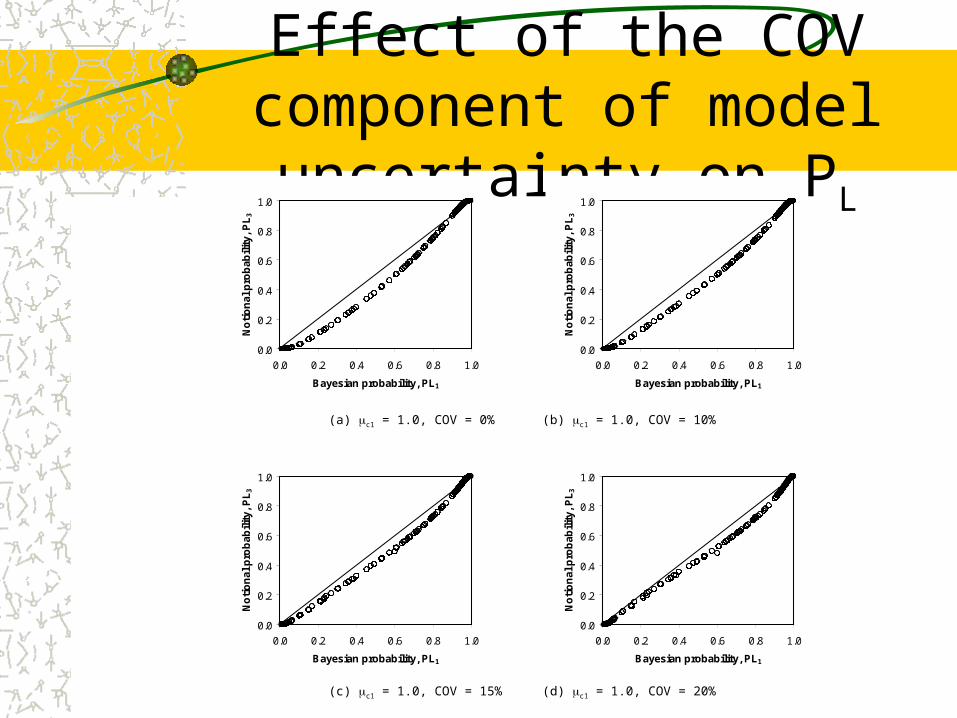
Effect of the COV component of model uncertainty on PL
0.0
0.2
0.4
0.6
0.8
1.0
0.0 0.2 0.4 0.6 0.8 1.0
Bayesian probability, PL1
No
tio
nal
pro
bab
ilit
y, P
L3
0.0
0.2
0.4
0.6
0.8
1.0
0.0 0.2 0.4 0.6 0.8 1.0
Bayesian probability, PL1
No
tio
nal
pro
bab
ilit
y, P
L3
0.0
0.2
0.4
0.6
0.8
1.0
0.0 0.2 0.4 0.6 0.8 1.0
Bayesian probability, PL1
No
tio
nal
pro
bab
ilit
y, P
L3
0.0
0.2
0.4
0.6
0.8
1.0
0.0 0.2 0.4 0.6 0.8 1.0
Bayesian probability, PL1
No
tio
nal
pro
bab
ilit
y, P
L3
(a) c1 = 1.0, COV = 0% (b) c1 = 1.0, COV = 10%
(c) c1 = 1.0, COV = 15% (d) c1 = 1.0, COV = 20%

Effect of the c1 component of model uncertainty on PL
0.0
0.2
0.4
0.6
0.8
1.0
0.0 0.2 0.4 0.6 0.8 1.0
Bayesian probability, PL1
No
tio
nal
pro
bab
ility
, PL
3
0.0
0.2
0.4
0.6
0.8
1.0
0.0 0.2 0.4 0.6 0.8 1.0
Bayesian probability, PL1
No
tio
nal
pro
bab
ility
, PL
3
0.0
0.2
0.4
0.6
0.8
1.0
0.0 0.2 0.4 0.6 0.8 1.0
Bayesian probability, PL1
No
tio
nal
pro
bab
ility
, PL
3
0.0
0.2
0.4
0.6
0.8
1.0
0.0 0.2 0.4 0.6 0.8 1.0
Bayesian probability, PL1
No
tio
nal
pro
bab
ility
, PL
3
(a) c1 = 0.8, COV = 10% (b) c1 = 0.9, COV = 10%
(c) c1 = 1.0, COV = 10% (d) c1 = 1.2, COV = 15%

Notional probability versusBayesian probability
The model uncertainty is
characterized by c1 = 0.94
and COV = 15%
The parameter uncertainty
is at the same level as in
the first baseline analysis
0.0
0.2
0.4
0.6
0.8
1.0
0.0 0.2 0.4 0.6 0.8 1.0
Bayesian probability, PL1
No
tio
nal
pro
bab
ility
, PL
3
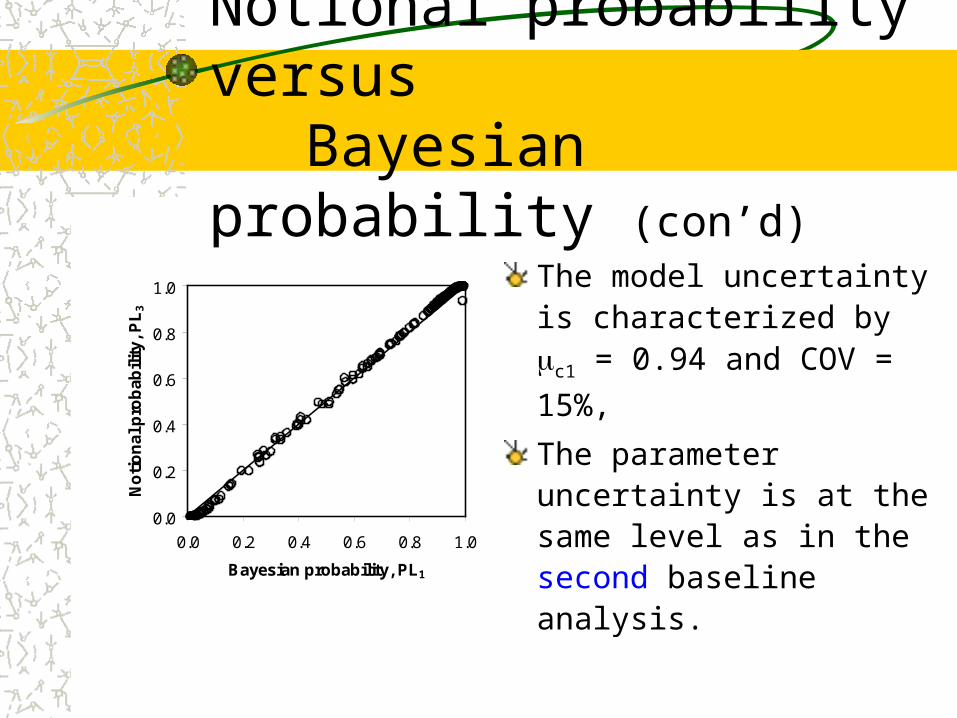
Notional probability versusBayesian probability (con’d)
The model uncertainty is characterized by c1 = 0.94
and COV = 15%,
The parameter uncertainty is at the same level as in the second baseline analysis.0.0
0.2
0.4
0.6
0.8
1.0
0.0 0.2 0.4 0.6 0.8 1.0
Bayesian probability, PL1
No
tio
nal
pro
bab
ility
, PL
3

Conclusions
The model uncertainty c1 can be characterized
with two statistical parameters, the mean (c1),
and the coefficient of variation (COV).
The results show that the c1 component has a
more profound impact than does the COV component.

Conclusions (con’d)
The first order reliability method (FORM) is shown to be able to estimate accurately and PL, provided that the correct parameter and
model uncertainties are incorporated in the analysis.
Conclusions (con’d)
Robustness of the Bayesian mapping approach is demonstrated in this study.
In the situation where the fully calibrated Bayesian mapping function is available, the model uncertainty may be estimated using the Bayesian mapping function.
Conclusions (con’d)
The Robertson and Wride model is estimated to have a model uncertainty that is characterized with a c1 of 0.94 and a COV of 15%.
Related Documents


