Estimation of the tissue composition of the tumour mass in neuroblastoma using segmented CT images \ F. J. Ayres 1"2"* M.K. Zuffo 2 R.M. Rangayyan 1"2"3 G.S. Boag 4 V. O. Filho 5 M. Valente 5 1Department of Electrical & Computer Engineering, University of Calgary, Calgary, Alberta, Canada 2Departamento de Engenharia EI4trica, Escola Polit4cnica da Universidade de S~o Paulo, S~o Paulo, Brazil 3Department of Radiology, University of Calgary, Calgary, Alberta, Canada CAIberta Children's Hospital, Calgary, Alberta, Canada 51-10spital das Clinicas, Instituto da Crianga, Faculdade de Medicina da Universidade de S~o Paulo, S~o Paulo, Brazil Abstract--Neurob/astoma is the most common extra-cranial, solid, malignant tumour in children. Advances in radiology have made possible the detection and staging of the disease. Nevertheless, there is no method available at present that can go beyond detection and qualitative analysis, towards quantitative assessment of the tissue composition of the primary tumour mass in neuroblastoma. Such quantitative analysis could provide important information and serve as a decision-support tool to the radiologist and the oncologist, result in better treatment and follow-up and even lead to the avoidance of delayed surgery. The problem investigated was the improvement of the analysis of the primary tumour mass, in patients with neuro- blastoma, using X-ray computed tomography (CT) images. A methodology was proposed for the estimation of the tissue content of the mass: it comprised a Gaussian mixture model for estimation, from segmented CT images, of the tissue composition of the primary tumour. To demonstrate the potential of the method, the results are presented of its application to ten CT examinations of four patients. The method provides quantitative information, and it was observed that the tumour in one of the patients reduced from 523cm 3 to 81cm 3 in volume, with an increase in calcification from about 20% to about 88% of the tumour volume, in response to chemotherapy over a period of five months. Results indicate that the proposed technique may be of considerable value in assessing the response to therapy of patients with neuroblastoma. Keywords--Neuroblastoma, CT image analysis, Gaussian mixture model, Tumour analysis, Tissue composition Med. Biol. Eng. Comput., 2004, 42, 366-377 J 1 Neuroblastoma NEUROBLASTOMA is a malignant tumour of neural crest origin that can arise anywhere along the sympathetic ganglia or within the adrenal medulla (ALEXANDER, 2000). it is said to be an enigmatic and fascinating entity that represents, at the same time, one of the best examples of spontaneous regression for a malignant tumour and one of the tumours with the poorest cure potential for some groups (ALEXANDER, 2000; COTTERILL et el., 2000). Correspondence should be addressed to Professor R. M. Rangayyan; emaih [email protected] *Also with Laboratory of Image, Vision & Spatial Structures, SENAC College of Computer Science & Technology, S~o Paulo, Brazil Paper received 12 June 2003 and in final form 5 February 2004 MBEC online number: 20043878 © IFMBE: 2004 366 There are three types of ganglion cell lesion that form a spectrum of neoplastic disease. Neuroblastoma is the most immature and malignant form of the three, usually presenting before the age of 5 years. Ganglioneuroblastoma is a more mature form that retains some malignant characteristics, with peak incidence between 5 and 10 years of age. Ganglioneuroma is well differentiated and benign, typically presenting after 10 years of age (MEZA et el., 1993). Neuroblastoma is the most common extra-cranial, solid, malignant tumour in children (ABRAMSON, 1997). it accounts for 8-10% of all childhood cancers (CASTLEBERRY, 1997) and for 15% of all deaths related to cancer in the paediatric age group. The median age at diagnosis is 2 years, and 90% of the diagnosed cases are in children under the age of 5 years (ABRAMSON, 1997). Sixty-five percent of the tumours related to neuroblastoma are located in the abdomen; approximately two-thirds of these arise in the adrenal gland. Fifteen percent of neuroblastomas are thoracic, usually located in the sympathetic ganglia of the Medical & Biological Engineering & Computing 2004, Vol. 42

Welcome message from author
This document is posted to help you gain knowledge. Please leave a comment to let me know what you think about it! Share it to your friends and learn new things together.
Transcript
Estimation of the tissue composition of the tumour mass in neuroblastoma
using segmented CT images
\
F. J. Ayres 1"2"* M . K . Zuffo 2 R .M . Rangayyan 1"2"3 G.S. Boag 4 V. O. Filho 5 M. Valente 5
1Department of Electrical & Computer Engineering, University of Calgary, Calgary, Alberta, Canada 2Departamento de Engenharia EI4trica, Escola Polit4cnica da Universidade de S~o Paulo,
S~o Paulo, Brazil 3Department of Radiology, University of Calgary, Calgary, Alberta, Canada
CAIberta Children's Hospital, Calgary, Alberta, Canada 51-10spital das Clinicas, Instituto da Crianga, Faculdade de Medicina da Universidade de S~o Paulo,
S~o Paulo, Brazil
Abstract--Neurob/astoma is the most common extra-cranial, solid, mal ignant tumour in children. Advances in radiology have made possible the detection and staging of the disease. Nevertheless, there is no method available at present that can go beyond detection and qualitative analysis, towards quantitative assessment of the tissue composit ion of the pr imary tumour mass in neuroblastoma. Such quantitative analysis could provide important information and serve as a decision-support tool to the radiologist and the oncologist, result in better treatment and fol low-up and even lead to the avoidance of delayed surgery. The problem investigated was the improvement of the analysis of the pr imary tumour mass, in patients with neuro- blastoma, using X-ray computed tomography (CT) images. A methodology was proposed for the estimation of the tissue content of the mass: it comprised a Gaussian mixture model for estimation, from segmented CT images, of the tissue composit ion of the pr imary tumour. To demonstrate the potential of the method, the results are presented of its application to ten CT examinations of four patients. The method provides quantitative information, and it was observed that the tumour in one of the patients reduced from 523cm 3 to 81cm 3 in volume, with an increase in calcification from about 20% to about 88% of the tumour volume, in response to chemotherapy over a period of five months. Results indicate that the proposed technique may be of considerable value in assessing the response to therapy of patients with neuroblastoma.
Keywords--Neuroblastoma, CT image analysis, Gaussian mixture model, Tumour analysis, Tissue composit ion
Med. Biol. Eng. Comput., 2004, 42, 366-377
J
1 Neuroblastoma
NEUROBLASTOMA is a malignant tumour of neural crest origin that can arise anywhere along the sympathetic ganglia or within the adrenal medulla (ALEXANDER, 2000). it is said to be an enigmatic and fascinating entity that represents, at the same time, one of the best examples of spontaneous regression for a malignant tumour and one of the tumours with the poorest cure potential for some groups (ALEXANDER, 2000; COTTERILL et el., 2000).
Correspondence should be addressed to Professor R. M. Rangayyan; emaih [email protected]
*Also with Laboratory of Image, Vision & Spatial Structures, SENAC College of Computer Science & Technology, S~o Paulo, Brazil Paper received 12 June 2003 and in final form 5 February 2004 MBEC online number: 20043878
© IFMBE: 2004
366
There are three types of ganglion cell lesion that form a spectrum of neoplastic disease. Neuroblastoma is the most immature and malignant form of the three, usually presenting before the age of 5 years. Ganglioneuroblastoma is a more mature form that retains some malignant characteristics, with peak incidence between 5 and 10 years of age. Ganglioneuroma is well differentiated and benign, typically presenting after 10 years of age (MEZA et el., 1993).
Neuroblastoma is the most common extra-cranial, solid, malignant tumour in children (ABRAMSON, 1997). it accounts for 8-10% of all childhood cancers (CASTLEBERRY, 1997) and for 15% of all deaths related to cancer in the paediatric age group. The median age at diagnosis is 2 years, and 90% of the diagnosed cases are in children under the age of 5 years (ABRAMSON, 1997).
Sixty-five percent of the tumours related to neuroblastoma are located in the abdomen; approximately two-thirds of these arise in the adrenal gland. Fifteen percent of neuroblastomas are thoracic, usually located in the sympathetic ganglia of the
Medical & Biological Engineering & Computing 2004, Vol. 42
posterior mediastinum. Between 10 and 12% ofneuroblastomas are disseminated without a known site of origin (BouSVAROS et al., 1986).
In the US, about 650 children and adolescents younger than 20 years of age are diagnosed with neuroblastoma every year (GOODMAN et al., 1999). Neuroblastoma is the most common cancer of infancy, with an incidence rate that is almost double that of leukaemia, the next most common malignancy occurring during the first year of life (GOODMAN et al., 1999). The rate of incidence of neuroblastoma among infants in the US has increased from 53 per million in the period 1976-1984 to 74 per million in the period 1986-1994 (GooDMAN et al., 1999). GURNEY et al. (1997) estimated an annual increase rate of 3.4% for extra-cranial neuroblastoma. Although some countries have instituted screening programmes to detect neuroblastoma in infants, studies have indicated that the possible benefit of screening on mortality is necessarily small and has not yet been demonstrated in reliable data (PARKER and POWELL, 1998; WOODS and TUCHMAN, 1998).
1.1 Staging
The most recent staging system for neuroblastoma is the international Neuroblastoma Staging System, which takes into account radiological findings, surgical resectability, lymph-node involvement and bone-marrow involvement (BRODEUR e t al., 1993). The staging ranges from Stage 1, for a localised tumour with no lymph-node involvement, to Stage 4 with the disease spread to distant lymph nodes, bone, liver and other organs (BRODEUR et al., 1993).
The main determinant factors for prognosis are the patient's age and the stage of the disease (ABRAMSON, 1997; BOUSVAROS et al., 1986). The survival rate of patients diagnosed with neuro- blastoma under the age of 1 year is 74%, whereas it is only 14% for patients over the age of 3 years (ABRAMSON, 1997). Whereas the survival rate of patients diagnosed with Stage 1 neuroblastoma is in the range 95-100%, it is only 10-30% for patients diagnosed with Stage 4 of the disease.
The site of the primary tumour is also said to be of relevance in the overall prognosis. Tumours arising in the abdomen and pelvis have the worst prognosis, with adrenal tumours having the highest mortality. Thoracic neuroblastoma has a better overall survival rate (61%) than abdominal tumours (20%) (BouSVAROS et al., 1986).
Surgical resection of the primary tumour is recommended whenever possible. However, the primary tumour of a patient with advanced neuroblastoma (Stages 3 and 4) can be unresect- able, if there is the risk of damaging vital structures in the procedure (notably when the mass encases the aorta). Treatment in these cases requires chemotherapy or radiotherapy for initial shrinkage of the mass, after which (delayed) surgical resection can be performed (ALEXANDER, 2000).
1.2 Radiological analysis
The radiology ofneuroblastoma has been studied extensively over the past three decades, and several review articles concerning the radiological aspects of the disease have been published (STARK et al., 1983; KIRKS et al., 1981; BOUSVAROS et al., 1986; ABRAMSON, 1997; COHEN et al., 1996). Radiological examinations can be useful in the initial diagnosis, assessment of extension, staging, presurgical evaluation, treat- ment and follow-up.
Several imaging modalities have been investigated in the context of neuroblastoma, including ultrasound, CT, magnetic resonance imaging (MRI), bone and marrow scintigraphy, excretory urography and chest radiography. CT and MRI are considered to be the best modalities for the evaluation oftumour
Medical & Biological Engineering & Computing 2004, Vol. 42
stage (ABRAMSON, 1997), resectability (BOECHAT et al., 1985) and prognosis and follow-up (ABRAMSON, 1997). CT examina- tions are mandatory for the analysis of the primary tumour, and some investigators have reported that MRI could be more useful than CT in evaluating metastatic disease (CORBETT et al., 1991; FLETCHER et al., 1985; SOFKA et al., 1999).
if we compare CT and MRI, the latter has a higher diagnostic accuracy (the highest among all imaging modalities) and is said to be more suitable for the demonstration oftumour spread and visualisation of the tumour in relationship to neighbounng blood vessels and vessels within the tumour (ABRAMSON, 1997), which are important factors in therapy and assessment of resectability. MRI also provides better soft-tissue contrast than CT and is more promising for the estimation of tissue composi- tion (CHEZMAR et al., 1998; KORNREICH et al., 1991). Another advantageous feature is that MRI uses non-ionising radiation. Nevertheless, CT is considered to be the modality of choice in several investigations, because it is comparable in usefulness with MRI in evaluating local disease (ABRAMSON, 1997) and is more cost-effective. CT is known to be effective in detecting calcifications (a finding in favour of neuroblastoma (STARK et al., 1983) and against Wilms tumour), detection and assess- ment of the extension of local disease and evaluation of lymph-node involvement, recurrent disease and nonskeletal metastasis (BouSVAROS et al., 1986).
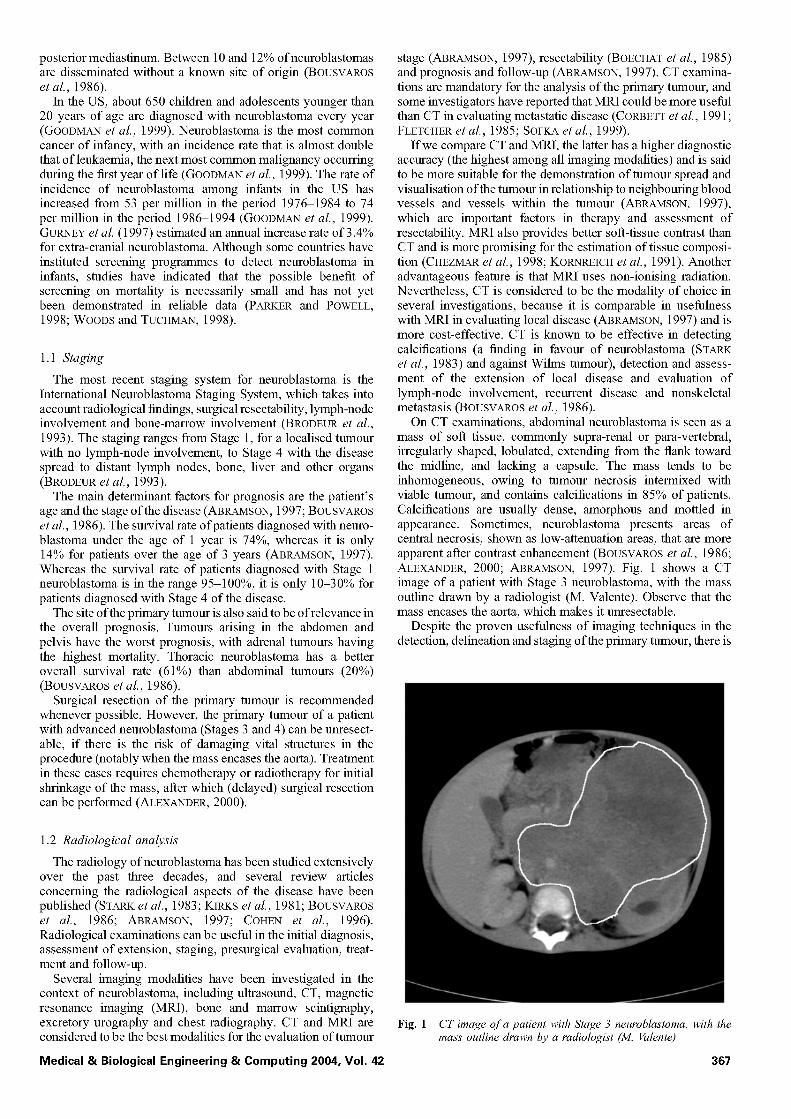
On CT examinations, abdominal neuroblastoma is seen as a mass of soft tissue, commonly supra-renal or para-vertebral, irregularly shaped, lobulated, extending from the flank toward the midline, and lacking a capsule. The mass tends to be inhomogeneous, owing to tumour necrosis intermixed with viable tumour, and contains calcifications in 85% of patients. Calcifications are usually dense, amorphous and mottled in appearance. Sometimes, neuroblastoma presents areas of central necrosis, shown as low-attenuation areas, that are more apparent after contrast enhancement (BouSVAROS et aL, 1986; ALEXANDER, 2000; ABRAMSON, 1997). Fig. 1 shows a CT image of a patient with Stage 3 neuroblastoma, with the mass outline drawn by a radiologist (M. Valente). Observe that the mass encases the aorta, which makes it unresectable.
Despite the proven usefulness of imaging techniques in the detection, delineation and staging of the primary tumour, there is
Fig. 1 CT image of a patient with Stage 3 neuroblastoma, with the mass outline drawn by a radiologist (M. Valente)
367
a need for improvement in the usage of imaging for more accurate assessment of the local disease that could lead to better treatment planning and follow-up. FOGLIA et al. (1989) argued that the primary tumour status in advanced neuroblas- toma cannot be assessed definitively by diagnostic imaging, owing to errors in sensitivity and specificity as high as 38%, when tumour viability was assessed by imaging methods and compared with findings in delayed surgery. They also reported that CT examinations could not differentiate viable tumour from fibrotic tissue or non-viable tumour destroyed by previous chemotherapy.
1.3 Computer-aided analysis
Computer-aided image analysis could improve radiological analysis of neuroblastoma by offering more sophisticated, quantitative, accurate and reproducible measures of information in the image data. Nevertheless, few researchers have investi- gated the potential of computer-aided analysis ofneuroblastoma using diagnostic imaging; related published works are limited to tumour volume measurement using manually segmented CT slices (planimetry) (WHEATLEY et al., 1995; HOPPER et al., 2000). in particular, there is no method, to our knowledge, with or without computer aid, that could quantitatively assess, using image-based examinations, the amount of active disease (viable tumour), scar tissue (necrosis), fibrosis, non-viable mmour, calcifications and other tissues in a given mmour mass (FOGLIA et al., 1989).
The problem that we investigate in the present report is computer-aided quantitative analysis of the primary tumour mass, in patients with neuroblastoma, using X-ray CT examina- tions. To achieve this goal, we propose a methodology for quantitative estimation of the tissue content of the mass using statistical modelling and analysis of segmented CT images (AYRES, 2001; AYRES et al., 2001). The results of the method are compared with the results of histological (pathological) analysis of surgically resected masses.
Although it may be possible to estimate the tissue content of a mmour by visual analysis of CT images, such estimation can only be subjective and prone to inter-observer variation. Furthermore, the analysis of a three-dimensional mmour mass by sequential examination of CT slices could be of limited accuracy. The proposed techniques provide quantitative results through objective and reproducible methods and, hence, are expected to lead to greater accuracy. The results should also facilitate comparative analysis of mmour data from multiple images of the same patient for the analysis of response to treatment, or comparative analysis ofmmour data from multiple patients for the assessment of response to the same or different treatment protocols.
2 Tissue characterisation using CT
The physical characteristic of tissue that is displayed in a CT image is the linear (X-ray) attenuation coefficient p. The value of p varies with two material properties: density and elemental composition (FULLERTON, 1980). Values of p have been measured and tabulated for several materials (PHELPS e t al., 1975; RAO and GREGG, 1975), including human and animal tissues, at different X-ray energies (including measurements with multiple energies, such as dual-energy imaging (FULLERTON, 1980; WILSON, 1980; BROOKS, 1977)).
it is not common to display CT images in terms of the linear attenuation coefficient (which is dependent on the energy used (PHELPS et al., 1975; BROOKS, 1977)). instead, normalised
'CT units' are used, which are more convenient and indepen- dent, to a certain extent, of the X-ray energy (RoBB, 1982). The CT unit is defined as
C T number = k p - Pw Pw
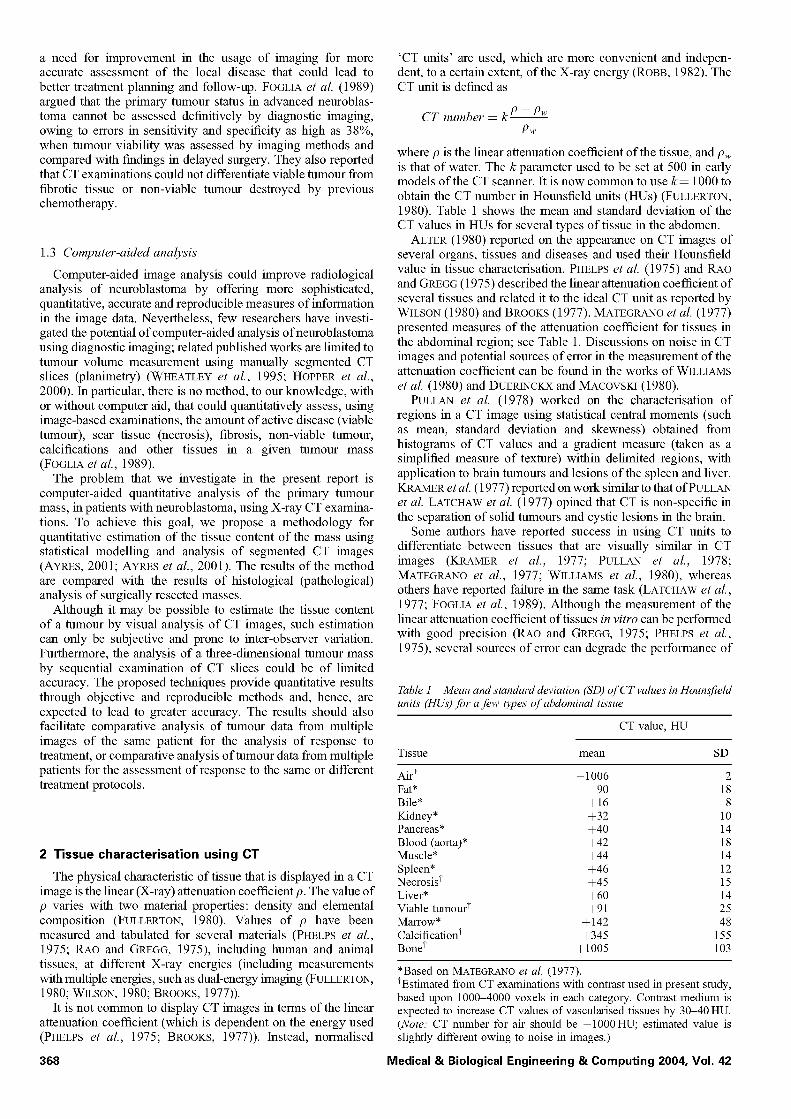
where p is the linear attenuation coefficient of the tissue, and Pw is that of water. The k parameter used to be set at 500 in early models of the CT scanner, it is now common to use k = 1000 to obtain the CT number in Hounsfield units (HUs) (FULLERTON, 1980). Table 1 shows the mean and standard deviation of the CT values in HUs for several types of tissue in the abdomen.
ALTER (1980) reported on the appearance on CT images of several organs, tissues and diseases and used their Hounsfield value in tissue characterisation. PHELPS et al. (1975) and RAO and GREGG (1975) described the linear attenuation coefficient of several tissues and related it to the ideal CT unit as reported by WILSON (1980) and BROOKS (1977). MATEGRANO et al. (1977) presented measures of the attenuation coefficient for tissues in the abdominal region; see Table 1. Discussions on noise in CT images and potential sources of error in the measurement of the attenuation coefficient can be found in the works of WILLIAMS et al. (1980) and DUERINCKX and MACOVSKI (1980).
PULLAN et al. (1978) worked on the characterisation of regions in a CT image using statistical central moments (such as mean, standard deviation and skewness) obtained from histograms of CT values and a gradient measure (taken as a simplified measure of texture) within delimited regions, with application to brain tumours and lesions of the spleen and liver. KRAMER et al. (1977) reported on work similar to that of PULLAN et al. LATCHAW et al. (1977) opined that CT is non-specific in the separation of solid tumours and cystic lesions in the brain.
Some authors have reported success in using CT units to differentiate between tissues that are visually similar in CT images (KRAMER et al., 1977; PULLAN et al., 1978; MATEGRANO et al., 1977; WILLIAMS et al., 1980), whereas others have reported failure in the same task (LATCHAW e t al., 1977; FOGLIA et al., 1989). Although the measurement of the linear attenuation coefficient of tissues in vitro can be performed with good precision (RAo and GREGG, 1975; PHELPS et al., 1975), several sources of error can degrade the performance of
Table 1 Mean and standard deviation (SD) o f CT values in Hounsfield units" (HUs) for a few types" o f abdominal tissue
CT value, HU
Tissue mean SD
Air t 1006 2 Fat* 90 18 Bile* +16 8 Kidney* +32 10 Pancreas* +40 14 Blood (aorta)* +42 18 Muscle* +44 14 Spleen* +46 12 Necrosis t +45 15 Liver* ÷60 14 Viable mmour t +91 25 Marrow* + 142 48 Calcification t +345 155 Bone t +1005 103
*Based on MATEGRANO et al. (1977). tEstimated from CT examinations with contrast used in present study, based upon 1000-4000 voxels in each category. Contrast medium is expected to increase CT values of vasculaxised tissues by 30-40 HU. (Note: CT number for air should be 1000 HU; estimated value is slightly different owing to noise in images.)
368 Medical & Biological Engineering & Computing 2004, Vol. 42
in vivo CT sensitometry (GOODENOUGH, 2000), some of which are motion artifacts, noise, partial-volume effect and the spectral spread of the energy of the X rays.
Intravascular contrast is usually employed in abdominal CT studies. The contrast agent is injected rapidly into the venous system, with scanning commencing shortly after completion of the injection. The objective of this technique is to image the patient while the intravascular concentration of contrast is at its peak and before redistribution of contrast into soft tissues occurs, thus maximising the density difference between vascular struc- tures and other body organs and allowing assessment of regional blood flow. The intravascular concentration of contrast decreases initially owing to dilution in the blood volume, then by redistribution throughout perfused tissues, and lastly by renal excretion. The effect of contrast on HU measurements is dependent on many factors, including: blood volume, body weight, contrast volume and injection rate, time elapsed since injection and vascularity of the structure of interest. Some of the HU values listed in Table 1 were estimated using the CT data with contrast in the present study.
3 Estimation of tissue composition from CT images of neuroblastoma
The problem we propose to investigate is quantitative analysis of the primary mmour mass, in patients with neuroblastoma, using CT examinations. The methodology designed includes a statistical parametric model for the tissue composition of the tumour and a method to estimate the parameters of the model. Segmentation of the tumour was performed manually by a radiologist (G. S. Boag) in the present pilot study. The histogram of the tumour mass was computed from the segmented regions over all applicable CT image slices. The statistical model employed was the Gaussian mixture model (BISHOP, 1995), and the algorithm for parameter estimation was the expectation- maximisation (EM) algorithm (JAIN et al., 2000).
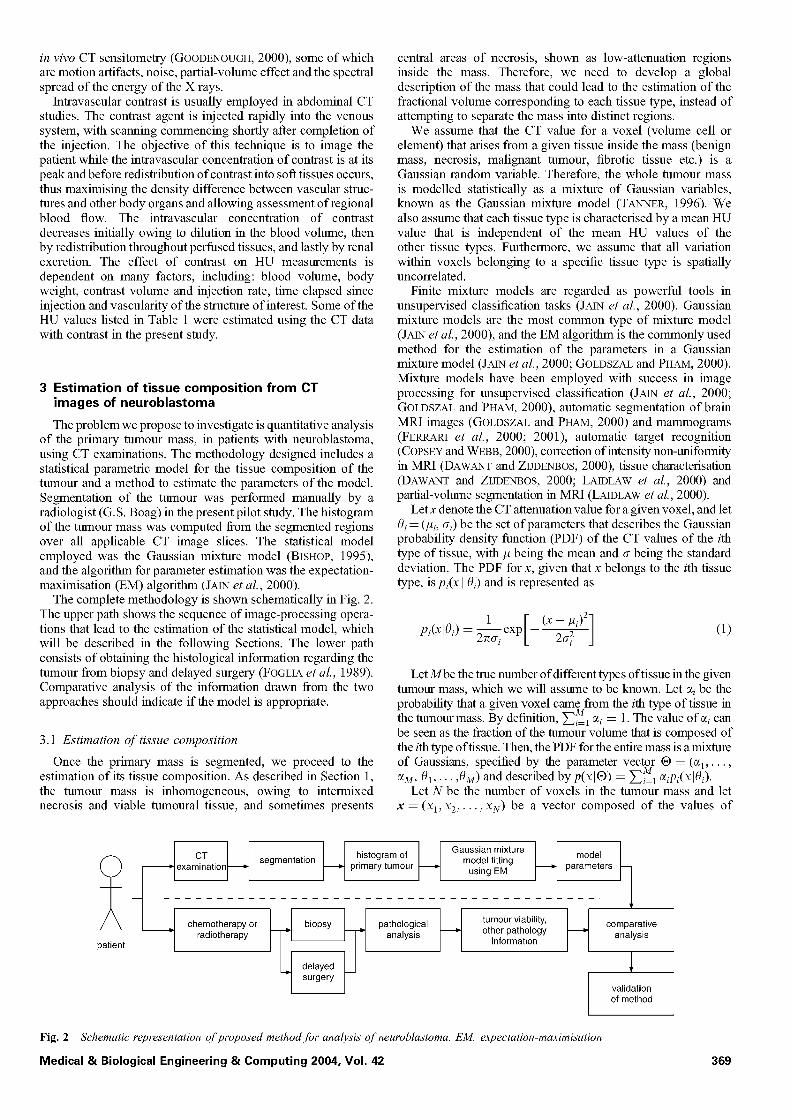
The complete methodology is shown schematically in Fig. 2. The upper path shows the sequence of image-processing opera- tions that lead to the estimation of the statistical model, which will be described in the following Sections. The lower path consists of obtaining the histological information regarding the tumour from biopsy and delayed surgery (FOGLIA et al., 1989). Comparative analysis of the information drawn from the two approaches should indicate if the model is appropriate.
3.1 Est imation o f tissue composit ion
Once the primary mass is segmented, we proceed to the estimation of its tissue composition. As described in Section 1, the tumour mass is inhomogeneous, owing to intermixed necrosis and viable tumoural tissue, and sometimes presents
central areas of necrosis, shown as low-attenuation regions inside the mass. Therefore, we need to develop a global description of the mass that could lead to the estimation of the fractional volume corresponding to each tissue type, instead of attempting to separate the mass into distinct regions.
We assume that the CT value for a voxel (volume cell or element) that arises from a given tissue inside the mass (benign mass, necrosis, malignant mmour, fibrotic tissue etc.) is a Gaussian random variable. Therefore, the whole mmour mass is modelled statistically as a mixture of Gaussian variables, known as the Gaussian mixture model (TANNER, 1996). We also assume that each tissue type is characterised by a mean HU value that is independent of the mean HU values of the other tissue types. Furthermore, we assume that all variation within voxels belonging to a specific tissue type is spatially uncorrelated.
Finite mixture models are regarded as powerful tools in unsupervised classification tasks (JAIN et al., 2000). Gaussian mixture models are the most common type of mixture model (JAIN et al., 2000), and the EM algorithm is the commonly used method for the estimation of the parameters in a Gaussian mixture model (JAIN et al., 2000; GOLDSZAL and PHAM, 2000). Mixture models have been employed with success in image processing for unsupervised classification (JAIN et al., 2000; GOLDSZAL and PHAM, 2000), automatic segmentation of brain MRI images (GOLDSZAL and PHAM, 2000) and mammograms (FERRARI et al., 2000; 2001), automatic target recognition (COPSEY and WEBB, 2000), correction of intensity non-unifolmity in Mill (DAWANT and ZlJDENBOS, 2000), tissue characterisation (DAWANT and ZlJDENBOS, 2000; LAIDLAW et al., 2000) and partial-volume segmentation in MRI (LAIDLAW et al., 2000).
Let x denote the CT attenuation value for a given voxel, and let Oi = (#i, ~ri) be the set of parameters that describes the Gaussian probability density function (PDF) of the CT values of the ith type of tissue, with # being the mean and o- being the standard deviation. The PDF for x, given that x belongs to the ith tissue type, is pi(x l Oi) and is represented as
1 F (x pi(xIOi) = _------- exp l - - # i ) !
)-1
L J (1)
Let Mbe the true number o fdifferent types of tissue in the given mmour mass, which we will assume to be known. Let ei be the probability that a given voxel came from the ith type of tissue in the tumour mass. By definition, ~ M 1 ~i = 1. The value of~i can be seen as the fraction of the tumour volume that is composed of the ith type of tissue. Then, the PDF for the entire mass is a mixture of Gaussians, specified by the parameter vector ® = (el , - - - , aM, 01 , . . . ,OM) and described by p(x[®) = ~ 1 ~iPi(x[Oi) •
Let N be the number of voxels in the tumour mass and let x = (x 1, x2 , . . . , xN) be a vector composed of the values of
patient
~ examination histogram of [ Gaussian mixture model / Ct [ segmentation ' l primarytumour _?o?e/fit2in2_ - parameters
[ . . . . . . ~ using EM
cam°tara °r °s I radiotherapy
delayed surgery
pathological tumour viability comparative analysis * other pathology =
information analysis
validation of method
Fig. 2 Schematic representation of proposed method for analysis o f neuroblastoma. EM: expectation-maximisation
Medical & Biological Engineering & Computing 2004, Vol. 42 369
the voxels, which we will call the observed data. Under the condition of the observed data, the posterior probability of the parameters is obtained by Bayes rule (BISHOP, 1995) as
p(®)p(xl®) p ( ® l x ) - (2)
p(x)
Here, p(x) is the probability of the data, regardless of the parameters; because the estimation problem is conditional upon the observed data, p(x) is a constant term. The term p(®) is the prior probability of the vector of parameters ®. The term p(x]®) is called the likelihood of ®, denoted by L(®lx) and given by
and the M-step simultaneously. For the ith tissue type, the update equations are
1 X O~ new = ~ iZ_l P(ilxj '®°ld)
N • old new ~]=1 xj pOIxj,® )
~N=lP(ilxj,®°Zd )
~ ~ j N 1 (Xj -- #7~W)2p(ilx2,® TM) (Tnew = N • old
~]=lp(zlx2,® )
N L(®lx) ~p(x l®) = ]--[p(xjl®)
j=l (3)
In the case that we do not have any prior belief about ®, i.e. if we do not know anything about its prior probability, we have the situation known as af la t prior (TANNER, 1996). in this case, (2) becomes p(®lx) = cp(xl®), where c is a normalising constant. Thus finding the most probable value of ® given the data, without any prior knowledge about the PDF of the parameters, is the same as finding the value o f® that maximises the likelihood, or the log-likelihood defined as log [L(®lx)]: this is the maximum likelihood (ME) principle (BISHOP, 1995; TANNER, 1996). The adoption of this principle leads to simplified calculations with reasonable results (DAWANT and ZIJDENBOS, 2000).
Regardless of the use of the flat-prior assumption, the histogram of the mass on hand constrains the range of possible values for the vector ® in the estimation procedure, if, however, information were to be available from other sources regarding the presence or absence of certain tissue types, along with the prior probabilities of their mean and standard deviation, the estimation procedure could be further constrained. Fully Bayesian approaches for parameter estimation can provide better performance, at the expense of greater computational requirements and increased complexity of implementation (COPSEY and WEBB, 2000; RICHARDSON and GREEN, 1997).
To maximise the likelihood, we use the EM algorithm (TANNER, 1996; MENG and VAN DYK, 1997; DAWANT and ZIJDENBOS, 2000; JAIN et al., 2000; BISHOP, 1995). The EM algorithm is an iterative procedure that starts with an initial guess ®g of the parameters and iteratively improves the estimate toward the local maximum of the likelihood. The generic EM algorithm is comprised of two steps: the expectation step (or E-step) and the maximisation step (or M-step). In the E-step, we compute the parametric probability model given the current estimate of the parameter vector, in the M-step, we find the parameter vector that maximises the newly calculated model, which is then treated as the new best estimate of the parameters. The iterative procedure continues until some stopping condition is met, e.g. the difference log[L(®~+llX)]- log[L(®~lx)] or the modulus I®~+l- ®~l of the difference vector between successive iterations n and n + 1 is smaller than a predefined value.
For each tissue type i, let us define p(ilxj,®) as the probability that thejth voxel, whose value is xj, belongs to the ith tissue type. This can be calculated using Bayes rule as
p(il®) p(xjli,®) _ ~, pi(xjlOi) p(ilxj,®) = p(xjl®) p(xjl®)
3.2 Parameter selection and initialisation
To estimate the value of M, i.e. the number of types of tissue in the mass, we cannot model M as a random variable and directly apply the ML principle, because the maximum likelihood o f® is a non-decreasing function o fM (JAIN et al., 2000). The estimated value of M should be the value that minimises a cost function that penalises higher values of M. The common choice for such a cost function is the minimum description length (MDL) criterion (JAIN et al., 2000). FERRARI et al., (2000; 2001) successfully used the MDL criterion to find the number of Gaussian kernels in a Gaussian mixture model, in the context of segmenting the fibro-glandular disc in mammograms. However, our experiments showed that is it not appropriate to use the MDL criterion in the present work, because the Gaussian kernels we wish to identify overlap significantly in the HU domain.
The mmour bulk in neuroblastoma commonly contains up to three different tissue components: low-attenuation necrotic tissue, intermediate-attenuation viable tumour and high-attenuation calcified tissue. The relative quantity of each of these tissue types varies from mmour to mmour. Although the typical mean HU and standard deviation values of these types of tissue are known (as shown in Table 1), the statistics of the tissue types could vary from one imaging system to another, depend upon the imaging protocol (including the use of contrast agents) and be influenced by the partial-volume effect, it should also be noted that the ranges of HU values of necrotic tissue, viable tumour and several abdominal organs overlap. For these reasons, it would be inappropriate to use fixed bands of HU values to analyse the density distribution of a given tumour mass. The same reasons make it inappropriate to use fixed initial values for the EM algorithm. In the present work, the EM algorithm was initialised with three mean values (M= 3) computed as the mean of the histogram of the mmour, and the mean-4- one-half of the standard deviation of the histogram. The variance of all three Gaussians was initialised to the variance of the histogram of the mmour.
4 Results
Ten CT examinations of four patients with Stage 3 neuro- blastoma were obtained from the records at the Alberta Children's Hospital, Calgary, Alberta, Canada, for this pilot study. Tumour outlines were manually drawn on the images by a radiologist (G.S. Boag). Each patient had had an initial CT scan to assess the state of the disease prior to chemotherapy. Two patients had follow-up CT examinations during treatment. All patients had a presurgical CT examination. After surgical resection, the mmour masses were analysed by a pathologist.
4.1 Case 1
The derivation of the EM algorithm for the Gaussian mixture model leads to a set ofiterative equations that perform the E-step
370
The two-year-old male patient had an initial diagnostic CT scan in April 2001 (labelled examination la; see Fig. 3a). The patient
Medical & Biological Engineering & Computing 2004, Vol. 42
a b
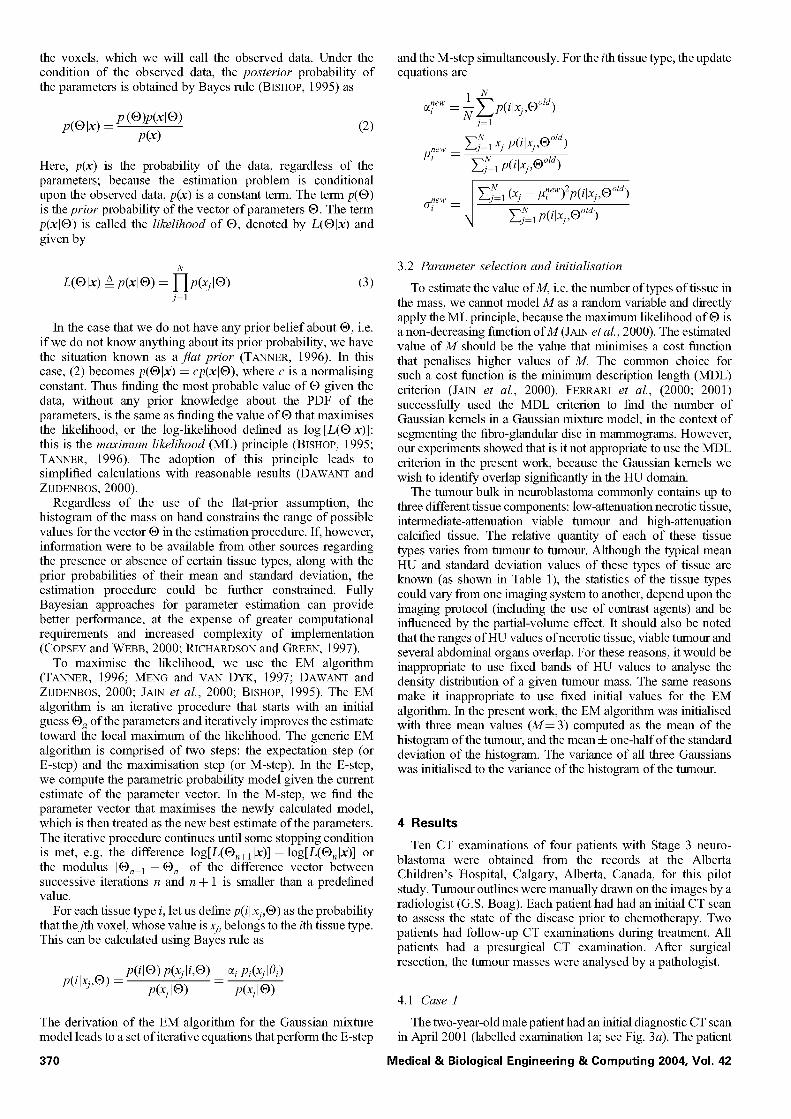
Fig. 3 (a) Initial diagnostic CT image o f case 1, examination la (April 2001). (b) Intermediate follow-up CT image o f case 1, examination lb (June 2001). (c 9 Presurgical CT image o f case 1, examination l c (September 2001). Contours" o f tumour mass drawn by a radiologist (G.S. Boag) are also shown. Images" display CT slices" with largest sectional area o f tumour in each examination
had a follow-up CT scan in June 2001 (labelled examination lb; see Fig. 3b) and a presurgical CT scan in September 2001 (labelled examination lc; see Fig. 3c). Surgical resection of the tumour was performed in September 2001. Pathological analysis showed extensive necrosis and dystrophic calcification.
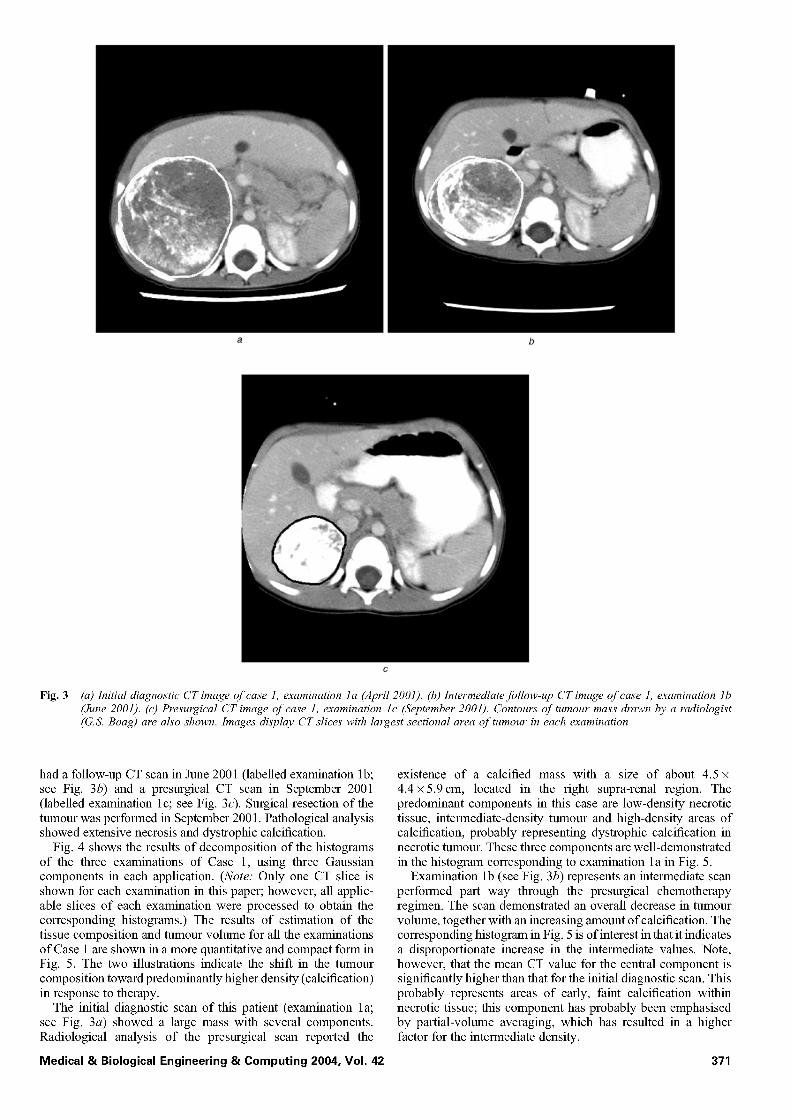
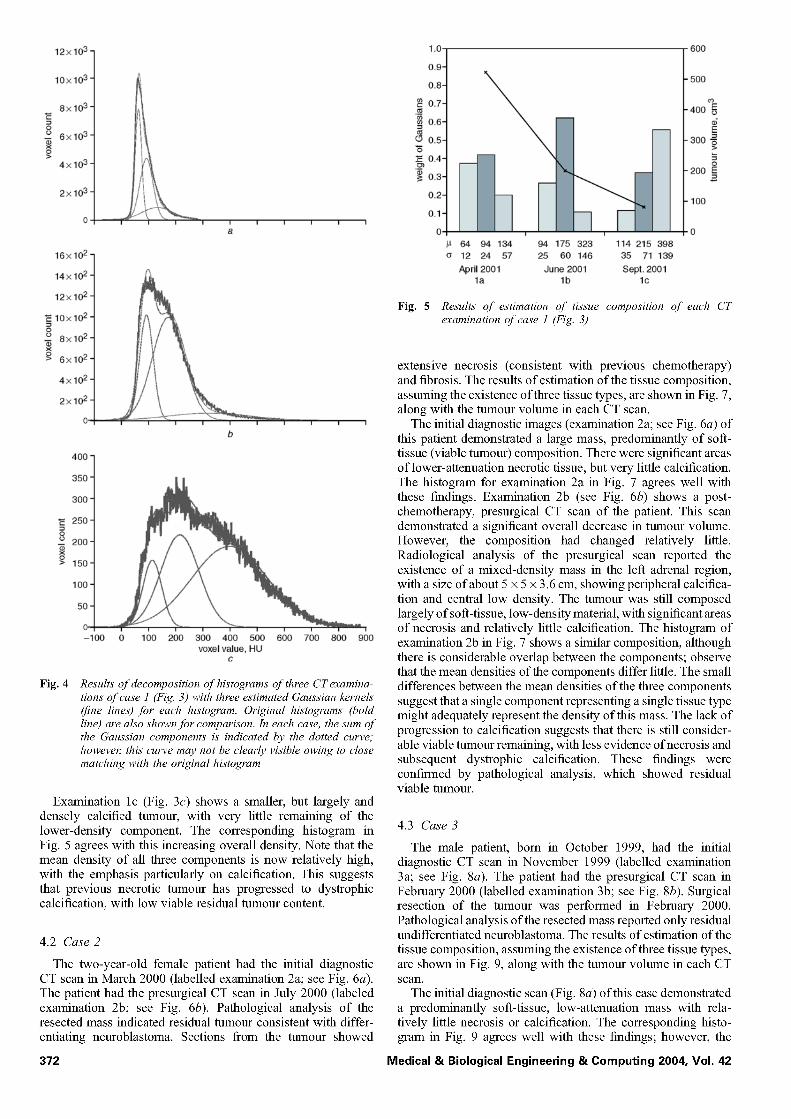
Fig. 4 shows the results of decomposition of the histograms of the three examinations of Case 1, using three Gaussian components in each application. (Note: Only one CT slice is shown for each examination in this paper; however, all applic- able slices of each examination were processed to obtain the corresponding histograms.) The results of estimation of the tissue composition and mmour volume for all the examinations of Case 1 are shown in a more quantitative and compact form in Fig. 5. The two illustrations indicate the shift in the tumour composition toward predominantly higher density (calcification) in response to therapy.
The initial diagnostic scan of this patient (examination la; see Fig. 3a) showed a large mass with several components. Radiological analysis of the presurgical scan reported the
Medical & Biological Engineering & Computing 2004, Vol. 42
existence of a calcified mass with a size of about 4.5 x 4.4 x5.9cm, located in the right supra-renal region. The predominant components in this case are low-density necrotic tissue, intermediate-density tumour and high-density areas of calcification, probably representing dystrophic calcification in necrotic mmour. These three components are well-demonstrated in the histogram corresponding to examination la in Fig. 5.
Examination lb (see Fig. 3b) represents an intermediate scan performed part way through the presurgical chemotherapy regimen. The scan demonstrated an overall decrease in mmour volume, together with an increasing amount of calcification. The corresponding histogram in Fig. 5 is of interest in that it indicates a disproportionate increase in the intermediate values. Note, however, that the mean CT value for the central component is significantly higher than that for the initial diagnostic scan. This probably represents areas of early, faint calcification within necrotic tissue; this component has probably been emphasised by partial-volume averaging, which has resulted in a higher factor for the intermediate density.
371
12x103.
10x103"
8x10³- 'E
_o 6x10³ .
>o 4x10³-
2x10³-
i i i i
16x102-
14x102-
12x102-
'E 10x102"
_o 8x10².
>o 6x10².
4x10²-
2x10²-
C ~ 1 ~ , , ~ , , '--i-
400 1
350 1
300 1
iii t laO 1 1111
-100 ; 100 200 3;0 400 5;0 6;0 7;0 800 900 voxel value, HU
c
Fig. 4 Results o f decomposition o f histograms of three CT examina- tions of case 1 (Fig. 3) with three estimated Gaussian kernels (fine lines) for each histogram. Original histograms (bold line) are also shown for comparison. In each case, the sum of the Gaussian components is indicated by the dotted curve; howeve~ this curve may not be clearly visible owing to close matching with the original histogram
Examination lc (Fig. 3c) shows a smaller, but largely and densely calcified tumour, with very little remaining of the lower-density component. The corresponding histogram in Fig. 5 agrees with this increasing overall density. Note that the mean density of all three components is now relatively high, with the emphasis particularly on calcification. This suggests that previous necrotic tumour has progressed to dystrophic calcification, with low viable residual tumour content.
4.2 Case 2
The two-year-old female patient had the initial diagnostic CT scan in March 2000 (labelled examination 2a; see Fig. 6a). The patient had the presurgical CT scan in July 2000 (labeled examination 2b; see Fig. 6b). Pathological analysis of the resected mass indicated residual tumour consistent with differ- entiating neuroblastoma. Sections from the tumour showed
372
1.0
0.9-
0.8-
0.7- ._
0.6-
0.5-
0.4-
~ 0.3-
0.2-
0.1-
i
64 94 134 12 24 57 April2001
l a
94 175 323 25
June 2001
m
\
114 215 398 60 146 35 71 139
Sept. 2001 lb l c
600
- 500
03
- 400 o E
- - E
- 300 o
- 200 =o
- 100
0
Fig. 5 Results o f estimation of tissue composition o f each CT examination of case 1 (Fig. 3)
extensive necrosis (consistent with previous chemotherapy) and fibrosis. The results of estimation of the tissue composition, assuming the existence of three tissue types, are shown in Fig. 7, along with the tumour volume in each CT scan.
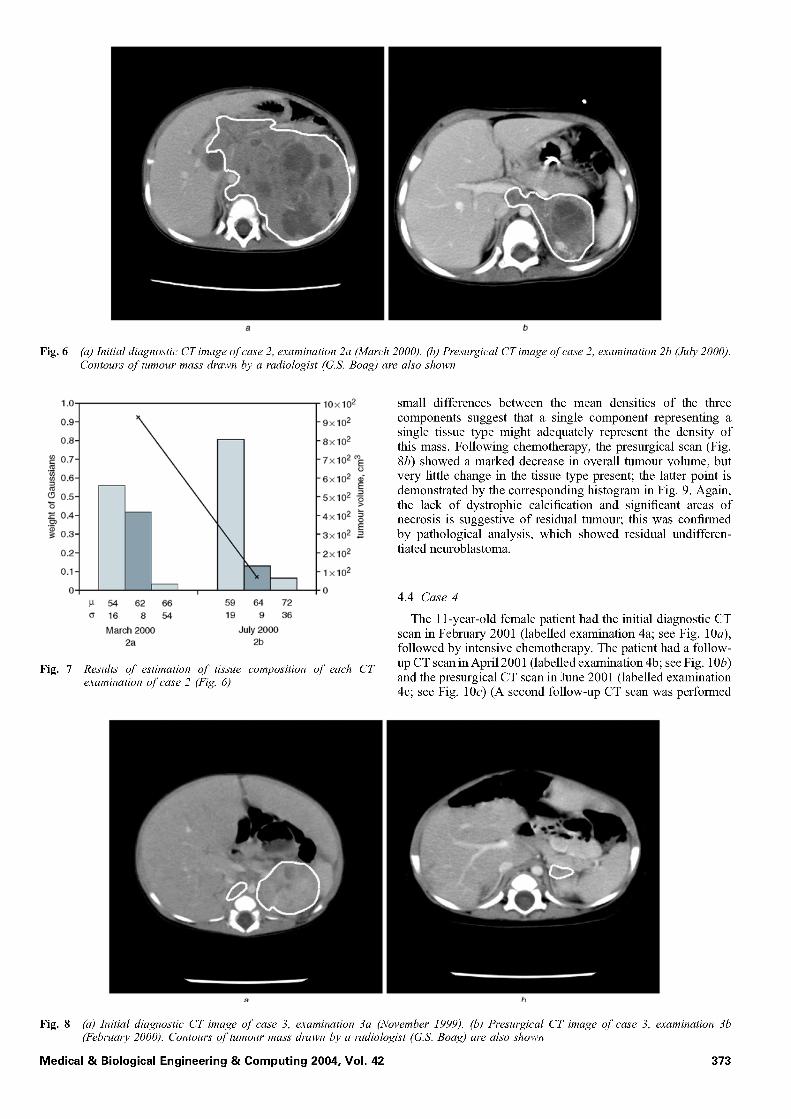
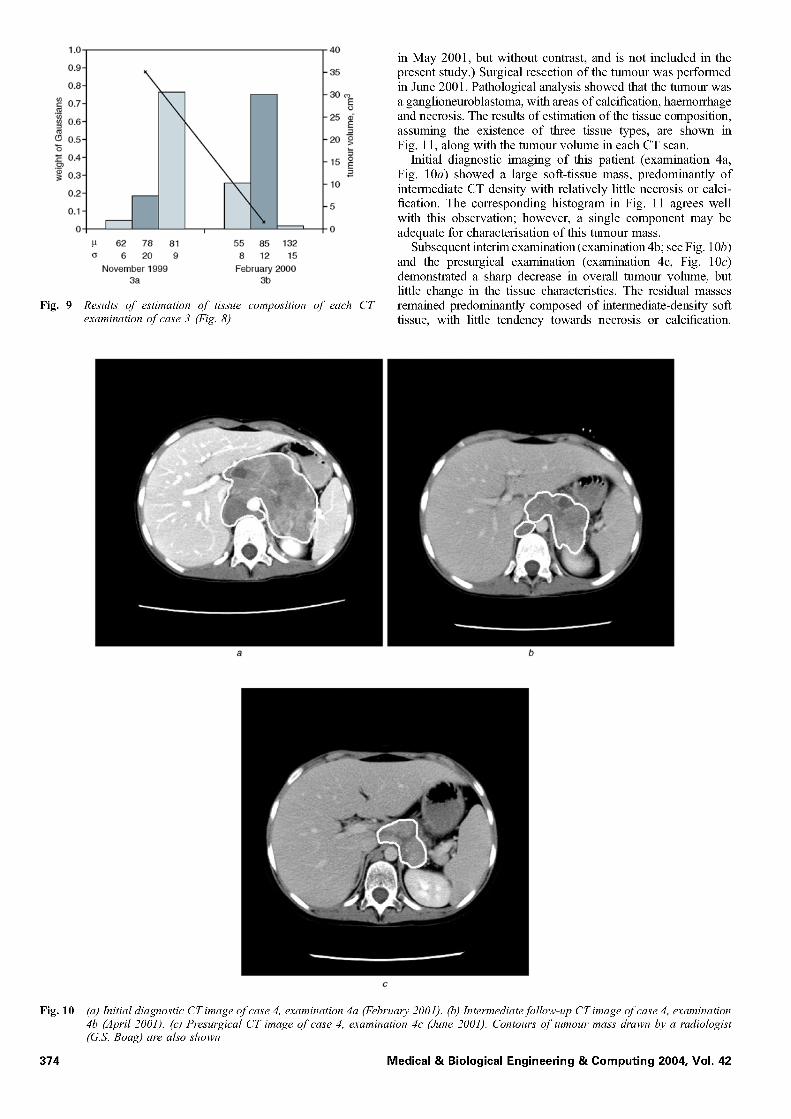
The initial diagnostic images (examination 2a; see Fig. 6a) of this patient demonstrated a large mass, predominantly of soft- tissue (viable tumour) composition. There were significant areas of lower-attenuation necrotic tissue, but very little calcification. The histogram for examination 2a in Fig. 7 agrees well with these findings. Examination 2b (see Fig. 6b) shows a post- chemotherapy, presurgical CT scan of the patient. This scan demonstrated a significant overall decrease in tumour volume. However, the composition had changed relatively little. Radiological analysis of the presurgical scan reported the existence of a mixed-density mass in the left adrenal region, with a size of about 5 × 5 × 3.6 cm, showing peripheral calcifica- tion and central low density. The tumour was still composed largely of soft-tissue, low-density material, with significant areas of necrosis and relatively little calcification. The histogram of examination 2b in Fig. 7 shows a similar composition, although there is considerable overlap between the components; observe that the mean densities of the components differ little. The small differences between the mean densities of the three components suggest that a single component representing a single tissue type might adequately represent the density of this mass. The lack of progression to calcification suggests that there is still consider- able viable tumour remaining, with less evidence of necrosis and subsequent dystrophic calcification. These findings were confirmed by pathological analysis, which showed residual viable tumour.
4.3 Case 3
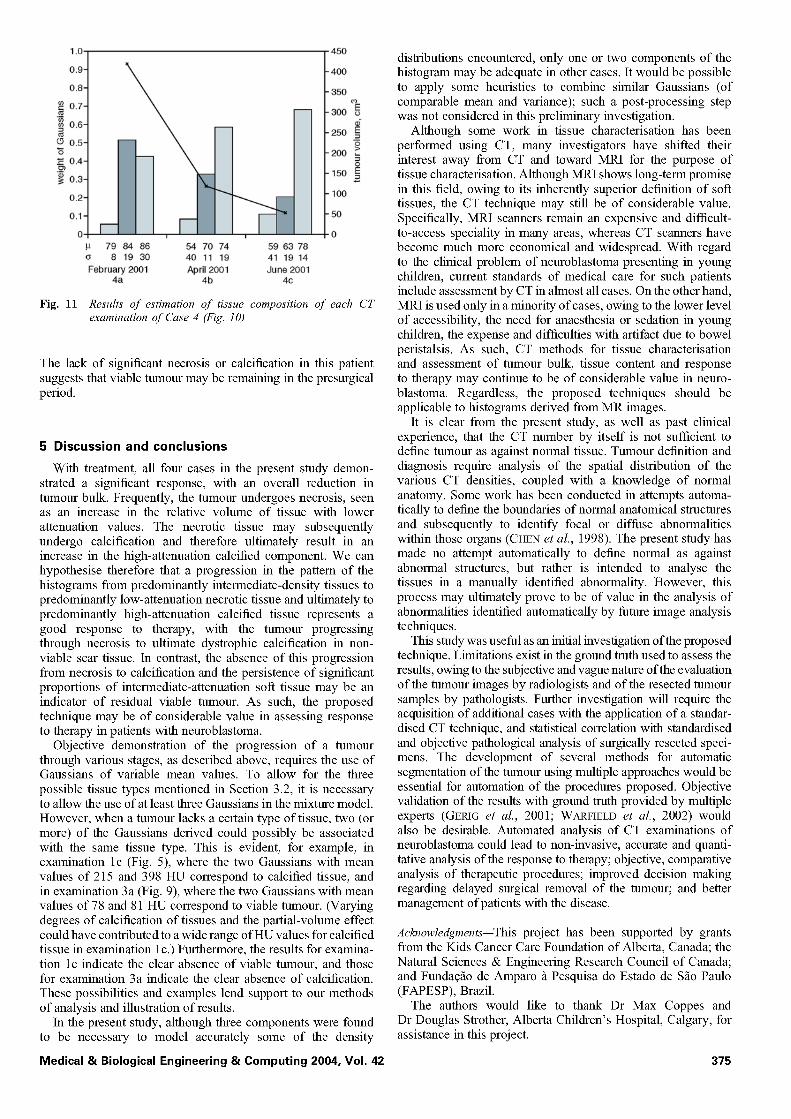
The male patient, born in October 1999, had the initial diagnostic CT scan in November 1999 (labelled examination 3a; see Fig. 8a). The patient had the presurgical CT scan in February 2000 (labelled examination 3b; see Fig. 8b). Surgical resection of the tumour was performed in February 2000. Pathological analysis of the resected mass reported only residual undifferentiated neuroblastoma. The results of estimation of the tissue composition, assuming the existence of three tissue types, are shown in Fig. 9, along with the tumour volume in each CT scan.
The initial diagnostic scan (Fig. 8a) of this case demonstrated a predominantly soft-tissue, low-attenuation mass with rela- tively little necrosis or calcification. The corresponding histo- gram in Fig. 9 agrees well with these findings; however, the
Medical & Biological Engineering & Computing 2004, Vol. 42
1 . 0 -
a b
(a) Initial diagnostic CT image o f case 2, examination 2a (March 2000). (b) Presurgical CT image of case 2, examination 2b (July 2000). Contours of tumour mass drawn by a radiologist (G.S. Boag) are also shown
0.9-
0.8-
0 . 7 -
"~ 0.6-
(~ 0.5-
~ 0.4-
"~ 0.3-
0.2-
0.1-
O-
Fig. 7
54 62 66 59 64 72 16 8 54 19 9 36
March 2000 July 2000 2a 2b
• lOx 102
Fig. 6
-9x10²
-8x10²
"7x10² ~
-6x10² d E
"5x10² ~
"4×10 2 ~
• 3×10 2 ~
-2×10 2
- l x 1 0 2
"0
Results of estimation of tissue composition of each CT examination of case 2 (Fig. 6)
small differences between the mean densities of the three components suggest that a single component representing a single tissue type might adequately represent the density of this mass. Following chemotherapy, the presurgical scan (Fig. 8b) showed a marked decrease in overall tumour volume, but very little change in the tissue type present; the latter point is demonstrated by the corresponding histogram in Fig. 9. Again, the lack of dystrophic calcification and significant areas of necrosis is suggestive of residual tumour; this was confirmed by pathological analysis, which showed residual undifferen- tiated neuroblastoma.
4.4 Case 4
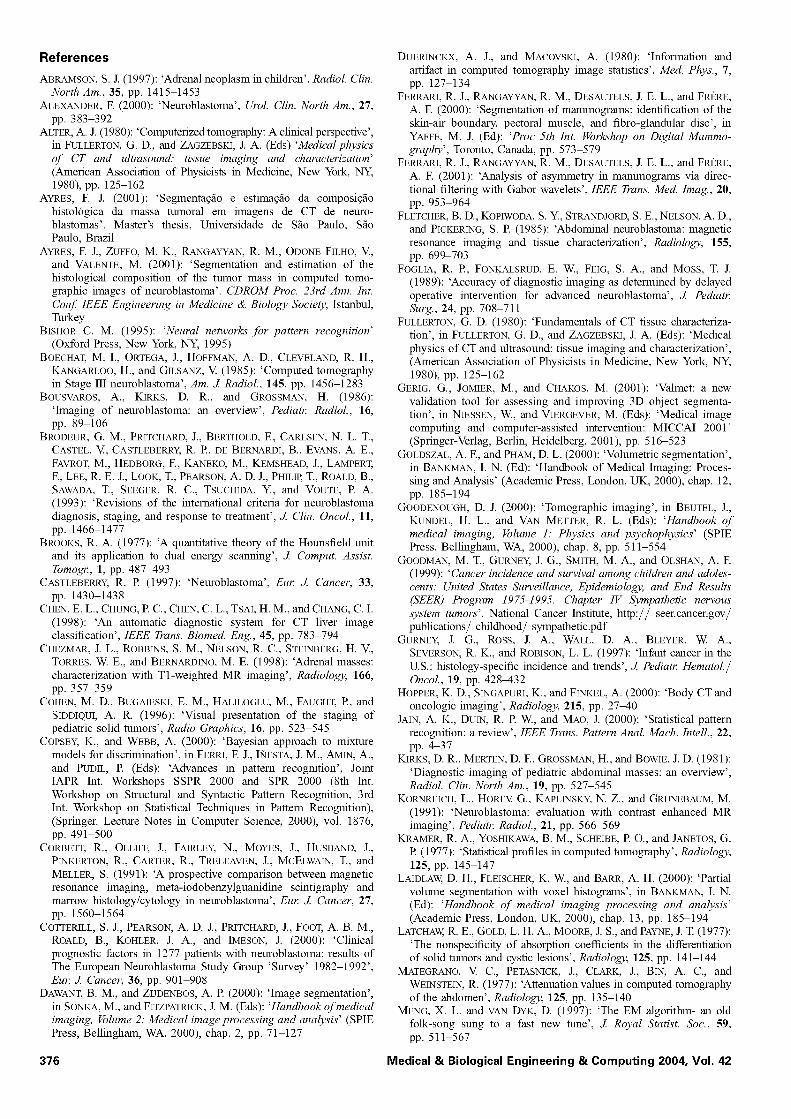
The 11-year-old female patient had the initial diagnostic CT scan in February 2001 (labelled examination 4a; see Fig. 10a), followed by intensive chemotherapy. The patient had a follow- up CT scan in April 2001 (labelled examination 4b; see Fig. 10b) and the presurgical CT scan in June 2001 (labelled examination 4c; see Fig. 10c) (A second follow-up CT scan was performed
a b
Fig. 8 (a) Initial diagnostic CT image o f case 3, examination 3a (November 1999). (b) Presurgical CT image of case 3, examination 3b (February 2000). Contours of tumour mass drawn by a radiologist (G.S. Boag) are also shown
Medical & Biological Engineering & Comput ing 2004, Vol. 42 373
1.0
0.9-
0.8-
0.7- ._
0.6-
0.5- "5 .~ 0.4- ._~ .~ 0.3-
0.2-
0.1
0
P
G
Fig. 9
40
r m 62 78 81
6 20 9
November 1999 3a
\ X
\ i
55 85 132 8 12 15
February 2000 3b
35
30
25 ¢" E _=
20 ~
15 ~
10
Results o f estimation o f tissue composition o f each CT examination o f case 3 (Fig. 8)
in May 2001, but without contrast, and is not included in the present study.) Surgical resection of the tumour was performed in June 2001. Pathological analysis showed that the tumour was a ganglioneuroblastoma, with areas of calcification, haemorrhage and necrosis. The results of estimation of the tissue composition, assuming the existence of three tissue types, are shown in Fig. 11, along with the tumour volume in each CT scan.
Initial diagnostic imaging of this patient (examination 4a, Fig. 10a) showed a large soft-tissue mass, predominantly of intermediate CT density with relatively little necrosis or calci- fication. The corresponding histogram in Fig. 11 agrees well with this observation; however, a single component may be adequate for characterisation of this tumour mass.
Subsequent interim examination (examination 4b; see Fig. 10b) and the presurgical examination (examination 4c, Fig. 10c) demonstrated a sharp decrease in overall tumour volume, but little change in the tissue characteristics. The residual masses remained predominantly composed of intermediate-density soft tissue, with little tendency towards necrosis or calcification.
a b
Fig. 10 (a) Initial diagnostic CT image o f case 4, examination 4a (February 2001). (b) Intermediate follow-up CT image o f case 4, examination 4b (April 2001). (c 9 Presurgical CT image o f case 4, examination 4c (June 2001). Contours o f tumour mass drawn by a radiologist (G.S. Boag) are also shown
374 Medical & Biological Engineering & Computing 2004, Vol. 42
1.0
0.9
0.8
0.7
~ 0.6
(3 0.5 "5
0.4
"~ 0 .3
0 .2
O l o
79 84 86 54 70 8 19 30
February 2001 4a
74 59 63 78 4 0 11 19 41 19 14 April2001 June 2001
4b 4c
450
- 400
350
- - 300 ~o E
250 _E
200
150 _E
100
50
0
Fig. 11 Results" of estimation of tissue composition of each CT examination of Case 4 (Fig. 10)
The lack of significant necrosis or calcification in this patient suggests that viable tumour may be remaining in the presurgical period.
5 Discussion and conclusions
With treatment, all four cases in the present study demon- strated a significant response, with an overall reduction in tumour bulk. Frequently, the mmour undergoes necrosis, seen as an increase in the relative volume of tissue with lower attenuation values. The necrotic tissue may subsequently undergo calcification and therefore ultimately result in an increase in the high-attenuation calcified component. We can hypothesise therefore that a progression in the pattern of the histograms from predominantly intermediate-density tissues to predominantly low-attenuation necrotic tissue and ultimately to predominantly high-attenuation calcified tissue represents a good response to therapy, with the tumour progressing through necrosis to ultimate dystrophic calcification in non- viable scar tissue, in contrast, the absence of this progression from necrosis to calcification and the persistence of significant proportions of intermediate-attenuation soft tissue may be an indicator of residual viable mmour. As such, the proposed technique may be of considerable value in assessing response to therapy in patients with neuroblastoma.
Objective demonstration of the progression of a tumour through various stages, as described above, requires the use of Gaussians of variable mean values. To allow for the three possible tissue types mentioned in Section 3.2, it is necessary to allow the use of at least three Gaussians in the mixture model. However, when a mmour lacks a certain type of tissue, two (or more) of the Gaussians derived could possibly be associated with the same tissue type. This is evident, for example, in examination lc (Fig. 5), where the two Gaussians with mean values of 215 and 398 HU correspond to calcified tissue, and in examination 3a (Fig. 9), where the two Gaussians with mean values of 78 and 81 HU correspond to viable tumour. (Varying degrees of calcification of tissues and the partial-volume effect could have contributed to a wide range of HU values for calcified tissue in examination lc.) Furthermore, the results for examina- tion lc indicate the clear absence of viable mmour, and those for examination 3a indicate the clear absence of calcification. These possibilities and examples lend support to our methods of analysis and illustration of results.
in the present study, although three components were found to be necessary to model accurately some of the density
Medical & Biological Engineering & Computing 2004, Vol. 42
distributions encountered, only one or two components of the histogram may be adequate in other cases, it would be possible to apply some heuristics to combine similar Gaussians (of comparable mean and variance); such a post-processing step was not considered in this preliminary investigation.
Although some work in tissue characterisation has been performed using CT, many investigators have shifted their interest away from CT and toward MRI for the purpose of tissue characterisation. Although MRI shows long-term promise in this field, owing to its inherently superior definition of soft tissues, the CT technique may still be of considerable value. Specifically, MRI scanners remain an expensive and difficult- to-access speciality in many areas, whereas CT scanners have become much more economical and widespread. With regard to the clinical problem of neuroblastoma presenting in young children, current standards of medical care for such patients include assessment by CT in almost all cases. On the other hand, MRI is used only in a minority of cases, owing to the lower level of accessibility, the need for anaesthesia or sedation in young children, the expense and difficulties with artifact due to bowel peristalsis. As such, CT methods for tissue characterisation and assessment of mmour bulk, tissue content and response to therapy may continue to be of considerable value in neuro- blastoma. Regardless, the proposed techniques should be applicable to histograms derived from MR images.
it is clear from the present study, as well as past clinical experience, that the CT number by itself is not sufficient to define mmour as against normal tissue. Tumour definition and diagnosis require analysis of the spatial distribution of the various CT densities, coupled with a knowledge of normal anatomy. Some work has been conducted in attempts automa- tically to define the boundaries of normal anatomical structures and subsequently to identify focal or diffuse abnormalities within those organs (CHEN et al., 1998). The present study has made no attempt automatically to define normal as against abnormal structures, but rather is intended to analyse the tissues in a manually identified abnormality. However, this process may ultimately prove to be of value in the analysis of abnormalities identified automatically by furore image analysis techniques.
This study was useful as an initial investigation of the proposed technique. Limitations exist in the ground truth used to assess the results, owing to the subjective and vague nature of the evaluation of the tumour images by radiologists and of the resected tumour samples by pathologists. Further investigation will require the acquisition of additional cases with the application of a standar- dised CT technique, and statistical correlation with standardised and objective pathological analysis of surgically resected speci- mens. The development of several methods for automatic segmentation of the tumour using multiple approaches would be essential for automation of the procedures proposed. Objective validation of the results with ground truth provided by multiple experts (GERIG et al., 2001; WARFIELD et al., 2002) would also be desirable. Automated analysis of CT examinations of neuroblastoma could lead to non-invasive, accurate and quanti- tative analysis of the response to therapy; objective, comparative analysis of therapeutic procedures; improved decision making regarding delayed surgical removal of the tumour; and better management of patients with the disease.
Acknowledgments--This project has been supported by grants from the Kids Cancer Care Foundation of Alberta, Canada; the Natural Sciences & Engineering Research Council of Canada; and Fundag~o de Amparo//Pesquisa do Estado de S~o Paulo (FAPESP), Brazil.
The authors would like to thank Dr Max Coppes and Dr Douglas Strother, Alberta Children's Hospital, Calgary, for assistance in this project.
375
References
ABRAMSON, S. J. (1997): 'Adrenal neoplasm in children', Radio/. C/in. North Am., 35, pp. 1415-1453
ALEXANDER, E (2000): 'Neuroblastoma', Urol. Clin. North Am., 27, pp. 383-392
ALTER, A. J. (1980): 'Computerized tomography: A clinical perspective', in FULLERTON, G. D., and ZAGZEBSKI, J. A. (Eds) 'Medical physies of CT and ultrasound: tissue imaging and characterization' (American Association of Physicists in Medicine, New York, NY, 1980), pp. 125-162
AYRES, F. J. (2001): 'Segmenta~fio e estima~fio da composi~fio histoldgica da massa tumoral em imagens de CT de neuro- blastomas'. Master's thesis, Universidade de Silo Paulo, S~o Paulo, Brazil
AYRES, E J., ZUFFO, M. K., RANGAYYAN, R. M., ODONE FILHO, V., and VALENTE, M. (2001): 'Segmentation and estimation of the histological composition of the tumor mass in computed tomo- graphic images of neuroblastoma'. CDROM Proc. 23rd Ann. Int. Conf IEEE Engineering in Medicine & Biology Society, Istanbul, Turkey
BISHOP, C. M. (1995): 'Neural networks" for pattern recognition' (Oxford Press, New York, NY, 1995)
BOECHAT, M. I., ORTEGA, J., HOFFMAN, A. D., CLEVELAND, R. H., KANGARLOO, H., and GILSANZ, V (1985): 'Computed tomography in Stage III neuroblastoma', Am. J. Radiol., 145, pp. 1456-1283
BOUSVAROS, A., KIRKS, D. R., and GROSSMAN, H. (1986): 'Imaging of neuroblastoma: am overview', Pediat~ Radiol., 16, pp. 89-106
BRODEUR, G. M., PRITCHARD, J., BERTHOLD, E, CARLSEN, N. L. T., CASTEL, V, CASTLEBERRY, R. R, DE BERNARDI, B., EVANS, A. E., FAVROT, M., HEDBORG, E, KANEKO, M., KEMSHEAD, J., LAMPERT, E, LEE, R. E. J., LOOK, T., PEARSON, A. D. J., PHILIP, T., ROALD, B., SAWADA, T., SEEGER, R. C., TSUCHIDA, Y., and VOUTE, P. A. (1993): 'Revisions of the international criteria for neuroblastoma diagnosis, staging, and response to treatment', J. Clin. Oncol., 11, pp. 1466-1477
BROOKS, R. A. (1977): 'A quantitative theory of the Hounsfield unit and its application to dual energy scalming', J Comput. Assist. Tomog~, 1, pp. 487-493
CASTLEBERRY, e. P. (1997): 'Neuroblastoma', Eu~ J. Cancer, 33, pp. 1430-1438
CHEN, E. L., CHUNG, P. C., CHEN, C. L., TSAI, H. M., and CHANG, C. I. (1998): 'An automatic diagnostic system for CT liver image classification', IEEE Trans. Biomed. Eng., 45, pp. 783-794
CHEZMAR, J. L., ROBBINS, S. M., NELSON, R. C., STEINBERG, H. V., TORRES, W. E., and BERNARDrNO, M. E. (1998): 'Adrenal masses: characterization with Tl-weighted MR imaging', Radiology, 166, pp. 357-359
COHEN, M. D., BUGAIESKI, E. M., HALILOGLU, M., FAUGHT, P., and SIDDIQUI, A. R. (1996): 'Visual presentation of the staging of pediatric solid tumors', Radio Graphics', 16, pp. 523-545
COPSEY, K., and WEBB, A. (2000): 'Bayesian approach to mixture models for discrimination', in FERRI, E J., IIqESTA, J. M., AMIN, A., and PUDIL, R (Eds): 'Advances in pattern recognition', Joint IAPR Int. Workshops SSPR 2000 and SPR 2000 (8th Int. Workshop on Structural and Syntactic Pattern Recognition, 3rd Int. Workshop on Statistical Techniques in Pattern Recognition), (Springer. Lecture Notes in Computer Science, 2000), vol. 1876, pp. 491-500
CORBETT, e., OLLIFF, J., FAIRLEY, N., MOYES, J., HUSBAND, J., PINKERTON, R., CARTER, R., TRELEAVEN, J., MCELWAIN, T., and MELLER, S. (1991): 'A prospective comparison between magnetic resonance imaging, meta-iodobenzylguanidine scintigraphy and marrow histology/cytology in neuroblastoma', Eu~ J. Cancer, 27, pp. 1560-1564
COTTERILL, S. J., PEARSON, A. D. J., PRITCHARD, J., FOOT, A. B. M., ROALD, B., KOHLER, J. A., and IMESON, J. (2000): 'Clinical prognostic factors in 1277 patients with neuroblastoma: results of The European Neuroblastoma Study Group 'Survey' 1982-1992', Eu~ J. Cancer, 36, pp. 901-908
DAWANT, B. M., and ZIJDENBOS, A. P. (2000): 'Image segmentation', in SONKA, M., and FITZPATRICK, J. M. (Eds): 'Handbook o f medical imaging, ~lume 2: Medical image processing and analysis' (SPIE Press, Bellinghaxn, WA, 2000), chap. 2, pp. 71-127
DUERINCKX, A. J., and MACOVSKI, A. (1980): 'Information and artifact in computed tomography image statistics', Med. Phys., 7, pp. 127-134
FERRARI, R. J., RANGAYYAN, R. M., DESAUTELS, J. E. L., and FRI~RE, A. E (2000): 'Segmentation of maxnmograxns: identification of the skin-air boundary, pectoral muscle, and fibro-glandulax disc', in YAFFE, M. J. (Ed): 'Proc 5th Int. Works'hop on Digital Mammo- graphy', Toronto, Canada, pp. 573-579
FERRARI, R. J., RANGAYYAN, R. M., DESAUTELS, J. E. L., and FRI~RE, A. E (2001): 'Analysis of asymmetry in maxnmograms via direc- tional filtering with Gabor wavelets', IEEE Trans. Med. Imag., 2D, pp. 953-964
FLETCHER, B. D., KOPIWODA, S. Y., STRANDJORD, S. E., NELSON, A. D., and PICKERING, S. R (1985): 'Abdominal neuroblastoma: magnetic resonance imaging and tissue characterization', Radiology, 155, pp. 69%703
FOGLIA, R. R, FONKALSRUD, E. W., FEIG, S. A., and Moss, T. J. (1989): 'Accuracy of diagnostic imaging as determined by delayed operative intervention for advanced neuroblastoma', J Pediam Surg., 24, pp. 708-711
FULLERTON, G. D. (1980): 'Fundamentals of CT tissue characteriza- tion', in FULLERTON, G. D., and ZAGZEBSKI, J. A. (Eds): 'Medical physics of CT and ultrasound: tissue imaging and characterization', (American Association of Physicists in Medicine, New York, NY, 1980), pp. 125-162
GERIG, G., JOMIER, M., and CHAKOS, M. (2001): 'Valmet: a new validation tool for assessing and improving 3D object segmenta- tion', in NIESSEN, W., and VIERGEVER, M. (Eds): 'Medical image computing and computer-assisted intervention: MICCAI 2001' (Springer-Verlag, Berlin, Heidelberg, 2001), pp. 516-523
GOLDSZAL, A. E, and PHAM, D. L. (2000): 'Volumetric segmentation', in BANKMAN, I. N. (Ed): 'Handbook of Medical Imaging: Proces- sing and Analysis' (Academic Press, London, UK, 2000), chap. 12, pp. 185-194
GOODENOUGH, D. J. (2000): 'Tomographic imaging', in BEUTEL, J., KUNDEL, H. L., and VAN METTER, R. L. (Eds): 'Handbook o f medical imaging, ~lume 1: Physics and psychophysics' (SPIE Press, Bellinghaxn, WA, 2000), chap. 8, pp. 511-554
GOODMAN, M. T., GURNEY, J. G., SMITH, M. A., and OLSHAN, A. E (1999): 'Cancer incidence and survival among children and adoles- cents': United States" Surveillance, Epidemiology, and End Results (SEER) Program 1975-1995. Chapter IV Sympathetic nervous" system tumors". National Cancer Institute, http:// seer.cancer.gov/ publications/childhood/sympathetic.pdf
GURNEY, J. G., Ross, J. A., WALL, D. A., BLEYER, W. A., SEVERSON, R. K., and ROBISON, L. L. (1997): 'infant cancer in the U.S.: histology-specific incidence and trends', J Pediat~ Hematol./ Oncol., 19, pp. 428-432
HOPPER, K. D., SINGAPURI, K., and FINKEL, A. (2000): 'Body CT and oncologic imaging', Radiology, 215, pp. 27-40
JAIN, A. K., DUN, R. R W., and MAO, J. (2000): 'Statistical pattern recognition: a review', IEEE Trans. Pattern Anal. Mach. Intell., 22, pp. 4-37
KIRKS, D. R., MERTEN, D. E, GROSSMAN, H., and BOWIE, J. D. (1981): 'Diagnostic imaging of pediatric abdominal masses: am overview', Radiol. Clin. North Am., 19, pp. 527-545
KORNREICH, L., HOREV, G., KAPLINSKY, N. Z., and GRUNEBAUM, M. (1991): 'Neuroblastoma: evaluation with contrast enhanced MR imaging', Pediam Radiol., 21, pp. 566-569
KRAMER, R. A., YOSHIKAWA, B. M., SCHEIBE, P. O., and JANETOS, G. R (1977): 'Statistical profiles in computed tomography', Radiology, 125, pp. 145-147
LAIDLAW, D. H., FLEISCHER, K. W., and BARR, A. H. (2000): 'Partial volume segmentation with voxel histograms', in BANKMAN, I. N. (Ed): 'Handbook o f medical imaging processing and analysis' (Academic Press, London, UK, 2000), chap. 13, pp. 185-194
LATCHAW, R. E., GOLD, L. H. A., MOORE, J. S., and PAYNE, J. T. (1977): 'The nonspecificity of absorption coefficients in the differentiation of solid tumors and cystic lesions', Radiology, 125, pp. 141-144
MATEGRANO, V C., PETASNICK, J., CLARK, J., BIN, A. C., and WEINSTEIN, R. (1977): 'Attenuation values in computed tomography of the abdomen', Radiology, 125, pp. 135-140
MENG, X. L. and VAN DYK, D. (1997): 'The EM algorithm- am old folk-song sung to a fast new tune', J. Royal Statist. Soc., 59, pp. 511-567
376 Medical & Biological Engineering & Computing 2004, Vol. 42
MEZA, M. P., BENSON, M., and SLOVIS, T. L. (1993): 'Imaging of mediastinal masses in children', Radiol. Clin. North Am., 31, pp. 583-604
PARKER, L., and POWELL, J. (1998): 'Screening for neuroblastoma in infaxlts younger than 1 year of age: review of the first 30 years', Med. Pediat~ Oncol., 31, pp. 455-469
PHELPS, M. E., HOFFMAN, E. J., and TER-POGOSSIAN, M. M. (1975): 'Attenuation coefficients of various body tissues, fluids and lesions at photon energies of 18 to 136 keV', Radiology, 117, pp. 573-583
PULLAN, B. R., FAWCITT, R. A., and ISHERWOOD, I. (1978): 'Tissue characterization by an analysis of the distribution of attenuation values in computed tomography scans: A preliminary report', d Comput. Assist. Tomog~, 2, pp. 49-54
RAO, P.S., and GREGG, E.C. (1975): 'Attenuation of monoenergetic gamma rays in tissues', Am. d Roentgenol., 123, pp. 631-637
RICHARDSON, S., and GREEN, P.J. (1997): 'On Bayesian analysis of mixtures with an unknown number of components', J. Roy. Statist. Soc. B, 59, pp. 731-792
ROBB, R. A. (1982): 'X-ray computed tomography: an engineering synthesis of multiscientific principles', CRC Crit. Rev. Biomed. Eng., 7, pp. 265-333
SOFKA, C. M., SEMELKA, R. C., KELEKIS, N. L., WORAWATTANAKUL, S., CHUNG, C. J., GOLD, S., and FORDHAM, L. A. (1999): 'Magnetic resonance imaging of neuroblastoma using current techniques', Magnet. Reson. Imag., 17, pp. 193-198
STARK, D. D., Moss, A. A., BRASCH, R. C., DELORIMIER, A. A., ALBIN, A. R., LONDON, D. A., and GOODING, C. A. (1983): 'Neuroblastoma: diagnostic imaging and staging', Radiology, 148, pp. 101-105
TANNER, M. A. (1996): 'Tools for statistical inference: methods" °for the exploration o f posterior distributions and likelihood functions', 3rd edn (Springer-Verlag, New York, NY, 1996)
WARFIELD, S. K., Zou, K. U., and WELLS, W. M. (2002): 'Validation of image segmentation and expert quality with am expectation- maximization algorithm', in DOHI, T., and KIKINIS, R. (Eds), Medical
image computing and computer-assisted intervention: MICCAI 2002 (Springer-Verlag, Berlin Heidelberg, 2002), pp. 298-306
WHEATEEY, J. M., ROSENFIEED, N. S., HEELER, G., FEEDSTEIN, D., and LAQUAGLIA, M. P. (1995): 'Validation of a technique of computer- aided tumor volume determination', J SurE. Res., 59, pp. 621-626
WILLIAMS, G., BYDDER, G. M., and KREEE, L. (1980): 'The validity and use of computed tomography attenuation values', B~ Med. Bull., 36, pp. 279-287
WILSON, C. R. (1980): 'Quantitative computed tomography', in FUEEERTON, G. D., and ZAGZEBSKI, J. A. (Eds), Medical physics of CT and uhrasound: tissue imaging and characterization (American Association of Physicists in Medicine, New York, NY, 1980), pp. 163-175
WOODS, W. G., and TUCHMAN, M. (1998): 'A population-based study of the usefulness of screening for neuroblastoma', Lancet, 348, pp. 1682-1687
Author's biography
FA.BIO JOSE AYRES is a PhD student at the University of Calgary, Calgary, Canada. He received his degree in electrical engineering and his MSc in electrical engineering from the University of S~o Paulo, S~o Paulo, Brazil. He was awarded 2nd place in the student paper competition at the 25th Annual International Conference of the IEEE Engineering in Med- icine and Biology Society, Canchn,
Mexico, 2003. His current interests are oriented texture segmenta- tion and analysis, probabilistic models in computer vision and image processing, medical imaging, and computer-aided diagnosis in medicine.
Medical & Biological Engineering & Computing 2004, Vol. 42 377
Related Documents