This is a repository copy of Estimation of seismic response parameters and capacity of irregular tunnel-form buildings. White Rose Research Online URL for this paper: https://eprints.whiterose.ac.uk/148600/ Version: Accepted Version Article: Mohsenian, V., Nikkhoo, A. and Hajirasouliha, I. orcid.org/0000-0003-2597-8200 (2019) Estimation of seismic response parameters and capacity of irregular tunnel-form buildings. Bulletin of Earthquake Engineering, 17 (9). pp. 5217-5239. ISSN 1570-761X https://doi.org/10.1007/s10518-019-00679-0 This is a post-peer-review, pre-copyedit version of an article published in Bulletin of Earthquake Engineering. The final authenticated version is available online at: http://dx.doi.org/10.1007/s10518-019-00679-0 [email protected] https://eprints.whiterose.ac.uk/ Reuse Items deposited in White Rose Research Online are protected by copyright, with all rights reserved unless indicated otherwise. They may be downloaded and/or printed for private study, or other acts as permitted by national copyright laws. The publisher or other rights holders may allow further reproduction and re-use of the full text version. This is indicated by the licence information on the White Rose Research Online record for the item. Takedown If you consider content in White Rose Research Online to be in breach of UK law, please notify us by emailing [email protected] including the URL of the record and the reason for the withdrawal request.

Welcome message from author
This document is posted to help you gain knowledge. Please leave a comment to let me know what you think about it! Share it to your friends and learn new things together.
Transcript
This is a repository copy of Estimation of seismic response parameters and capacity of irregular tunnel-form buildings.
White Rose Research Online URL for this paper:https://eprints.whiterose.ac.uk/148600/
Version: Accepted Version
Article:
Mohsenian, V., Nikkhoo, A. and Hajirasouliha, I. orcid.org/0000-0003-2597-8200 (2019) Estimation of seismic response parameters and capacity of irregular tunnel-form buildings.Bulletin of Earthquake Engineering, 17 (9). pp. 5217-5239. ISSN 1570-761X
https://doi.org/10.1007/s10518-019-00679-0
This is a post-peer-review, pre-copyedit version of an article published in Bulletin of Earthquake Engineering. The final authenticated version is available online at: http://dx.doi.org/10.1007/s10518-019-00679-0
[email protected]://eprints.whiterose.ac.uk/
Reuse
Items deposited in White Rose Research Online are protected by copyright, with all rights reserved unless indicated otherwise. They may be downloaded and/or printed for private study, or other acts as permitted by national copyright laws. The publisher or other rights holders may allow further reproduction and re-use of the full text version. This is indicated by the licence information on the White Rose Research Online record for the item.
Takedown
If you consider content in White Rose Research Online to be in breach of UK law, please notify us by emailing [email protected] including the URL of the record and the reason for the withdrawal request.
1
Estimation of Seismic Response Parameters and Capacity of
Irregular Tunnel-Form Buildings
Vahid Mohsenian1, Ali Nikkhoo2*, Iman Hajirasouliha3
1. Postgraduate Researcher, Department of Civil Engineering, University of Science
and Culture, Tehran, Iran.
2. Associate Professor, Department of Civil Engineering, University of Science and
Culture, Tehran, Iran.
3. Associate Professor, Department of Civil and Structural Engineering, University of
Sheffield, Sheffield, UK.
* Corresponding author Associate Professor,
Department of Civil Engineering,
University of Science and Culture, Tehran, IRAN.
Tel and Fax: +98 2142863000
Email: [email protected]
2
Abstract 1
Insufficient information about the seismic performance of tunnel-form buildings and limited 2
relevant design codes and standards are the main barriers towards application of these systems in 3
seismically active areas. Vertical and horizontal irregularity of typical tunnel-form buildings is 4
another cumbersome challenge restricting the application of these systems. To address these 5
issues, this study aims to evaluate the seismic behaviour of tunnel-form buildings with horizontal 6
irregularity and develop appropriate design methodologies. Based on the results of 3, 5, 7 and 10-7
storey buildings, new response modification factors are proposed as a function of seismic demand 8
and expected performance level. Fragility curves are also derived for various levels of intensity, 9
and simple equations are introduced to estimate uncoupled frequency ratios. The results, in 10
general, demonstrate the flexible torsional behaviour of irregular tunnel-form structures and their 11
adequate seismic resistance capacity. The buildings studied herein, managed to satisfy the 12
Immediate Occupancy (IO) performance requirements under design-basis earthquake, which 13
implies that the plan regularity requirement for tunnel-form buildings in seismic codes may be 14
too conservative. Moreover, it is concluded that using response modification factor equal to 5 can 15
generally result in sufficient stability and adequate performance level under both design basis and 16
maximum considered earthquake scenarios. 17
18
Keywords: Tunnel-Form Structural System, Irregularity, Response Modification Factor, 19
Fragility Analysis, Uncoupled Frequencies Ratio. 20
Introduction 21
The modern construction industry is quickly moving towards more efficient structural systems 22
and technologies to reduce costs, constructional time and human resources, and also to promote 23
the quality and safety of the structures under extreme loading events such as strong earthquakes. 24
In this respect, the newly-developed tunnel-form structural systems can offer several advantages 25
such as competent capability for planning, shortening the construction time and consequently 26
leading to a rapid asset return. In the tunnel-form structures, slab and wall elements are employed 27
as the main lateral and vertical load-carrying systems, and the beam and column elements 28
commonly used in typical structural systems are excluded. Moreover, since the walls and slabs 29
3
are simultaneously constructed in each storey, there is no need to use cold joints to ensure an 30
integrated 3D performance of the system during a seismic event. The considerable length of wall 31
elements in this system, helps to prevent stress concentrations at wall to slab connections, which 32
are usually observed in common beam-column systems. In addition, tunnel-form structures 33
generally can provide a good level of resilient under extreme load conditions. This is confirmed 34
by the observations from Kocaeli (Mw=7.4) and Duzce (Mw=7.2) earthquakes, where most 35
tunnel-form buildings managed to withstand the strong earthquake excitations and generally 36
performed better than other commonly used RC systems (Balkaya and Kalkan 2004a). 37
Due to the above mentioned advantages, this type of structural system is increasingly become 38
popular especially for mass construction projects in seismically active areas. Despite extensive 39
use of these structures, the available codes and standards do not consider them as independent 40
structural systems. Moreover, very limited studies have been conducted to investigate the seismic 41
performance of these systems. In the following, some of the most notable studies including their 42
outcomes are briefly presented. 43
Previous studies on the behaviour of tunnel-form buildings, have demonstrated that the empirical 44
equations for calculation of fundamental period in current design guidelines, do not generally 45
yield to accurate predictions. This can result in improper estimation of the earthquake-induced 46
loads for tunnel-form buildings (Goel and Chopra 1998; Lee et al. 2000). To address this issue, 47
through a number of eigenvalue analyses on reinforced concrete (RC) buildings with different 48
plans and number of storeys, Balkaya and Kalkan (2003a) proposed a new equation to acceptably 49
estimate the fundamental period of tunnel-form buildings. Based on the outcomes of their 50
analyses, in most cases, torsional modes were precedent to the translational ones. Due to the 51
complexity and limitations of their proposed relationship, in a follow-up study they attempted to 52
develop another equation which was direction-independent (Balkaya and Kalkan 2004a). 53
In another relevant study, Balkaya and Kalkan (2003b; 2004b) carried out pushover analysis on 2 54
and 5-storey tunnel-form buildings with the same plan and found the 3D membrane action as the 55
dominant mechanism for tunnel-form buildings. They concluded that the 3D coupled tension-56
compression performance, plays an important role in load-carrying capacity of these systems. 57
Moreover, the structures analyzed in their research, managed to meet the requirements of the 58
Turkish Seismic Design Code at the performance level of immediate occupancy (IO). Based on 59
4
the analytical results, they proposed to utilize response modification factor (R) of 5 and 4 for 60
shorter and taller tunnel-form buildings, respectively. 61
To investigate the nonlinear seismic behaviour of tunnel-form buildings, Tavafoghi and Eshghi 62
(2005) carried out studies on two 1-5 scale specimens. During the cyclic lateral loading process, a 63
brittle behaviour was observed. The structural damages were mainly developed in the slabs as 64
well as the slab to wall and wall to foundation connections. The forced vibration tests also 65
indicated that the cracks developed in the slabs clearly affected the period of the first vibration 66
mode. Based on their findings, the response modification factor of 4 was suggested to be a 67
reasonable value for these systems. 68
Yuksel and Kalkan (2007) carried out a number of experimental tests on intersecting walls under 69
lateral cyclic pseudo-static loads at both principal directions. Although their tested specimens had 70
minimum percentage of longitudinal reinforcement, they exhibited a brittle shear failure. 71
Subsequently, a verification study was performed to analyse models with different percentage of 72
longitudinal bars. The results demonstrated that increasing the longitudinal bars concentrated at 73
the corner of walls, has positive effects on their seismic performance. In another study, Tavafoghi 74
and Eshghi (2008) investigated the seismic behaviour of tunnel-form concrete building structures 75
with different plans and heights. It was concluded that the fundamental period of these systems in 76
each direction is directly dependent on the total height and the aspect ratio, while number of 77
storeys does not considerably affect the results. Furthermore, the first three modes of vibration 78
were reported to be independent of the height and number of walls in plan. 79
In another relevant study, Balkaya et al. (2012) investigated the effect of soil-structure interaction 80
on the mechanical characteristics of the tunnel-form structures with different geometries making 81
use of eigenvalue analysis. According to the results, several relations for calculation of the 82
fundamental vibration period of these structures were developed by taking the effect of the soil-83
structure interaction into account. Through a case study on a 12-storey building with tunnel-form 84
system in Croatia, Klasanovic et al. (2014) demonstrated that while the structure is in the linear 85
domain, the measured fundamental period of is close to the period obtained from EC8. 86
In a more recent study, Beheshti-aval et al. (2018) evaluated the seismic performance of tunnel-87
form system subjected to a set of near and far-field earthquake records including forward 88
directivity effects. It was shown that the forward directivity can influence the failure modes of 89
5
tall tunnel-form structures and reduce the reliability of the design. Mohsenian and Mortezaei 90
(2018a) also evaluated the seismic reliability of tunnel-form structures subjected to accidental 91
torsions. According to their results, eccentricity of mass centre by up to 10% of the plan 92
dimension does not considerably affect the performance of these systems. In a follow-up study, 93
Mohsenian and Mortezaei (2018b) proposed to replace the concrete coupling beam by a 94
replaceable steel beam so that the damages could be optimally distributed in plan and height of 95
tunnel-form buildings. 96
Problem Definition and Research Novelty 97
Due to the special construction process of tunnel-from buildings and obligation to provide 98
sufficient space to take the formworks out of the perimeter sides of the building, it is not 99
generally possible to construct structural walls in these areas. This can lead to reduction in 100
torsional stiffness of the typical tunnel-from buildings and make them susceptible to exhibit a soft 101
torsional behaviour. As discussed in the previous section, the results of the eigenvalue analysis on 102
several buildings using tunnel-form systems, imply that the torsional modes can occur at 103
frequencies lower than the translational ones, which indicates a flexible torsional behaviour. To 104
control this undesirable response, current design standards generally suggest using regular and 105
symmetric plans, which is followed by architectural limitations. Therefore, the above mentioned 106
studies on tunnel-form structural system have been mainly focused on estimation of the 107
fundamental period and evaluation of the seismic behaviour and design parameters of 108
horizontally regular buildings. Moreover, currently there is no agreement on behaviour factors 109
suitable for seismic design of tunnel-form buildings. Due to the lack of information, in most 110
seismic design guidelines the tunnel-form structural system is categorised as a subcategory of 111
load-bearing wall structural system. However, due to the interaction between well and slab 112
elements, the seismic performance of tunnel-form buildings can be completely different with 113
conventional load-bearing wall systems. 114
To bridge the above mentioned knowledge gaps in this area, this study aims to investigate the 115
seismic performance and reliability of irregular tunnel-form building by using 3, 5, 7 and 10-116
storey structures subjected to design earthquakes with different intensity levels simultaneously 117
applied in the two principal directions. A novel approach is also utilized to develop multi-level 118
behaviour factors on the basis of earthquake hazard level and performance limit. The proposed 119
6
behaviour factors can be efficiently used for performance-based design (PBD) of these systems to 120
achieve specific performance targets. Finally, the reliability studies and fragility curves 121
developed using different damage measures should provide useful insight into the nonlinear shear 122
behaviour and seismic reliability of tunnel-form building structures as a new class of structural 123
systems. 124
Methodology 125
o Specifications of numerical models 126
In this study, the seismic performance of 3, 5, 7 and 10-storey tunnel-form buildings is 127
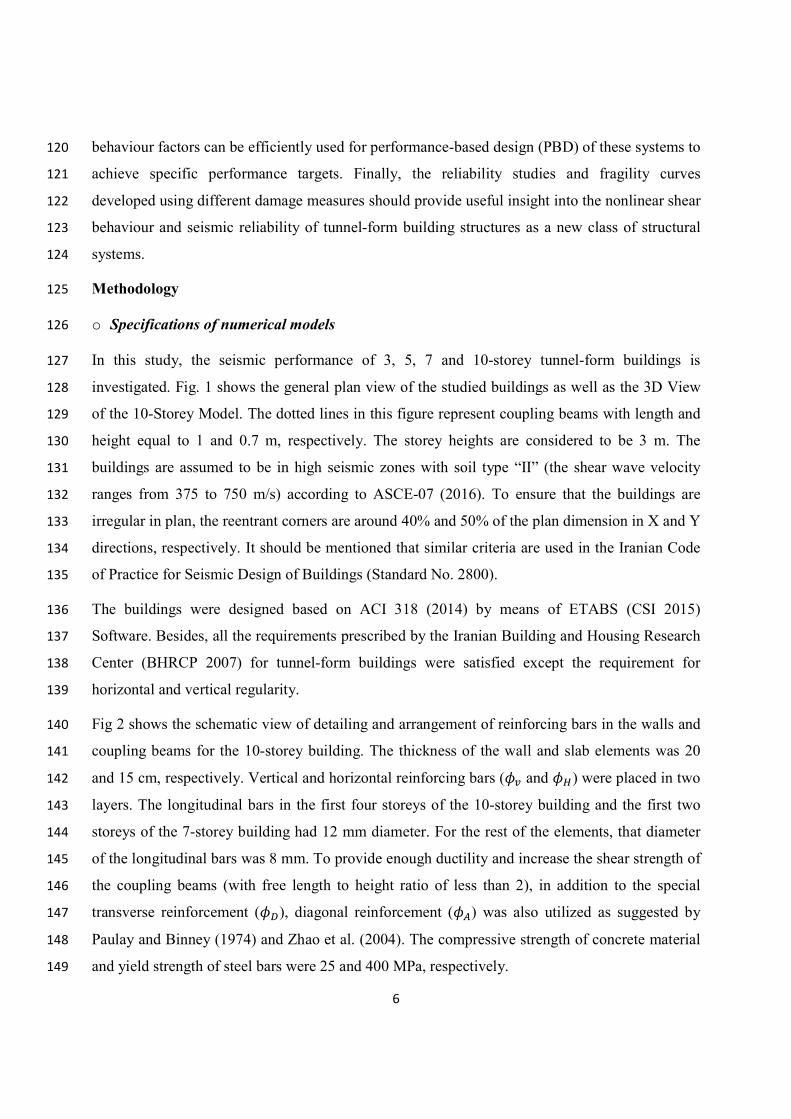
investigated. Fig. 1 shows the general plan view of the studied buildings as well as the 3D View 128
of the 10-Storey Model. The dotted lines in this figure represent coupling beams with length and 129
height equal to 1 and 0.7 m, respectively. The storey heights are considered to be 3 m. The 130
buildings are assumed to be in high seismic zones with soil type “II” (the shear wave velocity 131
ranges from 375 to 750 m/s) according to ASCE-07 (2016). To ensure that the buildings are 132
irregular in plan, the reentrant corners are around 40% and 50% of the plan dimension in X and Y 133
directions, respectively. It should be mentioned that similar criteria are used in the Iranian Code 134
of Practice for Seismic Design of Buildings (Standard No. 2800). 135
The buildings were designed based on ACI 318 (2014) by means of ETABS (CSI 2015) 136
Software. Besides, all the requirements prescribed by the Iranian Building and Housing Research 137
Center (BHRCP 2007) for tunnel-form buildings were satisfied except the requirement for 138
horizontal and vertical regularity. 139
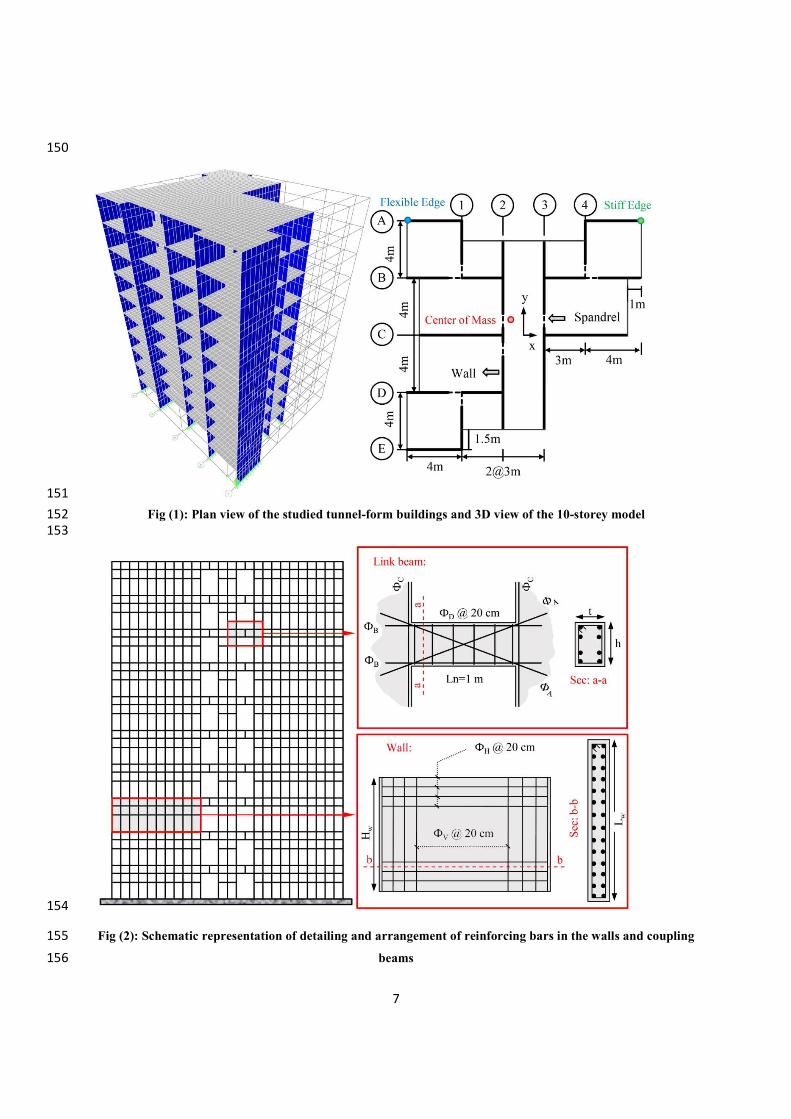
Fig 2 shows the schematic view of detailing and arrangement of reinforcing bars in the walls and 140
coupling beams for the 10-storey building. The thickness of the wall and slab elements was 20 141
and 15 cm, respectively. Vertical and horizontal reinforcing bars (𝜙 and 𝜙 ) were placed in two 142
layers. The longitudinal bars in the first four storeys of the 10-storey building and the first two 143
storeys of the 7-storey building had 12 mm diameter. For the rest of the elements, that diameter 144
of the longitudinal bars was 8 mm. To provide enough ductility and increase the shear strength of 145
the coupling beams (with free length to height ratio of less than 2), in addition to the special 146
transverse reinforcement (𝜙 ), diagonal reinforcement (𝜙 ) was also utilized as suggested by 147
Paulay and Binney (1974) and Zhao et al. (2004). The compressive strength of concrete material 148
and yield strength of steel bars were 25 and 400 MPa, respectively. 149
7
150
151 Fig (1): Plan view of the studied tunnel-form buildings and 3D view of the 10-storey model 152
153
154
Fig (2): Schematic representation of detailing and arrangement of reinforcing bars in the walls and coupling 155 beams 156
8
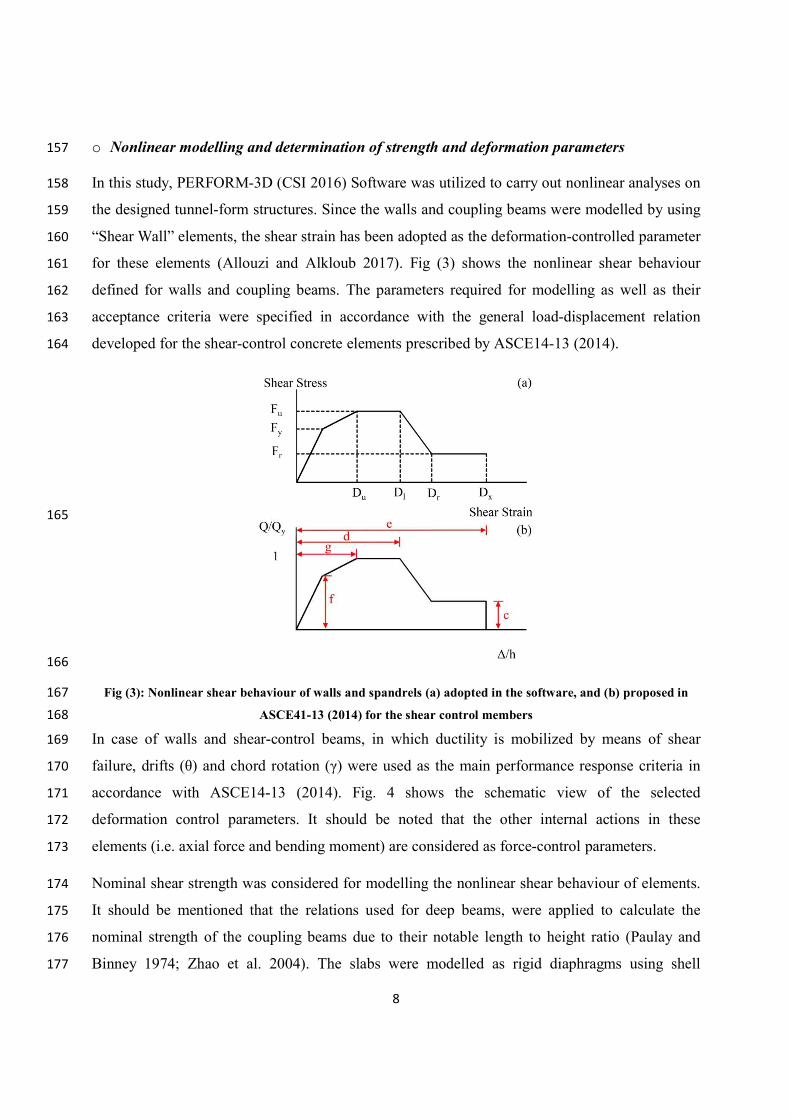
o Nonlinear modelling and determination of strength and deformation parameters 157
In this study, PERFORM-3D (CSI 2016) Software was utilized to carry out nonlinear analyses on 158
the designed tunnel-form structures. Since the walls and coupling beams were modelled by using 159
“Shear Wall” elements, the shear strain has been adopted as the deformation-controlled parameter 160
for these elements (Allouzi and Alkloub 2017). Fig (3) shows the nonlinear shear behaviour 161
defined for walls and coupling beams. The parameters required for modelling as well as their 162
acceptance criteria were specified in accordance with the general load-displacement relation 163
developed for the shear-control concrete elements prescribed by ASCE14-13 (2014). 164
165
166
Fig (3): Nonlinear shear behaviour of walls and spandrels (a) adopted in the software, and (b) proposed in 167 ASCE41-13 (2014) for the shear control members 168
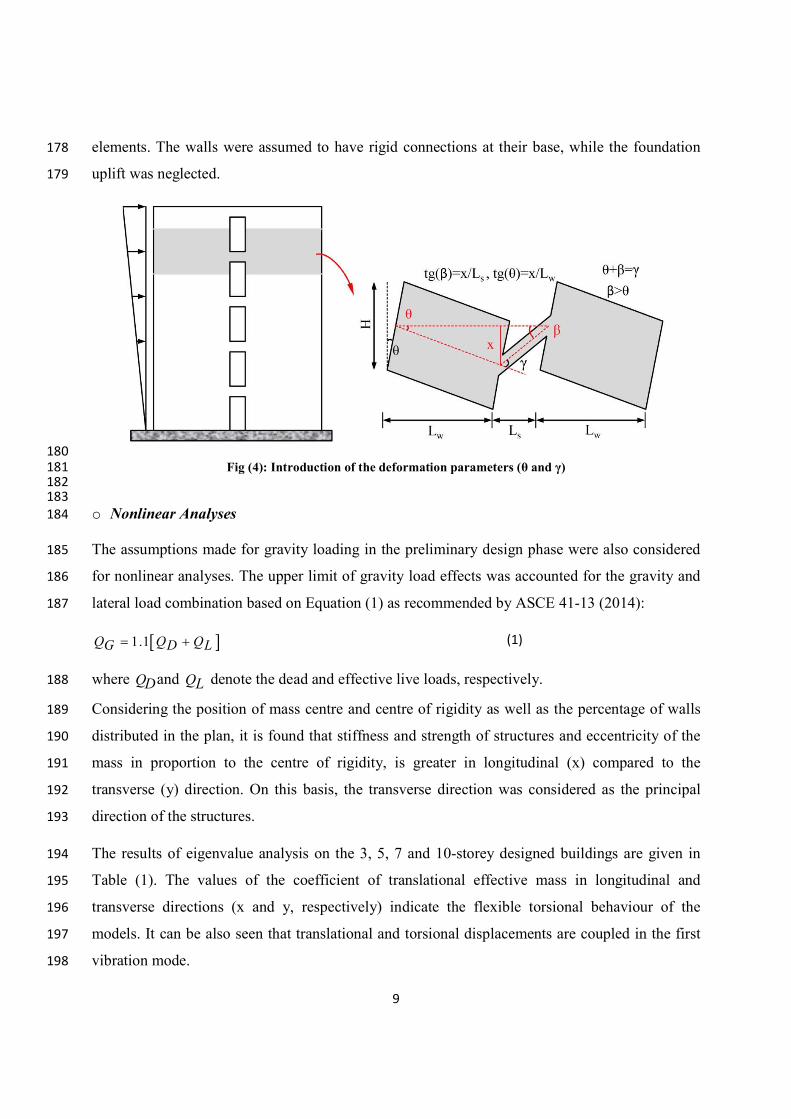
In case of walls and shear-control beams, in which ductility is mobilized by means of shear 169
failure, drifts (θ) and chord rotation (γ) were used as the main performance response criteria in 170
accordance with ASCE14-13 (2014). Fig. 4 shows the schematic view of the selected 171
deformation control parameters. It should be noted that the other internal actions in these 172
elements (i.e. axial force and bending moment) are considered as force-control parameters. 173
Nominal shear strength was considered for modelling the nonlinear shear behaviour of elements. 174
It should be mentioned that the relations used for deep beams, were applied to calculate the 175
nominal strength of the coupling beams due to their notable length to height ratio (Paulay and 176
Binney 1974; Zhao et al. 2004). The slabs were modelled as rigid diaphragms using shell 177
9
elements. The walls were assumed to have rigid connections at their base, while the foundation 178
uplift was neglected. 179
180 Fig (4): Introduction of the deformation parameters (θ and γ) 181
182 183
o Nonlinear Analyses 184
The assumptions made for gravity loading in the preliminary design phase were also considered 185
for nonlinear analyses. The upper limit of gravity load effects was accounted for the gravity and 186
lateral load combination based on Equation (1) as recommended by ASCE 41-13 (2014): 187
1.1Q Q QG D L (1)
where QDand QL denote the dead and effective live loads, respectively. 188
Considering the position of mass centre and centre of rigidity as well as the percentage of walls 189
distributed in the plan, it is found that stiffness and strength of structures and eccentricity of the 190
mass in proportion to the centre of rigidity, is greater in longitudinal (x) compared to the 191
transverse (y) direction. On this basis, the transverse direction was considered as the principal 192
direction of the structures. 193
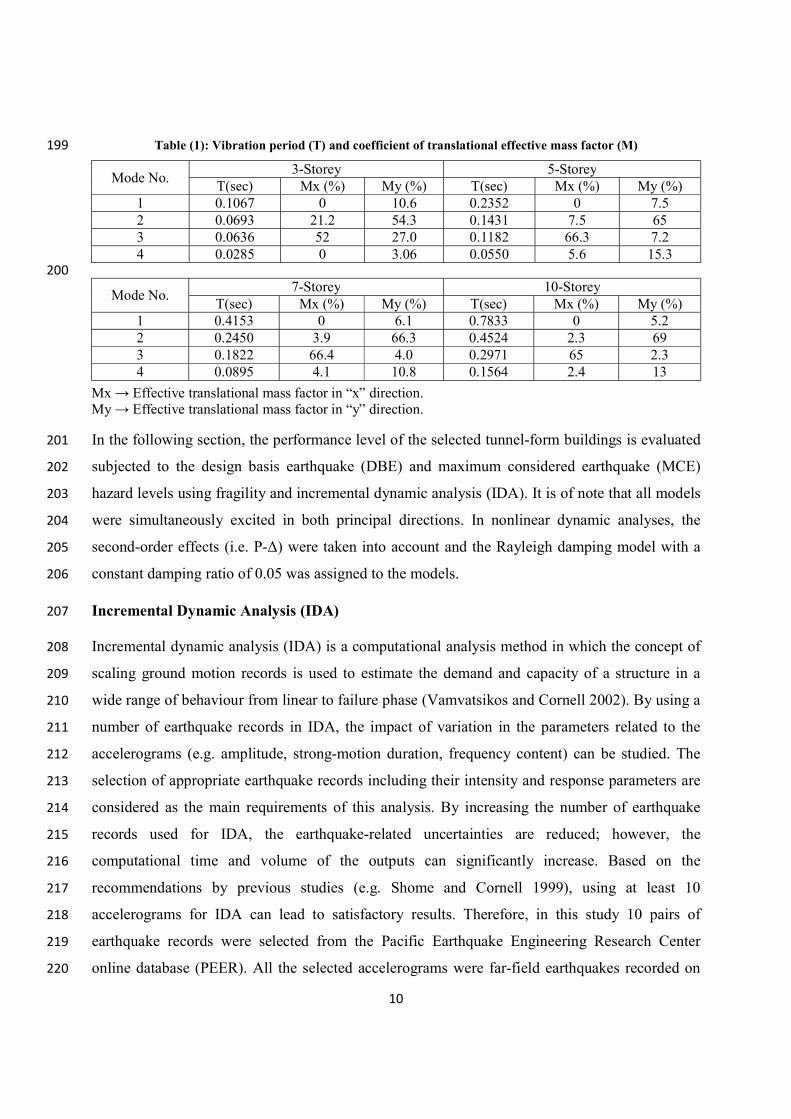
The results of eigenvalue analysis on the 3, 5, 7 and 10-storey designed buildings are given in 194
Table (1). The values of the coefficient of translational effective mass in longitudinal and 195
transverse directions (x and y, respectively) indicate the flexible torsional behaviour of the 196
models. It can be also seen that translational and torsional displacements are coupled in the first 197
vibration mode. 198
10
Table (1): Vibration period (T) and coefficient of translational effective mass factor (M) 199
Mode No. 3-Storey 5-Storey T(sec) Mx (%) My (%) T(sec) Mx (%) My (%)
1 0.1067 0 10.6 0.2352 0 7.5 2 0.0693 21.2 54.3 0.1431 7.5 65 3 0.0636 52 27.0 0.1182 66.3 7.2 4 0.0285 0 3.06 0.0550 5.6 15.3
200
Mode No. 7-Storey 10-Storey T(sec) Mx (%) My (%) T(sec) Mx (%) My (%)
1 0.4153 0 6.1 0.7833 0 5.2 2 0.2450 3.9 66.3 0.4524 2.3 69 3 0.1822 66.4 4.0 0.2971 65 2.3 4 0.0895 4.1 10.8 0.1564 2.4 13
Mx → Effective translational mass factor in “x” direction. My → Effective translational mass factor in “y” direction.
In the following section, the performance level of the selected tunnel-form buildings is evaluated 201
subjected to the design basis earthquake (DBE) and maximum considered earthquake (MCE) 202
hazard levels using fragility and incremental dynamic analysis (IDA). It is of note that all models 203
were simultaneously excited in both principal directions. In nonlinear dynamic analyses, the 204
second-order effects (i.e. P-Δ) were taken into account and the Rayleigh damping model with a 205
constant damping ratio of 0.05 was assigned to the models. 206
Incremental Dynamic Analysis (IDA) 207
Incremental dynamic analysis (IDA) is a computational analysis method in which the concept of 208
scaling ground motion records is used to estimate the demand and capacity of a structure in a 209
wide range of behaviour from linear to failure phase (Vamvatsikos and Cornell 2002). By using a 210
number of earthquake records in IDA, the impact of variation in the parameters related to the 211
accelerograms (e.g. amplitude, strong-motion duration, frequency content) can be studied. The 212
selection of appropriate earthquake records including their intensity and response parameters are 213
considered as the main requirements of this analysis. By increasing the number of earthquake 214
records used for IDA, the earthquake-related uncertainties are reduced; however, the 215
computational time and volume of the outputs can significantly increase. Based on the 216
recommendations by previous studies (e.g. Shome and Cornell 1999), using at least 10 217
accelerograms for IDA can lead to satisfactory results. Therefore, in this study 10 pairs of 218
earthquake records were selected from the Pacific Earthquake Engineering Research Center 219
online database (PEER). All the selected accelerograms were far-field earthquakes recorded on 220
11
the sites with soil class “II” (shear wave velocity ranges from 375 to 750 m/s) in accordance with 221
ASCE-07 (2016). Table 2 lists the characteristics of the records including their closest distance to 222
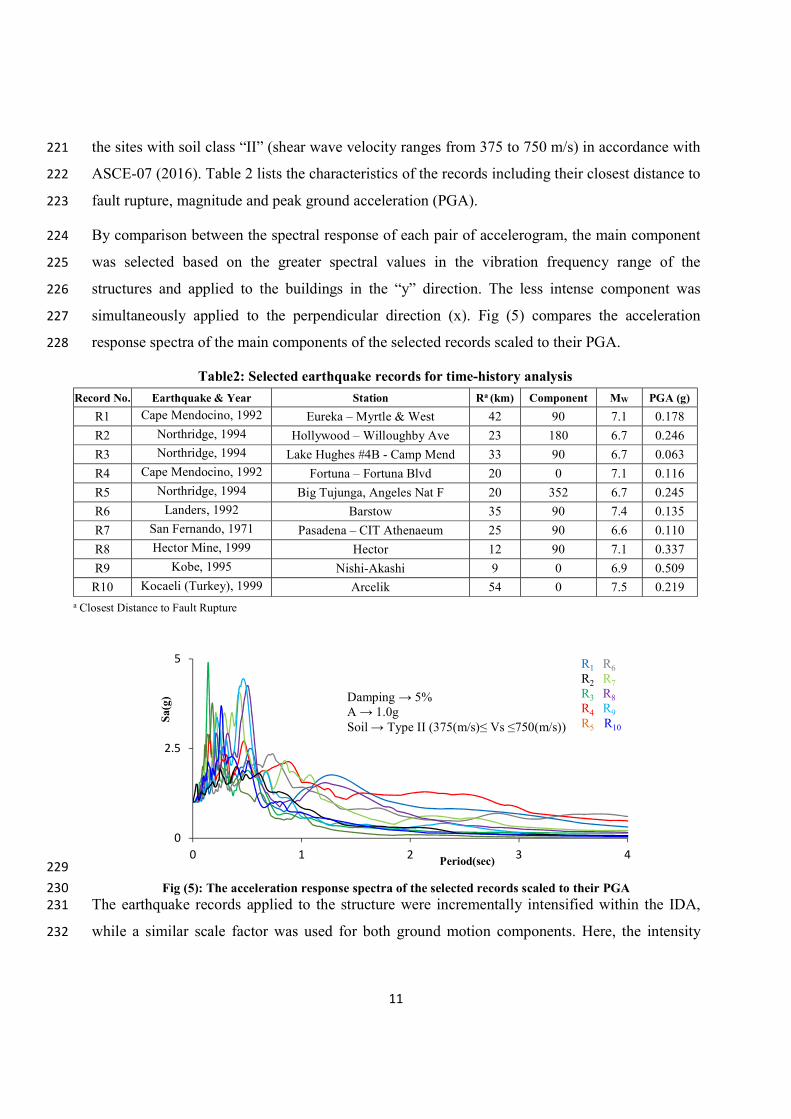
fault rupture, magnitude and peak ground acceleration (PGA). 223
By comparison between the spectral response of each pair of accelerogram, the main component 224
was selected based on the greater spectral values in the vibration frequency range of the 225
structures and applied to the buildings in the “y” direction. The less intense component was 226
simultaneously applied to the perpendicular direction (x). Fig (5) compares the acceleration 227
response spectra of the main components of the selected records scaled to their PGA. 228
Table2: Selected earthquake records for time-history analysis Record No. Earthquake & Year Station Ra (km) Component MW PGA (g)
R1 Cape Mendocino, 1992 Eureka – Myrtle & West 42 90 7.1 0.178 R2 Northridge, 1994 Hollywood – Willoughby Ave 23 180 6.7 0.246 R3 Northridge, 1994 Lake Hughes #4B - Camp Mend 33 90 6.7 0.063 R4 Cape Mendocino, 1992 Fortuna – Fortuna Blvd 20 0 7.1 0.116 R5 Northridge, 1994 Big Tujunga, Angeles Nat F 20 352 6.7 0.245 R6 Landers, 1992 Barstow 35 90 7.4 0.135 R7 San Fernando, 1971 Pasadena – CIT Athenaeum 25 90 6.6 0.110 R8 Hector Mine, 1999 Hector 12 90 7.1 0.337 R9 Kobe, 1995 Nishi-Akashi 9 0 6.9 0.509
R10 Kocaeli (Turkey), 1999 Arcelik 54 0 7.5 0.219 a Closest Distance to Fault Rupture
229 Fig (5): The acceleration response spectra of the selected records scaled to their PGA 230
The earthquake records applied to the structure were incrementally intensified within the IDA, 231
while a similar scale factor was used for both ground motion components. Here, the intensity 232
0
2.5
5
0 1 2 3 4
Sa(g
)
Period(sec)
R1 R6R2 R7R3 R8R4 R9R5 R10
Damping → 5%A → 1.0gSoil → Type ІІ (375(m/s)≤ Vs ≤750(m/s))
12
measure and the structural response to the input motion are denoted by IM and DM, respectively. 233
The fragility curves demonstrate the relation between these two parameters. 234
It should be noted that, due to the irregularity of the selected buildings, the torsional and 235
translational components of the first vibration mode are coupled in this study (see Table 1). 236
Therefore, using the spectral acceleration of the first vibration mode as the seismic intensity 237
measure would be inadequate. To address this issue, in this study the peak ground acceleration 238
(PGA) was chosen as intensity measure (IM), since it is independent of the structural 239
characteristics. 240
Different global damage indexes and particularly inter-storey drifts are generally taken as the 241
damage measure parameter (DM) in IDA. For the tunnel-form buildings studied herein, as the 242
elements are shear-control and due to lack of specific values to quantitatively define the global 243
damage indexes for this novel system, maximum drift and chord rotation developed in the walls 244
and coupling beams were adopted as the main damage parameters in IDA (see Fig (4)). It should 245
be mentioned that the global damage indexes proposed by Chobarah (2004) for squat walls could 246
be also employed, but in order to enhance the reliability on the results, the latter parameters were 247
chosen. 248
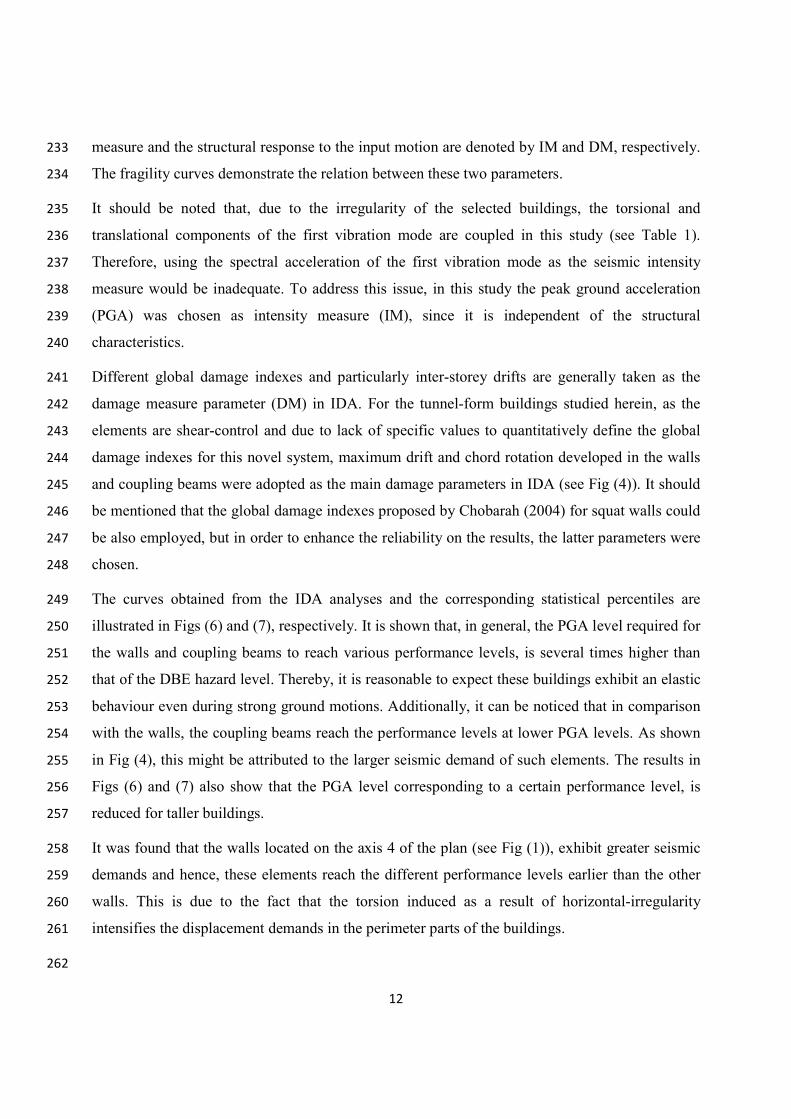
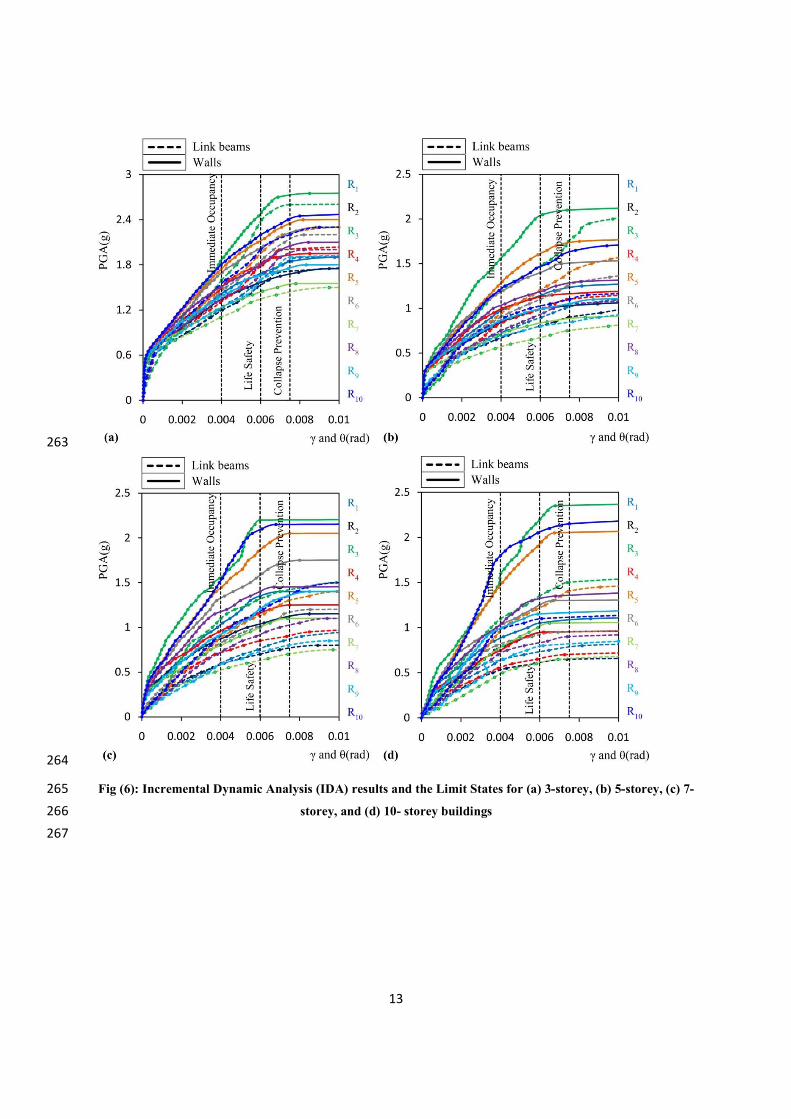
The curves obtained from the IDA analyses and the corresponding statistical percentiles are 249
illustrated in Figs (6) and (7), respectively. It is shown that, in general, the PGA level required for 250
the walls and coupling beams to reach various performance levels, is several times higher than 251
that of the DBE hazard level. Thereby, it is reasonable to expect these buildings exhibit an elastic 252
behaviour even during strong ground motions. Additionally, it can be noticed that in comparison 253
with the walls, the coupling beams reach the performance levels at lower PGA levels. As shown 254
in Fig (4), this might be attributed to the larger seismic demand of such elements. The results in 255
Figs (6) and (7) also show that the PGA level corresponding to a certain performance level, is 256
reduced for taller buildings. 257
It was found that the walls located on the axis 4 of the plan (see Fig (1)), exhibit greater seismic 258
demands and hence, these elements reach the different performance levels earlier than the other 259
walls. This is due to the fact that the torsion induced as a result of horizontal-irregularity 260
intensifies the displacement demands in the perimeter parts of the buildings. 261
262
13
263
264
Fig (6): Incremental Dynamic Analysis (IDA) results and the Limit States for (a) 3-storey, (b) 5-storey, (c) 7-265 storey, and (d) 10- storey buildings 266
267
14
268
269 Fig (7): Comparison of 16, 50 and 84 Percentiles of results obtained by the Incremental Dynamic Analysis 270
(IDA) for (a) 3-storey, (b) 5-storey, (c) 7-storey, and (d) 10- storey buildings 271
272
Generation of Fragility Curves Using IDA 273
Many uncertainties can affect the accuracy of the seismic performance assessment of a building 274
under earthquake events (Hajirasouliha et al. 2016). Such uncertainties are generally classified 275
into two groups. The first group deals with the existing uncertainties in nature such as the 276
differences lying in the material properties, ambient effects etc. The second group concerns the 277
uncertainties due to the errors in the computational methods, modelling procedures etc (Ang and 278
Tang 2007; Berahman and Behnamfar 2007). In such conditions, expression of the building’s 279
15
performance in a probabilistic form (e.g. using fragility curves) appears to be the most logical 280
approach. The fragility curves represent the cumulative distribution of loss (Cimellaro et al. 281
2006), and can be mathematically written as in Equation (2): 282
|Fragility P R LS IM Si (2)
where, R represents the building’s response, LSi denotes the performance level or limit state 283
related to R, IM (intensity measure) is the intensity of the input earthquake ground motions, and S 284
is a particular value of IM. 285
The distribution of structural responses at different levels of earthquake intensity can be 286
demonstrated by using fragility curves. The fragility curves can be also utilized as efficient tools 287
to assess the seismic vulnerability of both structural and non-structural elements (Nielson 2005; 288
Kinali 2007). Different methods can be used to generate fragility curves including experts’ 289
judgments, empirical-statistical approach, experimental, analytical and combined methods 290
(Khalvati and Hosseini 2008). In this study, the fragility curves were generated by means of 291
analytical or IDA analysis. By using the lateral drift and chord rotation as the damage measure 292
parameters for the walls and coupling beams, the performance levels defined by ASCE41-13 293
(2014) were considered as the damage criteria (see Fig (6)). Subsequently, fragility curves were 294
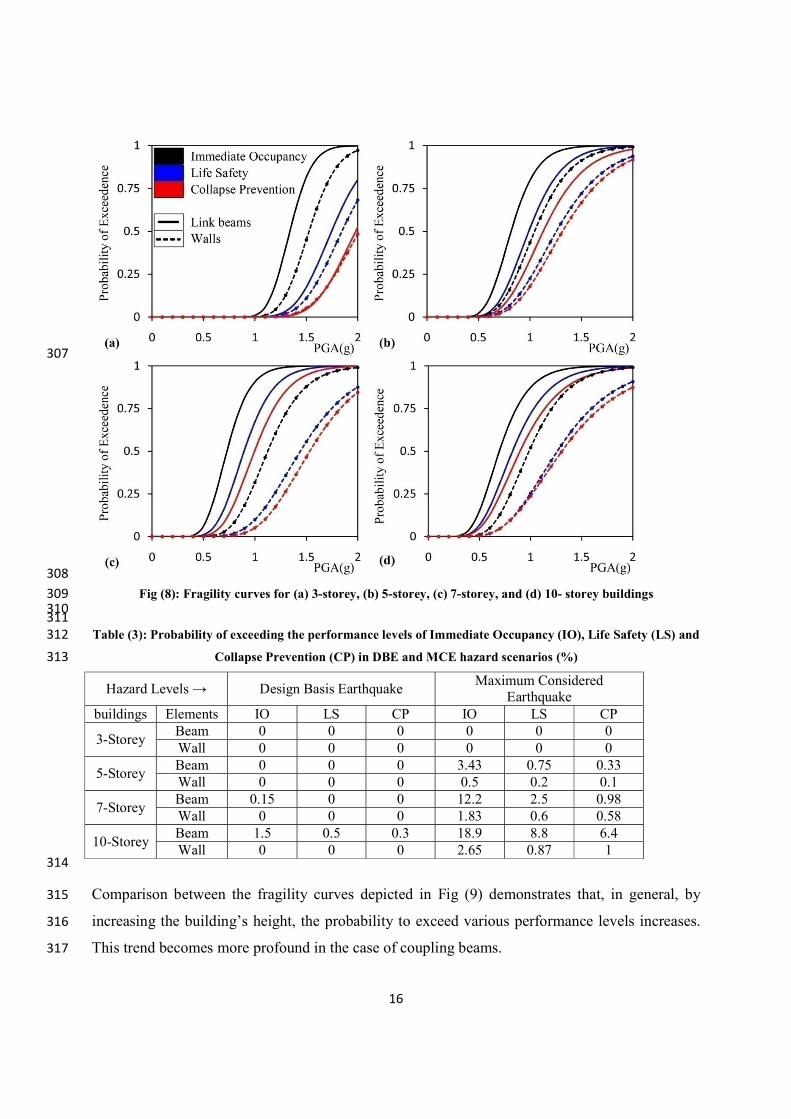
generated for each event of exceedance from these damage states as shown in Fig (8). 295
Table 3 lists the probability of exceeding the performance levels of Immediate Occupancy (IO), 296
Life Safety (LS) and Collapse Prevention (CP) in DBE and MCE hazard scenarios for the 3, 5, 7, 297
and 10- storey buildings. The results show the early damage in the coupling beams compared to 298
the walls, which indicates these elements can play the role of seismic fuse in tunnel-form 299
buildings. In all the buildings used in this study, the probability of exceeding the IO performance 300
level for coupling beams under DBE and MCE hazard levels was less than 2 and 19%, 301
respectively. Accordingly, these values for the walls in the event of DBE and MCE scenarios 302
were around 0 and less than 2%. Based on the results, it can be concluded that the studied tunnel-303
form buildings can practically satisfy IO performance level even under very strong earthquake 304
events. 305
306
16
307
308 Fig (8): Fragility curves for (a) 3-storey, (b) 5-storey, (c) 7-storey, and (d) 10- storey buildings 309
310 311
Table (3): Probability of exceeding the performance levels of Immediate Occupancy (IO), Life Safety (LS) and 312 Collapse Prevention (CP) in DBE and MCE hazard scenarios (%) 313
Hazard Levels → Design Basis Earthquake Maximum Considered Earthquake
buildings Elements IO LS CP IO LS CP
3-Storey Beam 0 0 0 0 0 0 Wall 0 0 0 0 0 0
5-Storey Beam 0 0 0 3.43 0.75 0.33 Wall 0 0 0 0.5 0.2 0.1
7-Storey Beam 0.15 0 0 12.2 2.5 0.98 Wall 0 0 0 1.83 0.6 0.58
10-Storey Beam 1.5 0.5 0.3 18.9 8.8 6.4 Wall 0 0 0 2.65 0.87 1
314
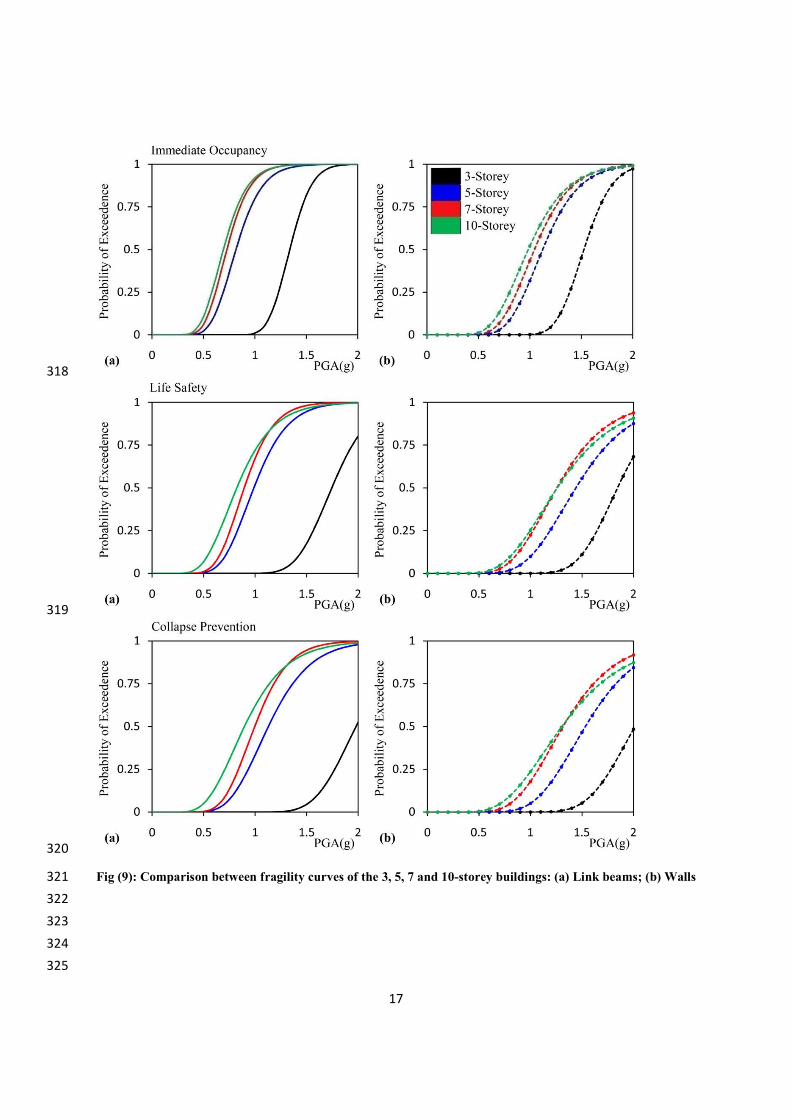
Comparison between the fragility curves depicted in Fig (9) demonstrates that, in general, by 315
increasing the building’s height, the probability to exceed various performance levels increases. 316
This trend becomes more profound in the case of coupling beams. 317
17
318
319
320
Fig (9): Comparison between fragility curves of the 3, 5, 7 and 10-storey buildings: (a) Link beams; (b) Walls 321 322 323 324 325
18
Estimation of Response Modification Factor 326
o Code-Based Response Modification Factor (RCode) 327
The response modification factors provide by the seismic codes are mainly based on engineering 328
judgments, experiences and lessons learned from the past earthquakes. Many researchers have 329
studied the limitations of code-based response modification factors (RCode), concluding that a 330
more rigorous estimation can lead to higher reliability in the methods and provisions prescribed 331
by the seismic codes (e.g. Whittaker et al. 1999). One of the problems with the response 332
modification factor introduced by seismic design codes (RCode) as “force-based method” is that it 333
is unclear what level of intensity and performance can be achieved. 334
As tunnel-form structural system has recently emerged, very limited information is available 335
regarding its performance in the past earthquakes. In addition, currently in most seismic codes 336
this system is considered as a subcategory of “reinforced concrete (RC) bearing wall system”. 337
Therefore, depending on the level of ductility, the response modification factor for tunnel-form is 338
typically considered to be between 3 to 5 (e.g. BHRCP 2007; Standard No.2800 2014). However, 339
considering the 3D behaviour of this structural system due to the interaction between intersecting 340
walls and floor slab, it is not very logical to adopt the parameters related to the RC bearing wall 341
with a 2D performance. This highlights the need to develop suitable behaviour factors for tunnel-342
form buildings as discussed in the previous sections. 343
o Demand-Based Response Modification Factor, RDemand (Displacement/Ductility) 344
The value of demand response modification factor depends on site seismicity as well as physical 345
and geometrical specifications of the building. Several studies have indicated that the parameters 346
like earthquake magnitude and focal depth do not considerably influence this factor compared to 347
the other parameters such as ductility, energy absorption, fundamental period, over-strength, 348
redundancy, number of degrees of freedom and soil type (Lia and Biggs 1980; Miranda 1991; 349
ATC-19 1995). 350
In this study, demand-based response modification factor, RDemand, is calculated based on the 351
following equation: 352
. .MDOFR R RDemand S d (3)
19
where RμMDOF denotes the modification factor originated form ductility and dissipated energy 353
caused by residual behaviour directly extracted from the actual structure comprising of multi 354
degrees of freedom;“Ωs” represents the over-strength factor, by which the effect of redistribution 355
of actions due to redundancy is also considered; and Rd is called the allowable stress factor. It 356
should be mentioned that as the loads and resistance of materials are multiplied by safety factors 357
in allowable stress or ultimate strength design methods, it is required to utilize Rd to reduce the 358
forces to the design strength level. These parameters are calculated based on Equations (4) to (6) 359
(Fanaie and AfsarDizaj 2014). 360
R V Ve y (4) V Vs y s (5)
R V Vd s d (6)
To attain these factors, the following parameters are introduced: 361
For a certain level of intensity, demand spectrum of the site is prepared and the earthquakes 362
compatible with this spectrum are selected. The selected earthquakes which are called demand 363
earthquakes are applied to the structure assuming a linear behaviour, and then the base shear is 364
recorded. The average of the base shear values obtained, is called elastic base shear (Ve). In this 365
study, artificial accelerograms corresponding to the code-based design spectrum were employed, 366
so that the design earthquakes could be compatible with the site hazard as much as possible. In 367
doing so, 10 artificial earthquake records were extracted based on the wavelet transform function 368
from the demand spectrum and then, applied to the structures as shown in Fig (10). It should be 369
noted that the earthquakes given in Table (2), have been utilized to produce the artificial records 370
(Hancock et al. 2006). 371
In the next step, the demand earthquakes were applied to the structure assuming a nonlinear 372
behaviour and the maximum roof displacement was obtained. Average of the drift values induced 373
by the DBE hazard scenario was taken as the target on the capacity curve. After bi-linearization 374
of this curve on the basis of ASCE41-13 (2014), yield base shear (Vy) is obtained. The shear 375
corresponding to the commencement of nonlinear behaviour (Vs), is defined as the point where 376
the capacity curves obtained based on linear and nonlinear behaviour are separated. Design base 377
shear (Vd) is calculated by dividing the linear spectral acceleration multiplied by total building’s 378
weight to the code-based response modification factor. Fig (11) shows the bi-linearization of the 379
capacity curve and the parameters used to calculate the response modification factor. 380
20
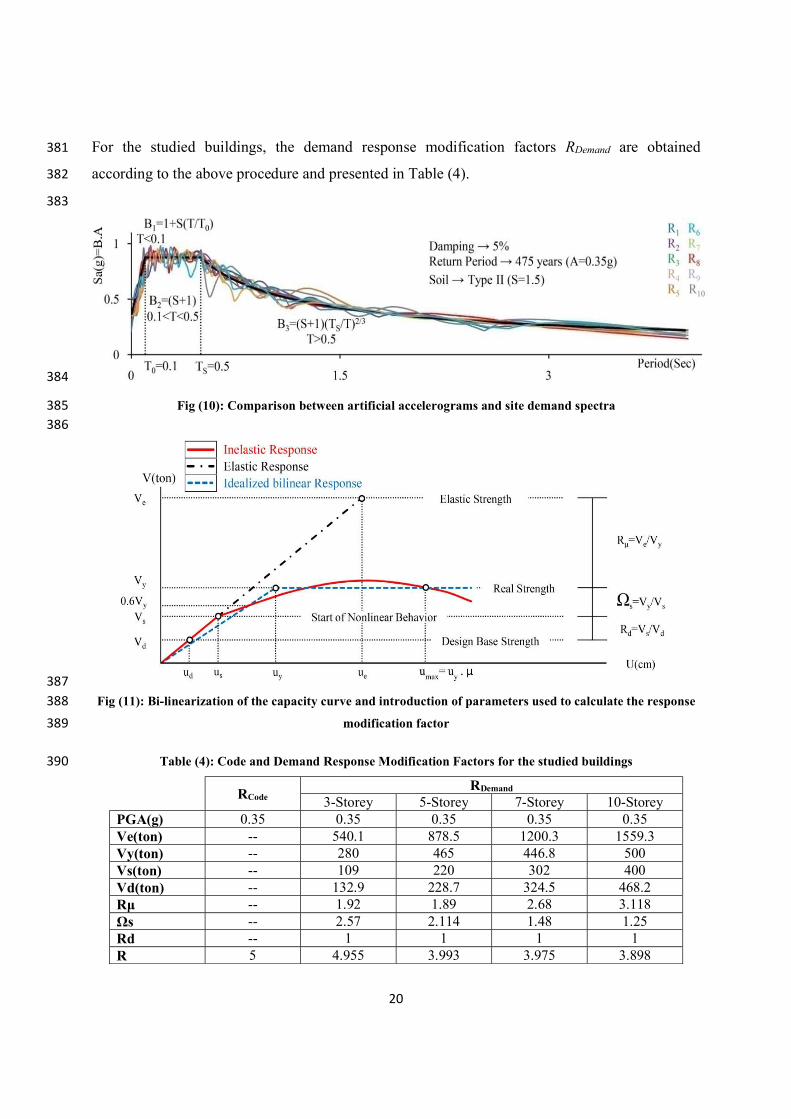
For the studied buildings, the demand response modification factors RDemand are obtained 381
according to the above procedure and presented in Table (4). 382
383
384
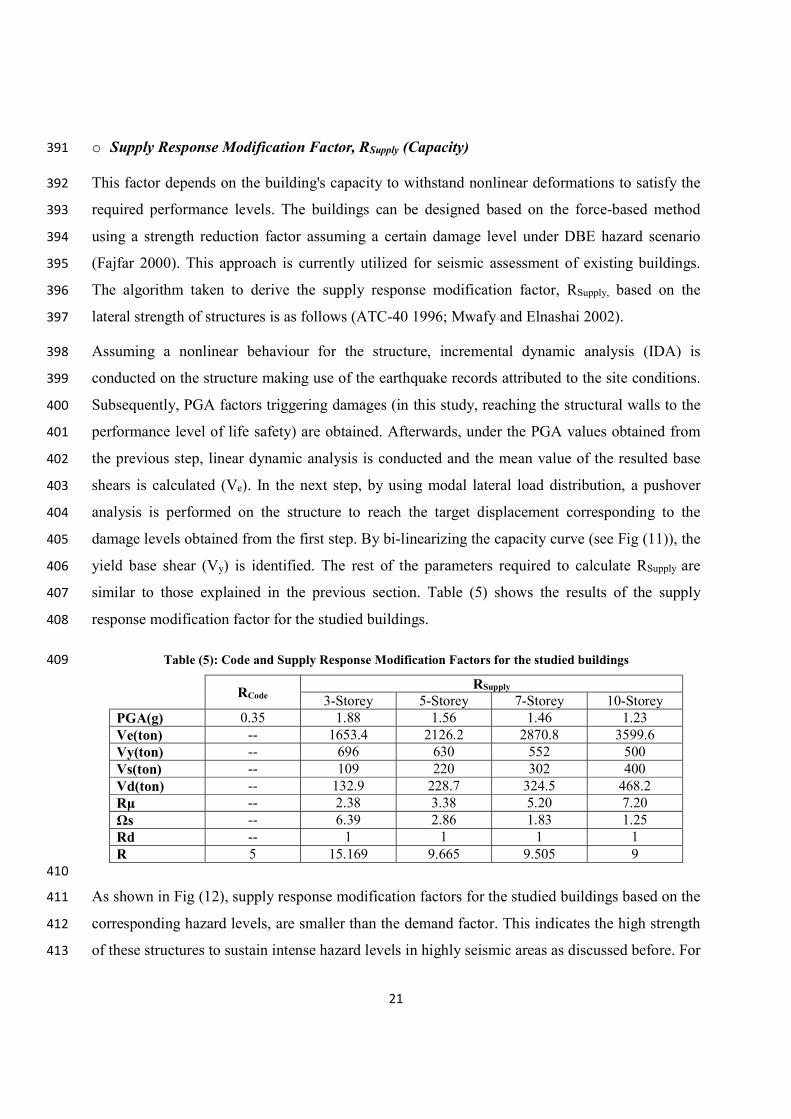
Fig (10): Comparison between artificial accelerograms and site demand spectra 385 386
387 Fig (11): Bi-linearization of the capacity curve and introduction of parameters used to calculate the response 388
modification factor 389
Table (4): Code and Demand Response Modification Factors for the studied buildings 390
RCode RDemand
3-Storey 5-Storey 7-Storey 10-Storey PGA(g) 0.35 0.35 0.35 0.35 0.35 Ve(ton) -- 540.1 878.5 1200.3 1559.3 Vy(ton) -- 280 465 446.8 500 Vs(ton) -- 109 220 302 400 Vd(ton) -- 132.9 228.7 324.5 468.2 Rμ -- 1.92 1.89 2.68 3.118 Ωs -- 2.57 2.114 1.48 1.25 Rd -- 1 1 1 1 R 5 4.955 3.993 3.975 3.898
21
o Supply Response Modification Factor, RSupply (Capacity) 391
This factor depends on the building's capacity to withstand nonlinear deformations to satisfy the 392
required performance levels. The buildings can be designed based on the force-based method 393
using a strength reduction factor assuming a certain damage level under DBE hazard scenario 394
(Fajfar 2000). This approach is currently utilized for seismic assessment of existing buildings. 395
The algorithm taken to derive the supply response modification factor, RSupply, based on the 396
lateral strength of structures is as follows (ATC-40 1996; Mwafy and Elnashai 2002). 397
Assuming a nonlinear behaviour for the structure, incremental dynamic analysis (IDA) is 398
conducted on the structure making use of the earthquake records attributed to the site conditions. 399
Subsequently, PGA factors triggering damages (in this study, reaching the structural walls to the 400
performance level of life safety) are obtained. Afterwards, under the PGA values obtained from 401
the previous step, linear dynamic analysis is conducted and the mean value of the resulted base 402
shears is calculated (Ve). In the next step, by using modal lateral load distribution, a pushover 403
analysis is performed on the structure to reach the target displacement corresponding to the 404
damage levels obtained from the first step. By bi-linearizing the capacity curve (see Fig (11)), the 405
yield base shear (Vy) is identified. The rest of the parameters required to calculate RSupply are 406
similar to those explained in the previous section. Table (5) shows the results of the supply 407
response modification factor for the studied buildings. 408
Table (5): Code and Supply Response Modification Factors for the studied buildings 409
RCode RSupply 3-Storey 5-Storey 7-Storey 10-Storey
PGA(g) 0.35 1.88 1.56 1.46 1.23 Ve(ton) -- 1653.4 2126.2 2870.8 3599.6 Vy(ton) -- 696 630 552 500 Vs(ton) -- 109 220 302 400 Vd(ton) -- 132.9 228.7 324.5 468.2 Rμ -- 2.38 3.38 5.20 7.20 Ωs -- 6.39 2.86 1.83 1.25 Rd -- 1 1 1 1 R 5 15.169 9.665 9.505 9
410
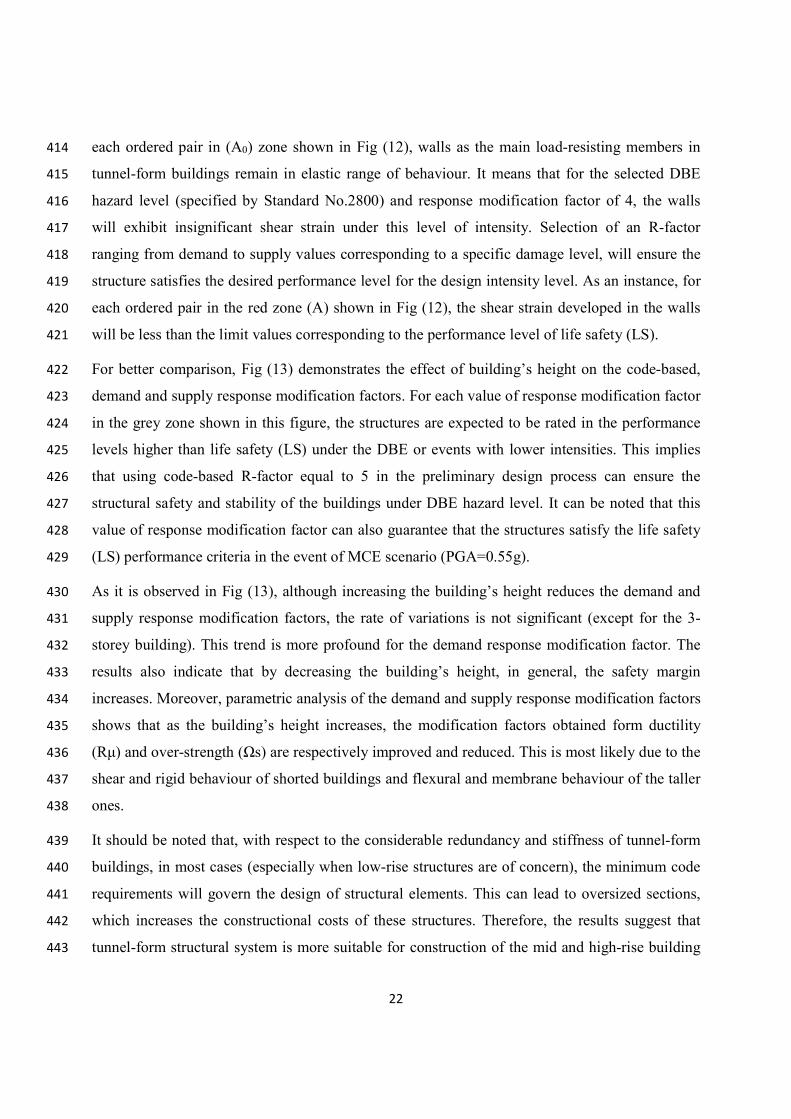
As shown in Fig (12), supply response modification factors for the studied buildings based on the 411
corresponding hazard levels, are smaller than the demand factor. This indicates the high strength 412
of these structures to sustain intense hazard levels in highly seismic areas as discussed before. For 413
22
each ordered pair in (A0) zone shown in Fig (12), walls as the main load-resisting members in 414
tunnel-form buildings remain in elastic range of behaviour. It means that for the selected DBE 415
hazard level (specified by Standard No.2800) and response modification factor of 4, the walls 416
will exhibit insignificant shear strain under this level of intensity. Selection of an R-factor 417
ranging from demand to supply values corresponding to a specific damage level, will ensure the 418
structure satisfies the desired performance level for the design intensity level. As an instance, for 419
each ordered pair in the red zone (A) shown in Fig (12), the shear strain developed in the walls 420
will be less than the limit values corresponding to the performance level of life safety (LS). 421
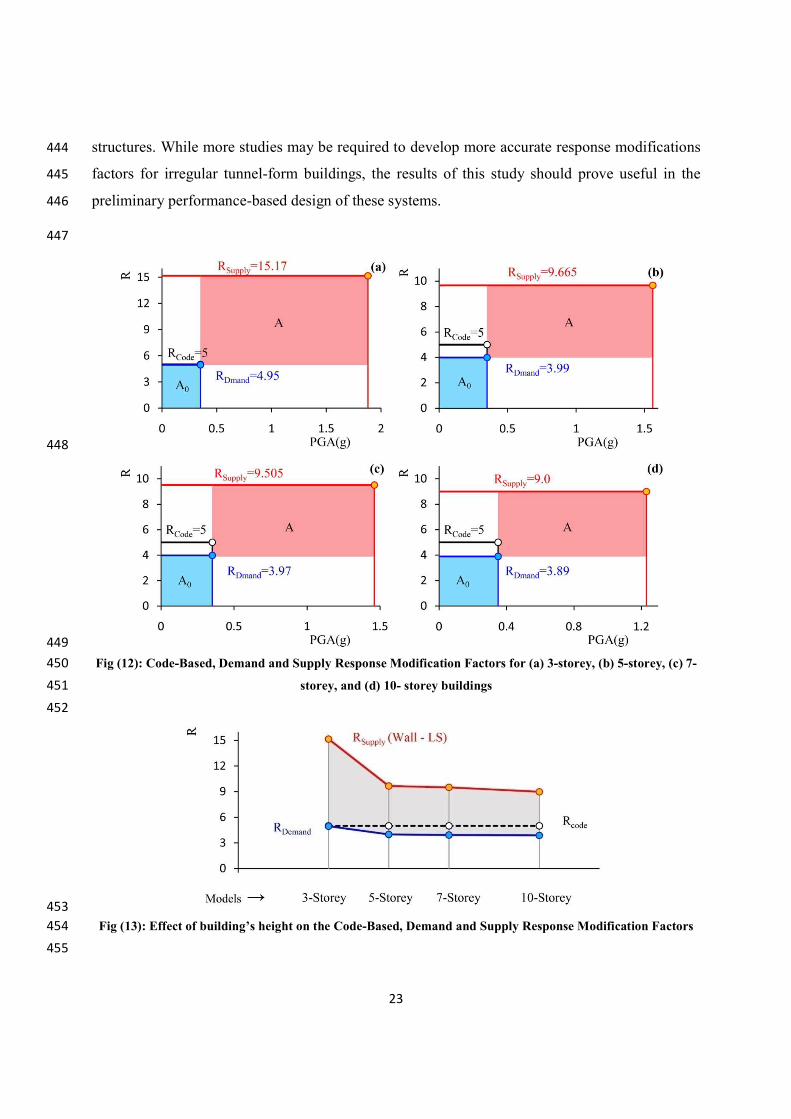
For better comparison, Fig (13) demonstrates the effect of building’s height on the code-based, 422
demand and supply response modification factors. For each value of response modification factor 423
in the grey zone shown in this figure, the structures are expected to be rated in the performance 424
levels higher than life safety (LS) under the DBE or events with lower intensities. This implies 425
that using code-based R-factor equal to 5 in the preliminary design process can ensure the 426
structural safety and stability of the buildings under DBE hazard level. It can be noted that this 427
value of response modification factor can also guarantee that the structures satisfy the life safety 428
(LS) performance criteria in the event of MCE scenario (PGA=0.55g). 429
As it is observed in Fig (13), although increasing the building’s height reduces the demand and 430
supply response modification factors, the rate of variations is not significant (except for the 3-431
storey building). This trend is more profound for the demand response modification factor. The 432
results also indicate that by decreasing the building’s height, in general, the safety margin 433
increases. Moreover, parametric analysis of the demand and supply response modification factors 434
shows that as the building’s height increases, the modification factors obtained form ductility 435
(Rμ) and over-strength (Ωs) are respectively improved and reduced. This is most likely due to the 436
shear and rigid behaviour of shorted buildings and flexural and membrane behaviour of the taller 437
ones. 438
It should be noted that, with respect to the considerable redundancy and stiffness of tunnel-form 439
buildings, in most cases (especially when low-rise structures are of concern), the minimum code 440
requirements will govern the design of structural elements. This can lead to oversized sections, 441
which increases the constructional costs of these structures. Therefore, the results suggest that 442
tunnel-form structural system is more suitable for construction of the mid and high-rise building 443
23
structures. While more studies may be required to develop more accurate response modifications 444
factors for irregular tunnel-form buildings, the results of this study should prove useful in the 445
preliminary performance-based design of these systems. 446
447
448
449 Fig (12): Code-Based, Demand and Supply Response Modification Factors for (a) 3-storey, (b) 5-storey, (c) 7-450
storey, and (d) 10- storey buildings 451 452
453 Fig (13): Effect of building’s height on the Code-Based, Demand and Supply Response Modification Factors 454
455
24
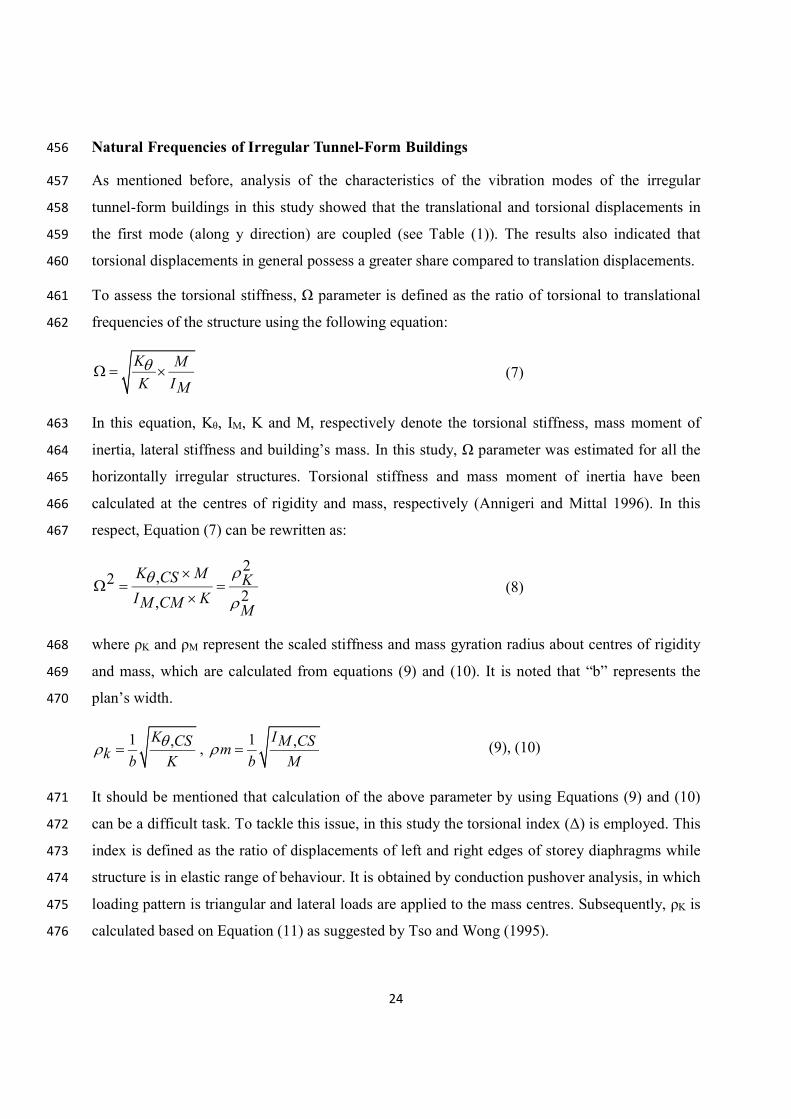
Natural Frequencies of Irregular Tunnel-Form Buildings 456
As mentioned before, analysis of the characteristics of the vibration modes of the irregular 457
tunnel-form buildings in this study showed that the translational and torsional displacements in 458
the first mode (along y direction) are coupled (see Table (1)). The results also indicated that 459
torsional displacements in general possess a greater share compared to translation displacements. 460
To assess the torsional stiffness, Ω parameter is defined as the ratio of torsional to translational 461
frequencies of the structure using the following equation: 462
K MK IM (7)
In this equation, Kθ, IM, K and M, respectively denote the torsional stiffness, mass moment of 463
inertia, lateral stiffness and building’s mass. In this study, Ω parameter was estimated for all the 464
horizontally irregular structures. Torsional stiffness and mass moment of inertia have been 465
calculated at the centres of rigidity and mass, respectively (Annigeri and Mittal 1996). In this 466
respect, Equation (7) can be rewritten as: 467
2,2
2,
K MCS KI KM CM M
(8)
where ρK and ρM represent the scaled stiffness and mass gyration radius about centres of rigidity 468
and mass, which are calculated from equations (9) and (10). It is noted that “b” represents the 469
plan’s width. 470
1 ,K CSk b K
, 1 ,IM CSmb M
(9), (10)
It should be mentioned that calculation of the above parameter by using Equations (9) and (10) 471
can be a difficult task. To tackle this issue, in this study the torsional index (Δ) is employed. This 472
index is defined as the ratio of displacements of left and right edges of storey diaphragms while 473
structure is in elastic range of behaviour. It is obtained by conduction pushover analysis, in which 474
loading pattern is triangular and lateral loads are applied to the mass centres. Subsequently, ρK is 475
calculated based on Equation (11) as suggested by Tso and Wong (1995). 476
25
1
min 1 1 0.52 2maxe e
k k
(11)
where δmin and δmax are minimum and maximum displacements of the edge, respectively 477
(displacement of stiff edge of diaphragm as shown in Fig 1); Δ represents the ratio of minimum 478
to maximum displacements; and e and η are the distance between centres of rigidity and mass and 479
the distance between the centres of geometry and rigidity, respectively (both normalized to the 480
plan’s width). In this study, for each storey, ρK is calculated based on the latter equation. 481
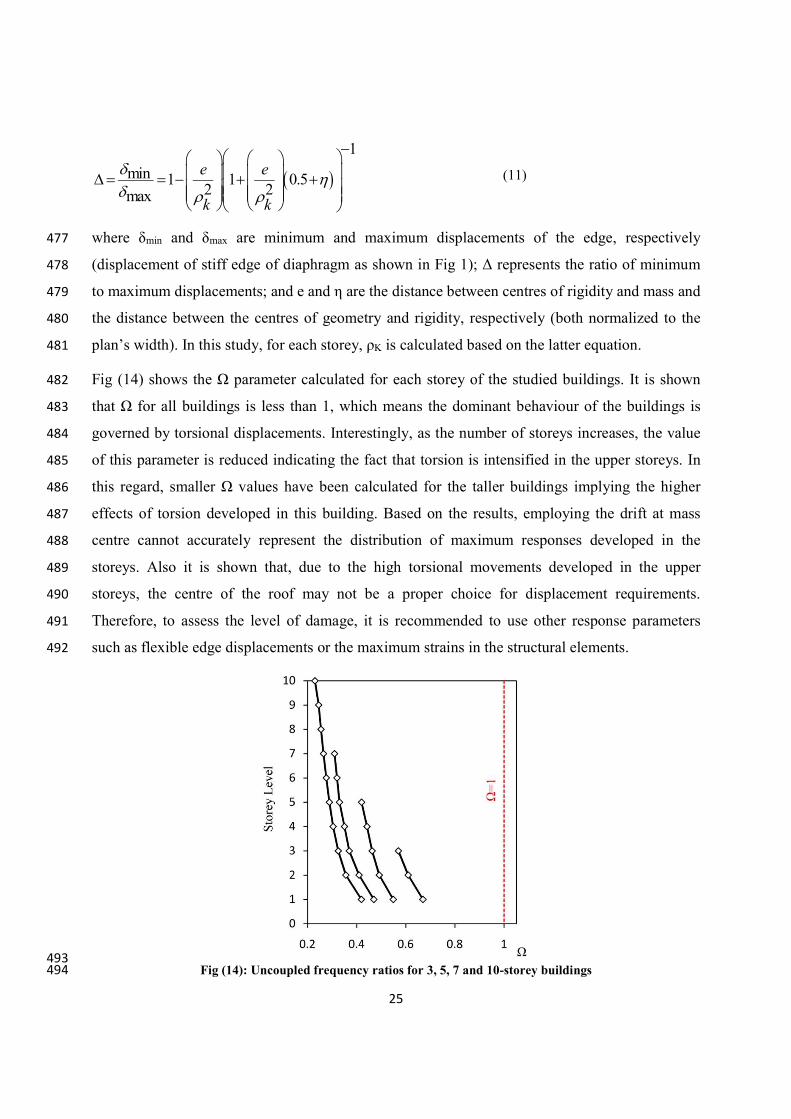
Fig (14) shows the Ω parameter calculated for each storey of the studied buildings. It is shown 482
that Ω for all buildings is less than 1, which means the dominant behaviour of the buildings is 483
governed by torsional displacements. Interestingly, as the number of storeys increases, the value 484
of this parameter is reduced indicating the fact that torsion is intensified in the upper storeys. In 485
this regard, smaller Ω values have been calculated for the taller buildings implying the higher 486
effects of torsion developed in this building. Based on the results, employing the drift at mass 487
centre cannot accurately represent the distribution of maximum responses developed in the 488
storeys. Also it is shown that, due to the high torsional movements developed in the upper 489
storeys, the centre of the roof may not be a proper choice for displacement requirements. 490
Therefore, to assess the level of damage, it is recommended to use other response parameters 491
such as flexible edge displacements or the maximum strains in the structural elements. 492
493 Fig (14): Uncoupled frequency ratios for 3, 5, 7 and 10-storey buildings 494
26
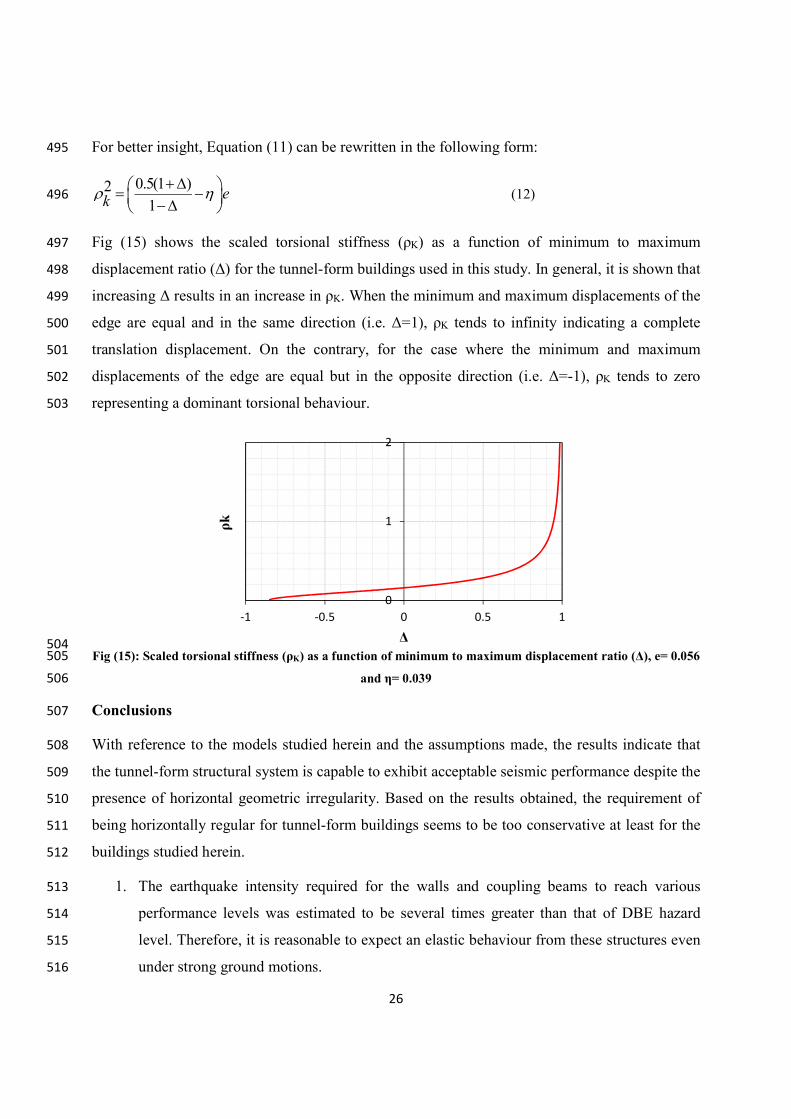
For better insight, Equation (11) can be rewritten in the following form: 495
0.5(1 )21
ek (12) 496
Fig (15) shows the scaled torsional stiffness (ρK) as a function of minimum to maximum 497
displacement ratio (Δ) for the tunnel-form buildings used in this study. In general, it is shown that 498
increasing Δ results in an increase in ρK. When the minimum and maximum displacements of the 499
edge are equal and in the same direction (i.e. Δ=1), ρK tends to infinity indicating a complete 500
translation displacement. On the contrary, for the case where the minimum and maximum 501
displacements of the edge are equal but in the opposite direction (i.e. Δ=-1), ρK tends to zero 502
representing a dominant torsional behaviour. 503
504 Fig (15): Scaled torsional stiffness (ρK) as a function of minimum to maximum displacement ratio (Δ), e= 0.056 505
and η= 0.039 506
Conclusions 507
With reference to the models studied herein and the assumptions made, the results indicate that 508
the tunnel-form structural system is capable to exhibit acceptable seismic performance despite the 509
presence of horizontal geometric irregularity. Based on the results obtained, the requirement of 510
being horizontally regular for tunnel-form buildings seems to be too conservative at least for the 511
buildings studied herein. 512
1. The earthquake intensity required for the walls and coupling beams to reach various 513
performance levels was estimated to be several times greater than that of DBE hazard 514
level. Therefore, it is reasonable to expect an elastic behaviour from these structures even 515
under strong ground motions. 516
0
1
2
-1 -0.5 0 0.5 1
ρk
Δ
27
2. Based on the probabilistic investigations on 3, 5, 7 and 10-storey tunnel-form irregular 517
buildings, the probability for the coupling beams to reach the performance level of 518
immediate occupancy (IO) is less than 2 and 19% under DBE and MCE hazard levels, 519
respectively. Likewise, the probability of reaching the same performance level for the 520
walls is approximately 0 and 2%, respectively. This indicates that the studied buildings 521
can practically satisfy IO performance level under both hazard levels. 522
3. Due to the larger seismic demands of coupling beams compared to those of the walls, 523
these elements can act as a seismic fuse in tunnel-form buildings to absorb and dissipate 524
the earthquake input energy, especially in lower seismic intensities 525
4. For a specific level of intensity, the seismic reliability of tunnel-form buildings is 526
generally reduced as the height (i.e. number of storeys) increases. This trend is especially 527
evident in the case of coupling beams. 528
5. The governing behaviour of the horizontally irregular tunnel-form buildings studied 529
herein is a flexible torsional mode, in which the torsional response is intensified by 530
increasing in the building’s height. Besides, it was found that, in general, the diaphragm 531
rotational displacements increase from the bottom to the top of the structures. Irregularity-532
induced torsions also intensify the displacement demands in the perimeter parts of the 533
buildings and thus, damages are initiated from those parts. 534
6. With respect to the greater values of displacement raised by torsion compared to the 535
translational movements, it appears that using the drift at storey mass centre as damage 536
measure (DM) is not appropriate for irregular tunnel-form buildings. In this respect, other 537
damage measures such as flexible edge drift or local damage measures for beams and 538
walls are recommended. 539
7. Response modification factor of the studied buildings based on the selected hazard levels 540
is smaller than the values estimated for the supply modification factor when the walls 541
reach the life safety performance level. This highlights the fact that such structures exhibit 542
sufficient strength and safety under intense hazard levels. It was shown that considering 543
the code-based response modification factor of 5 for preliminary design of irregular 544
tunnel-form buildings can ensure the structural safety and stability of the buildings under 545
both DBE and MCE hazard scenarios. 546
28
8. Parametric analysis on the demand and supply response modification factors indicates 547
that increasing the building’s height results in an increase and a decrease in the 548
modification factors originated by ductility and over-strength, respectively. Increasing the 549
building’s height, can also transform the shear-dominant behaviour to the membrane and 550
flexural type response in tunnel-form structural systems. 551
552
References 553
ACI Committee 318 (2014). Building code requirements for structural concrete (ACI 318-14) 554 and commentary, American Concrete Institute. 555
Allouzi R, Alkloub A (2017) New nonlinear dynamic response model of squat/-slender 556 flanged/non-flanged reinforced concrete walls, Structural Concrete, PP.1-15. 557
Ang AHS, Tang WH (2007) Probability Concepts in Engineering: Emphasis on Applications to 558 Civil and Environmental Engineering, 1, Wiley, 2nd Edition, the University of Michigan. 559
Annigeri S, Mittal AK (1996) Uncoupled Frequency Ratio in Asymmetric Buildings, Earthquake 560 Engineering and Structural Dynamics, 25, PP.871-881. 561
ASCE (2014) Seismic rehabilitation of existing buildings, ASCE/SEI41-13, American Society of 562 Civil Engineers. 563
ASCE (2016) Minimum Design Loads and Associated Criteria for Buildings and Other 564 Structures, ASCE/SEI 7-16, American Society of Civil Engineers, Reston, Virginia. 565
ATC (1995) Structural Response Modification Factors, ATC-19 Report, Applied Technology 566 Council, Redwood City, California. 567
ATC (1996), Seismic Evaluation of Concrete Buildings, Vol.1, ATC-40, Applied Technology 568 Council, Redwood, CA. 569
Balkaya C, Kalkan E (2003a) Estimation of fundamental periods of shear-wall dominant building 570 structures, Earthquake Engineering and structural dynamics, 32(7), PP. 985-998. 571
Balkaya C, Kalkan E (2003b) Seismic Design Parameters for Shear-Wall Dominant Building 572 Structures, 14th national congress on Earthquake Engineering, mexico. 573
Balkaya C, Kalkan E (2004b) Seismic Vulnerability, Behavior and Design of Tunnel Form 574 Building Structures, Engineering Structures, 26(14), PP.2081-2099. 575
Balkaya C, Yuksel SB, Derinoz O (2012) Soil-Structure Interaction Effects on the Fundamental 576 Periods of the Shear-Wall Dominant Buildings, The Structural Design of Tall and Special 577 Buildings, 21(6), PP.416-430. 578
Balkaya, C.,Kalkan, E. (2004a) Relevance of R-Factor and Fundamental Period for Seismic 579 Design of Tunnel-Form Building, 13th World Conference on Earthquake Engineering, 580 Vancouver, Canada. 581
Beheshti-Aval SB, Mohsenian V, Sadegh-Kouhestani H (2018) Seismic performance-based 582 assessment of tunnel form buildings subjected to near- and far-fault ground motions, Asian 583 Journal of Civil Engineering, 19(1), PP.79-92. 584
29
Berahman F, Behnamfar F (2007) Seismic Fragility Curves for Un Anchored on-Grade Steel 585 Storage Tanks: Bayesian Approach, Journal of Earthquake Engineering, 11, PP.166-192. 586
BHRCP (2007) Approved technologies indirection of sub-note 2-6, paragraph "D", Note 587 6, “A step in direction of building industrialization”, first edition, Building and Housing 588 Research Center Press, pages 21 and 22. 589
CEN (Comité Européen de Normalization) (2004). Eurocode 8: Design of structures for 590 earthquake resistance-Part 1: General rules, seismic actions and rules for buildings, EN 1998-591 1-1, Brussels. 592
Cimellaro GP, Reinhorn AM, Bruneau M, Rutenberg A (2006) Multi-Dimensional Fragility of 593 Structures: Formulation and Evaluation, Technical Report MCEER-06-0002. 594
Computers and Structures Inc. (CSI), (2015). Structural and Earthquake Engineering Software, 595 ETABS, Extended Three Dimensional Analysis of Building Systems Nonlinear Version 596 15.2.2, Berkeley, CA, USA. 597
Computers and Structures Inc. (CSI), (2016), Structural and Earthquake Engineering Software, 598 PERFORM-3D Nonlinear Analysis and Performance Assessment for 3D Structures, Version 599 6.0.0, Berkeley, CA, USA. 600
Fajfar P (2000) A Nonlinear Analysis Method for Performance Based Seismic Design, 601 Earthquake Spectra, l16 (3), PP.573-592. 602
Fanaie N, AfsarDizaj E (2014) Response modification factor of the frames braced with reduced 603 yielding segment BRB, Structural Engineering and Mechanics, 50(1), PP. 1-17. 604
Ghobarah A (2004). On drift limits associated with different damage levels. International 605 Workshop on Performance-based Seismic Design Concepts and Implementation, Bled, 606 Slovenia. 607
Goel RK, Chopra AK (1998) Period Formulas for Concrete Shear Wall Buildings, Journal of 608 Structural Engineering, 124(4), PP.426-433. 609
Hajirasouliha I, Pilakoutas K, Mohammadi RK (2016) Effects of uncertainties on seismic 610 behaviour of optimum designed braced steel frames. Steel and Composite Structures, 20(2), 611 pp. 317-335. 612
Hancock J, Watson-Lamprey J, Abrahamson NA, Bommer JJ, Markatis A, McCoy E, Mendis R 613 (2006) An Improved Method of Matching Response Spectra of Recorded Earthquake Ground 614 Motion Using Wavelets, Journal of Earthquake Engineering, 10,PP. 67-89. 615
Kalkan E, Yuksel SB (2007) Pros and Cons of Multi Story RC Tunnel-Form (Box-Type) 616 Buildings, The Structural Design of Tall and Special Buildings, 17(3), PP.601-617. 617
Kinali K (2007) Seismic Fragility Assessment of Steel Frames in the Central and Eastern United 618 States, APh.D Thesis, School of Civil and Environmental Engineering, Georgia Institute of 619 Technology. 620
Klasanovic I, Kraus I, Hadzima-Nyarko Ma (2014) Dynamic Properties of Multistory Reinforced 621 Concrete Tunnel-Form Building – A Case Study in Osijek, Croatia, Forecast Engineering: 622 Global Climate change and the challenge for built environment, Weimar, Germany. 623
Lee L, Chang K, Chun Y (2000) Experimental Formula for the Fundamental Period of RC 624 Building with Shear Wall Dominant Systems, Structural Design of Tall Buildings, 9(4), PP. 625 295-307. 626
30
Lia SP, Biggs JM (1980) Inelastic response spectra for seismic building design, Journal of the 627 Structural Division (ASCE) 106(ST6), PP.1295-1310. 628
Miranda E (1991) Seismic evaluation & upgrading of existing buildings, A P.hd Thesis, 629 University of California @ Berkeley. 630
Mohsenian V, Mortezaei A (2018a) Seismic reliability evaluation of tunnel form (box-type) RC 631 structures under the accidental torsion, Structural Concrete, pp.1-12, DOI: 632 10.1002/suco.201700276. 633
Mohsenian V, Mortezaei A (2018b), Effect of steel coupling beam on the seismic reliability 634 and R-factor of box-type buildings, Structures and Buildings. 635
Mwafy AM, Elnashai AS (2002) Calibration of force reduction factors of RC buildings. Journal 636 of Earthquake Engineering, 6(2), PP. 239-273. 637
Nielson BG (2005) Analytical Fragility Curves for Highway Bridges in Moderate Seismic Zones, 638 A Ph.D Thesis, School of Civil and Environmental Engineering, Georgia Institute of 639 Technology. 640
Paulay T, Binney JR (1974) Diagonally reinforced coupling beams of shear walls”, Shear in 641 reinforced concrete, ACI Special Publications 42, PP.579-598. 642
PEER Ground Motion Database, Pacific Earthquake Engineering Research Center, Web Site: 643 http://peer.berkeley.edu/peer_ground_motion_database. 644
Permanent Committee for Revising the Standard 2800, Iranian Code of Practice for Seismic 645 Resistant Design of Buildings, 4th Edition, Building and Housing Research Center, 2014, 646 Tehran, Iran. 647
Shome N, Cornell CA (1999) Probabilistic Seismic Demand Analysis of Nonlinear Structures, 648 Reliability of Marine Structures Report No: RMS-35, Civil and Environmental Engineering, 649 Stanford University. 650
Tavafoghi A, Eshghi S (2008) Seismic Behavior of Tunnel Form Concrete Building Structures, 651 14th World Conference on Earthquake Engineering, 12-17 October, Beijing, China. 652
Tavafoghi A, Eshghi S (2011) Evaluation of behavior factor of tunnel-form concrete building 653 structures using Applied Technology Council 63,The Structural Design of Tall and Special 654 Buildings, 22(8), PP.615-634. 655
Tso WK, Wong CM (1995) Eurocode8 seismic torsional provision evaluation, European 656 Earthquake Engineering, IX, 9(1), PP.23-33. 657
Vamvatsikos D, Cornell CA (2002) Incremental Dynamic Analysis, Earthquake Engineering 658 Structural Dynamics, 31(3), PP.491-514. 659
Whittaker A, Hart G, Rojahn C (1999) Seismic response modification factors, Journal of 660 Structural Engineering, 125, PP. 438-444. 661
Yuksel SB, Kalkan E (2007) Behavior of Tunnel form Buildings under quasi_static cyclic lateral 662 loading, Structural Engineering and Mechanics, 27(1), PP.99-115. 663
Zhao ZZ, Kwan AKH, He XG (2004) Nonlinear Finite Element Analysis of Deep Reinforced 664 Concrete Coupling Beams, Engineering Structures, 26(1), PP.13-25. 665
Related Documents


