ESTIMATION OF PARAMETERS OF THE TORQUE CONVERTER OF AN AUTOMATIC TRANSMISSION OF A PASSENGER VEHICLE Elias Dias Rossi Lopes 1 , André Flora Alves Pinto 1 and Caio César do Prado Dorea Reis 1 1 Instituto Militar de Engenharia E-mails: [email protected], [email protected], [email protected] ABSTRACT The automatic transmission has been becoming more usual in the modern vehicles, even those considered low cost ones. The torque converter is the device responsible for the coupling between the engine and the gearbox in automatic transmission vehicles. In this context, this research aims the simulation and estimation of parameters of the automatic transmission of a passenger vehicle. In that purpose, it is implemented the Particle Swarm Optimization Method, which assists in obtaining parameters of the torque converter’s curve from the engine full-load curve and the car real traction diagram. The torque converter’s curves have fundamental importance, and only manufacturers have possession of that information. Beyond that, through those curves, it is possible: to raise the profit of the company, to develop an automobile that is economic in terms of fuel consumption and offers a better adaptation of the engine characteristic curve to the ideal traction curve. INTRODUCTION The methodology used in this article aims to obtain parameters of the characteristic curves of a TRILOK torque converter through the Particle Swarm Optimization (PSO) Method. To this end, this introductory section is subdivided into three subsections, in order to detail the process as a whole. The first subsection details the operating principle of a TRILOK torque converter, as well as it presents its characteristics curves. At its end, the parametrization adopted for these curves and the parameters that the method seeks to estimate are specified. In the second subsection, the matching process is approaches, which is the process of coupling between the full-load engine curve and the transmission system. The matching equating is presented and specifies as the process is performed for vehicle equipped with a torque converter. The matching process is also known as the direct problem and is used as the basis for formulating the inverse method. Finally, in the last subsection, is presented the methodology of inverse problems in general. The concept of objective function is defined and the formulation adopted is presented. Focus is given to the stochastic method known as Particle Swarm Optimization, which is detailed and equated.

Welcome message from author
This document is posted to help you gain knowledge. Please leave a comment to let me know what you think about it! Share it to your friends and learn new things together.
Transcript

ESTIMATION OF PARAMETERS OF THE TORQUE CONVERTER OF
AN AUTOMATIC TRANSMISSION OF A PASSENGER VEHICLE
Elias Dias Rossi Lopes1, André Flora Alves Pinto1 and Caio César do Prado Dorea Reis1
1Instituto Militar de Engenharia
E-mails: [email protected], [email protected], [email protected]
ABSTRACT
The automatic transmission has been becoming more usual in the modern vehicles, even those
considered low cost ones. The torque converter is the device responsible for the coupling
between the engine and the gearbox in automatic transmission vehicles. In this context, this
research aims the simulation and estimation of parameters of the automatic transmission of a
passenger vehicle. In that purpose, it is implemented the Particle Swarm Optimization
Method, which assists in obtaining parameters of the torque converter’s curve from the engine
full-load curve and the car real traction diagram. The torque converter’s curves have
fundamental importance, and only manufacturers have possession of that information. Beyond
that, through those curves, it is possible: to raise the profit of the company, to develop an
automobile that is economic in terms of fuel consumption and offers a better adaptation of the
engine characteristic curve to the ideal traction curve.
INTRODUCTION
The methodology used in this article aims to obtain parameters of the characteristic curves of
a TRILOK torque converter through the Particle Swarm Optimization (PSO) Method. To this
end, this introductory section is subdivided into three subsections, in order to detail the
process as a whole.
The first subsection details the operating principle of a TRILOK torque converter, as well as it
presents its characteristics curves. At its end, the parametrization adopted for these curves and
the parameters that the method seeks to estimate are specified.
In the second subsection, the matching process is approaches, which is the process of
coupling between the full-load engine curve and the transmission system. The matching
equating is presented and specifies as the process is performed for vehicle equipped with a
torque converter. The matching process is also known as the direct problem and is used as the
basis for formulating the inverse method.
Finally, in the last subsection, is presented the methodology of inverse problems in general.
The concept of objective function is defined and the formulation adopted is presented. Focus
is given to the stochastic method known as Particle Swarm Optimization, which is detailed
and equated.
1. TORQUE CONVERTER
The basis of most of the types of automatic and semi-automatic transmissions used in vehicles
engines is hydrodynamic coupling, so called because it operates with kinetic energy of the
circulating fluid. This type of coupling involves a hydrodynamic clutch or a torque converter.
Despite being similar in their constructions, the torque converter is capable of multiplying
torque while the hydrodynamic clutch is not [1].
The hydrodynamic couplings use the inertia of the flow of a fluid. The individual components
of a transmission of this type are the fluid flow devices. A rotatory pump plays the role of
source of energy and the turbine of a primary engine. The mechanical energy applied through
the transmission shaft is converted into hydraulic energy from the fluid and then back into the
mechanical energy in the turbine, which is available (except losses) on the output shaft. The
basic difference between a hydrodynamic clutch and a torque converter is that the torque has,
in addition to the pump and turbine, a stator [2].
The advantages of a hydrodynamic clutch and a torque converter can be combined to avoid a
decaying section in the efficiency curve of the torque converter. This type of device is known
as a TRILOK torque converter and its simple construction and high level of efficiency make
this converter suitable for vehicle transmissions and therefore are the only ones used in
passenger cars. The torque converter operates in the first phase up to the lock-up point. In the
second phase, the stator is released from the housing by a free wheel mechanism. As the stator
rotates freely, there is no more torque conversion [2].
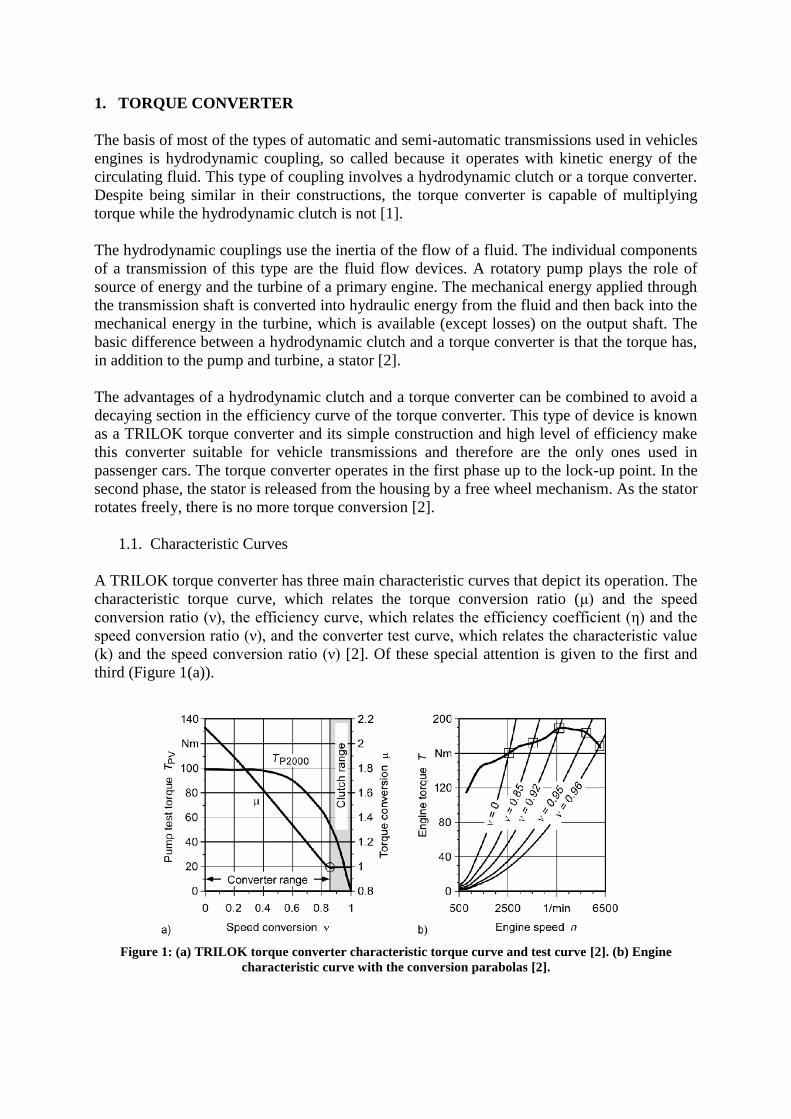
1.1. Characteristic Curves
A TRILOK torque converter has three main characteristic curves that depict its operation. The
characteristic torque curve, which relates the torque conversion ratio (μ) and the speed
conversion ratio (ν), the efficiency curve, which relates the efficiency coefficient (η) and the
speed conversion ratio (ν), and the converter test curve, which relates the characteristic value
(k) and the speed conversion ratio (ν) [2]. Of these special attention is given to the first and
third (Figure 1(a)).
Figure 1: (a) TRILOK torque converter characteristic torque curve and test curve [2]. (b) Engine
characteristic curve with the conversion parabolas [2].
Some characteristic point of the curves can be highlighted, such as, the stall point in which the
speed conversion ratio is zero and the torque conversion ratio is maximum, and the lock-up
point at which the converter starts operating as a hydrodynamic clutch assuming unitary
torque conversion ratio.
The converter test curve is used to define the operating point in the engine characteristic curve
in which the converter will act under certain torque and speed conversion ratios. The pump
torque parabolas at an instantaneous conversion speed ratio (the so-called conversion
parabolas) are added to the characteristic engine curve (Figure 1(b)) using the converter test
curve and the Equation (1). These are the SPAN conversion parabolas covering a field of
possible operational points [2].
2)(
P
P
n
Tk = (1)
1.2. Parametrization
The application of the inverse problem methodology is performed with the purpose of
obtaining the characteristic curves of a torque converter. In this direction, the characteristic
and the test curves are parametrized with the help of a discrete set of parameters in order to
represent them continuously and in the most faithful way possible.
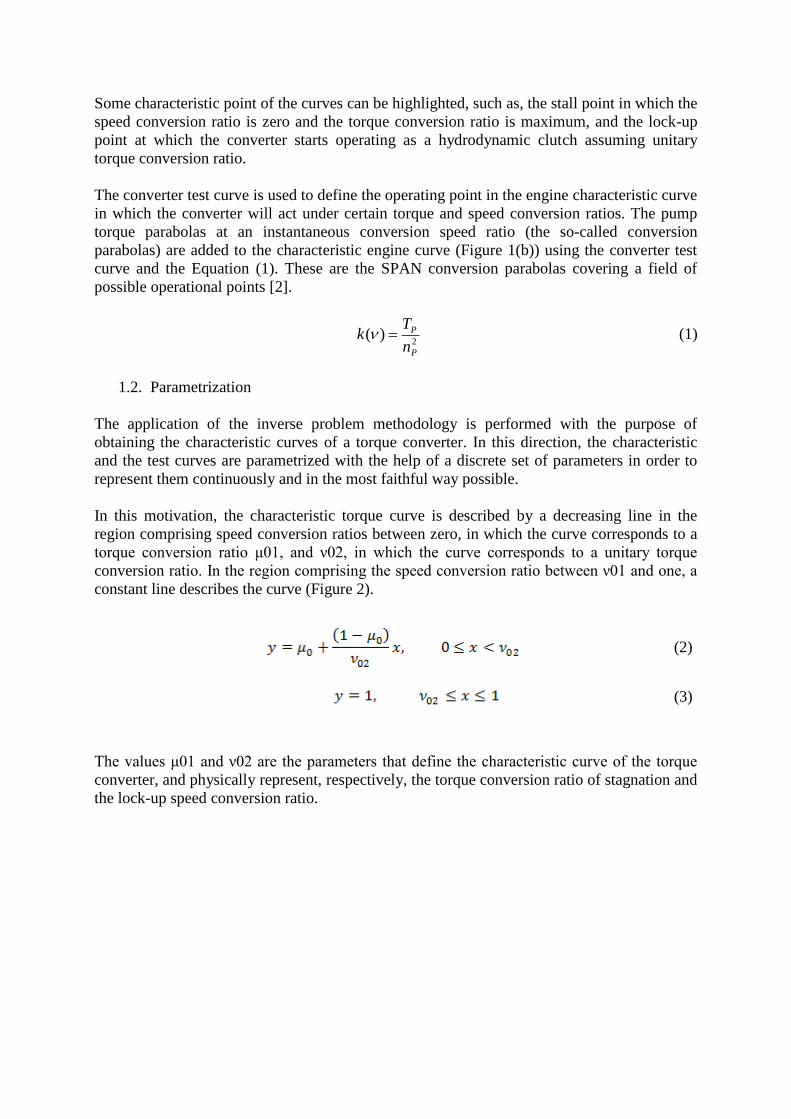
In this motivation, the characteristic torque curve is described by a decreasing line in the
region comprising speed conversion ratios between zero, in which the curve corresponds to a
torque conversion ratio μ01, and ν02, in which the curve corresponds to a unitary torque
conversion ratio. In the region comprising the speed conversion ratio between ν01 and one, a
constant line describes the curve (Figure 2).
(2)
(3)
The values μ01 and ν02 are the parameters that define the characteristic curve of the torque
converter, and physically represent, respectively, the torque conversion ratio of stagnation and
the lock-up speed conversion ratio.
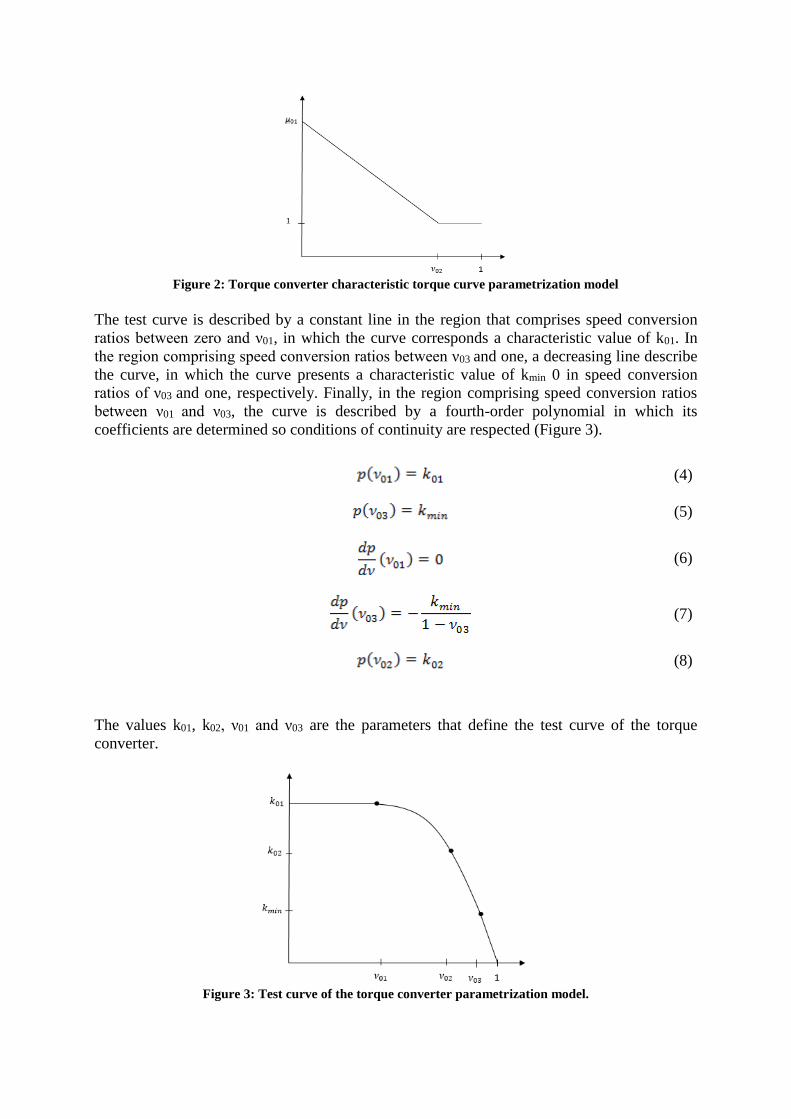
Figure 2: Torque converter characteristic torque curve parametrization model
The test curve is described by a constant line in the region that comprises speed conversion
ratios between zero and ν01, in which the curve corresponds a characteristic value of k01. In
the region comprising speed conversion ratios between ν03 and one, a decreasing line describe
the curve, in which the curve presents a characteristic value of kmin 0 in speed conversion
ratios of ν03 and one, respectively. Finally, in the region comprising speed conversion ratios
between ν01 and ν03, the curve is described by a fourth-order polynomial in which its
coefficients are determined so conditions of continuity are respected (Figure 3).
(4)
(5)
(6)
(7)
(8)
The values k01, k02, ν01 and ν03 are the parameters that define the test curve of the torque
converter.
Figure 3: Test curve of the torque converter parametrization model.
1.3. Matching
Matching is the process of coupling the engine to the vehicle transmission. This is a problem
in the field of vehicle longitudinal dynamics. The powertrain and its optimal conditions of
work are acquired through computer simulations, bench and road tests. Vehicle transmissions
are the connection between the engine and the drive wheels. The transmission adapts the
power output to the power requirement of the car and to do that, it converts torque and
rotational speed.
In this process of matching, the traction force available in the wheels and velocity of the
vehicle can be calculated from the engine torque and speed, the dynamic radius of the tyre,
the powertrain efficiency and the overall gear ratio, for a certain set of speed and torque
conversion ratios. These calculations are equated by Equation (2) and Equation (3),
respectively [2].
tot
dyn
AMAZ
r
inTF
=
)(, (9)
A
dynM
i
rnV
=
(10)
2. INVERSE PROBLEMS
Inverse problems are a field of study of applied mathematics that consists in discovering the
causes from its consequences, in other words, to make the reverse process to obtain
parameters or an inherent function of a system, from its behavior or its dynamics. Solutions of
inverse problems involve stabilization techniques and are based on the reformulation of direct
problems. The use of optimization techniques is not mandatory, but it is quite common to
solve inverse problems.
Methods of solving inverse problems can be divided into stochastic and deterministic.
Deterministic methods are computationally faster than stochastic, although they may converge
to a local or non-global maximum or minimum, as desired. In addition, there are hybrid
methods that combine the two so that the response can be achieved more quickly and
appropriately, they can be combined as iterations progress within the program [3].
In order to solve inverse problems, optimization techniques must be used. Therefore the first
step in solving inverse problems is the definition of the objective function. The objective
function is the mathematical representation that is under evaluation and needs to be
minimized or maximized. The relation between the objective function and its variables can be
expressed through mathematical or physical models and in the impossibility, it is used the
determination by experiments [3]. In this article the objective function used is the sum of the
quadratic differences between the available traction calculated by the matching process and
the withdrawal directly from the traction diagram, as equated in Equation (4).
−= 2
, )( diagAZobj FFf (11)

2.1. Particle Swarm Optimization (PSO)
Particle Swarm Optimization (PSO) is a computational stochastic method that optimizes a
problem through iterations by looking for a candidate solution of a measurable parameter. It
solves the problem through a population of solution candidates and moving these particles
into the search space. Each particle has its movement influenced by its best local position, but
it also is guided by the best position of the entire population.
The method is based on the behavior of various species and attempts to balance the
individual’s individuality and sociability to locate the optimum point of interest. The iterative
process can be represented by Equations (5) and (6), in which the left-hand term of the
equality sign represents the particle in the iteration number k + 1, the first right-hand term
represents the particle in the iteration number k, and the second, third and fourth terms
represent the inertia, the individuality and the sociability, respectively [3].
11 ++ += k
i
k
i
k
i vxx (12)
)()( 2211
1 k
igi
k
iii
k
i
k
i xprxprvv −+−+=+ (13)
The entire methodology developed by this article of the application of the PSO to the
matching problem in order to estimate parameters from the characteristic curves of a torque is
summed up by the flow chart (Figure 4).
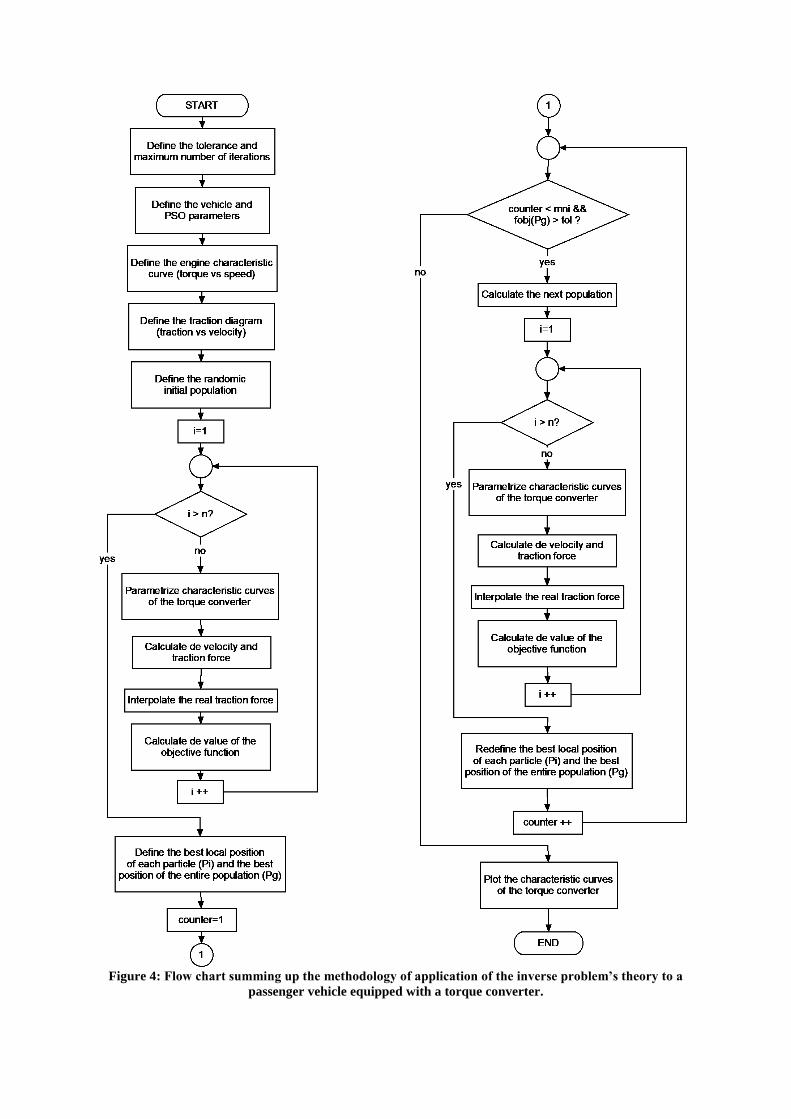
Figure 4: Flow chart summing up the methodology of application of the inverse problem’s theory to a
passenger vehicle equipped with a torque converter.
3. RESULTS
The results obtained in this article are exposed in the (Figure 5), (Figure 6) and (Figure 7).
These results are obtained by the following data from a mid-size passenger car with a spark
ignition engine, whose data, characteristic curves of the engine and torque converter, and
traction diagram are shown in [2]. The methodology presented in previous sections is
implemented with de help of the mathematical software MATLAB®.
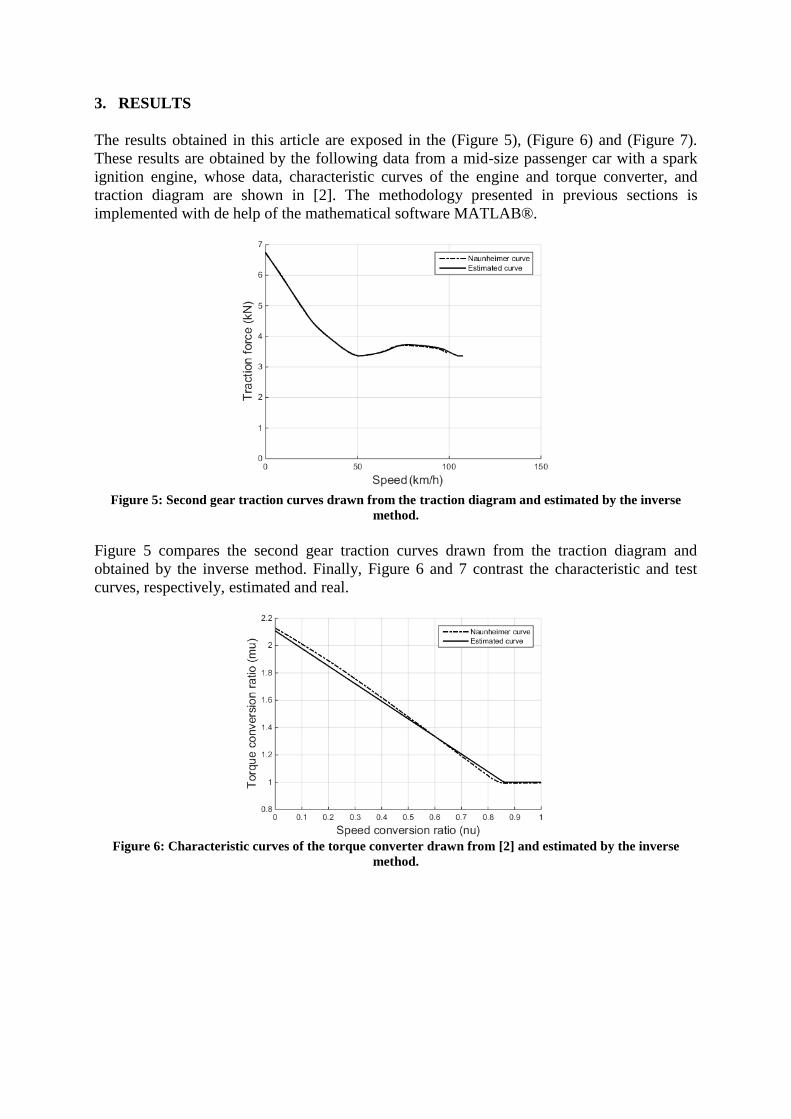
Figure 5: Second gear traction curves drawn from the traction diagram and estimated by the inverse
method.
Figure 5 compares the second gear traction curves drawn from the traction diagram and
obtained by the inverse method. Finally, Figure 6 and 7 contrast the characteristic and test
curves, respectively, estimated and real.
Figure 6: Characteristic curves of the torque converter drawn from [2] and estimated by the inverse
method.
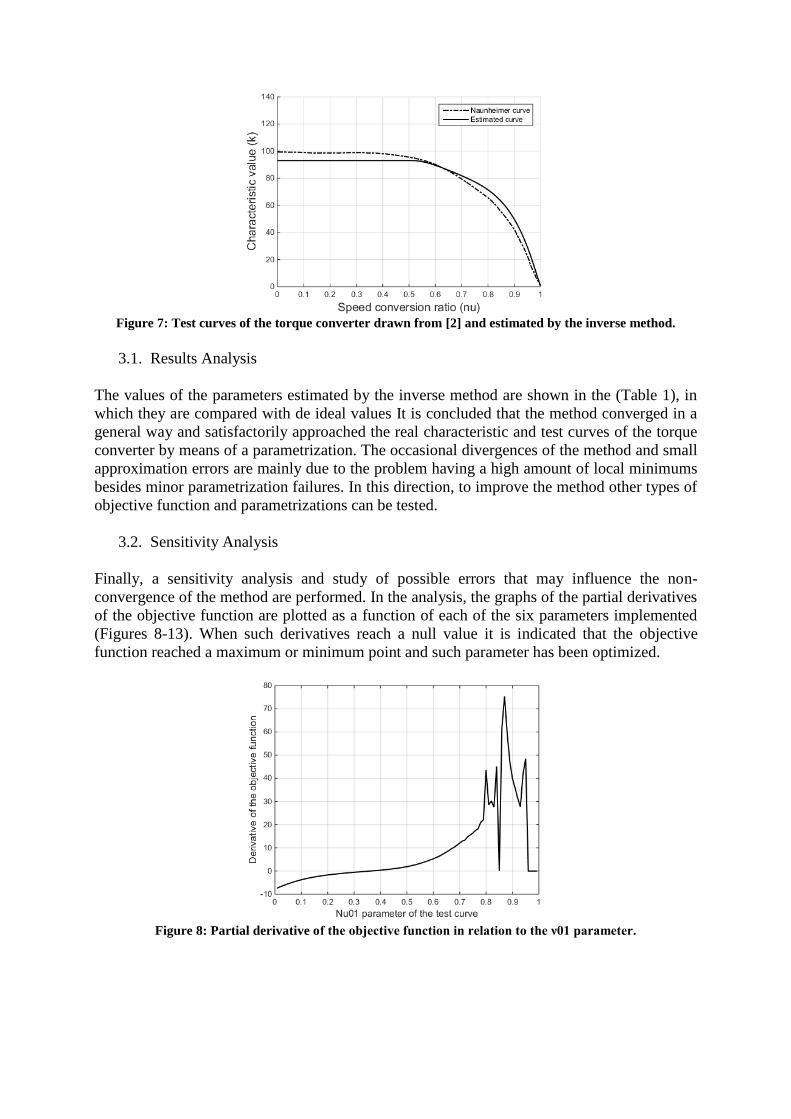
Figure 7: Test curves of the torque converter drawn from [2] and estimated by the inverse method.
3.1. Results Analysis
The values of the parameters estimated by the inverse method are shown in the (Table 1), in
which they are compared with de ideal values It is concluded that the method converged in a
general way and satisfactorily approached the real characteristic and test curves of the torque
converter by means of a parametrization. The occasional divergences of the method and small
approximation errors are mainly due to the problem having a high amount of local minimums
besides minor parametrization failures. In this direction, to improve the method other types of
objective function and parametrizations can be tested.
3.2. Sensitivity Analysis
Finally, a sensitivity analysis and study of possible errors that may influence the non-
convergence of the method are performed. In the analysis, the graphs of the partial derivatives
of the objective function are plotted as a function of each of the six parameters implemented
(Figures 8-13). When such derivatives reach a null value it is indicated that the objective
function reached a maximum or minimum point and such parameter has been optimized.
Figure 8: Partial derivative of the objective function in relation to the ν01 parameter.
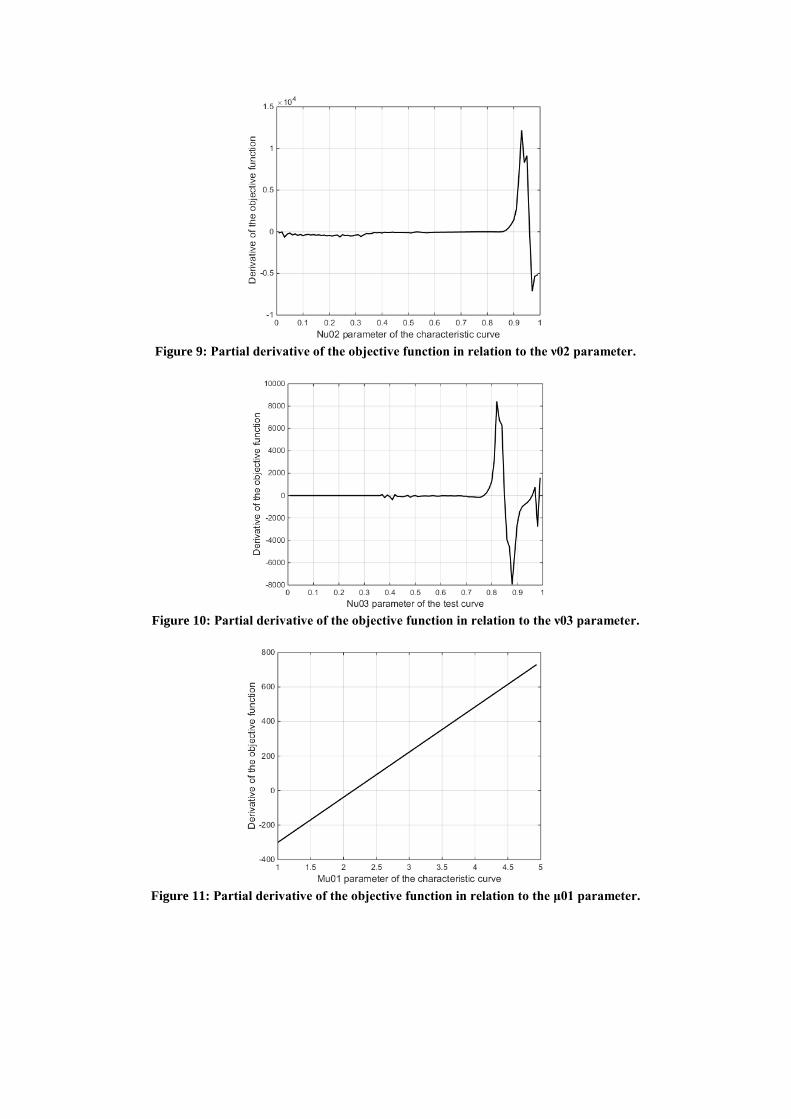
Figure 9: Partial derivative of the objective function in relation to the ν02 parameter.
Figure 10: Partial derivative of the objective function in relation to the ν03 parameter.
Figure 11: Partial derivative of the objective function in relation to the μ01 parameter.
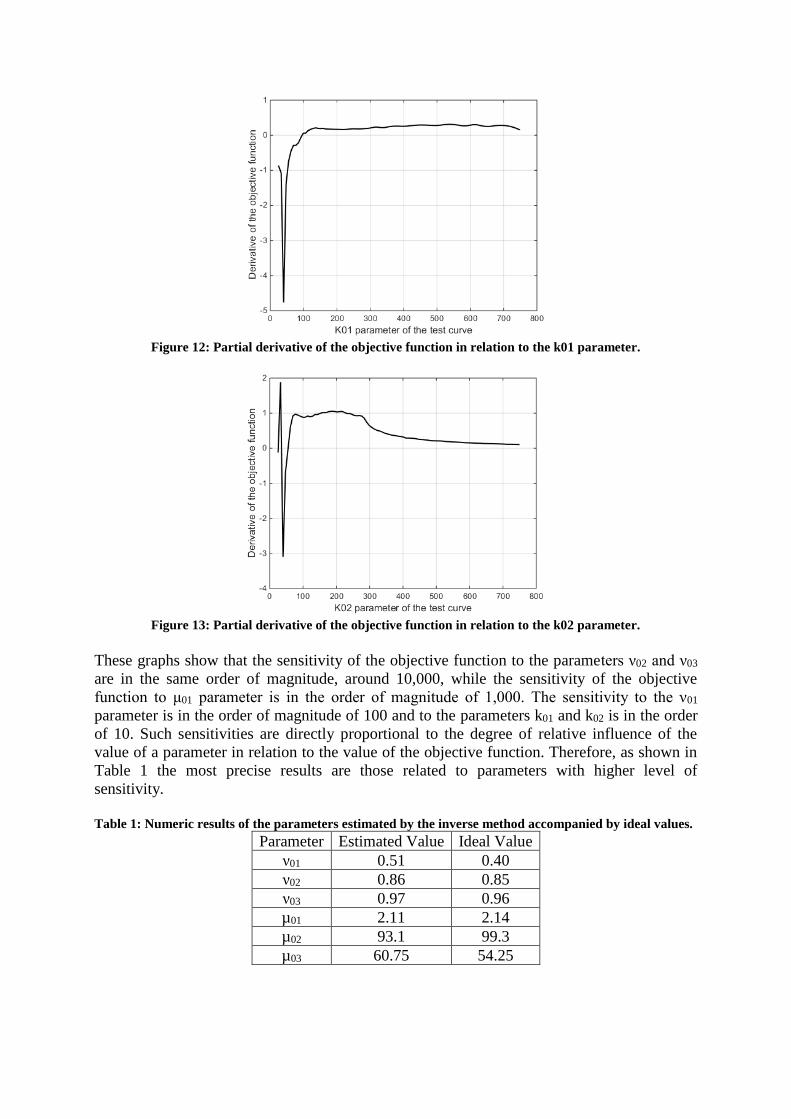
Figure 12: Partial derivative of the objective function in relation to the k01 parameter.
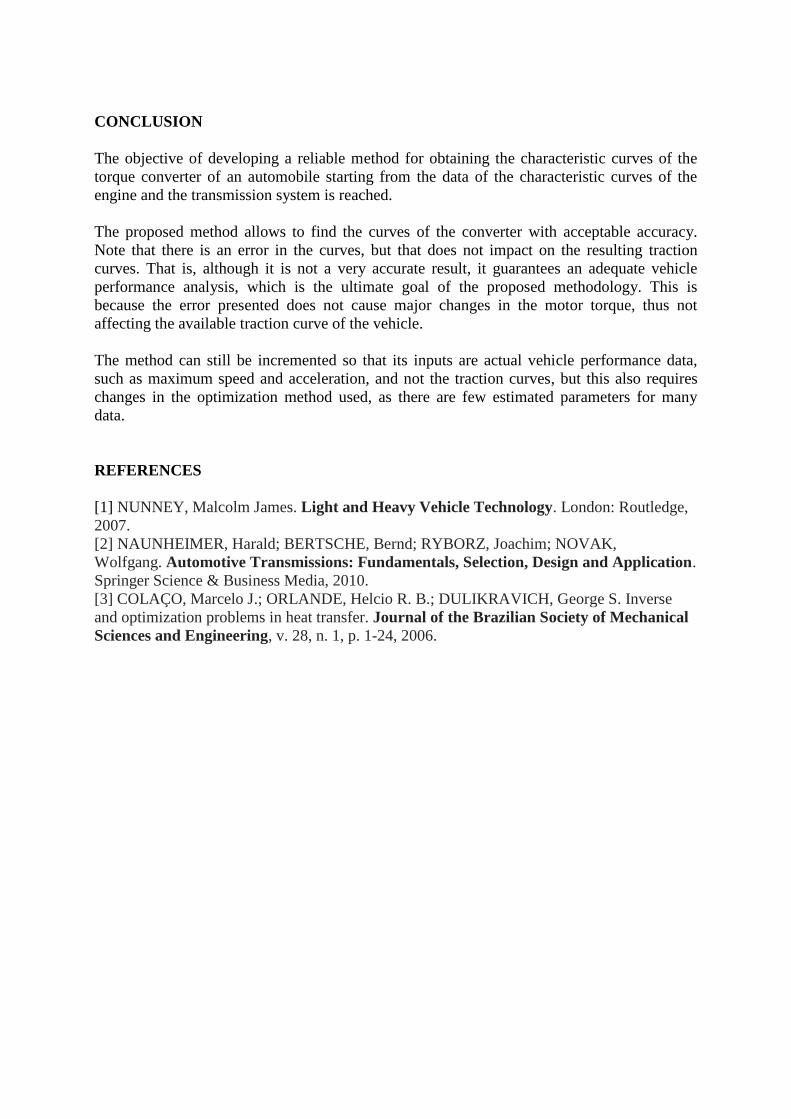
Figure 13: Partial derivative of the objective function in relation to the k02 parameter.
These graphs show that the sensitivity of the objective function to the parameters ν02 and ν03
are in the same order of magnitude, around 10,000, while the sensitivity of the objective
function to μ01 parameter is in the order of magnitude of 1,000. The sensitivity to the ν01
parameter is in the order of magnitude of 100 and to the parameters k01 and k02 is in the order
of 10. Such sensitivities are directly proportional to the degree of relative influence of the
value of a parameter in relation to the value of the objective function. Therefore, as shown in
Table 1 the most precise results are those related to parameters with higher level of
sensitivity.
Table 1: Numeric results of the parameters estimated by the inverse method accompanied by ideal values.
Parameter Estimated Value Ideal Value
ν01 0.51 0.40
ν02 0.86 0.85
ν03 0.97 0.96
µ01 2.11 2.14
µ02 93.1 99.3
µ03 60.75 54.25
CONCLUSION
The objective of developing a reliable method for obtaining the characteristic curves of the
torque converter of an automobile starting from the data of the characteristic curves of the
engine and the transmission system is reached.
The proposed method allows to find the curves of the converter with acceptable accuracy.
Note that there is an error in the curves, but that does not impact on the resulting traction
curves. That is, although it is not a very accurate result, it guarantees an adequate vehicle
performance analysis, which is the ultimate goal of the proposed methodology. This is
because the error presented does not cause major changes in the motor torque, thus not
affecting the available traction curve of the vehicle.
The method can still be incremented so that its inputs are actual vehicle performance data,
such as maximum speed and acceleration, and not the traction curves, but this also requires
changes in the optimization method used, as there are few estimated parameters for many
data.
REFERENCES
[1] NUNNEY, Malcolm James. Light and Heavy Vehicle Technology. London: Routledge,
2007.
[2] NAUNHEIMER, Harald; BERTSCHE, Bernd; RYBORZ, Joachim; NOVAK,
Wolfgang. Automotive Transmissions: Fundamentals, Selection, Design and Application.
Springer Science & Business Media, 2010.
[3] COLAÇO, Marcelo J.; ORLANDE, Helcio R. B.; DULIKRAVICH, George S. Inverse
and optimization problems in heat transfer. Journal of the Brazilian Society of Mechanical
Sciences and Engineering, v. 28, n. 1, p. 1-24, 2006.
Related Documents


