1 23 National Academy Science Letters ISSN 0250-541X Natl. Acad. Sci. Lett. DOI 10.1007/s40009-014-0236-5 Estimation of Genetic Diversity in Capsicum annuum L. Germplasm Using PCR-Based Molecular Markers Maneet Rana, Rajnish Sharma, Parul Sharma, Sat Vrat Bhardwaj & Manish Sharma

Welcome message from author
This document is posted to help you gain knowledge. Please leave a comment to let me know what you think about it! Share it to your friends and learn new things together.
Transcript
1 23
National Academy Science Letters ISSN 0250-541X Natl. Acad. Sci. Lett.DOI 10.1007/s40009-014-0236-5
Estimation of Genetic Diversity inCapsicum annuum L. Germplasm UsingPCR-Based Molecular Markers
Maneet Rana, Rajnish Sharma, ParulSharma, Sat Vrat Bhardwaj & ManishSharma
1 23
Your article is protected by copyright and all
rights are held exclusively by The National
Academy of Sciences, India. This e-offprint
is for personal use only and shall not be self-
archived in electronic repositories. If you wish
to self-archive your article, please use the
accepted manuscript version for posting on
your own website. You may further deposit
the accepted manuscript version in any
repository, provided it is only made publicly
available 12 months after official publication
or later and provided acknowledgement is
given to the original source of publication
and a link is inserted to the published article
on Springer's website. The link must be
accompanied by the following text: "The final
publication is available at link.springer.com”.
RESEARCH ARTICLE
Estimation of Genetic Diversity in Capsicum annuum L.Germplasm Using PCR-Based Molecular Markers
Maneet Rana • Rajnish Sharma • Parul Sharma •
Sat Vrat Bhardwaj • Manish Sharma
Received: 3 April 2013 / Revised: 29 October 2013 / Accepted: 1 November 2013
� The National Academy of Sciences, India 2014
Abstract The importance of germplasm characterization is
an important link between the conservation and utilization of
plant genetic resources in various breeding programmes. In
the present study, genetic variability and relationships among
twenty-four Capsicum annuum L. genotypes were tested
using PCR-based RAPD and ISSR molecular markers. The
level of polymorphism across genotypes was 42–44 % as
revealed by RAPD and ISSR, respectively. The highest
similarity was detected between PC-1, Feroz, Gajio, Kan-
daghat Selection-9 genotypes (96 %) and Feroz, Kandaghat
Selection-9 (93 %), by RAPD and ISSR markers, respec-
tively. It was concluded from the pooled analysis of both
molecular markers that genotypes ACC-2 and Mahog were
most distantly related to each other. Hence, it is recommended
that these two genotypes should be crossed to create a seg-
regating population with maximum genetic diversity. Fur-
ther, it is suggested that molecular markers are valid tags for
the assessment of genetic diversity in C. annuum germplasm.
Keywords Genetic diversity � RAPD �ISSR and Capsicum
Introduction
Capsicum annuum L. popularly known as sweet pepper,
bell pepper, capsicum and shimla mirch is a high value
solanaceous vegetable crop grown extensively in Karna-
taka, Tamil Nadu, Himachal Pradesh, Uttrakhand and
Darjeeling district of West Bengal. It is used either raw as
salad, cooked as vegetable, pickled or processed and is
appreciated worldwide for its flavor, aroma and color. It
has some medicinal properties and is used in treatment of
dropsy, colic, toothache and cholera [1]. Being an eco-
nomically important cultivated crop, genetic diversity is
essential for successful breeding and creation of new cul-
tivars [2]. Characterization and evaluation of crop varieties
based on morphological characteristics is often difficult,
since most of these characteristics are under the influence
of environmental factors. Developments in DNA based
technologies have revolutionized the utilization of molec-
ular markers in genetics and breeding studies [3, 4]. Ran-
dom amplified polymorphic DNA (RAPD-PCR) and inter-
simple sequence repeat polymerase chain reaction (ISSR-
PCR) technique have been widely used to quantify the
genetic variation due to its simplicity and power to detect
differences, even among closely related individuals, in
species of pepper [5]. Keeping in view the above consid-
erations and importance of germplasm characterization as
an important link between the conservation and utilization
of plant genetic resources, the present investigations were
carried out to analyze genetic diversity in C. annuum
germplasm using PCR based molecular markers (RAPD
and ISSR) analysis.
Materials and Methods
The present investigation was carried out in the Depart-
ment of Biotechnology, Dr YS Parmar University of Hor-
ticulture and Forestry, Nauni, Solan (HP) India. Twenty-
four genotypes of C. annuum L. were obtained from the
M. Rana � R. Sharma (&) � P. Sharma � S. V. Bhardwaj
Department of Biotechnology, Dr YS Parmar University of
Horticulture and Forestry, Nauni, Solan, HP 173 230, India
e-mail: [email protected]
M. Sharma
Department of Vegetable Sciences, Dr YS Parmar University of
Horticulture and Forestry, Nauni, Solan, HP 173 230, India
123
Natl. Acad. Sci. Lett.
DOI 10.1007/s40009-014-0236-5
Author's personal copy
Department of Vegetable Science of Dr YS Parmar Uni-
versity of Horticulture and Forestry, Nauni, Solan (HP)
India, which were previously collected from different
locations. These genotypes were inbred lines that were
selfed for two generations.
Molecular Markers Studies
Isolation of DNA was carried out from the leaves of Cap-
sicum germplasm by using CTAB method with some
modifications [6]. The DNA samples from the different
Capsicum genotypes were amplified using polymerase
chain reaction (PCR) using the protocol of Williams and
coworkers with a few modifications [7]. PCR was carried
out in a 25 ll reaction volume containing Taq DNA poly-
merase (3 U/reaction), Taq DNA polymerase buffer (19)
with 1.5 mM MgCl2, random decamer primers (10
pmol/reaction), deoxynucleotide triphosphate (dNTPs)
(25 mM) of Genei, Bangalore, India and template DNA
(50 ng/reaction). A total of 30 RAPD and 20 ISSR primers
were employed to characterize 24 genotypes of C. annuum
L. at their respective annealing temperatures (Tables 1; 2)
using a thermal cycler (Applied Biosystems, USA)
programmed to preliminary denaturation of DNA at 94 �C
for 4 min followed by 35 cycles of 94 �C for 1 min, 30 �C
for 1 min and 72 �C for 2 min. After 35 cycles, there was a
final step of 8 min at 72 �C followed by a 4 �C soak until
recovery. Products were analysed using 100 bp standard
molecular weight marker (GeNei, Bangalore, India) by
electrophoresis on 1.6 % agarose (GeNei, Bangalore, India)
gel in 1X TAE buffer for RAPD analysis and 2.0 % agarose
(GeNei, Bangalore, India) gel in 1X TAE buffer for ISSR
analysis containing ethidium bromide (10 mg/ml) respec-
tively and images were taken through Gel Documentation
Unit (Syngene, UK). Only those primers which produced
bands with all the samples were used to score for
polymorphism.
Similarity matrix was generated from binary data using
Jaccard Coefficient. The similarity matrix thus generated
was used for pair-group method with arithmetic average
(UPGMA) using software package NTSYS-PC 2.0 h [8].
Thus output data was graphically represented as dendro-
grams along with bootstrap values ([30) on the branches
using DARwin software for RAPD, ISSR and pooled
markers analysis, respectively. Marker index for RAPD
and ISSR markers was calculated in order to characterize
the capacity of each primer to detect polymorphic loci
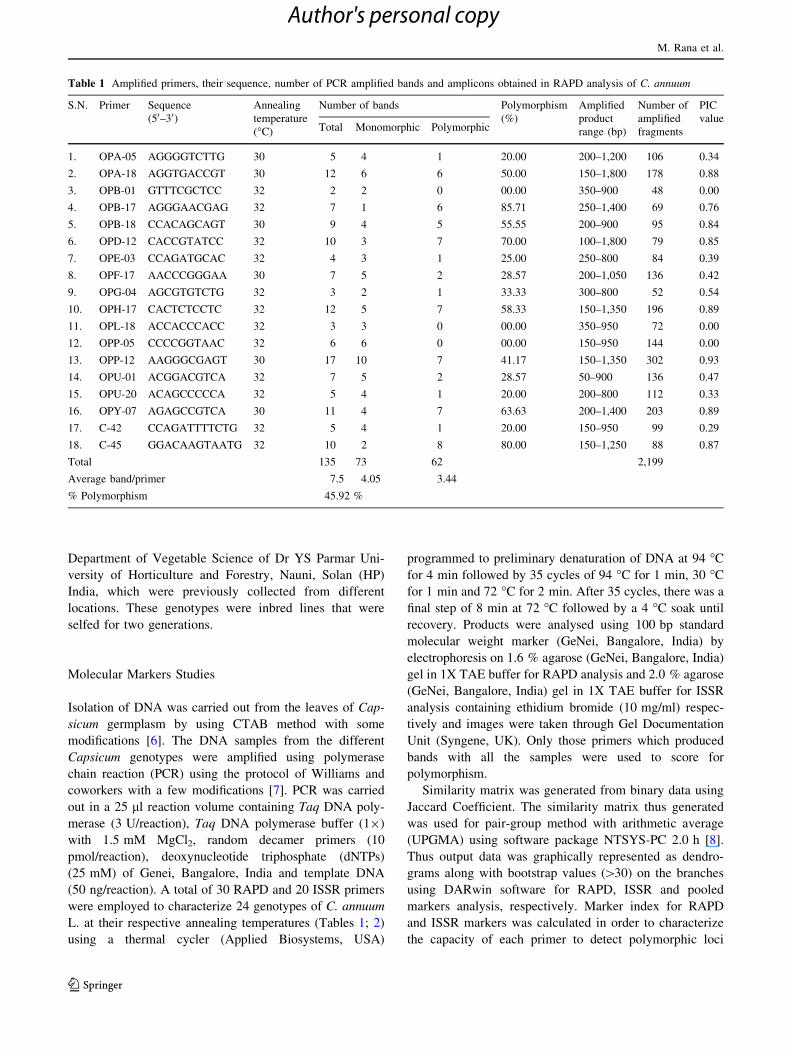
Table 1 Amplified primers, their sequence, number of PCR amplified bands and amplicons obtained in RAPD analysis of C. annuum
S.N. Primer Sequence
(50–30)Annealing
temperature
(�C)
Number of bands Polymorphism
(%)
Amplified
product
range (bp)
Number of
amplified
fragments
PIC
valueTotal Monomorphic Polymorphic
1. OPA-05 AGGGGTCTTG 30 5 4 1 20.00 200–1,200 106 0.34
2. OPA-18 AGGTGACCGT 30 12 6 6 50.00 150–1,800 178 0.88
3. OPB-01 GTTTCGCTCC 32 2 2 0 00.00 350–900 48 0.00
4. OPB-17 AGGGAACGAG 32 7 1 6 85.71 250–1,400 69 0.76
5. OPB-18 CCACAGCAGT 30 9 4 5 55.55 200–900 95 0.84
6. OPD-12 CACCGTATCC 32 10 3 7 70.00 100–1,800 79 0.85
7. OPE-03 CCAGATGCAC 32 4 3 1 25.00 250–800 84 0.39
8. OPF-17 AACCCGGGAA 30 7 5 2 28.57 200–1,050 136 0.42
9. OPG-04 AGCGTGTCTG 32 3 2 1 33.33 300–800 52 0.54
10. OPH-17 CACTCTCCTC 32 12 5 7 58.33 150–1,350 196 0.89
11. OPL-18 ACCACCCACC 32 3 3 0 00.00 350–950 72 0.00
12. OPP-05 CCCCGGTAAC 32 6 6 0 00.00 150–950 144 0.00
13. OPP-12 AAGGGCGAGT 30 17 10 7 41.17 150–1,350 302 0.93
14. OPU-01 ACGGACGTCA 32 7 5 2 28.57 50–900 136 0.47
15. OPU-20 ACAGCCCCCA 32 5 4 1 20.00 200–800 112 0.33
16. OPY-07 AGAGCCGTCA 30 11 4 7 63.63 200–1,400 203 0.89
17. C-42 CCAGATTTTCTG 32 5 4 1 20.00 150–950 99 0.29
18. C-45 GGACAAGTAATG 32 10 2 8 80.00 150–1,250 88 0.87
Total 135 73 62 2,199
Average band/primer 7.5 4.05 3.44
% Polymorphism 45.92 %
M. Rana et al.
123
Author's personal copy
among the genotypes. PIC value was calculated using the
formula [9];
PIC = 1 - R(Pij)2, where Pij is the frequency of the ith
pattern revealed by the jth primer summed across all pat-
terns revealed by the primers.
Results and Discussion
RAPD Studies
Of the 30 random RAPD primers used, only 18 were able
to amplify the genomic DNA (Table 1). Fifteen random
primers were found polymorphic and the three were found
monomorphic. The rest of 12 primers failed to amplify the
genomic DNA uniformly and were not included into fur-
ther analysis. For a total of 18 primers, the number of bands
varied from 2 with OPB-01 to 17 with primer OPP-17,
respectively with fragment size ranging from 150 to
1,800 bp (approx.) for all the informative primers. The
total number of amplified fragments for each primer were
counted and found to be 2,199. A total of 135 bands were
amplified, of which 62 (45.92 %) were polymorphic and 73
(54.07 %) were monomorphic across all the subjected
genotypes. On an average, total number of bands generated
per primer was 7.5 of which 3.44 were polymorphic and
4.05 were monomorphic (Table 1). However, 99 marker
levels in C. annuum were obtained, of which 63 (63.33 %)
were polymorphic and 36 (36.36 %) were monomorphic
across the genotypes with total number of bands generated
per primer was 6 of which 3.9 were polymorphic and 2.25
were monomorphic [10].
The PIC value provides an estimate of the discrimina-
tory power of a locus or loci, by taking into account not
only the number of alleles that are expressed, but also
relative frequencies of these alleles. Referring to PIC value
recorded for all the informative RAPD primers, the PIC
vary from a minimum of 0.00 for OPB-01, OPL-18 and
OPP-05 followed by 0.29 for C-42 and maximum of 0.93
for OPP-12 with an average of 0.54 (Table 1). Our results
with respect to PIC values are consistent with the findings
of Yumnam et al. [11] corresponding to an average PIC
value of 0.52 in C. annuum landraces. A total of seven
primers (OPY-07, C-45, OPB-18, OPH-17, OPD-12, OPB-
17, OPF-17) were able to fingerprint the six genotypes of
C. annuum namely ‘EC-579997’, ‘UHF-14’, ‘Kandaghat
Selection-9’, ‘Kannauel’, ‘Local Collection Bilaspur’ and
‘California Wonder’ by giving 8 unique bands of sizes
1,300, 600, 950, 600, 1,400, 1,150, 400, and 1,150 bp,
respectively. These can be used as molecular markers to
label and identify different cultivated species. Such unique
bands were also reported while accessing genetic vari-
ability in Capsicum species using RAPD markers [12]. The
similarity coefficient values determined using Jaccard’s
coefficient based on eighteen RAPD markers ranged from
0.40 to 0.96. The mean similarity index was found to be
0.68 indicating that high level of diversity exists among the
genotypes. Our results holds good with the previous
investigations while estimating genetic diversity in C.
annuum [13–15]. The cluster tree analysis showed that the
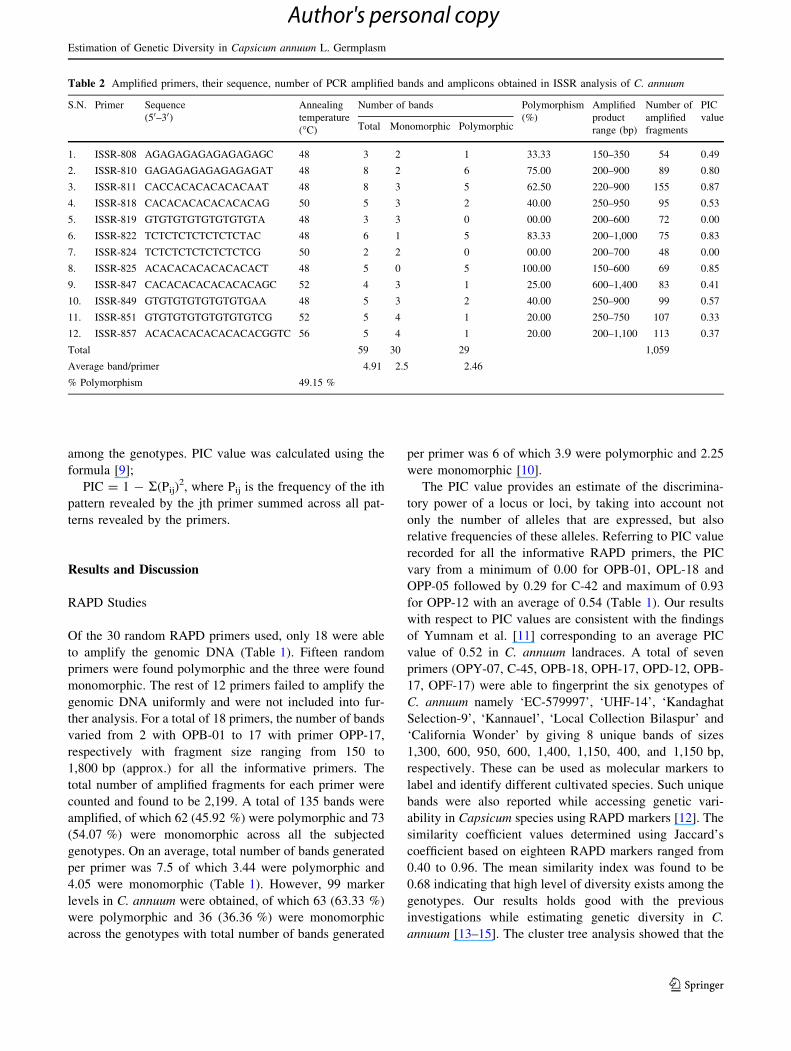
Table 2 Amplified primers, their sequence, number of PCR amplified bands and amplicons obtained in ISSR analysis of C. annuum
S.N. Primer Sequence
(50–30)Annealing
temperature
(�C)
Number of bands Polymorphism
(%)
Amplified
product
range (bp)
Number of
amplified
fragments
PIC
valueTotal Monomorphic Polymorphic
1. ISSR-808 AGAGAGAGAGAGAGAGC 48 3 2 1 33.33 150–350 54 0.49
2. ISSR-810 GAGAGAGAGAGAGAGAT 48 8 2 6 75.00 200–900 89 0.80
3. ISSR-811 CACCACACACACACAAT 48 8 3 5 62.50 220–900 155 0.87
4. ISSR-818 CACACACACACACACAG 50 5 3 2 40.00 250–950 95 0.53
5. ISSR-819 GTGTGTGTGTGTGTGTA 48 3 3 0 00.00 200–600 72 0.00
6. ISSR-822 TCTCTCTCTCTCTCTAC 48 6 1 5 83.33 200–1,000 75 0.83
7. ISSR-824 TCTCTCTCTCTCTCTCG 50 2 2 0 00.00 200–700 48 0.00
8. ISSR-825 ACACACACACACACACT 48 5 0 5 100.00 150–600 69 0.85
9. ISSR-847 CACACACACACACACAGC 52 4 3 1 25.00 600–1,400 83 0.41
10. ISSR-849 GTGTGTGTGTGTGTGAA 48 5 3 2 40.00 250–900 99 0.57
11. ISSR-851 GTGTGTGTGTGTGTGTCG 52 5 4 1 20.00 250–750 107 0.33
12. ISSR-857 ACACACACACACACACGGTC 56 5 4 1 20.00 200–1,100 113 0.37
Total 59 30 29 1,059
Average band/primer 4.91 2.5 2.46
% Polymorphism 49.15 %
Estimation of Genetic Diversity in Capsicum annuum L. Germplasm
123
Author's personal copy
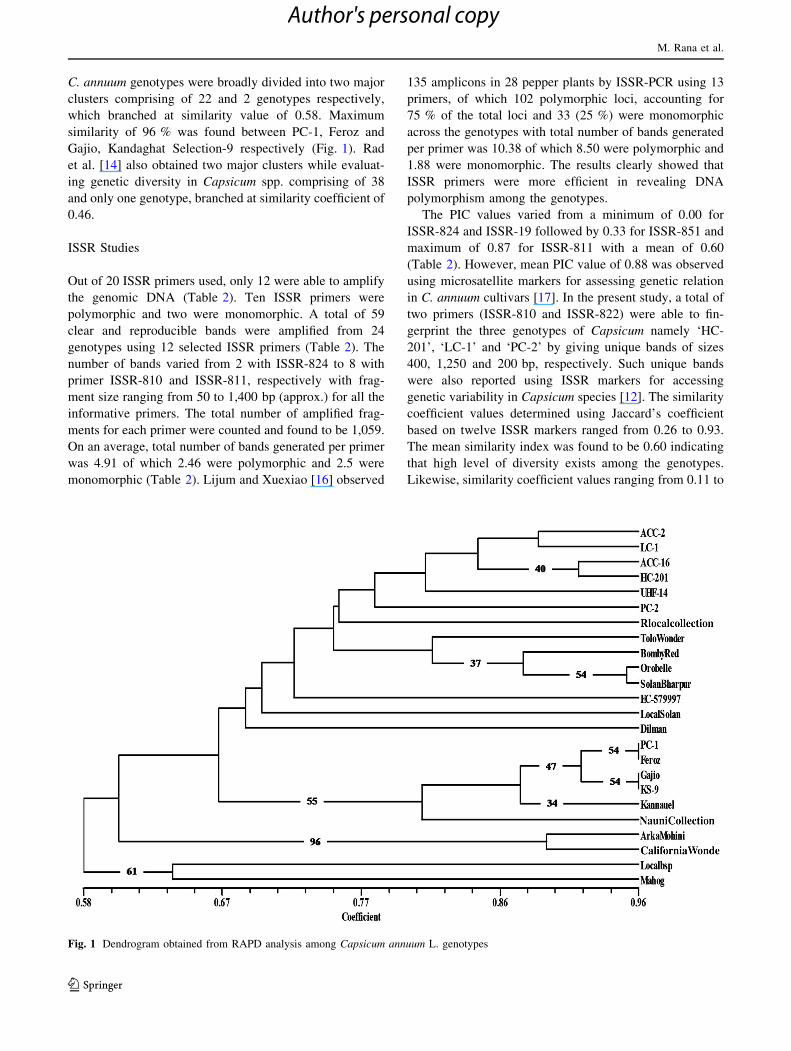
C. annuum genotypes were broadly divided into two major
clusters comprising of 22 and 2 genotypes respectively,
which branched at similarity value of 0.58. Maximum
similarity of 96 % was found between PC-1, Feroz and
Gajio, Kandaghat Selection-9 respectively (Fig. 1). Rad
et al. [14] also obtained two major clusters while evaluat-
ing genetic diversity in Capsicum spp. comprising of 38
and only one genotype, branched at similarity coefficient of
0.46.
ISSR Studies
Out of 20 ISSR primers used, only 12 were able to amplify
the genomic DNA (Table 2). Ten ISSR primers were
polymorphic and two were monomorphic. A total of 59
clear and reproducible bands were amplified from 24
genotypes using 12 selected ISSR primers (Table 2). The
number of bands varied from 2 with ISSR-824 to 8 with
primer ISSR-810 and ISSR-811, respectively with frag-
ment size ranging from 50 to 1,400 bp (approx.) for all the
informative primers. The total number of amplified frag-
ments for each primer were counted and found to be 1,059.
On an average, total number of bands generated per primer
was 4.91 of which 2.46 were polymorphic and 2.5 were
monomorphic (Table 2). Lijum and Xuexiao [16] observed
135 amplicons in 28 pepper plants by ISSR-PCR using 13
primers, of which 102 polymorphic loci, accounting for
75 % of the total loci and 33 (25 %) were monomorphic
across the genotypes with total number of bands generated
per primer was 10.38 of which 8.50 were polymorphic and
1.88 were monomorphic. The results clearly showed that
ISSR primers were more efficient in revealing DNA
polymorphism among the genotypes.
The PIC values varied from a minimum of 0.00 for
ISSR-824 and ISSR-19 followed by 0.33 for ISSR-851 and
maximum of 0.87 for ISSR-811 with a mean of 0.60
(Table 2). However, mean PIC value of 0.88 was observed
using microsatellite markers for assessing genetic relation
in C. annuum cultivars [17]. In the present study, a total of
two primers (ISSR-810 and ISSR-822) were able to fin-
gerprint the three genotypes of Capsicum namely ‘HC-
201’, ‘LC-1’ and ‘PC-2’ by giving unique bands of sizes
400, 1,250 and 200 bp, respectively. Such unique bands
were also reported using ISSR markers for accessing
genetic variability in Capsicum species [12]. The similarity
coefficient values determined using Jaccard’s coefficient
based on twelve ISSR markers ranged from 0.26 to 0.93.
The mean similarity index was found to be 0.60 indicating
that high level of diversity exists among the genotypes.
Likewise, similarity coefficient values ranging from 0.11 to
Fig. 1 Dendrogram obtained from RAPD analysis among Capsicum annuum L. genotypes
M. Rana et al.
123
Author's personal copy
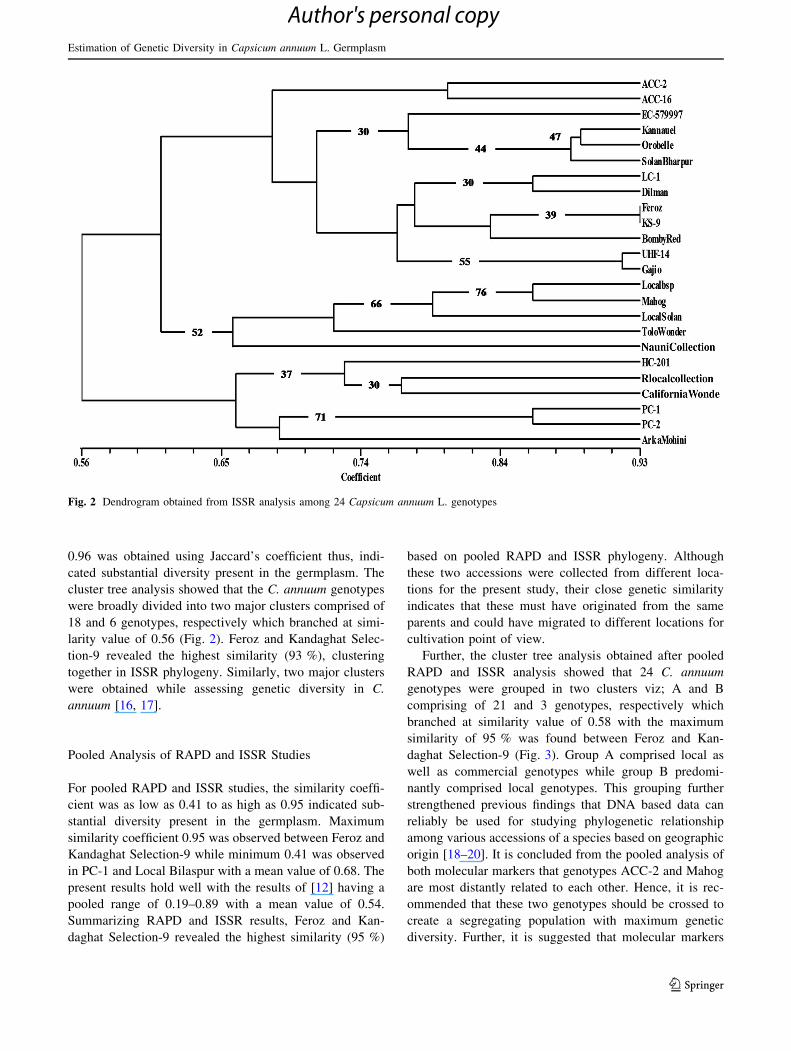
0.96 was obtained using Jaccard’s coefficient thus, indi-
cated substantial diversity present in the germplasm. The
cluster tree analysis showed that the C. annuum genotypes
were broadly divided into two major clusters comprised of
18 and 6 genotypes, respectively which branched at simi-
larity value of 0.56 (Fig. 2). Feroz and Kandaghat Selec-
tion-9 revealed the highest similarity (93 %), clustering
together in ISSR phylogeny. Similarly, two major clusters
were obtained while assessing genetic diversity in C.
annuum [16, 17].
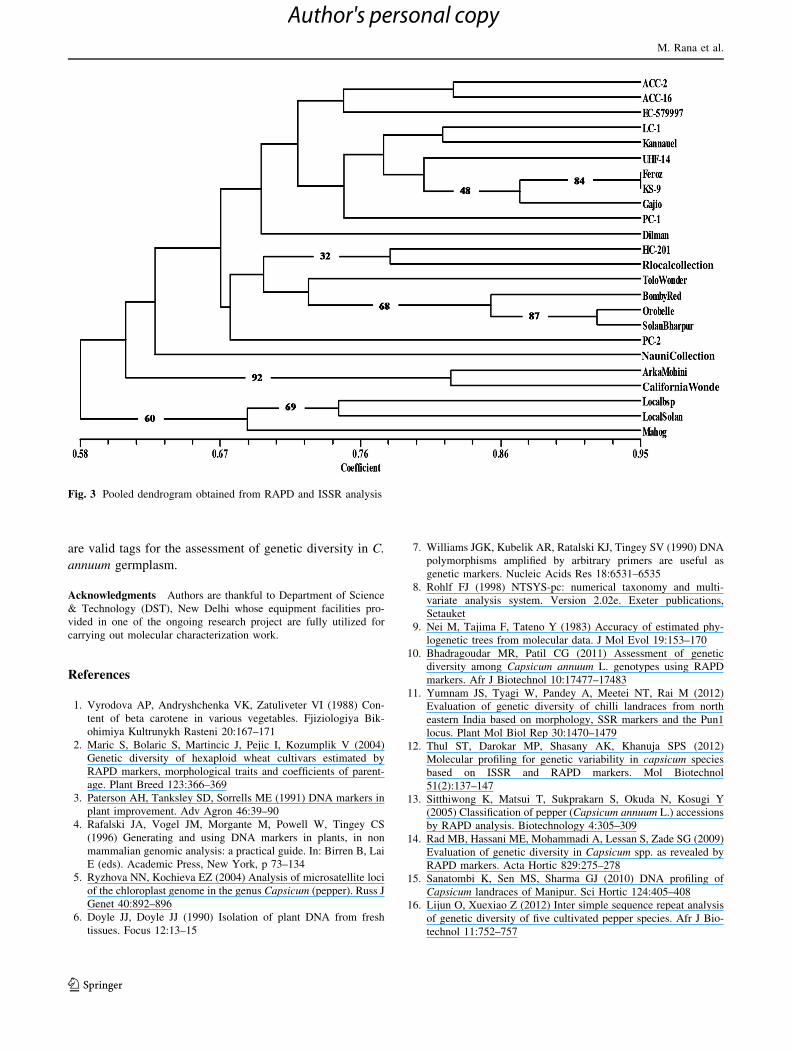
Pooled Analysis of RAPD and ISSR Studies
For pooled RAPD and ISSR studies, the similarity coeffi-
cient was as low as 0.41 to as high as 0.95 indicated sub-
stantial diversity present in the germplasm. Maximum
similarity coefficient 0.95 was observed between Feroz and
Kandaghat Selection-9 while minimum 0.41 was observed
in PC-1 and Local Bilaspur with a mean value of 0.68. The
present results hold well with the results of [12] having a
pooled range of 0.19–0.89 with a mean value of 0.54.
Summarizing RAPD and ISSR results, Feroz and Kan-
daghat Selection-9 revealed the highest similarity (95 %)
based on pooled RAPD and ISSR phylogeny. Although
these two accessions were collected from different loca-
tions for the present study, their close genetic similarity
indicates that these must have originated from the same
parents and could have migrated to different locations for
cultivation point of view.
Further, the cluster tree analysis obtained after pooled
RAPD and ISSR analysis showed that 24 C. annuum
genotypes were grouped in two clusters viz; A and B
comprising of 21 and 3 genotypes, respectively which
branched at similarity value of 0.58 with the maximum
similarity of 95 % was found between Feroz and Kan-
daghat Selection-9 (Fig. 3). Group A comprised local as
well as commercial genotypes while group B predomi-
nantly comprised local genotypes. This grouping further
strengthened previous findings that DNA based data can
reliably be used for studying phylogenetic relationship
among various accessions of a species based on geographic
origin [18–20]. It is concluded from the pooled analysis of
both molecular markers that genotypes ACC-2 and Mahog
are most distantly related to each other. Hence, it is rec-
ommended that these two genotypes should be crossed to
create a segregating population with maximum genetic
diversity. Further, it is suggested that molecular markers
Fig. 2 Dendrogram obtained from ISSR analysis among 24 Capsicum annuum L. genotypes
Estimation of Genetic Diversity in Capsicum annuum L. Germplasm
123
Author's personal copy
are valid tags for the assessment of genetic diversity in C.
annuum germplasm.
Acknowledgments Authors are thankful to Department of Science
& Technology (DST), New Delhi whose equipment facilities pro-
vided in one of the ongoing research project are fully utilized for
carrying out molecular characterization work.
References
1. Vyrodova AP, Andryshchenka VK, Zatuliveter VI (1988) Con-
tent of beta carotene in various vegetables. Fjiziologiya Bik-
ohimiya Kultrunykh Rasteni 20:167–171
2. Maric S, Bolaric S, Martincic J, Pejic I, Kozumplik V (2004)
Genetic diversity of hexaploid wheat cultivars estimated by
RAPD markers, morphological traits and coefficients of parent-
age. Plant Breed 123:366–369
3. Paterson AH, Tanksley SD, Sorrells ME (1991) DNA markers in
plant improvement. Adv Agron 46:39–90
4. Rafalski JA, Vogel JM, Morgante M, Powell W, Tingey CS
(1996) Generating and using DNA markers in plants, in non
mammalian genomic analysis: a practical guide. In: Birren B, Lai
E (eds). Academic Press, New York, p 73–134
5. Ryzhova NN, Kochieva EZ (2004) Analysis of microsatellite loci
of the chloroplast genome in the genus Capsicum (pepper). Russ J
Genet 40:892–896
6. Doyle JJ, Doyle JJ (1990) Isolation of plant DNA from fresh
tissues. Focus 12:13–15
7. Williams JGK, Kubelik AR, Ratalski KJ, Tingey SV (1990) DNA
polymorphisms amplified by arbitrary primers are useful as
genetic markers. Nucleic Acids Res 18:6531–6535
8. Rohlf FJ (1998) NTSYS-pc: numerical taxonomy and multi-
variate analysis system. Version 2.02e. Exeter publications,
Setauket
9. Nei M, Tajima F, Tateno Y (1983) Accuracy of estimated phy-
logenetic trees from molecular data. J Mol Evol 19:153–170
10. Bhadragoudar MR, Patil CG (2011) Assessment of genetic
diversity among Capsicum annuum L. genotypes using RAPD
markers. Afr J Biotechnol 10:17477–17483
11. Yumnam JS, Tyagi W, Pandey A, Meetei NT, Rai M (2012)
Evaluation of genetic diversity of chilli landraces from north
eastern India based on morphology, SSR markers and the Pun1
locus. Plant Mol Biol Rep 30:1470–1479
12. Thul ST, Darokar MP, Shasany AK, Khanuja SPS (2012)
Molecular profiling for genetic variability in capsicum species
based on ISSR and RAPD markers. Mol Biotechnol
51(2):137–147
13. Sitthiwong K, Matsui T, Sukprakarn S, Okuda N, Kosugi Y
(2005) Classification of pepper (Capsicum annuum L.) accessions
by RAPD analysis. Biotechnology 4:305–309
14. Rad MB, Hassani ME, Mohammadi A, Lessan S, Zade SG (2009)
Evaluation of genetic diversity in Capsicum spp. as revealed by
RAPD markers. Acta Hortic 829:275–278
15. Sanatombi K, Sen MS, Sharma GJ (2010) DNA profiling of
Capsicum landraces of Manipur. Sci Hortic 124:405–408
16. Lijun O, Xuexiao Z (2012) Inter simple sequence repeat analysis
of genetic diversity of five cultivated pepper species. Afr J Bio-
technol 11:752–757
Fig. 3 Pooled dendrogram obtained from RAPD and ISSR analysis
M. Rana et al.
123
Author's personal copy

17. Patel AS, Sasidharan N, Vala AG, Vinay K (2011) Genetic
relation in Capsicum annuum L. cultivars through microsatellite
markers: SSR and ISSR. Electron J Plant Breed 2:67–76
18. Olmstead RG, Sweere JA, Spangler RE, Bohs L, Palmer JD
(1999) Phylogeny and provisional classification of the solanaceae
based on chloroplast DNA. In: Nee M, Symon DE, Jessup JP,
Hawkes JG (eds) Solanaceae IV advances in biology and utili-
zation. Royal Botanic Gardens, Kew, London, pp 111–137
19. Knapp SL, Bohs MN, Spooner DM (2004) Solanaceae: a model
for linking genomics with biodiversity. Comput Funct Genomics
5:285–291
20. Gopinath K, Radhakrishnan NV, Jayaral J (2006) Effect of
propiconazole and difenoconazole on the control of anthracnose
of chilli fruit caused by Colletotrichum capsici. Crop Prot
25:1024–1031
Estimation of Genetic Diversity in Capsicum annuum L. Germplasm
123
Author's personal copy
Related Documents