int. j. remote sensing, 2002, vol. 23, no. 11, 2145–2162 Estimation of fuel moisture content from multitemporal analysis of Landsat Thematic Mapper re ectance data: applications in re danger assessment E. CHUVIECO, D. RIAN ˜ O, I. AGUADO and D. COCERO Universidad de Alcala ´, Department of Geography, Colegios 2-28801 Alcala ´ de Henares, Spain (Received 15 December 1999; in nal form 29 March 2001) Abstract. The objective of this paper was to de ne indices based on re ectance measurements performed by the Landsat Thematic Mapper (TM) sensor for estimating water content of live Mediterranean fuels for re danger estimation. Seven Landsat TM images were processed and correlated with fuel moisture content (FMC) of several live species of Mediterranean grassland and shrubland. Raw bands were converted to re ectances, and several indices potentially related to water content were calculated from them. Pearson r correlation coeYcients and linear regression analysis were computed in order to estimate FMC. Those indices based on the short wave infrared bands (SWIR: 1.4–2.5 mm) and on the contrast between this band and the near-infrared band oVered the best estimations. For grassland, the integral of visible and SWIR bands provided the highest correlation, but also raw re ectances and Normalized DiVerence Vegetation Indices (NDVIs) provide signi cant r values (r2 above 0.8). For shrub species, indices that include SWIR re ectances performed much better than NDVI, because the SWIR band is more sensitive to water absorption, whereas NDVI estimates FMC indirectly, only from the eVects of chlorophyll changes due to water variation content and leaf area index. The most signi cant relations were found with the derivatives of bands 4–5 and 2–3, and again the integral of visible and SWIR bands. Multiple regression analysis provided adjusted r2 values of 0.84 for grasslands and 0.74 for shrublands. Average errors of 23.45–40% in the estimation of FMC for grasslands were found, depending on which variables were included in the multiple regression. For the FMC estimation of shrub species, errors were lower (from 7.94 to 19.40%), since the range of FMC values was also lower. 1. Fuel moisture content and re danger Fuel water content is one of the critical factors aVecting re ignition and re propagation, and therefore is taken into account in most re danger and re behavi- our modelling systems (Rothermel et al. 1986). High moisture content increases the heat required to ignite a fuel, since some of this energy is used to evaporate water. Additionally, high values of fuel moisture imply a slow propagation, because part of the heat released by the re front is used to absorb water from adjacent fuels, and since the air has more water vapour, less oxygen will be available for combustion. Some authors observed a 50% reduction in heat output of burning matter when International Journal of Remote Sensing ISSN 0143-1161 print/ISSN 1366-5901 online © 2002 Taylor & Francis Ltd http://www.tandf.co.uk/journals DOI: 10.1080 /01431160110069818

Welcome message from author
This document is posted to help you gain knowledge. Please leave a comment to let me know what you think about it! Share it to your friends and learn new things together.
Transcript
int j remote sensing 2002 vol 23 no 11 2145ndash2162
Estimation of fuel moisture content from multitemporal analysis ofLandsat Thematic Mapper re ectance data applications in re dangerassessment
E CHUVIECO D RIANO I AGUADO and D COCERO
Universidad de Alcala Department of Geography Colegios 2-28801Alcala de Henares Spain
(Received 15 December 1999 in nal form 29 March 2001)
Abstract The objective of this paper was to de ne indices based on re ectancemeasurements performed by the Landsat Thematic Mapper (TM) sensor forestimating water content of live Mediterranean fuels for re danger estimationSeven Landsat TM images were processed and correlated with fuel moisturecontent (FMC) of several live species of Mediterranean grassland and shrublandRaw bands were converted to re ectances and several indices potentially relatedto water content were calculated from them Pearson r correlation coeYcientsand linear regression analysis were computed in order to estimate FMC Thoseindices based on the short wave infrared bands (SWIR 14ndash25 mm) and on thecontrast between this band and the near-infrared band oVered the best estimationsFor grassland the integral of visible and SWIR bands provided the highestcorrelation but also raw re ectances and Normalized DiVerence VegetationIndices (NDVIs) provide signi cant r values (r2 above 08) For shrub speciesindices that include SWIR re ectances performed much better than NDVIbecause the SWIR band is more sensitive to water absorption whereas NDVIestimates FMC indirectly only from the eVects of chlorophyll changes due towater variation content and leaf area index The most signi cant relations werefound with the derivatives of bands 4ndash5 and 2ndash3 and again the integral of visibleand SWIR bands Multiple regression analysis provided adjusted r2 values of 084for grasslands and 074 for shrublands Average errors of 2345ndash40 in theestimation of FMC for grasslands were found depending on which variables wereincluded in the multiple regression For the FMC estimation of shrub specieserrors were lower (from 794 to 1940) since the range of FMC values wasalso lower
1 Fuel moisture content and re dangerFuel water content is one of the critical factors aVecting re ignition and re
propagation and therefore is taken into account in most re danger and re behavi-our modelling systems (Rothermel et al 1986) High moisture content increases theheat required to ignite a fuel since some of this energy is used to evaporate waterAdditionally high values of fuel moisture imply a slow propagation because part ofthe heat released by the re front is used to absorb water from adjacent fuels andsince the air has more water vapour less oxygen will be available for combustionSome authors observed a 50 reduction in heat output of burning matter when
International Journal of Remote SensingISSN 0143-1161 printISSN 1366-5901 online copy 2002 Taylor amp Francis Ltd
httpwwwtandfcoukjournalsDOI 10108001431160110069818
E Chuvieco et al2146
moisture content increases from 100 to 200 of dry matter (Byram 1959)Additionally moisture content has also been directly related to the energy requiredto ignite a fuel and its role is critical for converting a surface re into a crown re(Van Wagner 1967)
Among biologists and ecologists several methods for estimating plant watercontent have been commonly used leaf water potential stomatal aperture relativewater content (RWC) and speci c water density (SWD) (Levitt 1980) However inthe forest re literature the most extended method of measuring plant moisturestatus is the fuel moisture content (FMC) de ned as the proportion of fresh weightversus dry weight of the sample
FMC=Wf shy Wd
Wd
times100 (1)
where W f is fresh weight and W d dry weight This measure has been recommendedby a wide range of re researchers (Van Wagner 1967 Blackmarr and Flanner 1968Simard 1968 Olson 1980 Viney 1991 Viegas et al 1992) It is simple to performbut very sensitive to variations of fresh weight at the time of the sampling The freshweight is estimated when the plant is sampled whereas the dry weight is obtainedby oven-drying the sample 24ndash48 h This is not an instantaneous measurement ofwater content which is also the case of the RWC and SWD so it is diYcult to beimplemented in re danger or re behaviour systems The FMC is computed fordead and live fuels The former are composed by materials lying on the forest oor( litter twigs branches) whereas the latter are live plants (herbaceous shrub andtrees)
Several methods have been proposed for estimating FMC for re danger applica-tions The most common are eldwork (Desbois et al 1997) the use of calibratedsticks (Simard 1968) and the computation of meteorological indices (Viney 1991Viegas et al 1998) None of them are completely satisfactory Field sampling is verycostly and requires intense work to obtain enough spatial and temporal signi canceCalibrated sticks attempt to resemble the behaviour of ideal fuels and should begood predictors of ne dead fuels but may not be very well associated to live fuelsmuch less dependent of atmospheric variations Finally meteorological indices areeasily computed and are very appropriate for considering other variables of redanger (wind relative humidity solar radiation) However they do not directlymeasure vegetation status but estimate it from atmospheric conditions which havea direct in uence on FMC of dead fuels However live fuels are also related to thephysiological characteristics of the plants (for instance canopy resistance and rootlength) and to the soil water retention capacity Additionally weather data may notbe available from forested areas of interest but just on rural or urban areas andtherefore extrapolation methods should be applied
2 Application of remote sensing data for estimating FMCThe use of remote sensing methods may overcome some of these diYculties since
they provide temporal and spatial coverage and the data are directly derived fromthe vegetation cover The main challenge in this case is to demonstrate that the eVectof moisture content on plant re ectance or temperature is clearly distinguishablefrom other factors of spectral variation such as pigment contents canopy geometryleaf area index soil background or atmospheric eVects Many authors have attempted
Estimation of fuel moisture content 2147
to prove this potentiality both from airborne and satellite sensors However sincesome factors of potential noise are diYcult to control an ample range of laboratoryspectral measurements have also been performed These studies have shown thatplant water content is most clearly related to short-wave infrared re ectance (SWIR)ranging from 14 to 20 mm (Thomas et al 1971 Tucker 1980 Jackson and Ezra1985 Ripple 1986 Hunt et al 1987 Bowman 1989 Cohen 1991) It is well knownthat these wavelengths present high water absorption peaks and therefore SWIRre ectance is negatively related to plant water content The monitoring of watercontent in the near-infrared (NIR) band (08ndash11 mm) is not so evident Increasesand decreases in re ectance were measured depending on whether the target was asingle leaf or a canopy For single leaves most authors found an increase in NIRre ectance when the leaf dries (Thomas et al 1971 Hunt et al 1987 Bowman 1989Hunt and Rock 1989) which may be caused by the increment in the refractive indexof the mesophyll layer when water is replaced by air However other authorsmeasured a decrease in re ectance (Westman and Price 1988 Penuelas et al 1993)This reduction may be caused by the indirect eVects of leaf dryness such as thedecrease in leaf area index or shadowing due to leaf curling (Jackson and Ezra 1985Westman and Price 1988) Finally a third group of authors did not nd a signi cantchange in NIR re ectance for leaf drying (Pierce et al 1990 Carter 1991) Finallythe visible domain has proved to be not very sensitive to leaf water content at leastin absolute terms (Jackson and Ezra 1985 Bowman 1989)
The use of satellite data in FMC estimation has been focused on NOAA AdvancedVery High Resolution Radiometer (AVHRR) images since they provide the requiredtemporal resolution for these studies The most solid relations were found betweenFMC of grasslands and multitemporal series of NDVI derived from AVHRR images(Paltridge and Barber 1988 Chladil and Nunez 1995) Less coherent were therelations between AVHRR data and FMC of shrubs (Alonso et al 1996 Deshayeset al 1998) which are less homogeneous than grasslands in Mediterranean areasand better adapted to the summer drought and show a lower range of FMCthroughout the vegetative period A recent study by Hardy and Burgan (1999) foundsimilar tendencies They estimated FMC from multitemporal airborne data of fourperiods and found good agreements between NDVI and FMC for grasslands butnot for trees and shrublands Another group of authors base the estimation of redanger on thermal channels which are commonly combined with vegetation indicesParticularly good results have been obtained with the water de cit index (Vidalet al 1994 derived by Moran et al 1994) the orthogonal regression of NDVI andsurface temperature (T
s) (Prosper-Laget et al 1994 1995) and the single ratio of
NDVI and Ts
(Chuvieco et al 1999)Additional studies have also suggested the use of NOAA AVHRR data to monitor
re danger but they are not aimed speci cally at measuring FMC These studiespropose diVerent techniques for emphasizing the multitemporal decrease in vegeta-tion vigour mainly by using indices based on the measure of NDVI change fromprevious periods (Lopez et al 1991 Illera et al 1996) Most of these attempts forestimating re danger were assessed by comparing danger values and re occurrencebut actual eld estimations of FMC were not performed This approach might beconsidered an indirect validation of a re danger index since re occurrence is aconjunction of diVerent factors both environmentally and human caused Satellitedata can only assess vegetation state (ideally FMC) but other factors related to reignition or re propagation such as wind or human activity cannot be directly
E Chuvieco et al2148
derived from satellite observations Fire only occurs when an ignition cause is presenteven if FMC is not critically low On the other hand critical levels of FMC maynot necessarily lead to res if other factors of risk do not appear
3 ObjectivesThe purpose of this paper was to de ne indices based on re ectance measurements
performed by the Landsat Thematic Mapper (TM) sensor in order to estimate FMCof live Mediterranean fuels The nal goal of this research was to estimate re dangerfrom satellite-derived indices Although temporal resolution of Landsat TM data isvery low for operational re danger estimation (daily to weekly predictions arerequired by re managers) it provides two important advantages over other sensorsFirst it includes measurements of SWIR re ectance (bands 5 and 7) which aspreviously reviewed is more clearly related to water content than visible or NIRbands Second the higher spatial resolution of Landsat TM reduces the uncertaintyin correlating eld measurements and satellite data since the location of land plotsis much easier with images of this sensor than with NOAA AVHRR imagesExperiences from the analysis of Landsat TM data will be used in the future tocalibrate results obtained from NOAA AVHRR images using the same set of elddata
Landsat TM images have been previously tested for drought and re dangerestimation (Vidal and Devaux-Ros 1995 Pinder and McLeod 1999) but no quantit-ative relations with FMC were addressed This paper includes the analysis of indicesderived from the optical bands of Landsat TM (1 2 3 4 5 and 7) whereas theexamination of thermal and opticalndashthermal indices will be covered in a future work
4 Methods41 Field sampling
Field sampling is the most direct method of estimating FMC but implies prob-lems to assure the spatial and temporal signi cance of the sample Field measuringis commonly performed at noontime when the FMC is lowest and therefore rerisk conditions are higher (Desbois et al 1997 Chuvieco et al 1999) It is stronglyrecommended that periodic sampling is performed during the re season in orderto monitor variations in risk conditions Some authors recommend sampling every2ndash3 days (Desbois et al 1997) whereas others propose once a week or every otherweek (Alonso et al 1996 Viegas et al 1998) Properly speaking FMC determinationwould require the measurement of the diVerent materials that form a fuel complexor a plant leaves trunks and branches which is operationally very diYcult Tosimplify FMC estimation in live fuels most operational experiences sample onlyfoliage Obviously the FMC of leaves is higher than the FMC of woody materialsand more variable throughout the year However it should be stated that foliagemoisture content is the most critical in re propagation Additionally lsquosince leavesterminate the biological pathway of water transport and are exposed to the greatestdrop in leaf water potential leaf water status is a sensitive indicator of canopy waterstatus especially when measurements include canopy position eVects (sunlight vsshaded eVects)rsquo (Weber and Ustin 1991 p 865) Therefore to measure foliage FMCas a surrogate of plant water content is a logical election and greatly facilitates theapplication of external methods (especially remote sensors) for estimating FMC
For this project eld sampling of FMC was undertaken from early April to theend of September between 1996 and 1999 The study area selected was part of the
Estimation of fuel moisture content 2149
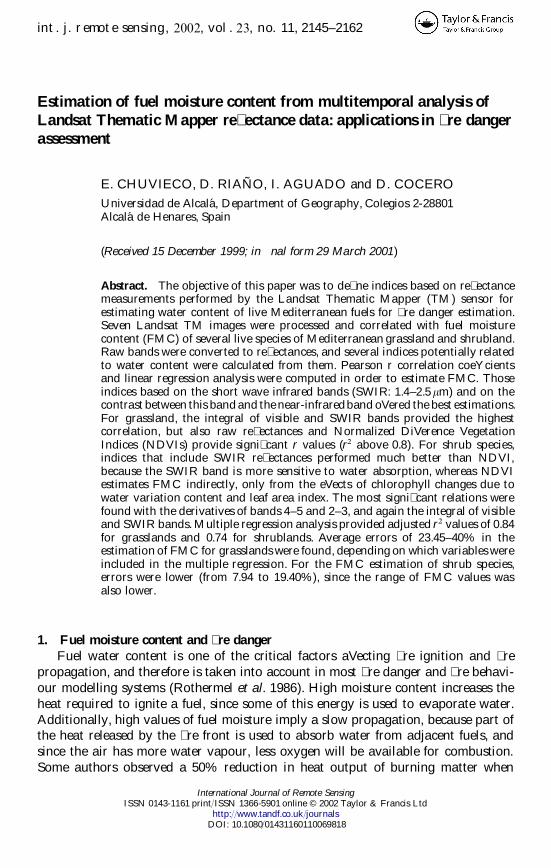
Cabaneros National Park located in Central Spain 200km south of Madrid( gure 1) which includes a wide representation of Mediterranean species Plots were10times10 m long positioned in the central valley of the Park with very gentle slopes(lt5) Distance between the plots ranged between 5 and 37 km The total distancebetween the rst and the last was about 20 km A total of six plots were sampledThe rst three were covered 100 by herbaceous species although in the summerthe eVect of soil background was noticeable during the eld sampling They diVerin soil depth and grass height and biomass The fourth and fth plots were 95covered by shrub species (the rest was soil background or some herbaceous species)which are very common in Mediterranean forested areas Cistus ladanifer and Ericaaustralis were sampled in the fourth plot and these two species plus in Erica umbellataand Rosmarinus oYcinalis in the fth The last plot was dedicated to sample leavesof Quercus faginea a typical Mediterranean oak This species presents a crown coverof 90 during late spring and summer (when leaves are opened ) but just 30during early spring (March to the beginning of April )
Samples were composed of terminal leaves for shrubs and trees whereas thewhole plant was extracted for herbaceous species Three samples per species andplot were collected every 8 days between 12 and 14 h GMT to coincide with theperiod of highest re risk Unfortunately the time of eld sampling did not corre-spond with the satellite acquisition (1030 versus 12ndash14 GMT) which may introducesome noise especially in the warmest days However some authors working insimilar climatic areas did not observe signi cant diVerences in FMC between 10 am
Figure 1 A 3D Landsat image of the study area with the location of sampled plots Thenumbers for the plots are referred to in the text (1ndash3 are grasslands 4 and 5 shrublandsand 6 oak trees)
E Chuvieco et al2150
and 5 pm (Ustin et al 1998) and it was therefore assumed that FMC conditionsmeasured on the eld would still be comparable to those at satellite acquisition timeThe dates of eld sampling were chosen in accordance with the Landsat orbitalcycles and therefore every other sampling the FMC measurement coincides with asatellite acquisition (16 days)
Each sample was composed of approximately 100g of leaves and small terminalbranches (in the case of shrub species) or herbaceous plants (in the case of grassland)The sample was then put in an envelope sealed and weighed with a eld balance(precision plusmn01 g) The envelopes with the samples were then dried in an oven during48 h at 60deg C and weighed again with the same balance The weight of the envelopeswas subtracted to compute the FMC following the equation (1)
The representative value of FMC for each plot and date was computed as theaverage of the three samples collected in each day and plot In the case of plots 4and 5 since there was a mixture of several shrub species an average value per specieswas computed as well as the average value of all the species collected in that plot(C ladanifer and E australis in plot 4 and C ladanifer E australis E umbellata andR oYcinalis in plot 5)
42 Image pre-processingSeven Landsat TM images were purchased for multitemporal estimation of FMC
An attempt was made to include a wide range of FMC conditions from early springto mid spring summer and early autumn Problems of cloud cover precluded theuse of a single year and therefore 3 years of images were processed for thoseacquired on 16 April 21 July and 23 September in 1997 for those acquired on5 May 24 July and 10 September in 1998 and 6 April in 1999 The range of FMCvalues for the species collected during those days are included in table 1 Asmentioned image dates coincided with eld sampling dates
The seven Landsat images were geo-referenced and co-registered to ensure spatialintegrity of the multitemporal series RMS errors of the correction were lower than1 pixel for all the images Calibration of raw digital values to radiance was performedusing the coeYcients included in the header les The atmospheric correction wasbased on a revision of the dark-object method recently proposed which estimatesatmospheric transmissivity as a function of the cosine of the zenith angle (Chavez
Table 1 FMC values of the species collected
No of Standardsamples Minimum Maximum Average deviation
Grassland 21 4768 286415 86121 92518C ladanifer 14dagger 58254 135778 96500 24516Erica 14dagger 32009 104000 72028 17689Average shrub 14dagger 46083 128996 81260 22569R oYcinalis 7 52155 174549 112975 40056Q faginea 6Dagger 91322 212577 130601 47042
Includes three plots and seven periodsdaggerIncludes two plots and seven periodsDaggerIn one of the satellite acquisitions leaves of Q faginea were not available
Estimation of fuel moisture content 2151
1996) Re ectances of the six non-thermal channels were then computed following
rk=
Kp(Lsenk shy Lak
)E
a k(cos h
i)2
(2)
where rk
is the re ectance for band k K is a factor that takes into account thevariation of the SunndashEarth distance L senk is the radiance detected by the sensor(computed from the digital values using the calibration coeYcients included in theimage) L
a kis the atmospheric radiance computed from the minimum (dark-object)
value of that band E0k
is the solar irradiance at the top of the atmosphere and hthe solar zenith angle K was computed as a function of the Julian day (D)
K=(1+00167(sen (2p(Dshy 935)365)))2 (3)
43 Indices potentially related to FMCAfter obtaining the re ectances of the raw bands several indices potentially
related to FMC variations were computed A wide range of indices was testedfollowing recommendations obtained from previous literature review Obviouslyonly indices adapted to the spectral resolution of Landsat TM were computedbecause the proposals of some authors (Danson et al 1992 Gao 1996 Penuelaset al 1997) are only accessible from hyperspectral sensors
The following indices were considered
431 Normalized DiVerence Vegetation Index (NDVI)
NDVI=(rNIR shy rR)
(rNIR
+rR)
(4)
where rNIR and rR are re ectances in the near-infrared and red bands respectivelyThe NDVI has been successfully related to chlorophyll content absorbed radiationleaf area index and vegetation greenness As said before this index has also provenuseful for FMC estimation of grasslands
432 Normalized DiVerence Infrared Index (NDII)This is a variation of the NDVI using the SWIR instead of the R band (Hunt
and Rock 1989)
NDII=(rNIR shy rSWIR)
(rNIR+rSWIR )(5)
where rSWIR is the re ectance of channel 5 or 7 of Landsat TM
433 L eaf Water Content Index (LWCI)This is based on the diVerence between NIR and SWIR re ectance for a speci c
sample with respect to another sample at full turgor (Hunt et al 1987)
LWCI=shy log(1 shy (rNIR shy rSWIR))
shy log(1 shy (rNIRFT shy rSWIRFT ))(6)
where FT denotes a sample with maximum amount of water content It is verycomplex to obtain a sample at full turgor for each species simultaneously with thesatellite overpass Therefore for practical purposes we simpli ed this approach bytaking pixels from very green areas (agricultural plots at full turgor) located nearthe sampling area to compute reference re ectances of well-watered species
E Chuvieco et al2152
434 T asselled Cap lsquoWetnessrsquoThis transformation was originally de ned to enhance agricultural applications
of Landsat MSS data (Kauth and Thomas 1976) It tended to emphasize thediscrimination of soil and vegetation by creating new axes that are better adjustedto that physical space In that new system of coordinates the separation betweenboth covers is supposed to be clearer Its adaptation to Landsat TM images enabledthree components to be obtained Brightness Greenness and Wetness which emphas-ize bare soils vegetation and water bodies respectively (Crist and Cicone 1984) Thethird component is suitable for our objective since it should emphasize the signalderived from the water content As de ned by Crist and Cicone this component iscomputed as a simple transformation of the raw digital values
Wetness=01509B1+01973B2+03279B3+03406B4 shy 07112B5 shy 04572B7 (7)
435 IntegralSimilarly to the concept of wetness we propose to consider the integral of
re ectances in the visible and SWIR bands as an additional variable related to watercontent The basis of this proposal relies on the absorption eVect of water on thesebands (especially on the SWIR region) and therefore the integral should be nega-tively related to FMC The integral was computed as the re ectance of each bandmultiplied by the bandwidth
Integral=007r1+008r2+006r3+02r5+027r7 (8)
The NIR band was not considered to avoid indirect eVects ( leaf area index grasscuring) in FMC estimation
436 Spectral derivativesThese indices were proposed by Danson et al (1992) to enhance the spectral
signal produced by water content variations They were de ned as the ratio ofre ectance change along the diVerent wavelengths considered
Derkl
dR
dW=
Rlshy R
kW
lshy W
k(9)
where Der is derivative of two contiguous bands k and l Rl
and Rk
are re ectancesof the same bands and W
land W
kare the wavelengths of those bands The authors
found good correlations between these derived indices and FMC for several spectralregions located in the NIR and SWIR regions Since Landsat TM bands are notcontiguous the concept of derivative can not properly be applied but instead theslope or gradient between bands However the term derivative has been maintainedin this paper to relate our results with previous experiences using spectro-radiometers
437 Relative greennessIt is de ned as the relative variation of NDVI with respect to its maximum and
minimum of a long period In this way the change due to the climatic conditionscan be discriminated better in each pixel since the absolute value of the NDVI issometimes more related to the landscaping composition of the pixel ( green cover)instead of its seasonal dynamism This index was proposed by Kogan (1990)
RGRE=NDVI
ishy NDVImin
NDVImax shy NDVImintimes100 (10)
where RGREi indicates the relative greenness for period i NDVI
ithe value of the
Estimation of fuel moisture content 2153
vegetation index for that period and NDVImin and NDVImax the maximum andminimum values of the indices for the series of images analysed This index iscurrently used in the National Fire Danger System of USA for estimating FMC oflive fuels (Burgan and Hartford 1993 Burgan et al 1998)
44 Correlation of FMC and spectral indicesAll these indices were computed for the six plots in which samples were collected
The average of the 3times3 pixels surrounding the plot was computed for each imagePearson correlation coeYcients were calculated after combining the three plots ofgrassland (21 observations three plotstimesseven dates) and the two plots of shrubland(14 observations two plotstimesseven dates) For the sixth plot covered by Q fagineaonly six observations were available for quantitative correlations (in one of theLandsat acquisition dates the leaves were still absent) which reduced notably thesigni cance level The FMC value of each plot was computed as previouslymentioned
5 Results51 T emporal variations of re ectance
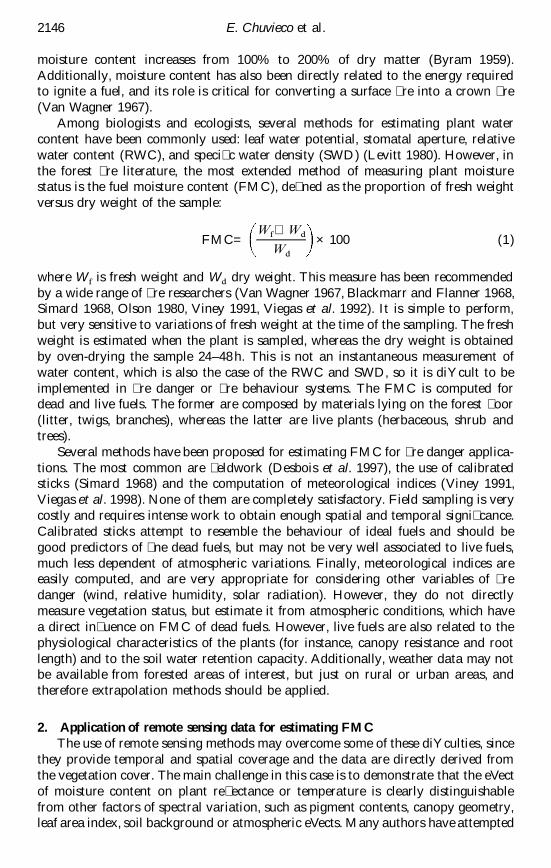
Figure 2 includes spectral re ectance curves for the average values of FMC ofgrassland and shrubland for the seven dates when Landsat TM images were availableCurves were labelled according to the FMC value measured in each date instead ofby the date of the images This made it possible to compare variations in FMC andspectral re ectance for the six optical bands of the Landsat TM sensor It wasremarkable that grasslands showed a stronger spectral contrast than shrublandalong with a higher variation in FMC Re ectance values were especially variablein the NIR wavelengths (band 4) in which grasslands varied from 011 to 024whereas shrublands only varied from 015 to 019 The SWIR bands were by far themost sensitive to variations in FMC ranging from 015 to 034 in grasslands andfrom 015 to 022 in shrublands (both in band 5) although the ranks of FMC andre ectance did not coincide Visible bands did not show a great sensitivity tovariations in FMC for neither grasslands nor shrublands
52 Quantitative analysisTable 2 includes Pearson r coeYcients between FMC and all the indices previ-
ously presented as well as the simple re ectances of Landsat TM bands In the caseof grasslands correlations were signi cant with most indices and original re ectancesThey were especially high for the integral and the wetness component of the tasselledcap transformation the re ectances of bands 5 and 7 the indices NDVI NDII5NDII7 LWCI RGRE and the rst derivative of bands 4 and 5 In all these casesPearson r values were higher than 08 and signi cant at 099 probability NIR andsome derivatives were the only variables not signi cantly related to FMC
The correlation of FMC and satellite variables in shrublands con rmed the clearsensitivity of the SWIR re ectance and the re ective contrast between the SWIRand NIR bands to variations in water content Pearson r correlations were signi cantfor bands 5 and 7 NDII5 LWCI the integral and wetness components and thederivatives of bands 2ndash3 and 4ndash5 when considering average values of shrubland Forspeci c species some of these signi cant values were lost either because of theanomalous character of FMC variation in the case of Erica or due to the smallnumber of observations in the case of R oYcinalis Similar conclusions can be
E Chuvieco et al2154
(a)
(b)
Figure 2 Variations of spectral re ectance of Landsat images with FMC (a) grasslands(b) shrubland
obtained from Q faginea which showed high correlations but not signi cant at 099because of the small number of samples available Among the original bands onlythe SWIR re ectances showed clear relations with FMC although in the case ofErica the relations were weak The visible and NIR bands did not show any relationwith FMC NIR re ectance showed negative signs with FMC as opposed to whatwas observed in grasslands Regarding the derived indices those that explore thecontrast between SWIR and NIR bands showed the highest associations LWCINDII the integral of bands 1ndash2ndash3ndash5ndash7 and the derivatives of bands 2ndash3 and 4ndash5provided the most consistent correlations being signi cant at 095 with C ladaniferand R oYcinalis Wetness worked well with all species but Erica which showed theworst correlations with other indices
When combining data from grasslands and shrublands in the same correlationanalysis the single variable with the highest correlation is the derivative of bands4ndash5 (r2=0592) followed by the integral (r2=0589) and the NDII5 (r2=0579) Inany case the correlation is reduced with respect to the correlation of single speciessince FMC variation is species dependent
As for the oaks (Q faginea) the most explicative variable of FMC was the NDII5
Estimation of fuel moisture content 2155
Table 2 Pearson r correlation coeYcients of FMC and Landsat TM derived indices (Namesof independent variables are referred to in the text The number of samples is givenin table 1)
Grassland Shrubland C ladanifer Erica R oYcinalis Q faginea
B1 shy 0624 shy 0197 shy 0164 shy 0038 shy 0427 0100B2
shy 0639 shy 0142 shy 0165 shy 0115 shy 0181 0421B3 shy 0781 shy 0562 shy 0545 shy 0286 shy 0750 shy 0020B4 0453 shy 0171 shy 0294 0187 shy 0220 0256B5 shy 0881 shy 0808 shy 0812 shy 0451 shy 0806 shy 0764B7
shy 0876 shy 0679 shy 0674 shy 0215 shy 0849 shy 0634NDVI 0869 0486 0431 0334 0676 0091NDII (band 5) 0855 0753 0689 0584 0805 0808NDII (band 7) 0820 0637 0595 0274 0828 0706LWCI 0847 0738 0663 0611 0778 0689Wetness 0905 0666 0635 0198 0794 0661Integral shy 0906 shy 0782 shy 0780 shy 0334 shy 0892 shy 0666Der1ndash2 shy 0131 0155 0056 shy 0102 0590 0792Der2ndash3 shy 0771 shy 0725 shy 0673 shy 0323 shy 0913 shy 0803Der3ndash4 0717 0170 0048 0335 0269 0299Der4ndash5 shy 0882 shy 0764 shy 0695 shy 0593 shy 0830 shy 0773Der5ndash7 0208 0078 0088 0267 shy 0182 0083RGRE 0877 0518 0455 0364 0676 0091
Bold types refer to signi cant correlations at 099 Underlined are correlations signi cantat 095
but again Der2ndash3 was closely associated to FMC as well as Der1ndash2 Der4ndash5 andNDII7 NDVI performed poorly for estimating FMC The reason to explain thiscould be the poor leave coverage during early spring and late summer Howeverthe small sample size avoided establishing solid conclusions from this dataset
53 T esting multiple regression trendsOnce signi cant correlations were found it was possible to undertake the estima-
tion phase in which FMC might be derived from Landsat TM variables Multiplelinear regression analyses were carried out using stepwise forward selection withthresholds of 008 to accept and 01 to reject a variable (SPSS 1999) Three analyseswere undertaken grasslands shrublands and the combination of the two
For grasslands the variables selected with the threshold criteria were the integralof bands 1ndash2ndash3ndash5ndash7 and the NDVI The former provided the highest explanation(r2=081) and the latter a small increment in the predictive value ( nal adjustedr2 =084) The nal equation was
FMCg=184227shy 179126 Integral+21859 NDVI (11)
Observed versus predicted values showed a solid trend throughout the range ofFMC values ( gure 3) although negative values were estimated in two cases (notshown on the graph) The errors ranged from 7276 to 093 of FMC with anaverage of 2709 In proportional terms the maximum error was found in a singleplot for September 1998 in which the estimation was 28 versus the actual 5FMC The minimum error was in July 1997 in which the estimation was 5889versus the actual 5709 FMC
For shrublands the selected variables for multiple regression analysis were
E Chuvieco et al2156
Figure 3 Observed versus predicted FMC values for grasslands
re ectance of band 5 and the derivative of bands 2 and 3 (Der2ndash3) Adjusted r2coeYcients of 06246 and 07396 were obtained after including the rst and thesecond variable respectively The equation generated was
FMCs=1855549shy 464932 R5shy 1453814 (Der2ndash3) (12)
where R5 is band 5 re ectance Observed versus predicted values are included in gure 4 which shows a lower dispersion than grassland in high values of FMC butless con dence in the lower values In any case the errors were less important inboth absolute and relative terms because the variation of FMC was much lower inshrublands than in grasslands Maximum and minimum absolute errors were 2230and 063 FMC respectively in proportion to the actual value of FMC the errorswere in the range from 33 to 1
When considering single shrub species the variables selected in stepwise forward
Figure 4 Observed versus predicted FMC values for shrublands
Estimation of fuel moisture content 2157
multiple regression changed from those selected for the average shrub value In thecase of C ladanifer only the re ectance of band 5 was selected for Erica the LWCI
and wetness were elected and for R oYcinalis Der2ndash3 only Adjusted determination
coeYcients (r2 ) were lower than for the equation of average shrubs 063 forC ladanifer 059 for Erica and 079 for R oYcinalis When the two variables
previously included in the estimation of the average values of shrub (R5 and Der2ndash3)
were introduced in the equations for single species the results were still acceptableThe explanation was better for R oYcinalis (adjusted r2=088 versus 079 with just
Der2ndash3) but this increase might be related to the few degrees of freedom of the
tting since only seven observations were available Erica decreased notably the
adjusted r2 from the previous tting with LWCI and Wetness (the r2 declined to007) and C ladanifer maintained a similar explanation capacity (r2=069) Since
the areas observed by the satellite sensor are usually a mixture of diVerent shrub
species we decided to use the coeYcients of the average FMC for further application
54 Mapping the estimated FMC
In order to apply these equations operationally some criteria to distinguishbetween herbaceous and shrub vegetation needed to be applied The use of auxiliary
sources such as land cover or vegetation maps can solve this limitation but also
criteria based on the image itself may be applied For instance discrimination between
grasslands and shrublands may be based on a previous classi cation of the image
or just on a single threshold related to the multitemporal variability of vegetation
indices Since grasslands would show a clearer seasonal contrast than shrublands
the standard deviation of NDVI or NDII values for each pixel may be used todiscriminate between the two covers In our case standard deviations of NDVI
values for the three grasslands plots were 015013 01776 and 01386 while for the
two plots of shrublands the values were almost one-third lower (00674 and 00771)
The contrast was even greater for NDII5 (0223 0244 and 0200 for grasslands and
0077 and 0074 for shrublands)
As an example of FMC maps derived from Landsat TM images gure 5 shows
the map of estimated FMC for the 24 July 1998 image The study area was dividedinto two covers grassland and shrublands by multitemporal thresholding of NDVI
and NDII indices Empirical equations previously generated (11 and 12) were applied
to obtain a synthetic image of the spatial variations of FMC Lower values of FMC
were found in the Central Valley of the study area dominated by grasslands (FMC
values lower than 30) Shrub species showed higher values of FMC in the range
of 80ndash110 but the highest values were observed for areas covered by Q faginea
oaks which reached up to 120An alternative way of generating FMC estimations was to apply a single equation
for both grasslands and shrublands The estimation in this case was based on a
common regression analysis of both sets of land plots The most explicative variable
in this case was the rst derivative of bands 4 and 5 An adjusted r2 of 06326 was
obtained which was clearly lower than the one computed from grasslands and
shrublands separately The errors of estimation were also higher with a maximum
of 128 and a minimum of 506 for grasslands and 586 and 820 for
shrublands respectively Therefore this single equation should only be used whenlittle chances of discriminating herbaceous and shrub species are available
E Chuvieco et al2158
(a)
(b)
Figure 5 (a) False colour composite of the Landsat TM image of 24 July 1998 (b) EstimatedFMC from the same image
6 DiscussionThis paper oVers empirical relations of FMC and variables derived from Landsat
TM re ectances for several Mediterranean fuels It shows the utility of includingbands located in the SWIR region to improve the estimations of FMC provided byvisible and NIR bands Since Landsat TM data are not very appropriated foroperational re danger estimation this experience emphasizes the need of including
Estimation of fuel moisture content 2159
SWIR bands in other sensors with better temporal resolution such as NOAAAVHRR The new series of the AVHRR sensor on board NOAA-15 and -16 hadincluded such band during diurnal acquisitions However there are still few imagesavailable for evaluating its performance (AVHRR transmission in NOAA-15 wasinterrupted in September 2000)
The best correlations for FMC of grasslands were found with the original SWIRbands and with those indices that take into account the spectral contrast of theNIRndashR spectral regions (such as the NDVI) and the NIRndashSWIR spectral regions(the NDII LWCI and Der4ndash5) but also the VISndashSWIR regions (such as the integral)However the relations should not be interpreted in the same way for these threespectral domains While the good correlations between FMC and the SWIR bandscan be based on the presence of high-absorption peaks in this spectral region therelation of FMC and NDVI should be related to changes in chlorophyll contentand leaf structure that accompanies the curing of herbaceous plants In other wordsthe high signi cance of the NIRndashR space to monitor changes in FMC of herbaceousplants should be related to the eVects of FMC variation on grass physiologicalstatus rather than on their water content per se It was noteworthy to observe thelack of signi cant correlation between FMC and the NIR band (band 4) of grass-lands The low sensitivity of band 4 con rmed the contradictory eVects of waterreduction on NIR re ectance that were previously noted (increase due to lowabsorption decrease because of damaged leaf structure and leaf curing)
Since the reduction of FMC in shrubs does not imply a serious deterioration ofleaf structure NIR re ectance increased with FMC in most shrub species as a resultof lower water absorption The indirect eVects of water reduction on the speciesrsquophysiology were not as noteworthy in shrubs as in herbaceous species Additionallyin the case of species that reduce their leaf area index as a result of dryness(C ladanifer) the increase of NIR re ectance may also be related to soil backgroundin uences
In the case of SWIR bands both shrublands and grasslands re ectances wereclearly in uenced by water absorption which explains the consistency of the relationsacross species The lower values found in Erica should be related to the greathomogeneity of this species between the spring and summer
Considering the diVerent derived indices reviewed throughout this paper wetnessshows a promising potential for estimating FMC in both grassland and some shrubspecies This is quite remarkable since the tasselled cap transformation was originallydeveloped for agricultural areas and computed from raw digital values (thereforeno atmospheric correction calibration or observation angles were considered ) Theweak physical interpretation of this component (empirically based on images froma very diVerent environment to our study area) makes it preferable to use the integralof bands 1ndash2ndash3ndash5ndash7 which is based on corrected re ectances and also considersseveral water absorption bands With respect to LWCI NDII and the derivative of4ndash5 the last two are preferable because they provide similar or better correlationsthan LWCI and do not require a previous estimation of re ectances for areas atfull turgor
The greater sensitivity of SWIRndashNIR contrast to FMC variations was somehowchallenged by the good correlations found with the derivative of bands 2 and 3(greenndashred) which were consistent for all shrub species with the exception of EricaThe sensitivity of this contrast to water content was previously noticed by Jacksonand Ezra (1985) and partially by Carter (1994)
E Chuvieco et al2160
Empirical equations for estimating FMC have showed errors averaging from 8to 23 (lower for shrublands higher for grasslands and oaks since these speciesare more variable throughout the year) These errors are acceptable for re dangerapplications although further improvements could be expected by consideringthermal bands and meteorological information
AcknowledgmentsThis research has been funded by the Control-Fire-Sat (ENV4-CT97-0479) and
In ame projects (ENV4-CT98-0700) under the Environment and Climate Programof the European Commission (DG-XII ) The authorities of the Cabaneros NationalPark have allowed the eldwork to be carried out and have kindly providedauxiliary data
Financial support was also obtained from the Spanish Ministry of Science throughproject number AGF96-2094-CE Linguistic assistance from Patrick Vaughan is alsoacknowledged
References
Alonso M Camarasa A Chuvieco E Cocero D Kyun I Martirsquon M P andSalas F J 1996 Estimating temporal dynamics of fuel moisture content ofMediterranean species from NOAA-AVHRR data EARSEL Advances in RemoteSensing 4-4 9ndash24
Blackmarr W H and Flanner W B 1968 Seasonal and diurnal variation in moisturecontent of six species of Pocosin shrubs SE-33 Southeastern Forest ExperimentStation US Forest Service Asheville
Bowman W D 1989 The relationship between leaf water status gas exchange and spectralre ectance in cotton leaves Remote Sensing of Environment 30 249ndash255
Burgan R E and Hartford R A 1993 Monitoring vegetation greenness with satellitedata GTR INT-297 USDA Forest Service Ogden Utah
Burgan R E Klaver R W and Klaver J M 1998 Fuel models and re potentialfrom satellite and surface observations International Journal of W ildland Fire 8159ndash170
Byram G M 1959 Combustion of forest fuels In Forest Fire Control and Use edited byK P Davis (New York McGraw-Hill) pp 155ndash182
Carter G A 1991 Primary and secondary eVects of water content on the spectral re ectanceof leaves American Journal of Botany 78 916ndash924
Carter G A 1994 Ratios of leaf re ectances in narrow wavebands as indicators of plantstress International Journal of Remote Sensing 15 697ndash703
Chavez P S 1996 Image-based atmospheric corrections Revisited and improvedPhotogrammetric Engineering and Remote Sensing 62 1025ndash1036
Chladil M A and Nunez M 1995 Assessing grasslandmoisture and biomass in TasmaniaThe application of remote sensing and empirical models for a cloudy environmentInternational Journal of W ildland Fire 5 165ndash171
Chuvieco E Deshayes M Stach N Cocero D and Rian~o D 1999 Short-term rerisk foliage moisture content estimation from satellite data In Remote Sensing ofL arge W ild res in the European Mediterranean Basin edited by E Chuvieco (BerlinSpringer-Verlag) pp 17ndash38
Cohen W B 1991 Temporal versus spatial variation in leaf re ectance under changingwater stress conditions International Journal of Remote Sensing 12 1865ndash1876
Crist E P and Cicone R C 1984 A physically-based transformation of Thematic Mapperdata the TM tasseled cap IEEE T ransactions on Geoscience and Remote SensingGE22 256ndash263
Danson F M Steven M D Malthus T J and Clark J A 1992 High-spectralresolution data for determining leaf water content International Journal of RemoteSensing 13 461ndash470
Desbois N Deshayes M and Beudoin A 1997 Protocol for fuel moisture content
Estimation of fuel moisture content 2161
measurements In A Review of Remote Sensing Methods for the Study of L arge W ildlandFires edited by E Chuvieco (Alcala de Henares Departamento de GeografIgrave aUniversidad de Alcala) pp 61ndash72
Deshayes M Chuvieco E Cocero D Karteris M Koutsias N and Stach N 1998Evaluation of diVerent NOAA-AVHRR derived indices for fuel moisture contentestimation interest for short-term re risk assessment In III International Conferenceon Forest Fire Researchndash14th Conference on Fire and Forest Meteorology edited byD X Viegas (Coimbra Portugal ADAI) pp 1149ndash1167
Gao B C 1996 NDWI A normalized diVerence water index for remote sensing of vegetationliquid water from space Remote Sensing of Environment 58 257ndash266
Hardy C C and Burgan R E 1999 Evaluation of NDVI for monitoring live moisturein three vegetation types of the Western US Photogrammetric Engineering and RemoteSensing 65 603ndash610
Hunt E R and Rock B N 1989 Detection of changes in leaf water content using nearand middle-infrared re ectances Remote Sensing of Environment 30 43ndash54
Hunt E R Rock B N and Nobel P S 1987 Measurement of leaf relative water contentby infrared re ectance Remote Sensing of Environment 22 429ndash435
Illera P Fernarsquondez A and Delgado J A 1996 Temporal evolution of the NDVI asan indicator of forest re danger International Journal of Remote Sensing 171093ndash1105
Jackson R D and Ezra C E 1985 Spectral response of cotton to suddenly inducedwater stress International Journal Remote Sensing 6 177ndash185
Kauth R J and Thomas G S 1976 The Tasseled Cap A graphic description of thespectralndashtemporal development of agricultural crops as seen by Landsat In Symposiumon Machine Processing of Remotely Sensed Data Purdue University West L afayettepp 41ndash51
Kogan F N 1990 Remote sensing of weather impacts on vegetation in non-homogeneousareas International Journal of Remote Sensing 11 1405ndash1419
Levitt J 1980 Responses of Plants to Environmental Stresses Vol II Water Radiation Saltand other Stresses (New York Academic Press)
Lorsquopez S Gonzarsquolez F Llop R and Cuevas J M 1991 An evaluation of the utility ofNOAA AVHRR images for monitoring forest re risk in Spain International Journalof Remote Sensing 12 1841ndash1851
Moran M S Clarke T R Inoue Y and Vidal A 1994 Estimating crop water de citusing the relation between surface-air temperature and spectral vegetation indexRemote Sensing of Environment 49 246ndash263
Olson C M 1980 An evaluation of the KeetchndashByram drought index as a predictor offoliar moisture content in a chaparral community In Sixth Conference on Fire andForest Meteorology American Meteorological Society Seattle pp 241ndash244
Paltridge G W and Barber J 1988 Monitoring grassland dryness and re potential inAustralia with NOAAAVHRR data Remote Sensing of Environment 25 381ndash394
Pen~uelas J I F Biel C Serrano L and Saversquo R 1993 The re ectance at the 950ndash970 nm region as an indicator of plant water status International Journal of RemoteSensing 14 1887ndash1905
Pen~uelas J Pin~ol J Ogaya R and Filella I 1997 Estimation of plant water concentra-tion by the re ectance Water Index WI (R900R970) International Journal of RemoteSensing 18 2869ndash2875
Pierce L L Running S W and Riggs G A 1990 Remote detection of canopy waterstress in coniferous forest using the NSOO1 Thematic Mapper simulator and thethermal infrared multispectral scanner Photogrammetric Engineering and RemoteSensing 56 579ndash586
Pinder J E and McLeod K W 1999 Indications or relative drought stress in longleafpine from Thematic Mapper data Photogrammetric Engineering and Remote Sensing65 495ndash501
Pons X and Solersquo-Sugran~ es L 1994 A simple radiometric correction model to improveautomatic mapping of vegetation from multispectral satellite data Remote Sensing ofEnvironment 48 191ndash204
Prosper-Laget V Douguersquodroit A and Guinot J P 1994 Mapping the risk of forest
Estimation of fuel moisture content2162
re departure using NOAA satellite information In InternationalWorkshop on SatelliteT echnology and GIS for Mediterranean Forest Mapping and Fire Management edited(Thessaloniki) pp 151ndash163
Prosper-Laget V Douguersquodroit A and Guinot J P 1995 Mapping the risk of forest re occurrence using NOAA satellite informationEARSeL Advances in Remote Sensing4-3 30ndash38
Ripple W J 1986 Spectral re ectance relationships to leaf water stress PhotogrammetricEngineering and Remote Sensing 52 1669ndash1675
Rothermel R C Wilson R A Morris G A and Sackett S S 1986 Modellingmoisture content of ne dead wildland fuels input to BEHAVE re prediction systemResearch Paper INT-359 USDA Forest Service Intermountain Research StationOdgen Utah
Simard A J 1968 The moisture content of forest fuelsmdasha review of the basic conceptsFF-X-14 Forest Fire Research Institute Ottawa Ontario
SPSS 1999 SPSS for Windows v 10 SPSS Inc ChicagoThomas J R Namken L N Oerther G F and Brown R G 1971 Estimating leaf
water content by re ectance measurements Agronomy Journal 63 845ndash847Tucker C J 1980 Remote sensing of leaf water content in the near infrared Remote Sensing
of Environment 10 23ndash32Ustin S L Roberts D S Pinzorsquon J Jacquemoud S Gardner M Scheer B
Castan~eda C M and Palacios-Orueta A 1998 Estimating canopy water contentof chaparral shrubs using optical methods Remote Sensing of Environment 65 280ndash291
Van Wagner C E 1967 Seasonal variation in moisture content of Eastern Canadian treefoliage and the possible eVect on crown res Departmental Publication no 1204Forestry Branch Canada
Vidal A and Devaux-Ros C 1995 Evaluating forest re hazard with a Landsat TMderived water stress index Agricultural and Forest Meteorology 77 207ndash224
Vidal A Pinglo F Durand H Devaux-Ros C and Maillet A 1994 Evaluation ofa temporal re risk index in Mediterranean forest from NOAA thermal IR RemoteSensing of Environment 49 296ndash303
Viegas D X Pin~ol J Viegas M T and Ogaya R 1998 Moisture content of livingforest fuels and their relationship with meteorological indices in the Iberian PeninsulaIII International Conference on Forest Fire Researchndash14th Conference on Fire andForest Meteorology edited by D X Viegas (Coimbra Portugal ADAI) pp 1029ndash1046
Viegas D X Viegas T P and Ferreira A D 1992 Moisture content of ne forest fuelsand re occurrence in central Portugal InternationalJournal of W ildland Fire 2 69ndash85
Viney N R 1991 A review of ne fuel moisture modelling International Journal of W ildlandFire 1 215ndash234
Weber J A and Ustin S L 1991 Diurnal water relations of walnut trees implicationsfor remote sensing IEEE T ransactions on Geoscience and Remote Sensing 29 864ndash874
Westman W E and Price C V 1988 Spectral changes in conifers subjected to air pollutionand water stress experimental studies IEEE T ransactions on Geoscience and RemoteSensing 26 11ndash20
E Chuvieco et al2146
moisture content increases from 100 to 200 of dry matter (Byram 1959)Additionally moisture content has also been directly related to the energy requiredto ignite a fuel and its role is critical for converting a surface re into a crown re(Van Wagner 1967)
Among biologists and ecologists several methods for estimating plant watercontent have been commonly used leaf water potential stomatal aperture relativewater content (RWC) and speci c water density (SWD) (Levitt 1980) However inthe forest re literature the most extended method of measuring plant moisturestatus is the fuel moisture content (FMC) de ned as the proportion of fresh weightversus dry weight of the sample
FMC=Wf shy Wd
Wd
times100 (1)
where W f is fresh weight and W d dry weight This measure has been recommendedby a wide range of re researchers (Van Wagner 1967 Blackmarr and Flanner 1968Simard 1968 Olson 1980 Viney 1991 Viegas et al 1992) It is simple to performbut very sensitive to variations of fresh weight at the time of the sampling The freshweight is estimated when the plant is sampled whereas the dry weight is obtainedby oven-drying the sample 24ndash48 h This is not an instantaneous measurement ofwater content which is also the case of the RWC and SWD so it is diYcult to beimplemented in re danger or re behaviour systems The FMC is computed fordead and live fuels The former are composed by materials lying on the forest oor( litter twigs branches) whereas the latter are live plants (herbaceous shrub andtrees)
Several methods have been proposed for estimating FMC for re danger applica-tions The most common are eldwork (Desbois et al 1997) the use of calibratedsticks (Simard 1968) and the computation of meteorological indices (Viney 1991Viegas et al 1998) None of them are completely satisfactory Field sampling is verycostly and requires intense work to obtain enough spatial and temporal signi canceCalibrated sticks attempt to resemble the behaviour of ideal fuels and should begood predictors of ne dead fuels but may not be very well associated to live fuelsmuch less dependent of atmospheric variations Finally meteorological indices areeasily computed and are very appropriate for considering other variables of redanger (wind relative humidity solar radiation) However they do not directlymeasure vegetation status but estimate it from atmospheric conditions which havea direct in uence on FMC of dead fuels However live fuels are also related to thephysiological characteristics of the plants (for instance canopy resistance and rootlength) and to the soil water retention capacity Additionally weather data may notbe available from forested areas of interest but just on rural or urban areas andtherefore extrapolation methods should be applied
2 Application of remote sensing data for estimating FMCThe use of remote sensing methods may overcome some of these diYculties since
they provide temporal and spatial coverage and the data are directly derived fromthe vegetation cover The main challenge in this case is to demonstrate that the eVectof moisture content on plant re ectance or temperature is clearly distinguishablefrom other factors of spectral variation such as pigment contents canopy geometryleaf area index soil background or atmospheric eVects Many authors have attempted
Estimation of fuel moisture content 2147
to prove this potentiality both from airborne and satellite sensors However sincesome factors of potential noise are diYcult to control an ample range of laboratoryspectral measurements have also been performed These studies have shown thatplant water content is most clearly related to short-wave infrared re ectance (SWIR)ranging from 14 to 20 mm (Thomas et al 1971 Tucker 1980 Jackson and Ezra1985 Ripple 1986 Hunt et al 1987 Bowman 1989 Cohen 1991) It is well knownthat these wavelengths present high water absorption peaks and therefore SWIRre ectance is negatively related to plant water content The monitoring of watercontent in the near-infrared (NIR) band (08ndash11 mm) is not so evident Increasesand decreases in re ectance were measured depending on whether the target was asingle leaf or a canopy For single leaves most authors found an increase in NIRre ectance when the leaf dries (Thomas et al 1971 Hunt et al 1987 Bowman 1989Hunt and Rock 1989) which may be caused by the increment in the refractive indexof the mesophyll layer when water is replaced by air However other authorsmeasured a decrease in re ectance (Westman and Price 1988 Penuelas et al 1993)This reduction may be caused by the indirect eVects of leaf dryness such as thedecrease in leaf area index or shadowing due to leaf curling (Jackson and Ezra 1985Westman and Price 1988) Finally a third group of authors did not nd a signi cantchange in NIR re ectance for leaf drying (Pierce et al 1990 Carter 1991) Finallythe visible domain has proved to be not very sensitive to leaf water content at leastin absolute terms (Jackson and Ezra 1985 Bowman 1989)
The use of satellite data in FMC estimation has been focused on NOAA AdvancedVery High Resolution Radiometer (AVHRR) images since they provide the requiredtemporal resolution for these studies The most solid relations were found betweenFMC of grasslands and multitemporal series of NDVI derived from AVHRR images(Paltridge and Barber 1988 Chladil and Nunez 1995) Less coherent were therelations between AVHRR data and FMC of shrubs (Alonso et al 1996 Deshayeset al 1998) which are less homogeneous than grasslands in Mediterranean areasand better adapted to the summer drought and show a lower range of FMCthroughout the vegetative period A recent study by Hardy and Burgan (1999) foundsimilar tendencies They estimated FMC from multitemporal airborne data of fourperiods and found good agreements between NDVI and FMC for grasslands butnot for trees and shrublands Another group of authors base the estimation of redanger on thermal channels which are commonly combined with vegetation indicesParticularly good results have been obtained with the water de cit index (Vidalet al 1994 derived by Moran et al 1994) the orthogonal regression of NDVI andsurface temperature (T
s) (Prosper-Laget et al 1994 1995) and the single ratio of
NDVI and Ts
(Chuvieco et al 1999)Additional studies have also suggested the use of NOAA AVHRR data to monitor
re danger but they are not aimed speci cally at measuring FMC These studiespropose diVerent techniques for emphasizing the multitemporal decrease in vegeta-tion vigour mainly by using indices based on the measure of NDVI change fromprevious periods (Lopez et al 1991 Illera et al 1996) Most of these attempts forestimating re danger were assessed by comparing danger values and re occurrencebut actual eld estimations of FMC were not performed This approach might beconsidered an indirect validation of a re danger index since re occurrence is aconjunction of diVerent factors both environmentally and human caused Satellitedata can only assess vegetation state (ideally FMC) but other factors related to reignition or re propagation such as wind or human activity cannot be directly
E Chuvieco et al2148
derived from satellite observations Fire only occurs when an ignition cause is presenteven if FMC is not critically low On the other hand critical levels of FMC maynot necessarily lead to res if other factors of risk do not appear
3 ObjectivesThe purpose of this paper was to de ne indices based on re ectance measurements
performed by the Landsat Thematic Mapper (TM) sensor in order to estimate FMCof live Mediterranean fuels The nal goal of this research was to estimate re dangerfrom satellite-derived indices Although temporal resolution of Landsat TM data isvery low for operational re danger estimation (daily to weekly predictions arerequired by re managers) it provides two important advantages over other sensorsFirst it includes measurements of SWIR re ectance (bands 5 and 7) which aspreviously reviewed is more clearly related to water content than visible or NIRbands Second the higher spatial resolution of Landsat TM reduces the uncertaintyin correlating eld measurements and satellite data since the location of land plotsis much easier with images of this sensor than with NOAA AVHRR imagesExperiences from the analysis of Landsat TM data will be used in the future tocalibrate results obtained from NOAA AVHRR images using the same set of elddata
Landsat TM images have been previously tested for drought and re dangerestimation (Vidal and Devaux-Ros 1995 Pinder and McLeod 1999) but no quantit-ative relations with FMC were addressed This paper includes the analysis of indicesderived from the optical bands of Landsat TM (1 2 3 4 5 and 7) whereas theexamination of thermal and opticalndashthermal indices will be covered in a future work
4 Methods41 Field sampling
Field sampling is the most direct method of estimating FMC but implies prob-lems to assure the spatial and temporal signi cance of the sample Field measuringis commonly performed at noontime when the FMC is lowest and therefore rerisk conditions are higher (Desbois et al 1997 Chuvieco et al 1999) It is stronglyrecommended that periodic sampling is performed during the re season in orderto monitor variations in risk conditions Some authors recommend sampling every2ndash3 days (Desbois et al 1997) whereas others propose once a week or every otherweek (Alonso et al 1996 Viegas et al 1998) Properly speaking FMC determinationwould require the measurement of the diVerent materials that form a fuel complexor a plant leaves trunks and branches which is operationally very diYcult Tosimplify FMC estimation in live fuels most operational experiences sample onlyfoliage Obviously the FMC of leaves is higher than the FMC of woody materialsand more variable throughout the year However it should be stated that foliagemoisture content is the most critical in re propagation Additionally lsquosince leavesterminate the biological pathway of water transport and are exposed to the greatestdrop in leaf water potential leaf water status is a sensitive indicator of canopy waterstatus especially when measurements include canopy position eVects (sunlight vsshaded eVects)rsquo (Weber and Ustin 1991 p 865) Therefore to measure foliage FMCas a surrogate of plant water content is a logical election and greatly facilitates theapplication of external methods (especially remote sensors) for estimating FMC
For this project eld sampling of FMC was undertaken from early April to theend of September between 1996 and 1999 The study area selected was part of the
Estimation of fuel moisture content 2149
Cabaneros National Park located in Central Spain 200km south of Madrid( gure 1) which includes a wide representation of Mediterranean species Plots were10times10 m long positioned in the central valley of the Park with very gentle slopes(lt5) Distance between the plots ranged between 5 and 37 km The total distancebetween the rst and the last was about 20 km A total of six plots were sampledThe rst three were covered 100 by herbaceous species although in the summerthe eVect of soil background was noticeable during the eld sampling They diVerin soil depth and grass height and biomass The fourth and fth plots were 95covered by shrub species (the rest was soil background or some herbaceous species)which are very common in Mediterranean forested areas Cistus ladanifer and Ericaaustralis were sampled in the fourth plot and these two species plus in Erica umbellataand Rosmarinus oYcinalis in the fth The last plot was dedicated to sample leavesof Quercus faginea a typical Mediterranean oak This species presents a crown coverof 90 during late spring and summer (when leaves are opened ) but just 30during early spring (March to the beginning of April )
Samples were composed of terminal leaves for shrubs and trees whereas thewhole plant was extracted for herbaceous species Three samples per species andplot were collected every 8 days between 12 and 14 h GMT to coincide with theperiod of highest re risk Unfortunately the time of eld sampling did not corre-spond with the satellite acquisition (1030 versus 12ndash14 GMT) which may introducesome noise especially in the warmest days However some authors working insimilar climatic areas did not observe signi cant diVerences in FMC between 10 am
Figure 1 A 3D Landsat image of the study area with the location of sampled plots Thenumbers for the plots are referred to in the text (1ndash3 are grasslands 4 and 5 shrublandsand 6 oak trees)
E Chuvieco et al2150
and 5 pm (Ustin et al 1998) and it was therefore assumed that FMC conditionsmeasured on the eld would still be comparable to those at satellite acquisition timeThe dates of eld sampling were chosen in accordance with the Landsat orbitalcycles and therefore every other sampling the FMC measurement coincides with asatellite acquisition (16 days)
Each sample was composed of approximately 100g of leaves and small terminalbranches (in the case of shrub species) or herbaceous plants (in the case of grassland)The sample was then put in an envelope sealed and weighed with a eld balance(precision plusmn01 g) The envelopes with the samples were then dried in an oven during48 h at 60deg C and weighed again with the same balance The weight of the envelopeswas subtracted to compute the FMC following the equation (1)
The representative value of FMC for each plot and date was computed as theaverage of the three samples collected in each day and plot In the case of plots 4and 5 since there was a mixture of several shrub species an average value per specieswas computed as well as the average value of all the species collected in that plot(C ladanifer and E australis in plot 4 and C ladanifer E australis E umbellata andR oYcinalis in plot 5)
42 Image pre-processingSeven Landsat TM images were purchased for multitemporal estimation of FMC
An attempt was made to include a wide range of FMC conditions from early springto mid spring summer and early autumn Problems of cloud cover precluded theuse of a single year and therefore 3 years of images were processed for thoseacquired on 16 April 21 July and 23 September in 1997 for those acquired on5 May 24 July and 10 September in 1998 and 6 April in 1999 The range of FMCvalues for the species collected during those days are included in table 1 Asmentioned image dates coincided with eld sampling dates
The seven Landsat images were geo-referenced and co-registered to ensure spatialintegrity of the multitemporal series RMS errors of the correction were lower than1 pixel for all the images Calibration of raw digital values to radiance was performedusing the coeYcients included in the header les The atmospheric correction wasbased on a revision of the dark-object method recently proposed which estimatesatmospheric transmissivity as a function of the cosine of the zenith angle (Chavez
Table 1 FMC values of the species collected
No of Standardsamples Minimum Maximum Average deviation
Grassland 21 4768 286415 86121 92518C ladanifer 14dagger 58254 135778 96500 24516Erica 14dagger 32009 104000 72028 17689Average shrub 14dagger 46083 128996 81260 22569R oYcinalis 7 52155 174549 112975 40056Q faginea 6Dagger 91322 212577 130601 47042
Includes three plots and seven periodsdaggerIncludes two plots and seven periodsDaggerIn one of the satellite acquisitions leaves of Q faginea were not available
Estimation of fuel moisture content 2151
1996) Re ectances of the six non-thermal channels were then computed following
rk=
Kp(Lsenk shy Lak
)E
a k(cos h
i)2
(2)
where rk
is the re ectance for band k K is a factor that takes into account thevariation of the SunndashEarth distance L senk is the radiance detected by the sensor(computed from the digital values using the calibration coeYcients included in theimage) L
a kis the atmospheric radiance computed from the minimum (dark-object)
value of that band E0k
is the solar irradiance at the top of the atmosphere and hthe solar zenith angle K was computed as a function of the Julian day (D)
K=(1+00167(sen (2p(Dshy 935)365)))2 (3)
43 Indices potentially related to FMCAfter obtaining the re ectances of the raw bands several indices potentially
related to FMC variations were computed A wide range of indices was testedfollowing recommendations obtained from previous literature review Obviouslyonly indices adapted to the spectral resolution of Landsat TM were computedbecause the proposals of some authors (Danson et al 1992 Gao 1996 Penuelaset al 1997) are only accessible from hyperspectral sensors
The following indices were considered
431 Normalized DiVerence Vegetation Index (NDVI)
NDVI=(rNIR shy rR)
(rNIR
+rR)
(4)
where rNIR and rR are re ectances in the near-infrared and red bands respectivelyThe NDVI has been successfully related to chlorophyll content absorbed radiationleaf area index and vegetation greenness As said before this index has also provenuseful for FMC estimation of grasslands
432 Normalized DiVerence Infrared Index (NDII)This is a variation of the NDVI using the SWIR instead of the R band (Hunt
and Rock 1989)
NDII=(rNIR shy rSWIR)
(rNIR+rSWIR )(5)
where rSWIR is the re ectance of channel 5 or 7 of Landsat TM
433 L eaf Water Content Index (LWCI)This is based on the diVerence between NIR and SWIR re ectance for a speci c
sample with respect to another sample at full turgor (Hunt et al 1987)
LWCI=shy log(1 shy (rNIR shy rSWIR))
shy log(1 shy (rNIRFT shy rSWIRFT ))(6)
where FT denotes a sample with maximum amount of water content It is verycomplex to obtain a sample at full turgor for each species simultaneously with thesatellite overpass Therefore for practical purposes we simpli ed this approach bytaking pixels from very green areas (agricultural plots at full turgor) located nearthe sampling area to compute reference re ectances of well-watered species
E Chuvieco et al2152
434 T asselled Cap lsquoWetnessrsquoThis transformation was originally de ned to enhance agricultural applications
of Landsat MSS data (Kauth and Thomas 1976) It tended to emphasize thediscrimination of soil and vegetation by creating new axes that are better adjustedto that physical space In that new system of coordinates the separation betweenboth covers is supposed to be clearer Its adaptation to Landsat TM images enabledthree components to be obtained Brightness Greenness and Wetness which emphas-ize bare soils vegetation and water bodies respectively (Crist and Cicone 1984) Thethird component is suitable for our objective since it should emphasize the signalderived from the water content As de ned by Crist and Cicone this component iscomputed as a simple transformation of the raw digital values
Wetness=01509B1+01973B2+03279B3+03406B4 shy 07112B5 shy 04572B7 (7)
435 IntegralSimilarly to the concept of wetness we propose to consider the integral of
re ectances in the visible and SWIR bands as an additional variable related to watercontent The basis of this proposal relies on the absorption eVect of water on thesebands (especially on the SWIR region) and therefore the integral should be nega-tively related to FMC The integral was computed as the re ectance of each bandmultiplied by the bandwidth
Integral=007r1+008r2+006r3+02r5+027r7 (8)
The NIR band was not considered to avoid indirect eVects ( leaf area index grasscuring) in FMC estimation
436 Spectral derivativesThese indices were proposed by Danson et al (1992) to enhance the spectral
signal produced by water content variations They were de ned as the ratio ofre ectance change along the diVerent wavelengths considered
Derkl
dR
dW=
Rlshy R
kW
lshy W
k(9)
where Der is derivative of two contiguous bands k and l Rl
and Rk
are re ectancesof the same bands and W
land W
kare the wavelengths of those bands The authors
found good correlations between these derived indices and FMC for several spectralregions located in the NIR and SWIR regions Since Landsat TM bands are notcontiguous the concept of derivative can not properly be applied but instead theslope or gradient between bands However the term derivative has been maintainedin this paper to relate our results with previous experiences using spectro-radiometers
437 Relative greennessIt is de ned as the relative variation of NDVI with respect to its maximum and
minimum of a long period In this way the change due to the climatic conditionscan be discriminated better in each pixel since the absolute value of the NDVI issometimes more related to the landscaping composition of the pixel ( green cover)instead of its seasonal dynamism This index was proposed by Kogan (1990)
RGRE=NDVI
ishy NDVImin
NDVImax shy NDVImintimes100 (10)
where RGREi indicates the relative greenness for period i NDVI
ithe value of the
Estimation of fuel moisture content 2153
vegetation index for that period and NDVImin and NDVImax the maximum andminimum values of the indices for the series of images analysed This index iscurrently used in the National Fire Danger System of USA for estimating FMC oflive fuels (Burgan and Hartford 1993 Burgan et al 1998)
44 Correlation of FMC and spectral indicesAll these indices were computed for the six plots in which samples were collected
The average of the 3times3 pixels surrounding the plot was computed for each imagePearson correlation coeYcients were calculated after combining the three plots ofgrassland (21 observations three plotstimesseven dates) and the two plots of shrubland(14 observations two plotstimesseven dates) For the sixth plot covered by Q fagineaonly six observations were available for quantitative correlations (in one of theLandsat acquisition dates the leaves were still absent) which reduced notably thesigni cance level The FMC value of each plot was computed as previouslymentioned
5 Results51 T emporal variations of re ectance
Figure 2 includes spectral re ectance curves for the average values of FMC ofgrassland and shrubland for the seven dates when Landsat TM images were availableCurves were labelled according to the FMC value measured in each date instead ofby the date of the images This made it possible to compare variations in FMC andspectral re ectance for the six optical bands of the Landsat TM sensor It wasremarkable that grasslands showed a stronger spectral contrast than shrublandalong with a higher variation in FMC Re ectance values were especially variablein the NIR wavelengths (band 4) in which grasslands varied from 011 to 024whereas shrublands only varied from 015 to 019 The SWIR bands were by far themost sensitive to variations in FMC ranging from 015 to 034 in grasslands andfrom 015 to 022 in shrublands (both in band 5) although the ranks of FMC andre ectance did not coincide Visible bands did not show a great sensitivity tovariations in FMC for neither grasslands nor shrublands
52 Quantitative analysisTable 2 includes Pearson r coeYcients between FMC and all the indices previ-
ously presented as well as the simple re ectances of Landsat TM bands In the caseof grasslands correlations were signi cant with most indices and original re ectancesThey were especially high for the integral and the wetness component of the tasselledcap transformation the re ectances of bands 5 and 7 the indices NDVI NDII5NDII7 LWCI RGRE and the rst derivative of bands 4 and 5 In all these casesPearson r values were higher than 08 and signi cant at 099 probability NIR andsome derivatives were the only variables not signi cantly related to FMC
The correlation of FMC and satellite variables in shrublands con rmed the clearsensitivity of the SWIR re ectance and the re ective contrast between the SWIRand NIR bands to variations in water content Pearson r correlations were signi cantfor bands 5 and 7 NDII5 LWCI the integral and wetness components and thederivatives of bands 2ndash3 and 4ndash5 when considering average values of shrubland Forspeci c species some of these signi cant values were lost either because of theanomalous character of FMC variation in the case of Erica or due to the smallnumber of observations in the case of R oYcinalis Similar conclusions can be
E Chuvieco et al2154
(a)
(b)
Figure 2 Variations of spectral re ectance of Landsat images with FMC (a) grasslands(b) shrubland
obtained from Q faginea which showed high correlations but not signi cant at 099because of the small number of samples available Among the original bands onlythe SWIR re ectances showed clear relations with FMC although in the case ofErica the relations were weak The visible and NIR bands did not show any relationwith FMC NIR re ectance showed negative signs with FMC as opposed to whatwas observed in grasslands Regarding the derived indices those that explore thecontrast between SWIR and NIR bands showed the highest associations LWCINDII the integral of bands 1ndash2ndash3ndash5ndash7 and the derivatives of bands 2ndash3 and 4ndash5provided the most consistent correlations being signi cant at 095 with C ladaniferand R oYcinalis Wetness worked well with all species but Erica which showed theworst correlations with other indices
When combining data from grasslands and shrublands in the same correlationanalysis the single variable with the highest correlation is the derivative of bands4ndash5 (r2=0592) followed by the integral (r2=0589) and the NDII5 (r2=0579) Inany case the correlation is reduced with respect to the correlation of single speciessince FMC variation is species dependent
As for the oaks (Q faginea) the most explicative variable of FMC was the NDII5
Estimation of fuel moisture content 2155
Table 2 Pearson r correlation coeYcients of FMC and Landsat TM derived indices (Namesof independent variables are referred to in the text The number of samples is givenin table 1)
Grassland Shrubland C ladanifer Erica R oYcinalis Q faginea
B1 shy 0624 shy 0197 shy 0164 shy 0038 shy 0427 0100B2
shy 0639 shy 0142 shy 0165 shy 0115 shy 0181 0421B3 shy 0781 shy 0562 shy 0545 shy 0286 shy 0750 shy 0020B4 0453 shy 0171 shy 0294 0187 shy 0220 0256B5 shy 0881 shy 0808 shy 0812 shy 0451 shy 0806 shy 0764B7
shy 0876 shy 0679 shy 0674 shy 0215 shy 0849 shy 0634NDVI 0869 0486 0431 0334 0676 0091NDII (band 5) 0855 0753 0689 0584 0805 0808NDII (band 7) 0820 0637 0595 0274 0828 0706LWCI 0847 0738 0663 0611 0778 0689Wetness 0905 0666 0635 0198 0794 0661Integral shy 0906 shy 0782 shy 0780 shy 0334 shy 0892 shy 0666Der1ndash2 shy 0131 0155 0056 shy 0102 0590 0792Der2ndash3 shy 0771 shy 0725 shy 0673 shy 0323 shy 0913 shy 0803Der3ndash4 0717 0170 0048 0335 0269 0299Der4ndash5 shy 0882 shy 0764 shy 0695 shy 0593 shy 0830 shy 0773Der5ndash7 0208 0078 0088 0267 shy 0182 0083RGRE 0877 0518 0455 0364 0676 0091
Bold types refer to signi cant correlations at 099 Underlined are correlations signi cantat 095
but again Der2ndash3 was closely associated to FMC as well as Der1ndash2 Der4ndash5 andNDII7 NDVI performed poorly for estimating FMC The reason to explain thiscould be the poor leave coverage during early spring and late summer Howeverthe small sample size avoided establishing solid conclusions from this dataset
53 T esting multiple regression trendsOnce signi cant correlations were found it was possible to undertake the estima-
tion phase in which FMC might be derived from Landsat TM variables Multiplelinear regression analyses were carried out using stepwise forward selection withthresholds of 008 to accept and 01 to reject a variable (SPSS 1999) Three analyseswere undertaken grasslands shrublands and the combination of the two
For grasslands the variables selected with the threshold criteria were the integralof bands 1ndash2ndash3ndash5ndash7 and the NDVI The former provided the highest explanation(r2=081) and the latter a small increment in the predictive value ( nal adjustedr2 =084) The nal equation was
FMCg=184227shy 179126 Integral+21859 NDVI (11)
Observed versus predicted values showed a solid trend throughout the range ofFMC values ( gure 3) although negative values were estimated in two cases (notshown on the graph) The errors ranged from 7276 to 093 of FMC with anaverage of 2709 In proportional terms the maximum error was found in a singleplot for September 1998 in which the estimation was 28 versus the actual 5FMC The minimum error was in July 1997 in which the estimation was 5889versus the actual 5709 FMC
For shrublands the selected variables for multiple regression analysis were
E Chuvieco et al2156
Figure 3 Observed versus predicted FMC values for grasslands
re ectance of band 5 and the derivative of bands 2 and 3 (Der2ndash3) Adjusted r2coeYcients of 06246 and 07396 were obtained after including the rst and thesecond variable respectively The equation generated was
FMCs=1855549shy 464932 R5shy 1453814 (Der2ndash3) (12)
where R5 is band 5 re ectance Observed versus predicted values are included in gure 4 which shows a lower dispersion than grassland in high values of FMC butless con dence in the lower values In any case the errors were less important inboth absolute and relative terms because the variation of FMC was much lower inshrublands than in grasslands Maximum and minimum absolute errors were 2230and 063 FMC respectively in proportion to the actual value of FMC the errorswere in the range from 33 to 1
When considering single shrub species the variables selected in stepwise forward
Figure 4 Observed versus predicted FMC values for shrublands
Estimation of fuel moisture content 2157
multiple regression changed from those selected for the average shrub value In thecase of C ladanifer only the re ectance of band 5 was selected for Erica the LWCI
and wetness were elected and for R oYcinalis Der2ndash3 only Adjusted determination
coeYcients (r2 ) were lower than for the equation of average shrubs 063 forC ladanifer 059 for Erica and 079 for R oYcinalis When the two variables
previously included in the estimation of the average values of shrub (R5 and Der2ndash3)
were introduced in the equations for single species the results were still acceptableThe explanation was better for R oYcinalis (adjusted r2=088 versus 079 with just
Der2ndash3) but this increase might be related to the few degrees of freedom of the
tting since only seven observations were available Erica decreased notably the
adjusted r2 from the previous tting with LWCI and Wetness (the r2 declined to007) and C ladanifer maintained a similar explanation capacity (r2=069) Since
the areas observed by the satellite sensor are usually a mixture of diVerent shrub
species we decided to use the coeYcients of the average FMC for further application
54 Mapping the estimated FMC
In order to apply these equations operationally some criteria to distinguishbetween herbaceous and shrub vegetation needed to be applied The use of auxiliary
sources such as land cover or vegetation maps can solve this limitation but also
criteria based on the image itself may be applied For instance discrimination between
grasslands and shrublands may be based on a previous classi cation of the image
or just on a single threshold related to the multitemporal variability of vegetation
indices Since grasslands would show a clearer seasonal contrast than shrublands
the standard deviation of NDVI or NDII values for each pixel may be used todiscriminate between the two covers In our case standard deviations of NDVI
values for the three grasslands plots were 015013 01776 and 01386 while for the
two plots of shrublands the values were almost one-third lower (00674 and 00771)
The contrast was even greater for NDII5 (0223 0244 and 0200 for grasslands and
0077 and 0074 for shrublands)
As an example of FMC maps derived from Landsat TM images gure 5 shows
the map of estimated FMC for the 24 July 1998 image The study area was dividedinto two covers grassland and shrublands by multitemporal thresholding of NDVI
and NDII indices Empirical equations previously generated (11 and 12) were applied
to obtain a synthetic image of the spatial variations of FMC Lower values of FMC
were found in the Central Valley of the study area dominated by grasslands (FMC
values lower than 30) Shrub species showed higher values of FMC in the range
of 80ndash110 but the highest values were observed for areas covered by Q faginea
oaks which reached up to 120An alternative way of generating FMC estimations was to apply a single equation
for both grasslands and shrublands The estimation in this case was based on a
common regression analysis of both sets of land plots The most explicative variable
in this case was the rst derivative of bands 4 and 5 An adjusted r2 of 06326 was
obtained which was clearly lower than the one computed from grasslands and
shrublands separately The errors of estimation were also higher with a maximum
of 128 and a minimum of 506 for grasslands and 586 and 820 for
shrublands respectively Therefore this single equation should only be used whenlittle chances of discriminating herbaceous and shrub species are available
E Chuvieco et al2158
(a)
(b)
Figure 5 (a) False colour composite of the Landsat TM image of 24 July 1998 (b) EstimatedFMC from the same image
6 DiscussionThis paper oVers empirical relations of FMC and variables derived from Landsat
TM re ectances for several Mediterranean fuels It shows the utility of includingbands located in the SWIR region to improve the estimations of FMC provided byvisible and NIR bands Since Landsat TM data are not very appropriated foroperational re danger estimation this experience emphasizes the need of including
Estimation of fuel moisture content 2159
SWIR bands in other sensors with better temporal resolution such as NOAAAVHRR The new series of the AVHRR sensor on board NOAA-15 and -16 hadincluded such band during diurnal acquisitions However there are still few imagesavailable for evaluating its performance (AVHRR transmission in NOAA-15 wasinterrupted in September 2000)
The best correlations for FMC of grasslands were found with the original SWIRbands and with those indices that take into account the spectral contrast of theNIRndashR spectral regions (such as the NDVI) and the NIRndashSWIR spectral regions(the NDII LWCI and Der4ndash5) but also the VISndashSWIR regions (such as the integral)However the relations should not be interpreted in the same way for these threespectral domains While the good correlations between FMC and the SWIR bandscan be based on the presence of high-absorption peaks in this spectral region therelation of FMC and NDVI should be related to changes in chlorophyll contentand leaf structure that accompanies the curing of herbaceous plants In other wordsthe high signi cance of the NIRndashR space to monitor changes in FMC of herbaceousplants should be related to the eVects of FMC variation on grass physiologicalstatus rather than on their water content per se It was noteworthy to observe thelack of signi cant correlation between FMC and the NIR band (band 4) of grass-lands The low sensitivity of band 4 con rmed the contradictory eVects of waterreduction on NIR re ectance that were previously noted (increase due to lowabsorption decrease because of damaged leaf structure and leaf curing)
Since the reduction of FMC in shrubs does not imply a serious deterioration ofleaf structure NIR re ectance increased with FMC in most shrub species as a resultof lower water absorption The indirect eVects of water reduction on the speciesrsquophysiology were not as noteworthy in shrubs as in herbaceous species Additionallyin the case of species that reduce their leaf area index as a result of dryness(C ladanifer) the increase of NIR re ectance may also be related to soil backgroundin uences
In the case of SWIR bands both shrublands and grasslands re ectances wereclearly in uenced by water absorption which explains the consistency of the relationsacross species The lower values found in Erica should be related to the greathomogeneity of this species between the spring and summer
Considering the diVerent derived indices reviewed throughout this paper wetnessshows a promising potential for estimating FMC in both grassland and some shrubspecies This is quite remarkable since the tasselled cap transformation was originallydeveloped for agricultural areas and computed from raw digital values (thereforeno atmospheric correction calibration or observation angles were considered ) Theweak physical interpretation of this component (empirically based on images froma very diVerent environment to our study area) makes it preferable to use the integralof bands 1ndash2ndash3ndash5ndash7 which is based on corrected re ectances and also considersseveral water absorption bands With respect to LWCI NDII and the derivative of4ndash5 the last two are preferable because they provide similar or better correlationsthan LWCI and do not require a previous estimation of re ectances for areas atfull turgor
The greater sensitivity of SWIRndashNIR contrast to FMC variations was somehowchallenged by the good correlations found with the derivative of bands 2 and 3(greenndashred) which were consistent for all shrub species with the exception of EricaThe sensitivity of this contrast to water content was previously noticed by Jacksonand Ezra (1985) and partially by Carter (1994)
E Chuvieco et al2160
Empirical equations for estimating FMC have showed errors averaging from 8to 23 (lower for shrublands higher for grasslands and oaks since these speciesare more variable throughout the year) These errors are acceptable for re dangerapplications although further improvements could be expected by consideringthermal bands and meteorological information
AcknowledgmentsThis research has been funded by the Control-Fire-Sat (ENV4-CT97-0479) and
In ame projects (ENV4-CT98-0700) under the Environment and Climate Programof the European Commission (DG-XII ) The authorities of the Cabaneros NationalPark have allowed the eldwork to be carried out and have kindly providedauxiliary data
Financial support was also obtained from the Spanish Ministry of Science throughproject number AGF96-2094-CE Linguistic assistance from Patrick Vaughan is alsoacknowledged
References
Alonso M Camarasa A Chuvieco E Cocero D Kyun I Martirsquon M P andSalas F J 1996 Estimating temporal dynamics of fuel moisture content ofMediterranean species from NOAA-AVHRR data EARSEL Advances in RemoteSensing 4-4 9ndash24
Blackmarr W H and Flanner W B 1968 Seasonal and diurnal variation in moisturecontent of six species of Pocosin shrubs SE-33 Southeastern Forest ExperimentStation US Forest Service Asheville
Bowman W D 1989 The relationship between leaf water status gas exchange and spectralre ectance in cotton leaves Remote Sensing of Environment 30 249ndash255
Burgan R E and Hartford R A 1993 Monitoring vegetation greenness with satellitedata GTR INT-297 USDA Forest Service Ogden Utah
Burgan R E Klaver R W and Klaver J M 1998 Fuel models and re potentialfrom satellite and surface observations International Journal of W ildland Fire 8159ndash170
Byram G M 1959 Combustion of forest fuels In Forest Fire Control and Use edited byK P Davis (New York McGraw-Hill) pp 155ndash182
Carter G A 1991 Primary and secondary eVects of water content on the spectral re ectanceof leaves American Journal of Botany 78 916ndash924
Carter G A 1994 Ratios of leaf re ectances in narrow wavebands as indicators of plantstress International Journal of Remote Sensing 15 697ndash703
Chavez P S 1996 Image-based atmospheric corrections Revisited and improvedPhotogrammetric Engineering and Remote Sensing 62 1025ndash1036
Chladil M A and Nunez M 1995 Assessing grasslandmoisture and biomass in TasmaniaThe application of remote sensing and empirical models for a cloudy environmentInternational Journal of W ildland Fire 5 165ndash171
Chuvieco E Deshayes M Stach N Cocero D and Rian~o D 1999 Short-term rerisk foliage moisture content estimation from satellite data In Remote Sensing ofL arge W ild res in the European Mediterranean Basin edited by E Chuvieco (BerlinSpringer-Verlag) pp 17ndash38
Cohen W B 1991 Temporal versus spatial variation in leaf re ectance under changingwater stress conditions International Journal of Remote Sensing 12 1865ndash1876
Crist E P and Cicone R C 1984 A physically-based transformation of Thematic Mapperdata the TM tasseled cap IEEE T ransactions on Geoscience and Remote SensingGE22 256ndash263
Danson F M Steven M D Malthus T J and Clark J A 1992 High-spectralresolution data for determining leaf water content International Journal of RemoteSensing 13 461ndash470
Desbois N Deshayes M and Beudoin A 1997 Protocol for fuel moisture content
Estimation of fuel moisture content 2161
measurements In A Review of Remote Sensing Methods for the Study of L arge W ildlandFires edited by E Chuvieco (Alcala de Henares Departamento de GeografIgrave aUniversidad de Alcala) pp 61ndash72
Deshayes M Chuvieco E Cocero D Karteris M Koutsias N and Stach N 1998Evaluation of diVerent NOAA-AVHRR derived indices for fuel moisture contentestimation interest for short-term re risk assessment In III International Conferenceon Forest Fire Researchndash14th Conference on Fire and Forest Meteorology edited byD X Viegas (Coimbra Portugal ADAI) pp 1149ndash1167
Gao B C 1996 NDWI A normalized diVerence water index for remote sensing of vegetationliquid water from space Remote Sensing of Environment 58 257ndash266
Hardy C C and Burgan R E 1999 Evaluation of NDVI for monitoring live moisturein three vegetation types of the Western US Photogrammetric Engineering and RemoteSensing 65 603ndash610
Hunt E R and Rock B N 1989 Detection of changes in leaf water content using nearand middle-infrared re ectances Remote Sensing of Environment 30 43ndash54
Hunt E R Rock B N and Nobel P S 1987 Measurement of leaf relative water contentby infrared re ectance Remote Sensing of Environment 22 429ndash435
Illera P Fernarsquondez A and Delgado J A 1996 Temporal evolution of the NDVI asan indicator of forest re danger International Journal of Remote Sensing 171093ndash1105
Jackson R D and Ezra C E 1985 Spectral response of cotton to suddenly inducedwater stress International Journal Remote Sensing 6 177ndash185
Kauth R J and Thomas G S 1976 The Tasseled Cap A graphic description of thespectralndashtemporal development of agricultural crops as seen by Landsat In Symposiumon Machine Processing of Remotely Sensed Data Purdue University West L afayettepp 41ndash51
Kogan F N 1990 Remote sensing of weather impacts on vegetation in non-homogeneousareas International Journal of Remote Sensing 11 1405ndash1419
Levitt J 1980 Responses of Plants to Environmental Stresses Vol II Water Radiation Saltand other Stresses (New York Academic Press)
Lorsquopez S Gonzarsquolez F Llop R and Cuevas J M 1991 An evaluation of the utility ofNOAA AVHRR images for monitoring forest re risk in Spain International Journalof Remote Sensing 12 1841ndash1851
Moran M S Clarke T R Inoue Y and Vidal A 1994 Estimating crop water de citusing the relation between surface-air temperature and spectral vegetation indexRemote Sensing of Environment 49 246ndash263
Olson C M 1980 An evaluation of the KeetchndashByram drought index as a predictor offoliar moisture content in a chaparral community In Sixth Conference on Fire andForest Meteorology American Meteorological Society Seattle pp 241ndash244
Paltridge G W and Barber J 1988 Monitoring grassland dryness and re potential inAustralia with NOAAAVHRR data Remote Sensing of Environment 25 381ndash394
Pen~uelas J I F Biel C Serrano L and Saversquo R 1993 The re ectance at the 950ndash970 nm region as an indicator of plant water status International Journal of RemoteSensing 14 1887ndash1905
Pen~uelas J Pin~ol J Ogaya R and Filella I 1997 Estimation of plant water concentra-tion by the re ectance Water Index WI (R900R970) International Journal of RemoteSensing 18 2869ndash2875
Pierce L L Running S W and Riggs G A 1990 Remote detection of canopy waterstress in coniferous forest using the NSOO1 Thematic Mapper simulator and thethermal infrared multispectral scanner Photogrammetric Engineering and RemoteSensing 56 579ndash586
Pinder J E and McLeod K W 1999 Indications or relative drought stress in longleafpine from Thematic Mapper data Photogrammetric Engineering and Remote Sensing65 495ndash501
Pons X and Solersquo-Sugran~ es L 1994 A simple radiometric correction model to improveautomatic mapping of vegetation from multispectral satellite data Remote Sensing ofEnvironment 48 191ndash204
Prosper-Laget V Douguersquodroit A and Guinot J P 1994 Mapping the risk of forest
Estimation of fuel moisture content2162
re departure using NOAA satellite information In InternationalWorkshop on SatelliteT echnology and GIS for Mediterranean Forest Mapping and Fire Management edited(Thessaloniki) pp 151ndash163
Prosper-Laget V Douguersquodroit A and Guinot J P 1995 Mapping the risk of forest re occurrence using NOAA satellite informationEARSeL Advances in Remote Sensing4-3 30ndash38
Ripple W J 1986 Spectral re ectance relationships to leaf water stress PhotogrammetricEngineering and Remote Sensing 52 1669ndash1675
Rothermel R C Wilson R A Morris G A and Sackett S S 1986 Modellingmoisture content of ne dead wildland fuels input to BEHAVE re prediction systemResearch Paper INT-359 USDA Forest Service Intermountain Research StationOdgen Utah
Simard A J 1968 The moisture content of forest fuelsmdasha review of the basic conceptsFF-X-14 Forest Fire Research Institute Ottawa Ontario
SPSS 1999 SPSS for Windows v 10 SPSS Inc ChicagoThomas J R Namken L N Oerther G F and Brown R G 1971 Estimating leaf
water content by re ectance measurements Agronomy Journal 63 845ndash847Tucker C J 1980 Remote sensing of leaf water content in the near infrared Remote Sensing
of Environment 10 23ndash32Ustin S L Roberts D S Pinzorsquon J Jacquemoud S Gardner M Scheer B
Castan~eda C M and Palacios-Orueta A 1998 Estimating canopy water contentof chaparral shrubs using optical methods Remote Sensing of Environment 65 280ndash291
Van Wagner C E 1967 Seasonal variation in moisture content of Eastern Canadian treefoliage and the possible eVect on crown res Departmental Publication no 1204Forestry Branch Canada
Vidal A and Devaux-Ros C 1995 Evaluating forest re hazard with a Landsat TMderived water stress index Agricultural and Forest Meteorology 77 207ndash224
Vidal A Pinglo F Durand H Devaux-Ros C and Maillet A 1994 Evaluation ofa temporal re risk index in Mediterranean forest from NOAA thermal IR RemoteSensing of Environment 49 296ndash303
Viegas D X Pin~ol J Viegas M T and Ogaya R 1998 Moisture content of livingforest fuels and their relationship with meteorological indices in the Iberian PeninsulaIII International Conference on Forest Fire Researchndash14th Conference on Fire andForest Meteorology edited by D X Viegas (Coimbra Portugal ADAI) pp 1029ndash1046
Viegas D X Viegas T P and Ferreira A D 1992 Moisture content of ne forest fuelsand re occurrence in central Portugal InternationalJournal of W ildland Fire 2 69ndash85
Viney N R 1991 A review of ne fuel moisture modelling International Journal of W ildlandFire 1 215ndash234
Weber J A and Ustin S L 1991 Diurnal water relations of walnut trees implicationsfor remote sensing IEEE T ransactions on Geoscience and Remote Sensing 29 864ndash874
Westman W E and Price C V 1988 Spectral changes in conifers subjected to air pollutionand water stress experimental studies IEEE T ransactions on Geoscience and RemoteSensing 26 11ndash20
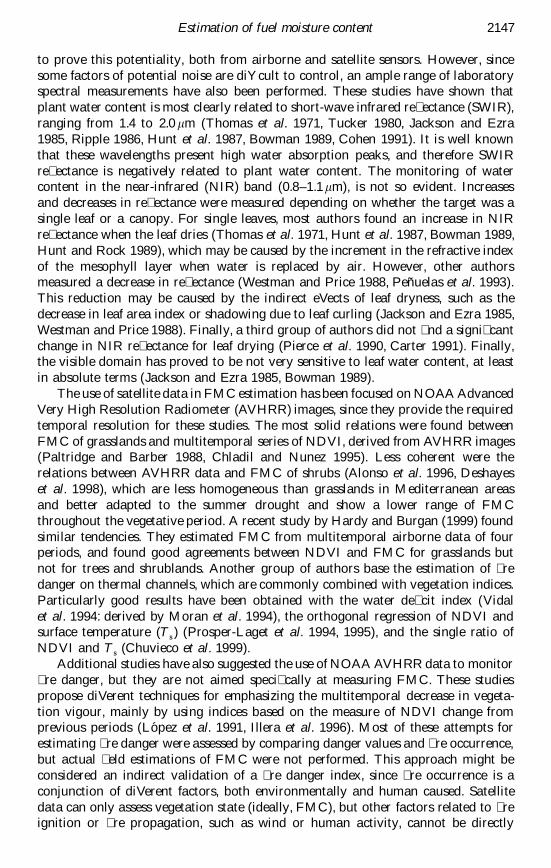
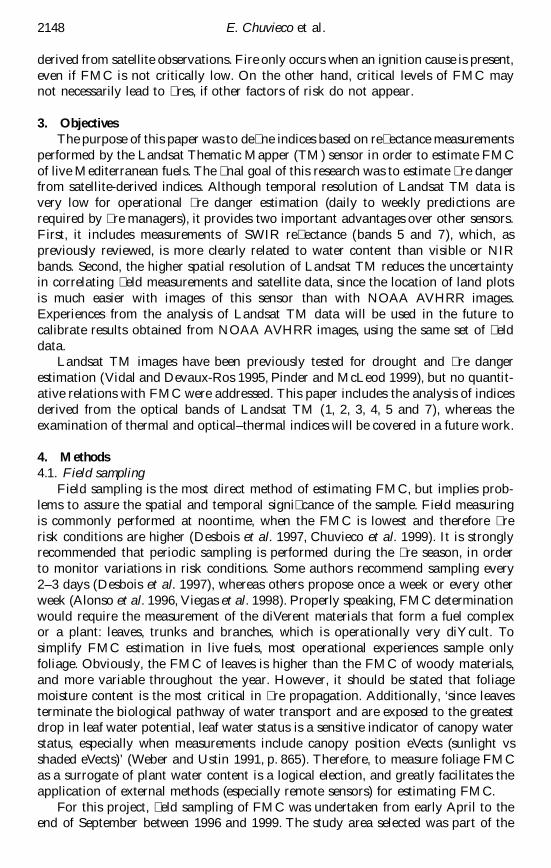
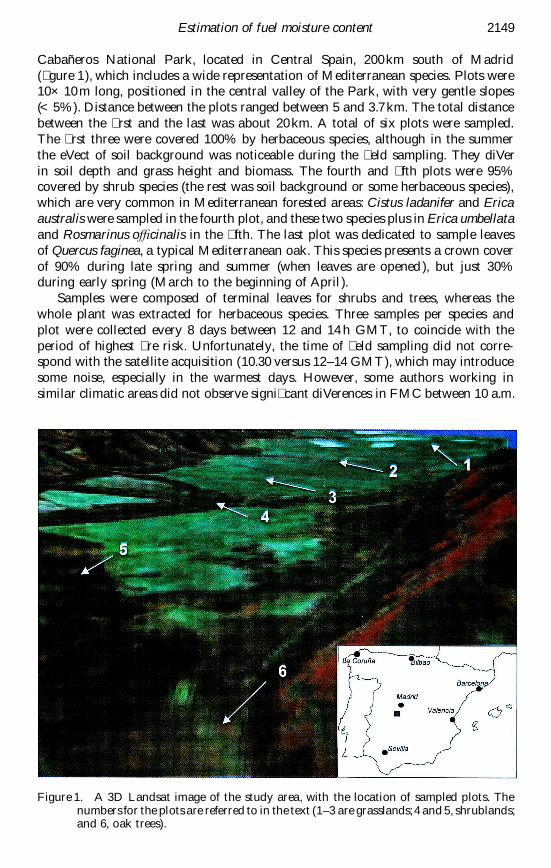
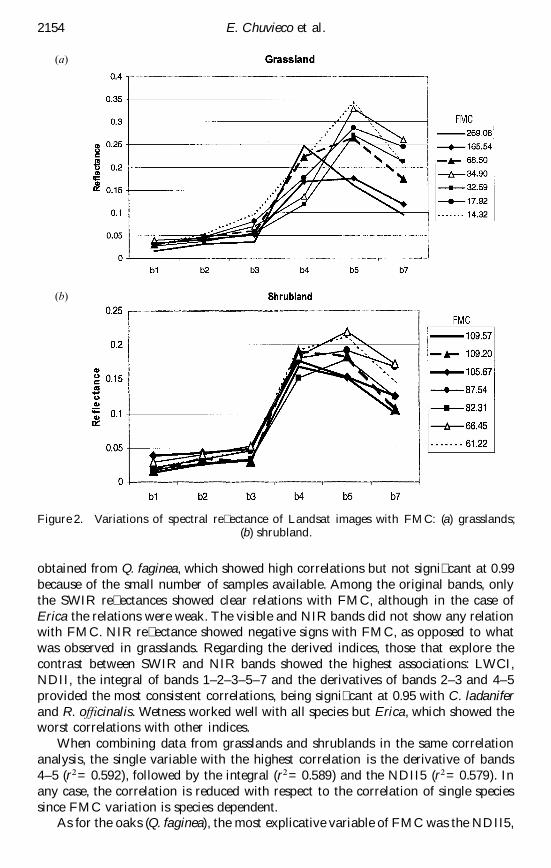
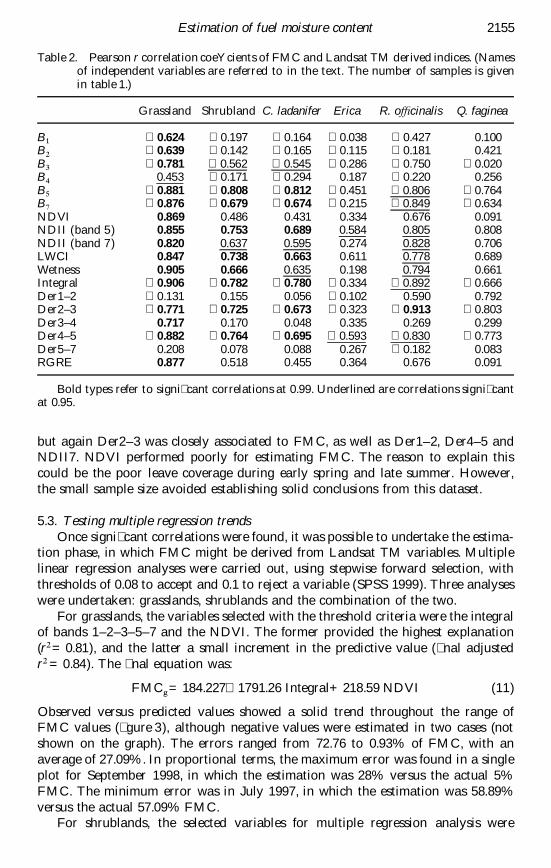
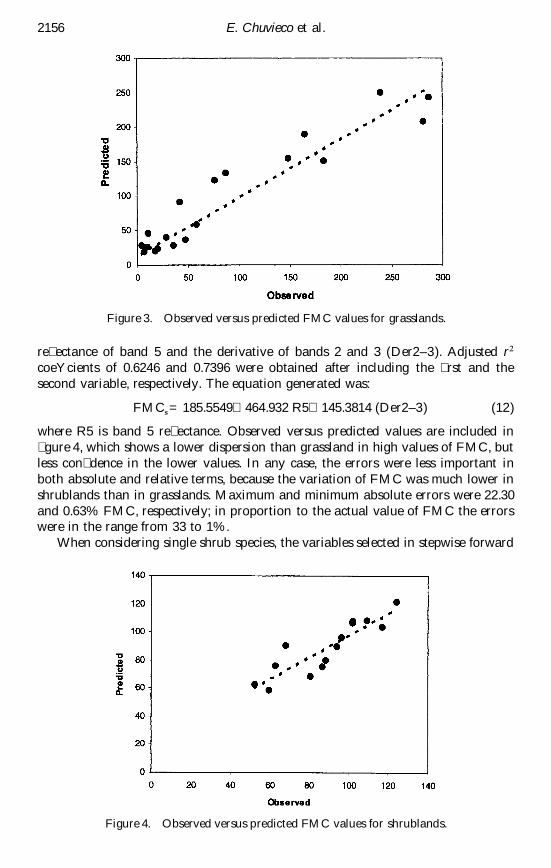
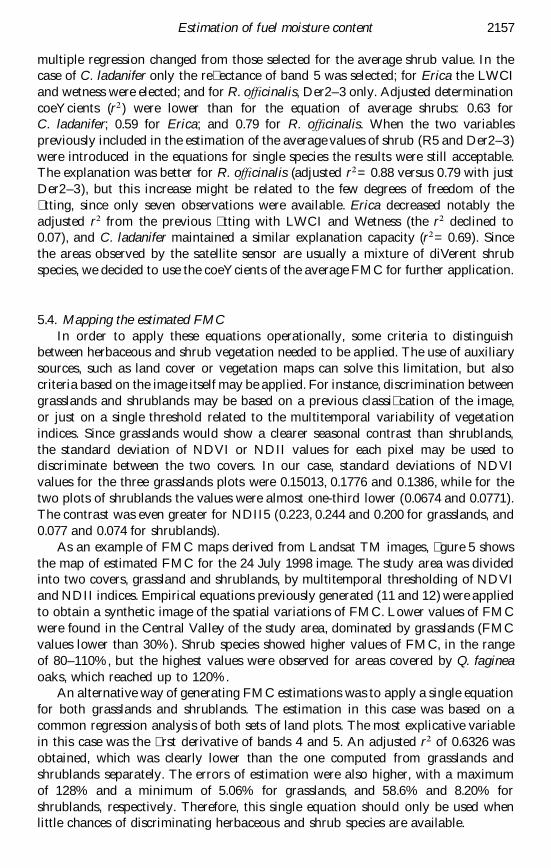
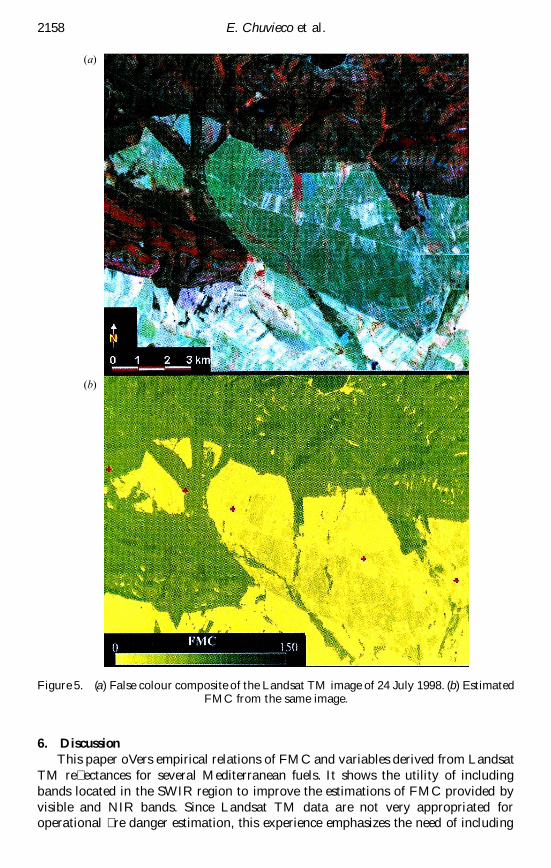
Related Documents