Boundary-Layer Meteorol (2010) 137:333–342 DOI 10.1007/s10546-010-9524-x RESEARCH NOTE Estimation of Biomass Heat Storage Using Thermal Infrared Imagery: Application to a Walnut Orchard Anirban Garai · Jan Kleissl · Stefan G. Llewellyn Smith Received: 29 December 2009 / Accepted: 24 June 2010 / Published online: 15 July 2010 © The Author(s) 2010. This article is published with open access at Springerlink.com Abstract A new method to estimate tree biomass heat storage from thermal infrared (TIR) imaging of biomass surface temperature is presented. TIR images of the canopy are classified into trunk, branches, and leaves. The one-dimensional heat equation in cylindrical coordinates is forced with trunk and branch surface temperatures to simulate the temperature distribu- tion and heat storage in tree trunks and branches. Assuming uniform leaf temperatures, heat storage in leaves is computed from the surface temperature of the leaves separately for the sunlit upper and shaded lower canopy. The sum of trunk, branches, leaf, and air heat storage gives the canopy heat storage. Measurements in a walnut orchard near Davis, California, in early June 2007 showed that biomass heat storage was of the same order as air heat storage and about 1% of daytime and 9% of nighttime net radiation. Keywords Canopy heat storage · Surface energy balance · Thermal infrared imaging 1 Introduction For a horizontally homogeneous vegetation canopy the surface energy balance reads R net = H + LE + S + G (1) where R net is the net radiation, H is the sensible heat flux, LE is the latent heat flux, G is soil heat flux at the soil surface (Moore and Fisch 1986), and S is heat storage within the bound- aries of the control volume for which the surface energy balance holds, including all biomass and atmospheric constituents between the soil surface and the height of the convective flux measurements. Some investigators (Lindorth and Iritz 1993; Oliphant et al. 2004) choose to include soil heat storage from the surface to the depth of the soil heat-flux measurements (typically 0.05–0.10 m below the soil surface) in the heat storage term, S. However, the large A. Garai · J. Kleissl (B ) · S. G. Llewellyn Smith Department of Mechanical and Aerospace Engineering, University of California, San Diego, CA, USA e-mail: [email protected] 123

Welcome message from author
This document is posted to help you gain knowledge. Please leave a comment to let me know what you think about it! Share it to your friends and learn new things together.
Transcript
Boundary-Layer Meteorol (2010) 137:333–342DOI 10.1007/s10546-010-9524-x
RESEARCH NOTE
Estimation of Biomass Heat Storage Using ThermalInfrared Imagery: Application to a Walnut Orchard
Anirban Garai · Jan Kleissl ·Stefan G. Llewellyn Smith
Received: 29 December 2009 / Accepted: 24 June 2010 / Published online: 15 July 2010© The Author(s) 2010. This article is published with open access at Springerlink.com
Abstract A new method to estimate tree biomass heat storage from thermal infrared (TIR)imaging of biomass surface temperature is presented. TIR images of the canopy are classifiedinto trunk, branches, and leaves. The one-dimensional heat equation in cylindrical coordinatesis forced with trunk and branch surface temperatures to simulate the temperature distribu-tion and heat storage in tree trunks and branches. Assuming uniform leaf temperatures, heatstorage in leaves is computed from the surface temperature of the leaves separately for thesunlit upper and shaded lower canopy. The sum of trunk, branches, leaf, and air heat storagegives the canopy heat storage. Measurements in a walnut orchard near Davis, California, inearly June 2007 showed that biomass heat storage was of the same order as air heat storageand about 1% of daytime and 9% of nighttime net radiation.
Keywords Canopy heat storage · Surface energy balance · Thermal infrared imaging
1 Introduction
For a horizontally homogeneous vegetation canopy the surface energy balance reads
Rnet = H + L E + S + G (1)
where Rnet is the net radiation, H is the sensible heat flux, LE is the latent heat flux, G is soilheat flux at the soil surface (Moore and Fisch 1986), and S is heat storage within the bound-aries of the control volume for which the surface energy balance holds, including all biomassand atmospheric constituents between the soil surface and the height of the convective fluxmeasurements. Some investigators (Lindorth and Iritz 1993; Oliphant et al. 2004) choose toinclude soil heat storage from the surface to the depth of the soil heat-flux measurements(typically 0.05–0.10 m below the soil surface) in the heat storage term, S. However, the large
A. Garai · J. Kleissl (B) · S. G. Llewellyn SmithDepartment of Mechanical and Aerospace Engineering, University of California, San Diego,CA, USAe-mail: [email protected]
123
334 A. Garai et al.
thermal mass density of soil then causes a strong dependence of S on the depth of the soilheat-flux plates, making it difficult to compare results between different investigators. Thuswe define the control volume’s lower boundary to be the soil surface, and exclude soil heatstorage from S.
Crude approaches to modelling S based on air temperature (e.g. Thom 1975) may giveadequate results when the canopy biomass is small, but produce significant errors in dense,thick canopies since canopy temperature then lags air temperature by several hours (Mooreand Fisch 1986) and the different masses and temperatures of trunk, branches, and leavesare not considered. Vertical integration of in-situ temperature measurements in the airand the biomass, and humidity measurements in air taken throughout the control volume,allows the direct estimation of S. However, a large number of sensors need to bedeployed destructively in remote areas and the holes drilled for the in situ tempera-ture sensors may affect the measurement through local changes in heat conductivity.Using these intrusive techniques, several investigators determined S for different vegeta-tion and climate conditions. In a young eucalyptus forest (tree height h = 10 m, bio-mass density 17.43 kg m−2) in Australia, Aston (1985) measured the temperature ofthe trunk of one tree with a diameter at breast height of 0.14 m at a depth of 0.01–0.07 m from the surface using thermocouples. This study also included temperature mea-surements of branches, twigs, leaves, boles, litter, and air at different heights. Aston(1985) found heat storage of up to 50 W m−2 in the morning and up to −40 W m−2
in the evening on a sunny day with maximum net radiation of 700 W m−2. Oliphantet al. (2004) measured trunk temperature using 33 thermocouples inserted 0.02 m intothe sapwood of boles, branches and tree trunks between 1.3 and 30.5 m above groundlevel (a.g.l.) in a temperate deciduous forest (h = 30−40 m, 19 kg m−2) for three years.S (defined to include G) reached its maximum around noon, varying from 60 W m−2 inApril to 20 W m−2 in December. Lindorth and Iritz (1993) studied the seasonal effectof bi-hourly S in a short-rotation willow forest in Sweden (h = 4.8 m, 2,000 plantsper ha), and found that the maximum S (defined to include G) during the day rangedfrom 70 W m−2 in May to 15 W m−2 in August. Moore and Fisch (1986) measuredstem and air temperatures of an Amazonian tropical forest (h = 35 m, 41 kg m−2),and solved the heat conduction equation for the trunk by forcing it with air tem-perature and a convective heat transfer model. They estimated that S can accountfor up to 80 W m−2, with similar contributions from air temperature, humidity, andbiomass heat storage. Over daily intervals, the average heat storage was generallyless than ±8 W m−2 or 0.7 MJ m−2 day−1, which accounted for 3–5% of daily netradiation.
Methodologically, modelling has focused on solving the heat equation for the bio-mass with air temperature as a boundary condition (Meesters and Vugts 1996; Joneset al. 2004; Haverd et al. 2007). However, general parameterizations of convection forcomplex shapes such as trees and complex wind fields such as those in a forest areinaccurate, which introduces uncertainty into previous heat storage modelling results.Non-contact measurements of surface temperature through thermal imaging providean attractive alternative to forcing the trunk heat equation without the need to para-meterize convection. The objective of our study is to estimate biomass heat storagein the canopy by measuring surface temperature changes over the diurnal cycleusing infrared thermometry and simulating the trunk temperature distribution using the heatequation.
123
Estimation of Biomass Heat Storage Using TIR Imagery 335
2 Methods
2.1 The CHATS Experiment
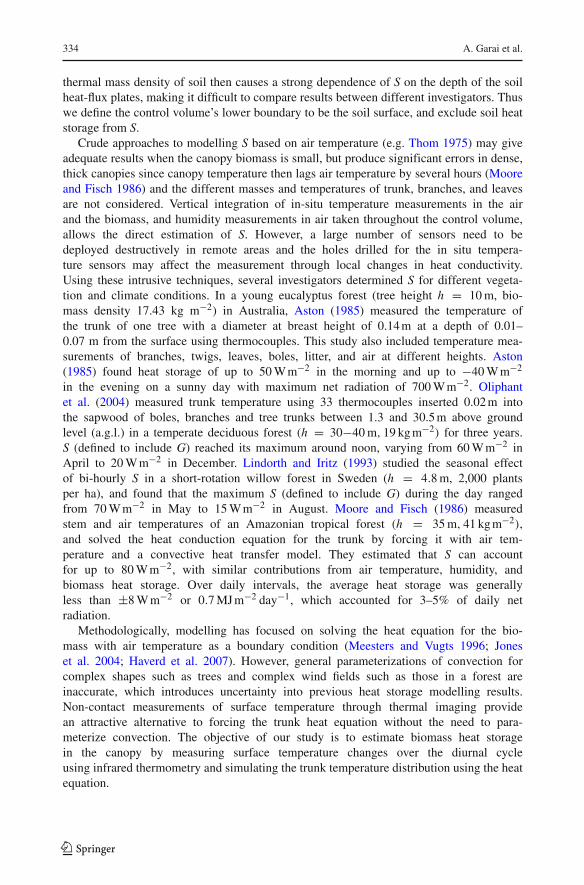
The observations were made in a walnut orchard near Dixon, California (about 38.487◦N,121.845◦W, with a canopy height h = 10 m) in 2007, with trees spaced in rows displacedby 7 m. A FLIR ThermaCAM SC3000 TIR camera was placed inside the orchard 239 mfrom the northern boundary and over 500 m from the southern boundary (daytime south-erly winds were most common). The lower canopy was imaged with a thermal infrared(TIR) camera facing south-south-west and mounted at a height of 1.68 m, with an incli-nation of 47◦, from 0948 Pacific Daylight Time (PDT) June 8 to 1612 PDT June 10 at2-min intervals. To obtain the upper leaf temperatures the camera was mounted at a heightof 11 m facing south from 1550 PDT May 28 to 1323 PDT June 4 with an inclinationof 15◦.
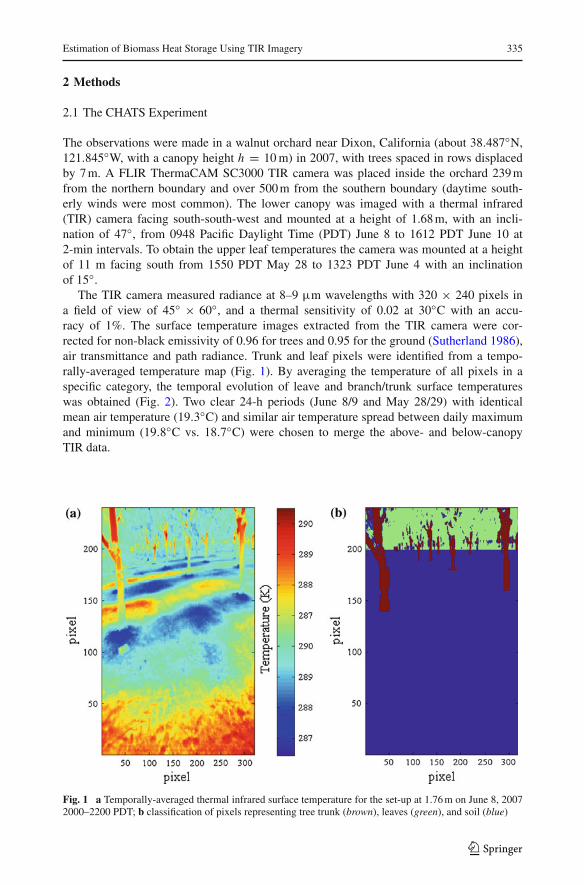
The TIR camera measured radiance at 8–9 µm wavelengths with 320 × 240 pixels ina field of view of 45◦ × 60◦, and a thermal sensitivity of 0.02 at 30◦C with an accu-racy of 1%. The surface temperature images extracted from the TIR camera were cor-rected for non-black emissivity of 0.96 for trees and 0.95 for the ground (Sutherland 1986),air transmittance and path radiance. Trunk and leaf pixels were identified from a tempo-rally-averaged temperature map (Fig. 1). By averaging the temperature of all pixels in aspecific category, the temporal evolution of leave and branch/trunk surface temperatureswas obtained (Fig. 2). Two clear 24-h periods (June 8/9 and May 28/29) with identicalmean air temperature (19.3◦C) and similar air temperature spread between daily maximumand minimum (19.8◦C vs. 18.7◦C) were chosen to merge the above- and below-canopyTIR data.
Fig. 1 a Temporally-averaged thermal infrared surface temperature for the set-up at 1.76 m on June 8, 20072000–2200 PDT; b classification of pixels representing tree trunk (brown), leaves (green), and soil (blue)
123
336 A. Garai et al.
Fig. 2 Trunk, leaf (lower canopy) and air temperature from 1600 PDT June 8 to 1600 PDT June 9 and leaftemperature (upper canopy) from 1600 PDT May 28 to 1600 PDT May 29
Air temperature and relative humidity profiles, as well as H, G, and LE values, wereobtained from the Canopy Horizontal Array Turbulence Study (CHATS, Patton et al. 2008),a set-up with aspirated temperature and humidity probes, and eddy-covariance flux (EC)measurements at 10 heights on a 30-m tower located in the orchard 116 m north of the TIRcamera. In this study we use LE and H from the EC sensors at z = 15 m, and Tair and specifichumidity w from the aspirated thermocouples and humidity sensors at 1.5, 3, 4.5, 6, 7.5and 9 m. G was estimated from a REBS HFT-3 soil heat-flux plate at 0.05-m depth whereheat storage in the soil between the soil heat flux plate and the ground surface was obtainedthrough a Hukseflux TP01 thermal property probe and soil temperature measurements at0.05 m depth.
2.2 Biomass Quantity and Thermal Properties
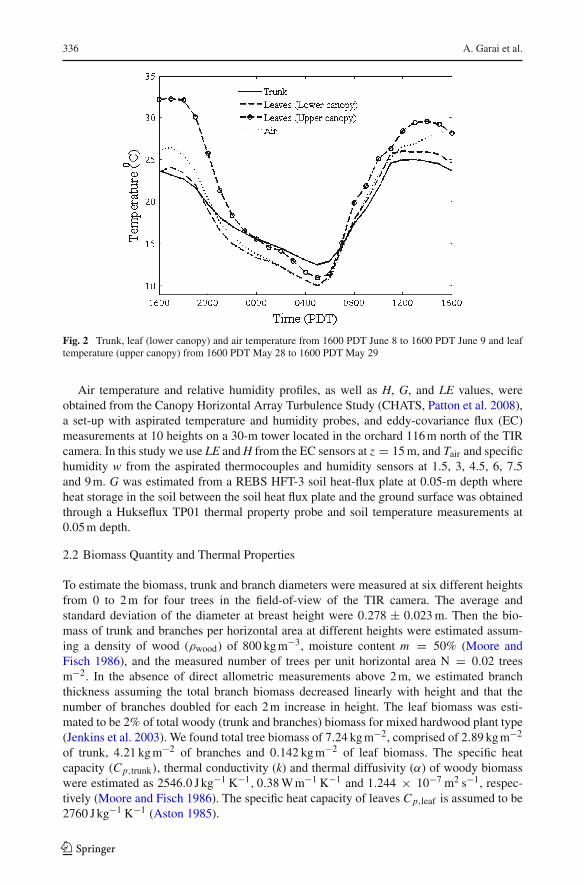
To estimate the biomass, trunk and branch diameters were measured at six different heightsfrom 0 to 2 m for four trees in the field-of-view of the TIR camera. The average andstandard deviation of the diameter at breast height were 0.278 ± 0.023 m. Then the bio-mass of trunk and branches per horizontal area at different heights were estimated assum-ing a density of wood (ρwood) of 800 kg m−3, moisture content m = 50% (Moore andFisch 1986), and the measured number of trees per unit horizontal area N = 0.02 treesm−2. In the absence of direct allometric measurements above 2 m, we estimated branchthickness assuming the total branch biomass decreased linearly with height and that thenumber of branches doubled for each 2 m increase in height. The leaf biomass was esti-mated to be 2% of total woody (trunk and branches) biomass for mixed hardwood plant type(Jenkins et al. 2003). We found total tree biomass of 7.24 kg m−2, comprised of 2.89 kg m−2
of trunk, 4.21 kg m−2 of branches and 0.142 kg m−2 of leaf biomass. The specific heatcapacity (C p,trunk), thermal conductivity (k) and thermal diffusivity (α) of woody biomasswere estimated as 2546.0 J kg−1 K−1, 0.38 W m−1 K−1 and 1.244 × 10⁻⁷ m2 s−1, respec-tively (Moore and Fisch 1986). The specific heat capacity of leaves C p,leaf is assumed to be2760 J kg−1 K−1 (Aston 1985).
123
Estimation of Biomass Heat Storage Using TIR Imagery 337
2.3 Estimation of Heat Storage
The total heat storage S is computed from the sum of heat storage in the trunk, branches,leaves and air, S = Strunk + Sbranch + Sleaf + Sair, where Sair is the sum of the heat storagein dry air and water vapour as in Oliphant et al. (2004, their Eqs. 5 and 6). The heat storagein leaves is given by
Sleaf = mleafCp,leafdTleaf
dt, (2)
where Tleaf is the average leaf temperature. Assuming a cylindrical tree trunk with height hand radius Rout, the heat storage in the trunk can be estimated using
Strunk = mtrunkC p,trunkdTtrunk
dt∼=
mtrunkC p,trunk
{(∫ 10 2rTtrunkdr
)t=t2
−(∫ 1
0 2rTtrunkdr)
t=t1
}
t2 − t1(3)
where mtrunk(= π R2
outhρwood N)
is the biomass density of the trunk, C p,trunk is the specificheat capacity of the trunk, Ttrunk is the temperature within the trunk, and r is the radialdistance normalized by Rout. The heat storage in branches (Sbranch) is also calculated usingEq. 3.
To obtain the hourly biomass heat storage in the tree trunk and branches for a typicalclear summer day, the trunk and branch transient temperature profile T (r) is modelled as aninfinite cylinder whose surface temperature is periodic with time. If TIR images of the treefrom multiple aspects were available, the full three-dimensional heat equation with T (r, θ, z)could be modelled. However, a static TIR camera location is advantageous for data continu-ity and pixel classification. The dense canopy (leaf area index = 2) provided near-completeshading of the trunk and branches, so other aspects are not expected to be much warmer thanthe measured northerly aspect in daytime. Assuming the average tree pixel temperature ( f (t),Fig. 2) provided a homogeneous surface boundary condition, and non-dimensionalizing theradial coordinate by the tree radius Rout, the governing equation is
α
R2out
{∂2T
∂r2 + 1
r
∂T
∂r
}= ∂T
∂t(4)
The initial conditions are at t = 0, T = constant, the boundary conditions are at r̄ = 0,
T is finite, and at r̄ = 1, T = f (t). Given the persistent meteorological conditions, thetrunk temperature is expected to change periodically with a period of 1 day. Thus to fit aperiodic f (t) to the trunk surface temperature data in Fig. 2 we used a 20th-order Fouriercosine series with coefficients An . Then Eq. 4 was solved using the separation of variablesand superposition theorem (Eckert and Drake 1972; Khedari et al. 1992), yielding the trunktemperature
T (r) = A0 +n=20∑n=1
An Re
⎡⎣e−niπ t
J0
(e−i1.5
n Rout
√ωα
r)
J0
(e−i1.5 n Rout
√ωα
)⎤⎦ , (5)
where ω = π . The solution was coded into MATLAB (The Mathworks, Inc.) and validatedwith a steady oscillation of a periodic cosine shaped boundary condition on the wall of aninfinite cylinder (Khedari et al. 1992, p. 322).
123
338 A. Garai et al.
3 Results and Discussion
3.1 Temperature Distribution in the Tree Trunk
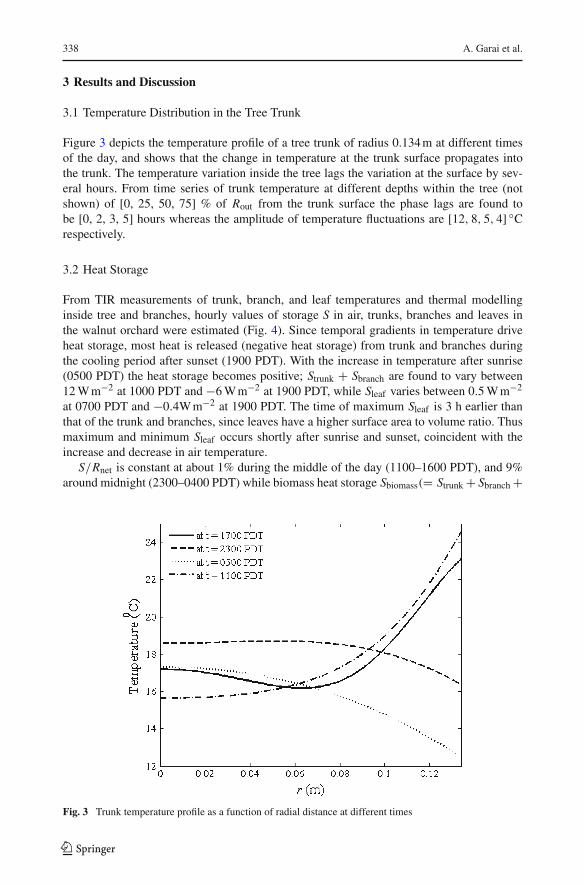
Figure 3 depicts the temperature profile of a tree trunk of radius 0.134 m at different timesof the day, and shows that the change in temperature at the trunk surface propagates intothe trunk. The temperature variation inside the tree lags the variation at the surface by sev-eral hours. From time series of trunk temperature at different depths within the tree (notshown) of [0, 25, 50, 75] % of Rout from the trunk surface the phase lags are found tobe [0, 2, 3, 5] hours whereas the amplitude of temperature fluctuations are [12, 8, 5, 4] ◦Crespectively.
3.2 Heat Storage
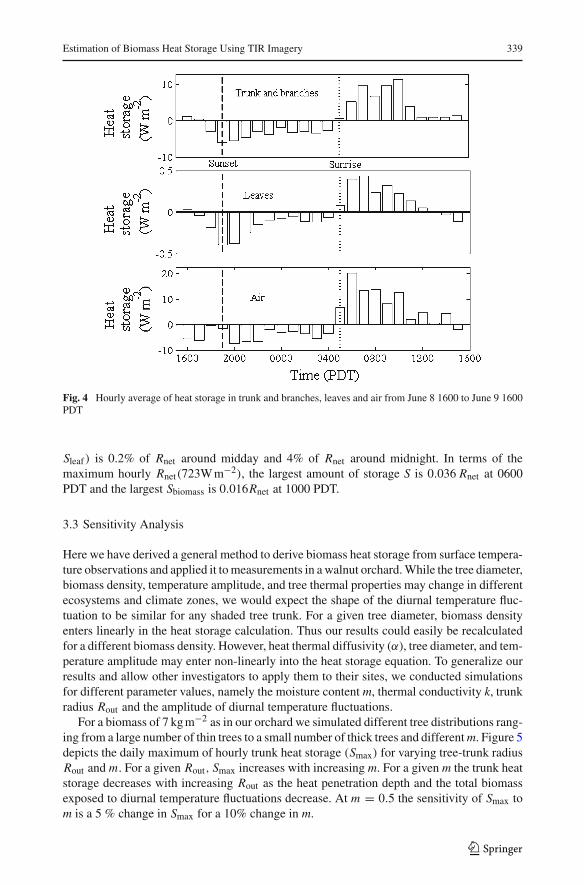
From TIR measurements of trunk, branch, and leaf temperatures and thermal modellinginside tree and branches, hourly values of storage S in air, trunks, branches and leaves inthe walnut orchard were estimated (Fig. 4). Since temporal gradients in temperature driveheat storage, most heat is released (negative heat storage) from trunk and branches duringthe cooling period after sunset (1900 PDT). With the increase in temperature after sunrise(0500 PDT) the heat storage becomes positive; Strunk + Sbranch are found to vary between12 W m−2 at 1000 PDT and −6 W m−2 at 1900 PDT, while Sleaf varies between 0.5 W m−2
at 0700 PDT and −0.4W m−2 at 1900 PDT. The time of maximum Sleaf is 3 h earlier thanthat of the trunk and branches, since leaves have a higher surface area to volume ratio. Thusmaximum and minimum Sleaf occurs shortly after sunrise and sunset, coincident with theincrease and decrease in air temperature.
S/Rnet is constant at about 1% during the middle of the day (1100–1600 PDT), and 9%around midnight (2300–0400 PDT) while biomass heat storage Sbiomass(= Strunk + Sbranch +
Fig. 3 Trunk temperature profile as a function of radial distance at different times
123
Estimation of Biomass Heat Storage Using TIR Imagery 339
Fig. 4 Hourly average of heat storage in trunk and branches, leaves and air from June 8 1600 to June 9 1600PDT
Sleaf ) is 0.2% of Rnet around midday and 4% of Rnet around midnight. In terms of themaximum hourly Rnet(723W m−2), the largest amount of storage S is 0.036 Rnet at 0600PDT and the largest Sbiomass is 0.016Rnet at 1000 PDT.
3.3 Sensitivity Analysis
Here we have derived a general method to derive biomass heat storage from surface tempera-ture observations and applied it to measurements in a walnut orchard. While the tree diameter,biomass density, temperature amplitude, and tree thermal properties may change in differentecosystems and climate zones, we would expect the shape of the diurnal temperature fluc-tuation to be similar for any shaded tree trunk. For a given tree diameter, biomass densityenters linearly in the heat storage calculation. Thus our results could easily be recalculatedfor a different biomass density. However, heat thermal diffusivity (α), tree diameter, and tem-perature amplitude may enter non-linearly into the heat storage equation. To generalize ourresults and allow other investigators to apply them to their sites, we conducted simulationsfor different parameter values, namely the moisture content m, thermal conductivity k, trunkradius Rout and the amplitude of diurnal temperature fluctuations.
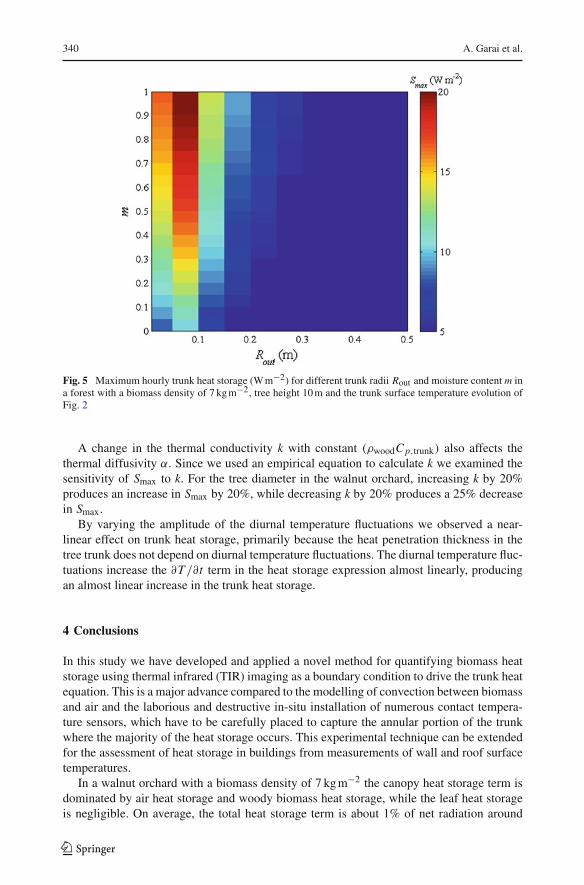
For a biomass of 7 kg m−2 as in our orchard we simulated different tree distributions rang-ing from a large number of thin trees to a small number of thick trees and different m. Figure 5depicts the daily maximum of hourly trunk heat storage (Smax) for varying tree-trunk radiusRout and m. For a given Rout, Smax increases with increasing m. For a given m the trunk heatstorage decreases with increasing Rout as the heat penetration depth and the total biomassexposed to diurnal temperature fluctuations decrease. At m = 0.5 the sensitivity of Smax tom is a 5 % change in Smax for a 10% change in m.
123
340 A. Garai et al.
Fig. 5 Maximum hourly trunk heat storage (W m−2) for different trunk radii Rout and moisture content m ina forest with a biomass density of 7 kg m−2, tree height 10 m and the trunk surface temperature evolution ofFig. 2
A change in the thermal conductivity k with constant (ρwoodC p,trunk) also affects thethermal diffusivity α. Since we used an empirical equation to calculate k we examined thesensitivity of Smax to k. For the tree diameter in the walnut orchard, increasing k by 20%produces an increase in Smax by 20%, while decreasing k by 20% produces a 25% decreasein Smax.
By varying the amplitude of the diurnal temperature fluctuations we observed a near-linear effect on trunk heat storage, primarily because the heat penetration thickness in thetree trunk does not depend on diurnal temperature fluctuations. The diurnal temperature fluc-tuations increase the ∂T /∂t term in the heat storage expression almost linearly, producingan almost linear increase in the trunk heat storage.
4 Conclusions
In this study we have developed and applied a novel method for quantifying biomass heatstorage using thermal infrared (TIR) imaging as a boundary condition to drive the trunk heatequation. This is a major advance compared to the modelling of convection between biomassand air and the laborious and destructive in-situ installation of numerous contact tempera-ture sensors, which have to be carefully placed to capture the annular portion of the trunkwhere the majority of the heat storage occurs. This experimental technique can be extendedfor the assessment of heat storage in buildings from measurements of wall and roof surfacetemperatures.
In a walnut orchard with a biomass density of 7 kg m−2 the canopy heat storage term isdominated by air heat storage and woody biomass heat storage, while the leaf heat storageis negligible. On average, the total heat storage term is about 1% of net radiation around
123
Estimation of Biomass Heat Storage Using TIR Imagery 341
midday and 9% of net radiation around midnight. The total heat storage can be up to 3.6%of maximum net radiation while the biomass heat storage is up to 1.6% of maximum netradiation. Around sunset and sunrise when Rnet is small, heat storage is larger than Rnet buteven then heat storage remains a small absolute value. The analysis also allows computationof response time constants for different components of the canopy with respect to canopyair temperature. This has applications in areas such as the computation of respiratory termsin the carbon balance of the plant. During the daytime, the response time constant of theaverage trunk temperature is about 8 h delayed compared to the canopy air temperature. Forthe lower and upper canopy leaves the time constant was −0.1 and −0.5 h, respectively,indicating that leaf temperatures increase and decrease earlier than air temperature.
In our study we made the following assumptions: (1) The heat equation was solved inone dimension only as a function of radius, and forced by the average trunk pixel surfacetemperature. In practice, however, the temperature profile of the tree trunk and heat storageterm in the trunk will be functions of height and aspect. To acquire sufficient TIR images,depending on the temporal variability of the radiative forcing, the camera could be rotatedaround the tree at least once per hour. (2) Allometric measurements were only conductedbelow 2 m height and models were used to determine woody biomass above and leaf biomass.(3) Thermal properties of trees were assumed to be constant, which might not be true fortrees with thick bark and potential air gaps between the bark and inner wood. In those casesthermal properties should be considered as a function of trunk radius. (4) We did not considerthe heat loss term due to sap flow in the trunk heat storage term explicitly; sap flow causescooling of the lower part of the trunk compared to the upper part. By taking the averagetemperature of all trunk and branch pixels we implicitly accounted for the cooling effect ofsap flow, which we estimate to be as high as 1.6 W m−2 of the surface area in our orchard.
Acknowledgements The analysis of the data was funded by NSF-EAR0739109. We would like to expressour gratitude to Jan Hendrickx for the TIR camera, and Yoichi Shiga, Michael Sankur, and Mandana Farhadiehfor field assistance. The experiment would not have been possible without the support of the NCAR EarthObserving Laboratory staff under the leadership of Ned Patton and Tom Horst. Thanks to Antonio Parades,the Cilker family, and Roy Gill for providing access to their orchards. The MATLAB program used to conductthese analyses is provided in the online material associated with this article.
Open Access This article is distributed under the terms of the Creative Commons Attribution Noncommer-cial License which permits any noncommercial use, distribution, and reproduction in any medium, providedthe original author(s) and source are credited.
References
Aston AR (1985) Heat storage in a young eucalypt forest. Agric For Meteorol 35:281–297Eckert ERG, Drake RM (1972) Analysis of heat and mass transfer. McGraw Hill Series in Mechanical Engi-
neering, New York, pp 208–216Haverd V, Cuntz M, Leuning R, Keith H (2007) Air and biomass heat storage fluxes in a forest
canopy: calculation within a soil vegetation atmosphere transfer model. Agric For Meteorol147(3–4):125–130
Jenkins JC, Chojnacky DC, Heath LS, Birdsey RA (2003) Comprehensive database of diameter-based biomassregression for North American tree species. United States Department of Agriculture, Forest Service,Northeastern Research Station. General Technical Report NE-319
Jones JK, Webb BW, Jimenez D, Reardon J, Butler B (2004) Development of an advanced one-dimensionalstem heating model for application in surface fires. Can J For Res 34(1):20–30
Khedari J, Benigni P, Rogez J, Mathieu JC (1992) A solution of the heat conduction equation in the finitecylinder exposed to periodic boundary conditions: the case of steady oscillation and thermal property.Proc Roy Soc Lond A 438:319–329
123

342 A. Garai et al.
Lindorth A, Iritz Z (1993) Surface energy budget dynamics of short rotation willow forest. Theor ApplClimatol 47:175–185
Meesters AGCA, Vugts HF (1996) Calculation of heat storage in stems. Agric For Meteorol 78:181–202Moore CJ, Fisch G (1986) Estimating heat storage in Amazonian tropical forest. Agric For Meteorol 38:
147–169Oliphant AJ, Grimmond CSB, Zutter HN, Schmid HP, Su HB, Scott SL, Offerle B, Randolph JC, Ehman
J (2004) Heat storage and energy balance fluxes for a temperature deciduous forest. Agric For Meteorol126:185–201
Patton EG, Horst T, Lenschow D, Sullivan P, Oncley S, Burns S, Guenther A, Held A, Karl T, Mayor S, RizzoL, Spuler S, Sun J, Turnipseed A, Allwine E, Edburg S, Lamb B, Avissar R, Holder H, Calhoun R, KleisslJ, Massman WJ, Paw UKT (2008) The Canopy Horizontal Array Turbulence Study (CHATS). In: 18thsymposium on boundary layers and turbulence. Stockholm, Sweden
Sutherland (1986) Broadband and spectral emissivities (2–18 µm) of some natural soil and vegetation.J Atmos Ocean Technol 3:199–202
Thom AS (1975) Momentum, mass and heat exchange of plant communities. In: Monteith JL (ed) Vegetationand the atmosphere, vol 1. Academic Press, London, pp 57–109
123
Related Documents