127 Genet. Res .. Camb. (1982),40, pp. 127-137 With 1 Printed in Cheat Britain Estimation and of genetic distance in empirical studies By LAURENCE D. MUELLER* AND FRANCISCO J. AYALA Department of Genetics, University of California, Davis, California 95616 U.S.A. (Received 19 November 1981 and in revised form 9 March 1982) SUMMARY Linear functions of Nei's genetic-distance statistic are calculated frequently in the literature of population genetics. Variance estimates for these linear functions are either not presented or incorrectly calculated. Part of the problem stems from the common assumption that distance statistics are independent random variables. This assumption is not generally correct. We describe methods for estimating the variance of linear combinations of genetic-distance statistics. We also suggest a method for constructing confidence intervals on genetic-distance statistics when these values are small « 0'10) and their distribution deviates substantially from normal. 1. INTRODUCTION Many questions of evolutionary interest require that genetic differences between populations be expressed as a single statistic, often called 'genetic distance'. Genetic distances are used, for example, to evaluate the degree of genetic differentiation achieved during the speciation process or at other stages of evolutionary divergence (review in Ayala, 1975). Gcnetic distances also are used in the construction ofphenograms (Sneath & Sokal, 1973) or cladograms (Farris, 1972) and have indeed provided valuable information for the reconstruction of phylogenetic history on the basis of extant species. Gel electrophoresis has made it relatively easy to characterize genetic differences between population through the study of a number of gene loci coding for enzymes and other proteins. The results of electrophoretic studies Can be used to estimate the genetic distance between pairs of populations. The distance measure proposed by Nei (1971, 1972) is one of the most widely used, although many others exist 1973). Nei's genetic-distance statistic is a complicated function of the underlying observations: allele frequencies at several loci. Consequently the statistical pro- perties of these quantities are rather complicated. The complications are most * Present address: Department of Biological Sciences, Stanford University, Stanford, California 94305 U.S.A.

Welcome message from author
This document is posted to help you gain knowledge. Please leave a comment to let me know what you think about it! Share it to your friends and learn new things together.
Transcript
127 Genet Res Camb (1982)40 pp 127-137 With 1 text~figure
Printed in Cheat Britain
Estimation and int~rpretation of genetic distance in empirical studies
By LAURENCE D MUELLER AND FRANCISCO J AYALA
Department of Genetics University of California Davis California 95616 USA
(Received 19 November 1981 and in revised form 9 March 1982)
SUMMARY
Linear functions of Neis genetic-distance statistic are calculated frequently in the literature of population genetics Variance estimates for these linear functions are either not presented or incorrectly calculated Part of the problem stems from the common assumption that distance statistics are independent random variables This assumption is not generally correct We describe methods for estimating the variance of linear combinations of genetic-distance statistics We also suggest a method for constructing confidence intervals on genetic-distance statistics when these values are small laquo 010) and their distribution deviates substantially from normal
1 INTRODUCTION
Many questions ofevolutionary interest require that genetic differences between populations be expressed as a single statistic often called genetic distance Genetic distances are used for example to evaluate the degree of genetic differentiation achieved during the speciation process or at other stages of evolutionary divergence (review in Ayala 1975) Gcnetic distances also are used in the construction ofphenograms (Sneath amp Sokal 1973) or cladograms (Farris 1972) and have indeed provided valuable information for the reconstruction of phylogenetic history on the basis of extant species
Gel electrophoresis has made it relatively easy to characterize genetic differences between population through the study of a number ofgene loci coding for enzymes and other proteins The results of electrophoretic studies Can be used to estimate the genetic distance between pairs of populations The distance measure proposed by Nei (1971 1972) is one of the most widely used although many others exist (~ei 1973)
Neis genetic-distance statistic is a complicated function of the underlying observations allele frequencies at several loci Consequently the statistical proshyperties of these quantities are rather complicated The complications are most
Present address Department of Biological Sciences Stanford University Stanford California 94305 USA
128 L D MUELLER AND F J AYALA
apparent when linear functions of distance statistics are computed Linear functions of distance statistics are routinely calculated in the literature (Hilburn 1980 Kilias Alahiotis amp Pelecanos 1980 Mulley amp Latter 1980 Ryman Reuterwall Nygren amp Nygren 1980 Ward 1980 Greenbaum 1981 Guttman Wood amp Karlin 1981 Halliday 1981) Oftentimes questions of biological importance requires some statistical inference on these linear functions Ve herein describe methods for making statistical inferences on linear functions of Keis measure of genetic distance and illustrate these methods with several examples In addition we suggest a method of interval estimation on estimates of genetic distance when these are close to zero
2 NEIS DIfTA~CIlt MEASURE
Under the assumptions that the substitution of electromorphs (and hence electrophoretically detectable alleles) is well described by a Poisson process and that the mean rate of this process is the same for all loci Nei (1971 1972) has derived a genetic distance statistic which estimates the mean number of such substitutions that have taken place since two populations shared their last common ancestor If r~) (y~raquo) is the frequency of the kth alleltgt at locus i in population X( Y) then the j-statistics may be defined as
j~b = 1 lx~) Y~)l k
where the summations are over all alleles at locus i Nei has proposed the following formula for estimating the genetic distance on the basis of n loci
(1 )
wherexyx andy are the averages over all loci ofj~bj~) andj~) A method for estimating the sampling variance of Dn is given by Nei and Roychoudhury (1974)
The true genetic distance D would of course be obtained from equation (1) if the summations were taken over all gene loci in the genome and if the allele frequencies were obtained from examination ofall the individuals in the population However bias may be introduced into 15n in two ways (1) because ~nly a few individuals and (2) because only a few loci are usually studied In this discussion a small number of individuals means ten or fewer whereas a large number of loci meam fifty or more If a small number of individuals is sampled then Dn may be biased owing to a substantial bias in B) and j~) Nei (1978) has proposed an unbiased estimator of Dn when a small number of individuals has been sampled at a large number of loci However a more common situation in electrophuretic
129 Genetic Distance Statistics
studies is that a sufficient number of individuals is sampled at a small number of loci Mueller (1979) has shown that in this case the approximate magnitude ofthe bias is gi yen by
(2)
where J XY = E(jxy) J x = E(jx) and J1J = B(jy) It seems to be often the case that (2) is positive which means that E(Dn) gt D This bias may be reduced by the jackknife method
3 THE JACKKNIFE
The jackknife method offers an alternative estimator of D that may be less biased than Dn (see Miller 1974 for a review) Let Dn t be the same as (1) except that the ith locus has been omitted (ie Dn i is based ~n n-l loci) There will be n different values of Dn t (i = 1 2 n) which may be used to define n pseudovalues as follows
(2a)
The jackknife estimator 1)n of D is simply defined as the mean of these n pseudovalues
(3)
The variance is defined in the usual fashion as
(4)
4 STATISTICAL PIWPERTTES OF THE Ef-l[IMATORS
In order to evaluate the advantages of each of the two estimators Dn and Dn we would like to know the following properties of the estimators (i) the bias (ii) the variance and (iii) the mean square error = (bias)2 + variance The smaller the values of (i) (ii) and (iii) the better the estimator will be It is not possible to derive analytic expressions for properties (i) (ii) (iii) but computer simulations provide some insights Mueller (1979) has carried out nine sets of simulations The bias was smaller in all nine cases for 1)n than for Dn the variance and the mean square error were smaller in eight out of the nine cases These results indicate that with respect to properties (i) (ii) and (iii) the jackknife is superior to (1)
(i) Interval e8timall0n
The results of Mueller (1979) show that the intervals generated by either method are too small for samples of five (or fewer) loci but are of about the correct magnitude for samples of n ~ 15 loci There is however an important exception to this conclusion namely when the value of D is very small (ie of the order of
l~O L D MeELLER AND F T AYALA
10-2 ) The genetic distanee between two populations cannot be negative Henee Dn ean not be less than zero and this causes the distribution of Dn values to be asymmetric and to deviate substantially from a t-distribution whenever D is very small (see Ineller 1979)
If we make use of the third and fourth moments of Dn and J5 n then we ean use an Edgeworth expansion (see Bickel amp Doksum 1977 pp 32-34) to obtain an approximation to the true distribution of these statistics Let Fn()) denote the distribution function of (Dn - D)Var (Dn)l and YIn and Y2n denote the coefficient of skewness and kurtosis then
where ltIgt (x) and cent(x) are the distribution and density function of a standard normal random variable respectively For the jackknifed estimator Dn the third and fourth moments ean be estimated from standard moment estimators using the pseudovalues in a fashion analogous to (4) Obtaining these estimates for Dn is quite a bit more difficult In principle one would use the expression 1A in the appendix to find E[J5n-Dn ll andE[Dn - Dn14 Once YIn and Y2n are estimated equal tail (onfidence intervals [Xl X 2 ] can be estimated from (5) by noting FnU(l) = 0middot025 and Fn(X2 ) = 0middot975 Ve can also examine the ability of the lognormal and gamma distributions to describe the distribution of small values If we assume that log (Dn) has a normal or t-distribution then an equal tail eonfidence interval on Dn will be given by
Xl = exp lU-v(]2 tn-la]
X 2 = exp [u +vi (]2 tn-laJ
u = In Dn-Iln lVar (Dn)Dn+1]
(]2 = In [Val (Dn)D~+ 11shy
Xl and X 2 are somewhat more diffieult to obtain for thl gamma distribution The parameters and distribution function may be estimated from equations (24) (412) and Thorns approximation as given in Johnson amp Kotz (1970 ch 17) Evidenee for the usefulness of any of these approximations is given by the following numerieal experiment Three thousand values of10 were caleulated using the data from Ayala et al (1974a) for the Barinitas and Tueupita populations of Drosophila tropicalis The methods for generating the 3000 values were the same as described in lueller (1979) From the 3000 values JJ 2 () (]2 P3n and P4n were estimated and used to estimate the Edgeworth lognormal and gamma distribution functions In Table 1 we have presented the empirical distribution and the distributions predieted from the Edgeworth expansion the gamma and the lognormal The Edgeworth expansion is only slightly better than the gamma distribution In view of the two additional parameters that one must estimate for the Edgeworth expansion it may be more accurate and easier to use the gamma distribution
131 Genetic Distance Statistics
(ii) Lack of independence between distance measures
Certain problems arise repeatedly in many empirical studies that utilize genetic distance statistics Their solution involves calculating statistics that are linear functions of genetic distance values Examples of these problems are (i) whether or not two distance values arc significantly different from each other (ii) what is the mean distance between populations in a group and (iii) constructing pheno-
Table 1 The empirical distribution f(x) of 3000 values of D20 the Edgeworth gamma and lognormal distributions The 3000 randomly-generated distance values were 8ampledfrom the data of Ayala et al (1974a) x = (lo-D)yVar (D 20 )
x f(x) Edgeworth Gamma lognormal
-181 0003 00055 000173 lt 0middot001 -1middot69 0middot00833 00147 000636 0middot0012 -157 00167 00278 00157 0middot0053 -1middot46 0middot0357 0middot0439 0middot0241 00129 - 1middot34 00543 0OG59 0middot0528 0middot0271 -111 0118 0122 0115 (H)824 -0644 0300 0middot287 0296 (H)83 -0179 0481 0480 0495 0512
0middot402 0middot685 0middot692 0middot703 0728 1middot33 0middot897 0middot899 0middot895 0middot898 2middot26 0975 0middot973 0968 0middot959 2middot38 0980 OH77 0middot973 0middot964 24H 0983 0H80 0middot977 0967
--- 2middotGl 0middot985 0middot984 0980 0middot971 2middot73 0middot988 0middot986 0middot983 0974 2middot84 0990 0middot988 098G 0976 296 0992 0990 0988 0middot979
grams or cladograms based on electrophoretic data Ve can formalize these questions First we introduce a change of notation by letting 8 Xy i and Dxy be the same as Sni and Dn in equations (2a) and (3) except that the sample size specification (n) has now been replaced by xy which refers to the populations whose genetic distance is being estimated The problems mentioned above reduce to considering the mean and variance of some linear combination U of m genetic distance statistics Thus if CXY is a constant associated with Dxy then
U = CAB DAB+CAC DAc +middotmiddotmiddot +CXY Dxy
Linear functions that arc commonly encountered arc sums or differences of means Since these can get quite complicated we find the notation given above useful The variance of U is given by
m m-l m
Var(U)= LCliVar(i5I)+2 L L CICICov(DIDI ) (6)i=l i=l j=i+l J J
132 L D MUELLER AND F J AYALA
where li lj E AB AG XY The question of whether two distance values are significantly different may be answered by calculating U = Dxy-Dwz and asking whether U is significantly different from zero In order to answer this we must obtain confidence intervals about U but this in turn requires knowing the variance of U This will be given by
(7)
In a similar fashion if we want to obtain the average of two distance values If = (DXy +Dwz )2 then the variance of If will be given by
Var (D) = [Var (Dxy) +Var (Dwz) +2 Cov (Dxy Dwz)] (8)
In general the covariance term in (7) and (8) will not be zero We may consider two situations The first situation is when x = Z which will be the case for example when a matrix of pairwise genetic distances is calculated involving a group of populations If x = Z the two distance values are not independent since the same data from population x are used to estimate Dxy and Dwx and therefore their covariance cannot be assumed to be O The second situation is when x y wand z refer all to different populations It might seem that in this case Dxy and Dwz would be independent but often it will not be so The distance statistics will only be independent if loci are sampled at random This is clearly not the case due to technical limitations in electrophoresis laboratories
Usually the same set of loci (or largely overlapping sets) are used to estimate Dxy and Dwz Ancestral relationships between the four populations as well as possible similarities of selection pressures may result in patterns of variation at a particular locus that are correlated between populations It is well known that rates of evolution can differ appreciably between loci eg the fibrinopeptides have evolved very rapidly compared to proteins such as cytochrome-c (Dobzhansky et al 1977 pp 301-303) Thus if a sample of loci contains many fibrinopeptide-like loci then the estimate of Dxy is liable to be larger than it should be If Dwz was estimated from the same rapidly evolving loci then it will also be larger than expected and Dxy and Dwz will covary as a result of this non-random sampling of loci Hence even when all populations are different we cannot assume that Cov (Dxy Dwz) = O
Fortunately the covariance term can be easily estimated from the pseudovalues of the jackknife
-- - - -Cov (Dxy Dwz) = (lin) Cov (SXy Swz)
= [lln(n-l)] ~ (SXyi-Dxy) (Swzi-Dwz) (9)
If the two distance measures are calculated using the delta method as in (1) the covariance term can also be calculated by means of the delta method (Kendall amp Stuart 1969 pp 231-232) This covariance is derived in the Appendix
133 Genetic Distance Statistics
5 APPLICATIOKf
The first problem of general interest is whether the subdivision of a set of populations into genetically similar groups is supported by estimates of genetic distance To illustrate this application we will use the data from Bruce amp Ayala (1979) The living hominoids including humans and apes can be divided into two groups one having the smaller apes genera Hylobates (gibbon) and Syrwphalangu8
Table 2 Results of two rnethods for testing the significance of intergroup flenetic distances
Parampter Method I 1Iethod II
(A) Var (Dw) 071 x 10~3 311 X 1O~3 (B) Var(J)B) t39xlO~3 312xlO~J
(C) COy (J)wDH) 0 363 x tO~3 (D) Var (C) = A +13-2( 2middottO x 1O~3 271 X 1O~3 (E) 95 CT on C (0-~5 03) (011076)
Sote Caiculatpd from Bruce amp Ayala (t979) Dw = 028~ DB = 0720 C = 0431 CT stands for Confidence I ntprval
(siamang) and a second group having the great apes (lor-ilia Pan (chimpanzee) and Pongo (orangutan) as well as humans It is often thought that the evolutionary lineage going to the small apes separated from the lineages going to the great apes and humans before these separ~ted fron one another The question we may want to raise is whether the species within each of these two groups are genetieally more similar to each other than they are to species from the other group In order to answer this question we calculate three quantities Dw = the average genetic distance within groups DB = the average genetic distance between groups and e = DB - Dw If C is significantly greater than 0 the answer to the question raised will be yes
Ve shall use two methods in order to estimate the variance of the three quantities Method T assumes that each distance value is an independent-andshyidentically-distributed random variable This method is the one most commonly used in the electrophoretic literature (eg Ayala et al 1974b Hene amp Carson 1977 Hedgeeock 1978 Tabachnick Munstermann amp Powell 1979) Method II makes use ofthe concepts outlined in equation (6) and uses equation (9) to estimate the eovariances between distance values
The results for the data of Bruce amp Ayala (1979) are shown in Table 2 Both methods lead to the same qualitative conelusion - namely that species within groups are genetically more similar than between groups - but it is apparent that method I grossly underestimates the variance of U If the magnitude of U had been smaller or if fewer loci had been used method J and II might have lead to qualitatively diff(~rent con(~lusions
A second problem for which the methods discussed in this paper are relevant concerns the construction of cladograms or phenograms on the basis of genetic
134 L D MUELLER AND F J AYALA
distances Several methods exist that estimate the position of the branch points or leg lengths as linear combinations of the distance values Examples of such methods are the l~nweighted Pair Group method (Sneath amp Sokal Inn) and Farris (1972) method for finding a Wagner tree Equation (6) can be used in such cases for estimating the variances and therefore the confidence intervals of the branch points The Unweighted Pair Group method is used to construct a phcnogram for the data of Bruce amp Ayala (197n) as shown in Fig 1
(0middot14 0rmiddot6_6)________ Gorilla
(0middot3511)_____---1 (0middot11057) lorno
(0023030)(0middot027 0-40) Pan troglodytes
Pan paniscus
r----- Pongo p_ pygrnaeus
L----Pongo p_ abelii
r------Hylobates lar ------1
L---Hylobates concolor
L-______ Syrnphalangus
I I
0-70 0middot60 0middot50 0-40 0-30 0-20 0-10 0
Genetic distance
Fig 1 A phenograrn of nine species of horninoids (Bruce amp Ayala 1979) constructed by the unweighted pair group method Confidence intervals (95 ) are given for the pOlgtition of each branching point
The branch points estimated for the unweighted pair group method are always the sum of various mean genetic distances Consequently when these branch points are small it would be best to use a gamma distribution to construct the confidence interval It should be noted that the confidence intervals in Fig 1 are not independent Thus if the branch point of I lar with H concolor were really close to 0middot35 then the branch point linking these species with Symphalangu8 would probably also be larger than 027 ConS~~lucntly this information can be used to make inferences on individual branch points but not on the overall topology of the tree
6_ DISCUSSION
Based on the results of Mueller (1979) we recommend that the jackknife method be used to estimate Neis measure of genetic distance Because the jackknife estimator has smaller variance and bias than the estimator proposed by Kei this recommendation can be made unconditionally The jackknife method is more laborious - because n pseudodistances must be calculated each usingn - Iloci - but it does not involve any more difficult computations than Neis method
Linear functions of distance statistics are computed often in empirical studies Some recent examples of work where either phenograms or some other function
135 Genetic Distance Statistics
of distance statistics were calculated are Hilburn 19RO Kilias Alahiotis amp Pelecanos 19RO Mulley amp Latter 19RO Hyman et al HlRO Ward 1980 Greenbaum 1981 Guttman Wood amp Karlin 1981 Halliday 1981 This list is certainly not exhaustive The methods discust-ed in thit- paper could han~ been applied in all these examplet-1t is obious that ift-ome statit-tical inference on thet-e linear functions is desired the ariance of the linear function must be computed Even if a formal hypothesit- tet-t it- not being considered confidence intervals should be published to give readert- t-ome feeling for the underlying uncertainty in these figuret- et-pecially t-ince this uncertainty it- ut-ually great At- we have illustrated in Table 2 the usual method for estimating the varianee of linear functiont- leadt- to t-evere underet-timates Thus application of the methodt- det-cribed here may lead to major qualitative changes in the interpretation of the data rather than to minor quantitative changes
Phenogramt- and cladograms are almot-t alwayt- presented without any indication of the variance in leg lengtht-o Fot-sil or other evidence is sometimet- available to fix the time of one or more branch points in a eladogram The approximate dates can then be estimated for the various eladogenetic events in the phylogeny Our methodt- can abo be ut-ed to calculate the confidence intervalt- of the dates
7 APPENDIX
Ve will derive the expret-sion for the covariance of Dxy and l)wz by the delta method Firt-t we expand the functions Dxy and Dwz about the expected values ofjxjy jXY jw jz andjwz we denote such expected aluet- by J x J y etc Ignoring the second order and higher terms we get
~ D~ CjI~) CiD~ J) - D C J C xy J C xy J C xyc C (1 A)xy - xy+(x- x)~+0y- Y)~+()Xy- Xy)--c-
0x 0 y 0~
D D J eDwz J M)wz ClDwzC C C
wz = wz+ 0w- w)~+ 0z- z)~+ 0wz- J wz)--c- (2A)GJw GJz uJwz
where the derivatives in (lA) and (2A) are evaluated at the points (Jx J y J XY ) and (Jw J z J wz ) respectively using (lA) and (2A) we get an expret-sion for (Dxy-Dxy) (l)wz-Dwz) Taking expectations on both t-i(ks of the equation and noting that
(Jl5xy _ 1
ajx - 2jx U)XY _ 1 -aj1 - 2jy
G15X Y = cJxy
1
Jxy
we get
COy (Dxy Dwz)
= Cov (xjw)4Jx Jw+Cov (xjz)4Jx Jz-Cov (xjwz)2Jx J wz
+Cov (yjw)4Jy Jw+Cov (yjz)4Jy Jz-Cov (iyjwz)2Jy J wz
-Cov 0-Xyjw)2Jxy Jw-Cov (Xyjz)2Jxy Jz+Cov (Xyjwz)JXY J wz (3A)
136 L D MUELLER AND F J AYALA
As an estimate of Co v (Dxy Dwz) we replace the population quantities in (3A) with - - - - - shy
their sample analogs ie COy (jxy) = COy (jxj~) Ix =x etc
REFERE~CES
AYALA F bullJ (19i5) Genetic differentiation during the speciation process Tn Evolutionary Biology vol 8 (ed T Dobzhansky 1 K Hecht and W C Steere) pp l-i8 New York Plenum Press
AYALA F bullJ TRACEYI L BARR L G VlcDoNALD J F amp PEREZ-SALAS S (19i4a) Genetic variation in natural popUlations of five Drosophila species and the hypothesis of the selective neutrality of protein polymorph isms Genetics 77 348-384
AYALA F J TRACEYM I HEDGECOCK D amp RICHMOND R C (Un4b) Genetic differentiation during the speciation process in Dromphila Evolution 28 5i6-592
BICKEL P bullJ amp DOKSOM K A (19ii) Mathematical Statistics Hasic ideas and Selected Topics San Francisco Holden-Day
BRUCE EJ amp AYALA F bullJ (19i9) Phylogenetic relationships beteen man and the apes Eleetrophoretic evidence Evolution 33 1040-1056
DOBZHANSKY TH AYALA F J STEBBINS G L amp VALENTINE J W (19ii) Evolutlon San Francisco Y H Freeman
FARRIS J S (19i2) Estimating phylogenetic trees from distance matrices American Naturalist 106 645-668
GREENBA FM T F (1981) Genetic interactions between hybridizing cytotypes of the tent making ([Troderma bilobatum) Evolution 35 306-321
GTTnIAN S 1 WOOD T K amp KARLIN A A (1981) Genetic differentiation along host plant lines in the sympatric Enchenopa binotata Say complex (Homoptera Mem bracidae) Evolution 35205-2Ii
HALLIDAY R B (1981) Heterozygosity and genetic distance in sibling species of meat ants (Iridomyrmex purpureus Group) Evolution 35 234-242
HEDGECOCK D (19i8) Population subdivision and genetic divergence in the red-bellied newt Tarirha rivularis Evolution 32 2il-286
HILBTRN L R (1 U80) Population genetics of Ohironom us stigmatems (Diptera Chironomedae) II Protein variation in populations of the southwest rnited States Evolution 34 696-i04
bull JoHNSON K L amp KOTZ S (19iO) Contlml011s [Tnivariate [)i~tribution8 vol 1 ~ew York John Wiley
KENDALL M G amp STUART A (1969) The advanced theory ojstatistirs vol 1 New York Hafner KILIAS G ALAHIOTIS S ~ amp PELECANOS M (1980) A multifactorial genetic investigation
of speciation theory using Drosophila melanogaster Evolution 34 i3O-i3i MILLER R G (19i4) The jackknife - a review Hiometrika 61 1-15 MlELLER L (l)i)) A comparison of two methods for estimating Keis measure of genetic
distance Biometrics 35 i5i-i63 MULLEY J C amp LATTER B D H (1980) Genetic variation and evolutionary relationship~
within a group of thirteen species of penaeid pawns Evolution 34 lO4-916 KEI M (19il) Interspecific differences and evolutionary time estimated from electrophoretic
data on protein identity American Naturali8t 105 385-398 KEI 1 (19i2) GenetiC distanee between populations American Naturalist 106 282-292 ~EI T (19i3) The theory and estimation ofgenetic distance In Genetic Structure oj PQ]Julations
(ed K E Morton) pp 45-fi4 Honolulu University of Hawaii Press ~EI VI (I li8) Estimation of average het8rozygosity and genetic distance from a small number
of individuals Genetics 89 583-5lO KEI M amp ROYCHOlTDHFRY A K (19i4) Sampling variances of heterozygosity and genetic
distances Genetics 76 3i~390 RYMAN N REUTERWALL G NYGREN K amp NYGREN T (1980) Genetic variation and
137 Genetic Dista nce Statistics
differentiation in Scandinavian moosp (Alas alces) Are large mammals monomorphie Evolution 34 1037-1049
SENE F M amp CARSON H L (1977) Genetic variation in Hawaiian Drosophila IV Allozymic similarity between D silvestris and D heteroneura from the island of Hawaii Genetics 86 187-198
S~EATH P amp SOKAL R (1973) Numerical Taxonomy San Francisco W H Freeman TAIlACH~ICK W J l1U~STERMANN L E amp POWELL J R (19iJ) Genetic distinetneRs of
sympatric forms of Aedes aegypti in East Afri(lL Evolution 33 28i-295 WARD P S (1980) Genetic variation and population differentiation in the Rhytdoponera
impressa group a species complpx of ponevine ants (Hymenoptera Formicidae) Evolutiun 34 1060--1076
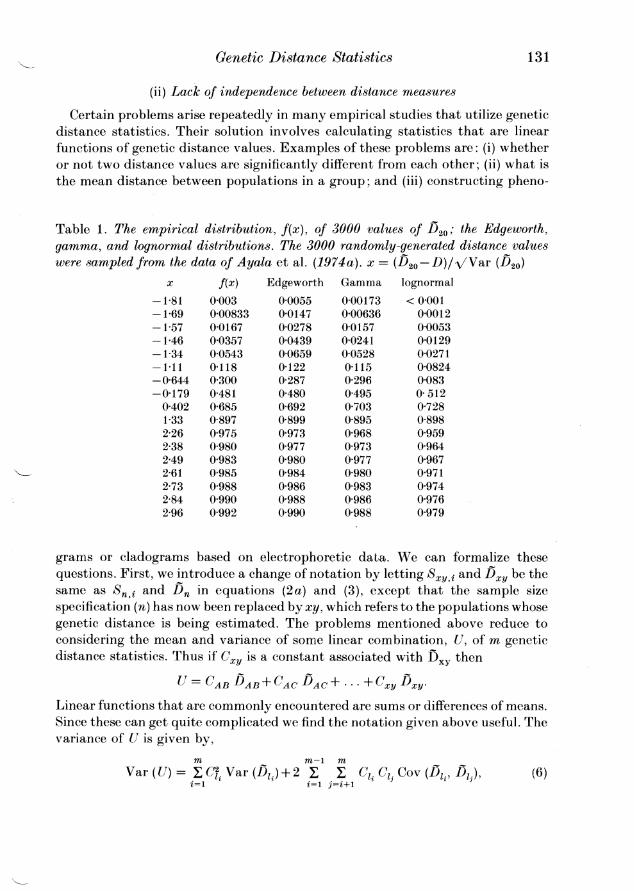
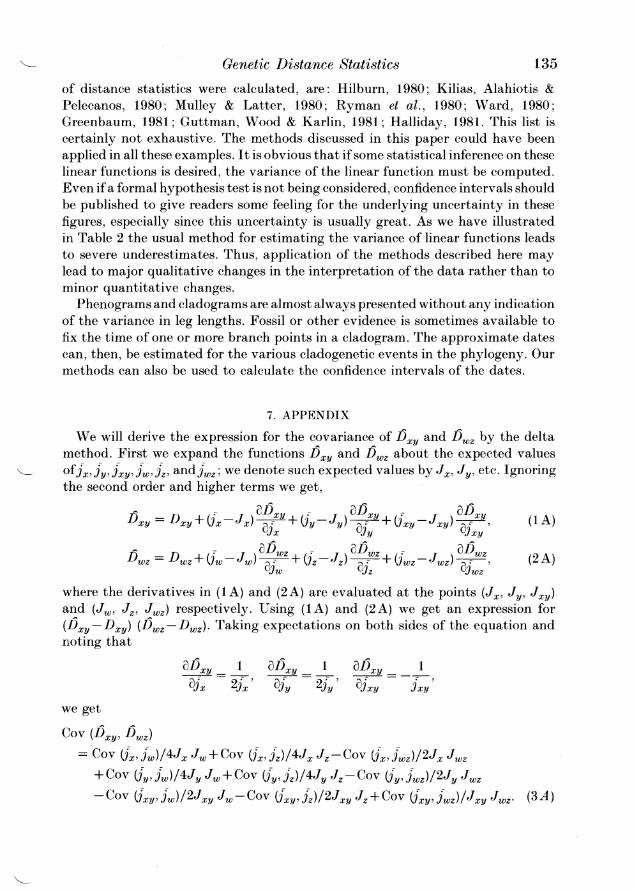
Related Documents