ACTA ACUSTICA UNITED WITH ACUSTICA Vol. 95 (2009) 1093 – 1103 DOI 10.3813/AAA.918241 Estimating Waveguide Model Elements from Acoustic Tube Measurements Tamara Smyth School of Computing Science, Simon Fraser University, 250-13450 102nd Ave., Surrey BC V3T 0A3, Canada. [email protected] Jonathan S. Abel Center for Computer Research in Music and Acoustics (CCRMA), Dept. of Music, Stanford University, Stanford, California 94305-8180. [email protected] Summary One-dimensional digital waveguides are widely used to model traveling pressure waves along wind instrument bores comprised of concatenated cylindrical or conical sections. Waveguide filter elements model frequency- dependent losses and delay (dispersion) occurring during propagation and at any boundary or discontinuity pro- ducing reflected and transmitted waves. In this work, a technique is described for estimating wind instrument waveguide elements from several measurements of the system’s impulse response, each measurement taken with the system having incrementally varying termination/boundary conditions. The measured impulse responses yield sequences of multiple arrivals from which estimates of waveguide element transfer functions may be formed. The measurement and post signal processing technique is explored using simple structures consisting of cylindrical and conical tubes, as these are well described theoretically and provide a basis for validating measured data. All waveguide elements necessary for modeling typical wind instrument bores are collected here, each presented with a theoretical description and accompanying measurement. The measurement and processing system is then shown to yield data closely matching the theory, thus providing confidence that the technique may be extended to accurately measure structures which are more difficult to describe theoretically, such as an instrument’s flaring bell. PACS no. 43.75.Wx, 43.75.Yy, 43.75.Zz 1. Introduction Computer simulations involving wave propagation in one dimension often make use of the digital waveguide, or bi- directional delay line [1]. The theory of digital waveguide synthesis and its use in modeling musical instruments is well documented [1, 2, 3]. It is a particularly practical syn- thesis technique for real-time interactive computer music instruments as it is computationally efficient, with musi- cally relevant control parameters easily changed in real time. When modeling wind instrument bores that are cylin- drical and/or conical, a waveguide section is used, incor- porating a pure delay corresponding to the length (or de- sired fundamental frequency) of the bore and digital fil- ters to account for losses and dispersion of the propagating wave, such as due to viscous drag and thermal conduction occurring along the bore walls [4, 5, 6]. Additional filter- ing is required at waveguide section boundaries, such as an open or closed termination, or a junction with one or Received 16 February 2009, accepted 13 July 2009. more waveguide sections, as these change the characteris- tic wave impedance and result in a reflection and a com- plementary transmission of the wave. Waveguide models of acoustic tubes and musical instrument bores therefore comprise three types of waveguide elements: 1) a waveg- uide section, modeling bore wave propagation and loss, 2) a termination, modeling bore end conditions, and 3) a scattering junction, modeling the bore scattering, as in the connection of waveguide sections. Depending on the shape of the bore being modeled, a one-dimensional digital waveguide model may not be sufficiently accurate since the waveguide section models only planar or spherical wave propagation in cylindrical or conical tubes, respectively. That is, instruments depart- ing from these simple shapes, such as the flared opening of many brass instruments, generate continuous reflection and transmission of the propagating wave that must ei- ther be modeled using a piecewise connection of several waveguide sections corresponding to the instrument’s con- tour, or by obtaining the bore’s (or bore section’s) mea- sured or theoretical reflection function. If a measured reflection function of an entire instru- ment body is used in the context of a real-time paramet- ric model, further processing will be necessary to separate © S. Hirzel Verlag · EAA 1093

Welcome message from author
This document is posted to help you gain knowledge. Please leave a comment to let me know what you think about it! Share it to your friends and learn new things together.
Transcript

ACTA ACUSTICA UNITED WITH ACUSTICAVol 95 (2009) 1093 ndash 1103
DOI 103813AAA918241
Estimating Waveguide Model Elements fromAcoustic Tube Measurements
Tamara SmythSchool of Computing Science Simon Fraser University 250-13450 102nd Ave Surrey BC V3T 0A3 Canadatamarascssfuca
Jonathan S AbelCenter for Computer Research in Music and Acoustics (CCRMA) Dept of Music Stanford University StanfordCalifornia 94305-8180 abelccrmastanfordedu
SummaryOne-dimensional digital waveguides are widely used to model traveling pressure waves along wind instrumentbores comprised of concatenated cylindrical or conical sections Waveguide filter elements model frequency-dependent losses and delay (dispersion) occurring during propagation and at any boundary or discontinuity pro-ducing reflected and transmitted waves In this work a technique is described for estimating wind instrumentwaveguide elements from several measurements of the systemrsquos impulse response each measurement taken withthe system having incrementally varying terminationboundary conditions The measured impulse responses yieldsequences of multiple arrivals from which estimates of waveguide element transfer functions may be formed Themeasurement and post signal processing technique is explored using simple structures consisting of cylindricaland conical tubes as these are well described theoretically and provide a basis for validating measured data Allwaveguide elements necessary for modeling typical wind instrument bores are collected here each presentedwith a theoretical description and accompanying measurement The measurement and processing system is thenshown to yield data closely matching the theory thus providing confidence that the technique may be extendedto accurately measure structures which are more difficult to describe theoretically such as an instrumentrsquos flaringbell
PACS no 4375Wx 4375Yy 4375Zz
1 Introduction
Computer simulations involving wave propagation in onedimension often make use of the digital waveguide or bi-directional delay line [1] The theory of digital waveguidesynthesis and its use in modeling musical instruments iswell documented [1 2 3] It is a particularly practical syn-thesis technique for real-time interactive computer musicinstruments as it is computationally efficient with musi-cally relevant control parameters easily changed in realtime
When modeling wind instrument bores that are cylin-drical andor conical a waveguide section is used incor-porating a pure delay corresponding to the length (or de-sired fundamental frequency) of the bore and digital fil-ters to account for losses and dispersion of the propagatingwave such as due to viscous drag and thermal conductionoccurring along the bore walls [4 5 6] Additional filter-ing is required at waveguide section boundaries such asan open or closed termination or a junction with one or
Received 16 February 2009accepted 13 July 2009
more waveguide sections as these change the characteris-tic wave impedance and result in a reflection and a com-plementary transmission of the wave Waveguide modelsof acoustic tubes and musical instrument bores thereforecomprise three types of waveguide elements 1) a waveg-uide section modeling bore wave propagation and loss2) a termination modeling bore end conditions and 3) ascattering junction modeling the bore scattering as in theconnection of waveguide sections
Depending on the shape of the bore being modeleda one-dimensional digital waveguide model may not besufficiently accurate since the waveguide section modelsonly planar or spherical wave propagation in cylindricalor conical tubes respectively That is instruments depart-ing from these simple shapes such as the flared openingof many brass instruments generate continuous reflectionand transmission of the propagating wave that must ei-ther be modeled using a piecewise connection of severalwaveguide sections corresponding to the instrumentrsquos con-tour or by obtaining the borersquos (or bore sectionrsquos) mea-sured or theoretical reflection function
If a measured reflection function of an entire instru-ment body is used in the context of a real-time paramet-ric model further processing will be necessary to separate
copy S Hirzel Verlag middot EAA 1093
ACTA ACUSTICA UNITED WITH ACUSTICA Smyth Abel Estimating waveguide model elementsVol 95 (2009)
components of the response that can be made parametricFor example in work by Rodet and Vergez [7] the down-stream pressure of a lip-reed model is obtained by con-volving the input bore pressure with the measured reflec-tion function of a trumpet bore and bell with the delay cor-responding to the length of the trumpetrsquos cylindrical sec-tion made variable according to the userrsquos desired sound-ing frequency This would be equivalent to a waveguidemodel having a single cylindrical waveguide section witha reflection function corresponding to the non-cylindricalsegment of the measurement
Several techniques exist for measuring acoustic proper-ties of tubes and wind instrument bores each one devel-oped for obtaining the acoustic information required for aparticular application Probably most notable and commonamong the acoustics community are techniques for obtain-ing the borersquos input impedance as a function of frequency[8 9 10 11] as this measurement fully characterizes theinstrument and may be used to obtain its resonances aswell as to estimate its area function as was done for thevocal tract [12] Though the input impedance of a tubeis closely related to its impulse response since a changeof impedance results in reflection and transmission of thepropagating wave it is not as easily incorporated into awaveguide model because it describes the acoustics of thewhole instrument not the behavior of individual sectionsand elements comprising the model This may be prob-lematic (though not necessarily insurmountable) from aninstrument design point of view when it is desirable toleave the modelrsquos control parameters intact
Perhaps more relevant to the work presented here arethe time-domain techniques for obtaining reflection trans-fer functions of instrument bores or bore sections Ag-ulloacute et al [13] present a system for measuring the re-flection function of a discontinuity in a divergent ldquocylin-droconicalrdquo acoustic tube Here two diametrally opposedmicrophonesmdashthe sum of their signals eliminating unde-sired higher-order modes with an odd number of diame-tral nodal linesmdashare placed at sufficient distance from thediscontinuity and the driver that a measurement of a shortpulse-like excitation followed by itrsquos reflection off the dis-continuity can be made before overlapping with any otherreflections in the system setup
In work by Vaumllimaumlki et al [14] a measurement tech-nique is presented in which two microphones are placed ata distance from one another along the length of the boresuch that right and left (incident and reflected) travellingwaves may be separated to estimate propagation loss andreflection at a tubersquos open end The work mentions the dif-ficulties involved in driving the system with a pulse andthe necessity for considering the transfer function of thespeaker when producing a driving signal that is aldquoperfectrdquoimpulse In their method an impulse is sent to the driverthe response is recorded and the driving impulse is thencomputed using inverse filtering
In another common measurement technique referred toas acoustic pulse reflectometry [15] a pulse drives a suffi-ciently long source tube to which an instrument is affixed
with reflections from the instrument being recorded with-out interference from any reflections in the source tubeAs with the input impedance curves discussed abovemdashinfact this technique is often used to obtain input impedancecurvesmdashthis measurement is used to describe the proper-ties of the complete tube using a single round-trip propaga-tion of the excitation signal along its lengthmdashnot of singlewaveguide elements
In methods using a pulse as the excitation signal thereare trade offs between the width of the pulse being sentdown the tube the length of the reflected signal the SNRand the covered bandwidth Though a loud narrow pulseis desirable both for having sufficient energy to excitethe system above the noise floor and to cover a broaderfrequency bandwidth such a pulse can cause the speakerto distort Sufficient energy may be applied to the systemby making the pulse longer A wider pulse has a reducedbandwidth and restricts placement of the microphoneswhich need to be sufficiently spaced to avoid interferencebetween incident and reflected pulses
It should be noted that it has become increasingly com-mon practice to use excitation signals such as a swept si-nusoid essentially an impulse smeared in time as this hassufficient energy to excite the system above the noise floorwithout causing the distortion that would inevitably re-sult from using an impulse with similar energy [16] Allthe techniques above could likely be improved using theswept-sine technique with mathematical post-processingleading to an excitation signal that is essentially a pulseIn so doing the duration of the input signal is completelydivorced from the effective pulse sent out the drive Thatis regardless of the choice of swept-sine length the in-put driving signal will always be post-processed so its ef-fective length is that of an impulse filtered by the speakertransfer function
In an additional multiple microphone technique to theone cited above Antoine Lefebvre et al [17 18] posi-tion multiple microphones along the length of the boreand excite the system with white noise providing suffi-cient energy to obtain as good a SNR as if using a sweptsinusoid By analyzing the signals simultaneously receivedat each of the microphones the left and right going wavemay be separated and the reflection function inferred Thedisadvantage of this system as compared to the work pre-sented here is that it uses multiple microphones requir-ing separate processing for different frequency bands thefurther spaced microphones give information on low fre-quencies while the closer microphones give informationon high frequencies Though certainly a reasonable tech-nique there is the added task of calibrating the micro-phones and piecing together the processing results fromdifferent frequency bands requiring less straight forwardsignal processing
In this work an acoustic measurement and signal pro-cessing technique is presented which allows the completesystem impulse responsemdashthe sequence of multiple ar-rivals from the tube and not just its single round-trip re-flection functionmdashto be interpreted in the time domain
1094
Smyth Abel Estimating waveguide model elements ACTA ACUSTICA UNITED WITH ACUSTICAVol 95 (2009)
(closed)
WaveguideSection(cylinder)
ScatteringJunction
WaveguideSection(cone)
Termination
(open)
Termination
Figure 1 Example waveguide model of the open cylicone show-ing an example application of three waveguide elements
λ (ω)zminus L
zminus Lλ (ω)
Figure 2 A waveguide section showing a pure delay of Msamples corresponding to a physical length L and frequency-dependent propagation losses λ(ω) which account for magni-tude attenuation and phase velocity (dispersion)
and used for estimating waveguide model element trans-fer functions Here measurements are made incrementallyon four tube structures each one specially designed andbuilt to yield a measurement corresponding to an addi-tional waveguide element leading to the final structure acylinder with an attached cone henceforth referred to as acylicone (Figure 1) Though it would certainly be possibleto estimate the input impedance from the measurementspresented here it is not the aim of this work Rather thefocus is on analyzing and interpreting the information con-tained within a sequence of impulse arrivalsmdashan in-depthdiscussion of the time-domain impulse response waveformtypically omitted from the literaturemdashand using the resultsto estimate filter components of a waveguide model
The measurement setup has the benefit of being ex-tremely simple requiring only a single microphone anda co-located speaker at one end of the tube (the place-ment remains the same for each tube structure and for eachwaveguide element being estimated) as well as a full du-plex audio device capable of simultaneously sending andreceiving a signal This eliminates the need to calibratemultiple microphones and since the swept-sine excitationtechnique is used provides more accurate and distortion-free measurements In addition because the placement ofthe speaker and microphone is at one end of the tube thelocation of the mouthpiece in most western wind instru-ments the measured impulse responses can be directlyincorporated into a reed model requiring a value for thedownstream (bore) pressure to determine the reedrsquos over-all driving force [19]
The measurements are validated (as one must be certaina measurement technique is yielding expected data freeof unexplained artifacts) using four tube structures com-prising cylinders and cones as the theory for these shapes
is well known and provides a good basis for comparisonwith the estimated element transfer functions If measure-ments yield data showing good agreement with theory forthese shapes it suggests that the technique can be easilyextended to include shapes that are much more difficult toaccount for theoretically
Section 2 serves to collect the theory describing waveg-uide elements In addition to forming the theoretical ba-sis for assessing the quality of the proposed measurementtechnique this also provides a single source for wind in-strument waveguide element design Section 3 presentsthe measurement technique and setup used to obtain theimpulse responses from which waveguide element trans-fer functions may be estimated Section 4 presents themeasured data corresponding to the four tube structuresdescribes the estimation of each waveguide element andcompares the measured and theoretically predicted waveg-uide element transfer functions shown to have very goodagreement The detailed illustration and discussion of thewaveguide elements observed within the echo responsesof the four impulse responses facilitates the discussion ofthe signal processing required to isolate and estimate eachwaveguide element transfer function
2 Waveguide theory
21 The waveguide section wave propagation
The digital waveguide or bidirectional delay line imple-ments drsquoAlembertrsquos solution for plane waves propagatingalong a lossless cylindrical tube
y(t x) = y+(t minus xc) + yminus(t + xc) (1)
where the positive and negative superscripts indicate trav-elling pressure waves y moving in opposite directions tand x are the time and spatial variables respectively and cis the propagation speed Spherical waves in conical tubesmay be similarly modeled as they are the sum of travelingwaves moving toward and away from the cone apex Dueto spherical spreading waves propagating from a distancer0 from the cone apex to a distance r1 from the cone apexwill experience a pressure scaling of r0r1
The digital waveguide Figure 2 is equivalent to sam-pling (1) where the delay in samples M is proportional tothe tube section length L In practice it is also useful toaccount for frequency-dependent propagation losses withtransfer function having both a magnitude and phase re-sponse arriving from viscous drag and thermal conduc-tion along the tube walls The propagation constant perunit length is given by
Γ(ω) = α(ω) + jω
v(ω) (2)
where α(ω) is the attenuation coefficient v(ω) is the phasevelocity and ω is the angular frequency [4] The attenua-tion and phase delay over a tube of length L is then givenby
exp minus Γ(ω)L
1095
ACTA ACUSTICA UNITED WITH ACUSTICA Smyth Abel Estimating waveguide model elementsVol 95 (2009)
Table I Molecular constants evaluated at 2685oC as providedby [4]
Symbol Values Units
Air density ρ 118 times 10minus3 gcm2
Viscosity η 185 times 10minus4 g(s cm)(Prandtl)
12 ν 0841
Ratio ofspecific heats γ = CpCv 140Free spacesound speed c 347 times 104 cms
Denoting by λ(ω) the one-way loss transfer function andby Lc the one-way propagation time the propagationloss is given by exp[minusjωLc] middot λ(ω) where
λ(ω) = exp minus α(ω)L minus jωL(1v(ω) minus 1c) (3)
An approximation to the phase velocity valid for all tuberadii is [6]
v(ω) asymp cAvrv (1 + rvκ)
1 + Avrv (Bv + rvκ) (4)
where rv is the ratio of the pipe radius a to the thickness ofthe viscous boundary layer given by
rv = aη
ωρ
minus 12
(5)
and the parameters Av and Bv given by
Av =1
2radicγ Bv = 1 +
[1 + (γ minus 1)ν)]radic2κ
(6)
were selected to match the limiting phase velocity behav-ior and the parameter
κ = 2γ (7)
marks the ratio rv delimiting the small-radius and large-radius tube regions [6] The molecular constants in (5) and(6) are defined in Table I and suggested values are pro-vided
Similarly an approximation to the attenuation coeffi-cient is
α(ω) asymp ω
crv
Aα + Bα (rvκ)1 + rvκ
(8)
where the parameters Aα and Bα were again selected tomatch the limiting attenuation coefficient behavior and aregiven by
Aα = 2 γ Bα =1 + (γ minus 1)ν
radic2
(9)
Figure 3 shows the approximations for phase velocityand attenuation as given by (4) and (8) along with theircomplete and limiting behaviors as given by Benade [4]
100
101
10-1
100
PhaseVelocityc
100
101
10-5
10-4
10-3
Boundary Layer Thickness Ratio (rv)
AttenuationFrequency
Figure 3 Modeled (solid) phase velocity (top) and attenuation(bottom) and their complete and limiting behavior (dashed)
T2(ω)
R 1(ω) R 2(ω)
T1(ω)
Figure 4 Scattering A change of impedance may occur as a two-port scattering junction between two waveguide sections con-sisting of frequency-dependent reflection R12(ω) and amplitudecomplementary transmission T12(ω)
R (ω)
T (ω)
R (ω)
Closed Open
Figure 5 Termination A change of impedance in a waveguidesection may occur as a termination closed with reflection oropen with a reflection R(ω) and corresponding complementarytransmission
22 Scattering reflection and transmission
Any change of impedance which may be the result of atermination (either open or closed as discussed in the fol-lowing section 23) a change in the tubersquos cross-sectionalarea or a connection to another acoustic element requiresfiltering to account for the frequency-dependent reflec-tion R12(ω) and amplitude complementary transmissionT12(ω) that will result between two adjacent waveguidesections (see Figure 4) or at a termination (see Figure 5)
1096
Smyth Abel Estimating waveguide model elements ACTA ACUSTICA UNITED WITH ACUSTICAVol 95 (2009)
A change in the wave impedance at the boundary be-tween two tube elements will result in a reflection withtransfer function
R(ω) =Z2(ω)Z1(ω) minus 1Z2(ω)Z1(ω)lowast + 1
(10)
where Z1 and Z2 denote the adjacent wave impedancesand lowast indicates the complex conjugate The amplitudecomplementary transmission transfer function is given by
T (ω) = 1 + R(ω) (11)
for pressure waves [20]For plane waves in cylindrical tubes (as denoted by the
y subscript) the impedance is given by
Zy =ρc
S (12)
where S is the cross-sectional area of the tubeFor spherical pressure waves in conical tubes (as de-
noted by the n subscript) propagating away from the coneapex (denoted by the + superscript) the impedance is de-pendent on frequency ω and the distance r from the obser-vation point to the cone apex and is given by
Z+n (rω) =
ρc
S
jωjω + cr
(13)
For spherical waves propagating toward the cone apex theimpedance is given by
Zminusn (rω) =
ρc
S
jωjω minus cr
= Z+lowastn (rω) (14)
23 Termination reflection and transmission
A special case of a change in cross section is at the in-strumentrsquos open end In this case the complex terminat-ing impedance Z2(ω) = ZL(ω) may be a complicatedfunction of frequency In the case of a cylindrical tube anexpression is available by Levine and Schwinger in termsof Bessel and Struve functions [21] There is no knownexpression for conical bores
The ratio ZLZ1 may be approximated by
ZLZ1 asympjka
ζ + jka (15)
where k = ωc is the wavenumber a is the radius of thecylinder and ζ is a scalar near one which determines thetransition between the low-frequency and high-frequencybehaviour The expression (15) follows the gross be-haviour described by Levine and Schwinger The reflec-tion filter for the open end on a cylindrical tube may thenbe approximated by
Rop(ω) =ZLZ1 minus 1ZLZ1 + 1
=minus1
1 + 2jkaζ (16)
yielding a one-pole low-pass filter with a cutoff frequencyof ω = ζca
cylinder speakerminusclosed
cylinder speakerminusopen
2 meters
cylicone speakerminusclosed
cylicone speakerminusopen
1)
2)
3)
4)
Figure 6 Four simple tube structures each terminated at one endwith a speaker and having a co-located microphone The follow-ing terminations are applied at the end opposite the speaker andmicrophone 1) a cylinder closed with Lucite to ensure a perfectreflection (cylinder speaker-closed) 2) an open cylinder (cylin-der speaker-open) 3) a cylicone terminated with a glass sphere(with radius nearly that of the cone) ensuring a perfect reflectionof spherical waves (cylicone speaker-closed) 4) an open cyli-cone (cylicone speaker-closed)
3 Measurement configuration
To isolate each of the waveguide model elements seen inFigure 1 a test signal a swept sinusoid similar to thatdescribed by Farina [16] was input through a speaker atone end of four tube configurations a cylindrical tube andthe cylinder with an attached conical flare (cylicone) eachmeasured with the end opposite the speaker closed thenopen (see Figure 6)1 Cylinder closed end A two-meter-long cylinder is
rigidly terminated at one end to ensure a perfect re-flection This configuration allows measurement of thespeaker output σ(ω) the speaker reflection ρ(ω) andthe wall loss λ(ω) transfer functions as described insection 41 The arrival responses Ln for this measure-ment may be seen in Figure 7
2 Cylinder open end Opening the cylinder allows mea-surement of the reflection at the open end of a cylinderRop(ω) as described in section 42 Figure 9 shows themeasured responses
3 Cylicone closed end The addition of a conical flarewith a spherical termination (to ensure a perfect reflec-tion) to the above cylindrical tube allows reflection andtransmission at the junction to be observed from themeasured responses shown in Figure 11 as describedin section 43
4 Cylicone open end Opening the conical end allows usto observe the corresponding reflection from the cyli-cone response shown in Figure 13 as described in sec-tion 44
1097
ACTA ACUSTICA UNITED WITH ACUSTICA Smyth Abel Estimating waveguide model elementsVol 95 (2009)
As described below by using a long swept sinusoid to ob-tain a system impulse response for each structure the sys-tem is excited with sufficient energy to achieve a signif-icantly larger SNR than could be obtained with a simplepulse while achieving the bandwidth of interest in thiscase up to 10kHz The impulse responses measured herehave a peak level roughly 70 dB above the noise floorstandard deviation There is no limit to the duration of theswept sinusoid ie itrsquos length is not bounded by the mi-crophone placement the length of the tube or any otherpotential for overlap between signal and reflections seenin other methods since the signal recorded at the micro-phone is processed to produce the response of the systemhad it been excited with a pulse only one sample long
The test signal used was a sinusoid exponentially sweptfrom 20 Hz to the band edge of 2205 kHz (half the sam-pling rate fs) and with a duration of 220 samples or about23 seconds Expressed mathematically the sine sweep isgiven by
s(t) = sin φ(t) φ(t) =t
0ω(τ) dτ (17)
where the frequency ω(t) traces out an exponential sweep
ω(t) = 2πf0eηt (18)
where η = ln(f02fs)T with fs being the sampling ratef0 the initial frequency and T the duration of the sweep
A sine sweep was repeated so that the measured re-sponse during the second sweep would be the circular con-volution of the input sweep with the system In particularto recover the system impulse response from the sweep re-sponse circular deconvolution may be used Denoting byr(t) the system response during the second sweep we have
h(t) = Fminus1 Fr(t) Fs(t) (19)
whereF denotes the Fourier Transform Expressed in Mat-lab code the impulse response h may be found with
h = ifft fft(r)fft(s) (20)
where s contains the sine sweep and r is the system re-sponse during the second sine sweep
The input signal and the measured response is sent andreceived simultaneously using a full duplex audio devicein this work the Mac PowerBook running Logic Pro withthe MOTU Traveler audio interface with 16-bit audio at asampling rate of 441 kHz was used Measurements weretaken in a very large room with the apparatus placed fivemeters from the nearest reflecting object
The four simple tube structures in Figure 6 were assem-bled using PVC tubes and plastic funnels of several sizesThe cylinder was prepared by placing a speaker (CUI IncCMS0281KLX) at one end and by press fitting a six-millimeter-diameter microphone (Panasonic W64M) intoa hole drilled next to the speaker It is not necessary toconsider or document the precise details of the speaker
and microphone as long as their placement and geome-try is consistent from one measurement to the next Anyeffects of placement and geometry are eliminated by thesignal normalization and post processing described in thefollowing section It is important however that the mi-crophone and speaker be placed as close as possible toeach other to minimize the acoustic travel time betweenthem In this way the corresponding frequency at whichdestructive interference occurs between the signal travel-ing from speaker to microphone and that returning fromthe bore is made large Destructive interference will resultin a notch in the transfer function and will impact the abil-ity to take the spectral ratios described in section 4 at thatfrequency In this case the distance between the micro-phone and speaker is sufficiently small to ensure that anyspectral nulls would be outside the 10 kHz band of interest
The cylinder is 2 m long with an inside radius a = 1 cmand the cone is 127 cm long with edge radii of a1 = 1 cmand a2 = 92 cm Both cylinder and cone are sufficientlythick to be considered rigid (3 mm and 2 mm respec-tively)
The impulse response between the speaker and mi-crophone was measured for each of the configurationsThe impulse responses were then equalized according tothe first arrival the speaker-microphone transfer functionσ(ω) to produce the figures shown in section 4 Note thatthe first arrival will also contain contributions from evanes-cent modes in this case above about 10kHz
4 Measured responses
In spite of the wide use of digital waveguides for soundsynthesis it is perhaps less common to observe the be-haviour of wave propagation in actual acoustic systemsfrom the same perspective That is rather than analyzing asystem purely from its frequency response it is informa-tive for analysis and practical for synthesis to observe theeffects of each waveguide element in a sequence of multi-ple arrivals comprising the system impulse response
41 Closed cylinder
A first measurement is taken for the cylinder closed atthe end opposite the speaker ensuring a perfect reflec-tion Comparing arrivals appearing in its impulse responseprovides estimates of the propagation loss λ(ω) speakertransfer function σ(ω) and the speaker reflection functionρ(ω)
The first four arrivals comprising the measured speaker-microphone impulse response are shown in Figure 7 Thedirect path speaker-microphone response is observed as apositive pulse labeled L1 at t asymp 25 ms and correspondsto the equalized transfer function σ(ω) (Note that the25 ms arrival time corresponds to buffering delays be-tween the sweep and response in the measurement sys-tem) This energy propagates down the length of the tubeand is perfectly reflected from the closed end returning tothe speaker and co-located microphone at t asymp 14 ms The
1098
Smyth Abel Estimating waveguide model elements ACTA ACUSTICA UNITED WITH ACUSTICAVol 95 (2009)
arrival L2 is reflected from the speaker and the observedpulse L2 is the sum of the incoming and speaker-reflectedwaves The pulse makes another round trip eventuallyproducing the sequence of consecutive equally spacedpulses observed in Figure 7 There is an attenuation ofthe pulse upon each successive reflection There is alsoan observable low-pass filtering as the signal becomes in-creasingly smooth and widened with every reflection (Fig-ure 7)
Given the arrival responses for a closed cylinder Ln thetransfer function of the reflection from the speaker maybe estimated The first arrival which is the output of thespeaker measured at the mic consists solely of the speakertransfer function
L1 = σ(ω) (21)
The following arrival L2 consists of the sum of leftand right traveling pressure waves at the microphone po-sition the speaker transfer function after having trav-elled twice the length of the tube (round trip) given byLminus
2 = σ(ω)λ2(ω) and the speaker transfer function withround trip losses after reflecting from the speaker L+
2 =σ(ω)λ2(ω)ρ(ω) The second arrival is expressed as theirsum and is given by
L2 = L+2 + Lminus
2 = σ(ω)λ2(ω) 1 + ρ(ω) (22)
Each subsequent arrival for the closed cylinder consists ofthe previous arrival with round-trip wall losses of λ2(ω)and a speaker reflection ρ(ω) The third arrival is thereforegiven by
L3 = σ(ω)λ4(ω)ρ(ω) 1 + ρ(ω) (23)
These three responses are sufficient for defining the inter-mediate variable
ζ(ω) =L1L3
(L2)2=
ρ(ω)1 + ρ(ω)
(24)
which yields an estimate for the speaker reflection transferfunction
ρ(ω) =ζ(ω)
1 minus ζ(ω) (25)
and the propagation loss λ(ω)
λ2(ω) =L3
ρ(ω)L2 (26)
Figure 8 shows the estimated and theoretical propaga-tion loss along with the estimated speaker reflection Notethe good agreement between the estimated and theoreti-cal propagation losses The low-frequency attenuation ob-served in the spectrum of the speaker reflection is likelydue to the speaker being designed to be resonant at lowfrequencies It should be pointed out that there is roughlya fraction of a dB attenuation in the estimated propagationloss beyond that theoretically predicted
0 5 10 15 20 25 30 35 40 45 50-02
0
02
04
06
08
1
12
time - milliseconds
amplitude
L 1 = σ (ω)
L2 = σ (ω)λ 2(ω)(1 + ρ(ω))
L 3 = σ (ω)λ 4(ω)ρ(ω)(1 + ρ(ω))
Figure 7 Arrival responses for the closed cylinder showing in-dividual pulses and corresponding spectra as combinations oftransfer functions for the speaker σ(ω) wall losses λ(ω) andspeaker reflection ρ(ω)
10-1
100
101
-25
-20
-15
-10
-5
0
frequency - kHz
magnitude-dB
estimated
theoretical
estimated speaker reflection
Figure 8 Theoretical (upper smooth curve) and estimated (lowercurve 05 dB down) propagation losses along with the estimatedspeaker reflection (high-pass curve)
42 Open cylinder
The open-end reflection transfer function Rop(ω) maybe estimated from the open cylinder impulse responseshown in Figure 9 The low-pass characteristic describedby Levine and Schwinger is apparent in the successive ar-rivals which are increasingly smeared over time comparedto their closed-end counterpart shown in Figure 7 Succes-sive arrivals show the same propagation delay as observedfor the closed cylinder but in this case with every other re-flection inverted and with increased attenuation and low-pass filtering with each consecutive reflection (Figure 9)This is expected as the responses Yn have all the lossesof the closed cylinder (propagation and speaker reflectionlosses) with the added effect of the open-end reflection
As with the closed cylinder the initial response of thismeasurement is merely the response of the speaker to an
1099
ACTA ACUSTICA UNITED WITH ACUSTICA Smyth Abel Estimating waveguide model elementsVol 95 (2009)
0 5 10 15 20 25 30 35 40 45 50-06
-04
-02
0
02
04
06
08
1
time - milliseconds
amplitude
Y3 = σ (ω)λ 4(ω)R 2op(ω)ρ(ω)(1 + ρ(ω))
Y1 = σ (ω)
Y2 = σ (ω)λ 2(ω)R op(ω)(1 + ρ(ω))
Figure 9 Measured impulse response for the open cylinder show-ing individual arrivals The open-end transfer function Rop(ω)may be isolated by comparison with the corresponding closed-end arrival spectra L2 L3 L4
impulse yielding the speaker transfer function Y1 = σ(ω)The second arrival Y2 is similar toL2 but also includes theopen-end reflection
Y2 = σ(ω)λ2(ω)Rop(ω) 1 + ρ(ω) (27)
Subsequent arrival responses include additional round-tripwall losses and open-end reflections The open-end reflec-tion function may then be estimated as the ratio of the sec-ond arrival spectra
Rop(ω) =Y2
L2 (28)
and is seen in Figure 10
43 Closed cylicone
Attaching a conical flare to the cylindrical tube and termi-nating with a spherical cap to ensure a perfect reflectionallows for estimation of the reflection and transmission fil-ters associated with the junction
Figure 11 shows the measured impulse response in-cluding groups of arrivals resulting from energy reflectedbetween the end cap and the junction Consider the indi-vidual subarrivals within the second arrival group A2 ofFigure 11 The signal from the speaker propagates alongthe length of the cylinder to the junction where part of thesignal is reflected back to the microphone and inverted (ascan be seen from (10) where if Z1(ω) gt Z2(ω) the re-flection R(ω) picks up a negative sign) It appears as thenegative pulse A21 with losses having a low-pass char-acteristic described by Ry(ω) as well as round-trip walllosses given by λ2
y(ω) The part of the signal that is not re-flected is transmitted through the junction with losses hav-ing a complementary high-pass characteristic Ty(ω) Thissignal propagates to the spherical termination where it isldquoperfectlyrdquo reflected arriving back at the junction a short
10-1
100
101
-12
-10
-8
-6
-4
-2
0
2
4
frequency - kHz
magnitude-dB
estimated (upper undulating line)
approximate theoretical (lower line)
Figure 10 Estimated and approximate theoretical open-endcylinder reflection magnitude The theoretical reflection magni-tude is a first-order approximation that captures the general low-pass characteristic Note that the estimated reflection magnitudeis greater than one at low-frequencies where the speaker doesnrsquotgenerate significant power and more measurement noise is in-troduced The measurement matches the approximate theoreticalcurve above 2 kHz and within a fraction of a dB otherwise
0 5 10 15 20 25 30 35 40 45 50-04
-02
0
02
04
06
08
1
time - milliseconds
amplitude
A 2 = (see expansion below)
A 1 = σ (ω)
A3 =
12 14 16 18 20 22 24-04
-02
0
02
04
time - milliseconds
amplitude
A 21 = σ (ω)λ 2y(ω)R y(ω)(1 + ρ(ω))
A 22 = σ (ω)λ 2y(ω)λ
2n(ω)Ty(ω)Tn(ω)(1 + ρ(ω))
Figure 11 Arrival responses are shown with their correspond-ing transfer functions The response A21 shows a low-pass char-acteristic expected of a junction reflection while A22 shows ahigh-pass characteristic expected of two transmissions throughthe junction
time later (corresponding to twice the length of the cone)Part of this signal at the junction is transmitted with trans-fer function Tc(ω) producing the pulse at t asymp 15 ms (A22
in Figure 11) and part is reflected with transfer function
1100
Smyth Abel Estimating waveguide model elements ACTA ACUSTICA UNITED WITH ACUSTICAVol 95 (2009)
2 3 4 5 6 7-05
0
05
1
15
2
25
3
time - milliseconds
amplitude
Figure 12 Measured (lower line) theoretical (thick line offset by10) and components (upper lines offset by 025) for closed conesecond arrival group corresponding to A2i
Rc(ω) Note the doublet nature of the pulse A22 withthe steep transition from a positive to a negative peak be-ing consistent with the high-pass transmission through thejunction The part of the pulse reflected back toward theend cap will appear at the junction to be in part transmit-ted to the cylinder and microphone and in part reflectedonce again toward the end cap
The first subarrival spectrum is
A21 = σ(ω)λ2y(ω)Ry(ω) 1 + ρ(ω) (29)
with subsequent ith arrivals having spectrum
A2i = σ(ω)λ2y(ω)λ2i
n (ω)
middot Ty(ω)Tn(ω)Riminus1n (ω) 1 + ρ(ω) (30)
The individual subarrivals shown in Figure 12 were gener-ated according to (30) using the transmission and reflec-tion filters described in section 2 for the 45o cone andone-centimeter radius cylinder measured The subarrivalsare summed to form the theoretical arrival group shownin Figure 12 Note the good agreement between the the-oretical and measured responses It should be pointed outthat the estimation of the junction transmission and reflec-tion filters in this case is complicated somewhat by theoverlapping nature of the subarrivals Rather than fix thereflection and transmission filters by analyzing individualarrivals hypothesized filters are used to generate the entirearrival group and then adjusted to produce the group bestmatching the one measured
44 Open cylicone
Opening the end of the cone produces an impulse responsewith similar behaviour as for the closed cylicone thoughbecause it is open the cone termination reflections are in-verted and attenuated A positive pulse traveling from thespeaker to the junction is partly inverted upon reflection
0 5 10 15 20 25 30 35 40 45 50-04
-02
0
02
04
06
08
1
time - milliseconds
amplitude
N 3 =
N 2 = (see expansion below)
N 1 = σ (ω)
12 14 16 18 20 22 24 26-04
-03
-02
-01
0
01
time - milliseconds
amplitude
N 22 = σ (ω)λ 2y(ω)λ
2n(ω)Ty(ω)Tn(ω)R op(ω)(1 + ρ(ω))
N 21 = σ (ω)λ 2y(ω)R y(ω)(1 + ρ(ω))
Figure 13 Arrival responses for the open cylicone showing in-dividual pulses corresponding to outputs of a combinations oftransfer functions
arriving at the microphone as a negative pulse and partlytransmitted through the junction this time being invertedat the open cone termination reflection When the negativepulse arrives at the junction a part is transmitted as a neg-ative pulse to the microphone and a part is reflected as apositive pulse back to the open cone termination where itis again inverted becoming negative The negative pulsepropagates back to the junction where it is partly transmit-ted to the microphone and partly reflected and invertedand so on
Figure 13 shows the measured impulse response for theopen cylicone Like the closed cylicone it exhibits a se-quence of arrival groups The N2 subarrival spectra maybe written in terms of the closed cylicone subarrival spec-tra
N2i = A2iRiminus1op (ω) (31)
Approximating the reflection from the open cone as a first-order low-pass filter with characteristic closely matchingboth observed measurement and that described by Levineand Schwinger (15) for a cylindrical radius equal to theaverage of the conersquos edge radii a1 and a2 a theoreticalarrival response is shown in Figure 14 along with its com-ponent subarrivals and the measured N2 arrival group Asin the case of the closed cylicone there is good agreementbetween the measured and theoretical responses
5 Results and conclusions
In this work a measurement technique was presented forestimating elements comprising a waveguide wind instru-
1101
ACTA ACUSTICA UNITED WITH ACUSTICA Smyth Abel Estimating waveguide model elementsVol 95 (2009)
2 3 4 5 6 7-05
0
05
1
15
2
25
3
time - milliseconds
amplitude
Figure 14 Measured (lower line) theoretical (thick line offsetby 10) and components (upper lines offset by 025) for the opencone second arrival corresponding to N22
ment model including filters used in propagation scatter-ing and termination The technique measures the impulseresponse between the mouthpiece end of the instrumentand a co-located microphone By comparing correspond-ing arrivals for different configurations modeled reflec-tion transmission and loss filters may be identified Tovalidate the measurement technique it was applied to asimple instrument configuration having a cylindrical boreconnected to a conical bell The estimated filters and im-pulse response was seen to closely match the theory giv-ing confidence that the measurement method can be gen-erally applied
To confirm the good agreement between the measuredand theoretical reflection transmission and propagationelements waveguide models of the four tube configura-tions were implemented based on cylinder and cone di-mensions Figure 15 shows a close match between mea-sured and theoretically-derived waveguide model impulseresponses for each of the tube configurations
This work will facilitate the development of filter com-ponents for which theoretical solutions may not be avail-able In particular reflection and transmission functions ofwind instrument bores bells and mouthpieces can be mea-sured by comparing the response of a rigidly terminatedtube to that of the tube with the instrument or instrumentsection affixed
Acknowledgments
We would like to sincerely thank Theresa Leonard and theBanff Centre for the Arts for the use of their facilities JohnLundell Carr Wilkerson Michael Coury and HarrisonSmith for their help in fabricating the experimental setupand the Natural Sciences and Engineering Research Coun-cil of Canada (NSERC) for their support Many thanks arealso extended to the reviewers whose careful reading ofthis text and invaluable comments have greatly strength-ened the clarity and accuracy of this work
0 5 10 15 20 25 30 35 40 45 50
0
2
4
6
8
10
time - milliseconds
amplitude
Closed Cylinder
M
T
Open Cylinder
M
T
Closed Cylicone
M
T
Open Cylicone
M
T
Figure 15 Measured and theoretically-derived impulse responsefor (from bottom to top) a closed cylinder an open cylinder aclosed cylicone and an open cylicone
References
[1] J O Smith Digital waveguide modeling of musical instru-ments www-ccrmastanfordedu˜joswaveguide 2003last viewed 1242008
[2] V Vaumllimaumlki Discrete-time modeling of acoustic tubes us-ing fractional delay filters Dissertation Helsinki Univer-sity of Technology Faculty of Electrical Engineering Lab-oratory of Acoustic and Audio Signal Processing EspooFinland 1995 Report no 37
[3] D P Berners Acoustics and signal processing techniquesfor physical modeling of brass instruments DissertationStanford University Stanford California July 1999
[4] A H Benade On the propagation of sound waves in acylindrical conduit Journal of the Acoustical Society ofAmerica 44 (1968) 616ndash623
[5] D H Keefe Acoustical wave propagation in cylindricalducts Transmission line approximation for isothermal and
1102
Smyth Abel Estimating waveguide model elements ACTA ACUSTICA UNITED WITH ACUSTICAVol 95 (2009)
nonisothermal boundary conditions Journal of the Acous-tical Society of America 75 (Januaray 1984) 58ndash62
[6] J Abel T Smyth J O Smith A simple accurate wall lossfilter for acoustic tubes DAFX 2003 Proceedings LondonUK September 2003 International Conference on DigitalAudio Effects 53ndash57
[7] X Rodet C Vergez Physical models of trumpet-like in-struments Detailed behavior and model improvementsProceedings of ICMC 1996 Clear Water Bay Hong-KongAugust 1996 International Computer Music Conference
[8] AHBenade MIIbisi Survey of impedance methods anda new piezo-disk-driven impedance head for air columnsJournal of the Acoustical Society of America 81 (April1987) 1152ndash1167
[9] JKergomard RCausseacute Measurement of acoustic impe-dance using a capillary An attempt to achieve optimiza-tion Journal of the Acoustical Society of America 79(April 1986) 1129ndash1140
[10] T Ossman H Pichler G Widholm Bias A computer-aided test system for brass wind instruments Audio En-gineering Society Preprint October 1989
[11] J Epps JRSmith JWolfe A novel instrument to mea-sure acoustic resonances of the vocal tract during phona-tion Measurement Science and Technology 8 (July 1997)1112ndash1121
[12] M M Sondhi J Resnick The inverse problem for the vo-cal tract Numerical methods acoustical experiments andspeech synthesis Journal of the Acoustical Society ofAmerica 73 (March 1983) 985ndash1002
[13] J Agulloacute S Cardona D H Keefe Time-domain deconvo-lution to measure reflection functions for discontinuities in
waveguides Journal of the Acoustical Society of America97 (March 1995) 1950ndash1957
[14] V Vaumllimaumlki B Hernoux J Huopaniemi M KarjalainenMeasurement and analysis of acoustic tubes using signalprocessing techniques Finnish Signal Processing Sympo-sium (FINSIGrsquo95) Espoo Finland June 1995
[15] D B Sharp Acoustic pulse reflectometry for the measure-ment of musical wind instruments Dissertation Universityof Edinburgh 1996
[16] A Farina Simultaneous measurement of impulse responseand distortion with a swept-sine technique Proceedings ofthe 108th AES Convention Paris France February 200018ndash22
[17] A Lefebvre G Scavone J Able A Buckiewicz-SmithA comparison of impedence measurements using one andtwo microphones Proceedings of ISMA 2007 BarcelonaSpain September 2007 International Symposium on Mu-sical Acoustics
[18] A Lefebvre La mesure de lrsquoimpeacutedance acoustique du sax-ophone alto Diploma Thesis Eacutecole Polytechnique deMontreacuteal 2006
[19] T Smyth J Abel Convolutional synthesis of wind instru-ments Proceedings of the IEEE Workshop on Applica-tions of Signal Processing to Audio and Acoustics (WAS-PAArsquo07) New Paltz New York October 2007
[20] J O Smith Physical audio signal processing for virtualmusical instruments and audio effects December 2008httpccrmastanfordedu˜jospasp
[21] H Levine J Schwinger On the radiation of sound from anunflanged circular pipe Phys Rev 73 (1948) 383ndash406
1103

ACTA ACUSTICA UNITED WITH ACUSTICA Smyth Abel Estimating waveguide model elementsVol 95 (2009)
components of the response that can be made parametricFor example in work by Rodet and Vergez [7] the down-stream pressure of a lip-reed model is obtained by con-volving the input bore pressure with the measured reflec-tion function of a trumpet bore and bell with the delay cor-responding to the length of the trumpetrsquos cylindrical sec-tion made variable according to the userrsquos desired sound-ing frequency This would be equivalent to a waveguidemodel having a single cylindrical waveguide section witha reflection function corresponding to the non-cylindricalsegment of the measurement
Several techniques exist for measuring acoustic proper-ties of tubes and wind instrument bores each one devel-oped for obtaining the acoustic information required for aparticular application Probably most notable and commonamong the acoustics community are techniques for obtain-ing the borersquos input impedance as a function of frequency[8 9 10 11] as this measurement fully characterizes theinstrument and may be used to obtain its resonances aswell as to estimate its area function as was done for thevocal tract [12] Though the input impedance of a tubeis closely related to its impulse response since a changeof impedance results in reflection and transmission of thepropagating wave it is not as easily incorporated into awaveguide model because it describes the acoustics of thewhole instrument not the behavior of individual sectionsand elements comprising the model This may be prob-lematic (though not necessarily insurmountable) from aninstrument design point of view when it is desirable toleave the modelrsquos control parameters intact
Perhaps more relevant to the work presented here arethe time-domain techniques for obtaining reflection trans-fer functions of instrument bores or bore sections Ag-ulloacute et al [13] present a system for measuring the re-flection function of a discontinuity in a divergent ldquocylin-droconicalrdquo acoustic tube Here two diametrally opposedmicrophonesmdashthe sum of their signals eliminating unde-sired higher-order modes with an odd number of diame-tral nodal linesmdashare placed at sufficient distance from thediscontinuity and the driver that a measurement of a shortpulse-like excitation followed by itrsquos reflection off the dis-continuity can be made before overlapping with any otherreflections in the system setup
In work by Vaumllimaumlki et al [14] a measurement tech-nique is presented in which two microphones are placed ata distance from one another along the length of the boresuch that right and left (incident and reflected) travellingwaves may be separated to estimate propagation loss andreflection at a tubersquos open end The work mentions the dif-ficulties involved in driving the system with a pulse andthe necessity for considering the transfer function of thespeaker when producing a driving signal that is aldquoperfectrdquoimpulse In their method an impulse is sent to the driverthe response is recorded and the driving impulse is thencomputed using inverse filtering
In another common measurement technique referred toas acoustic pulse reflectometry [15] a pulse drives a suffi-ciently long source tube to which an instrument is affixed
with reflections from the instrument being recorded with-out interference from any reflections in the source tubeAs with the input impedance curves discussed abovemdashinfact this technique is often used to obtain input impedancecurvesmdashthis measurement is used to describe the proper-ties of the complete tube using a single round-trip propaga-tion of the excitation signal along its lengthmdashnot of singlewaveguide elements
In methods using a pulse as the excitation signal thereare trade offs between the width of the pulse being sentdown the tube the length of the reflected signal the SNRand the covered bandwidth Though a loud narrow pulseis desirable both for having sufficient energy to excitethe system above the noise floor and to cover a broaderfrequency bandwidth such a pulse can cause the speakerto distort Sufficient energy may be applied to the systemby making the pulse longer A wider pulse has a reducedbandwidth and restricts placement of the microphoneswhich need to be sufficiently spaced to avoid interferencebetween incident and reflected pulses
It should be noted that it has become increasingly com-mon practice to use excitation signals such as a swept si-nusoid essentially an impulse smeared in time as this hassufficient energy to excite the system above the noise floorwithout causing the distortion that would inevitably re-sult from using an impulse with similar energy [16] Allthe techniques above could likely be improved using theswept-sine technique with mathematical post-processingleading to an excitation signal that is essentially a pulseIn so doing the duration of the input signal is completelydivorced from the effective pulse sent out the drive Thatis regardless of the choice of swept-sine length the in-put driving signal will always be post-processed so its ef-fective length is that of an impulse filtered by the speakertransfer function
In an additional multiple microphone technique to theone cited above Antoine Lefebvre et al [17 18] posi-tion multiple microphones along the length of the boreand excite the system with white noise providing suffi-cient energy to obtain as good a SNR as if using a sweptsinusoid By analyzing the signals simultaneously receivedat each of the microphones the left and right going wavemay be separated and the reflection function inferred Thedisadvantage of this system as compared to the work pre-sented here is that it uses multiple microphones requir-ing separate processing for different frequency bands thefurther spaced microphones give information on low fre-quencies while the closer microphones give informationon high frequencies Though certainly a reasonable tech-nique there is the added task of calibrating the micro-phones and piecing together the processing results fromdifferent frequency bands requiring less straight forwardsignal processing
In this work an acoustic measurement and signal pro-cessing technique is presented which allows the completesystem impulse responsemdashthe sequence of multiple ar-rivals from the tube and not just its single round-trip re-flection functionmdashto be interpreted in the time domain
1094
Smyth Abel Estimating waveguide model elements ACTA ACUSTICA UNITED WITH ACUSTICAVol 95 (2009)
(closed)
WaveguideSection(cylinder)
ScatteringJunction
WaveguideSection(cone)
Termination
(open)
Termination
Figure 1 Example waveguide model of the open cylicone show-ing an example application of three waveguide elements
λ (ω)zminus L
zminus Lλ (ω)
Figure 2 A waveguide section showing a pure delay of Msamples corresponding to a physical length L and frequency-dependent propagation losses λ(ω) which account for magni-tude attenuation and phase velocity (dispersion)
and used for estimating waveguide model element trans-fer functions Here measurements are made incrementallyon four tube structures each one specially designed andbuilt to yield a measurement corresponding to an addi-tional waveguide element leading to the final structure acylinder with an attached cone henceforth referred to as acylicone (Figure 1) Though it would certainly be possibleto estimate the input impedance from the measurementspresented here it is not the aim of this work Rather thefocus is on analyzing and interpreting the information con-tained within a sequence of impulse arrivalsmdashan in-depthdiscussion of the time-domain impulse response waveformtypically omitted from the literaturemdashand using the resultsto estimate filter components of a waveguide model
The measurement setup has the benefit of being ex-tremely simple requiring only a single microphone anda co-located speaker at one end of the tube (the place-ment remains the same for each tube structure and for eachwaveguide element being estimated) as well as a full du-plex audio device capable of simultaneously sending andreceiving a signal This eliminates the need to calibratemultiple microphones and since the swept-sine excitationtechnique is used provides more accurate and distortion-free measurements In addition because the placement ofthe speaker and microphone is at one end of the tube thelocation of the mouthpiece in most western wind instru-ments the measured impulse responses can be directlyincorporated into a reed model requiring a value for thedownstream (bore) pressure to determine the reedrsquos over-all driving force [19]
The measurements are validated (as one must be certaina measurement technique is yielding expected data freeof unexplained artifacts) using four tube structures com-prising cylinders and cones as the theory for these shapes
is well known and provides a good basis for comparisonwith the estimated element transfer functions If measure-ments yield data showing good agreement with theory forthese shapes it suggests that the technique can be easilyextended to include shapes that are much more difficult toaccount for theoretically
Section 2 serves to collect the theory describing waveg-uide elements In addition to forming the theoretical ba-sis for assessing the quality of the proposed measurementtechnique this also provides a single source for wind in-strument waveguide element design Section 3 presentsthe measurement technique and setup used to obtain theimpulse responses from which waveguide element trans-fer functions may be estimated Section 4 presents themeasured data corresponding to the four tube structuresdescribes the estimation of each waveguide element andcompares the measured and theoretically predicted waveg-uide element transfer functions shown to have very goodagreement The detailed illustration and discussion of thewaveguide elements observed within the echo responsesof the four impulse responses facilitates the discussion ofthe signal processing required to isolate and estimate eachwaveguide element transfer function
2 Waveguide theory
21 The waveguide section wave propagation
The digital waveguide or bidirectional delay line imple-ments drsquoAlembertrsquos solution for plane waves propagatingalong a lossless cylindrical tube
y(t x) = y+(t minus xc) + yminus(t + xc) (1)
where the positive and negative superscripts indicate trav-elling pressure waves y moving in opposite directions tand x are the time and spatial variables respectively and cis the propagation speed Spherical waves in conical tubesmay be similarly modeled as they are the sum of travelingwaves moving toward and away from the cone apex Dueto spherical spreading waves propagating from a distancer0 from the cone apex to a distance r1 from the cone apexwill experience a pressure scaling of r0r1
The digital waveguide Figure 2 is equivalent to sam-pling (1) where the delay in samples M is proportional tothe tube section length L In practice it is also useful toaccount for frequency-dependent propagation losses withtransfer function having both a magnitude and phase re-sponse arriving from viscous drag and thermal conduc-tion along the tube walls The propagation constant perunit length is given by
Γ(ω) = α(ω) + jω
v(ω) (2)
where α(ω) is the attenuation coefficient v(ω) is the phasevelocity and ω is the angular frequency [4] The attenua-tion and phase delay over a tube of length L is then givenby
exp minus Γ(ω)L
1095
ACTA ACUSTICA UNITED WITH ACUSTICA Smyth Abel Estimating waveguide model elementsVol 95 (2009)
Table I Molecular constants evaluated at 2685oC as providedby [4]
Symbol Values Units
Air density ρ 118 times 10minus3 gcm2
Viscosity η 185 times 10minus4 g(s cm)(Prandtl)
12 ν 0841
Ratio ofspecific heats γ = CpCv 140Free spacesound speed c 347 times 104 cms
Denoting by λ(ω) the one-way loss transfer function andby Lc the one-way propagation time the propagationloss is given by exp[minusjωLc] middot λ(ω) where
λ(ω) = exp minus α(ω)L minus jωL(1v(ω) minus 1c) (3)
An approximation to the phase velocity valid for all tuberadii is [6]
v(ω) asymp cAvrv (1 + rvκ)
1 + Avrv (Bv + rvκ) (4)
where rv is the ratio of the pipe radius a to the thickness ofthe viscous boundary layer given by
rv = aη
ωρ
minus 12
(5)
and the parameters Av and Bv given by
Av =1
2radicγ Bv = 1 +
[1 + (γ minus 1)ν)]radic2κ
(6)
were selected to match the limiting phase velocity behav-ior and the parameter
κ = 2γ (7)
marks the ratio rv delimiting the small-radius and large-radius tube regions [6] The molecular constants in (5) and(6) are defined in Table I and suggested values are pro-vided
Similarly an approximation to the attenuation coeffi-cient is
α(ω) asymp ω
crv
Aα + Bα (rvκ)1 + rvκ
(8)
where the parameters Aα and Bα were again selected tomatch the limiting attenuation coefficient behavior and aregiven by
Aα = 2 γ Bα =1 + (γ minus 1)ν
radic2
(9)
Figure 3 shows the approximations for phase velocityand attenuation as given by (4) and (8) along with theircomplete and limiting behaviors as given by Benade [4]
100
101
10-1
100
PhaseVelocityc
100
101
10-5
10-4
10-3
Boundary Layer Thickness Ratio (rv)
AttenuationFrequency
Figure 3 Modeled (solid) phase velocity (top) and attenuation(bottom) and their complete and limiting behavior (dashed)
T2(ω)
R 1(ω) R 2(ω)
T1(ω)
Figure 4 Scattering A change of impedance may occur as a two-port scattering junction between two waveguide sections con-sisting of frequency-dependent reflection R12(ω) and amplitudecomplementary transmission T12(ω)
R (ω)
T (ω)
R (ω)
Closed Open
Figure 5 Termination A change of impedance in a waveguidesection may occur as a termination closed with reflection oropen with a reflection R(ω) and corresponding complementarytransmission
22 Scattering reflection and transmission
Any change of impedance which may be the result of atermination (either open or closed as discussed in the fol-lowing section 23) a change in the tubersquos cross-sectionalarea or a connection to another acoustic element requiresfiltering to account for the frequency-dependent reflec-tion R12(ω) and amplitude complementary transmissionT12(ω) that will result between two adjacent waveguidesections (see Figure 4) or at a termination (see Figure 5)
1096
Smyth Abel Estimating waveguide model elements ACTA ACUSTICA UNITED WITH ACUSTICAVol 95 (2009)
A change in the wave impedance at the boundary be-tween two tube elements will result in a reflection withtransfer function
R(ω) =Z2(ω)Z1(ω) minus 1Z2(ω)Z1(ω)lowast + 1
(10)
where Z1 and Z2 denote the adjacent wave impedancesand lowast indicates the complex conjugate The amplitudecomplementary transmission transfer function is given by
T (ω) = 1 + R(ω) (11)
for pressure waves [20]For plane waves in cylindrical tubes (as denoted by the
y subscript) the impedance is given by
Zy =ρc
S (12)
where S is the cross-sectional area of the tubeFor spherical pressure waves in conical tubes (as de-
noted by the n subscript) propagating away from the coneapex (denoted by the + superscript) the impedance is de-pendent on frequency ω and the distance r from the obser-vation point to the cone apex and is given by
Z+n (rω) =
ρc
S
jωjω + cr
(13)
For spherical waves propagating toward the cone apex theimpedance is given by
Zminusn (rω) =
ρc
S
jωjω minus cr
= Z+lowastn (rω) (14)
23 Termination reflection and transmission
A special case of a change in cross section is at the in-strumentrsquos open end In this case the complex terminat-ing impedance Z2(ω) = ZL(ω) may be a complicatedfunction of frequency In the case of a cylindrical tube anexpression is available by Levine and Schwinger in termsof Bessel and Struve functions [21] There is no knownexpression for conical bores
The ratio ZLZ1 may be approximated by
ZLZ1 asympjka
ζ + jka (15)
where k = ωc is the wavenumber a is the radius of thecylinder and ζ is a scalar near one which determines thetransition between the low-frequency and high-frequencybehaviour The expression (15) follows the gross be-haviour described by Levine and Schwinger The reflec-tion filter for the open end on a cylindrical tube may thenbe approximated by
Rop(ω) =ZLZ1 minus 1ZLZ1 + 1
=minus1
1 + 2jkaζ (16)
yielding a one-pole low-pass filter with a cutoff frequencyof ω = ζca
cylinder speakerminusclosed
cylinder speakerminusopen
2 meters
cylicone speakerminusclosed
cylicone speakerminusopen
1)
2)
3)
4)
Figure 6 Four simple tube structures each terminated at one endwith a speaker and having a co-located microphone The follow-ing terminations are applied at the end opposite the speaker andmicrophone 1) a cylinder closed with Lucite to ensure a perfectreflection (cylinder speaker-closed) 2) an open cylinder (cylin-der speaker-open) 3) a cylicone terminated with a glass sphere(with radius nearly that of the cone) ensuring a perfect reflectionof spherical waves (cylicone speaker-closed) 4) an open cyli-cone (cylicone speaker-closed)
3 Measurement configuration
To isolate each of the waveguide model elements seen inFigure 1 a test signal a swept sinusoid similar to thatdescribed by Farina [16] was input through a speaker atone end of four tube configurations a cylindrical tube andthe cylinder with an attached conical flare (cylicone) eachmeasured with the end opposite the speaker closed thenopen (see Figure 6)1 Cylinder closed end A two-meter-long cylinder is
rigidly terminated at one end to ensure a perfect re-flection This configuration allows measurement of thespeaker output σ(ω) the speaker reflection ρ(ω) andthe wall loss λ(ω) transfer functions as described insection 41 The arrival responses Ln for this measure-ment may be seen in Figure 7
2 Cylinder open end Opening the cylinder allows mea-surement of the reflection at the open end of a cylinderRop(ω) as described in section 42 Figure 9 shows themeasured responses
3 Cylicone closed end The addition of a conical flarewith a spherical termination (to ensure a perfect reflec-tion) to the above cylindrical tube allows reflection andtransmission at the junction to be observed from themeasured responses shown in Figure 11 as describedin section 43
4 Cylicone open end Opening the conical end allows usto observe the corresponding reflection from the cyli-cone response shown in Figure 13 as described in sec-tion 44
1097
ACTA ACUSTICA UNITED WITH ACUSTICA Smyth Abel Estimating waveguide model elementsVol 95 (2009)
As described below by using a long swept sinusoid to ob-tain a system impulse response for each structure the sys-tem is excited with sufficient energy to achieve a signif-icantly larger SNR than could be obtained with a simplepulse while achieving the bandwidth of interest in thiscase up to 10kHz The impulse responses measured herehave a peak level roughly 70 dB above the noise floorstandard deviation There is no limit to the duration of theswept sinusoid ie itrsquos length is not bounded by the mi-crophone placement the length of the tube or any otherpotential for overlap between signal and reflections seenin other methods since the signal recorded at the micro-phone is processed to produce the response of the systemhad it been excited with a pulse only one sample long
The test signal used was a sinusoid exponentially sweptfrom 20 Hz to the band edge of 2205 kHz (half the sam-pling rate fs) and with a duration of 220 samples or about23 seconds Expressed mathematically the sine sweep isgiven by
s(t) = sin φ(t) φ(t) =t
0ω(τ) dτ (17)
where the frequency ω(t) traces out an exponential sweep
ω(t) = 2πf0eηt (18)
where η = ln(f02fs)T with fs being the sampling ratef0 the initial frequency and T the duration of the sweep
A sine sweep was repeated so that the measured re-sponse during the second sweep would be the circular con-volution of the input sweep with the system In particularto recover the system impulse response from the sweep re-sponse circular deconvolution may be used Denoting byr(t) the system response during the second sweep we have
h(t) = Fminus1 Fr(t) Fs(t) (19)
whereF denotes the Fourier Transform Expressed in Mat-lab code the impulse response h may be found with
h = ifft fft(r)fft(s) (20)
where s contains the sine sweep and r is the system re-sponse during the second sine sweep
The input signal and the measured response is sent andreceived simultaneously using a full duplex audio devicein this work the Mac PowerBook running Logic Pro withthe MOTU Traveler audio interface with 16-bit audio at asampling rate of 441 kHz was used Measurements weretaken in a very large room with the apparatus placed fivemeters from the nearest reflecting object
The four simple tube structures in Figure 6 were assem-bled using PVC tubes and plastic funnels of several sizesThe cylinder was prepared by placing a speaker (CUI IncCMS0281KLX) at one end and by press fitting a six-millimeter-diameter microphone (Panasonic W64M) intoa hole drilled next to the speaker It is not necessary toconsider or document the precise details of the speaker
and microphone as long as their placement and geome-try is consistent from one measurement to the next Anyeffects of placement and geometry are eliminated by thesignal normalization and post processing described in thefollowing section It is important however that the mi-crophone and speaker be placed as close as possible toeach other to minimize the acoustic travel time betweenthem In this way the corresponding frequency at whichdestructive interference occurs between the signal travel-ing from speaker to microphone and that returning fromthe bore is made large Destructive interference will resultin a notch in the transfer function and will impact the abil-ity to take the spectral ratios described in section 4 at thatfrequency In this case the distance between the micro-phone and speaker is sufficiently small to ensure that anyspectral nulls would be outside the 10 kHz band of interest
The cylinder is 2 m long with an inside radius a = 1 cmand the cone is 127 cm long with edge radii of a1 = 1 cmand a2 = 92 cm Both cylinder and cone are sufficientlythick to be considered rigid (3 mm and 2 mm respec-tively)
The impulse response between the speaker and mi-crophone was measured for each of the configurationsThe impulse responses were then equalized according tothe first arrival the speaker-microphone transfer functionσ(ω) to produce the figures shown in section 4 Note thatthe first arrival will also contain contributions from evanes-cent modes in this case above about 10kHz
4 Measured responses
In spite of the wide use of digital waveguides for soundsynthesis it is perhaps less common to observe the be-haviour of wave propagation in actual acoustic systemsfrom the same perspective That is rather than analyzing asystem purely from its frequency response it is informa-tive for analysis and practical for synthesis to observe theeffects of each waveguide element in a sequence of multi-ple arrivals comprising the system impulse response
41 Closed cylinder
A first measurement is taken for the cylinder closed atthe end opposite the speaker ensuring a perfect reflec-tion Comparing arrivals appearing in its impulse responseprovides estimates of the propagation loss λ(ω) speakertransfer function σ(ω) and the speaker reflection functionρ(ω)
The first four arrivals comprising the measured speaker-microphone impulse response are shown in Figure 7 Thedirect path speaker-microphone response is observed as apositive pulse labeled L1 at t asymp 25 ms and correspondsto the equalized transfer function σ(ω) (Note that the25 ms arrival time corresponds to buffering delays be-tween the sweep and response in the measurement sys-tem) This energy propagates down the length of the tubeand is perfectly reflected from the closed end returning tothe speaker and co-located microphone at t asymp 14 ms The
1098
Smyth Abel Estimating waveguide model elements ACTA ACUSTICA UNITED WITH ACUSTICAVol 95 (2009)
arrival L2 is reflected from the speaker and the observedpulse L2 is the sum of the incoming and speaker-reflectedwaves The pulse makes another round trip eventuallyproducing the sequence of consecutive equally spacedpulses observed in Figure 7 There is an attenuation ofthe pulse upon each successive reflection There is alsoan observable low-pass filtering as the signal becomes in-creasingly smooth and widened with every reflection (Fig-ure 7)
Given the arrival responses for a closed cylinder Ln thetransfer function of the reflection from the speaker maybe estimated The first arrival which is the output of thespeaker measured at the mic consists solely of the speakertransfer function
L1 = σ(ω) (21)
The following arrival L2 consists of the sum of leftand right traveling pressure waves at the microphone po-sition the speaker transfer function after having trav-elled twice the length of the tube (round trip) given byLminus
2 = σ(ω)λ2(ω) and the speaker transfer function withround trip losses after reflecting from the speaker L+
2 =σ(ω)λ2(ω)ρ(ω) The second arrival is expressed as theirsum and is given by
L2 = L+2 + Lminus
2 = σ(ω)λ2(ω) 1 + ρ(ω) (22)
Each subsequent arrival for the closed cylinder consists ofthe previous arrival with round-trip wall losses of λ2(ω)and a speaker reflection ρ(ω) The third arrival is thereforegiven by
L3 = σ(ω)λ4(ω)ρ(ω) 1 + ρ(ω) (23)
These three responses are sufficient for defining the inter-mediate variable
ζ(ω) =L1L3
(L2)2=
ρ(ω)1 + ρ(ω)
(24)
which yields an estimate for the speaker reflection transferfunction
ρ(ω) =ζ(ω)
1 minus ζ(ω) (25)
and the propagation loss λ(ω)
λ2(ω) =L3
ρ(ω)L2 (26)
Figure 8 shows the estimated and theoretical propaga-tion loss along with the estimated speaker reflection Notethe good agreement between the estimated and theoreti-cal propagation losses The low-frequency attenuation ob-served in the spectrum of the speaker reflection is likelydue to the speaker being designed to be resonant at lowfrequencies It should be pointed out that there is roughlya fraction of a dB attenuation in the estimated propagationloss beyond that theoretically predicted
0 5 10 15 20 25 30 35 40 45 50-02
0
02
04
06
08
1
12
time - milliseconds
amplitude
L 1 = σ (ω)
L2 = σ (ω)λ 2(ω)(1 + ρ(ω))
L 3 = σ (ω)λ 4(ω)ρ(ω)(1 + ρ(ω))
Figure 7 Arrival responses for the closed cylinder showing in-dividual pulses and corresponding spectra as combinations oftransfer functions for the speaker σ(ω) wall losses λ(ω) andspeaker reflection ρ(ω)
10-1
100
101
-25
-20
-15
-10
-5
0
frequency - kHz
magnitude-dB
estimated
theoretical
estimated speaker reflection
Figure 8 Theoretical (upper smooth curve) and estimated (lowercurve 05 dB down) propagation losses along with the estimatedspeaker reflection (high-pass curve)
42 Open cylinder
The open-end reflection transfer function Rop(ω) maybe estimated from the open cylinder impulse responseshown in Figure 9 The low-pass characteristic describedby Levine and Schwinger is apparent in the successive ar-rivals which are increasingly smeared over time comparedto their closed-end counterpart shown in Figure 7 Succes-sive arrivals show the same propagation delay as observedfor the closed cylinder but in this case with every other re-flection inverted and with increased attenuation and low-pass filtering with each consecutive reflection (Figure 9)This is expected as the responses Yn have all the lossesof the closed cylinder (propagation and speaker reflectionlosses) with the added effect of the open-end reflection
As with the closed cylinder the initial response of thismeasurement is merely the response of the speaker to an
1099
ACTA ACUSTICA UNITED WITH ACUSTICA Smyth Abel Estimating waveguide model elementsVol 95 (2009)
0 5 10 15 20 25 30 35 40 45 50-06
-04
-02
0
02
04
06
08
1
time - milliseconds
amplitude
Y3 = σ (ω)λ 4(ω)R 2op(ω)ρ(ω)(1 + ρ(ω))
Y1 = σ (ω)
Y2 = σ (ω)λ 2(ω)R op(ω)(1 + ρ(ω))
Figure 9 Measured impulse response for the open cylinder show-ing individual arrivals The open-end transfer function Rop(ω)may be isolated by comparison with the corresponding closed-end arrival spectra L2 L3 L4
impulse yielding the speaker transfer function Y1 = σ(ω)The second arrival Y2 is similar toL2 but also includes theopen-end reflection
Y2 = σ(ω)λ2(ω)Rop(ω) 1 + ρ(ω) (27)
Subsequent arrival responses include additional round-tripwall losses and open-end reflections The open-end reflec-tion function may then be estimated as the ratio of the sec-ond arrival spectra
Rop(ω) =Y2
L2 (28)
and is seen in Figure 10
43 Closed cylicone
Attaching a conical flare to the cylindrical tube and termi-nating with a spherical cap to ensure a perfect reflectionallows for estimation of the reflection and transmission fil-ters associated with the junction
Figure 11 shows the measured impulse response in-cluding groups of arrivals resulting from energy reflectedbetween the end cap and the junction Consider the indi-vidual subarrivals within the second arrival group A2 ofFigure 11 The signal from the speaker propagates alongthe length of the cylinder to the junction where part of thesignal is reflected back to the microphone and inverted (ascan be seen from (10) where if Z1(ω) gt Z2(ω) the re-flection R(ω) picks up a negative sign) It appears as thenegative pulse A21 with losses having a low-pass char-acteristic described by Ry(ω) as well as round-trip walllosses given by λ2
y(ω) The part of the signal that is not re-flected is transmitted through the junction with losses hav-ing a complementary high-pass characteristic Ty(ω) Thissignal propagates to the spherical termination where it isldquoperfectlyrdquo reflected arriving back at the junction a short
10-1
100
101
-12
-10
-8
-6
-4
-2
0
2
4
frequency - kHz
magnitude-dB
estimated (upper undulating line)
approximate theoretical (lower line)
Figure 10 Estimated and approximate theoretical open-endcylinder reflection magnitude The theoretical reflection magni-tude is a first-order approximation that captures the general low-pass characteristic Note that the estimated reflection magnitudeis greater than one at low-frequencies where the speaker doesnrsquotgenerate significant power and more measurement noise is in-troduced The measurement matches the approximate theoreticalcurve above 2 kHz and within a fraction of a dB otherwise
0 5 10 15 20 25 30 35 40 45 50-04
-02
0
02
04
06
08
1
time - milliseconds
amplitude
A 2 = (see expansion below)
A 1 = σ (ω)
A3 =
12 14 16 18 20 22 24-04
-02
0
02
04
time - milliseconds
amplitude
A 21 = σ (ω)λ 2y(ω)R y(ω)(1 + ρ(ω))
A 22 = σ (ω)λ 2y(ω)λ
2n(ω)Ty(ω)Tn(ω)(1 + ρ(ω))
Figure 11 Arrival responses are shown with their correspond-ing transfer functions The response A21 shows a low-pass char-acteristic expected of a junction reflection while A22 shows ahigh-pass characteristic expected of two transmissions throughthe junction
time later (corresponding to twice the length of the cone)Part of this signal at the junction is transmitted with trans-fer function Tc(ω) producing the pulse at t asymp 15 ms (A22
in Figure 11) and part is reflected with transfer function
1100
Smyth Abel Estimating waveguide model elements ACTA ACUSTICA UNITED WITH ACUSTICAVol 95 (2009)
2 3 4 5 6 7-05
0
05
1
15
2
25
3
time - milliseconds
amplitude
Figure 12 Measured (lower line) theoretical (thick line offset by10) and components (upper lines offset by 025) for closed conesecond arrival group corresponding to A2i
Rc(ω) Note the doublet nature of the pulse A22 withthe steep transition from a positive to a negative peak be-ing consistent with the high-pass transmission through thejunction The part of the pulse reflected back toward theend cap will appear at the junction to be in part transmit-ted to the cylinder and microphone and in part reflectedonce again toward the end cap
The first subarrival spectrum is
A21 = σ(ω)λ2y(ω)Ry(ω) 1 + ρ(ω) (29)
with subsequent ith arrivals having spectrum
A2i = σ(ω)λ2y(ω)λ2i
n (ω)
middot Ty(ω)Tn(ω)Riminus1n (ω) 1 + ρ(ω) (30)
The individual subarrivals shown in Figure 12 were gener-ated according to (30) using the transmission and reflec-tion filters described in section 2 for the 45o cone andone-centimeter radius cylinder measured The subarrivalsare summed to form the theoretical arrival group shownin Figure 12 Note the good agreement between the the-oretical and measured responses It should be pointed outthat the estimation of the junction transmission and reflec-tion filters in this case is complicated somewhat by theoverlapping nature of the subarrivals Rather than fix thereflection and transmission filters by analyzing individualarrivals hypothesized filters are used to generate the entirearrival group and then adjusted to produce the group bestmatching the one measured
44 Open cylicone
Opening the end of the cone produces an impulse responsewith similar behaviour as for the closed cylicone thoughbecause it is open the cone termination reflections are in-verted and attenuated A positive pulse traveling from thespeaker to the junction is partly inverted upon reflection
0 5 10 15 20 25 30 35 40 45 50-04
-02
0
02
04
06
08
1
time - milliseconds
amplitude
N 3 =
N 2 = (see expansion below)
N 1 = σ (ω)
12 14 16 18 20 22 24 26-04
-03
-02
-01
0
01
time - milliseconds
amplitude
N 22 = σ (ω)λ 2y(ω)λ
2n(ω)Ty(ω)Tn(ω)R op(ω)(1 + ρ(ω))
N 21 = σ (ω)λ 2y(ω)R y(ω)(1 + ρ(ω))
Figure 13 Arrival responses for the open cylicone showing in-dividual pulses corresponding to outputs of a combinations oftransfer functions
arriving at the microphone as a negative pulse and partlytransmitted through the junction this time being invertedat the open cone termination reflection When the negativepulse arrives at the junction a part is transmitted as a neg-ative pulse to the microphone and a part is reflected as apositive pulse back to the open cone termination where itis again inverted becoming negative The negative pulsepropagates back to the junction where it is partly transmit-ted to the microphone and partly reflected and invertedand so on
Figure 13 shows the measured impulse response for theopen cylicone Like the closed cylicone it exhibits a se-quence of arrival groups The N2 subarrival spectra maybe written in terms of the closed cylicone subarrival spec-tra
N2i = A2iRiminus1op (ω) (31)
Approximating the reflection from the open cone as a first-order low-pass filter with characteristic closely matchingboth observed measurement and that described by Levineand Schwinger (15) for a cylindrical radius equal to theaverage of the conersquos edge radii a1 and a2 a theoreticalarrival response is shown in Figure 14 along with its com-ponent subarrivals and the measured N2 arrival group Asin the case of the closed cylicone there is good agreementbetween the measured and theoretical responses
5 Results and conclusions
In this work a measurement technique was presented forestimating elements comprising a waveguide wind instru-
1101
ACTA ACUSTICA UNITED WITH ACUSTICA Smyth Abel Estimating waveguide model elementsVol 95 (2009)
2 3 4 5 6 7-05
0
05
1
15
2
25
3
time - milliseconds
amplitude
Figure 14 Measured (lower line) theoretical (thick line offsetby 10) and components (upper lines offset by 025) for the opencone second arrival corresponding to N22
ment model including filters used in propagation scatter-ing and termination The technique measures the impulseresponse between the mouthpiece end of the instrumentand a co-located microphone By comparing correspond-ing arrivals for different configurations modeled reflec-tion transmission and loss filters may be identified Tovalidate the measurement technique it was applied to asimple instrument configuration having a cylindrical boreconnected to a conical bell The estimated filters and im-pulse response was seen to closely match the theory giv-ing confidence that the measurement method can be gen-erally applied
To confirm the good agreement between the measuredand theoretical reflection transmission and propagationelements waveguide models of the four tube configura-tions were implemented based on cylinder and cone di-mensions Figure 15 shows a close match between mea-sured and theoretically-derived waveguide model impulseresponses for each of the tube configurations
This work will facilitate the development of filter com-ponents for which theoretical solutions may not be avail-able In particular reflection and transmission functions ofwind instrument bores bells and mouthpieces can be mea-sured by comparing the response of a rigidly terminatedtube to that of the tube with the instrument or instrumentsection affixed
Acknowledgments
We would like to sincerely thank Theresa Leonard and theBanff Centre for the Arts for the use of their facilities JohnLundell Carr Wilkerson Michael Coury and HarrisonSmith for their help in fabricating the experimental setupand the Natural Sciences and Engineering Research Coun-cil of Canada (NSERC) for their support Many thanks arealso extended to the reviewers whose careful reading ofthis text and invaluable comments have greatly strength-ened the clarity and accuracy of this work
0 5 10 15 20 25 30 35 40 45 50
0
2
4
6
8
10
time - milliseconds
amplitude
Closed Cylinder
M
T
Open Cylinder
M
T
Closed Cylicone
M
T
Open Cylicone
M
T
Figure 15 Measured and theoretically-derived impulse responsefor (from bottom to top) a closed cylinder an open cylinder aclosed cylicone and an open cylicone
References
[1] J O Smith Digital waveguide modeling of musical instru-ments www-ccrmastanfordedu˜joswaveguide 2003last viewed 1242008
[2] V Vaumllimaumlki Discrete-time modeling of acoustic tubes us-ing fractional delay filters Dissertation Helsinki Univer-sity of Technology Faculty of Electrical Engineering Lab-oratory of Acoustic and Audio Signal Processing EspooFinland 1995 Report no 37
[3] D P Berners Acoustics and signal processing techniquesfor physical modeling of brass instruments DissertationStanford University Stanford California July 1999
[4] A H Benade On the propagation of sound waves in acylindrical conduit Journal of the Acoustical Society ofAmerica 44 (1968) 616ndash623
[5] D H Keefe Acoustical wave propagation in cylindricalducts Transmission line approximation for isothermal and
1102
Smyth Abel Estimating waveguide model elements ACTA ACUSTICA UNITED WITH ACUSTICAVol 95 (2009)
nonisothermal boundary conditions Journal of the Acous-tical Society of America 75 (Januaray 1984) 58ndash62
[6] J Abel T Smyth J O Smith A simple accurate wall lossfilter for acoustic tubes DAFX 2003 Proceedings LondonUK September 2003 International Conference on DigitalAudio Effects 53ndash57
[7] X Rodet C Vergez Physical models of trumpet-like in-struments Detailed behavior and model improvementsProceedings of ICMC 1996 Clear Water Bay Hong-KongAugust 1996 International Computer Music Conference
[8] AHBenade MIIbisi Survey of impedance methods anda new piezo-disk-driven impedance head for air columnsJournal of the Acoustical Society of America 81 (April1987) 1152ndash1167
[9] JKergomard RCausseacute Measurement of acoustic impe-dance using a capillary An attempt to achieve optimiza-tion Journal of the Acoustical Society of America 79(April 1986) 1129ndash1140
[10] T Ossman H Pichler G Widholm Bias A computer-aided test system for brass wind instruments Audio En-gineering Society Preprint October 1989
[11] J Epps JRSmith JWolfe A novel instrument to mea-sure acoustic resonances of the vocal tract during phona-tion Measurement Science and Technology 8 (July 1997)1112ndash1121
[12] M M Sondhi J Resnick The inverse problem for the vo-cal tract Numerical methods acoustical experiments andspeech synthesis Journal of the Acoustical Society ofAmerica 73 (March 1983) 985ndash1002
[13] J Agulloacute S Cardona D H Keefe Time-domain deconvo-lution to measure reflection functions for discontinuities in
waveguides Journal of the Acoustical Society of America97 (March 1995) 1950ndash1957
[14] V Vaumllimaumlki B Hernoux J Huopaniemi M KarjalainenMeasurement and analysis of acoustic tubes using signalprocessing techniques Finnish Signal Processing Sympo-sium (FINSIGrsquo95) Espoo Finland June 1995
[15] D B Sharp Acoustic pulse reflectometry for the measure-ment of musical wind instruments Dissertation Universityof Edinburgh 1996
[16] A Farina Simultaneous measurement of impulse responseand distortion with a swept-sine technique Proceedings ofthe 108th AES Convention Paris France February 200018ndash22
[17] A Lefebvre G Scavone J Able A Buckiewicz-SmithA comparison of impedence measurements using one andtwo microphones Proceedings of ISMA 2007 BarcelonaSpain September 2007 International Symposium on Mu-sical Acoustics
[18] A Lefebvre La mesure de lrsquoimpeacutedance acoustique du sax-ophone alto Diploma Thesis Eacutecole Polytechnique deMontreacuteal 2006
[19] T Smyth J Abel Convolutional synthesis of wind instru-ments Proceedings of the IEEE Workshop on Applica-tions of Signal Processing to Audio and Acoustics (WAS-PAArsquo07) New Paltz New York October 2007
[20] J O Smith Physical audio signal processing for virtualmusical instruments and audio effects December 2008httpccrmastanfordedu˜jospasp
[21] H Levine J Schwinger On the radiation of sound from anunflanged circular pipe Phys Rev 73 (1948) 383ndash406
1103
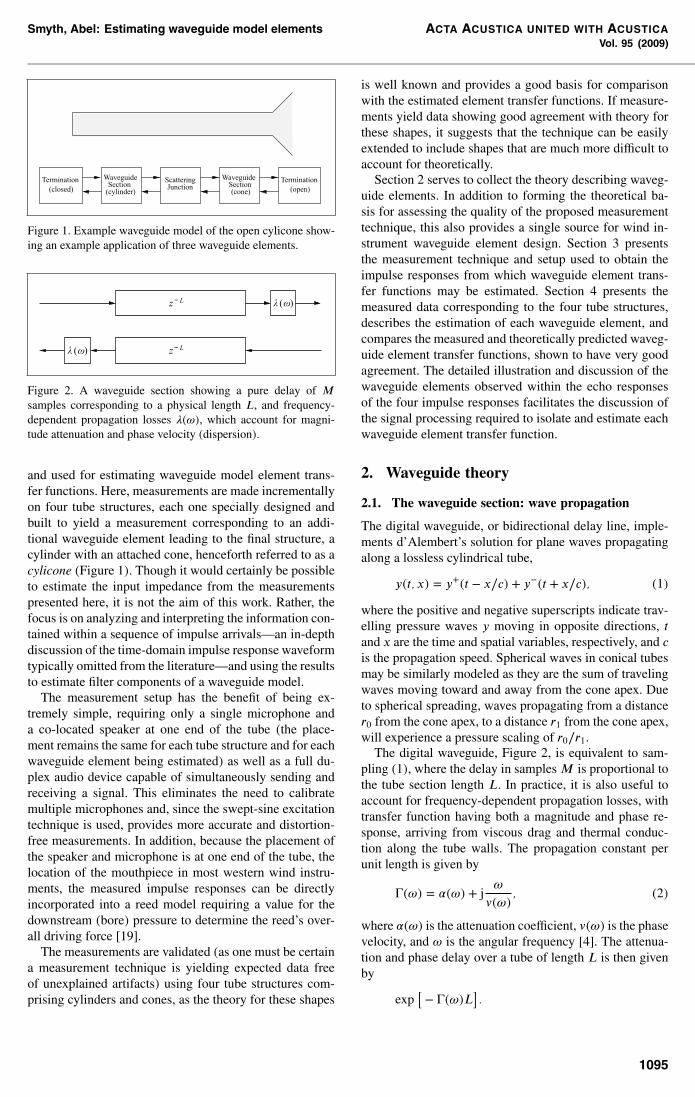
Smyth Abel Estimating waveguide model elements ACTA ACUSTICA UNITED WITH ACUSTICAVol 95 (2009)
(closed)
WaveguideSection(cylinder)
ScatteringJunction
WaveguideSection(cone)
Termination
(open)
Termination
Figure 1 Example waveguide model of the open cylicone show-ing an example application of three waveguide elements
λ (ω)zminus L
zminus Lλ (ω)
Figure 2 A waveguide section showing a pure delay of Msamples corresponding to a physical length L and frequency-dependent propagation losses λ(ω) which account for magni-tude attenuation and phase velocity (dispersion)
and used for estimating waveguide model element trans-fer functions Here measurements are made incrementallyon four tube structures each one specially designed andbuilt to yield a measurement corresponding to an addi-tional waveguide element leading to the final structure acylinder with an attached cone henceforth referred to as acylicone (Figure 1) Though it would certainly be possibleto estimate the input impedance from the measurementspresented here it is not the aim of this work Rather thefocus is on analyzing and interpreting the information con-tained within a sequence of impulse arrivalsmdashan in-depthdiscussion of the time-domain impulse response waveformtypically omitted from the literaturemdashand using the resultsto estimate filter components of a waveguide model
The measurement setup has the benefit of being ex-tremely simple requiring only a single microphone anda co-located speaker at one end of the tube (the place-ment remains the same for each tube structure and for eachwaveguide element being estimated) as well as a full du-plex audio device capable of simultaneously sending andreceiving a signal This eliminates the need to calibratemultiple microphones and since the swept-sine excitationtechnique is used provides more accurate and distortion-free measurements In addition because the placement ofthe speaker and microphone is at one end of the tube thelocation of the mouthpiece in most western wind instru-ments the measured impulse responses can be directlyincorporated into a reed model requiring a value for thedownstream (bore) pressure to determine the reedrsquos over-all driving force [19]
The measurements are validated (as one must be certaina measurement technique is yielding expected data freeof unexplained artifacts) using four tube structures com-prising cylinders and cones as the theory for these shapes
is well known and provides a good basis for comparisonwith the estimated element transfer functions If measure-ments yield data showing good agreement with theory forthese shapes it suggests that the technique can be easilyextended to include shapes that are much more difficult toaccount for theoretically
Section 2 serves to collect the theory describing waveg-uide elements In addition to forming the theoretical ba-sis for assessing the quality of the proposed measurementtechnique this also provides a single source for wind in-strument waveguide element design Section 3 presentsthe measurement technique and setup used to obtain theimpulse responses from which waveguide element trans-fer functions may be estimated Section 4 presents themeasured data corresponding to the four tube structuresdescribes the estimation of each waveguide element andcompares the measured and theoretically predicted waveg-uide element transfer functions shown to have very goodagreement The detailed illustration and discussion of thewaveguide elements observed within the echo responsesof the four impulse responses facilitates the discussion ofthe signal processing required to isolate and estimate eachwaveguide element transfer function
2 Waveguide theory
21 The waveguide section wave propagation
The digital waveguide or bidirectional delay line imple-ments drsquoAlembertrsquos solution for plane waves propagatingalong a lossless cylindrical tube
y(t x) = y+(t minus xc) + yminus(t + xc) (1)
where the positive and negative superscripts indicate trav-elling pressure waves y moving in opposite directions tand x are the time and spatial variables respectively and cis the propagation speed Spherical waves in conical tubesmay be similarly modeled as they are the sum of travelingwaves moving toward and away from the cone apex Dueto spherical spreading waves propagating from a distancer0 from the cone apex to a distance r1 from the cone apexwill experience a pressure scaling of r0r1
The digital waveguide Figure 2 is equivalent to sam-pling (1) where the delay in samples M is proportional tothe tube section length L In practice it is also useful toaccount for frequency-dependent propagation losses withtransfer function having both a magnitude and phase re-sponse arriving from viscous drag and thermal conduc-tion along the tube walls The propagation constant perunit length is given by
Γ(ω) = α(ω) + jω
v(ω) (2)
where α(ω) is the attenuation coefficient v(ω) is the phasevelocity and ω is the angular frequency [4] The attenua-tion and phase delay over a tube of length L is then givenby
exp minus Γ(ω)L
1095
ACTA ACUSTICA UNITED WITH ACUSTICA Smyth Abel Estimating waveguide model elementsVol 95 (2009)
Table I Molecular constants evaluated at 2685oC as providedby [4]
Symbol Values Units
Air density ρ 118 times 10minus3 gcm2
Viscosity η 185 times 10minus4 g(s cm)(Prandtl)
12 ν 0841
Ratio ofspecific heats γ = CpCv 140Free spacesound speed c 347 times 104 cms
Denoting by λ(ω) the one-way loss transfer function andby Lc the one-way propagation time the propagationloss is given by exp[minusjωLc] middot λ(ω) where
λ(ω) = exp minus α(ω)L minus jωL(1v(ω) minus 1c) (3)
An approximation to the phase velocity valid for all tuberadii is [6]
v(ω) asymp cAvrv (1 + rvκ)
1 + Avrv (Bv + rvκ) (4)
where rv is the ratio of the pipe radius a to the thickness ofthe viscous boundary layer given by
rv = aη
ωρ
minus 12
(5)
and the parameters Av and Bv given by
Av =1
2radicγ Bv = 1 +
[1 + (γ minus 1)ν)]radic2κ
(6)
were selected to match the limiting phase velocity behav-ior and the parameter
κ = 2γ (7)
marks the ratio rv delimiting the small-radius and large-radius tube regions [6] The molecular constants in (5) and(6) are defined in Table I and suggested values are pro-vided
Similarly an approximation to the attenuation coeffi-cient is
α(ω) asymp ω
crv
Aα + Bα (rvκ)1 + rvκ
(8)
where the parameters Aα and Bα were again selected tomatch the limiting attenuation coefficient behavior and aregiven by
Aα = 2 γ Bα =1 + (γ minus 1)ν
radic2
(9)
Figure 3 shows the approximations for phase velocityand attenuation as given by (4) and (8) along with theircomplete and limiting behaviors as given by Benade [4]
100
101
10-1
100
PhaseVelocityc
100
101
10-5
10-4
10-3
Boundary Layer Thickness Ratio (rv)
AttenuationFrequency
Figure 3 Modeled (solid) phase velocity (top) and attenuation(bottom) and their complete and limiting behavior (dashed)
T2(ω)
R 1(ω) R 2(ω)
T1(ω)
Figure 4 Scattering A change of impedance may occur as a two-port scattering junction between two waveguide sections con-sisting of frequency-dependent reflection R12(ω) and amplitudecomplementary transmission T12(ω)
R (ω)
T (ω)
R (ω)
Closed Open
Figure 5 Termination A change of impedance in a waveguidesection may occur as a termination closed with reflection oropen with a reflection R(ω) and corresponding complementarytransmission
22 Scattering reflection and transmission
Any change of impedance which may be the result of atermination (either open or closed as discussed in the fol-lowing section 23) a change in the tubersquos cross-sectionalarea or a connection to another acoustic element requiresfiltering to account for the frequency-dependent reflec-tion R12(ω) and amplitude complementary transmissionT12(ω) that will result between two adjacent waveguidesections (see Figure 4) or at a termination (see Figure 5)
1096
Smyth Abel Estimating waveguide model elements ACTA ACUSTICA UNITED WITH ACUSTICAVol 95 (2009)
A change in the wave impedance at the boundary be-tween two tube elements will result in a reflection withtransfer function
R(ω) =Z2(ω)Z1(ω) minus 1Z2(ω)Z1(ω)lowast + 1
(10)
where Z1 and Z2 denote the adjacent wave impedancesand lowast indicates the complex conjugate The amplitudecomplementary transmission transfer function is given by
T (ω) = 1 + R(ω) (11)
for pressure waves [20]For plane waves in cylindrical tubes (as denoted by the
y subscript) the impedance is given by
Zy =ρc
S (12)
where S is the cross-sectional area of the tubeFor spherical pressure waves in conical tubes (as de-
noted by the n subscript) propagating away from the coneapex (denoted by the + superscript) the impedance is de-pendent on frequency ω and the distance r from the obser-vation point to the cone apex and is given by
Z+n (rω) =
ρc
S
jωjω + cr
(13)
For spherical waves propagating toward the cone apex theimpedance is given by
Zminusn (rω) =
ρc
S
jωjω minus cr
= Z+lowastn (rω) (14)
23 Termination reflection and transmission
A special case of a change in cross section is at the in-strumentrsquos open end In this case the complex terminat-ing impedance Z2(ω) = ZL(ω) may be a complicatedfunction of frequency In the case of a cylindrical tube anexpression is available by Levine and Schwinger in termsof Bessel and Struve functions [21] There is no knownexpression for conical bores
The ratio ZLZ1 may be approximated by
ZLZ1 asympjka
ζ + jka (15)
where k = ωc is the wavenumber a is the radius of thecylinder and ζ is a scalar near one which determines thetransition between the low-frequency and high-frequencybehaviour The expression (15) follows the gross be-haviour described by Levine and Schwinger The reflec-tion filter for the open end on a cylindrical tube may thenbe approximated by
Rop(ω) =ZLZ1 minus 1ZLZ1 + 1
=minus1
1 + 2jkaζ (16)
yielding a one-pole low-pass filter with a cutoff frequencyof ω = ζca
cylinder speakerminusclosed
cylinder speakerminusopen
2 meters
cylicone speakerminusclosed
cylicone speakerminusopen
1)
2)
3)
4)
Figure 6 Four simple tube structures each terminated at one endwith a speaker and having a co-located microphone The follow-ing terminations are applied at the end opposite the speaker andmicrophone 1) a cylinder closed with Lucite to ensure a perfectreflection (cylinder speaker-closed) 2) an open cylinder (cylin-der speaker-open) 3) a cylicone terminated with a glass sphere(with radius nearly that of the cone) ensuring a perfect reflectionof spherical waves (cylicone speaker-closed) 4) an open cyli-cone (cylicone speaker-closed)
3 Measurement configuration
To isolate each of the waveguide model elements seen inFigure 1 a test signal a swept sinusoid similar to thatdescribed by Farina [16] was input through a speaker atone end of four tube configurations a cylindrical tube andthe cylinder with an attached conical flare (cylicone) eachmeasured with the end opposite the speaker closed thenopen (see Figure 6)1 Cylinder closed end A two-meter-long cylinder is
rigidly terminated at one end to ensure a perfect re-flection This configuration allows measurement of thespeaker output σ(ω) the speaker reflection ρ(ω) andthe wall loss λ(ω) transfer functions as described insection 41 The arrival responses Ln for this measure-ment may be seen in Figure 7
2 Cylinder open end Opening the cylinder allows mea-surement of the reflection at the open end of a cylinderRop(ω) as described in section 42 Figure 9 shows themeasured responses
3 Cylicone closed end The addition of a conical flarewith a spherical termination (to ensure a perfect reflec-tion) to the above cylindrical tube allows reflection andtransmission at the junction to be observed from themeasured responses shown in Figure 11 as describedin section 43
4 Cylicone open end Opening the conical end allows usto observe the corresponding reflection from the cyli-cone response shown in Figure 13 as described in sec-tion 44
1097
ACTA ACUSTICA UNITED WITH ACUSTICA Smyth Abel Estimating waveguide model elementsVol 95 (2009)
As described below by using a long swept sinusoid to ob-tain a system impulse response for each structure the sys-tem is excited with sufficient energy to achieve a signif-icantly larger SNR than could be obtained with a simplepulse while achieving the bandwidth of interest in thiscase up to 10kHz The impulse responses measured herehave a peak level roughly 70 dB above the noise floorstandard deviation There is no limit to the duration of theswept sinusoid ie itrsquos length is not bounded by the mi-crophone placement the length of the tube or any otherpotential for overlap between signal and reflections seenin other methods since the signal recorded at the micro-phone is processed to produce the response of the systemhad it been excited with a pulse only one sample long
The test signal used was a sinusoid exponentially sweptfrom 20 Hz to the band edge of 2205 kHz (half the sam-pling rate fs) and with a duration of 220 samples or about23 seconds Expressed mathematically the sine sweep isgiven by
s(t) = sin φ(t) φ(t) =t
0ω(τ) dτ (17)
where the frequency ω(t) traces out an exponential sweep
ω(t) = 2πf0eηt (18)
where η = ln(f02fs)T with fs being the sampling ratef0 the initial frequency and T the duration of the sweep
A sine sweep was repeated so that the measured re-sponse during the second sweep would be the circular con-volution of the input sweep with the system In particularto recover the system impulse response from the sweep re-sponse circular deconvolution may be used Denoting byr(t) the system response during the second sweep we have
h(t) = Fminus1 Fr(t) Fs(t) (19)
whereF denotes the Fourier Transform Expressed in Mat-lab code the impulse response h may be found with
h = ifft fft(r)fft(s) (20)
where s contains the sine sweep and r is the system re-sponse during the second sine sweep
The input signal and the measured response is sent andreceived simultaneously using a full duplex audio devicein this work the Mac PowerBook running Logic Pro withthe MOTU Traveler audio interface with 16-bit audio at asampling rate of 441 kHz was used Measurements weretaken in a very large room with the apparatus placed fivemeters from the nearest reflecting object
The four simple tube structures in Figure 6 were assem-bled using PVC tubes and plastic funnels of several sizesThe cylinder was prepared by placing a speaker (CUI IncCMS0281KLX) at one end and by press fitting a six-millimeter-diameter microphone (Panasonic W64M) intoa hole drilled next to the speaker It is not necessary toconsider or document the precise details of the speaker
and microphone as long as their placement and geome-try is consistent from one measurement to the next Anyeffects of placement and geometry are eliminated by thesignal normalization and post processing described in thefollowing section It is important however that the mi-crophone and speaker be placed as close as possible toeach other to minimize the acoustic travel time betweenthem In this way the corresponding frequency at whichdestructive interference occurs between the signal travel-ing from speaker to microphone and that returning fromthe bore is made large Destructive interference will resultin a notch in the transfer function and will impact the abil-ity to take the spectral ratios described in section 4 at thatfrequency In this case the distance between the micro-phone and speaker is sufficiently small to ensure that anyspectral nulls would be outside the 10 kHz band of interest
The cylinder is 2 m long with an inside radius a = 1 cmand the cone is 127 cm long with edge radii of a1 = 1 cmand a2 = 92 cm Both cylinder and cone are sufficientlythick to be considered rigid (3 mm and 2 mm respec-tively)
The impulse response between the speaker and mi-crophone was measured for each of the configurationsThe impulse responses were then equalized according tothe first arrival the speaker-microphone transfer functionσ(ω) to produce the figures shown in section 4 Note thatthe first arrival will also contain contributions from evanes-cent modes in this case above about 10kHz
4 Measured responses
In spite of the wide use of digital waveguides for soundsynthesis it is perhaps less common to observe the be-haviour of wave propagation in actual acoustic systemsfrom the same perspective That is rather than analyzing asystem purely from its frequency response it is informa-tive for analysis and practical for synthesis to observe theeffects of each waveguide element in a sequence of multi-ple arrivals comprising the system impulse response
41 Closed cylinder
A first measurement is taken for the cylinder closed atthe end opposite the speaker ensuring a perfect reflec-tion Comparing arrivals appearing in its impulse responseprovides estimates of the propagation loss λ(ω) speakertransfer function σ(ω) and the speaker reflection functionρ(ω)
The first four arrivals comprising the measured speaker-microphone impulse response are shown in Figure 7 Thedirect path speaker-microphone response is observed as apositive pulse labeled L1 at t asymp 25 ms and correspondsto the equalized transfer function σ(ω) (Note that the25 ms arrival time corresponds to buffering delays be-tween the sweep and response in the measurement sys-tem) This energy propagates down the length of the tubeand is perfectly reflected from the closed end returning tothe speaker and co-located microphone at t asymp 14 ms The
1098
Smyth Abel Estimating waveguide model elements ACTA ACUSTICA UNITED WITH ACUSTICAVol 95 (2009)
arrival L2 is reflected from the speaker and the observedpulse L2 is the sum of the incoming and speaker-reflectedwaves The pulse makes another round trip eventuallyproducing the sequence of consecutive equally spacedpulses observed in Figure 7 There is an attenuation ofthe pulse upon each successive reflection There is alsoan observable low-pass filtering as the signal becomes in-creasingly smooth and widened with every reflection (Fig-ure 7)
Given the arrival responses for a closed cylinder Ln thetransfer function of the reflection from the speaker maybe estimated The first arrival which is the output of thespeaker measured at the mic consists solely of the speakertransfer function
L1 = σ(ω) (21)
The following arrival L2 consists of the sum of leftand right traveling pressure waves at the microphone po-sition the speaker transfer function after having trav-elled twice the length of the tube (round trip) given byLminus
2 = σ(ω)λ2(ω) and the speaker transfer function withround trip losses after reflecting from the speaker L+
2 =σ(ω)λ2(ω)ρ(ω) The second arrival is expressed as theirsum and is given by
L2 = L+2 + Lminus
2 = σ(ω)λ2(ω) 1 + ρ(ω) (22)
Each subsequent arrival for the closed cylinder consists ofthe previous arrival with round-trip wall losses of λ2(ω)and a speaker reflection ρ(ω) The third arrival is thereforegiven by
L3 = σ(ω)λ4(ω)ρ(ω) 1 + ρ(ω) (23)
These three responses are sufficient for defining the inter-mediate variable
ζ(ω) =L1L3
(L2)2=
ρ(ω)1 + ρ(ω)
(24)
which yields an estimate for the speaker reflection transferfunction
ρ(ω) =ζ(ω)
1 minus ζ(ω) (25)
and the propagation loss λ(ω)
λ2(ω) =L3
ρ(ω)L2 (26)
Figure 8 shows the estimated and theoretical propaga-tion loss along with the estimated speaker reflection Notethe good agreement between the estimated and theoreti-cal propagation losses The low-frequency attenuation ob-served in the spectrum of the speaker reflection is likelydue to the speaker being designed to be resonant at lowfrequencies It should be pointed out that there is roughlya fraction of a dB attenuation in the estimated propagationloss beyond that theoretically predicted
0 5 10 15 20 25 30 35 40 45 50-02
0
02
04
06
08
1
12
time - milliseconds
amplitude
L 1 = σ (ω)
L2 = σ (ω)λ 2(ω)(1 + ρ(ω))
L 3 = σ (ω)λ 4(ω)ρ(ω)(1 + ρ(ω))
Figure 7 Arrival responses for the closed cylinder showing in-dividual pulses and corresponding spectra as combinations oftransfer functions for the speaker σ(ω) wall losses λ(ω) andspeaker reflection ρ(ω)
10-1
100
101
-25
-20
-15
-10
-5
0
frequency - kHz
magnitude-dB
estimated
theoretical
estimated speaker reflection
Figure 8 Theoretical (upper smooth curve) and estimated (lowercurve 05 dB down) propagation losses along with the estimatedspeaker reflection (high-pass curve)
42 Open cylinder
The open-end reflection transfer function Rop(ω) maybe estimated from the open cylinder impulse responseshown in Figure 9 The low-pass characteristic describedby Levine and Schwinger is apparent in the successive ar-rivals which are increasingly smeared over time comparedto their closed-end counterpart shown in Figure 7 Succes-sive arrivals show the same propagation delay as observedfor the closed cylinder but in this case with every other re-flection inverted and with increased attenuation and low-pass filtering with each consecutive reflection (Figure 9)This is expected as the responses Yn have all the lossesof the closed cylinder (propagation and speaker reflectionlosses) with the added effect of the open-end reflection
As with the closed cylinder the initial response of thismeasurement is merely the response of the speaker to an
1099
ACTA ACUSTICA UNITED WITH ACUSTICA Smyth Abel Estimating waveguide model elementsVol 95 (2009)
0 5 10 15 20 25 30 35 40 45 50-06
-04
-02
0
02
04
06
08
1
time - milliseconds
amplitude
Y3 = σ (ω)λ 4(ω)R 2op(ω)ρ(ω)(1 + ρ(ω))
Y1 = σ (ω)
Y2 = σ (ω)λ 2(ω)R op(ω)(1 + ρ(ω))
Figure 9 Measured impulse response for the open cylinder show-ing individual arrivals The open-end transfer function Rop(ω)may be isolated by comparison with the corresponding closed-end arrival spectra L2 L3 L4
impulse yielding the speaker transfer function Y1 = σ(ω)The second arrival Y2 is similar toL2 but also includes theopen-end reflection
Y2 = σ(ω)λ2(ω)Rop(ω) 1 + ρ(ω) (27)
Subsequent arrival responses include additional round-tripwall losses and open-end reflections The open-end reflec-tion function may then be estimated as the ratio of the sec-ond arrival spectra
Rop(ω) =Y2
L2 (28)
and is seen in Figure 10
43 Closed cylicone
Attaching a conical flare to the cylindrical tube and termi-nating with a spherical cap to ensure a perfect reflectionallows for estimation of the reflection and transmission fil-ters associated with the junction
Figure 11 shows the measured impulse response in-cluding groups of arrivals resulting from energy reflectedbetween the end cap and the junction Consider the indi-vidual subarrivals within the second arrival group A2 ofFigure 11 The signal from the speaker propagates alongthe length of the cylinder to the junction where part of thesignal is reflected back to the microphone and inverted (ascan be seen from (10) where if Z1(ω) gt Z2(ω) the re-flection R(ω) picks up a negative sign) It appears as thenegative pulse A21 with losses having a low-pass char-acteristic described by Ry(ω) as well as round-trip walllosses given by λ2
y(ω) The part of the signal that is not re-flected is transmitted through the junction with losses hav-ing a complementary high-pass characteristic Ty(ω) Thissignal propagates to the spherical termination where it isldquoperfectlyrdquo reflected arriving back at the junction a short
10-1
100
101
-12
-10
-8
-6
-4
-2
0
2
4
frequency - kHz
magnitude-dB
estimated (upper undulating line)
approximate theoretical (lower line)
Figure 10 Estimated and approximate theoretical open-endcylinder reflection magnitude The theoretical reflection magni-tude is a first-order approximation that captures the general low-pass characteristic Note that the estimated reflection magnitudeis greater than one at low-frequencies where the speaker doesnrsquotgenerate significant power and more measurement noise is in-troduced The measurement matches the approximate theoreticalcurve above 2 kHz and within a fraction of a dB otherwise
0 5 10 15 20 25 30 35 40 45 50-04
-02
0
02
04
06
08
1
time - milliseconds
amplitude
A 2 = (see expansion below)
A 1 = σ (ω)
A3 =
12 14 16 18 20 22 24-04
-02
0
02
04
time - milliseconds
amplitude
A 21 = σ (ω)λ 2y(ω)R y(ω)(1 + ρ(ω))
A 22 = σ (ω)λ 2y(ω)λ
2n(ω)Ty(ω)Tn(ω)(1 + ρ(ω))
Figure 11 Arrival responses are shown with their correspond-ing transfer functions The response A21 shows a low-pass char-acteristic expected of a junction reflection while A22 shows ahigh-pass characteristic expected of two transmissions throughthe junction
time later (corresponding to twice the length of the cone)Part of this signal at the junction is transmitted with trans-fer function Tc(ω) producing the pulse at t asymp 15 ms (A22
in Figure 11) and part is reflected with transfer function
1100
Smyth Abel Estimating waveguide model elements ACTA ACUSTICA UNITED WITH ACUSTICAVol 95 (2009)
2 3 4 5 6 7-05
0
05
1
15
2
25
3
time - milliseconds
amplitude
Figure 12 Measured (lower line) theoretical (thick line offset by10) and components (upper lines offset by 025) for closed conesecond arrival group corresponding to A2i
Rc(ω) Note the doublet nature of the pulse A22 withthe steep transition from a positive to a negative peak be-ing consistent with the high-pass transmission through thejunction The part of the pulse reflected back toward theend cap will appear at the junction to be in part transmit-ted to the cylinder and microphone and in part reflectedonce again toward the end cap
The first subarrival spectrum is
A21 = σ(ω)λ2y(ω)Ry(ω) 1 + ρ(ω) (29)
with subsequent ith arrivals having spectrum
A2i = σ(ω)λ2y(ω)λ2i
n (ω)
middot Ty(ω)Tn(ω)Riminus1n (ω) 1 + ρ(ω) (30)
The individual subarrivals shown in Figure 12 were gener-ated according to (30) using the transmission and reflec-tion filters described in section 2 for the 45o cone andone-centimeter radius cylinder measured The subarrivalsare summed to form the theoretical arrival group shownin Figure 12 Note the good agreement between the the-oretical and measured responses It should be pointed outthat the estimation of the junction transmission and reflec-tion filters in this case is complicated somewhat by theoverlapping nature of the subarrivals Rather than fix thereflection and transmission filters by analyzing individualarrivals hypothesized filters are used to generate the entirearrival group and then adjusted to produce the group bestmatching the one measured
44 Open cylicone
Opening the end of the cone produces an impulse responsewith similar behaviour as for the closed cylicone thoughbecause it is open the cone termination reflections are in-verted and attenuated A positive pulse traveling from thespeaker to the junction is partly inverted upon reflection
0 5 10 15 20 25 30 35 40 45 50-04
-02
0
02
04
06
08
1
time - milliseconds
amplitude
N 3 =
N 2 = (see expansion below)
N 1 = σ (ω)
12 14 16 18 20 22 24 26-04
-03
-02
-01
0
01
time - milliseconds
amplitude
N 22 = σ (ω)λ 2y(ω)λ
2n(ω)Ty(ω)Tn(ω)R op(ω)(1 + ρ(ω))
N 21 = σ (ω)λ 2y(ω)R y(ω)(1 + ρ(ω))
Figure 13 Arrival responses for the open cylicone showing in-dividual pulses corresponding to outputs of a combinations oftransfer functions
arriving at the microphone as a negative pulse and partlytransmitted through the junction this time being invertedat the open cone termination reflection When the negativepulse arrives at the junction a part is transmitted as a neg-ative pulse to the microphone and a part is reflected as apositive pulse back to the open cone termination where itis again inverted becoming negative The negative pulsepropagates back to the junction where it is partly transmit-ted to the microphone and partly reflected and invertedand so on
Figure 13 shows the measured impulse response for theopen cylicone Like the closed cylicone it exhibits a se-quence of arrival groups The N2 subarrival spectra maybe written in terms of the closed cylicone subarrival spec-tra
N2i = A2iRiminus1op (ω) (31)
Approximating the reflection from the open cone as a first-order low-pass filter with characteristic closely matchingboth observed measurement and that described by Levineand Schwinger (15) for a cylindrical radius equal to theaverage of the conersquos edge radii a1 and a2 a theoreticalarrival response is shown in Figure 14 along with its com-ponent subarrivals and the measured N2 arrival group Asin the case of the closed cylicone there is good agreementbetween the measured and theoretical responses
5 Results and conclusions
In this work a measurement technique was presented forestimating elements comprising a waveguide wind instru-
1101
ACTA ACUSTICA UNITED WITH ACUSTICA Smyth Abel Estimating waveguide model elementsVol 95 (2009)
2 3 4 5 6 7-05
0
05
1
15
2
25
3
time - milliseconds
amplitude
Figure 14 Measured (lower line) theoretical (thick line offsetby 10) and components (upper lines offset by 025) for the opencone second arrival corresponding to N22
ment model including filters used in propagation scatter-ing and termination The technique measures the impulseresponse between the mouthpiece end of the instrumentand a co-located microphone By comparing correspond-ing arrivals for different configurations modeled reflec-tion transmission and loss filters may be identified Tovalidate the measurement technique it was applied to asimple instrument configuration having a cylindrical boreconnected to a conical bell The estimated filters and im-pulse response was seen to closely match the theory giv-ing confidence that the measurement method can be gen-erally applied
To confirm the good agreement between the measuredand theoretical reflection transmission and propagationelements waveguide models of the four tube configura-tions were implemented based on cylinder and cone di-mensions Figure 15 shows a close match between mea-sured and theoretically-derived waveguide model impulseresponses for each of the tube configurations
This work will facilitate the development of filter com-ponents for which theoretical solutions may not be avail-able In particular reflection and transmission functions ofwind instrument bores bells and mouthpieces can be mea-sured by comparing the response of a rigidly terminatedtube to that of the tube with the instrument or instrumentsection affixed
Acknowledgments
We would like to sincerely thank Theresa Leonard and theBanff Centre for the Arts for the use of their facilities JohnLundell Carr Wilkerson Michael Coury and HarrisonSmith for their help in fabricating the experimental setupand the Natural Sciences and Engineering Research Coun-cil of Canada (NSERC) for their support Many thanks arealso extended to the reviewers whose careful reading ofthis text and invaluable comments have greatly strength-ened the clarity and accuracy of this work
0 5 10 15 20 25 30 35 40 45 50
0
2
4
6
8
10
time - milliseconds
amplitude
Closed Cylinder
M
T
Open Cylinder
M
T
Closed Cylicone
M
T
Open Cylicone
M
T
Figure 15 Measured and theoretically-derived impulse responsefor (from bottom to top) a closed cylinder an open cylinder aclosed cylicone and an open cylicone
References
[1] J O Smith Digital waveguide modeling of musical instru-ments www-ccrmastanfordedu˜joswaveguide 2003last viewed 1242008
[2] V Vaumllimaumlki Discrete-time modeling of acoustic tubes us-ing fractional delay filters Dissertation Helsinki Univer-sity of Technology Faculty of Electrical Engineering Lab-oratory of Acoustic and Audio Signal Processing EspooFinland 1995 Report no 37
[3] D P Berners Acoustics and signal processing techniquesfor physical modeling of brass instruments DissertationStanford University Stanford California July 1999
[4] A H Benade On the propagation of sound waves in acylindrical conduit Journal of the Acoustical Society ofAmerica 44 (1968) 616ndash623
[5] D H Keefe Acoustical wave propagation in cylindricalducts Transmission line approximation for isothermal and
1102
Smyth Abel Estimating waveguide model elements ACTA ACUSTICA UNITED WITH ACUSTICAVol 95 (2009)
nonisothermal boundary conditions Journal of the Acous-tical Society of America 75 (Januaray 1984) 58ndash62
[6] J Abel T Smyth J O Smith A simple accurate wall lossfilter for acoustic tubes DAFX 2003 Proceedings LondonUK September 2003 International Conference on DigitalAudio Effects 53ndash57
[7] X Rodet C Vergez Physical models of trumpet-like in-struments Detailed behavior and model improvementsProceedings of ICMC 1996 Clear Water Bay Hong-KongAugust 1996 International Computer Music Conference
[8] AHBenade MIIbisi Survey of impedance methods anda new piezo-disk-driven impedance head for air columnsJournal of the Acoustical Society of America 81 (April1987) 1152ndash1167
[9] JKergomard RCausseacute Measurement of acoustic impe-dance using a capillary An attempt to achieve optimiza-tion Journal of the Acoustical Society of America 79(April 1986) 1129ndash1140
[10] T Ossman H Pichler G Widholm Bias A computer-aided test system for brass wind instruments Audio En-gineering Society Preprint October 1989
[11] J Epps JRSmith JWolfe A novel instrument to mea-sure acoustic resonances of the vocal tract during phona-tion Measurement Science and Technology 8 (July 1997)1112ndash1121
[12] M M Sondhi J Resnick The inverse problem for the vo-cal tract Numerical methods acoustical experiments andspeech synthesis Journal of the Acoustical Society ofAmerica 73 (March 1983) 985ndash1002
[13] J Agulloacute S Cardona D H Keefe Time-domain deconvo-lution to measure reflection functions for discontinuities in
waveguides Journal of the Acoustical Society of America97 (March 1995) 1950ndash1957
[14] V Vaumllimaumlki B Hernoux J Huopaniemi M KarjalainenMeasurement and analysis of acoustic tubes using signalprocessing techniques Finnish Signal Processing Sympo-sium (FINSIGrsquo95) Espoo Finland June 1995
[15] D B Sharp Acoustic pulse reflectometry for the measure-ment of musical wind instruments Dissertation Universityof Edinburgh 1996
[16] A Farina Simultaneous measurement of impulse responseand distortion with a swept-sine technique Proceedings ofthe 108th AES Convention Paris France February 200018ndash22
[17] A Lefebvre G Scavone J Able A Buckiewicz-SmithA comparison of impedence measurements using one andtwo microphones Proceedings of ISMA 2007 BarcelonaSpain September 2007 International Symposium on Mu-sical Acoustics
[18] A Lefebvre La mesure de lrsquoimpeacutedance acoustique du sax-ophone alto Diploma Thesis Eacutecole Polytechnique deMontreacuteal 2006
[19] T Smyth J Abel Convolutional synthesis of wind instru-ments Proceedings of the IEEE Workshop on Applica-tions of Signal Processing to Audio and Acoustics (WAS-PAArsquo07) New Paltz New York October 2007
[20] J O Smith Physical audio signal processing for virtualmusical instruments and audio effects December 2008httpccrmastanfordedu˜jospasp
[21] H Levine J Schwinger On the radiation of sound from anunflanged circular pipe Phys Rev 73 (1948) 383ndash406
1103

ACTA ACUSTICA UNITED WITH ACUSTICA Smyth Abel Estimating waveguide model elementsVol 95 (2009)
Table I Molecular constants evaluated at 2685oC as providedby [4]
Symbol Values Units
Air density ρ 118 times 10minus3 gcm2
Viscosity η 185 times 10minus4 g(s cm)(Prandtl)
12 ν 0841
Ratio ofspecific heats γ = CpCv 140Free spacesound speed c 347 times 104 cms
Denoting by λ(ω) the one-way loss transfer function andby Lc the one-way propagation time the propagationloss is given by exp[minusjωLc] middot λ(ω) where
λ(ω) = exp minus α(ω)L minus jωL(1v(ω) minus 1c) (3)
An approximation to the phase velocity valid for all tuberadii is [6]
v(ω) asymp cAvrv (1 + rvκ)
1 + Avrv (Bv + rvκ) (4)
where rv is the ratio of the pipe radius a to the thickness ofthe viscous boundary layer given by
rv = aη
ωρ
minus 12
(5)
and the parameters Av and Bv given by
Av =1
2radicγ Bv = 1 +
[1 + (γ minus 1)ν)]radic2κ
(6)
were selected to match the limiting phase velocity behav-ior and the parameter
κ = 2γ (7)
marks the ratio rv delimiting the small-radius and large-radius tube regions [6] The molecular constants in (5) and(6) are defined in Table I and suggested values are pro-vided
Similarly an approximation to the attenuation coeffi-cient is
α(ω) asymp ω
crv
Aα + Bα (rvκ)1 + rvκ
(8)
where the parameters Aα and Bα were again selected tomatch the limiting attenuation coefficient behavior and aregiven by
Aα = 2 γ Bα =1 + (γ minus 1)ν
radic2
(9)
Figure 3 shows the approximations for phase velocityand attenuation as given by (4) and (8) along with theircomplete and limiting behaviors as given by Benade [4]
100
101
10-1
100
PhaseVelocityc
100
101
10-5
10-4
10-3
Boundary Layer Thickness Ratio (rv)
AttenuationFrequency
Figure 3 Modeled (solid) phase velocity (top) and attenuation(bottom) and their complete and limiting behavior (dashed)
T2(ω)
R 1(ω) R 2(ω)
T1(ω)
Figure 4 Scattering A change of impedance may occur as a two-port scattering junction between two waveguide sections con-sisting of frequency-dependent reflection R12(ω) and amplitudecomplementary transmission T12(ω)
R (ω)
T (ω)
R (ω)
Closed Open
Figure 5 Termination A change of impedance in a waveguidesection may occur as a termination closed with reflection oropen with a reflection R(ω) and corresponding complementarytransmission
22 Scattering reflection and transmission
Any change of impedance which may be the result of atermination (either open or closed as discussed in the fol-lowing section 23) a change in the tubersquos cross-sectionalarea or a connection to another acoustic element requiresfiltering to account for the frequency-dependent reflec-tion R12(ω) and amplitude complementary transmissionT12(ω) that will result between two adjacent waveguidesections (see Figure 4) or at a termination (see Figure 5)
1096
Smyth Abel Estimating waveguide model elements ACTA ACUSTICA UNITED WITH ACUSTICAVol 95 (2009)
A change in the wave impedance at the boundary be-tween two tube elements will result in a reflection withtransfer function
R(ω) =Z2(ω)Z1(ω) minus 1Z2(ω)Z1(ω)lowast + 1
(10)
where Z1 and Z2 denote the adjacent wave impedancesand lowast indicates the complex conjugate The amplitudecomplementary transmission transfer function is given by
T (ω) = 1 + R(ω) (11)
for pressure waves [20]For plane waves in cylindrical tubes (as denoted by the
y subscript) the impedance is given by
Zy =ρc
S (12)
where S is the cross-sectional area of the tubeFor spherical pressure waves in conical tubes (as de-
noted by the n subscript) propagating away from the coneapex (denoted by the + superscript) the impedance is de-pendent on frequency ω and the distance r from the obser-vation point to the cone apex and is given by
Z+n (rω) =
ρc
S
jωjω + cr
(13)
For spherical waves propagating toward the cone apex theimpedance is given by
Zminusn (rω) =
ρc
S
jωjω minus cr
= Z+lowastn (rω) (14)
23 Termination reflection and transmission
A special case of a change in cross section is at the in-strumentrsquos open end In this case the complex terminat-ing impedance Z2(ω) = ZL(ω) may be a complicatedfunction of frequency In the case of a cylindrical tube anexpression is available by Levine and Schwinger in termsof Bessel and Struve functions [21] There is no knownexpression for conical bores
The ratio ZLZ1 may be approximated by
ZLZ1 asympjka
ζ + jka (15)
where k = ωc is the wavenumber a is the radius of thecylinder and ζ is a scalar near one which determines thetransition between the low-frequency and high-frequencybehaviour The expression (15) follows the gross be-haviour described by Levine and Schwinger The reflec-tion filter for the open end on a cylindrical tube may thenbe approximated by
Rop(ω) =ZLZ1 minus 1ZLZ1 + 1
=minus1
1 + 2jkaζ (16)
yielding a one-pole low-pass filter with a cutoff frequencyof ω = ζca
cylinder speakerminusclosed
cylinder speakerminusopen
2 meters
cylicone speakerminusclosed
cylicone speakerminusopen
1)
2)
3)
4)
Figure 6 Four simple tube structures each terminated at one endwith a speaker and having a co-located microphone The follow-ing terminations are applied at the end opposite the speaker andmicrophone 1) a cylinder closed with Lucite to ensure a perfectreflection (cylinder speaker-closed) 2) an open cylinder (cylin-der speaker-open) 3) a cylicone terminated with a glass sphere(with radius nearly that of the cone) ensuring a perfect reflectionof spherical waves (cylicone speaker-closed) 4) an open cyli-cone (cylicone speaker-closed)
3 Measurement configuration
To isolate each of the waveguide model elements seen inFigure 1 a test signal a swept sinusoid similar to thatdescribed by Farina [16] was input through a speaker atone end of four tube configurations a cylindrical tube andthe cylinder with an attached conical flare (cylicone) eachmeasured with the end opposite the speaker closed thenopen (see Figure 6)1 Cylinder closed end A two-meter-long cylinder is
rigidly terminated at one end to ensure a perfect re-flection This configuration allows measurement of thespeaker output σ(ω) the speaker reflection ρ(ω) andthe wall loss λ(ω) transfer functions as described insection 41 The arrival responses Ln for this measure-ment may be seen in Figure 7
2 Cylinder open end Opening the cylinder allows mea-surement of the reflection at the open end of a cylinderRop(ω) as described in section 42 Figure 9 shows themeasured responses
3 Cylicone closed end The addition of a conical flarewith a spherical termination (to ensure a perfect reflec-tion) to the above cylindrical tube allows reflection andtransmission at the junction to be observed from themeasured responses shown in Figure 11 as describedin section 43
4 Cylicone open end Opening the conical end allows usto observe the corresponding reflection from the cyli-cone response shown in Figure 13 as described in sec-tion 44
1097
ACTA ACUSTICA UNITED WITH ACUSTICA Smyth Abel Estimating waveguide model elementsVol 95 (2009)
As described below by using a long swept sinusoid to ob-tain a system impulse response for each structure the sys-tem is excited with sufficient energy to achieve a signif-icantly larger SNR than could be obtained with a simplepulse while achieving the bandwidth of interest in thiscase up to 10kHz The impulse responses measured herehave a peak level roughly 70 dB above the noise floorstandard deviation There is no limit to the duration of theswept sinusoid ie itrsquos length is not bounded by the mi-crophone placement the length of the tube or any otherpotential for overlap between signal and reflections seenin other methods since the signal recorded at the micro-phone is processed to produce the response of the systemhad it been excited with a pulse only one sample long
The test signal used was a sinusoid exponentially sweptfrom 20 Hz to the band edge of 2205 kHz (half the sam-pling rate fs) and with a duration of 220 samples or about23 seconds Expressed mathematically the sine sweep isgiven by
s(t) = sin φ(t) φ(t) =t
0ω(τ) dτ (17)
where the frequency ω(t) traces out an exponential sweep
ω(t) = 2πf0eηt (18)
where η = ln(f02fs)T with fs being the sampling ratef0 the initial frequency and T the duration of the sweep
A sine sweep was repeated so that the measured re-sponse during the second sweep would be the circular con-volution of the input sweep with the system In particularto recover the system impulse response from the sweep re-sponse circular deconvolution may be used Denoting byr(t) the system response during the second sweep we have
h(t) = Fminus1 Fr(t) Fs(t) (19)
whereF denotes the Fourier Transform Expressed in Mat-lab code the impulse response h may be found with
h = ifft fft(r)fft(s) (20)
where s contains the sine sweep and r is the system re-sponse during the second sine sweep
The input signal and the measured response is sent andreceived simultaneously using a full duplex audio devicein this work the Mac PowerBook running Logic Pro withthe MOTU Traveler audio interface with 16-bit audio at asampling rate of 441 kHz was used Measurements weretaken in a very large room with the apparatus placed fivemeters from the nearest reflecting object
The four simple tube structures in Figure 6 were assem-bled using PVC tubes and plastic funnels of several sizesThe cylinder was prepared by placing a speaker (CUI IncCMS0281KLX) at one end and by press fitting a six-millimeter-diameter microphone (Panasonic W64M) intoa hole drilled next to the speaker It is not necessary toconsider or document the precise details of the speaker
and microphone as long as their placement and geome-try is consistent from one measurement to the next Anyeffects of placement and geometry are eliminated by thesignal normalization and post processing described in thefollowing section It is important however that the mi-crophone and speaker be placed as close as possible toeach other to minimize the acoustic travel time betweenthem In this way the corresponding frequency at whichdestructive interference occurs between the signal travel-ing from speaker to microphone and that returning fromthe bore is made large Destructive interference will resultin a notch in the transfer function and will impact the abil-ity to take the spectral ratios described in section 4 at thatfrequency In this case the distance between the micro-phone and speaker is sufficiently small to ensure that anyspectral nulls would be outside the 10 kHz band of interest
The cylinder is 2 m long with an inside radius a = 1 cmand the cone is 127 cm long with edge radii of a1 = 1 cmand a2 = 92 cm Both cylinder and cone are sufficientlythick to be considered rigid (3 mm and 2 mm respec-tively)
The impulse response between the speaker and mi-crophone was measured for each of the configurationsThe impulse responses were then equalized according tothe first arrival the speaker-microphone transfer functionσ(ω) to produce the figures shown in section 4 Note thatthe first arrival will also contain contributions from evanes-cent modes in this case above about 10kHz
4 Measured responses
In spite of the wide use of digital waveguides for soundsynthesis it is perhaps less common to observe the be-haviour of wave propagation in actual acoustic systemsfrom the same perspective That is rather than analyzing asystem purely from its frequency response it is informa-tive for analysis and practical for synthesis to observe theeffects of each waveguide element in a sequence of multi-ple arrivals comprising the system impulse response
41 Closed cylinder
A first measurement is taken for the cylinder closed atthe end opposite the speaker ensuring a perfect reflec-tion Comparing arrivals appearing in its impulse responseprovides estimates of the propagation loss λ(ω) speakertransfer function σ(ω) and the speaker reflection functionρ(ω)
The first four arrivals comprising the measured speaker-microphone impulse response are shown in Figure 7 Thedirect path speaker-microphone response is observed as apositive pulse labeled L1 at t asymp 25 ms and correspondsto the equalized transfer function σ(ω) (Note that the25 ms arrival time corresponds to buffering delays be-tween the sweep and response in the measurement sys-tem) This energy propagates down the length of the tubeand is perfectly reflected from the closed end returning tothe speaker and co-located microphone at t asymp 14 ms The
1098
Smyth Abel Estimating waveguide model elements ACTA ACUSTICA UNITED WITH ACUSTICAVol 95 (2009)
arrival L2 is reflected from the speaker and the observedpulse L2 is the sum of the incoming and speaker-reflectedwaves The pulse makes another round trip eventuallyproducing the sequence of consecutive equally spacedpulses observed in Figure 7 There is an attenuation ofthe pulse upon each successive reflection There is alsoan observable low-pass filtering as the signal becomes in-creasingly smooth and widened with every reflection (Fig-ure 7)
Given the arrival responses for a closed cylinder Ln thetransfer function of the reflection from the speaker maybe estimated The first arrival which is the output of thespeaker measured at the mic consists solely of the speakertransfer function
L1 = σ(ω) (21)
The following arrival L2 consists of the sum of leftand right traveling pressure waves at the microphone po-sition the speaker transfer function after having trav-elled twice the length of the tube (round trip) given byLminus
2 = σ(ω)λ2(ω) and the speaker transfer function withround trip losses after reflecting from the speaker L+
2 =σ(ω)λ2(ω)ρ(ω) The second arrival is expressed as theirsum and is given by
L2 = L+2 + Lminus
2 = σ(ω)λ2(ω) 1 + ρ(ω) (22)
Each subsequent arrival for the closed cylinder consists ofthe previous arrival with round-trip wall losses of λ2(ω)and a speaker reflection ρ(ω) The third arrival is thereforegiven by
L3 = σ(ω)λ4(ω)ρ(ω) 1 + ρ(ω) (23)
These three responses are sufficient for defining the inter-mediate variable
ζ(ω) =L1L3
(L2)2=
ρ(ω)1 + ρ(ω)
(24)
which yields an estimate for the speaker reflection transferfunction
ρ(ω) =ζ(ω)
1 minus ζ(ω) (25)
and the propagation loss λ(ω)
λ2(ω) =L3
ρ(ω)L2 (26)
Figure 8 shows the estimated and theoretical propaga-tion loss along with the estimated speaker reflection Notethe good agreement between the estimated and theoreti-cal propagation losses The low-frequency attenuation ob-served in the spectrum of the speaker reflection is likelydue to the speaker being designed to be resonant at lowfrequencies It should be pointed out that there is roughlya fraction of a dB attenuation in the estimated propagationloss beyond that theoretically predicted
0 5 10 15 20 25 30 35 40 45 50-02
0
02
04
06
08
1
12
time - milliseconds
amplitude
L 1 = σ (ω)
L2 = σ (ω)λ 2(ω)(1 + ρ(ω))
L 3 = σ (ω)λ 4(ω)ρ(ω)(1 + ρ(ω))
Figure 7 Arrival responses for the closed cylinder showing in-dividual pulses and corresponding spectra as combinations oftransfer functions for the speaker σ(ω) wall losses λ(ω) andspeaker reflection ρ(ω)
10-1
100
101
-25
-20
-15
-10
-5
0
frequency - kHz
magnitude-dB
estimated
theoretical
estimated speaker reflection
Figure 8 Theoretical (upper smooth curve) and estimated (lowercurve 05 dB down) propagation losses along with the estimatedspeaker reflection (high-pass curve)
42 Open cylinder
The open-end reflection transfer function Rop(ω) maybe estimated from the open cylinder impulse responseshown in Figure 9 The low-pass characteristic describedby Levine and Schwinger is apparent in the successive ar-rivals which are increasingly smeared over time comparedto their closed-end counterpart shown in Figure 7 Succes-sive arrivals show the same propagation delay as observedfor the closed cylinder but in this case with every other re-flection inverted and with increased attenuation and low-pass filtering with each consecutive reflection (Figure 9)This is expected as the responses Yn have all the lossesof the closed cylinder (propagation and speaker reflectionlosses) with the added effect of the open-end reflection
As with the closed cylinder the initial response of thismeasurement is merely the response of the speaker to an
1099
ACTA ACUSTICA UNITED WITH ACUSTICA Smyth Abel Estimating waveguide model elementsVol 95 (2009)
0 5 10 15 20 25 30 35 40 45 50-06
-04
-02
0
02
04
06
08
1
time - milliseconds
amplitude
Y3 = σ (ω)λ 4(ω)R 2op(ω)ρ(ω)(1 + ρ(ω))
Y1 = σ (ω)
Y2 = σ (ω)λ 2(ω)R op(ω)(1 + ρ(ω))
Figure 9 Measured impulse response for the open cylinder show-ing individual arrivals The open-end transfer function Rop(ω)may be isolated by comparison with the corresponding closed-end arrival spectra L2 L3 L4
impulse yielding the speaker transfer function Y1 = σ(ω)The second arrival Y2 is similar toL2 but also includes theopen-end reflection
Y2 = σ(ω)λ2(ω)Rop(ω) 1 + ρ(ω) (27)
Subsequent arrival responses include additional round-tripwall losses and open-end reflections The open-end reflec-tion function may then be estimated as the ratio of the sec-ond arrival spectra
Rop(ω) =Y2
L2 (28)
and is seen in Figure 10
43 Closed cylicone
Attaching a conical flare to the cylindrical tube and termi-nating with a spherical cap to ensure a perfect reflectionallows for estimation of the reflection and transmission fil-ters associated with the junction
Figure 11 shows the measured impulse response in-cluding groups of arrivals resulting from energy reflectedbetween the end cap and the junction Consider the indi-vidual subarrivals within the second arrival group A2 ofFigure 11 The signal from the speaker propagates alongthe length of the cylinder to the junction where part of thesignal is reflected back to the microphone and inverted (ascan be seen from (10) where if Z1(ω) gt Z2(ω) the re-flection R(ω) picks up a negative sign) It appears as thenegative pulse A21 with losses having a low-pass char-acteristic described by Ry(ω) as well as round-trip walllosses given by λ2
y(ω) The part of the signal that is not re-flected is transmitted through the junction with losses hav-ing a complementary high-pass characteristic Ty(ω) Thissignal propagates to the spherical termination where it isldquoperfectlyrdquo reflected arriving back at the junction a short
10-1
100
101
-12
-10
-8
-6
-4
-2
0
2
4
frequency - kHz
magnitude-dB
estimated (upper undulating line)
approximate theoretical (lower line)
Figure 10 Estimated and approximate theoretical open-endcylinder reflection magnitude The theoretical reflection magni-tude is a first-order approximation that captures the general low-pass characteristic Note that the estimated reflection magnitudeis greater than one at low-frequencies where the speaker doesnrsquotgenerate significant power and more measurement noise is in-troduced The measurement matches the approximate theoreticalcurve above 2 kHz and within a fraction of a dB otherwise
0 5 10 15 20 25 30 35 40 45 50-04
-02
0
02
04
06
08
1
time - milliseconds
amplitude
A 2 = (see expansion below)
A 1 = σ (ω)
A3 =
12 14 16 18 20 22 24-04
-02
0
02
04
time - milliseconds
amplitude
A 21 = σ (ω)λ 2y(ω)R y(ω)(1 + ρ(ω))
A 22 = σ (ω)λ 2y(ω)λ
2n(ω)Ty(ω)Tn(ω)(1 + ρ(ω))
Figure 11 Arrival responses are shown with their correspond-ing transfer functions The response A21 shows a low-pass char-acteristic expected of a junction reflection while A22 shows ahigh-pass characteristic expected of two transmissions throughthe junction
time later (corresponding to twice the length of the cone)Part of this signal at the junction is transmitted with trans-fer function Tc(ω) producing the pulse at t asymp 15 ms (A22
in Figure 11) and part is reflected with transfer function
1100
Smyth Abel Estimating waveguide model elements ACTA ACUSTICA UNITED WITH ACUSTICAVol 95 (2009)
2 3 4 5 6 7-05
0
05
1
15
2
25
3
time - milliseconds
amplitude
Figure 12 Measured (lower line) theoretical (thick line offset by10) and components (upper lines offset by 025) for closed conesecond arrival group corresponding to A2i
Rc(ω) Note the doublet nature of the pulse A22 withthe steep transition from a positive to a negative peak be-ing consistent with the high-pass transmission through thejunction The part of the pulse reflected back toward theend cap will appear at the junction to be in part transmit-ted to the cylinder and microphone and in part reflectedonce again toward the end cap
The first subarrival spectrum is
A21 = σ(ω)λ2y(ω)Ry(ω) 1 + ρ(ω) (29)
with subsequent ith arrivals having spectrum
A2i = σ(ω)λ2y(ω)λ2i
n (ω)
middot Ty(ω)Tn(ω)Riminus1n (ω) 1 + ρ(ω) (30)
The individual subarrivals shown in Figure 12 were gener-ated according to (30) using the transmission and reflec-tion filters described in section 2 for the 45o cone andone-centimeter radius cylinder measured The subarrivalsare summed to form the theoretical arrival group shownin Figure 12 Note the good agreement between the the-oretical and measured responses It should be pointed outthat the estimation of the junction transmission and reflec-tion filters in this case is complicated somewhat by theoverlapping nature of the subarrivals Rather than fix thereflection and transmission filters by analyzing individualarrivals hypothesized filters are used to generate the entirearrival group and then adjusted to produce the group bestmatching the one measured
44 Open cylicone
Opening the end of the cone produces an impulse responsewith similar behaviour as for the closed cylicone thoughbecause it is open the cone termination reflections are in-verted and attenuated A positive pulse traveling from thespeaker to the junction is partly inverted upon reflection
0 5 10 15 20 25 30 35 40 45 50-04
-02
0
02
04
06
08
1
time - milliseconds
amplitude
N 3 =
N 2 = (see expansion below)
N 1 = σ (ω)
12 14 16 18 20 22 24 26-04
-03
-02
-01
0
01
time - milliseconds
amplitude
N 22 = σ (ω)λ 2y(ω)λ
2n(ω)Ty(ω)Tn(ω)R op(ω)(1 + ρ(ω))
N 21 = σ (ω)λ 2y(ω)R y(ω)(1 + ρ(ω))
Figure 13 Arrival responses for the open cylicone showing in-dividual pulses corresponding to outputs of a combinations oftransfer functions
arriving at the microphone as a negative pulse and partlytransmitted through the junction this time being invertedat the open cone termination reflection When the negativepulse arrives at the junction a part is transmitted as a neg-ative pulse to the microphone and a part is reflected as apositive pulse back to the open cone termination where itis again inverted becoming negative The negative pulsepropagates back to the junction where it is partly transmit-ted to the microphone and partly reflected and invertedand so on
Figure 13 shows the measured impulse response for theopen cylicone Like the closed cylicone it exhibits a se-quence of arrival groups The N2 subarrival spectra maybe written in terms of the closed cylicone subarrival spec-tra
N2i = A2iRiminus1op (ω) (31)
Approximating the reflection from the open cone as a first-order low-pass filter with characteristic closely matchingboth observed measurement and that described by Levineand Schwinger (15) for a cylindrical radius equal to theaverage of the conersquos edge radii a1 and a2 a theoreticalarrival response is shown in Figure 14 along with its com-ponent subarrivals and the measured N2 arrival group Asin the case of the closed cylicone there is good agreementbetween the measured and theoretical responses
5 Results and conclusions
In this work a measurement technique was presented forestimating elements comprising a waveguide wind instru-
1101
ACTA ACUSTICA UNITED WITH ACUSTICA Smyth Abel Estimating waveguide model elementsVol 95 (2009)
2 3 4 5 6 7-05
0
05
1
15
2
25
3
time - milliseconds
amplitude
Figure 14 Measured (lower line) theoretical (thick line offsetby 10) and components (upper lines offset by 025) for the opencone second arrival corresponding to N22
ment model including filters used in propagation scatter-ing and termination The technique measures the impulseresponse between the mouthpiece end of the instrumentand a co-located microphone By comparing correspond-ing arrivals for different configurations modeled reflec-tion transmission and loss filters may be identified Tovalidate the measurement technique it was applied to asimple instrument configuration having a cylindrical boreconnected to a conical bell The estimated filters and im-pulse response was seen to closely match the theory giv-ing confidence that the measurement method can be gen-erally applied
To confirm the good agreement between the measuredand theoretical reflection transmission and propagationelements waveguide models of the four tube configura-tions were implemented based on cylinder and cone di-mensions Figure 15 shows a close match between mea-sured and theoretically-derived waveguide model impulseresponses for each of the tube configurations
This work will facilitate the development of filter com-ponents for which theoretical solutions may not be avail-able In particular reflection and transmission functions ofwind instrument bores bells and mouthpieces can be mea-sured by comparing the response of a rigidly terminatedtube to that of the tube with the instrument or instrumentsection affixed
Acknowledgments
We would like to sincerely thank Theresa Leonard and theBanff Centre for the Arts for the use of their facilities JohnLundell Carr Wilkerson Michael Coury and HarrisonSmith for their help in fabricating the experimental setupand the Natural Sciences and Engineering Research Coun-cil of Canada (NSERC) for their support Many thanks arealso extended to the reviewers whose careful reading ofthis text and invaluable comments have greatly strength-ened the clarity and accuracy of this work
0 5 10 15 20 25 30 35 40 45 50
0
2
4
6
8
10
time - milliseconds
amplitude
Closed Cylinder
M
T
Open Cylinder
M
T
Closed Cylicone
M
T
Open Cylicone
M
T
Figure 15 Measured and theoretically-derived impulse responsefor (from bottom to top) a closed cylinder an open cylinder aclosed cylicone and an open cylicone
References
[1] J O Smith Digital waveguide modeling of musical instru-ments www-ccrmastanfordedu˜joswaveguide 2003last viewed 1242008
[2] V Vaumllimaumlki Discrete-time modeling of acoustic tubes us-ing fractional delay filters Dissertation Helsinki Univer-sity of Technology Faculty of Electrical Engineering Lab-oratory of Acoustic and Audio Signal Processing EspooFinland 1995 Report no 37
[3] D P Berners Acoustics and signal processing techniquesfor physical modeling of brass instruments DissertationStanford University Stanford California July 1999
[4] A H Benade On the propagation of sound waves in acylindrical conduit Journal of the Acoustical Society ofAmerica 44 (1968) 616ndash623
[5] D H Keefe Acoustical wave propagation in cylindricalducts Transmission line approximation for isothermal and
1102
Smyth Abel Estimating waveguide model elements ACTA ACUSTICA UNITED WITH ACUSTICAVol 95 (2009)
nonisothermal boundary conditions Journal of the Acous-tical Society of America 75 (Januaray 1984) 58ndash62
[6] J Abel T Smyth J O Smith A simple accurate wall lossfilter for acoustic tubes DAFX 2003 Proceedings LondonUK September 2003 International Conference on DigitalAudio Effects 53ndash57
[7] X Rodet C Vergez Physical models of trumpet-like in-struments Detailed behavior and model improvementsProceedings of ICMC 1996 Clear Water Bay Hong-KongAugust 1996 International Computer Music Conference
[8] AHBenade MIIbisi Survey of impedance methods anda new piezo-disk-driven impedance head for air columnsJournal of the Acoustical Society of America 81 (April1987) 1152ndash1167
[9] JKergomard RCausseacute Measurement of acoustic impe-dance using a capillary An attempt to achieve optimiza-tion Journal of the Acoustical Society of America 79(April 1986) 1129ndash1140
[10] T Ossman H Pichler G Widholm Bias A computer-aided test system for brass wind instruments Audio En-gineering Society Preprint October 1989
[11] J Epps JRSmith JWolfe A novel instrument to mea-sure acoustic resonances of the vocal tract during phona-tion Measurement Science and Technology 8 (July 1997)1112ndash1121
[12] M M Sondhi J Resnick The inverse problem for the vo-cal tract Numerical methods acoustical experiments andspeech synthesis Journal of the Acoustical Society ofAmerica 73 (March 1983) 985ndash1002
[13] J Agulloacute S Cardona D H Keefe Time-domain deconvo-lution to measure reflection functions for discontinuities in
waveguides Journal of the Acoustical Society of America97 (March 1995) 1950ndash1957
[14] V Vaumllimaumlki B Hernoux J Huopaniemi M KarjalainenMeasurement and analysis of acoustic tubes using signalprocessing techniques Finnish Signal Processing Sympo-sium (FINSIGrsquo95) Espoo Finland June 1995
[15] D B Sharp Acoustic pulse reflectometry for the measure-ment of musical wind instruments Dissertation Universityof Edinburgh 1996
[16] A Farina Simultaneous measurement of impulse responseand distortion with a swept-sine technique Proceedings ofthe 108th AES Convention Paris France February 200018ndash22
[17] A Lefebvre G Scavone J Able A Buckiewicz-SmithA comparison of impedence measurements using one andtwo microphones Proceedings of ISMA 2007 BarcelonaSpain September 2007 International Symposium on Mu-sical Acoustics
[18] A Lefebvre La mesure de lrsquoimpeacutedance acoustique du sax-ophone alto Diploma Thesis Eacutecole Polytechnique deMontreacuteal 2006
[19] T Smyth J Abel Convolutional synthesis of wind instru-ments Proceedings of the IEEE Workshop on Applica-tions of Signal Processing to Audio and Acoustics (WAS-PAArsquo07) New Paltz New York October 2007
[20] J O Smith Physical audio signal processing for virtualmusical instruments and audio effects December 2008httpccrmastanfordedu˜jospasp
[21] H Levine J Schwinger On the radiation of sound from anunflanged circular pipe Phys Rev 73 (1948) 383ndash406
1103

Smyth Abel Estimating waveguide model elements ACTA ACUSTICA UNITED WITH ACUSTICAVol 95 (2009)
A change in the wave impedance at the boundary be-tween two tube elements will result in a reflection withtransfer function
R(ω) =Z2(ω)Z1(ω) minus 1Z2(ω)Z1(ω)lowast + 1
(10)
where Z1 and Z2 denote the adjacent wave impedancesand lowast indicates the complex conjugate The amplitudecomplementary transmission transfer function is given by
T (ω) = 1 + R(ω) (11)
for pressure waves [20]For plane waves in cylindrical tubes (as denoted by the
y subscript) the impedance is given by
Zy =ρc
S (12)
where S is the cross-sectional area of the tubeFor spherical pressure waves in conical tubes (as de-
noted by the n subscript) propagating away from the coneapex (denoted by the + superscript) the impedance is de-pendent on frequency ω and the distance r from the obser-vation point to the cone apex and is given by
Z+n (rω) =
ρc
S
jωjω + cr
(13)
For spherical waves propagating toward the cone apex theimpedance is given by
Zminusn (rω) =
ρc
S
jωjω minus cr
= Z+lowastn (rω) (14)
23 Termination reflection and transmission
A special case of a change in cross section is at the in-strumentrsquos open end In this case the complex terminat-ing impedance Z2(ω) = ZL(ω) may be a complicatedfunction of frequency In the case of a cylindrical tube anexpression is available by Levine and Schwinger in termsof Bessel and Struve functions [21] There is no knownexpression for conical bores
The ratio ZLZ1 may be approximated by
ZLZ1 asympjka
ζ + jka (15)
where k = ωc is the wavenumber a is the radius of thecylinder and ζ is a scalar near one which determines thetransition between the low-frequency and high-frequencybehaviour The expression (15) follows the gross be-haviour described by Levine and Schwinger The reflec-tion filter for the open end on a cylindrical tube may thenbe approximated by
Rop(ω) =ZLZ1 minus 1ZLZ1 + 1
=minus1
1 + 2jkaζ (16)
yielding a one-pole low-pass filter with a cutoff frequencyof ω = ζca
cylinder speakerminusclosed
cylinder speakerminusopen
2 meters
cylicone speakerminusclosed
cylicone speakerminusopen
1)
2)
3)
4)
Figure 6 Four simple tube structures each terminated at one endwith a speaker and having a co-located microphone The follow-ing terminations are applied at the end opposite the speaker andmicrophone 1) a cylinder closed with Lucite to ensure a perfectreflection (cylinder speaker-closed) 2) an open cylinder (cylin-der speaker-open) 3) a cylicone terminated with a glass sphere(with radius nearly that of the cone) ensuring a perfect reflectionof spherical waves (cylicone speaker-closed) 4) an open cyli-cone (cylicone speaker-closed)
3 Measurement configuration
To isolate each of the waveguide model elements seen inFigure 1 a test signal a swept sinusoid similar to thatdescribed by Farina [16] was input through a speaker atone end of four tube configurations a cylindrical tube andthe cylinder with an attached conical flare (cylicone) eachmeasured with the end opposite the speaker closed thenopen (see Figure 6)1 Cylinder closed end A two-meter-long cylinder is
rigidly terminated at one end to ensure a perfect re-flection This configuration allows measurement of thespeaker output σ(ω) the speaker reflection ρ(ω) andthe wall loss λ(ω) transfer functions as described insection 41 The arrival responses Ln for this measure-ment may be seen in Figure 7
2 Cylinder open end Opening the cylinder allows mea-surement of the reflection at the open end of a cylinderRop(ω) as described in section 42 Figure 9 shows themeasured responses
3 Cylicone closed end The addition of a conical flarewith a spherical termination (to ensure a perfect reflec-tion) to the above cylindrical tube allows reflection andtransmission at the junction to be observed from themeasured responses shown in Figure 11 as describedin section 43
4 Cylicone open end Opening the conical end allows usto observe the corresponding reflection from the cyli-cone response shown in Figure 13 as described in sec-tion 44
1097
ACTA ACUSTICA UNITED WITH ACUSTICA Smyth Abel Estimating waveguide model elementsVol 95 (2009)
As described below by using a long swept sinusoid to ob-tain a system impulse response for each structure the sys-tem is excited with sufficient energy to achieve a signif-icantly larger SNR than could be obtained with a simplepulse while achieving the bandwidth of interest in thiscase up to 10kHz The impulse responses measured herehave a peak level roughly 70 dB above the noise floorstandard deviation There is no limit to the duration of theswept sinusoid ie itrsquos length is not bounded by the mi-crophone placement the length of the tube or any otherpotential for overlap between signal and reflections seenin other methods since the signal recorded at the micro-phone is processed to produce the response of the systemhad it been excited with a pulse only one sample long
The test signal used was a sinusoid exponentially sweptfrom 20 Hz to the band edge of 2205 kHz (half the sam-pling rate fs) and with a duration of 220 samples or about23 seconds Expressed mathematically the sine sweep isgiven by
s(t) = sin φ(t) φ(t) =t
0ω(τ) dτ (17)
where the frequency ω(t) traces out an exponential sweep
ω(t) = 2πf0eηt (18)
where η = ln(f02fs)T with fs being the sampling ratef0 the initial frequency and T the duration of the sweep
A sine sweep was repeated so that the measured re-sponse during the second sweep would be the circular con-volution of the input sweep with the system In particularto recover the system impulse response from the sweep re-sponse circular deconvolution may be used Denoting byr(t) the system response during the second sweep we have
h(t) = Fminus1 Fr(t) Fs(t) (19)
whereF denotes the Fourier Transform Expressed in Mat-lab code the impulse response h may be found with
h = ifft fft(r)fft(s) (20)
where s contains the sine sweep and r is the system re-sponse during the second sine sweep
The input signal and the measured response is sent andreceived simultaneously using a full duplex audio devicein this work the Mac PowerBook running Logic Pro withthe MOTU Traveler audio interface with 16-bit audio at asampling rate of 441 kHz was used Measurements weretaken in a very large room with the apparatus placed fivemeters from the nearest reflecting object
The four simple tube structures in Figure 6 were assem-bled using PVC tubes and plastic funnels of several sizesThe cylinder was prepared by placing a speaker (CUI IncCMS0281KLX) at one end and by press fitting a six-millimeter-diameter microphone (Panasonic W64M) intoa hole drilled next to the speaker It is not necessary toconsider or document the precise details of the speaker
and microphone as long as their placement and geome-try is consistent from one measurement to the next Anyeffects of placement and geometry are eliminated by thesignal normalization and post processing described in thefollowing section It is important however that the mi-crophone and speaker be placed as close as possible toeach other to minimize the acoustic travel time betweenthem In this way the corresponding frequency at whichdestructive interference occurs between the signal travel-ing from speaker to microphone and that returning fromthe bore is made large Destructive interference will resultin a notch in the transfer function and will impact the abil-ity to take the spectral ratios described in section 4 at thatfrequency In this case the distance between the micro-phone and speaker is sufficiently small to ensure that anyspectral nulls would be outside the 10 kHz band of interest
The cylinder is 2 m long with an inside radius a = 1 cmand the cone is 127 cm long with edge radii of a1 = 1 cmand a2 = 92 cm Both cylinder and cone are sufficientlythick to be considered rigid (3 mm and 2 mm respec-tively)
The impulse response between the speaker and mi-crophone was measured for each of the configurationsThe impulse responses were then equalized according tothe first arrival the speaker-microphone transfer functionσ(ω) to produce the figures shown in section 4 Note thatthe first arrival will also contain contributions from evanes-cent modes in this case above about 10kHz
4 Measured responses
In spite of the wide use of digital waveguides for soundsynthesis it is perhaps less common to observe the be-haviour of wave propagation in actual acoustic systemsfrom the same perspective That is rather than analyzing asystem purely from its frequency response it is informa-tive for analysis and practical for synthesis to observe theeffects of each waveguide element in a sequence of multi-ple arrivals comprising the system impulse response
41 Closed cylinder
A first measurement is taken for the cylinder closed atthe end opposite the speaker ensuring a perfect reflec-tion Comparing arrivals appearing in its impulse responseprovides estimates of the propagation loss λ(ω) speakertransfer function σ(ω) and the speaker reflection functionρ(ω)
The first four arrivals comprising the measured speaker-microphone impulse response are shown in Figure 7 Thedirect path speaker-microphone response is observed as apositive pulse labeled L1 at t asymp 25 ms and correspondsto the equalized transfer function σ(ω) (Note that the25 ms arrival time corresponds to buffering delays be-tween the sweep and response in the measurement sys-tem) This energy propagates down the length of the tubeand is perfectly reflected from the closed end returning tothe speaker and co-located microphone at t asymp 14 ms The
1098
Smyth Abel Estimating waveguide model elements ACTA ACUSTICA UNITED WITH ACUSTICAVol 95 (2009)
arrival L2 is reflected from the speaker and the observedpulse L2 is the sum of the incoming and speaker-reflectedwaves The pulse makes another round trip eventuallyproducing the sequence of consecutive equally spacedpulses observed in Figure 7 There is an attenuation ofthe pulse upon each successive reflection There is alsoan observable low-pass filtering as the signal becomes in-creasingly smooth and widened with every reflection (Fig-ure 7)
Given the arrival responses for a closed cylinder Ln thetransfer function of the reflection from the speaker maybe estimated The first arrival which is the output of thespeaker measured at the mic consists solely of the speakertransfer function
L1 = σ(ω) (21)
The following arrival L2 consists of the sum of leftand right traveling pressure waves at the microphone po-sition the speaker transfer function after having trav-elled twice the length of the tube (round trip) given byLminus
2 = σ(ω)λ2(ω) and the speaker transfer function withround trip losses after reflecting from the speaker L+
2 =σ(ω)λ2(ω)ρ(ω) The second arrival is expressed as theirsum and is given by
L2 = L+2 + Lminus
2 = σ(ω)λ2(ω) 1 + ρ(ω) (22)
Each subsequent arrival for the closed cylinder consists ofthe previous arrival with round-trip wall losses of λ2(ω)and a speaker reflection ρ(ω) The third arrival is thereforegiven by
L3 = σ(ω)λ4(ω)ρ(ω) 1 + ρ(ω) (23)
These three responses are sufficient for defining the inter-mediate variable
ζ(ω) =L1L3
(L2)2=
ρ(ω)1 + ρ(ω)
(24)
which yields an estimate for the speaker reflection transferfunction
ρ(ω) =ζ(ω)
1 minus ζ(ω) (25)
and the propagation loss λ(ω)
λ2(ω) =L3
ρ(ω)L2 (26)
Figure 8 shows the estimated and theoretical propaga-tion loss along with the estimated speaker reflection Notethe good agreement between the estimated and theoreti-cal propagation losses The low-frequency attenuation ob-served in the spectrum of the speaker reflection is likelydue to the speaker being designed to be resonant at lowfrequencies It should be pointed out that there is roughlya fraction of a dB attenuation in the estimated propagationloss beyond that theoretically predicted
0 5 10 15 20 25 30 35 40 45 50-02
0
02
04
06
08
1
12
time - milliseconds
amplitude
L 1 = σ (ω)
L2 = σ (ω)λ 2(ω)(1 + ρ(ω))
L 3 = σ (ω)λ 4(ω)ρ(ω)(1 + ρ(ω))
Figure 7 Arrival responses for the closed cylinder showing in-dividual pulses and corresponding spectra as combinations oftransfer functions for the speaker σ(ω) wall losses λ(ω) andspeaker reflection ρ(ω)
10-1
100
101
-25
-20
-15
-10
-5
0
frequency - kHz
magnitude-dB
estimated
theoretical
estimated speaker reflection
Figure 8 Theoretical (upper smooth curve) and estimated (lowercurve 05 dB down) propagation losses along with the estimatedspeaker reflection (high-pass curve)
42 Open cylinder
The open-end reflection transfer function Rop(ω) maybe estimated from the open cylinder impulse responseshown in Figure 9 The low-pass characteristic describedby Levine and Schwinger is apparent in the successive ar-rivals which are increasingly smeared over time comparedto their closed-end counterpart shown in Figure 7 Succes-sive arrivals show the same propagation delay as observedfor the closed cylinder but in this case with every other re-flection inverted and with increased attenuation and low-pass filtering with each consecutive reflection (Figure 9)This is expected as the responses Yn have all the lossesof the closed cylinder (propagation and speaker reflectionlosses) with the added effect of the open-end reflection
As with the closed cylinder the initial response of thismeasurement is merely the response of the speaker to an
1099
ACTA ACUSTICA UNITED WITH ACUSTICA Smyth Abel Estimating waveguide model elementsVol 95 (2009)
0 5 10 15 20 25 30 35 40 45 50-06
-04
-02
0
02
04
06
08
1
time - milliseconds
amplitude
Y3 = σ (ω)λ 4(ω)R 2op(ω)ρ(ω)(1 + ρ(ω))
Y1 = σ (ω)
Y2 = σ (ω)λ 2(ω)R op(ω)(1 + ρ(ω))
Figure 9 Measured impulse response for the open cylinder show-ing individual arrivals The open-end transfer function Rop(ω)may be isolated by comparison with the corresponding closed-end arrival spectra L2 L3 L4
impulse yielding the speaker transfer function Y1 = σ(ω)The second arrival Y2 is similar toL2 but also includes theopen-end reflection
Y2 = σ(ω)λ2(ω)Rop(ω) 1 + ρ(ω) (27)
Subsequent arrival responses include additional round-tripwall losses and open-end reflections The open-end reflec-tion function may then be estimated as the ratio of the sec-ond arrival spectra
Rop(ω) =Y2
L2 (28)
and is seen in Figure 10
43 Closed cylicone
Attaching a conical flare to the cylindrical tube and termi-nating with a spherical cap to ensure a perfect reflectionallows for estimation of the reflection and transmission fil-ters associated with the junction
Figure 11 shows the measured impulse response in-cluding groups of arrivals resulting from energy reflectedbetween the end cap and the junction Consider the indi-vidual subarrivals within the second arrival group A2 ofFigure 11 The signal from the speaker propagates alongthe length of the cylinder to the junction where part of thesignal is reflected back to the microphone and inverted (ascan be seen from (10) where if Z1(ω) gt Z2(ω) the re-flection R(ω) picks up a negative sign) It appears as thenegative pulse A21 with losses having a low-pass char-acteristic described by Ry(ω) as well as round-trip walllosses given by λ2
y(ω) The part of the signal that is not re-flected is transmitted through the junction with losses hav-ing a complementary high-pass characteristic Ty(ω) Thissignal propagates to the spherical termination where it isldquoperfectlyrdquo reflected arriving back at the junction a short
10-1
100
101
-12
-10
-8
-6
-4
-2
0
2
4
frequency - kHz
magnitude-dB
estimated (upper undulating line)
approximate theoretical (lower line)
Figure 10 Estimated and approximate theoretical open-endcylinder reflection magnitude The theoretical reflection magni-tude is a first-order approximation that captures the general low-pass characteristic Note that the estimated reflection magnitudeis greater than one at low-frequencies where the speaker doesnrsquotgenerate significant power and more measurement noise is in-troduced The measurement matches the approximate theoreticalcurve above 2 kHz and within a fraction of a dB otherwise
0 5 10 15 20 25 30 35 40 45 50-04
-02
0
02
04
06
08
1
time - milliseconds
amplitude
A 2 = (see expansion below)
A 1 = σ (ω)
A3 =
12 14 16 18 20 22 24-04
-02
0
02
04
time - milliseconds
amplitude
A 21 = σ (ω)λ 2y(ω)R y(ω)(1 + ρ(ω))
A 22 = σ (ω)λ 2y(ω)λ
2n(ω)Ty(ω)Tn(ω)(1 + ρ(ω))
Figure 11 Arrival responses are shown with their correspond-ing transfer functions The response A21 shows a low-pass char-acteristic expected of a junction reflection while A22 shows ahigh-pass characteristic expected of two transmissions throughthe junction
time later (corresponding to twice the length of the cone)Part of this signal at the junction is transmitted with trans-fer function Tc(ω) producing the pulse at t asymp 15 ms (A22
in Figure 11) and part is reflected with transfer function
1100
Smyth Abel Estimating waveguide model elements ACTA ACUSTICA UNITED WITH ACUSTICAVol 95 (2009)
2 3 4 5 6 7-05
0
05
1
15
2
25
3
time - milliseconds
amplitude
Figure 12 Measured (lower line) theoretical (thick line offset by10) and components (upper lines offset by 025) for closed conesecond arrival group corresponding to A2i
Rc(ω) Note the doublet nature of the pulse A22 withthe steep transition from a positive to a negative peak be-ing consistent with the high-pass transmission through thejunction The part of the pulse reflected back toward theend cap will appear at the junction to be in part transmit-ted to the cylinder and microphone and in part reflectedonce again toward the end cap
The first subarrival spectrum is
A21 = σ(ω)λ2y(ω)Ry(ω) 1 + ρ(ω) (29)
with subsequent ith arrivals having spectrum
A2i = σ(ω)λ2y(ω)λ2i
n (ω)
middot Ty(ω)Tn(ω)Riminus1n (ω) 1 + ρ(ω) (30)
The individual subarrivals shown in Figure 12 were gener-ated according to (30) using the transmission and reflec-tion filters described in section 2 for the 45o cone andone-centimeter radius cylinder measured The subarrivalsare summed to form the theoretical arrival group shownin Figure 12 Note the good agreement between the the-oretical and measured responses It should be pointed outthat the estimation of the junction transmission and reflec-tion filters in this case is complicated somewhat by theoverlapping nature of the subarrivals Rather than fix thereflection and transmission filters by analyzing individualarrivals hypothesized filters are used to generate the entirearrival group and then adjusted to produce the group bestmatching the one measured
44 Open cylicone
Opening the end of the cone produces an impulse responsewith similar behaviour as for the closed cylicone thoughbecause it is open the cone termination reflections are in-verted and attenuated A positive pulse traveling from thespeaker to the junction is partly inverted upon reflection
0 5 10 15 20 25 30 35 40 45 50-04
-02
0
02
04
06
08
1
time - milliseconds
amplitude
N 3 =
N 2 = (see expansion below)
N 1 = σ (ω)
12 14 16 18 20 22 24 26-04
-03
-02
-01
0
01
time - milliseconds
amplitude
N 22 = σ (ω)λ 2y(ω)λ
2n(ω)Ty(ω)Tn(ω)R op(ω)(1 + ρ(ω))
N 21 = σ (ω)λ 2y(ω)R y(ω)(1 + ρ(ω))
Figure 13 Arrival responses for the open cylicone showing in-dividual pulses corresponding to outputs of a combinations oftransfer functions
arriving at the microphone as a negative pulse and partlytransmitted through the junction this time being invertedat the open cone termination reflection When the negativepulse arrives at the junction a part is transmitted as a neg-ative pulse to the microphone and a part is reflected as apositive pulse back to the open cone termination where itis again inverted becoming negative The negative pulsepropagates back to the junction where it is partly transmit-ted to the microphone and partly reflected and invertedand so on
Figure 13 shows the measured impulse response for theopen cylicone Like the closed cylicone it exhibits a se-quence of arrival groups The N2 subarrival spectra maybe written in terms of the closed cylicone subarrival spec-tra
N2i = A2iRiminus1op (ω) (31)
Approximating the reflection from the open cone as a first-order low-pass filter with characteristic closely matchingboth observed measurement and that described by Levineand Schwinger (15) for a cylindrical radius equal to theaverage of the conersquos edge radii a1 and a2 a theoreticalarrival response is shown in Figure 14 along with its com-ponent subarrivals and the measured N2 arrival group Asin the case of the closed cylicone there is good agreementbetween the measured and theoretical responses
5 Results and conclusions
In this work a measurement technique was presented forestimating elements comprising a waveguide wind instru-
1101
ACTA ACUSTICA UNITED WITH ACUSTICA Smyth Abel Estimating waveguide model elementsVol 95 (2009)
2 3 4 5 6 7-05
0
05
1
15
2
25
3
time - milliseconds
amplitude
Figure 14 Measured (lower line) theoretical (thick line offsetby 10) and components (upper lines offset by 025) for the opencone second arrival corresponding to N22
ment model including filters used in propagation scatter-ing and termination The technique measures the impulseresponse between the mouthpiece end of the instrumentand a co-located microphone By comparing correspond-ing arrivals for different configurations modeled reflec-tion transmission and loss filters may be identified Tovalidate the measurement technique it was applied to asimple instrument configuration having a cylindrical boreconnected to a conical bell The estimated filters and im-pulse response was seen to closely match the theory giv-ing confidence that the measurement method can be gen-erally applied
To confirm the good agreement between the measuredand theoretical reflection transmission and propagationelements waveguide models of the four tube configura-tions were implemented based on cylinder and cone di-mensions Figure 15 shows a close match between mea-sured and theoretically-derived waveguide model impulseresponses for each of the tube configurations
This work will facilitate the development of filter com-ponents for which theoretical solutions may not be avail-able In particular reflection and transmission functions ofwind instrument bores bells and mouthpieces can be mea-sured by comparing the response of a rigidly terminatedtube to that of the tube with the instrument or instrumentsection affixed
Acknowledgments
We would like to sincerely thank Theresa Leonard and theBanff Centre for the Arts for the use of their facilities JohnLundell Carr Wilkerson Michael Coury and HarrisonSmith for their help in fabricating the experimental setupand the Natural Sciences and Engineering Research Coun-cil of Canada (NSERC) for their support Many thanks arealso extended to the reviewers whose careful reading ofthis text and invaluable comments have greatly strength-ened the clarity and accuracy of this work
0 5 10 15 20 25 30 35 40 45 50
0
2
4
6
8
10
time - milliseconds
amplitude
Closed Cylinder
M
T
Open Cylinder
M
T
Closed Cylicone
M
T
Open Cylicone
M
T
Figure 15 Measured and theoretically-derived impulse responsefor (from bottom to top) a closed cylinder an open cylinder aclosed cylicone and an open cylicone
References
[1] J O Smith Digital waveguide modeling of musical instru-ments www-ccrmastanfordedu˜joswaveguide 2003last viewed 1242008
[2] V Vaumllimaumlki Discrete-time modeling of acoustic tubes us-ing fractional delay filters Dissertation Helsinki Univer-sity of Technology Faculty of Electrical Engineering Lab-oratory of Acoustic and Audio Signal Processing EspooFinland 1995 Report no 37
[3] D P Berners Acoustics and signal processing techniquesfor physical modeling of brass instruments DissertationStanford University Stanford California July 1999
[4] A H Benade On the propagation of sound waves in acylindrical conduit Journal of the Acoustical Society ofAmerica 44 (1968) 616ndash623
[5] D H Keefe Acoustical wave propagation in cylindricalducts Transmission line approximation for isothermal and
1102
Smyth Abel Estimating waveguide model elements ACTA ACUSTICA UNITED WITH ACUSTICAVol 95 (2009)
nonisothermal boundary conditions Journal of the Acous-tical Society of America 75 (Januaray 1984) 58ndash62
[6] J Abel T Smyth J O Smith A simple accurate wall lossfilter for acoustic tubes DAFX 2003 Proceedings LondonUK September 2003 International Conference on DigitalAudio Effects 53ndash57
[7] X Rodet C Vergez Physical models of trumpet-like in-struments Detailed behavior and model improvementsProceedings of ICMC 1996 Clear Water Bay Hong-KongAugust 1996 International Computer Music Conference
[8] AHBenade MIIbisi Survey of impedance methods anda new piezo-disk-driven impedance head for air columnsJournal of the Acoustical Society of America 81 (April1987) 1152ndash1167
[9] JKergomard RCausseacute Measurement of acoustic impe-dance using a capillary An attempt to achieve optimiza-tion Journal of the Acoustical Society of America 79(April 1986) 1129ndash1140
[10] T Ossman H Pichler G Widholm Bias A computer-aided test system for brass wind instruments Audio En-gineering Society Preprint October 1989
[11] J Epps JRSmith JWolfe A novel instrument to mea-sure acoustic resonances of the vocal tract during phona-tion Measurement Science and Technology 8 (July 1997)1112ndash1121
[12] M M Sondhi J Resnick The inverse problem for the vo-cal tract Numerical methods acoustical experiments andspeech synthesis Journal of the Acoustical Society ofAmerica 73 (March 1983) 985ndash1002
[13] J Agulloacute S Cardona D H Keefe Time-domain deconvo-lution to measure reflection functions for discontinuities in
waveguides Journal of the Acoustical Society of America97 (March 1995) 1950ndash1957
[14] V Vaumllimaumlki B Hernoux J Huopaniemi M KarjalainenMeasurement and analysis of acoustic tubes using signalprocessing techniques Finnish Signal Processing Sympo-sium (FINSIGrsquo95) Espoo Finland June 1995
[15] D B Sharp Acoustic pulse reflectometry for the measure-ment of musical wind instruments Dissertation Universityof Edinburgh 1996
[16] A Farina Simultaneous measurement of impulse responseand distortion with a swept-sine technique Proceedings ofthe 108th AES Convention Paris France February 200018ndash22
[17] A Lefebvre G Scavone J Able A Buckiewicz-SmithA comparison of impedence measurements using one andtwo microphones Proceedings of ISMA 2007 BarcelonaSpain September 2007 International Symposium on Mu-sical Acoustics
[18] A Lefebvre La mesure de lrsquoimpeacutedance acoustique du sax-ophone alto Diploma Thesis Eacutecole Polytechnique deMontreacuteal 2006
[19] T Smyth J Abel Convolutional synthesis of wind instru-ments Proceedings of the IEEE Workshop on Applica-tions of Signal Processing to Audio and Acoustics (WAS-PAArsquo07) New Paltz New York October 2007
[20] J O Smith Physical audio signal processing for virtualmusical instruments and audio effects December 2008httpccrmastanfordedu˜jospasp
[21] H Levine J Schwinger On the radiation of sound from anunflanged circular pipe Phys Rev 73 (1948) 383ndash406
1103

ACTA ACUSTICA UNITED WITH ACUSTICA Smyth Abel Estimating waveguide model elementsVol 95 (2009)
As described below by using a long swept sinusoid to ob-tain a system impulse response for each structure the sys-tem is excited with sufficient energy to achieve a signif-icantly larger SNR than could be obtained with a simplepulse while achieving the bandwidth of interest in thiscase up to 10kHz The impulse responses measured herehave a peak level roughly 70 dB above the noise floorstandard deviation There is no limit to the duration of theswept sinusoid ie itrsquos length is not bounded by the mi-crophone placement the length of the tube or any otherpotential for overlap between signal and reflections seenin other methods since the signal recorded at the micro-phone is processed to produce the response of the systemhad it been excited with a pulse only one sample long
The test signal used was a sinusoid exponentially sweptfrom 20 Hz to the band edge of 2205 kHz (half the sam-pling rate fs) and with a duration of 220 samples or about23 seconds Expressed mathematically the sine sweep isgiven by
s(t) = sin φ(t) φ(t) =t
0ω(τ) dτ (17)
where the frequency ω(t) traces out an exponential sweep
ω(t) = 2πf0eηt (18)
where η = ln(f02fs)T with fs being the sampling ratef0 the initial frequency and T the duration of the sweep
A sine sweep was repeated so that the measured re-sponse during the second sweep would be the circular con-volution of the input sweep with the system In particularto recover the system impulse response from the sweep re-sponse circular deconvolution may be used Denoting byr(t) the system response during the second sweep we have
h(t) = Fminus1 Fr(t) Fs(t) (19)
whereF denotes the Fourier Transform Expressed in Mat-lab code the impulse response h may be found with
h = ifft fft(r)fft(s) (20)
where s contains the sine sweep and r is the system re-sponse during the second sine sweep
The input signal and the measured response is sent andreceived simultaneously using a full duplex audio devicein this work the Mac PowerBook running Logic Pro withthe MOTU Traveler audio interface with 16-bit audio at asampling rate of 441 kHz was used Measurements weretaken in a very large room with the apparatus placed fivemeters from the nearest reflecting object
The four simple tube structures in Figure 6 were assem-bled using PVC tubes and plastic funnels of several sizesThe cylinder was prepared by placing a speaker (CUI IncCMS0281KLX) at one end and by press fitting a six-millimeter-diameter microphone (Panasonic W64M) intoa hole drilled next to the speaker It is not necessary toconsider or document the precise details of the speaker
and microphone as long as their placement and geome-try is consistent from one measurement to the next Anyeffects of placement and geometry are eliminated by thesignal normalization and post processing described in thefollowing section It is important however that the mi-crophone and speaker be placed as close as possible toeach other to minimize the acoustic travel time betweenthem In this way the corresponding frequency at whichdestructive interference occurs between the signal travel-ing from speaker to microphone and that returning fromthe bore is made large Destructive interference will resultin a notch in the transfer function and will impact the abil-ity to take the spectral ratios described in section 4 at thatfrequency In this case the distance between the micro-phone and speaker is sufficiently small to ensure that anyspectral nulls would be outside the 10 kHz band of interest
The cylinder is 2 m long with an inside radius a = 1 cmand the cone is 127 cm long with edge radii of a1 = 1 cmand a2 = 92 cm Both cylinder and cone are sufficientlythick to be considered rigid (3 mm and 2 mm respec-tively)
The impulse response between the speaker and mi-crophone was measured for each of the configurationsThe impulse responses were then equalized according tothe first arrival the speaker-microphone transfer functionσ(ω) to produce the figures shown in section 4 Note thatthe first arrival will also contain contributions from evanes-cent modes in this case above about 10kHz
4 Measured responses
In spite of the wide use of digital waveguides for soundsynthesis it is perhaps less common to observe the be-haviour of wave propagation in actual acoustic systemsfrom the same perspective That is rather than analyzing asystem purely from its frequency response it is informa-tive for analysis and practical for synthesis to observe theeffects of each waveguide element in a sequence of multi-ple arrivals comprising the system impulse response
41 Closed cylinder
A first measurement is taken for the cylinder closed atthe end opposite the speaker ensuring a perfect reflec-tion Comparing arrivals appearing in its impulse responseprovides estimates of the propagation loss λ(ω) speakertransfer function σ(ω) and the speaker reflection functionρ(ω)
The first four arrivals comprising the measured speaker-microphone impulse response are shown in Figure 7 Thedirect path speaker-microphone response is observed as apositive pulse labeled L1 at t asymp 25 ms and correspondsto the equalized transfer function σ(ω) (Note that the25 ms arrival time corresponds to buffering delays be-tween the sweep and response in the measurement sys-tem) This energy propagates down the length of the tubeand is perfectly reflected from the closed end returning tothe speaker and co-located microphone at t asymp 14 ms The
1098
Smyth Abel Estimating waveguide model elements ACTA ACUSTICA UNITED WITH ACUSTICAVol 95 (2009)
arrival L2 is reflected from the speaker and the observedpulse L2 is the sum of the incoming and speaker-reflectedwaves The pulse makes another round trip eventuallyproducing the sequence of consecutive equally spacedpulses observed in Figure 7 There is an attenuation ofthe pulse upon each successive reflection There is alsoan observable low-pass filtering as the signal becomes in-creasingly smooth and widened with every reflection (Fig-ure 7)
Given the arrival responses for a closed cylinder Ln thetransfer function of the reflection from the speaker maybe estimated The first arrival which is the output of thespeaker measured at the mic consists solely of the speakertransfer function
L1 = σ(ω) (21)
The following arrival L2 consists of the sum of leftand right traveling pressure waves at the microphone po-sition the speaker transfer function after having trav-elled twice the length of the tube (round trip) given byLminus
2 = σ(ω)λ2(ω) and the speaker transfer function withround trip losses after reflecting from the speaker L+
2 =σ(ω)λ2(ω)ρ(ω) The second arrival is expressed as theirsum and is given by
L2 = L+2 + Lminus
2 = σ(ω)λ2(ω) 1 + ρ(ω) (22)
Each subsequent arrival for the closed cylinder consists ofthe previous arrival with round-trip wall losses of λ2(ω)and a speaker reflection ρ(ω) The third arrival is thereforegiven by
L3 = σ(ω)λ4(ω)ρ(ω) 1 + ρ(ω) (23)
These three responses are sufficient for defining the inter-mediate variable
ζ(ω) =L1L3
(L2)2=
ρ(ω)1 + ρ(ω)
(24)
which yields an estimate for the speaker reflection transferfunction
ρ(ω) =ζ(ω)
1 minus ζ(ω) (25)
and the propagation loss λ(ω)
λ2(ω) =L3
ρ(ω)L2 (26)
Figure 8 shows the estimated and theoretical propaga-tion loss along with the estimated speaker reflection Notethe good agreement between the estimated and theoreti-cal propagation losses The low-frequency attenuation ob-served in the spectrum of the speaker reflection is likelydue to the speaker being designed to be resonant at lowfrequencies It should be pointed out that there is roughlya fraction of a dB attenuation in the estimated propagationloss beyond that theoretically predicted
0 5 10 15 20 25 30 35 40 45 50-02
0
02
04
06
08
1
12
time - milliseconds
amplitude
L 1 = σ (ω)
L2 = σ (ω)λ 2(ω)(1 + ρ(ω))
L 3 = σ (ω)λ 4(ω)ρ(ω)(1 + ρ(ω))
Figure 7 Arrival responses for the closed cylinder showing in-dividual pulses and corresponding spectra as combinations oftransfer functions for the speaker σ(ω) wall losses λ(ω) andspeaker reflection ρ(ω)
10-1
100
101
-25
-20
-15
-10
-5
0
frequency - kHz
magnitude-dB
estimated
theoretical
estimated speaker reflection
Figure 8 Theoretical (upper smooth curve) and estimated (lowercurve 05 dB down) propagation losses along with the estimatedspeaker reflection (high-pass curve)
42 Open cylinder
The open-end reflection transfer function Rop(ω) maybe estimated from the open cylinder impulse responseshown in Figure 9 The low-pass characteristic describedby Levine and Schwinger is apparent in the successive ar-rivals which are increasingly smeared over time comparedto their closed-end counterpart shown in Figure 7 Succes-sive arrivals show the same propagation delay as observedfor the closed cylinder but in this case with every other re-flection inverted and with increased attenuation and low-pass filtering with each consecutive reflection (Figure 9)This is expected as the responses Yn have all the lossesof the closed cylinder (propagation and speaker reflectionlosses) with the added effect of the open-end reflection
As with the closed cylinder the initial response of thismeasurement is merely the response of the speaker to an
1099
ACTA ACUSTICA UNITED WITH ACUSTICA Smyth Abel Estimating waveguide model elementsVol 95 (2009)
0 5 10 15 20 25 30 35 40 45 50-06
-04
-02
0
02
04
06
08
1
time - milliseconds
amplitude
Y3 = σ (ω)λ 4(ω)R 2op(ω)ρ(ω)(1 + ρ(ω))
Y1 = σ (ω)
Y2 = σ (ω)λ 2(ω)R op(ω)(1 + ρ(ω))
Figure 9 Measured impulse response for the open cylinder show-ing individual arrivals The open-end transfer function Rop(ω)may be isolated by comparison with the corresponding closed-end arrival spectra L2 L3 L4
impulse yielding the speaker transfer function Y1 = σ(ω)The second arrival Y2 is similar toL2 but also includes theopen-end reflection
Y2 = σ(ω)λ2(ω)Rop(ω) 1 + ρ(ω) (27)
Subsequent arrival responses include additional round-tripwall losses and open-end reflections The open-end reflec-tion function may then be estimated as the ratio of the sec-ond arrival spectra
Rop(ω) =Y2
L2 (28)
and is seen in Figure 10
43 Closed cylicone
Attaching a conical flare to the cylindrical tube and termi-nating with a spherical cap to ensure a perfect reflectionallows for estimation of the reflection and transmission fil-ters associated with the junction
Figure 11 shows the measured impulse response in-cluding groups of arrivals resulting from energy reflectedbetween the end cap and the junction Consider the indi-vidual subarrivals within the second arrival group A2 ofFigure 11 The signal from the speaker propagates alongthe length of the cylinder to the junction where part of thesignal is reflected back to the microphone and inverted (ascan be seen from (10) where if Z1(ω) gt Z2(ω) the re-flection R(ω) picks up a negative sign) It appears as thenegative pulse A21 with losses having a low-pass char-acteristic described by Ry(ω) as well as round-trip walllosses given by λ2
y(ω) The part of the signal that is not re-flected is transmitted through the junction with losses hav-ing a complementary high-pass characteristic Ty(ω) Thissignal propagates to the spherical termination where it isldquoperfectlyrdquo reflected arriving back at the junction a short
10-1
100
101
-12
-10
-8
-6
-4
-2
0
2
4
frequency - kHz
magnitude-dB
estimated (upper undulating line)
approximate theoretical (lower line)
Figure 10 Estimated and approximate theoretical open-endcylinder reflection magnitude The theoretical reflection magni-tude is a first-order approximation that captures the general low-pass characteristic Note that the estimated reflection magnitudeis greater than one at low-frequencies where the speaker doesnrsquotgenerate significant power and more measurement noise is in-troduced The measurement matches the approximate theoreticalcurve above 2 kHz and within a fraction of a dB otherwise
0 5 10 15 20 25 30 35 40 45 50-04
-02
0
02
04
06
08
1
time - milliseconds
amplitude
A 2 = (see expansion below)
A 1 = σ (ω)
A3 =
12 14 16 18 20 22 24-04
-02
0
02
04
time - milliseconds
amplitude
A 21 = σ (ω)λ 2y(ω)R y(ω)(1 + ρ(ω))
A 22 = σ (ω)λ 2y(ω)λ
2n(ω)Ty(ω)Tn(ω)(1 + ρ(ω))
Figure 11 Arrival responses are shown with their correspond-ing transfer functions The response A21 shows a low-pass char-acteristic expected of a junction reflection while A22 shows ahigh-pass characteristic expected of two transmissions throughthe junction
time later (corresponding to twice the length of the cone)Part of this signal at the junction is transmitted with trans-fer function Tc(ω) producing the pulse at t asymp 15 ms (A22
in Figure 11) and part is reflected with transfer function
1100
Smyth Abel Estimating waveguide model elements ACTA ACUSTICA UNITED WITH ACUSTICAVol 95 (2009)
2 3 4 5 6 7-05
0
05
1
15
2
25
3
time - milliseconds
amplitude
Figure 12 Measured (lower line) theoretical (thick line offset by10) and components (upper lines offset by 025) for closed conesecond arrival group corresponding to A2i
Rc(ω) Note the doublet nature of the pulse A22 withthe steep transition from a positive to a negative peak be-ing consistent with the high-pass transmission through thejunction The part of the pulse reflected back toward theend cap will appear at the junction to be in part transmit-ted to the cylinder and microphone and in part reflectedonce again toward the end cap
The first subarrival spectrum is
A21 = σ(ω)λ2y(ω)Ry(ω) 1 + ρ(ω) (29)
with subsequent ith arrivals having spectrum
A2i = σ(ω)λ2y(ω)λ2i
n (ω)
middot Ty(ω)Tn(ω)Riminus1n (ω) 1 + ρ(ω) (30)
The individual subarrivals shown in Figure 12 were gener-ated according to (30) using the transmission and reflec-tion filters described in section 2 for the 45o cone andone-centimeter radius cylinder measured The subarrivalsare summed to form the theoretical arrival group shownin Figure 12 Note the good agreement between the the-oretical and measured responses It should be pointed outthat the estimation of the junction transmission and reflec-tion filters in this case is complicated somewhat by theoverlapping nature of the subarrivals Rather than fix thereflection and transmission filters by analyzing individualarrivals hypothesized filters are used to generate the entirearrival group and then adjusted to produce the group bestmatching the one measured
44 Open cylicone
Opening the end of the cone produces an impulse responsewith similar behaviour as for the closed cylicone thoughbecause it is open the cone termination reflections are in-verted and attenuated A positive pulse traveling from thespeaker to the junction is partly inverted upon reflection
0 5 10 15 20 25 30 35 40 45 50-04
-02
0
02
04
06
08
1
time - milliseconds
amplitude
N 3 =
N 2 = (see expansion below)
N 1 = σ (ω)
12 14 16 18 20 22 24 26-04
-03
-02
-01
0
01
time - milliseconds
amplitude
N 22 = σ (ω)λ 2y(ω)λ
2n(ω)Ty(ω)Tn(ω)R op(ω)(1 + ρ(ω))
N 21 = σ (ω)λ 2y(ω)R y(ω)(1 + ρ(ω))
Figure 13 Arrival responses for the open cylicone showing in-dividual pulses corresponding to outputs of a combinations oftransfer functions
arriving at the microphone as a negative pulse and partlytransmitted through the junction this time being invertedat the open cone termination reflection When the negativepulse arrives at the junction a part is transmitted as a neg-ative pulse to the microphone and a part is reflected as apositive pulse back to the open cone termination where itis again inverted becoming negative The negative pulsepropagates back to the junction where it is partly transmit-ted to the microphone and partly reflected and invertedand so on
Figure 13 shows the measured impulse response for theopen cylicone Like the closed cylicone it exhibits a se-quence of arrival groups The N2 subarrival spectra maybe written in terms of the closed cylicone subarrival spec-tra
N2i = A2iRiminus1op (ω) (31)
Approximating the reflection from the open cone as a first-order low-pass filter with characteristic closely matchingboth observed measurement and that described by Levineand Schwinger (15) for a cylindrical radius equal to theaverage of the conersquos edge radii a1 and a2 a theoreticalarrival response is shown in Figure 14 along with its com-ponent subarrivals and the measured N2 arrival group Asin the case of the closed cylicone there is good agreementbetween the measured and theoretical responses
5 Results and conclusions
In this work a measurement technique was presented forestimating elements comprising a waveguide wind instru-
1101
ACTA ACUSTICA UNITED WITH ACUSTICA Smyth Abel Estimating waveguide model elementsVol 95 (2009)
2 3 4 5 6 7-05
0
05
1
15
2
25
3
time - milliseconds
amplitude
Figure 14 Measured (lower line) theoretical (thick line offsetby 10) and components (upper lines offset by 025) for the opencone second arrival corresponding to N22
ment model including filters used in propagation scatter-ing and termination The technique measures the impulseresponse between the mouthpiece end of the instrumentand a co-located microphone By comparing correspond-ing arrivals for different configurations modeled reflec-tion transmission and loss filters may be identified Tovalidate the measurement technique it was applied to asimple instrument configuration having a cylindrical boreconnected to a conical bell The estimated filters and im-pulse response was seen to closely match the theory giv-ing confidence that the measurement method can be gen-erally applied
To confirm the good agreement between the measuredand theoretical reflection transmission and propagationelements waveguide models of the four tube configura-tions were implemented based on cylinder and cone di-mensions Figure 15 shows a close match between mea-sured and theoretically-derived waveguide model impulseresponses for each of the tube configurations
This work will facilitate the development of filter com-ponents for which theoretical solutions may not be avail-able In particular reflection and transmission functions ofwind instrument bores bells and mouthpieces can be mea-sured by comparing the response of a rigidly terminatedtube to that of the tube with the instrument or instrumentsection affixed
Acknowledgments
We would like to sincerely thank Theresa Leonard and theBanff Centre for the Arts for the use of their facilities JohnLundell Carr Wilkerson Michael Coury and HarrisonSmith for their help in fabricating the experimental setupand the Natural Sciences and Engineering Research Coun-cil of Canada (NSERC) for their support Many thanks arealso extended to the reviewers whose careful reading ofthis text and invaluable comments have greatly strength-ened the clarity and accuracy of this work
0 5 10 15 20 25 30 35 40 45 50
0
2
4
6
8
10
time - milliseconds
amplitude
Closed Cylinder
M
T
Open Cylinder
M
T
Closed Cylicone
M
T
Open Cylicone
M
T
Figure 15 Measured and theoretically-derived impulse responsefor (from bottom to top) a closed cylinder an open cylinder aclosed cylicone and an open cylicone
References
[1] J O Smith Digital waveguide modeling of musical instru-ments www-ccrmastanfordedu˜joswaveguide 2003last viewed 1242008
[2] V Vaumllimaumlki Discrete-time modeling of acoustic tubes us-ing fractional delay filters Dissertation Helsinki Univer-sity of Technology Faculty of Electrical Engineering Lab-oratory of Acoustic and Audio Signal Processing EspooFinland 1995 Report no 37
[3] D P Berners Acoustics and signal processing techniquesfor physical modeling of brass instruments DissertationStanford University Stanford California July 1999
[4] A H Benade On the propagation of sound waves in acylindrical conduit Journal of the Acoustical Society ofAmerica 44 (1968) 616ndash623
[5] D H Keefe Acoustical wave propagation in cylindricalducts Transmission line approximation for isothermal and
1102
Smyth Abel Estimating waveguide model elements ACTA ACUSTICA UNITED WITH ACUSTICAVol 95 (2009)
nonisothermal boundary conditions Journal of the Acous-tical Society of America 75 (Januaray 1984) 58ndash62
[6] J Abel T Smyth J O Smith A simple accurate wall lossfilter for acoustic tubes DAFX 2003 Proceedings LondonUK September 2003 International Conference on DigitalAudio Effects 53ndash57
[7] X Rodet C Vergez Physical models of trumpet-like in-struments Detailed behavior and model improvementsProceedings of ICMC 1996 Clear Water Bay Hong-KongAugust 1996 International Computer Music Conference
[8] AHBenade MIIbisi Survey of impedance methods anda new piezo-disk-driven impedance head for air columnsJournal of the Acoustical Society of America 81 (April1987) 1152ndash1167
[9] JKergomard RCausseacute Measurement of acoustic impe-dance using a capillary An attempt to achieve optimiza-tion Journal of the Acoustical Society of America 79(April 1986) 1129ndash1140
[10] T Ossman H Pichler G Widholm Bias A computer-aided test system for brass wind instruments Audio En-gineering Society Preprint October 1989
[11] J Epps JRSmith JWolfe A novel instrument to mea-sure acoustic resonances of the vocal tract during phona-tion Measurement Science and Technology 8 (July 1997)1112ndash1121
[12] M M Sondhi J Resnick The inverse problem for the vo-cal tract Numerical methods acoustical experiments andspeech synthesis Journal of the Acoustical Society ofAmerica 73 (March 1983) 985ndash1002
[13] J Agulloacute S Cardona D H Keefe Time-domain deconvo-lution to measure reflection functions for discontinuities in
waveguides Journal of the Acoustical Society of America97 (March 1995) 1950ndash1957
[14] V Vaumllimaumlki B Hernoux J Huopaniemi M KarjalainenMeasurement and analysis of acoustic tubes using signalprocessing techniques Finnish Signal Processing Sympo-sium (FINSIGrsquo95) Espoo Finland June 1995
[15] D B Sharp Acoustic pulse reflectometry for the measure-ment of musical wind instruments Dissertation Universityof Edinburgh 1996
[16] A Farina Simultaneous measurement of impulse responseand distortion with a swept-sine technique Proceedings ofthe 108th AES Convention Paris France February 200018ndash22
[17] A Lefebvre G Scavone J Able A Buckiewicz-SmithA comparison of impedence measurements using one andtwo microphones Proceedings of ISMA 2007 BarcelonaSpain September 2007 International Symposium on Mu-sical Acoustics
[18] A Lefebvre La mesure de lrsquoimpeacutedance acoustique du sax-ophone alto Diploma Thesis Eacutecole Polytechnique deMontreacuteal 2006
[19] T Smyth J Abel Convolutional synthesis of wind instru-ments Proceedings of the IEEE Workshop on Applica-tions of Signal Processing to Audio and Acoustics (WAS-PAArsquo07) New Paltz New York October 2007
[20] J O Smith Physical audio signal processing for virtualmusical instruments and audio effects December 2008httpccrmastanfordedu˜jospasp
[21] H Levine J Schwinger On the radiation of sound from anunflanged circular pipe Phys Rev 73 (1948) 383ndash406
1103

Smyth Abel Estimating waveguide model elements ACTA ACUSTICA UNITED WITH ACUSTICAVol 95 (2009)
arrival L2 is reflected from the speaker and the observedpulse L2 is the sum of the incoming and speaker-reflectedwaves The pulse makes another round trip eventuallyproducing the sequence of consecutive equally spacedpulses observed in Figure 7 There is an attenuation ofthe pulse upon each successive reflection There is alsoan observable low-pass filtering as the signal becomes in-creasingly smooth and widened with every reflection (Fig-ure 7)
Given the arrival responses for a closed cylinder Ln thetransfer function of the reflection from the speaker maybe estimated The first arrival which is the output of thespeaker measured at the mic consists solely of the speakertransfer function
L1 = σ(ω) (21)
The following arrival L2 consists of the sum of leftand right traveling pressure waves at the microphone po-sition the speaker transfer function after having trav-elled twice the length of the tube (round trip) given byLminus
2 = σ(ω)λ2(ω) and the speaker transfer function withround trip losses after reflecting from the speaker L+
2 =σ(ω)λ2(ω)ρ(ω) The second arrival is expressed as theirsum and is given by
L2 = L+2 + Lminus
2 = σ(ω)λ2(ω) 1 + ρ(ω) (22)
Each subsequent arrival for the closed cylinder consists ofthe previous arrival with round-trip wall losses of λ2(ω)and a speaker reflection ρ(ω) The third arrival is thereforegiven by
L3 = σ(ω)λ4(ω)ρ(ω) 1 + ρ(ω) (23)
These three responses are sufficient for defining the inter-mediate variable
ζ(ω) =L1L3
(L2)2=
ρ(ω)1 + ρ(ω)
(24)
which yields an estimate for the speaker reflection transferfunction
ρ(ω) =ζ(ω)
1 minus ζ(ω) (25)
and the propagation loss λ(ω)
λ2(ω) =L3
ρ(ω)L2 (26)
Figure 8 shows the estimated and theoretical propaga-tion loss along with the estimated speaker reflection Notethe good agreement between the estimated and theoreti-cal propagation losses The low-frequency attenuation ob-served in the spectrum of the speaker reflection is likelydue to the speaker being designed to be resonant at lowfrequencies It should be pointed out that there is roughlya fraction of a dB attenuation in the estimated propagationloss beyond that theoretically predicted
0 5 10 15 20 25 30 35 40 45 50-02
0
02
04
06
08
1
12
time - milliseconds
amplitude
L 1 = σ (ω)
L2 = σ (ω)λ 2(ω)(1 + ρ(ω))
L 3 = σ (ω)λ 4(ω)ρ(ω)(1 + ρ(ω))
Figure 7 Arrival responses for the closed cylinder showing in-dividual pulses and corresponding spectra as combinations oftransfer functions for the speaker σ(ω) wall losses λ(ω) andspeaker reflection ρ(ω)
10-1
100
101
-25
-20
-15
-10
-5
0
frequency - kHz
magnitude-dB
estimated
theoretical
estimated speaker reflection
Figure 8 Theoretical (upper smooth curve) and estimated (lowercurve 05 dB down) propagation losses along with the estimatedspeaker reflection (high-pass curve)
42 Open cylinder
The open-end reflection transfer function Rop(ω) maybe estimated from the open cylinder impulse responseshown in Figure 9 The low-pass characteristic describedby Levine and Schwinger is apparent in the successive ar-rivals which are increasingly smeared over time comparedto their closed-end counterpart shown in Figure 7 Succes-sive arrivals show the same propagation delay as observedfor the closed cylinder but in this case with every other re-flection inverted and with increased attenuation and low-pass filtering with each consecutive reflection (Figure 9)This is expected as the responses Yn have all the lossesof the closed cylinder (propagation and speaker reflectionlosses) with the added effect of the open-end reflection
As with the closed cylinder the initial response of thismeasurement is merely the response of the speaker to an
1099
ACTA ACUSTICA UNITED WITH ACUSTICA Smyth Abel Estimating waveguide model elementsVol 95 (2009)
0 5 10 15 20 25 30 35 40 45 50-06
-04
-02
0
02
04
06
08
1
time - milliseconds
amplitude
Y3 = σ (ω)λ 4(ω)R 2op(ω)ρ(ω)(1 + ρ(ω))
Y1 = σ (ω)
Y2 = σ (ω)λ 2(ω)R op(ω)(1 + ρ(ω))
Figure 9 Measured impulse response for the open cylinder show-ing individual arrivals The open-end transfer function Rop(ω)may be isolated by comparison with the corresponding closed-end arrival spectra L2 L3 L4
impulse yielding the speaker transfer function Y1 = σ(ω)The second arrival Y2 is similar toL2 but also includes theopen-end reflection
Y2 = σ(ω)λ2(ω)Rop(ω) 1 + ρ(ω) (27)
Subsequent arrival responses include additional round-tripwall losses and open-end reflections The open-end reflec-tion function may then be estimated as the ratio of the sec-ond arrival spectra
Rop(ω) =Y2
L2 (28)
and is seen in Figure 10
43 Closed cylicone
Attaching a conical flare to the cylindrical tube and termi-nating with a spherical cap to ensure a perfect reflectionallows for estimation of the reflection and transmission fil-ters associated with the junction
Figure 11 shows the measured impulse response in-cluding groups of arrivals resulting from energy reflectedbetween the end cap and the junction Consider the indi-vidual subarrivals within the second arrival group A2 ofFigure 11 The signal from the speaker propagates alongthe length of the cylinder to the junction where part of thesignal is reflected back to the microphone and inverted (ascan be seen from (10) where if Z1(ω) gt Z2(ω) the re-flection R(ω) picks up a negative sign) It appears as thenegative pulse A21 with losses having a low-pass char-acteristic described by Ry(ω) as well as round-trip walllosses given by λ2
y(ω) The part of the signal that is not re-flected is transmitted through the junction with losses hav-ing a complementary high-pass characteristic Ty(ω) Thissignal propagates to the spherical termination where it isldquoperfectlyrdquo reflected arriving back at the junction a short
10-1
100
101
-12
-10
-8
-6
-4
-2
0
2
4
frequency - kHz
magnitude-dB
estimated (upper undulating line)
approximate theoretical (lower line)
Figure 10 Estimated and approximate theoretical open-endcylinder reflection magnitude The theoretical reflection magni-tude is a first-order approximation that captures the general low-pass characteristic Note that the estimated reflection magnitudeis greater than one at low-frequencies where the speaker doesnrsquotgenerate significant power and more measurement noise is in-troduced The measurement matches the approximate theoreticalcurve above 2 kHz and within a fraction of a dB otherwise
0 5 10 15 20 25 30 35 40 45 50-04
-02
0
02
04
06
08
1
time - milliseconds
amplitude
A 2 = (see expansion below)
A 1 = σ (ω)
A3 =
12 14 16 18 20 22 24-04
-02
0
02
04
time - milliseconds
amplitude
A 21 = σ (ω)λ 2y(ω)R y(ω)(1 + ρ(ω))
A 22 = σ (ω)λ 2y(ω)λ
2n(ω)Ty(ω)Tn(ω)(1 + ρ(ω))
Figure 11 Arrival responses are shown with their correspond-ing transfer functions The response A21 shows a low-pass char-acteristic expected of a junction reflection while A22 shows ahigh-pass characteristic expected of two transmissions throughthe junction
time later (corresponding to twice the length of the cone)Part of this signal at the junction is transmitted with trans-fer function Tc(ω) producing the pulse at t asymp 15 ms (A22
in Figure 11) and part is reflected with transfer function
1100
Smyth Abel Estimating waveguide model elements ACTA ACUSTICA UNITED WITH ACUSTICAVol 95 (2009)
2 3 4 5 6 7-05
0
05
1
15
2
25
3
time - milliseconds
amplitude
Figure 12 Measured (lower line) theoretical (thick line offset by10) and components (upper lines offset by 025) for closed conesecond arrival group corresponding to A2i
Rc(ω) Note the doublet nature of the pulse A22 withthe steep transition from a positive to a negative peak be-ing consistent with the high-pass transmission through thejunction The part of the pulse reflected back toward theend cap will appear at the junction to be in part transmit-ted to the cylinder and microphone and in part reflectedonce again toward the end cap
The first subarrival spectrum is
A21 = σ(ω)λ2y(ω)Ry(ω) 1 + ρ(ω) (29)
with subsequent ith arrivals having spectrum
A2i = σ(ω)λ2y(ω)λ2i
n (ω)
middot Ty(ω)Tn(ω)Riminus1n (ω) 1 + ρ(ω) (30)
The individual subarrivals shown in Figure 12 were gener-ated according to (30) using the transmission and reflec-tion filters described in section 2 for the 45o cone andone-centimeter radius cylinder measured The subarrivalsare summed to form the theoretical arrival group shownin Figure 12 Note the good agreement between the the-oretical and measured responses It should be pointed outthat the estimation of the junction transmission and reflec-tion filters in this case is complicated somewhat by theoverlapping nature of the subarrivals Rather than fix thereflection and transmission filters by analyzing individualarrivals hypothesized filters are used to generate the entirearrival group and then adjusted to produce the group bestmatching the one measured
44 Open cylicone
Opening the end of the cone produces an impulse responsewith similar behaviour as for the closed cylicone thoughbecause it is open the cone termination reflections are in-verted and attenuated A positive pulse traveling from thespeaker to the junction is partly inverted upon reflection
0 5 10 15 20 25 30 35 40 45 50-04
-02
0
02
04
06
08
1
time - milliseconds
amplitude
N 3 =
N 2 = (see expansion below)
N 1 = σ (ω)
12 14 16 18 20 22 24 26-04
-03
-02
-01
0
01
time - milliseconds
amplitude
N 22 = σ (ω)λ 2y(ω)λ
2n(ω)Ty(ω)Tn(ω)R op(ω)(1 + ρ(ω))
N 21 = σ (ω)λ 2y(ω)R y(ω)(1 + ρ(ω))
Figure 13 Arrival responses for the open cylicone showing in-dividual pulses corresponding to outputs of a combinations oftransfer functions
arriving at the microphone as a negative pulse and partlytransmitted through the junction this time being invertedat the open cone termination reflection When the negativepulse arrives at the junction a part is transmitted as a neg-ative pulse to the microphone and a part is reflected as apositive pulse back to the open cone termination where itis again inverted becoming negative The negative pulsepropagates back to the junction where it is partly transmit-ted to the microphone and partly reflected and invertedand so on
Figure 13 shows the measured impulse response for theopen cylicone Like the closed cylicone it exhibits a se-quence of arrival groups The N2 subarrival spectra maybe written in terms of the closed cylicone subarrival spec-tra
N2i = A2iRiminus1op (ω) (31)
Approximating the reflection from the open cone as a first-order low-pass filter with characteristic closely matchingboth observed measurement and that described by Levineand Schwinger (15) for a cylindrical radius equal to theaverage of the conersquos edge radii a1 and a2 a theoreticalarrival response is shown in Figure 14 along with its com-ponent subarrivals and the measured N2 arrival group Asin the case of the closed cylicone there is good agreementbetween the measured and theoretical responses
5 Results and conclusions
In this work a measurement technique was presented forestimating elements comprising a waveguide wind instru-
1101
ACTA ACUSTICA UNITED WITH ACUSTICA Smyth Abel Estimating waveguide model elementsVol 95 (2009)
2 3 4 5 6 7-05
0
05
1
15
2
25
3
time - milliseconds
amplitude
Figure 14 Measured (lower line) theoretical (thick line offsetby 10) and components (upper lines offset by 025) for the opencone second arrival corresponding to N22
ment model including filters used in propagation scatter-ing and termination The technique measures the impulseresponse between the mouthpiece end of the instrumentand a co-located microphone By comparing correspond-ing arrivals for different configurations modeled reflec-tion transmission and loss filters may be identified Tovalidate the measurement technique it was applied to asimple instrument configuration having a cylindrical boreconnected to a conical bell The estimated filters and im-pulse response was seen to closely match the theory giv-ing confidence that the measurement method can be gen-erally applied
To confirm the good agreement between the measuredand theoretical reflection transmission and propagationelements waveguide models of the four tube configura-tions were implemented based on cylinder and cone di-mensions Figure 15 shows a close match between mea-sured and theoretically-derived waveguide model impulseresponses for each of the tube configurations
This work will facilitate the development of filter com-ponents for which theoretical solutions may not be avail-able In particular reflection and transmission functions ofwind instrument bores bells and mouthpieces can be mea-sured by comparing the response of a rigidly terminatedtube to that of the tube with the instrument or instrumentsection affixed
Acknowledgments
We would like to sincerely thank Theresa Leonard and theBanff Centre for the Arts for the use of their facilities JohnLundell Carr Wilkerson Michael Coury and HarrisonSmith for their help in fabricating the experimental setupand the Natural Sciences and Engineering Research Coun-cil of Canada (NSERC) for their support Many thanks arealso extended to the reviewers whose careful reading ofthis text and invaluable comments have greatly strength-ened the clarity and accuracy of this work
0 5 10 15 20 25 30 35 40 45 50
0
2
4
6
8
10
time - milliseconds
amplitude
Closed Cylinder
M
T
Open Cylinder
M
T
Closed Cylicone
M
T
Open Cylicone
M
T
Figure 15 Measured and theoretically-derived impulse responsefor (from bottom to top) a closed cylinder an open cylinder aclosed cylicone and an open cylicone
References
[1] J O Smith Digital waveguide modeling of musical instru-ments www-ccrmastanfordedu˜joswaveguide 2003last viewed 1242008
[2] V Vaumllimaumlki Discrete-time modeling of acoustic tubes us-ing fractional delay filters Dissertation Helsinki Univer-sity of Technology Faculty of Electrical Engineering Lab-oratory of Acoustic and Audio Signal Processing EspooFinland 1995 Report no 37
[3] D P Berners Acoustics and signal processing techniquesfor physical modeling of brass instruments DissertationStanford University Stanford California July 1999
[4] A H Benade On the propagation of sound waves in acylindrical conduit Journal of the Acoustical Society ofAmerica 44 (1968) 616ndash623
[5] D H Keefe Acoustical wave propagation in cylindricalducts Transmission line approximation for isothermal and
1102
Smyth Abel Estimating waveguide model elements ACTA ACUSTICA UNITED WITH ACUSTICAVol 95 (2009)
nonisothermal boundary conditions Journal of the Acous-tical Society of America 75 (Januaray 1984) 58ndash62
[6] J Abel T Smyth J O Smith A simple accurate wall lossfilter for acoustic tubes DAFX 2003 Proceedings LondonUK September 2003 International Conference on DigitalAudio Effects 53ndash57
[7] X Rodet C Vergez Physical models of trumpet-like in-struments Detailed behavior and model improvementsProceedings of ICMC 1996 Clear Water Bay Hong-KongAugust 1996 International Computer Music Conference
[8] AHBenade MIIbisi Survey of impedance methods anda new piezo-disk-driven impedance head for air columnsJournal of the Acoustical Society of America 81 (April1987) 1152ndash1167
[9] JKergomard RCausseacute Measurement of acoustic impe-dance using a capillary An attempt to achieve optimiza-tion Journal of the Acoustical Society of America 79(April 1986) 1129ndash1140
[10] T Ossman H Pichler G Widholm Bias A computer-aided test system for brass wind instruments Audio En-gineering Society Preprint October 1989
[11] J Epps JRSmith JWolfe A novel instrument to mea-sure acoustic resonances of the vocal tract during phona-tion Measurement Science and Technology 8 (July 1997)1112ndash1121
[12] M M Sondhi J Resnick The inverse problem for the vo-cal tract Numerical methods acoustical experiments andspeech synthesis Journal of the Acoustical Society ofAmerica 73 (March 1983) 985ndash1002
[13] J Agulloacute S Cardona D H Keefe Time-domain deconvo-lution to measure reflection functions for discontinuities in
waveguides Journal of the Acoustical Society of America97 (March 1995) 1950ndash1957
[14] V Vaumllimaumlki B Hernoux J Huopaniemi M KarjalainenMeasurement and analysis of acoustic tubes using signalprocessing techniques Finnish Signal Processing Sympo-sium (FINSIGrsquo95) Espoo Finland June 1995
[15] D B Sharp Acoustic pulse reflectometry for the measure-ment of musical wind instruments Dissertation Universityof Edinburgh 1996
[16] A Farina Simultaneous measurement of impulse responseand distortion with a swept-sine technique Proceedings ofthe 108th AES Convention Paris France February 200018ndash22
[17] A Lefebvre G Scavone J Able A Buckiewicz-SmithA comparison of impedence measurements using one andtwo microphones Proceedings of ISMA 2007 BarcelonaSpain September 2007 International Symposium on Mu-sical Acoustics
[18] A Lefebvre La mesure de lrsquoimpeacutedance acoustique du sax-ophone alto Diploma Thesis Eacutecole Polytechnique deMontreacuteal 2006
[19] T Smyth J Abel Convolutional synthesis of wind instru-ments Proceedings of the IEEE Workshop on Applica-tions of Signal Processing to Audio and Acoustics (WAS-PAArsquo07) New Paltz New York October 2007
[20] J O Smith Physical audio signal processing for virtualmusical instruments and audio effects December 2008httpccrmastanfordedu˜jospasp
[21] H Levine J Schwinger On the radiation of sound from anunflanged circular pipe Phys Rev 73 (1948) 383ndash406
1103
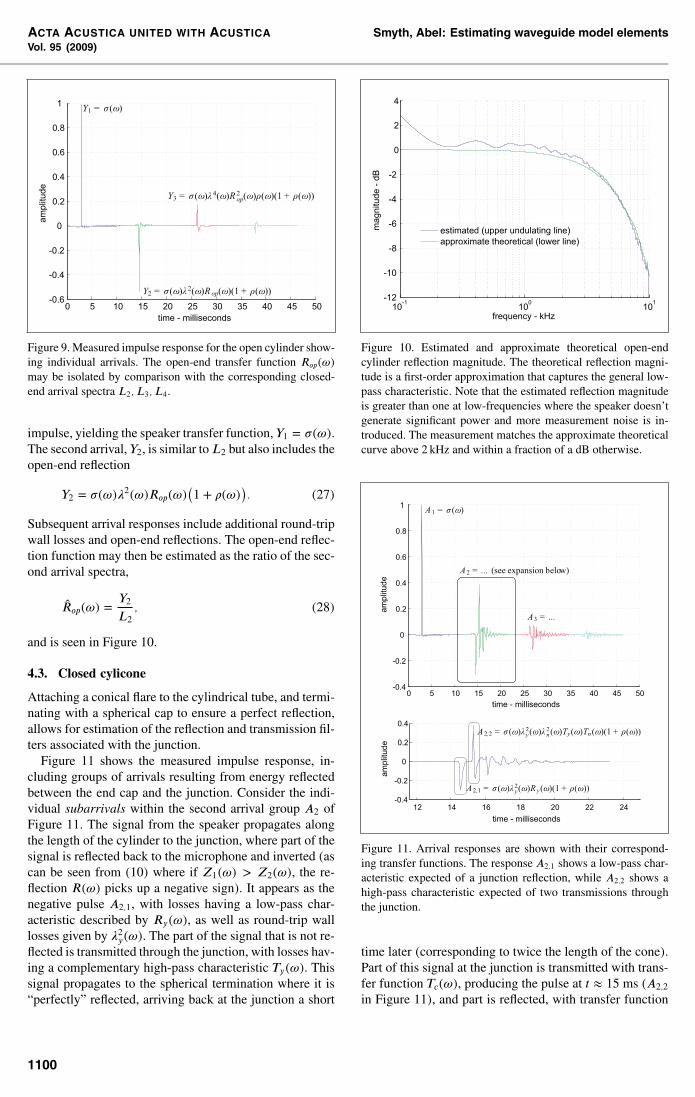
ACTA ACUSTICA UNITED WITH ACUSTICA Smyth Abel Estimating waveguide model elementsVol 95 (2009)
0 5 10 15 20 25 30 35 40 45 50-06
-04
-02
0
02
04
06
08
1
time - milliseconds
amplitude
Y3 = σ (ω)λ 4(ω)R 2op(ω)ρ(ω)(1 + ρ(ω))
Y1 = σ (ω)
Y2 = σ (ω)λ 2(ω)R op(ω)(1 + ρ(ω))
Figure 9 Measured impulse response for the open cylinder show-ing individual arrivals The open-end transfer function Rop(ω)may be isolated by comparison with the corresponding closed-end arrival spectra L2 L3 L4
impulse yielding the speaker transfer function Y1 = σ(ω)The second arrival Y2 is similar toL2 but also includes theopen-end reflection
Y2 = σ(ω)λ2(ω)Rop(ω) 1 + ρ(ω) (27)
Subsequent arrival responses include additional round-tripwall losses and open-end reflections The open-end reflec-tion function may then be estimated as the ratio of the sec-ond arrival spectra
Rop(ω) =Y2
L2 (28)
and is seen in Figure 10
43 Closed cylicone
Attaching a conical flare to the cylindrical tube and termi-nating with a spherical cap to ensure a perfect reflectionallows for estimation of the reflection and transmission fil-ters associated with the junction
Figure 11 shows the measured impulse response in-cluding groups of arrivals resulting from energy reflectedbetween the end cap and the junction Consider the indi-vidual subarrivals within the second arrival group A2 ofFigure 11 The signal from the speaker propagates alongthe length of the cylinder to the junction where part of thesignal is reflected back to the microphone and inverted (ascan be seen from (10) where if Z1(ω) gt Z2(ω) the re-flection R(ω) picks up a negative sign) It appears as thenegative pulse A21 with losses having a low-pass char-acteristic described by Ry(ω) as well as round-trip walllosses given by λ2
y(ω) The part of the signal that is not re-flected is transmitted through the junction with losses hav-ing a complementary high-pass characteristic Ty(ω) Thissignal propagates to the spherical termination where it isldquoperfectlyrdquo reflected arriving back at the junction a short
10-1
100
101
-12
-10
-8
-6
-4
-2
0
2
4
frequency - kHz
magnitude-dB
estimated (upper undulating line)
approximate theoretical (lower line)
Figure 10 Estimated and approximate theoretical open-endcylinder reflection magnitude The theoretical reflection magni-tude is a first-order approximation that captures the general low-pass characteristic Note that the estimated reflection magnitudeis greater than one at low-frequencies where the speaker doesnrsquotgenerate significant power and more measurement noise is in-troduced The measurement matches the approximate theoreticalcurve above 2 kHz and within a fraction of a dB otherwise
0 5 10 15 20 25 30 35 40 45 50-04
-02
0
02
04
06
08
1
time - milliseconds
amplitude
A 2 = (see expansion below)
A 1 = σ (ω)
A3 =
12 14 16 18 20 22 24-04
-02
0
02
04
time - milliseconds
amplitude
A 21 = σ (ω)λ 2y(ω)R y(ω)(1 + ρ(ω))
A 22 = σ (ω)λ 2y(ω)λ
2n(ω)Ty(ω)Tn(ω)(1 + ρ(ω))
Figure 11 Arrival responses are shown with their correspond-ing transfer functions The response A21 shows a low-pass char-acteristic expected of a junction reflection while A22 shows ahigh-pass characteristic expected of two transmissions throughthe junction
time later (corresponding to twice the length of the cone)Part of this signal at the junction is transmitted with trans-fer function Tc(ω) producing the pulse at t asymp 15 ms (A22
in Figure 11) and part is reflected with transfer function
1100
Smyth Abel Estimating waveguide model elements ACTA ACUSTICA UNITED WITH ACUSTICAVol 95 (2009)
2 3 4 5 6 7-05
0
05
1
15
2
25
3
time - milliseconds
amplitude
Figure 12 Measured (lower line) theoretical (thick line offset by10) and components (upper lines offset by 025) for closed conesecond arrival group corresponding to A2i
Rc(ω) Note the doublet nature of the pulse A22 withthe steep transition from a positive to a negative peak be-ing consistent with the high-pass transmission through thejunction The part of the pulse reflected back toward theend cap will appear at the junction to be in part transmit-ted to the cylinder and microphone and in part reflectedonce again toward the end cap
The first subarrival spectrum is
A21 = σ(ω)λ2y(ω)Ry(ω) 1 + ρ(ω) (29)
with subsequent ith arrivals having spectrum
A2i = σ(ω)λ2y(ω)λ2i
n (ω)
middot Ty(ω)Tn(ω)Riminus1n (ω) 1 + ρ(ω) (30)
The individual subarrivals shown in Figure 12 were gener-ated according to (30) using the transmission and reflec-tion filters described in section 2 for the 45o cone andone-centimeter radius cylinder measured The subarrivalsare summed to form the theoretical arrival group shownin Figure 12 Note the good agreement between the the-oretical and measured responses It should be pointed outthat the estimation of the junction transmission and reflec-tion filters in this case is complicated somewhat by theoverlapping nature of the subarrivals Rather than fix thereflection and transmission filters by analyzing individualarrivals hypothesized filters are used to generate the entirearrival group and then adjusted to produce the group bestmatching the one measured
44 Open cylicone
Opening the end of the cone produces an impulse responsewith similar behaviour as for the closed cylicone thoughbecause it is open the cone termination reflections are in-verted and attenuated A positive pulse traveling from thespeaker to the junction is partly inverted upon reflection
0 5 10 15 20 25 30 35 40 45 50-04
-02
0
02
04
06
08
1
time - milliseconds
amplitude
N 3 =
N 2 = (see expansion below)
N 1 = σ (ω)
12 14 16 18 20 22 24 26-04
-03
-02
-01
0
01
time - milliseconds
amplitude
N 22 = σ (ω)λ 2y(ω)λ
2n(ω)Ty(ω)Tn(ω)R op(ω)(1 + ρ(ω))
N 21 = σ (ω)λ 2y(ω)R y(ω)(1 + ρ(ω))
Figure 13 Arrival responses for the open cylicone showing in-dividual pulses corresponding to outputs of a combinations oftransfer functions
arriving at the microphone as a negative pulse and partlytransmitted through the junction this time being invertedat the open cone termination reflection When the negativepulse arrives at the junction a part is transmitted as a neg-ative pulse to the microphone and a part is reflected as apositive pulse back to the open cone termination where itis again inverted becoming negative The negative pulsepropagates back to the junction where it is partly transmit-ted to the microphone and partly reflected and invertedand so on
Figure 13 shows the measured impulse response for theopen cylicone Like the closed cylicone it exhibits a se-quence of arrival groups The N2 subarrival spectra maybe written in terms of the closed cylicone subarrival spec-tra
N2i = A2iRiminus1op (ω) (31)
Approximating the reflection from the open cone as a first-order low-pass filter with characteristic closely matchingboth observed measurement and that described by Levineand Schwinger (15) for a cylindrical radius equal to theaverage of the conersquos edge radii a1 and a2 a theoreticalarrival response is shown in Figure 14 along with its com-ponent subarrivals and the measured N2 arrival group Asin the case of the closed cylicone there is good agreementbetween the measured and theoretical responses
5 Results and conclusions
In this work a measurement technique was presented forestimating elements comprising a waveguide wind instru-
1101
ACTA ACUSTICA UNITED WITH ACUSTICA Smyth Abel Estimating waveguide model elementsVol 95 (2009)
2 3 4 5 6 7-05
0
05
1
15
2
25
3
time - milliseconds
amplitude
Figure 14 Measured (lower line) theoretical (thick line offsetby 10) and components (upper lines offset by 025) for the opencone second arrival corresponding to N22
ment model including filters used in propagation scatter-ing and termination The technique measures the impulseresponse between the mouthpiece end of the instrumentand a co-located microphone By comparing correspond-ing arrivals for different configurations modeled reflec-tion transmission and loss filters may be identified Tovalidate the measurement technique it was applied to asimple instrument configuration having a cylindrical boreconnected to a conical bell The estimated filters and im-pulse response was seen to closely match the theory giv-ing confidence that the measurement method can be gen-erally applied
To confirm the good agreement between the measuredand theoretical reflection transmission and propagationelements waveguide models of the four tube configura-tions were implemented based on cylinder and cone di-mensions Figure 15 shows a close match between mea-sured and theoretically-derived waveguide model impulseresponses for each of the tube configurations
This work will facilitate the development of filter com-ponents for which theoretical solutions may not be avail-able In particular reflection and transmission functions ofwind instrument bores bells and mouthpieces can be mea-sured by comparing the response of a rigidly terminatedtube to that of the tube with the instrument or instrumentsection affixed
Acknowledgments
We would like to sincerely thank Theresa Leonard and theBanff Centre for the Arts for the use of their facilities JohnLundell Carr Wilkerson Michael Coury and HarrisonSmith for their help in fabricating the experimental setupand the Natural Sciences and Engineering Research Coun-cil of Canada (NSERC) for their support Many thanks arealso extended to the reviewers whose careful reading ofthis text and invaluable comments have greatly strength-ened the clarity and accuracy of this work
0 5 10 15 20 25 30 35 40 45 50
0
2
4
6
8
10
time - milliseconds
amplitude
Closed Cylinder
M
T
Open Cylinder
M
T
Closed Cylicone
M
T
Open Cylicone
M
T
Figure 15 Measured and theoretically-derived impulse responsefor (from bottom to top) a closed cylinder an open cylinder aclosed cylicone and an open cylicone
References
[1] J O Smith Digital waveguide modeling of musical instru-ments www-ccrmastanfordedu˜joswaveguide 2003last viewed 1242008
[2] V Vaumllimaumlki Discrete-time modeling of acoustic tubes us-ing fractional delay filters Dissertation Helsinki Univer-sity of Technology Faculty of Electrical Engineering Lab-oratory of Acoustic and Audio Signal Processing EspooFinland 1995 Report no 37
[3] D P Berners Acoustics and signal processing techniquesfor physical modeling of brass instruments DissertationStanford University Stanford California July 1999
[4] A H Benade On the propagation of sound waves in acylindrical conduit Journal of the Acoustical Society ofAmerica 44 (1968) 616ndash623
[5] D H Keefe Acoustical wave propagation in cylindricalducts Transmission line approximation for isothermal and
1102
Smyth Abel Estimating waveguide model elements ACTA ACUSTICA UNITED WITH ACUSTICAVol 95 (2009)
nonisothermal boundary conditions Journal of the Acous-tical Society of America 75 (Januaray 1984) 58ndash62
[6] J Abel T Smyth J O Smith A simple accurate wall lossfilter for acoustic tubes DAFX 2003 Proceedings LondonUK September 2003 International Conference on DigitalAudio Effects 53ndash57
[7] X Rodet C Vergez Physical models of trumpet-like in-struments Detailed behavior and model improvementsProceedings of ICMC 1996 Clear Water Bay Hong-KongAugust 1996 International Computer Music Conference
[8] AHBenade MIIbisi Survey of impedance methods anda new piezo-disk-driven impedance head for air columnsJournal of the Acoustical Society of America 81 (April1987) 1152ndash1167
[9] JKergomard RCausseacute Measurement of acoustic impe-dance using a capillary An attempt to achieve optimiza-tion Journal of the Acoustical Society of America 79(April 1986) 1129ndash1140
[10] T Ossman H Pichler G Widholm Bias A computer-aided test system for brass wind instruments Audio En-gineering Society Preprint October 1989
[11] J Epps JRSmith JWolfe A novel instrument to mea-sure acoustic resonances of the vocal tract during phona-tion Measurement Science and Technology 8 (July 1997)1112ndash1121
[12] M M Sondhi J Resnick The inverse problem for the vo-cal tract Numerical methods acoustical experiments andspeech synthesis Journal of the Acoustical Society ofAmerica 73 (March 1983) 985ndash1002
[13] J Agulloacute S Cardona D H Keefe Time-domain deconvo-lution to measure reflection functions for discontinuities in
waveguides Journal of the Acoustical Society of America97 (March 1995) 1950ndash1957
[14] V Vaumllimaumlki B Hernoux J Huopaniemi M KarjalainenMeasurement and analysis of acoustic tubes using signalprocessing techniques Finnish Signal Processing Sympo-sium (FINSIGrsquo95) Espoo Finland June 1995
[15] D B Sharp Acoustic pulse reflectometry for the measure-ment of musical wind instruments Dissertation Universityof Edinburgh 1996
[16] A Farina Simultaneous measurement of impulse responseand distortion with a swept-sine technique Proceedings ofthe 108th AES Convention Paris France February 200018ndash22
[17] A Lefebvre G Scavone J Able A Buckiewicz-SmithA comparison of impedence measurements using one andtwo microphones Proceedings of ISMA 2007 BarcelonaSpain September 2007 International Symposium on Mu-sical Acoustics
[18] A Lefebvre La mesure de lrsquoimpeacutedance acoustique du sax-ophone alto Diploma Thesis Eacutecole Polytechnique deMontreacuteal 2006
[19] T Smyth J Abel Convolutional synthesis of wind instru-ments Proceedings of the IEEE Workshop on Applica-tions of Signal Processing to Audio and Acoustics (WAS-PAArsquo07) New Paltz New York October 2007
[20] J O Smith Physical audio signal processing for virtualmusical instruments and audio effects December 2008httpccrmastanfordedu˜jospasp
[21] H Levine J Schwinger On the radiation of sound from anunflanged circular pipe Phys Rev 73 (1948) 383ndash406
1103

Smyth Abel Estimating waveguide model elements ACTA ACUSTICA UNITED WITH ACUSTICAVol 95 (2009)
2 3 4 5 6 7-05
0
05
1
15
2
25
3
time - milliseconds
amplitude
Figure 12 Measured (lower line) theoretical (thick line offset by10) and components (upper lines offset by 025) for closed conesecond arrival group corresponding to A2i
Rc(ω) Note the doublet nature of the pulse A22 withthe steep transition from a positive to a negative peak be-ing consistent with the high-pass transmission through thejunction The part of the pulse reflected back toward theend cap will appear at the junction to be in part transmit-ted to the cylinder and microphone and in part reflectedonce again toward the end cap
The first subarrival spectrum is
A21 = σ(ω)λ2y(ω)Ry(ω) 1 + ρ(ω) (29)
with subsequent ith arrivals having spectrum
A2i = σ(ω)λ2y(ω)λ2i
n (ω)
middot Ty(ω)Tn(ω)Riminus1n (ω) 1 + ρ(ω) (30)
The individual subarrivals shown in Figure 12 were gener-ated according to (30) using the transmission and reflec-tion filters described in section 2 for the 45o cone andone-centimeter radius cylinder measured The subarrivalsare summed to form the theoretical arrival group shownin Figure 12 Note the good agreement between the the-oretical and measured responses It should be pointed outthat the estimation of the junction transmission and reflec-tion filters in this case is complicated somewhat by theoverlapping nature of the subarrivals Rather than fix thereflection and transmission filters by analyzing individualarrivals hypothesized filters are used to generate the entirearrival group and then adjusted to produce the group bestmatching the one measured
44 Open cylicone
Opening the end of the cone produces an impulse responsewith similar behaviour as for the closed cylicone thoughbecause it is open the cone termination reflections are in-verted and attenuated A positive pulse traveling from thespeaker to the junction is partly inverted upon reflection
0 5 10 15 20 25 30 35 40 45 50-04
-02
0
02
04
06
08
1
time - milliseconds
amplitude
N 3 =
N 2 = (see expansion below)
N 1 = σ (ω)
12 14 16 18 20 22 24 26-04
-03
-02
-01
0
01
time - milliseconds
amplitude
N 22 = σ (ω)λ 2y(ω)λ
2n(ω)Ty(ω)Tn(ω)R op(ω)(1 + ρ(ω))
N 21 = σ (ω)λ 2y(ω)R y(ω)(1 + ρ(ω))
Figure 13 Arrival responses for the open cylicone showing in-dividual pulses corresponding to outputs of a combinations oftransfer functions
arriving at the microphone as a negative pulse and partlytransmitted through the junction this time being invertedat the open cone termination reflection When the negativepulse arrives at the junction a part is transmitted as a neg-ative pulse to the microphone and a part is reflected as apositive pulse back to the open cone termination where itis again inverted becoming negative The negative pulsepropagates back to the junction where it is partly transmit-ted to the microphone and partly reflected and invertedand so on
Figure 13 shows the measured impulse response for theopen cylicone Like the closed cylicone it exhibits a se-quence of arrival groups The N2 subarrival spectra maybe written in terms of the closed cylicone subarrival spec-tra
N2i = A2iRiminus1op (ω) (31)
Approximating the reflection from the open cone as a first-order low-pass filter with characteristic closely matchingboth observed measurement and that described by Levineand Schwinger (15) for a cylindrical radius equal to theaverage of the conersquos edge radii a1 and a2 a theoreticalarrival response is shown in Figure 14 along with its com-ponent subarrivals and the measured N2 arrival group Asin the case of the closed cylicone there is good agreementbetween the measured and theoretical responses
5 Results and conclusions
In this work a measurement technique was presented forestimating elements comprising a waveguide wind instru-
1101
ACTA ACUSTICA UNITED WITH ACUSTICA Smyth Abel Estimating waveguide model elementsVol 95 (2009)
2 3 4 5 6 7-05
0
05
1
15
2
25
3
time - milliseconds
amplitude
Figure 14 Measured (lower line) theoretical (thick line offsetby 10) and components (upper lines offset by 025) for the opencone second arrival corresponding to N22
ment model including filters used in propagation scatter-ing and termination The technique measures the impulseresponse between the mouthpiece end of the instrumentand a co-located microphone By comparing correspond-ing arrivals for different configurations modeled reflec-tion transmission and loss filters may be identified Tovalidate the measurement technique it was applied to asimple instrument configuration having a cylindrical boreconnected to a conical bell The estimated filters and im-pulse response was seen to closely match the theory giv-ing confidence that the measurement method can be gen-erally applied
To confirm the good agreement between the measuredand theoretical reflection transmission and propagationelements waveguide models of the four tube configura-tions were implemented based on cylinder and cone di-mensions Figure 15 shows a close match between mea-sured and theoretically-derived waveguide model impulseresponses for each of the tube configurations
This work will facilitate the development of filter com-ponents for which theoretical solutions may not be avail-able In particular reflection and transmission functions ofwind instrument bores bells and mouthpieces can be mea-sured by comparing the response of a rigidly terminatedtube to that of the tube with the instrument or instrumentsection affixed
Acknowledgments
We would like to sincerely thank Theresa Leonard and theBanff Centre for the Arts for the use of their facilities JohnLundell Carr Wilkerson Michael Coury and HarrisonSmith for their help in fabricating the experimental setupand the Natural Sciences and Engineering Research Coun-cil of Canada (NSERC) for their support Many thanks arealso extended to the reviewers whose careful reading ofthis text and invaluable comments have greatly strength-ened the clarity and accuracy of this work
0 5 10 15 20 25 30 35 40 45 50
0
2
4
6
8
10
time - milliseconds
amplitude
Closed Cylinder
M
T
Open Cylinder
M
T
Closed Cylicone
M
T
Open Cylicone
M
T
Figure 15 Measured and theoretically-derived impulse responsefor (from bottom to top) a closed cylinder an open cylinder aclosed cylicone and an open cylicone
References
[1] J O Smith Digital waveguide modeling of musical instru-ments www-ccrmastanfordedu˜joswaveguide 2003last viewed 1242008
[2] V Vaumllimaumlki Discrete-time modeling of acoustic tubes us-ing fractional delay filters Dissertation Helsinki Univer-sity of Technology Faculty of Electrical Engineering Lab-oratory of Acoustic and Audio Signal Processing EspooFinland 1995 Report no 37
[3] D P Berners Acoustics and signal processing techniquesfor physical modeling of brass instruments DissertationStanford University Stanford California July 1999
[4] A H Benade On the propagation of sound waves in acylindrical conduit Journal of the Acoustical Society ofAmerica 44 (1968) 616ndash623
[5] D H Keefe Acoustical wave propagation in cylindricalducts Transmission line approximation for isothermal and
1102
Smyth Abel Estimating waveguide model elements ACTA ACUSTICA UNITED WITH ACUSTICAVol 95 (2009)
nonisothermal boundary conditions Journal of the Acous-tical Society of America 75 (Januaray 1984) 58ndash62
[6] J Abel T Smyth J O Smith A simple accurate wall lossfilter for acoustic tubes DAFX 2003 Proceedings LondonUK September 2003 International Conference on DigitalAudio Effects 53ndash57
[7] X Rodet C Vergez Physical models of trumpet-like in-struments Detailed behavior and model improvementsProceedings of ICMC 1996 Clear Water Bay Hong-KongAugust 1996 International Computer Music Conference
[8] AHBenade MIIbisi Survey of impedance methods anda new piezo-disk-driven impedance head for air columnsJournal of the Acoustical Society of America 81 (April1987) 1152ndash1167
[9] JKergomard RCausseacute Measurement of acoustic impe-dance using a capillary An attempt to achieve optimiza-tion Journal of the Acoustical Society of America 79(April 1986) 1129ndash1140
[10] T Ossman H Pichler G Widholm Bias A computer-aided test system for brass wind instruments Audio En-gineering Society Preprint October 1989
[11] J Epps JRSmith JWolfe A novel instrument to mea-sure acoustic resonances of the vocal tract during phona-tion Measurement Science and Technology 8 (July 1997)1112ndash1121
[12] M M Sondhi J Resnick The inverse problem for the vo-cal tract Numerical methods acoustical experiments andspeech synthesis Journal of the Acoustical Society ofAmerica 73 (March 1983) 985ndash1002
[13] J Agulloacute S Cardona D H Keefe Time-domain deconvo-lution to measure reflection functions for discontinuities in
waveguides Journal of the Acoustical Society of America97 (March 1995) 1950ndash1957
[14] V Vaumllimaumlki B Hernoux J Huopaniemi M KarjalainenMeasurement and analysis of acoustic tubes using signalprocessing techniques Finnish Signal Processing Sympo-sium (FINSIGrsquo95) Espoo Finland June 1995
[15] D B Sharp Acoustic pulse reflectometry for the measure-ment of musical wind instruments Dissertation Universityof Edinburgh 1996
[16] A Farina Simultaneous measurement of impulse responseand distortion with a swept-sine technique Proceedings ofthe 108th AES Convention Paris France February 200018ndash22
[17] A Lefebvre G Scavone J Able A Buckiewicz-SmithA comparison of impedence measurements using one andtwo microphones Proceedings of ISMA 2007 BarcelonaSpain September 2007 International Symposium on Mu-sical Acoustics
[18] A Lefebvre La mesure de lrsquoimpeacutedance acoustique du sax-ophone alto Diploma Thesis Eacutecole Polytechnique deMontreacuteal 2006
[19] T Smyth J Abel Convolutional synthesis of wind instru-ments Proceedings of the IEEE Workshop on Applica-tions of Signal Processing to Audio and Acoustics (WAS-PAArsquo07) New Paltz New York October 2007
[20] J O Smith Physical audio signal processing for virtualmusical instruments and audio effects December 2008httpccrmastanfordedu˜jospasp
[21] H Levine J Schwinger On the radiation of sound from anunflanged circular pipe Phys Rev 73 (1948) 383ndash406
1103
Related Documents