Estimating the unit costs of public hospitals and primary healthcare centers Mustafa Z. Younis 1 *, Samer Jaber 2 , Anthony R. Mawson 3 and Michael Hartmann 4 1 Jackson State University, Health Policy and Management, Jackson, Mississippi, USA 2 Health Planning and Policy Unit, Ministry of Health, Nabulus, Occupied Palestinian Territory 3 Jackson State University, Health Policy, Jackson, Mississippi, USA 4 School of Medicine, Jena, Germany SUMMARY Background Many factors have affected the rise of health expenditures, such as high-cost medical technologies, changes in disease patterns and increasing demand for health services. All countries allocate a significant portion of resources to the health sector. In 2008, the gross domestic product of Palestine was estimated to be at $6.108bn (current price) or about $1697 per capita. Health expenditures are estimated at 15.6% of the gross domestic product, almost as much as those of Germany, Japan and other developed countries. The numbers of hospitals, hospital beds and primary healthcare centers in the country have all increased. The Ministry of Health (MOH) currently operates 27 of 76 hospitals, with a total of 3074 beds, which represent 61% of total beds of all hospitals in the Palestinian Authorities area. Also, the MOH is operating 453 of 706 Primary Health Care facilities. By 2007, about 40000 people were employed in different sectors of the health system, with 33% employed by the MOH. Aim This purpose of this study was to develop a financing strategy to help cover some or all of the costs involved in operating such institutions and to estimate the unit cost of primary and secondary programs and departments. Methods A retrospective study was carried out on data from government hospitals and pri- mary healthcare centers to identify and analyze the costs and output (patient-related services) and to estimate the unit cost of health services provided by hospitals and PHCs during the year 2008. All operating costs are assigned and allocated to the departments at MOH hospitals and primary health care centers (PPHCs) and are identified as overhead departments, intermediate- service and final-service departments. Intermediate-service departments provide procedures and services to patients in the final-service departments. The costs of the overhead departments are distributed to the intermediate-service and final-service departments through a step-down method, according to allocation criteria devised to resemble as closely as possible the actual use of resources by each of the departments. The data were analyzed using SPSS. Data cleaning was carried out by cross-validating the results through conducting cross-tabulations between the hospital/center and section/program to identify errors from the data collection or entry process. Depreciation of assets and the consumption of capital costs are ignored in this study, as it is difficult to evaluate the MOH facilities owing to a lack of recording of depreciation of assets or other costs of servicing capital assets. *Correspondence to: M. Z. Younis, Health Policy and Management, Jackson State University, Jackson, Mississippi, USA. E-mail: [email protected] Copyright © 2012 John Wiley & Sons, Ltd. THE INTERNATIONAL JOURNAL OF HEALTH PLANNING AND MANAGEMENT Int J Health Plann Mgmt 2013; 28: 320–332. Published online 5 November 2012 in Wiley Online Library (wileyonlinelibrary.com) DOI: 10.1002/hpm.2147

Welcome message from author
This document is posted to help you gain knowledge. Please leave a comment to let me know what you think about it! Share it to your friends and learn new things together.
Transcript

THE INTERNATIONAL JOURNAL OF HEALTH PLANNING AND MANAGEMENT
Int J Health Plann Mgmt 2013; 28: 320–332.Published online 5 November 2012 in Wiley Online Library(wileyonlinelibrary.com) DOI: 10.1002/hpm.2147
Estimating the unit costs of public hospitalsand primary healthcare centers
Mustafa Z. Younis1*, Samer Jaber2, Anthony R. Mawson3 andMichael Hartmann41Jackson State University, Health Policy and Management, Jackson, Mississippi, USA2Health Planning and Policy Unit, Ministry of Health, Nabulus, Occupied Palestinian Territory3Jackson State University, Health Policy, Jackson, Mississippi, USA4School of Medicine, Jena, Germany
SUMMARY
Background Many factors have affected the rise of health expenditures, such as high-costmedical technologies, changes in disease patterns and increasing demand for health services.All countries allocate a significant portion of resources to the health sector. In 2008, thegross domestic product of Palestine was estimated to be at $6.108bn (current price) or about$1697 per capita. Health expenditures are estimated at 15.6% of the gross domestic product,almost as much as those of Germany, Japan and other developed countries. The numbers ofhospitals, hospital beds and primary healthcare centers in the country have all increased. TheMinistry of Health (MOH) currently operates 27 of 76 hospitals, with a total of 3074 beds, whichrepresent 61% of total beds of all hospitals in the Palestinian Authorities area. Also, the MOH isoperating 453 of 706 Primary Health Care facilities. By 2007, about 40 000 people wereemployed in different sectors of the health system, with 33% employed by the MOH.Aim This purpose of this study was to develop a financing strategy to help cover some or allof the costs involved in operating such institutions and to estimate the unit cost of primary andsecondary programs and departments.Methods A retrospective study was carried out on data from government hospitals and pri-mary healthcare centers to identify and analyze the costs and output (patient-related services)and to estimate the unit cost of health services provided by hospitals and PHCs during the year2008. All operating costs are assigned and allocated to the departments at MOH hospitals andprimary health care centers (PPHCs) and are identified as overhead departments, intermediate-service and final-service departments. Intermediate-service departments provide proceduresand services to patients in the final-service departments. The costs of the overhead departmentsare distributed to the intermediate-service and final-service departments through a step-downmethod, according to allocation criteria devised to resemble as closely as possible the actualuse of resources by each of the departments. The data were analyzed using SPSS. Data cleaningwas carried out by cross-validating the results through conducting cross-tabulations between thehospital/center and section/program to identify errors from the data collection or entry process.Depreciation of assets and the consumption of capital costs are ignored in this study, as it isdifficult to evaluate the MOH facilities owing to a lack of recording of depreciation of assetsor other costs of servicing capital assets.
*Correspondence to: M. Z. Younis, Health Policy and Management, Jackson State University, Jackson,Mississippi, USA. E-mail: [email protected]
Copyright © 2012 John Wiley & Sons, Ltd.

321ESTIMATING PUBLIC HOSPITAL, PHCs UNIT COSTS
Results Inpatient costs contributed about 75% of all costs, whereas outpatient servicescontributed the remaining 25% of total costs. The average cost per visit was $13.00 for outpatientdepartments, whereas the average cost per patient day for inpatient departments was $90.00. Asfor the unit cost for each department, intensive care unit and intermediate care unit services werethe highest among all categories of daily hospital services ($208.00). This is in contrast to surgicaloperations ($124.00), specialized surgeries ($106.00), delivery department ($99.00), orthopedics($98.50) and general surgery ($85.00). The lowest unit cost was found in the neonatology depart-ment ($72.00). In PHCs, the unit cost per visit was highest for psychiatry programs ($26.00),followed by other programs ($21.50), chronic diseases ($21.00), maternal and child health ($11.50),preventive programs ($9.00) and general medicine ($6.50). The exchange rate listed by The WallStreet Journal as of Wednesday August 25, 2010 is 1 US dollar =3.82 new Israeli shekel (NIS).Conclusion The findings have implications for policy and decision making in the healthsector in Palestine concerning the cost of services provided by hospitals and PHCs. Theavailability of a standardized data set for cost assessment would greatly enhance and improvethe quality of financial information as well as efficiency in the use of scarce resources. Copyright© 2012 John Wiley & Sons, Ltd.
KEY WORDS: unit cost; fixed cost; variable cost
INTRODUCTION
Escalating health expenditures have been a universal phenomenon in recent decades.Although the degree of escalation has been highest in more affluent countries, low-income and middle-income countries have experienced similar changes in healthcareexpenditures. Many factors affect the escalation of health expenditures, such as high-cost medical technologies, changes in disease patterns and increasing demands forhealth services (Hideki, 2008).
Palestine allocates a significant portion of its resources to the health sector. Data for2008 indicated that the gross domestic product of Palestine was about $6108bn (currentprice) or about $1697 per capita. Health expenditures are estimated at 15.6% of thegross domestic product, which is higher than in other developing countries (PCBS,2010). Figure 1 illustrates the trend in health expenditures in Palestine between 2000and 2008. It shows that government health expenditures increased significantlybetween 2000 and 2008. Further increases in government spending on health occurredafter 2006, in line with the vision of the Ministry of Health (MOH) to promote thehealth of Palestinians and to aid the poor.
The public share of total health expenditure varies according to income: the govern-ment share is 29% in low-income countries, 42% in lower-to-middle-income countries,56% in upper-to-middle-income countries and 65% in high-income countries. Thegovernment share of health expenditures in Palestine accounts for 36.7% of the totalhealth expenditures, which is similar to that of lower-to-middle-income countries.For private spending, the poorer the country, the larger the amount that is out-of-pocket: 60% of the total health expenditure in low-income countries, 40% of the totalin the middle-income countries and only 20% of the total in high-income countries. Out-of-pocket expenses in Palestine, including premiums, account for 36.7% of the totalspending on health, which is close to that of middle-income countries. Thiscomparison shows that the Palestinian MOH, despite limited resources, madegreat efforts to let government spending be on a par with the existing system in
Copyright © 2012 John Wiley & Sons, Ltd. Int J Health Plann Mgmt 2013; 28: 320–332.
DOI: 10.1002/hpm

-
100,000.00
200,000.00
300,000.00
400,000.00
500,000.00
600,000.00
700,000.00
800,000.00
900,000.00
1,000,000.00
1999 2000 2001 2002 2003 2004 2005 2006 2007 2008 2009
year
US
D in
Th
ou
san
ds
Government Health Expenditure
Out-of-Pocket
Total Health Expenditure
Figure 1. Total health expenditure
322 M. Z. YOUNIS ET AL.
middle-to-high income countries and to provide financial protection for indivi-duals from the consequences of catastrophic illness (Palestinian Central Bureauof Statistics, 2010, which we refer to in the text as PCBS). In Table 1, we presenthealth expenditure indicators for Palestine and its neighboring countries.In order to develop a financing strategy that will help cover all or some of the costs
involved in operating such government institutions, it is necessary to know how costsof hospitals and primary healthcare centers (PHCs) are influenced by patient-relatedservices (i.e., “outputs”). The purpose of this study was to estimate the unit cost ofhealth services for hospitals and PHCs. The findings are expected to have importantimplications for policy and decision making in the health sector in Palestine from the
Table 1. Comparison of health expenditure indicators in Palestine and in neighboringcountries as of 2008
Economic indicators Egypt Jordan Lebanon Syria Palestine
GDP per capita in US$ exchange rate 1949 3257 7659 1804 1697Total expenditure on health (percapita) in average US$ exchange rate
124 277 599 79 248
Government expenditure on health(per capita) in average US$ exchange rate
48 172 293 35 91
Total expenditure on health of % of GDP 6.4 8.5 8.8 3.2 15.6General government expenditure on healthas % of total health expenditure
38.3 62.2 49 45.1 36.7
Out-of-pocket expenditure as % oftotal health expenditure
58.7 33.4 39.9 54.9 36.7
Ministry of Health budget as % ofgovernment budget
7.1 11.3 12.4 6 10.5
Source: EMRO, WHO-country profile and PCBS. GDP, gross domestic product.
Copyright © 2012 John Wiley & Sons, Ltd. Int J Health Plann Mgmt 2013; 28: 320–332.
DOI: 10.1002/hpm
323ESTIMATING PUBLIC HOSPITAL, PHCs UNIT COSTS
perspective of enhancing sustainability and improving the quality of financial informa-tion to the efficiency in the use of scarce resources.
Healthcare system
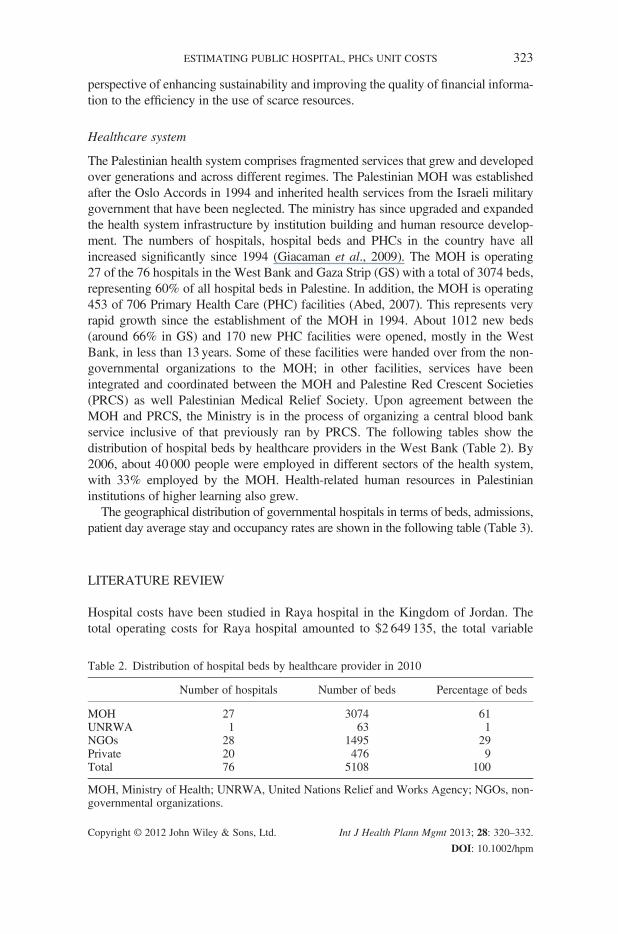
The Palestinian health system comprises fragmented services that grew and developedover generations and across different regimes. The Palestinian MOH was establishedafter the Oslo Accords in 1994 and inherited health services from the Israeli militarygovernment that have been neglected. The ministry has since upgraded and expandedthe health system infrastructure by institution building and human resource develop-ment. The numbers of hospitals, hospital beds and PHCs in the country have allincreased significantly since 1994 (Giacaman et al., 2009). The MOH is operating27 of the 76 hospitals in the West Bank and Gaza Strip (GS) with a total of 3074 beds,representing 60% of all hospital beds in Palestine. In addition, the MOH is operating453 of 706 Primary Health Care (PHC) facilities (Abed, 2007). This represents veryrapid growth since the establishment of the MOH in 1994. About 1012 new beds(around 66% in GS) and 170 new PHC facilities were opened, mostly in the WestBank, in less than 13 years. Some of these facilities were handed over from the non-governmental organizations to the MOH; in other facilities, services have beenintegrated and coordinated between the MOH and Palestine Red Crescent Societies(PRCS) as well Palestinian Medical Relief Society. Upon agreement between theMOH and PRCS, the Ministry is in the process of organizing a central blood bankservice inclusive of that previously ran by PRCS. The following tables show thedistribution of hospital beds by healthcare providers in the West Bank (Table 2). By2006, about 40 000 people were employed in different sectors of the health system,with 33% employed by the MOH. Health-related human resources in Palestinianinstitutions of higher learning also grew.
The geographical distribution of governmental hospitals in terms of beds, admissions,patient day average stay and occupancy rates are shown in the following table (Table 3).
LITERATURE REVIEW
Hospital costs have been studied in Raya hospital in the Kingdom of Jordan. Thetotal operating costs for Raya hospital amounted to $2 649 135, the total variable
Table 2. Distribution of hospital beds by healthcare provider in 2010
Number of hospitals Number of beds Percentage of beds
MOH 27 3074 61UNRWA 1 63 1NGOs 28 1495 29Private 20 476 9Total 76 5108 100
MOH, Ministry of Health; UNRWA, United Nations Relief and Works Agency; NGOs, non-governmental organizations.
Copyright © 2012 John Wiley & Sons, Ltd. Int J Health Plann Mgmt 2013; 28: 320–332.
DOI: 10.1002/hpm

Table
3.Distributionof
theprim
aryhealthcare
facilitiesby
healthcare
provider
in2000
and2010
2000
2010
West
Bank
Gaza
Strip
Total
West
Bank
Gaza
Strip
Total
%
Population
2011930
1138126
3150056
2513283
1535120
4048403
MOH
PHCfacilities
316
43359
394
59453
26NGO
PHCfacilities
145
40185
137
57194
5UNRWA
PHCfacilities
3417
5141
1859
16Total
PHCfacilities
495
100
595
572
134
706
19Num
berof
people
perPHCfacility
4065
11381
5294
4394
11456
5734
MOH,M
inistryof
Health
;NGO,n
on-governm
entalorganizatio
n;UNRWA,UnitedNations
ReliefandWorks
Agency;
PHC,p
rimaryhealthcare.
324 M. Z. YOUNIS ET AL.
Copyright © 2012 John Wiley & Sons, Ltd. Int J Health Plann Mgmt 2013; 28: 320–332.
DOI: 10.1002/hpm
325ESTIMATING PUBLIC HOSPITAL, PHCs UNIT COSTS
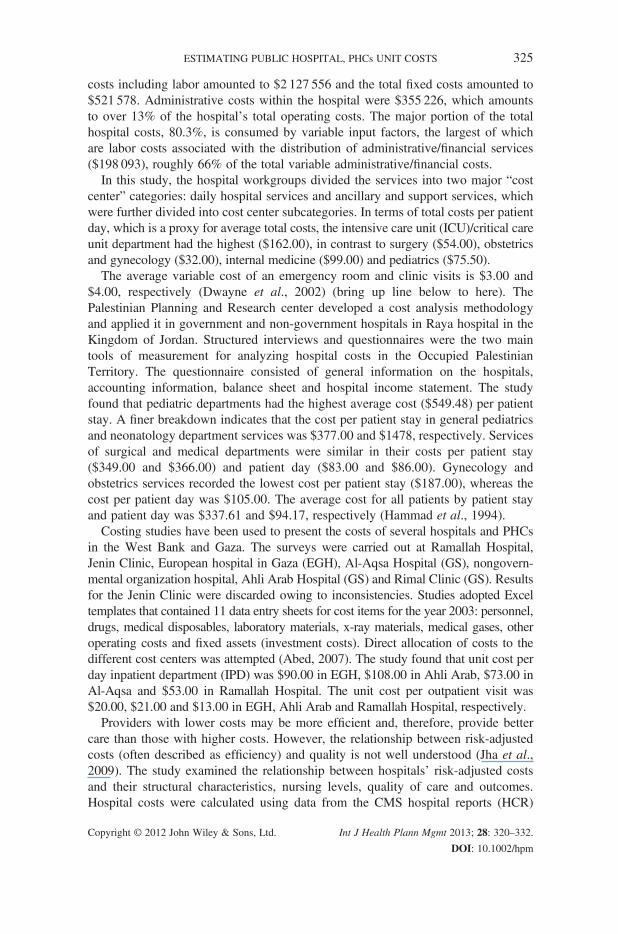
costs including labor amounted to $2 127 556 and the total fixed costs amounted to$521 578. Administrative costs within the hospital were $355 226, which amountsto over 13% of the hospital’s total operating costs. The major portion of the totalhospital costs, 80.3%, is consumed by variable input factors, the largest of whichare labor costs associated with the distribution of administrative/financial services($198 093), roughly 66% of the total variable administrative/financial costs.
In this study, the hospital workgroups divided the services into two major “costcenter” categories: daily hospital services and ancillary and support services, whichwere further divided into cost center subcategories. In terms of total costs per patientday, which is a proxy for average total costs, the intensive care unit (ICU)/critical careunit department had the highest ($162.00), in contrast to surgery ($54.00), obstetricsand gynecology ($32.00), internal medicine ($99.00) and pediatrics ($75.50).
The average variable cost of an emergency room and clinic visits is $3.00 and$4.00, respectively (Dwayne et al., 2002) (bring up line below to here). ThePalestinian Planning and Research center developed a cost analysis methodologyand applied it in government and non-government hospitals in Raya hospital in theKingdom of Jordan. Structured interviews and questionnaires were the two maintools of measurement for analyzing hospital costs in the Occupied PalestinianTerritory. The questionnaire consisted of general information on the hospitals,accounting information, balance sheet and hospital income statement. The studyfound that pediatric departments had the highest average cost ($549.48) per patientstay. A finer breakdown indicates that the cost per patient stay in general pediatricsand neonatology department services was $377.00 and $1478, respectively. Servicesof surgical and medical departments were similar in their costs per patient stay($349.00 and $366.00) and patient day ($83.00 and $86.00). Gynecology andobstetrics services recorded the lowest cost per patient stay ($187.00), whereas thecost per patient day was $105.00. The average cost for all patients by patient stayand patient day was $337.61 and $94.17, respectively (Hammad et al., 1994).
Costing studies have been used to present the costs of several hospitals and PHCsin the West Bank and Gaza. The surveys were carried out at Ramallah Hospital,Jenin Clinic, European hospital in Gaza (EGH), Al-Aqsa Hospital (GS), nongovern-mental organization hospital, Ahli Arab Hospital (GS) and Rimal Clinic (GS). Resultsfor the Jenin Clinic were discarded owing to inconsistencies. Studies adopted Exceltemplates that contained 11 data entry sheets for cost items for the year 2003: personnel,drugs, medical disposables, laboratory materials, x-ray materials, medical gases, otheroperating costs and fixed assets (investment costs). Direct allocation of costs to thedifferent cost centers was attempted (Abed, 2007). The study found that unit cost perday inpatient department (IPD) was $90.00 in EGH, $108.00 in Ahli Arab, $73.00 inAl-Aqsa and $53.00 in Ramallah Hospital. The unit cost per outpatient visit was$20.00, $21.00 and $13.00 in EGH, Ahli Arab and Ramallah Hospital, respectively.
Providers with lower costs may be more efficient and, therefore, provide bettercare than those with higher costs. However, the relationship between risk-adjustedcosts (often described as efficiency) and quality is not well understood (Jha et al.,2009). The study examined the relationship between hospitals’ risk-adjusted costsand their structural characteristics, nursing levels, quality of care and outcomes.Hospital costs were calculated using data from the CMS hospital reports (HCR)
Copyright © 2012 John Wiley & Sons, Ltd. Int J Health Plann Mgmt 2013; 28: 320–332.
DOI: 10.1002/hpm

326 M. Z. YOUNIS ET AL.
for fiscal year 2002. A relative cost index was calculated for each hospital as the ratioof its predicted average cost per case for medical patients. The study found a widerange of results across hospitals. Certain hospital characteristics, such as for-profitstatus and a higher percentage of Medicare patients, were associated with lowerrisk-adjusted costs; they provided modestly worse care for acute myocardial infarc-tion and congestive heart failure but had comparable rates of risk-adjusted mortality.There was no evidence that low-cost providers provide better care (Jha et al., 2009).Information on the unit cost of inpatient and outpatient care is essential for cost-
ing, budgeting and economic evaluation. Many countries lack liable estimates. How-ever, WHO has undertaken extensive efforts to collect and collate data on the unitcost of hospitals and health centers from as many countries as possible. Data havebeen assembled from 49 countries for various years during the period 1973–2000.A standard template was used for extracting data from all sources. The databaseincludes ownership, level of facility, number of beds, number of inpatient andoutpatient specialist, cost data, type of costs and other utilization data. Ordinary leastsquare regression analysis was used to estimate a long-run cost function; the depen-dent variable is the natural log of the cost per bed-day. As the relation between unitcosts and the explanatory variables are expected to be non-linear, the Cobb–Douglastransformation was used to approximate the normal distribution of the modelvariables. The paper found that unit costs of hospitals vary within countries, sometimesby an order of magnitude (Adam et al., 2003).Flessa andDung (2004) have identified the costs of services of Vietnamese hospitals:
one central, two provincial and two district hospitals. The study analyzed five hospitalsin Vietnam and determined the average costs as well as the main cost drivers. The costshave been classified as fixed costs and variable costs; depreciation for equipment andbuildings are not included in the accounts. Unit costs are calculated by dividing the totalcost of each final cost center (service department) by an appropriate measure of output(e.g., number of outpatient visits, number of inpatient days). The main finding ofthis study is that the average cost per inpatient day at the central hospital is about300% higher than the costs of provincial hospitals and about 600% higher thanthe costs of district hospitals. However, the costs of some laboratory proceduresand operations performed at district hospitals are higher than those of provincialor even central hospitals.Scott (2009) reviewed the published medical and economic literature to determine a
range of estimates for the annual direct hospital cost of treating healthcare-associatedinfections in the USA. Applying two different consumer price index (CPI) adjustmentsto account for the rate of inflation in hospital resource prices, the overall annual directmedical costs of healthcare-associated infection to US hospitals ranges from $28.40 to$33.80bn (after adjusting to 2007 dollars using the CPI for all urban consumers) andfrom $35.7 to $45bn (after adjusting to 2007 dollars using the CPI for inpatient hospitalservices). After adjusting for the range of effectiveness of possible infection controlinterventions, the benefits of prevention range from a low of $5.7 to $6.8bn (20% ofinfections preventable, CPI for all urban consumers) to a high of $25.00 to $31.5bn(70% of infections preventable, CPI for inpatient hospital services).The Bangladesh Facility Efficiency Study surveyed a nationally representative, strati-
fied sample of 121 Ministry of Health and Family Welfare facilities. A questionnaire
Copyright © 2012 John Wiley & Sons, Ltd. Int J Health Plann Mgmt 2013; 28: 320–332.
DOI: 10.1002/hpm
327ESTIMATING PUBLIC HOSPITAL, PHCs UNIT COSTS
administered by field investigators was effective in collecting the data required. Serviceindicators and unit costs for outpatient and inpatient services were estimated for calendaryear 1997. Only recurrent costs were considered, and expenditures by the familyplanning division were excluded from consideration. Ministry of Health and FamilyWelfare facilities were categorized into four groups: Thana health complexes(THCs), district and general hospitals (DH/GHs), medical college hospitals (MCHs)and specialized hospitals. MCHs offer more sophisticated and differentiated servicesand facilities than the other categories. DH/GHs offer only basic services and differfrom THCs only in the extent of their size and higher levels of basic equipment suchas X-ray equipment. DH/GHs have the lowest costs of all facilities, even lower thanTHCs. In fact, THCs have unit costs similar to those of MCHs. THCs have highercosts largely due to higher staffing ratios. In comparison with most countries, wheredoctor : bed ratios are lower in basic-level facilities, Bangladesh is unusual in havinghigher doctor : bed ratios at the lowest primary-level facilities. As for the internationalpattern of staffing ratios, some preliminary results on marginal products of installedbeds and staff as well as overall findings for aggregate unit costs strongly indicate thatthe current pattern of staffing and infrastructure at lower-level facilities is suboptimal.The findings suggest that large THCs with more beds but similar budgets and staffingwould be more optimal and efficient. DH/GHs with 100–150 beds appear closer to anoptimal size for basic facilities than THCs. High occupancy rates and turnover ratessuggest that the problem is more on under-capacity than on over-supply, which rein-forces the case for expansion of smaller facilities (Rannan-Eliya, 1999).
The governorates of Alexandria, Suez, Bani Suef, Aswan, Dakahlia, Port Said,North and South Sinai undertook detailed costing studies to define costs andefficiency in MOH and Population Primary Health Care Facilities (PHCFs). Thisstudy presents the results of 19 PHCFs in the three governorates of Alexandria, Suezand Bani Suef. The operating costs of the PHCFs from July 1993 to June 1994 wereallocated to the individual cost centers. Five major categories of costs were selectedto estimate the total costs: building and permanent structures; equipment andfurniture; personnel; drugs and medical supplies; and utilities, including food andclothing. The largest expenditure is for personnel. Personnel costs include take-home pay and all related benefits. Annual personnel costs in the individual PHCFsaccount for 19–82% of total costs with an average of 62%. On average, 22% of thetotal annual costs for 1993–1994 were spent on drugs and medical supplies. Thetotal annual cost of drugs and medical supplies includes not only the drugs actuallyused but also the donated and wasted drugs.
The average cost per visit is $3.70. Costs range from $1.10 for Arbeen urbanhealth centers (UHC) to $22.00 for Sedment rural health units and centers (RHU)(MOHP, 1997).
METHODOLOGY
The research design of this study is a retrospective analysis using secondary data onMOH hospitals and PHCs to identify and evaluate costs and outputs per patient. Theunit cost estimation models were based on data obtained during the year 2008. The
Copyright © 2012 John Wiley & Sons, Ltd. Int J Health Plann Mgmt 2013; 28: 320–332.
DOI: 10.1002/hpm

328 M. Z. YOUNIS ET AL.
target population included all public hospitals and PHCs in the West Bank. Datawere available for 11 hospitals and 10 PHCCs from three districts as of 2008. Outof them, Beitlahem and Qalqiliah hospitals were excluded from the study.Government hospitals and PHCs provide a multiple of services for individuals.
This study divided the departments in hospitals and programs in PHCs on thebasis of data available, numerous specialties in hospitals including generalsurgery, delivery, neonatology, dialysis, oncology, ICU, orthopedics, specializedsurgery, polyclinics and emergency, where the programs in PHCs include generalmedicine, psychiatry, chronic diseases, maternal and child health (MCH), preven-tive programs and other programs.In this study, all operating costs are assigned and allocated to the departments at
MOH hospitals and PHCs. These departments are identified as overhead, intermediateservice and final service; intermediate-service departments provide procedures andservices to patients in final-service departments. The costs of the overhead departmentsare distributed to the intermediate-service and final-service departments through a step-downmethod, according to allocation criteria devised to resemble as closely as possiblethe actual use of resources by each department. The step-down method is a moreadvanced cost-finding technique because it involves the distribution of costs fromoverhead departments and finally to intermediate-service and final-service depart-ments, where overhead departments provide support to intermediate-service andfinal-service departments. Intermediate-service departments provide procedures andservices to patients in final-service departments (Zaman, 1993). The identified variablesfor the cost variables are listed in Table 4.The following formula is used to calculate unit cost for each department for
government hospitals:
TC ¼ g1 genþ g2 delivþ g3 neonþ g4 dialþ g5 oncolþ g6 ICUþ g7 orthþg8 speciþ g9 polyþ g10 emerg
where TC means total cost, g, gamma (average unit cost); gen, general surgery;deliv., delivery department; neon, neonatology department; dial, dialysis depart-ment; oncol, oncology department; orth, orthopedics department; speci, specializedsurgery; poly, polyclinics; and emerg, emergency.The cost formula to estimate the unit cost per programs in the PHC is defined as
follows:
Table 4. Variables for hospital costs
Category Variable
Outputs Q1 IPD Number of patient daysQ2 OPD Number of outpatient visits
Inputs P1 SAL Average price of direct medical and non-medical staffP2 MED Average price of drugs and consumablesP3 OTH Average price of other expendituresP4 OVH Average price of overhead allocation
Copyright © 2012 John Wiley & Sons, Ltd. Int J Health Plann Mgmt 2013; 28: 320–332.
DOI: 10.1002/hpm
329ESTIMATING PUBLIC HOSPITAL, PHCs UNIT COSTS
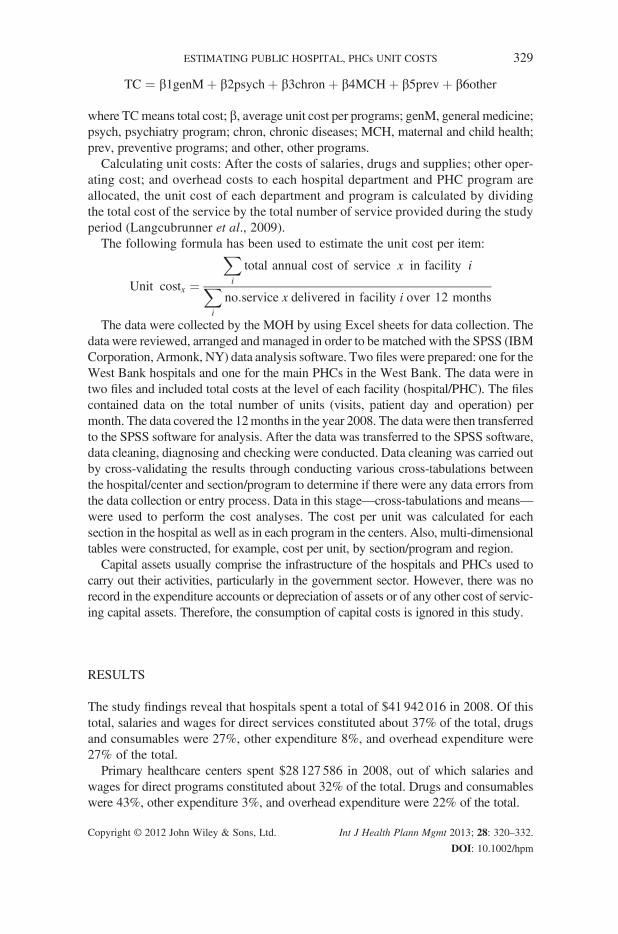
TC ¼ b1genMþ b2psychþ b3chronþ b4MCHþ b5prevþ b6other
where TCmeans total cost; b, average unit cost per programs; genM, general medicine;psych, psychiatry program; chron, chronic diseases; MCH, maternal and child health;prev, preventive programs; and other, other programs.
Calculating unit costs: After the costs of salaries, drugs and supplies; other oper-ating cost; and overhead costs to each hospital department and PHC program areallocated, the unit cost of each department and program is calculated by dividingthe total cost of the service by the total number of service provided during the studyperiod (Langcubrunner et al., 2009).
The following formula has been used to estimate the unit cost per item:
Unit costx ¼
X
i
total annual cost of service x in facility i
X
i
no:service x delivered in facility i over 12 months
The data were collected by the MOH by using Excel sheets for data collection. Thedata were reviewed, arranged and managed in order to be matched with the SPSS (IBM
Corporation, Armonk, NY) data analysis software. Two files were prepared: one for theWest Bank hospitals and one for the main PHCs in the West Bank. The data were intwo files and included total costs at the level of each facility (hospital/PHC). The filescontained data on the total number of units (visits, patient day and operation) permonth. The data covered the 12months in the year 2008. The data were then transferredto the SPSS software for analysis. After the data was transferred to the SPSS software,data cleaning, diagnosing and checking were conducted. Data cleaning was carried outby cross-validating the results through conducting various cross-tabulations betweenthe hospital/center and section/program to determine if there were any data errors fromthe data collection or entry process. Data in this stage—cross-tabulations and means—were used to perform the cost analyses. The cost per unit was calculated for eachsection in the hospital as well as in each program in the centers. Also, multi-dimensionaltables were constructed, for example, cost per unit, by section/program and region.Capital assets usually comprise the infrastructure of the hospitals and PHCs used tocarry out their activities, particularly in the government sector. However, there was norecord in the expenditure accounts or depreciation of assets or of any other cost of servic-ing capital assets. Therefore, the consumption of capital costs is ignored in this study.
RESULTS
The study findings reveal that hospitals spent a total of $41 942 016 in 2008. Of thistotal, salaries and wages for direct services constituted about 37% of the total, drugsand consumables were 27%, other expenditure 8%, and overhead expenditure were27% of the total.
Primary healthcare centers spent $28 127 586 in 2008, out of which salaries andwages for direct programs constituted about 32% of the total. Drugs and consumableswere 43%, other expenditure 3%, and overhead expenditure were 22% of the total.
Copyright © 2012 John Wiley & Sons, Ltd. Int J Health Plann Mgmt 2013; 28: 320–332.
DOI: 10.1002/hpm

330 M. Z. YOUNIS ET AL.
Unit cost calculation
Table 5 summarizes the total cost of inpatient and outpatient departments. It shows thatthe inpatient department costs contribute about 75%, whereas outpatient departmentcosts contribute about 25% of the total.Concerning the number of visits, there were 800 913 visits in 2008, with total
costs of US$; the average cost per outpatient department visit was $13.00.Regarding the number of patient days (n= 346 808), the average length of stay
was 2 days, and the total cost was $31 319 639. The average cost per patient dayfor inpatient departments was $90.00.As shown in Table 6, the unit cost of ICU and IMU services was the highest among
all categories of daily hospital services ($208.00). This is in contrast to those of surgicaloperations ($124.00), specialized surgeries ($106.00), delivery department ($99.00),orthopedics ($98.50) and general surgery ($85.00). The lowest unit cost was foundin the neonatology department, which was $72.00.Table 7 clarifies the unit cost per visit of each program. It shows that psychiatry
programs exhibited the highest ($26), followed by other programs ($21.5), chronicdiseases ($21), MCH ($11.5), preventive programs ($9) and general medicine ($6.5).
Table 6. Unit cost per patient day in terms of cost items
Hospital Average UC Salaries Drugs Other OC Overhead
General surgery Value 85 37 17 7 24% 100 43.4 20 8.3 28
Delivery department Value 99 37.5 16 10 35.5% 100 37.9 15.9 10.3 35.8
Neonatologydepartment
Value 72 29 19.5 4.5 19% 100 40 27 6 27
ICU, IMU Value 208.5 54.5 110 9 35% 100 26 53 4 17
Orthopedicsdepartment
Value 98.5 46 22 11 19.5% 100 47 22 11 20
Specialized surgery Value 106 41 29 7.5 28.5% 100 39 27 7 27
Surgical operation Value 124 57 18.5 10 38.5% 100 46 15 8 31
Dialysis Value 55 13.5 27 3 11.5% 100 24 49 6 21
Emergency Value 10 4 2 1 3% 100 42.1 23.7 7.9 26.3
Polyclinic Value 13 3 5 1.5 3.5% 100 24 42 12 23
ICU, intensive care unit; IMU, intermediate care unit; UC, unit costs; OC, operating costs.
Table 5. Unit cost for outpatient and inpatient departments
Department Total costs Volume of activities Unit cost in USD
Outpatient 10 622 377.50 800 913 13Inpatient 31 319 639 346 808 90
Copyright © 2012 John Wiley & Sons, Ltd. Int J Health Plann Mgmt 2013; 28: 320–332.
DOI: 10.1002/hpm
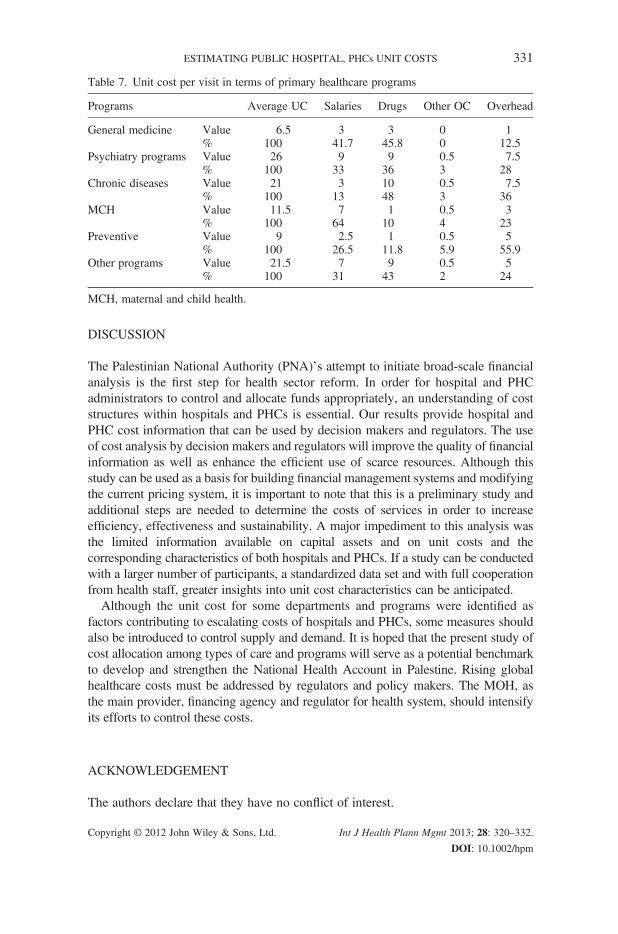
Table 7. Unit cost per visit in terms of primary healthcare programs
Programs Average UC Salaries Drugs Other OC Overhead
General medicine Value 6.5 3 3 0 1% 100 41.7 45.8 0 12.5
Psychiatry programs Value 26 9 9 0.5 7.5% 100 33 36 3 28
Chronic diseases Value 21 3 10 0.5 7.5% 100 13 48 3 36
MCH Value 11.5 7 1 0.5 3% 100 64 10 4 23
Preventive Value 9 2.5 1 0.5 5% 100 26.5 11.8 5.9 55.9
Other programs Value 21.5 7 9 0.5 5% 100 31 43 2 24
MCH, maternal and child health.
331ESTIMATING PUBLIC HOSPITAL, PHCs UNIT COSTS
DISCUSSION
The Palestinian National Authority (PNA)’s attempt to initiate broad-scale financialanalysis is the first step for health sector reform. In order for hospital and PHCadministrators to control and allocate funds appropriately, an understanding of coststructures within hospitals and PHCs is essential. Our results provide hospital andPHC cost information that can be used by decision makers and regulators. The useof cost analysis by decision makers and regulators will improve the quality of financialinformation as well as enhance the efficient use of scarce resources. Although thisstudy can be used as a basis for building financial management systems and modifyingthe current pricing system, it is important to note that this is a preliminary study andadditional steps are needed to determine the costs of services in order to increaseefficiency, effectiveness and sustainability. A major impediment to this analysis wasthe limited information available on capital assets and on unit costs and thecorresponding characteristics of both hospitals and PHCs. If a study can be conductedwith a larger number of participants, a standardized data set and with full cooperationfrom health staff, greater insights into unit cost characteristics can be anticipated.
Although the unit cost for some departments and programs were identified asfactors contributing to escalating costs of hospitals and PHCs, some measures shouldalso be introduced to control supply and demand. It is hoped that the present study ofcost allocation among types of care and programs will serve as a potential benchmarkto develop and strengthen the National Health Account in Palestine. Rising globalhealthcare costs must be addressed by regulators and policy makers. The MOH, asthe main provider, financing agency and regulator for health system, should intensifyits efforts to control these costs.
ACKNOWLEDGEMENT
The authors declare that they have no conflict of interest.
Copyright © 2012 John Wiley & Sons, Ltd. Int J Health Plann Mgmt 2013; 28: 320–332.
DOI: 10.1002/hpm

332 M. Z. YOUNIS ET AL.
REFERENCES
Abed Y. 2007. Health sector review, a summary report
2007, 16–17.
Adam T, Evans BD, Muurray JLC. 2003. Econometric
estimation of country-specific hospital costs. Cost Eff
Resour Alloc 1: 3. Accessed Feb, 12, 2010 at www.
resouce-allocation.com/content/1/1/3
Banks D, As-Sayaideh A, Shafei A, Muhtaseb A. 2002.
Implementing Hospital Autonomy in Jordan: An
Economic Cost Analysis princess Raya Hospital.
Partners of Health Reform (PHR). 17–45.
Department of planning, MOHP. 1997. Cost analysis and
efficiency indicators for health care, Report No.4, 16–17.
Rannan-Eliya RP. 1999. Bangladesh facility efficiency study
report. Institute of policy studies of Srilanka. (Report) 7–25.
Flessa S, Dung T. 2004. Costing of services of Vietnamese
hospitals: identifying costs in one central, two provincial
and two district hospitals using a standard methodology.
Int J Health Plann Manage 19: 63–77.
Giacaman R, Khatib R, Shabaneh L, et al. 2009. Health
status and health services in the Occupied Palestinian
Territory. Lancet 373: 837–49.
Hammad A, Jayousi S, AlamiM, Ismail N. 1994. Accounting
framework for analyzing hospital costs in the Occupied
Palestinian Territory. The Planning and research center.
Hideki H. 2008. Estimating the cost function and unit costs
of public hospitals in Thailand. Thesis, Chulalongkorn
University.
Copyright © 2012 John Wiley & Sons, Ltd.
Jha KA, Orav EJ, Dobson A, Book AR, Epstein MA.
2009. Measuring efficiency: the association of hospital
costs and quality of care. Health Aff 28: 897–903.
Accessed Mar 15 2010 at www.content.health
affairs . org /cgi /content /full/ 28 /3/897 ?ijkey=TNmS/.
JXdeRXk&keytype=ref&siteid=healthaff
Langcubrunner J, Cashin C, O’Dougherty S. 2009.
Designing and implementation health care provider
payment systems: how-to manuals. The World Bank
& USAID, 48–50. Accessed July 20 2010 at www.
siteresources.worldbank.org/HEALTHNUTRITIO-
NANDPOPULATION/Resources/Peer-Reviewed-
Publications/ProviderPaymentHowTo.pdf
Palestinian Central Bureau of Statistic. 2010. The
Palestinian national health accounts. (Report)
17–20.
Scott RD. 2009. The direct medical costs of healthcare
associated infections in US hospitals and the benefits
of preventions. Centers for disease control and preven-
tion. (Report). Accessed July 18 2010 at www.cdc.
gov/ncidod/dhqp/pdf/Scott_CostPaper.pdf
Zaman S. 1993. Cost analysis for hospital care, the case
of Embaba Hospital, Cairo, Egypt, Bureau for Research
and Development- US agency for International Develop-
ment, 9–45. Report Egypt. Health Financing and
Sustainability Project, Technical note no. 32. Bethesda,
MD: Abt Associates, 1993.
Int J Health Plann Mgmt 2013; 28: 320–332.
DOI: 10.1002/hpm
Related Documents