Tourism in Marine Environments, Vol. 4, Nos. 2–3, pp. 121–133 1544-273X/07 $60.00 + .00 Printed in the USA. All rights reserved. Copyright © 2007 Cognizant Comm. Corp. www.cognizantcommunication.com 121 Address correspondence to Bas Amelung, ICIS, Maastricht University, P.O. Box 616, 6200 MD Maastricht, The Netherlands. Tel: 0031 43 3882659; Fax: 0031 43 3884916; E-mail: [email protected] ESTIMATING THE GREENHOUSE GAS EMISSIONS FROM ANTARCTIC TOURISM BAS AMELUNG and MACHIEL LAMERS International Centre for Integrated assessment and Sustainable development (ICIS), Maastricht University, Maastricht, The Netherlands Tourism in Antarctica is rapidly growing and diversifying, which raises concerns about its effects on the environment. Research and policy-making efforts have so far focused on the impacts on Antarctica’s own ecosystems, whereas global impacts have all but been ignored. This article presents an inventory of greenhouse gas emissions produced by Antarctic tourism. Emissions are shown to be considerable, with aviation and cruises being the main sources. Tourism to the Antarctic ranks among the most energy-intensive segments in the tourism market. It is argued that greenhouse gas emissions should be included in environmental impact assessments. Improving the global environmental performance of Antarctic tourism is difficult, because of its exclusive dependency on long-haul trips. Key words: Antarctica; Tourism; Environmental impact assessment; Greenhouse gas emissions; Climate change Antarctica, and are still growing at a fast pace. How- ever, the classic “Lindblad-style” Antarctic expedi- tion cruises, involving small to medium-sized ships, rubber boat landings, and educational programs, are now complemented with cruises, overflights, and fly–sail operations, as well as adventurous activities such as helicopter excursions, kayaking, scuba div- ing, mountain climbing, and cross-country skiing (Bastmeijer & Roura, 2004; Stonehouse & Crosbie, 1995). Numerous academic papers have tried to identify the various environmental risks and impacts of tour- ism in Antarctica. Tourism contains the risk of af- Introduction In the course of the past four decades, tourism has become a well-established Antarctic activity. After an initial period of slow growth, tourism de- velopment took off in the late 1980s and early 1990s. The total number of tourists taking part in Antarctic travel itineraries exceeded 30,000 in the season of 2004/2005, and is projected to continue growing in the future (Fig. 1). The quantitative growth of Ant- arctic tourism has gone hand in hand with diversifi- cation. Ship-based expedition cruises have histori- cally comprised the bulk of tourism activities in

Welcome message from author
This document is posted to help you gain knowledge. Please leave a comment to let me know what you think about it! Share it to your friends and learn new things together.
Transcript
Tourism in Marine Environments, Vol. 4, Nos. 2–3, pp. 121–133 1544-273X/07 $60.00 + .00Printed in the USA. All rights reserved. Copyright © 2007 Cognizant Comm. Corp.
www.cognizantcommunication.com
121
Address correspondence to Bas Amelung, ICIS, Maastricht University, P.O. Box 616, 6200 MD Maastricht, The Netherlands. Tel: 003143 3882659; Fax: 0031 43 3884916; E-mail: [email protected]
ESTIMATING THE GREENHOUSE GAS
EMISSIONS FROM ANTARCTIC TOURISM
BAS AMELUNG and MACHIEL LAMERS
International Centre for Integrated assessment and Sustainable development (ICIS),Maastricht University, Maastricht, The Netherlands
Tourism in Antarctica is rapidly growing and diversifying, which raises concerns about its effects onthe environment. Research and policy-making efforts have so far focused on the impacts on Antarctica’sown ecosystems, whereas global impacts have all but been ignored. This article presents an inventoryof greenhouse gas emissions produced by Antarctic tourism. Emissions are shown to be considerable,with aviation and cruises being the main sources. Tourism to the Antarctic ranks among the mostenergy-intensive segments in the tourism market. It is argued that greenhouse gas emissions should beincluded in environmental impact assessments. Improving the global environmental performance ofAntarctic tourism is difficult, because of its exclusive dependency on long-haul trips.
Key words: Antarctica; Tourism; Environmental impact assessment; Greenhouse gas emissions;Climate change
Antarctica, and are still growing at a fast pace. How-ever, the classic “Lindblad-style” Antarctic expedi-tion cruises, involving small to medium-sized ships,rubber boat landings, and educational programs, arenow complemented with cruises, overflights, andfly–sail operations, as well as adventurous activitiessuch as helicopter excursions, kayaking, scuba div-ing, mountain climbing, and cross-country skiing(Bastmeijer & Roura, 2004; Stonehouse & Crosbie,1995).
Numerous academic papers have tried to identifythe various environmental risks and impacts of tour-ism in Antarctica. Tourism contains the risk of af-
Introduction
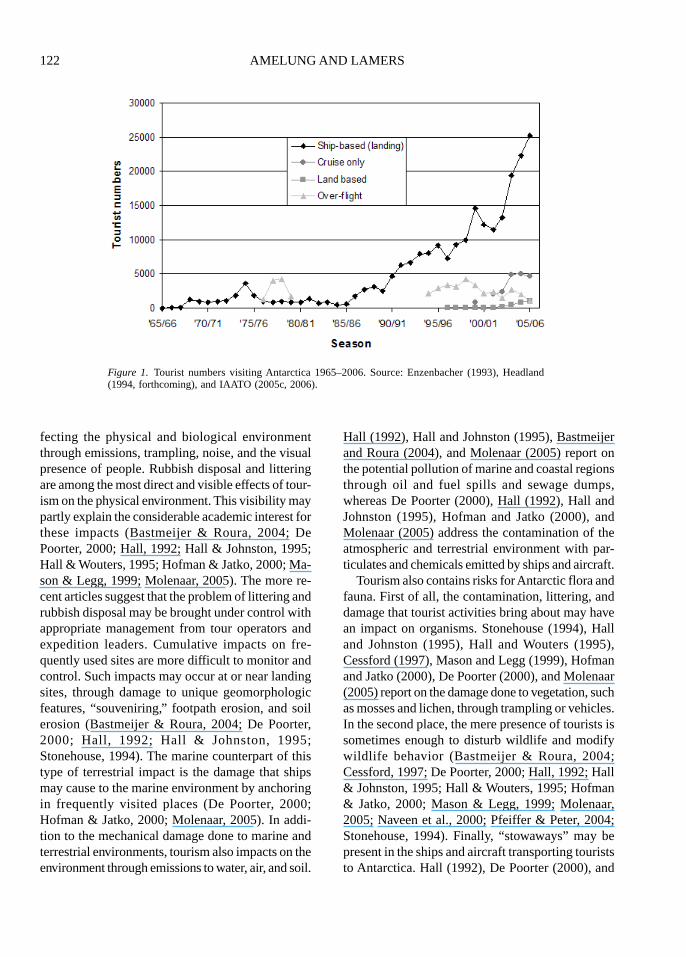
In the course of the past four decades, tourismhas become a well-established Antarctic activity.After an initial period of slow growth, tourism de-velopment took off in the late 1980s and early 1990s.The total number of tourists taking part in Antarctictravel itineraries exceeded 30,000 in the season of2004/2005, and is projected to continue growing inthe future (Fig. 1). The quantitative growth of Ant-arctic tourism has gone hand in hand with diversifi-cation. Ship-based expedition cruises have histori-cally comprised the bulk of tourism activities in
122 AMELUNG AND LAMERS
fecting the physical and biological environmentthrough emissions, trampling, noise, and the visualpresence of people. Rubbish disposal and litteringare among the most direct and visible effects of tour-ism on the physical environment. This visibility maypartly explain the considerable academic interest forthese impacts (Bastmeijer & Roura, 2004; DePoorter, 2000; Hall, 1992; Hall & Johnston, 1995;Hall & Wouters, 1995; Hofman & Jatko, 2000; Ma-son & Legg, 1999; Molenaar, 2005). The more re-cent articles suggest that the problem of littering andrubbish disposal may be brought under control withappropriate management from tour operators andexpedition leaders. Cumulative impacts on fre-quently used sites are more difficult to monitor andcontrol. Such impacts may occur at or near landingsites, through damage to unique geomorphologicfeatures, “souveniring,” footpath erosion, and soilerosion (Bastmeijer & Roura, 2004; De Poorter,2000; Hall, 1992; Hall & Johnston, 1995;Stonehouse, 1994). The marine counterpart of thistype of terrestrial impact is the damage that shipsmay cause to the marine environment by anchoringin frequently visited places (De Poorter, 2000;Hofman & Jatko, 2000; Molenaar, 2005). In addi-tion to the mechanical damage done to marine andterrestrial environments, tourism also impacts on theenvironment through emissions to water, air, and soil.
Hall (1992), Hall and Johnston (1995), Bastmeijerand Roura (2004), and Molenaar (2005) report onthe potential pollution of marine and coastal regionsthrough oil and fuel spills and sewage dumps,whereas De Poorter (2000), Hall (1992), Hall andJohnston (1995), Hofman and Jatko (2000), andMolenaar (2005) address the contamination of theatmospheric and terrestrial environment with par-ticulates and chemicals emitted by ships and aircraft.
Tourism also contains risks for Antarctic flora andfauna. First of all, the contamination, littering, anddamage that tourist activities bring about may havean impact on organisms. Stonehouse (1994), Halland Johnston (1995), Hall and Wouters (1995),Cessford (1997), Mason and Legg (1999), Hofmanand Jatko (2000), De Poorter (2000), and Molenaar(2005) report on the damage done to vegetation, suchas mosses and lichen, through trampling or vehicles.In the second place, the mere presence of tourists issometimes enough to disturb wildlife and modifywildlife behavior (Bastmeijer & Roura, 2004;Cessford, 1997; De Poorter, 2000; Hall, 1992; Hall& Johnston, 1995; Hall & Wouters, 1995; Hofman& Jatko, 2000; Mason & Legg, 1999; Molenaar,2005; Naveen et al., 2000; Pfeiffer & Peter, 2004;Stonehouse, 1994). Finally, “stowaways” may bepresent in the ships and aircraft transporting touriststo Antarctica. Hall (1992), De Poorter (2000), and
Figure 1. Tourist numbers visiting Antarctica 1965–2006. Source: Enzenbacher (1993), Headland(1994, forthcoming), and IAATO (2005c, 2006).
ESTIMATING ANTARCTIC GREENHOUSE GAS EMISSIONS 123
Frenot et al. (2005) discuss the risks of introducingexotic flora and fauna as well as animal and plantdiseases.
So far, scientific assessments of the impact of tour-ism have not revealed major environmental impactsor changes caused by tourism (Hofman & Jatko,2000; Stewart, Draper, & Johnston, 2005). This doesnot mean that tourism development in Antarctica isharmless, however. Cumulative effects are poorlyunderstood, and research into tourism’s impacts onthe marine environment is still in its infancy. Per-haps even more significantly, the environmentalimpact assessments of tourism have so far been lim-ited to the impacts in Antarctica itself. Any mentionof atmospheric pollution is limited to emissions inthe Antarctic region (Stewart et al., 2005).
Tourism’s role in emerging issues on a globalscale, such as climate change, is largely ignored. Anestimated 5.3% of global greenhouse gas emissionswas leisure related in 1996 (Gössling, 2002), andthis share has been increasing. Transport is respon-sible for almost 95% (Gössling, 2002) of thisamount. Transport is also at the core of Antarctictourism. Tourist mobility in the Antarctic itself isvery high, with most tourists visiting the regiononboard a ship. In addition, Antarctica is a distantdestination, in particular for the majority of touriststhat come from the Northern Hemisphere, and it hasno home market. This makes Antarctic tourism aclear case of hypermobility: visitors of Antarcticabelong to the minority of the population that is re-sponsible for the bulk of passenger kilometers andtransport-related emissions.
Tour operators report on the projected environ-mental consequences of their activities when apply-ing for permits to operate in Antarctica. These envi-ronmental impact assessments (EIAs) are mandatoryunder the Environmental Protocol, which wasadopted by the Antarctic Treaty parties in 1991. Asthere are no broader frameworks for societal assess-ment in the current Antarctic agreements, EIAs arethe “sole gatekeeper for Antarctic access”(Hemmings & Roura, 2003, p. 21). The most com-monly used EIA tool, the initial environmental evalu-ation (IEE), must contain a description of the pro-posed activity, and any impacts that the activity mayhave. In practice, the scope is limited to direct andimmediate effects, so that greenhouse gas emissionsare not included. For a balanced environmental im-
pact assessment of tourism in Antarctica, however,it is essential to include the impacts on the globalenvironment. This article focuses on tourism’s con-tribution to climate change. It presents an inventoryof greenhouse gases emitted by holidaymakers vis-iting Antarctica, and discusses the need and optionsfor accounting for such emissions in environmentalmanagement practices in general, and environmen-tal impact assessments in particular.
Methods and Data
In recent years, several inventories have beenmade of tourism-related greenhouse gas emissions,with scopes ranging from the global (Gössling,2002), to the national (Becken, 2002; Becken &Simmons, 2002, for New Zealand), and local levels(Gössling et al., 2005, for Amsterdam and the RockyMountain National Park). In these studies, emissionswere estimated using bottom-up or top-down meth-ods, or a combination of both. Bottom-up approachesstart from the emission properties of individual fa-cilities, motor vehicles, aircraft, or ships and arriveat macroscale results through aggregation. Top-downapproaches start from macrolevel statistics and useaverage emission coefficients to calculate total emis-sions. In this article, top-down techniques are usedwhere possible, complemented by bottom-up meth-ods where crucial data are missing.
Tourism in Antarctica is atypical in many respects,one of them being the virtual absence of permanentland-based facilities for tourism (Splettstoesser,Landau, & Headland, 2004). In the 1980s and early1990s, there was a “Hotel Estrella Polar” (Maher,Steele, & McIntosh, 2003), but this project ended,and to date the accommodation capacity on the con-tinent is limited to a few tented camps and small-scale accommodations at research stations. The bulkof tourism takes place on ships, which unite all threetraditional components of tourism: transport, accom-modation, and activities. Tourists fly from their coun-try of origin to the so-called “gateway cities” in SouthAmerica, Australia, and New Zealand, where shipspick them up. A minority of tourists engage in land-based tourism or overflights. To reflect this realityas much as possible, the inventory of greenhousegas emissions is made up of four compartments:origin–destination (OD) transport, (expedition)cruises, overflights, and land-based expeditions.
124 AMELUNG AND LAMERS
Calculations are based on data for the Antarctic sea-son of 2004/2005. The scope of the study is limitedto tourists reported by IAATO, and does not encom-pass staff and crew members and the small minorityof tourists not reported by IAATO. As the emphasisis on the contribution of Antarctic tourism to cli-mate change (i.e., radiative forcing), results are re-ported in terms of CO
2-equivalents, rather than CO
2.
Transport to and From the Gateway Cities
The continent of Antarctica is very remote, andpoorly connected to the international transportationnetworks. There are only a handful of gateway cit-ies, including Ushuaia in Argentina, Punta Arenasin Chile, and Christchurch and Bluff in New Zealand.Ushuaia is the main “hub” for ship-born tourism,while Punta Arenas is the main basis for air connec-tions to Antarctica. These gateway cities usually haveair connections with only a handful of other airports,typically located in the same country or in a neigh-boring nation. The large majority of internationaltourists therefore change flights at a large interna-tional airport: Buenos Aires, Santiago de Chile, andAuckland for connections to Ushuaia, Punta Are-nas, and Christchurch/Bluff, respectively. In this ar-ticle, the simplifying assumption is therefore madethat passengers travel to the gateway cities in twostages: from the home country to the hub airport inthe gateway country, and from that hub to the gate-way city. Because the individual flight plans areunknown, all passengers are assumed to depart fromthe largest airport in their respective home countries.In the absence of information about the technicalspecifications of the individual aircraft used, a fixedcoefficient linking distances to emissions is used.
The resulting emission estimates are cast into CO2-
equivalent (CO2-e) emissions by multiplying them
by a correction factor to take into account thatnoncarbon coproducts of burning fossil fuel at greatheights are responsible for additional radiative forc-ing. According to the latest information, the maincoproducts are CH
4 (negative radiative forcing), O
3,
contrails, and cirrus clouds (Sausen et al., 2005). Theproduction of the former two is proportional to fueluse and relatively well understood. The latter twooccur only under specific atmospheric conditions,and their contribution to overall radiative forcingfrom aviation is relatively poorly understood. Be-
cause of the nonlinear relationship between carbonand noncarbon emissions, including noncarbonemissions through a standard mark-up on top of thecarbon emissions is no ideal solution (Peeters,Gössling, & Williams, 2006), but noncarbon emis-sions are too important to ignore. The most com-monly accepted way of dealing with noncarbonemissions available to date is by using an equiva-lence factor. Following Gössling (2005) andWatterson, Walker, & Eggleston (2004), a detourfactor is applied to correct for the fact that actualflight distances are usually longer than the GreatCircle distances. The estimate of total emissions fromtransport to and away from the gateway cities is nowgiven by (adapted from Gössling et al., 2005):
Eel
= β*ε*V (1)
in which E stands for the amount of CO2-e emis-
sions in kilograms, β denotes the emissions of CO2
in kilogram per passenger kilometer, ε is the equiva-lence factor, and V is the total transport volume inpassenger kilometers that can be calculated as fol-lows (adapted from Gössling et al., 2005):
V N S DFn nn
= ( )∑2* * * (2)
in which N stands for the number of tourists travel-ing on connection n, S denotes the shortest distanceof connection n, DF represents the detour factor.
Data on the number of tourists and their nation-alities are retrieved from the IAATO website(www.iaato.org). The distances between two airportsare calculated as Great Circle distances using theweb-based Great Circle Mapper tool (gc.kls2.com).A detour correction factor of 1.05 is used, as sug-gested by Gössling et al. (2005) for long-haul airtravel. An emission intensity factor of 0.14 kg/Pkmis used, as suggested by Gössling et al. (2005) forlong-haul air travel. An equivalence factor of 2.7 isused to compensate for noncarbon emissions, fol-lowing Penner, Lister, Griggs, Dokken, & McFarland(1999).
To fill in Equation 2, a list of gateway cities andcountries of origin is composed. Tourists visit Ant-arctica from a range of gateway cities. For ship-basedtourism by far the most important of these is theport of Ushuaia in Argentina. In addition, a small
ESTIMATING ANTARCTIC GREENHOUSE GAS EMISSIONS 125
number of tourists traveling to the Ross Sea regionmake use of the gateway ports of Christchurch(Lyttleton) and Bluff in New Zealand, and Hobartin Australia. These ports are at very similar distancesfrom the main tourist markets, and therefore one ofthem is chosen to represent all three ports in the cal-culations. Christchurch performs this role of repre-sentative port, because it handled most tourists inthe season 2004/2005. In South America, touristsengaging in land-based tourism depart from the cityof Punta Arenas, but these are relatively few, andthis city is located close to Ushuaia. In the analysis,the number of gateway cities is therefore limited totwo: Ushuaia and Christchurch. Origin-destinationtransport related to overflights is not considered be-cause information about the countries of origin ofthe overflight passengers is not available. Moreover,it is methodologically inappropriate to allocate allor a large share of the origin–destination emissionsto a holiday activity that lasts 12 hours at most.
In the season 2004/2005, close to a hundred coun-tries were represented in the Antarctic tourist popu-lation (IAATO, 2005b). Many of these national cat-egories consisted of one or just a few individuals,while the largest delegation (that of the US) con-sisted of more than 11,000 visitors. The 21 coun-tries that were the source of more than 100 touristseach covered almost 97% of all tourists. In the cal-culations, only these countries are considered indi-vidually; the remaining 3% are assumed to travelfrom a hypothetical country that is located at theaverage distance of the first 21 countries.
Cruises
The ships used for tourism in the Antarctic varywidely in size, with capacities ranging from approxi-mately 50 to 1,300 passengers. Some of the shipswere built for tourism purposes, but many otherswere originally constructed and used as expeditionships or icebreakers. As a result, fuel use and emis-sions also differ greatly between ships. To take someof this diversity into account, without knowing thetechnical details of all individual ships, a linear re-lationship is assumed between fuel use at maximumpower and gross tonnage, as suggested by Trozziand Vaccaro (1998). Actual fuel use depends on the“mode” a ship is operating in; in “hoteling” modemuch less fuel is used than in cruise mode. It is com-
mon practice in the Antarctic cruise business to un-load and load ships in one day (IAATO, 2005a).Therefore, it is assumed that in each trip a minimumof 1 day is spent in “hoteling” mode. The estimateof total emissions from (expedition) cruising is nowgiven by:
Eel
= γ*δm*P
m(3)
in which E stands for the amount of CO2e emissions
in kilogram, γ represents the emissions per kilogramof fuel, δ denotes the specific amount of fuel used atmaximum power in kilogram per hour, and P repre-sents the specific engine performance in numbersof hours at maximum power. P in turn can be calcu-lated as follows:
P Tm nn
= ∑µ* (4)
in which T stands for the time a ship’s engine oper-ates in mode n in hours, and µ represents the full-power equivalence factor for mode n.
In this article, an emission coefficient δ of 3.2 isused, as suggested by Trozzi and Vaccaro (1998).Fuel use by ships is typically expressed in tonnes (t)of fuel per day used at maximum power. Technicalspecifications were available for only a few of theships involved. Instead, estimations for fuel use wereretrieved from Trozzi and Vaccaro (1998). Based onregression analyses including hundreds of ships, theyestimated the empirical relationship between grosstonnages and daily fuel use for a range of ship cat-egories. It is assumed here that the equation thatTrozzi and Vaccaro derived for passenger ships isan acceptable estimation of the fuel use of the Ant-arctic tourism fleet:
F = 16.904 + 0.00198 × GT (5)
in which F is fuel consumption at maximum powerin t/day, and GT stands for gross tonnage. The namesof all ships used for Antarctic cruising in the seasonof 2004/2005 are available from IAATO (2005a).Information on their gross tonnage was retrievedfrom dedicated websites, such as www.kreuzfahrt-w.de. For each ship, maximum daily fuel use wasestimated using Equation 5.
126 AMELUNG AND LAMERS
According to Trozzi and Vaccaro (1998), ships incruising mode operate at 80% of maximum power,while ships in “hoteling” mode (term used by Trozziand Vaccaro) operate at 32% of maximum power.This may be an underestimate in the Antarctic con-text, because both cruising in an environment of seaice and rough weather conditions and hoteling with-out piers and with limited shelter may require morepower than suggested by the averages. Nevertheless,with no information available about the magnitudeof the deviations, Trozzi and Vaccaro’s percentageswere used unchanged. No information was foundon the relative share of time that is spent on cruisingand hoteling, respectively, during cruise expeditions.Ship-borne tourism can be divided into two maintypes: expedition cruises that include landings, andcruise-only trips. In the 2004/2005 season, four shipswere used for cruise-only trips, while 27 were usedfor expedition cruises, excluding sailing vessels andsmall yachts (IAATO, 2005a). Cruise-only ships areassumed to operate in cruise mode continuously,except for the day of loading and unloading, so thatS
c= 1 and S
h= 0. According to Carey (2005), expe-
dition cruises make an average of two landings perday of 3 hours each. Based on this empirical obser-vation, and taking into account the time needed toreach Antarctica, it is assumed that expedition cruiseships operate in cruise mode for 75% of time, and inhoteling mode for 25% of time, excluding days thatare used for loading and unloading. The duration ofall individual trips by all individual ships in the 2004/2005 season is documented by IAATO (2005a).
Land-Based Activities
Land-based tourism, serviced by aircraft, com-prises a minor share of Antarctic tourism. It is orga-nized in the form of expeditions. Two IAATO mem-ber companies conduct land-based tourism activitiesfrom Punta Arenas, namely Antarctic Logistics andExpeditions (ALE) and Aerovias DAP. Land-basedexpeditions are risky and require extensive prepara-tion, and implementation of stringent safety mea-sures. The US-based organization ALE takes careof the logistical side of most if not all land-basedtourism. In its Multi-Year Application to the USEnvironmental Protection Agency, ALE reports onthe environmental impact of their activities, includ-ing CO
2 emissions (ALE, 2003). In the 2003 report,
ALE projected its emissions for the 2003/2004 sea-son at 1801 t of CO
2. The bulk of these emissions
(1783 t) was attributable to air transport (i.e., flightsbetween Punta Arenas and the Antarctic field campat Patriot Hills). These figures were calculated basedon the prospect of handling 100 tourists on sevenflights in 2003/2004. In reality, ALE had a total of119 clients in 2003/2004, and 190 clients and 14flights in 2004/2005. This growth in passengers be-tween 2003/2004 and 2004/2005 must have led toincreased emissions. In the absence of more recentinformation than the 2003 prospective report, pro-portionality was assumed between the increase indemand and the increase in emissions. For the flightcomponents, an equivalence factor of 2.7 is used tocompensate for noncarbon emissions, followingPenner et al. (1999).
Operating from Punta Arenas, the ChileanAerovias DAP conducts tourist day flights and 2-day trips to King George Island for land-based ac-tivities. In the 2004/2005 season, it transported a totalof 657 tourists on 29 flights (IAATO, 2005c), usingtwo relatively small aircraft: a King Air 200b (KingAir) with a capacity of 12 for small groups, and aDe Havilland DHC-7 (Dash 7) with a capacity of 54for larger groups. In the absence of information aboutthe number of flights each of these planes made, ahypothetical configuration was established of 21King Air flights and 8 Dash 7 flights, with a totalcapacity of 684 passengers. Watterson et al. (2004)provide the following equations linking fuel use todistance flown:
FKA
= (7.33 + 0.392 × 2D) × (6)DF for King Air
FD7
= (–0.135 + 1.05 × 2D) × (7)DF for Dash 7
in which F is the amount of fuel used in kilograms,D is the distance flown, and DF is the detour correc-tion factor. The itinerary from Punta Arenas to KingGeorge Island and back corresponds with a distanceof 1,255 km one way. A detour factor of 1.05 is used,as suggested by Gössling et al. (2005). Emissionsare calculated from the amount of fuel used, usingthe coefficient provided by Watterson et al. (2004).An equivalence factor of 2.7 (Penner et al., 1999) isused to compensate for noncarbon emissions.
ESTIMATING ANTARCTIC GREENHOUSE GAS EMISSIONS 127
Overflights
Tourist overflights are made from two differentgateway cities. The Australian tour operator CroydonTravel and airline Quantas organize overflights fromdifferent Southern Australian cities to East-Antarc-tica and back, using Boeing 747-400 aircraft. IAATO(2005c) reports on the number of passengers taken,the number of flights made, and the flying time.Croydon/Qantas performed a total of 4 overflightswith a Boeing 747-400, carrying a total of 1,568passengers. A distance of some 11,000 km is cov-ered per trip, using 150 t of fuel (Clarke, 2004). Anestimate of the CO
2–e emissions resulting from
Croydon Quantas overflight activities is producedusing the coefficients suggested by Watterson et al.(2004). Overflights are also organized from PuntaArenas by LanChile with Boeing 737-200 aircraft.IAATO reports on the number of passengers taken,the number of flights made, and the routes flown(IAATO, 2005c). LanChile performed a total of 9overflights with a Boeing 737-200, carrying a totalof 462 passengers. In the absence of specific infor-mation on the Boeing 737-200, the equation of fueluse as a function of distance for the Boeing 737-100 is taken as a surrogate, following Watterson etal. (2004):
F737-100
= (241 + 2.75 × D) × DF (8)
in which F is the amount of fuel used in kilograms,D is the distance flown, and DF is the detour correc-tion factor. The route taken during the LanChileoverflights is: Punta Arenas → King George Island→ Deception Island → O’Higgins → Marambio→ Punta Arenas (IAATO, 2005c), which, correctedfor detours with the usual factor of 1.05, correspondsto a distance D of 3288 km per flight. Again, a de-tour factor of 1.05 is used, as suggested by Gösslinget al. (2005). Emissions are calculated from theamount of fuel used, using the coefficient providedby Watterson et al. (2004). The equivalence factorof 2.7 (Penner et al., 1999) is also used here to com-pensate for noncarbon emissions.
Results
The total flight volume related to traveling to andfrom the gateway cities by air is estimated at 728million passenger kilometers (Pkm), of which 713
million Pkm are linked to Ushuaia/Punta Arenas and15 million Pkm to Christchurch. Total CO
2 emis-
sions are estimated at 243,000 t CO2-e. In absolute
terms, tourists from the US are the dominant factorin passenger kilometers and emissions. This is a re-sult of relatively large numbers of tourists and mod-erate travel distances. Tourists from other countries(in particular Japanese traveling to South Americaand Europeans traveling to New Zealand), however,are more energy intensive in relative terms. Averageemissions by Japanese tourists traveling to Ushuaiaare almost twice as high as emissions by their Ameri-can counterparts (14.32 vs. 7.34 t of CO
2-e per tour-
ist). Average emissions for traveling to Ushuaia andChristchurch are similar, at 8.58 and 8.48 t of CO
2-
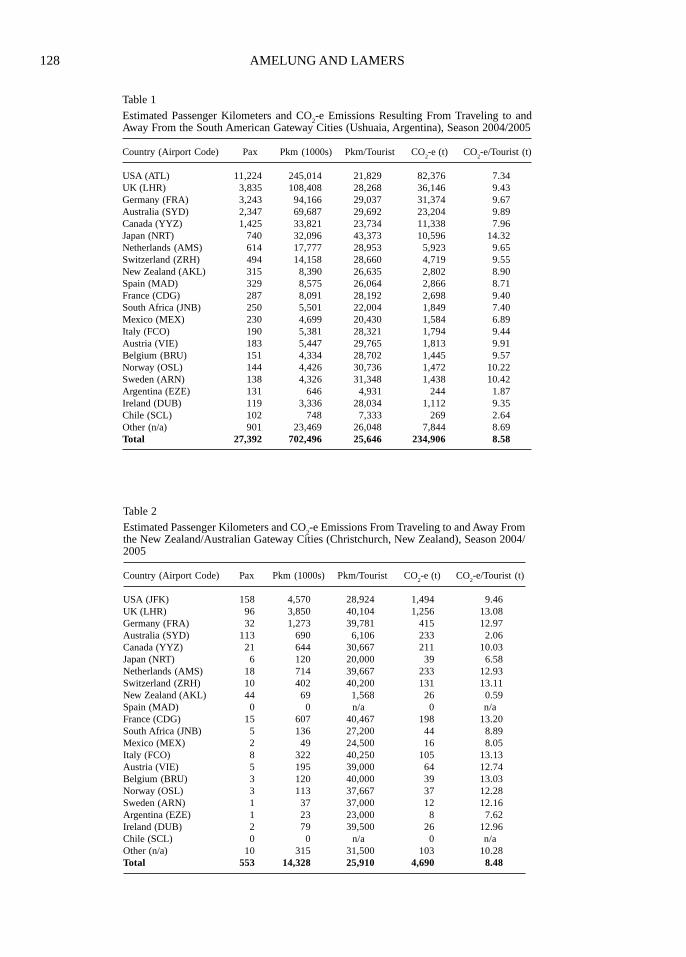
e per tourist, respectively. Detailed results per na-tionality are presented in Table 1 (Ushuaia/PuntaArenas) and Table 2 (Christchurch).
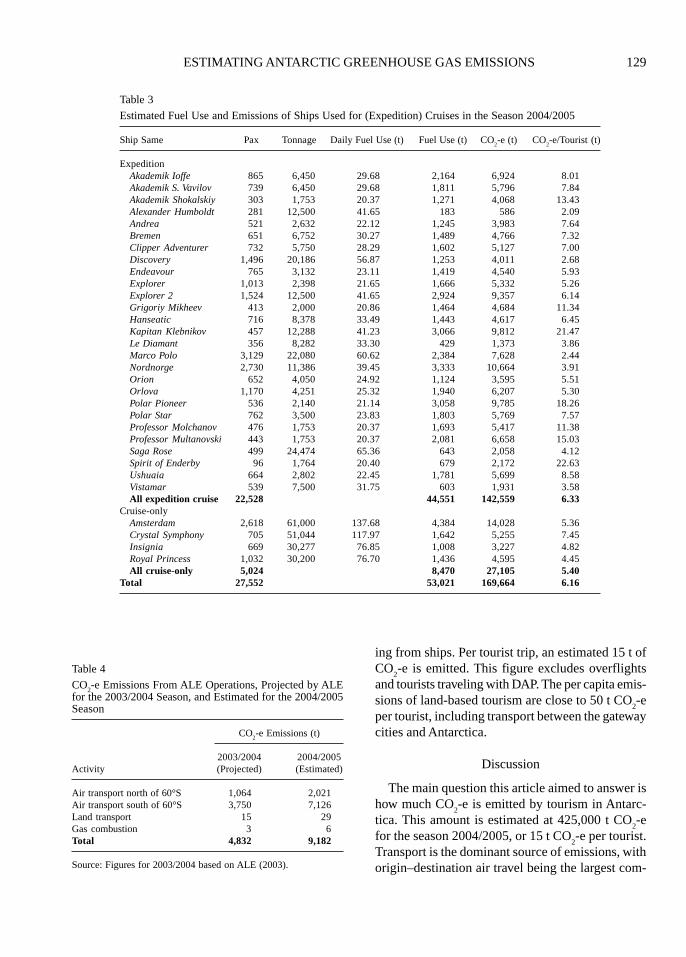
Ships burned an estimated 53,020 t of fuel duringthe 2004/2005 season, encompassing 44,550 t byexpedition cruises and the remaining 8,470 t bycruise-only ships (Table 3). Total emissions are esti-mated at 169,666 t of CO
2-e. The 27 expedition
cruise ships account for close to 85% of these emis-sions, whereas the four cruise-only ships are respon-sible for the remaining 15%. Average per capitaemissions are 6.16 t CO
2-e per passenger, but this
ratio varies widely, from 2.09 t CO2-e per passenger
for the Alexander Humboldt to 22.63 t CO2-e per
passenger for the Spirit of Enderby. Average percapita emissions for expedition cruise ships are foundto be almost 20% higher than for cruise-only ships.
The ALE emissions for the 2004/2005 seasonwere estimated at 3,423 t CO
2, an increase of 90%
with respect to the projected emissions for 2003/2004. Expressed in terms of CO
2-e, total ALE emis-
sions are estimated at 9,182 t CO2-e (Table 4). Emis-
sions produced by the two DAP airplanes are esti-mated at 375 t CO
2-e in 2004/2005.
For the four Croydon/Qantas overflights, totalemissions are estimated at 5,102 t CO
2-e. The nine
LanChile flights resulted in an estimated total of 710t CO
2-e. Total emissions related to overflights in the
2004/2005 season are thus estimated at some 5,812t CO
2-e.
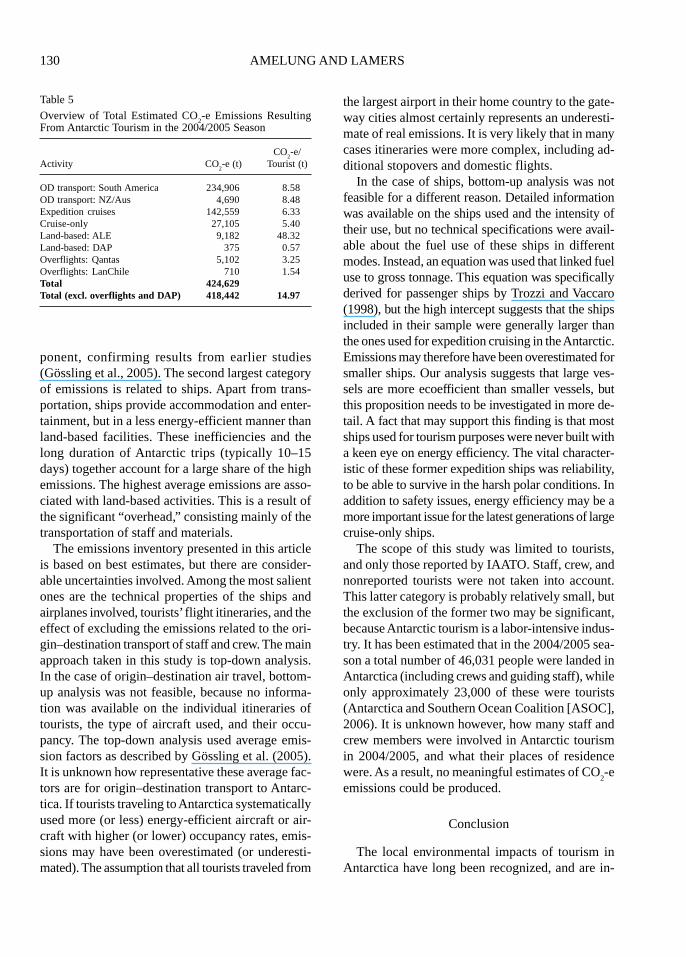
All in all, tourism in Antarctica produced an esti-mated 425,000 t CO
2–e in the season 2004/2005
(Table 5). Air travel contributes close to 60% of thisamount, with most of the remaining emissions com-
128 AMELUNG AND LAMERS
Table 1
Estimated Passenger Kilometers and CO2-e Emissions Resulting From Traveling to and
Away From the South American Gateway Cities (Ushuaia, Argentina), Season 2004/2005
Country (Airport Code) Pax Pkm (1000s) Pkm/Tourist CO2-e (t) CO
2-e/Tourist (t)
USA (ATL) 11,224 245,014 21,829 82,376 7.34UK (LHR) 3,835 108,408 28,268 36,146 9.43Germany (FRA) 3,243 94,166 29,037 31,374 9.67Australia (SYD) 2,347 69,687 29,692 23,204 9.89Canada (YYZ) 1,425 33,821 23,734 11,338 7.96Japan (NRT) 740 32,096 43,373 10,596 14.32Netherlands (AMS) 614 17,777 28,953 5,923 9.65Switzerland (ZRH) 494 14,158 28,660 4,719 9.55New Zealand (AKL) 315 8,390 26,635 2,802 8.90Spain (MAD) 329 8,575 26,064 2,866 8.71France (CDG) 287 8,091 28,192 2,698 9.40South Africa (JNB) 250 5,501 22,004 1,849 7.40Mexico (MEX) 230 4,699 20,430 1,584 6.89Italy (FCO) 190 5,381 28,321 1,794 9.44Austria (VIE) 183 5,447 29,765 1,813 9.91Belgium (BRU) 151 4,334 28,702 1,445 9.57Norway (OSL) 144 4,426 30,736 1,472 10.22Sweden (ARN) 138 4,326 31,348 1,438 10.42Argentina (EZE) 131 646 4,931 244 1.87Ireland (DUB) 119 3,336 28,034 1,112 9.35Chile (SCL) 102 748 7,333 269 2.64Other (n/a) 901 23,469 26,048 7,844 8.69Total 27,392 702,496 25,646 234,906 8.58
Table 2
Estimated Passenger Kilometers and CO2-e Emissions From Traveling to and Away From
the New Zealand/Australian Gateway Cities (Christchurch, New Zealand), Season 2004/2005
Country (Airport Code) Pax Pkm (1000s) Pkm/Tourist CO2-e (t) CO
2-e/Tourist (t)
USA (JFK) 158 4,570 28,924 1,494 9.46UK (LHR) 96 3,850 40,104 1,256 13.08Germany (FRA) 32 1,273 39,781 415 12.97Australia (SYD) 113 690 6,106 233 2.06Canada (YYZ) 21 644 30,667 211 10.03Japan (NRT) 6 120 20,000 39 6.58Netherlands (AMS) 18 714 39,667 233 12.93Switzerland (ZRH) 10 402 40,200 131 13.11New Zealand (AKL) 44 69 1,568 26 0.59Spain (MAD) 0 0 n/a 0 n/aFrance (CDG) 15 607 40,467 198 13.20South Africa (JNB) 5 136 27,200 44 8.89Mexico (MEX) 2 49 24,500 16 8.05Italy (FCO) 8 322 40,250 105 13.13Austria (VIE) 5 195 39,000 64 12.74Belgium (BRU) 3 120 40,000 39 13.03Norway (OSL) 3 113 37,667 37 12.28Sweden (ARN) 1 37 37,000 12 12.16Argentina (EZE) 1 23 23,000 8 7.62Ireland (DUB) 2 79 39,500 26 12.96Chile (SCL) 0 0 n/a 0 n/aOther (n/a) 10 315 31,500 103 10.28Total 553 14,328 25,910 4,690 8.48
ESTIMATING ANTARCTIC GREENHOUSE GAS EMISSIONS 129
ing from ships. Per tourist trip, an estimated 15 t ofCO
2-e is emitted. This figure excludes overflights
and tourists traveling with DAP. The per capita emis-sions of land-based tourism are close to 50 t CO
2-e
per tourist, including transport between the gatewaycities and Antarctica.
Discussion
The main question this article aimed to answer ishow much CO
2-e is emitted by tourism in Antarc-
tica. This amount is estimated at 425,000 t CO2-e
for the season 2004/2005, or 15 t CO2-e per tourist.
Transport is the dominant source of emissions, withorigin–destination air travel being the largest com-
Table 4
CO2-e Emissions From ALE Operations, Projected by ALEfor the 2003/2004 Season, and Estimated for the 2004/2005Season
CO2-e Emissions (t)
2003/2004 2004/2005Activity (Projected) (Estimated)
Air transport north of 60°S 1,064 2,021Air transport south of 60°S 3,750 7,126Land transport 15 29Gas combustion 3 6Total 4,832 9,182
Source: Figures for 2003/2004 based on ALE (2003).
Table 3
Estimated Fuel Use and Emissions of Ships Used for (Expedition) Cruises in the Season 2004/2005
Ship Same Pax Tonnage Daily Fuel Use (t) Fuel Use (t) CO2-e (t) CO
2-e/Tourist (t)
ExpeditionAkademik Ioffe 865 6,450 29.68 2,164 6,924 8.01Akademik S. Vavilov 739 6,450 29.68 1,811 5,796 7.84Akademik Shokalskiy 303 1,753 20.37 1,271 4,068 13.43Alexander Humboldt 281 12,500 41.65 183 586 2.09Andrea 521 2,632 22.12 1,245 3,983 7.64Bremen 651 6,752 30.27 1,489 4,766 7.32Clipper Adventurer 732 5,750 28.29 1,602 5,127 7.00Discovery 1,496 20,186 56.87 1,253 4,011 2.68Endeavour 765 3,132 23.11 1,419 4,540 5.93Explorer 1,013 2,398 21.65 1,666 5,332 5.26Explorer 2 1,524 12,500 41.65 2,924 9,357 6.14Grigoriy Mikheev 413 2,000 20.86 1,464 4,684 11.34Hanseatic 716 8,378 33.49 1,443 4,617 6.45Kapitan Klebnikov 457 12,288 41.23 3,066 9,812 21.47Le Diamant 356 8,282 33.30 429 1,373 3.86Marco Polo 3,129 22,080 60.62 2,384 7,628 2.44Nordnorge 2,730 11,386 39.45 3,333 10,664 3.91Orion 652 4,050 24.92 1,124 3,595 5.51Orlova 1,170 4,251 25.32 1,940 6,207 5.30Polar Pioneer 536 2,140 21.14 3,058 9,785 18.26Polar Star 762 3,500 23.83 1,803 5,769 7.57Professor Molchanov 476 1,753 20.37 1,693 5,417 11.38Professor Multanovski 443 1,753 20.37 2,081 6,658 15.03Saga Rose 499 24,474 65.36 643 2,058 4.12Spirit of Enderby 96 1,764 20.40 679 2,172 22.63Ushuaia 664 2,802 22.45 1,781 5,699 8.58Vistamar 539 7,500 31.75 603 1,931 3.58All expedition cruise 22,528 44,551 142,559 6.33
Cruise-onlyAmsterdam 2,618 61,000 137.68 4,384 14,028 5.36Crystal Symphony 705 51,044 117.97 1,642 5,255 7.45Insignia 669 30,277 76.85 1,008 3,227 4.82Royal Princess 1,032 30,200 76.70 1,436 4,595 4.45All cruise-only 5,024 8,470 27,105 5.40
Total 27,552 53,021 169,664 6.16
130 AMELUNG AND LAMERS
ponent, confirming results from earlier studies(Gössling et al., 2005). The second largest categoryof emissions is related to ships. Apart from trans-portation, ships provide accommodation and enter-tainment, but in a less energy-efficient manner thanland-based facilities. These inefficiencies and thelong duration of Antarctic trips (typically 10–15days) together account for a large share of the highemissions. The highest average emissions are asso-ciated with land-based activities. This is a result ofthe significant “overhead,” consisting mainly of thetransportation of staff and materials.
The emissions inventory presented in this articleis based on best estimates, but there are consider-able uncertainties involved. Among the most salientones are the technical properties of the ships andairplanes involved, tourists’ flight itineraries, and theeffect of excluding the emissions related to the ori-gin–destination transport of staff and crew. The mainapproach taken in this study is top-down analysis.In the case of origin–destination air travel, bottom-up analysis was not feasible, because no informa-tion was available on the individual itineraries oftourists, the type of aircraft used, and their occu-pancy. The top-down analysis used average emis-sion factors as described by Gössling et al. (2005).It is unknown how representative these average fac-tors are for origin–destination transport to Antarc-tica. If tourists traveling to Antarctica systematicallyused more (or less) energy-efficient aircraft or air-craft with higher (or lower) occupancy rates, emis-sions may have been overestimated (or underesti-mated). The assumption that all tourists traveled from
the largest airport in their home country to the gate-way cities almost certainly represents an underesti-mate of real emissions. It is very likely that in manycases itineraries were more complex, including ad-ditional stopovers and domestic flights.
In the case of ships, bottom-up analysis was notfeasible for a different reason. Detailed informationwas available on the ships used and the intensity oftheir use, but no technical specifications were avail-able about the fuel use of these ships in differentmodes. Instead, an equation was used that linked fueluse to gross tonnage. This equation was specificallyderived for passenger ships by Trozzi and Vaccaro(1998), but the high intercept suggests that the shipsincluded in their sample were generally larger thanthe ones used for expedition cruising in the Antarctic.Emissions may therefore have been overestimated forsmaller ships. Our analysis suggests that large ves-sels are more ecoefficient than smaller vessels, butthis proposition needs to be investigated in more de-tail. A fact that may support this finding is that mostships used for tourism purposes were never built witha keen eye on energy efficiency. The vital character-istic of these former expedition ships was reliability,to be able to survive in the harsh polar conditions. Inaddition to safety issues, energy efficiency may be amore important issue for the latest generations of largecruise-only ships.
The scope of this study was limited to tourists,and only those reported by IAATO. Staff, crew, andnonreported tourists were not taken into account.This latter category is probably relatively small, butthe exclusion of the former two may be significant,because Antarctic tourism is a labor-intensive indus-try. It has been estimated that in the 2004/2005 sea-son a total number of 46,031 people were landed inAntarctica (including crews and guiding staff), whileonly approximately 23,000 of these were tourists(Antarctica and Southern Ocean Coalition [ASOC],2006). It is unknown however, how many staff andcrew members were involved in Antarctic tourismin 2004/2005, and what their places of residencewere. As a result, no meaningful estimates of CO
2-e
emissions could be produced.
Conclusion
The local environmental impacts of tourism inAntarctica have long been recognized, and are in-
Table 5
Overview of Total Estimated CO2-e Emissions Resulting
From Antarctic Tourism in the 2004/2005 Season
CO2-e/
Activity CO2-e (t) Tourist (t)
OD transport: South America 234,906 8.58OD transport: NZ/Aus 4,690 8.48Expedition cruises 142,559 6.33Cruise-only 27,105 5.40Land-based: ALE 9,182 48.32Land-based: DAP 375 0.57Overflights: Qantas 5,102 3.25Overflights: LanChile 710 1.54Total 424,629Total (excl. overflights and DAP) 418,442 14.97
ESTIMATING ANTARCTIC GREENHOUSE GAS EMISSIONS 131
creasingly addressed in (self-)regulatory measures.The global environmental impacts of visiting Ant-arctica, however, have been systematically over-looked in environmental impact assessments. In thisarticle a first inventory was made of the greenhousegas emissions produced by tourism to and in Ant-arctica. The long distances traveled, the large air-craft used, and the safety measures taken result inemissions close to 15 t CO
2-e per typical tourist trip,
including transport to and from the gateway cities.Antarctic tourism belongs to the most energy-in-
tensive tourism market segments. Average per capitaemissions for Antarctic tourists are more than threetimes as high as those for visits to the Seychelles(4.76 t CO
2-e per tourist), and 43 times as high as
the per capita emissions of a visit to the Rocky Moun-tains (0.35 t CO
2-e per tourist), as documented in
Gössling et al. (2005). In the case of the remote anduninhabited Antarctic, there is little scope for com-pensating high-emission long-haul travel patternswith local trips. In addition, even emissions fromtourists originating from relatively nearby countriessuch as Chile and Argentina are high, because thelarge majority of tourists depend on engine-poweredships for accommodation. As a result, Antarctica isthe exclusive domain of high-mobility, high-emis-sion tourists.
Our study reveals a number of gaps in data avail-ability. The conceptual problems and lack of dataaround making an inventory for emissions from in-ternational air travel have been documented else-where (Becken, 2002). Emissions originating fromtourism-related shipping have received much lessattention. For aviation, detailed information aboutfuel use and emissions are available for individualtypes of aircraft (Watterson et al., 2004), which al-lows for bottom-up analysis. To the best knowledgeof the authors, such a standard and accessible data-base is not available for ships. Future top-downanalyses would benefit from the development ofstandardized average emission coefficients, similarto those available for air travel (Gössling et al., 2005).
Regardless of the incomplete availability of sta-tistics and the uncertainties present, the results showthat the global impacts of Antarctic tourism are largeand merit a place in any environmental assessmentof tourism in Antarctica. The most natural place forsuch global impacts to be assessed is in the EIAs,but major problems are associated with this. All regu-
lations under the Antarctic Treaty, including theEnvironmental Protocol, apply only to the area southof 60° South latitude. Because of this, all emissionsrelated to origin–destination air travel and some ofthe ship-related emissions would be excluded. Thisis analogous to the difficulty of including interna-tional air travel in national emissions inventories(Dubois & Ceron, 2006). In addition, in the contextof tourism, only preliminary and initial environmen-tal evaluations (PEE, IEE) have been performed(Hemmings & Roura, 2003), which have limitedrequirements beside the description of direct impactsin Antarctica itself. There is a tendency, however,towards requiring tour operators to also address theindirect impacts of their activities in their EIAs(Kriwoken & Rootes, 2000). Emissions from ori-gin–destination air travel may qualify as indirectimpacts, but the legal feasibility of such an arrange-ment is yet to be explored.
Apart from the legal requirements, there is also amoral aspect to accounting for the environmentalimpacts of tourism. Antarctica is frequently labeledas an ecotourism or sustainable tourism destination(Splettstoesser et al., 2004; Stonehouse, 1994). Twoof IAATO’s key objectives are “to advocate, pro-mote and practice safe and environmentally respon-sible travel to the Antarctic” and “to create a corpsof ambassadors for the continued protection of Ant-arctica by offering the opportunity to experience thecontinent first hand” (IAATO, 2007). Whether tour-ists indeed contribute to preserving the Antarcticwilderness remains undecided (Maher et al., 2003),but one can argue that the emphasis on the idealisticand moral side of tourism in Antarctica raises ex-pectations about the environmental performance ofthe tourists and tour operators. Even in the absenceof formal regulation, the tourist industry might there-fore try to address greenhouse gas emissions: forexample, by introducing emission compensationschemes, or by applying best available (transport)technologies. After all, Antarctica is itself a major“victim” of climate change. The Antarctic Peninsulahas witnessed an increase in average annual tem-perature of 3°C since the 1940s, causing the disinte-gration of ice-shelves, and creating opportunities forthe success and distribution of exotic species(Crosbie, 2005).
A fundamental question remains: Is there a long-term future for Antarctic tourism? In the absence of
132 AMELUNG AND LAMERS
a domestic market, trips to the South Pole regionunavoidably imply long-haul travel. In fact, the largemajority of visitors currently originate from theNorthern Hemisphere. To compensate for the largedistances traveled, large efficiency gains in air travelwould be required, and these are not in sight for thenext few decades. In addition, Antarctica and otherlong-haul destinations are vulnerable to any poli-cies that would lead to substantial increases in trans-port costs (e.g., carbon taxing). Albeit taking placein a distant and pristine location, Antarctic tourismis very strongly connected to global developments.
Acknowledgments
The authors wish to thank Stefan Gössling and ananonymous referee for their constructive comments,and Debra Enzenbacher for her valuable feedbackon a draft version of the paper. The project describedwas funded by Netherlands AntArctic Programme(NWO-NAAP) grant number 851.20.029 and851.20.025.
Biographical Notes
Dr. Bas Amelung is a Post-doc researcher at the InternationalCentre for Integrated Assessment and Sustainable Develop-ment (ICIS) at Maastricht University. He received his Ph.D.from this same university in March 2006. His research inter-ests include Antarctic tourism, climate change and tourism,and sustainability.
Machiel Lamers, M.A., is a Ph.D. student at ICIS workingon the development of Antarctic tourism scenarios throughparticipatory research methodologies.
References
Antarctic Logistics and Expeditions. (2003). Multi-year ap-plication to the US Environmental Protection Agency: Ini-tial environmental evaluation of Antarctic flight logis-tics. Arlington, VA.
Antarctica and Southern Ocean Coalition. (2006). Strategicissues posed by commercial tourism in the AntarcticTreaty area. Antarctica and Southern Ocean Coalition.Paper presented at the Antarctic Treaty ConsultativeMeeting XXIX, Edinburgh, UK.
Bastmeijer, C., & Roura, R. (2004). Regulating Antarctictourism and the precautionary principle. American Jour-nal of International Law, 98(4), 763–781.
Becken, S. (2002). Analysing international tourist flows toestimate energy use associated with air travel. Journal ofSustainable Tourism, 10(2), 114–131.
Becken, S., & Simmons, D. (2002). Understanding energyconsumption patterns of tourist attractions and activitiesin New Zealand. Tourism Management, 23(4), 343–354.
Carey, P. (2005). Small ship or large ship? In J. Rubin (Ed.),Lonely Planet Antarctica (3rd ed., pp. 298–299).Footscray, Australia: Lonely Planet Publications.
Cessford, G. (1997). Antarctic tourism. A frontier for wil-derness management. International Journal of Wilder-ness, 3(3), 7–11.
Clarke, M. (2004). Tourist flight returns to Antarctica’s MountErebus. Retrieved January 8, 2007 from http://www.avweb.com/news/features/187317-1.html
Crosbie, K. (2005). Towards site guidelines: A preliminaryanalysis of Antarctic Peninsula site landing data, 1990/00–2003/04. Paper presented at the Antarctic Treaty Con-sultative Meeting XXVIII, Stockholm, Sweden.
De Poorter, M. (2000). Tourism risks from an environmentalperspective. Paper presented at the Antarctic TourismWorkshop, Antarctica New Zealand, June 23,Christchurch, New Zealand.
Dubois, G., & Ceron, J.-P. (2006). Tourism and climatechange: Proposals for a research agenda. Journal of Sus-tainable Tourism, 14(4), 399–415.
Enzenbacher, D. (1993). Tourists in Antarctica: Numbers andtrends. Tourism Management, 14(2), 142–146.
Frenot, Y., Chown, S., Whinam, J., Selkirk, P., Convey, P.,Skonicki, M., & Bergstrom, D. (2005). Biological inva-sions in the Antarctic: Extent, impacts and implications.Biological Review, 80, 45–72.
Gössling, S. (2002). Global environmental consequences oftourism. Global Environmental Change, 12(4), 283–302.
Gössling, S., Peeters, P., Ceron, J.-P., Dubois, G., Patterson,T., & Richardson, R. B. (2005). The eco-efficiency oftourism. Ecological Economics, 54(4), 417–434.
Hall, C. M. (1992). Tourism in Antarctica: Activities, im-pacts, and management. Journal of Travel Research,30(4), 2–9.
Hall, C. M., & Johnston, M. (1995). Introduction: Pole topole: Tourism issues, impacts and the search for a man-agement regime in polar regions. In C. M. Hall & M.Johnston (Eds.), Polar tourism (pp. 1–26). Chichester:John Wiley.
Hall, C. M., & Wouters, M. (1995). Issues in Antarctic tour-ism. In C. M. Hall & M. Johnston (Eds.), Polar tourism(pp. 147–166). Chichester: John Wiley.
Headland, R. (1994). Historical development of Antarctictourism. Annals of Tourism Research, 21(2), 269–280.
Headland, R. (forthcoming). Chronological list of Antarcticexpeditions and related historical events (2nd ed.). Cam-bridge: Cambridge University Press.
Hemmings, A. D., & Roura, R. (2003). A square peg in around hole: Fitting impact assessment under the Antarc-tic Environmental Protocol to Antarctic tourism. ImpactAssessment and Project Appraisal, 21(1), 13–24.
Hofman, R., & Jatko, J. (2000). Assessment of the possiblecumulative environmental impacts of commercial ship-based tourism in the Antarctic Peninsula area. Paper pre-sented at the Workshop, La Jolla, California, June 7–9.
ESTIMATING ANTARCTIC GREENHOUSE GAS EMISSIONS 133
International Association of Antarctica Tour Operators.(2005a). 2004–2005 Summary of seaborne, airborne, andland-based Antarctic tourism. Retrieved fromwww.iaato.org/tourism_stats.html
International Association of Antarctica Tour Operators.(2005b). 2004–2005 Tourist nationalities by vessel. Re-trieved from www.iaato.org/tourism_stats.html
International Association of Antarctica Tour Operators.(2005c). IAATO overview of Antarctic tourism 2004/05Antarctic season. Paper presented at the Antarctic TreatyConsultative Meeting XXVIII, Stockholm, Sweden.
International Association of Antarctica Tour Operators.(2006). IAATO overview of Antarctic tourism 2005–2006Antarctic season. Paper presented at the Antarctic TreatyConsultative Meeting XXIX 2006, Edinburgh, UK.
International Association of Antarctica Tour Operators.(2007). About IAATO: Objectives. Retrieved January 15,2007 from www.iaato.org/objectives.html
Kriwoken, L. K., & Rootes, D. (2000). Tourism on ice: Envi-ronmental impact assessment of Antarctic tourism. Im-pact Assessment and Project Appraisal, 18(2), 138–150.
Maher, P., Steel, G., & McIntosh, A. (2003). Antarctica: Tour-ism, wilderness, and ‘ambassadorship’? In A. Watson &J. Sproull (Eds.), Science and Stewardship to Protect andSustain Wilderness Values, Seventh World WildernessCongress Symposium (pp. 204–210), November 2–82001, Port Elizabeth, South Africa, Proceedings RMRS-P-27. Ogden, UT: USDA Forest Service, Rocky Moun-tain Research Station.
Mason, P., & Legg, S. (1999). Antarctic tourism: Activities,impacts, management issues, and a proposed researchagenda. Pacific Tourism Review, 3, 71–84.
Molenaar, E. J. (2005). Sea-borne tourism in Antarctica:Avenues for further intergovernemental regulation. In-ternational Journal for Marine and Coastal Law, 20(2),247–295.
Naveen, R., Forrest, S., Dagit, R., Blight, L., Trivelpiece, W.,& Trivelpiece, S. (2000). Censuses of penguin, blue-eyedshag, and southern giant petrel populations in the Ant-arctic Peninsula region, 1994–2000. Polar Record,
36(199), 323–334.Peeters, P., Gössling, S., & Williams, V. (2006). Air trans-
port greenhouse gas emission factors. Paper presented atthe Tourism and Climate Change Mitigation, Westelbeers.
Penner, J. E., Lister, D. H., Griggs, J. D., Dokken, D. J., &McFarland, M. (1999). Aviation and the global atmo-sphere: Summary for policymakers. Special Report ofIPCC Working Groups I and III, Intergovernmental Panelon Climate Change.
Pfeiffer, S., & Peter, H.-U. (2004). Ecological studies to-wards the management of an Antarctic tourist landingsite (Penguin Island, South Shetland Islands). PolarRecord, 40(215), 245–252.
Sausen, R., Isaksen, I., Grewe, V., Hauglustaine, D., Lee, D.S., Myhre, G., Köhler, M. O., Pitari, G., Schumann, U.,Stordal, F., & Zerefos, C. (2005). Aviation radiative forc-ing in 2000: An update on IPCC (1999). MeteorologischeZeitschrift, 14(4), 555–561.
Splettstoesser, J., Landau, D., & Headland, R. (2004). Tour-ism in the forbidden lands: The Antarctica experience. InT. V. Singh (Ed.), New horizons in tourism. Strange ex-periences and stranger practices. Wallingford: CABIPublishing.
Stewart, E., Draper, D., & Johnston, M. (2005). A review oftourism research in the polar regions. Arctic, 58(4), 383–394.
Stonehouse, B. (1994). Ecotourism in Antarctica. In E. Ca-ter & G. Lowman (Eds.), Ecotourism: A sustainable op-tion? (pp. 195–212). New York: John Wiley & Sons Ltd.
Stonehouse, B., & Crosbie, K. (1995). Tourist impacts andmanagement in the Antarctic Peninsula area. In C. M.Hall & M. Johnston (Eds.), Polar tourism (pp. 217–233).Chichester: John Wiley.
Trozzi, C., & Vaccaro, R. (1998). Methodologies for esti-mating air pollutant emissions from ships. Rome: Techne.
Watterson, J., Walker, C., & Eggleston, S. (2004). Revisionto the method of estimating emissions from Aircraft inthe UK Greenhouse Gas Inventory: Report to Global At-mosphere Division, DEFRA. Oxon: Netcen.
Related Documents


