Estimating the Disease Burden of 2009 Pandemic Influenza A(H1N1) from Surveillance and Household Surveys in Greece Vana Sypsa 1 *, Stefanos Bonovas 2 , Sotirios Tsiodras 2 , Agoritsa Baka 3 , Panos Efstathiou 3 , Meni Malliori 1 , Takis Panagiotopoulos 2 , Ilias Nikolakopoulos 1 , Angelos Hatzakis 1 1 National and Kapodistrian University of Athens, Athens, Greece, 2 Hellenic Centre for Diseases Control and Prevention, Athens, Greece, 3 National Health Operations Centre, Ministry of Health and Social Solidarity, Athens, Greece Abstract Background: The aim of this study was to assess the disease burden of the 2009 pandemic influenza A(H1N1) in Greece. Methodology/Principal Findings: Data on influenza-like illness (ILI), collected through cross-sectional nationwide telephone surveys of 1,000 households in Greece repeated for 25 consecutive weeks, were combined with data from H1N1 virologic surveillance to estimate the incidence and the clinical attack rate (CAR) of influenza A(H1N1). Alternative definitions of ILI (cough or sore throat and fever.38uC [ILI-38] or fever 37.1–38uC [ILI-37]) were used to estimate the number of symptomatic infections. The infection attack rate (IAR) was approximated using estimates from published studies on the frequency of fever in infected individuals. Data on H1N1 morbidity and mortality were used to estimate ICU admission and case fatality (CFR) rates. The epidemic peaked on week 48/2009 with approximately 750–1,500 new cases/100,000 population per week, depending on ILI-38 or ILI-37 case definition, respectively. By week 6/2010, 7.1%–15.6% of the population in Greece was estimated to be symptomatically infected with H1N1. Children 5–19 years represented the most affected population group (CAR:27%–54%), whereas individuals older than 64 years were the least affected (CAR:0.6%–2.2%). The IAR (95% CI) of influenza A(H1N1) was estimated to be 19.7% (13.3%, 26.1%). Per 1,000 symptomatic cases, based on ILI-38 case definition, 416 attended health services, 108 visited hospital emergency departments and 15 were admitted to hospitals. ICU admission rate and CFR were 37 and 17.5 per 100,000 symptomatic cases or 13.4 and 6.3 per 100,000 infections, respectively. Conclusions/Significance: Influenza A(H1N1) infected one fifth and caused symptomatic infection in up to 15% of the Greek population. Although individuals older than 65 years were the least affected age group in terms of attack rate, they had 55 and 185 times higher risk of ICU admission and CFR, respectively. Citation: Sypsa V, Bonovas S, Tsiodras S, Baka A, Efstathiou P, et al. (2011) Estimating the Disease Burden of 2009 Pandemic Influenza A(H1N1) from Surveillance and Household Surveys in Greece. PLoS ONE 6(6): e20593. doi:10.1371/journal.pone.0020593 Editor: Vladimir Brusic, Dana-Farber Cancer Institute, United States of America Received February 11, 2011; Accepted May 4, 2011; Published June 9, 2011 Copyright: ß 2011 Sypsa et al. This is an open-access article distributed under the terms of the Creative Commons Attribution License, which permits unrestricted use, distribution, and reproduction in any medium, provided the original author and source are credited. Funding: Work was funded by Hellenic Centre for Diseases Control and Prevention; and National and Kapodistrian University of Athens. The funders had no role in study design, data collection and analysis, decision to publish, or preparation of the manuscript. Competing Interests: The authors have declared that no competing interests exist. * E-mail: [email protected] Introduction Soon after the identification of the first cases infected with the new influenza A(H1N1) strain in Mexico and USA in March-April 2009, the virus spread rapidly around the world. H1N1 influenza activity initially peaked in the United States during May and June 2009 and a second wave occurred during the fall with activity peaking during the second week in October [1]. In Europe, an initial spring/summer wave of transmission appeared in most countries and was followed by a sharper autumn/winter wave of infection affecting all countries [2]. The first case of influenza A(H1N1) in Greece was reported on May 18, 2009 and the epidemic continued up to April 2010 when the last cases were recorded. A major challenge in influenza pandemics is to estimate the proportion of the population that was symptomatically infected and to draw conclusions concerning the age-specific severity of the infection. Estimating the attack rate of an influenza pandemic using existing influenza surveillance systems is challenging since only a portion of symptomatic cases seek medical care and only a small number of those seeking medical care are usually tested. During the 2009 influenza A(H1N1) pandemic, several reports have attempted an assessment of the associated burden and provided estimates of hospitalisations, ICU admissions or death rates using the number of laboratory-confirmed cases or the size of the general population as denominator [3–6]. Few studies have endeavored to estimate the attack rate of influenza A(H1N1) or to provide more accurate estimates of morbidity and mortality rates [7–13]. A proposed method, complementary to existing surveillance, in ascertaining the true incidence of influenza-like illness is repeated population-based telephone surveys [14,15]. Telephone surveys have been used during the 2009 pandemic to assess attitudes and perceptions concerning influenza [16,17] as well as in the past to PLoS ONE | www.plosone.org 1 June 2011 | Volume 6 | Issue 6 | e20593

Welcome message from author
This document is posted to help you gain knowledge. Please leave a comment to let me know what you think about it! Share it to your friends and learn new things together.
Transcript
Estimating the Disease Burden of 2009 PandemicInfluenza A(H1N1) from Surveillance and HouseholdSurveys in GreeceVana Sypsa1*, Stefanos Bonovas2, Sotirios Tsiodras2, Agoritsa Baka3, Panos Efstathiou3, Meni Malliori1,
Takis Panagiotopoulos2, Ilias Nikolakopoulos1, Angelos Hatzakis1
1 National and Kapodistrian University of Athens, Athens, Greece, 2 Hellenic Centre for Diseases Control and Prevention, Athens, Greece, 3 National Health Operations
Centre, Ministry of Health and Social Solidarity, Athens, Greece
Abstract
Background: The aim of this study was to assess the disease burden of the 2009 pandemic influenza A(H1N1) in Greece.
Methodology/Principal Findings: Data on influenza-like illness (ILI), collected through cross-sectional nationwide telephonesurveys of 1,000 households in Greece repeated for 25 consecutive weeks, were combined with data from H1N1 virologicsurveillance to estimate the incidence and the clinical attack rate (CAR) of influenza A(H1N1). Alternative definitions of ILI(cough or sore throat and fever.38uC [ILI-38] or fever 37.1–38uC [ILI-37]) were used to estimate the number of symptomaticinfections. The infection attack rate (IAR) was approximated using estimates from published studies on the frequency of feverin infected individuals. Data on H1N1 morbidity and mortality were used to estimate ICU admission and case fatality (CFR)rates. The epidemic peaked on week 48/2009 with approximately 750–1,500 new cases/100,000 population per week,depending on ILI-38 or ILI-37 case definition, respectively. By week 6/2010, 7.1%–15.6% of the population in Greece wasestimated to be symptomatically infected with H1N1. Children 5–19 years represented the most affected population group(CAR:27%–54%), whereas individuals older than 64 years were the least affected (CAR:0.6%–2.2%). The IAR (95% CI) of influenzaA(H1N1) was estimated to be 19.7% (13.3%, 26.1%). Per 1,000 symptomatic cases, based on ILI-38 case definition, 416 attendedhealth services, 108 visited hospital emergency departments and 15 were admitted to hospitals. ICU admission rate and CFRwere 37 and 17.5 per 100,000 symptomatic cases or 13.4 and 6.3 per 100,000 infections, respectively.
Conclusions/Significance: Influenza A(H1N1) infected one fifth and caused symptomatic infection in up to 15% of the Greekpopulation. Although individuals older than 65 years were the least affected age group in terms of attack rate, they had 55and 185 times higher risk of ICU admission and CFR, respectively.
Citation: Sypsa V, Bonovas S, Tsiodras S, Baka A, Efstathiou P, et al. (2011) Estimating the Disease Burden of 2009 Pandemic Influenza A(H1N1) from Surveillanceand Household Surveys in Greece. PLoS ONE 6(6): e20593. doi:10.1371/journal.pone.0020593
Editor: Vladimir Brusic, Dana-Farber Cancer Institute, United States of America
Received February 11, 2011; Accepted May 4, 2011; Published June 9, 2011
Copyright: � 2011 Sypsa et al. This is an open-access article distributed under the terms of the Creative Commons Attribution License, which permitsunrestricted use, distribution, and reproduction in any medium, provided the original author and source are credited.
Funding: Work was funded by Hellenic Centre for Diseases Control and Prevention; and National and Kapodistrian University of Athens. The funders had no rolein study design, data collection and analysis, decision to publish, or preparation of the manuscript.
Competing Interests: The authors have declared that no competing interests exist.
* E-mail: [email protected]
Introduction
Soon after the identification of the first cases infected with the
new influenza A(H1N1) strain in Mexico and USA in March-April
2009, the virus spread rapidly around the world. H1N1 influenza
activity initially peaked in the United States during May and June
2009 and a second wave occurred during the fall with activity
peaking during the second week in October [1]. In Europe, an
initial spring/summer wave of transmission appeared in most
countries and was followed by a sharper autumn/winter wave of
infection affecting all countries [2]. The first case of influenza
A(H1N1) in Greece was reported on May 18, 2009 and the
epidemic continued up to April 2010 when the last cases were
recorded.
A major challenge in influenza pandemics is to estimate the
proportion of the population that was symptomatically infected
and to draw conclusions concerning the age-specific severity of the
infection. Estimating the attack rate of an influenza pandemic
using existing influenza surveillance systems is challenging since
only a portion of symptomatic cases seek medical care and only a
small number of those seeking medical care are usually tested.
During the 2009 influenza A(H1N1) pandemic, several reports
have attempted an assessment of the associated burden and
provided estimates of hospitalisations, ICU admissions or death
rates using the number of laboratory-confirmed cases or the size of
the general population as denominator [3–6]. Few studies have
endeavored to estimate the attack rate of influenza A(H1N1) or to
provide more accurate estimates of morbidity and mortality rates
[7–13].
A proposed method, complementary to existing surveillance, in
ascertaining the true incidence of influenza-like illness is repeated
population-based telephone surveys [14,15]. Telephone surveys
have been used during the 2009 pandemic to assess attitudes and
perceptions concerning influenza [16,17] as well as in the past to
PLoS ONE | www.plosone.org 1 June 2011 | Volume 6 | Issue 6 | e20593
estimate the prevalence of seasonal influenza or of influenza-like
illness [18,19]. In Greece, repeated cross-sectional nationwide
telephone surveys of 1,000 households were conducted for 25
consecutive weeks, and covered the major epidemic wave during
the autumn and early winter of 2009. The aim of the present study
was to estimate the overall and age-specific incidence as well as the
attack rate of influenza A(H1N1) in the Greek population by
combining the data collected by the telephone surveys with data
from virologic surveillance. Secondary aims were to provide
estimates of the case fatality rate (CFR) as well as of the burden of
disease of health care services. The collected data allowed to trace
the spread of influenza A(H1N1) in the population over time and
to identify the most affected age groups.
Methods
EthicsAccording to the decision of the Board of Directors of the
Hellenic Center for Disease Control and Prevention and of Athens
University, the household telephone surveys were deemed public
health practice and not human subjects research and therefore did
not require ethics approval by the Institutional Review Board of
Athens University Medical School. Contacted persons gave verbal
consent to participate in a telephone survey conducted by the
University of Athens.
Telephone surveysData on the incidence of influenza-like illness (ILI) were ob-
tained by repeated cross-sectional nationwide telephone surveys of
1,000 households in Greece on a weekly basis, starting the last
week of August 2009 (Week 35 of 2009) until mid-February 2010
(Week 6 of 2010) (total duration, 25 weeks). Proportional quota
sampling was used each week to ensure that selected households
were representative of Greek households, with quotas based on
household size and urban/rural location. A non-random adult
from each household was asked to participate to a survey. To
reduce selection bias, the participants were initially asked to
participate to a survey performed on behalf of the University
of Athens without mentioning that the survey was related to
influenza A(H1N1). In case the person accepted to participate,
he/she was asked to provide information on several items inclu-
ding the occurrence of each of the following symptoms related to
influenza during that particular week for each household member:
fever (37.1–38.0uC or .38uC), cough, sore throat, runny nose.
Other data, including perceptions and beliefs concerning influenza
and vaccination, were also collected [20,21] (more details in
Supporting Information S1).
Estimating the incidence and attack rate of influenzaA(H1N1)
The definition of ILI usually includes the presence of fever
.38uC and cough or sore throat (ILI-38). Due to the limited
sensitivity of ILI-38 for symptomatic influenza infection [22,23],
alternative definitions of ILI and acute respiratory illness (ARI) were
also used. Thus, we denote as ILI-37 the presence of fever 37.1–
38uC and cough or sore throat, as ARI-38 the presence of any two
of the following symptoms: fever .38uC, cough, sore throat, and
runny nose, and as ARI-37 the presence of any two of the following
symptoms: fever 37.1–38uC, cough, sore throat and runny nose.
The estimate of the incidence of symptomatic influenza
A(H1N1) was based on the weekly age-specific ILI rate data,
obtained from the phone surveys, and the data on the proportion
of samples testing positive for H1N1 out of the total number of
samples sent to laboratories from hospitals in the corresponding
weeks. We assumed 90% sensitivity for the RT-PCR test [24]. We
have applied the age-specific estimates of the proportion of
samples testing positive on the corresponding age-specific ILI rates
to obtain the number of H1N1 cases as the proportion testing
positive varied largely according to age (Figure 1). Thus, for a
particular week i and age group j where ILIij: the estimated
number of new ILI cases per 100,000 population and PROPij: the
proportion of samples testing positive for H1N1, the incidence of
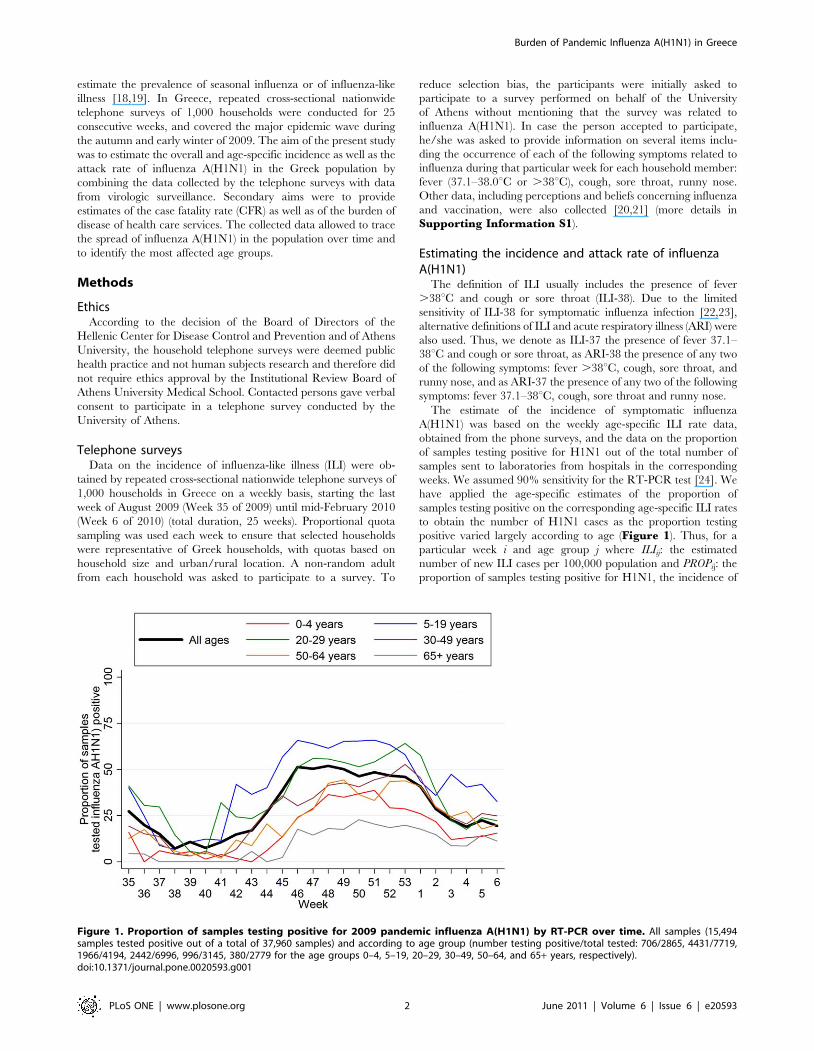
Figure 1. Proportion of samples testing positive for 2009 pandemic influenza A(H1N1) by RT-PCR over time. All samples (15,494samples tested positive out of a total of 37,960 samples) and according to age group (number testing positive/total tested: 706/2865, 4431/7719,1966/4194, 2442/6996, 996/3145, 380/2779 for the age groups 0–4, 5–19, 20–29, 30–49, 50–64, and 65+ years, respectively).doi:10.1371/journal.pone.0020593.g001
Burden of Pandemic Influenza A(H1N1) in Greece
PLoS ONE | www.plosone.org 2 June 2011 | Volume 6 | Issue 6 | e20593
symptomatic H1N1 cases was estimated as:ILIij � PROPij
0:90per
100,000 population per week. Alternative incidence estimates were
obtained using the number of ILI-38, ILI-37, ARI-38 and ARI-37
cases in this formula. A refinement of this method would be
possible by taking into account of the variability of the estimates of
ILIij and PROPij obtained by the weekly samples.
The number of infections, both symptomatic and asymptom-
atic, was approximated using the estimates provided by two studies
on the frequency of fever among infected individuals [22,23].
According to Carrat et al, fever .37.8uC was observed in 37% of
A/H1N1 infections [22]. Similarly, Cao et al reported that 36% of
infected individuals experienced fever .38.0uC [23]. Thus, the
estimated incidence of symptomatic H1N1 infection (based on ILI-
38 case definition) was divided by 36% to obtain the correspond-
ing estimate for H1N1 infection.
The clinical attack rate (CAR) and the infection attack rate
(IAR) were estimated as the cumulative incidence of symptomatic
infections and of all estimated infections, respectively, during the
25-week period covered by the phone surveys.
To account for the sampling design, the svy commands
(STATA, StataCorp LP) were employed with the design properly
specified in order to obtain estimates and their standard errors.
Estimating the burden of disease (GP consultations,hospital admissions, ICU admissions, case fatality rates)
Data collected from the phone surveys concerning GP
consultations and hospital visits/admissions (Supporting Infor-mation S2) were used to estimate the proportion of symptomatic
cases seeking medical care from their GPs/hospital emergency
departments or being hospitalized.
Surveillance data on the number of laboratory confirmed
influenza A(H1N1) cases that were admitted to ICU or died were
collected as described elsewhere [25]. Briefly, all hospital
administrations in Greece were asked to report patients admitted
with confirmed or suspected cases of 2009 H1N1 three times
weekly. On a daily basis, investigators from the National Health
Operations Centre of the Ministry of Health made follow-up
telephone calls to the physicians of all patients with confirmed
cases of 2009 influenza A(H1N1) who were admitted to an ICU.
Data collection on deaths was performed by the Hellenic Centre
for Diseases Control and Prevention in collaboration with the
National Health Operations Centre from a network that included
all state and private hospitals in the seven semiautonomous
regional health authorities of Greece.
ICU admission rates and case fatality rates (CFR) were
estimated per symptomatic cases as well as per estimated H1N1
infections. The estimates of H1N1 case numbers and the data
collected on the number of deaths and ICU admissions up to week
6 of 2010 were used to calculate age-specific and overall ICU
admission rates and CFR. To allow the comparability of these
results with estimates from other studies, rates per symptomatic
cases were calculated using the number of symptomatic H1N1
cases obtained based on the standard ILI-38 definition. To
account for the lag between the onset of symptoms and the
occurrence of these events, the cumulative number of cases one
and two weeks before week 6 of 2010 for the estimate of ICU
admission rates and CFR, respectively, were used [11].
Results
Response rates and sample characteristicsOverall, 81,268 households were contacted with members
eligible to participate during the 25 weeks. Of these, 25,012 agreed
to participate (response rate: 30.8%). Weekly response rates
ranged from 25.7% to 34.5% throughout the study.
The weekly samples of 1,000 households included in the surveys
were located in Athens (main metropolitan area of Southern
Greece, 40% of households), Thessaloniki (main metropolitan area
of Northern Greece, 10% of households), and other urban (25%),
semi-urban (10%), and rural (15%) areas. In total, there were
72,201 members in the participating households. The average
household size was 2.9 persons. Females accounted for 51.4% of
the sample. Fourteen per cent, 11%, 57% and 18% of the sample
were 0–14, 15–24, 25–64 and $65 years old, respectively. Age
and gender distribution as well as the average household size of the
sample were similar to that of the Greek population according to
the data provided by the Hellenic Statistical Authority (Support-ing Information S3).
Incidence and attack rate of influenza A (H1N1)The proportion of swabs collected from ILI cases that tested
positive for H1N1 by RT-PCR according to age and over time is
depicted in Figure 1. The prevalence of H1N1 positive samples
was higher in the peak epidemic weeks and reached up to 65% in
individuals aged 5–29 years. Furthermore, it was considerably
lower among very young (0–4 years) and old ($65 years) ILI cases.
The age-specific weekly incidence rates of ILI-38, ILI-37, ARI-
38 and ARI-37 are depicted in Figure S1. A steady rise in the
number of ILI and ARI cases was observed after week 37 of 2009
(September 7–13, 2009) in most age groups; particularly, among
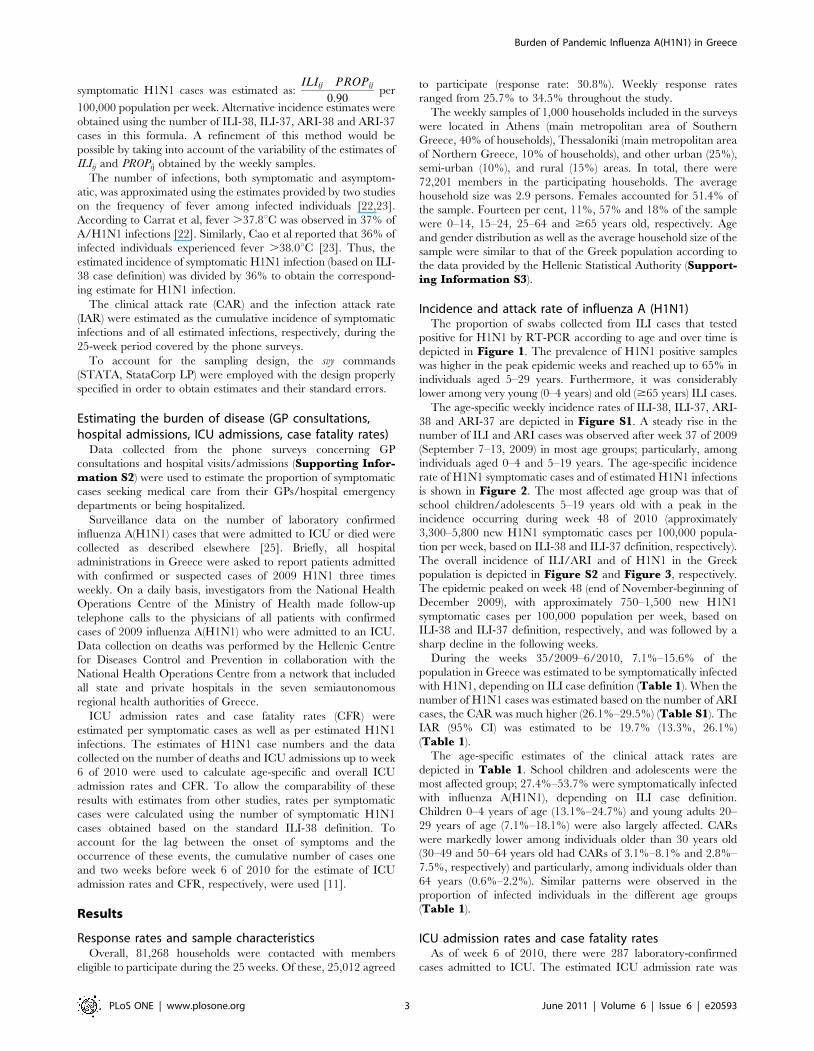
individuals aged 0–4 and 5–19 years. The age-specific incidence
rate of H1N1 symptomatic cases and of estimated H1N1 infections
is shown in Figure 2. The most affected age group was that of
school children/adolescents 5–19 years old with a peak in the
incidence occurring during week 48 of 2010 (approximately
3,300–5,800 new H1N1 symptomatic cases per 100,000 popula-
tion per week, based on ILI-38 and ILI-37 definition, respectively).
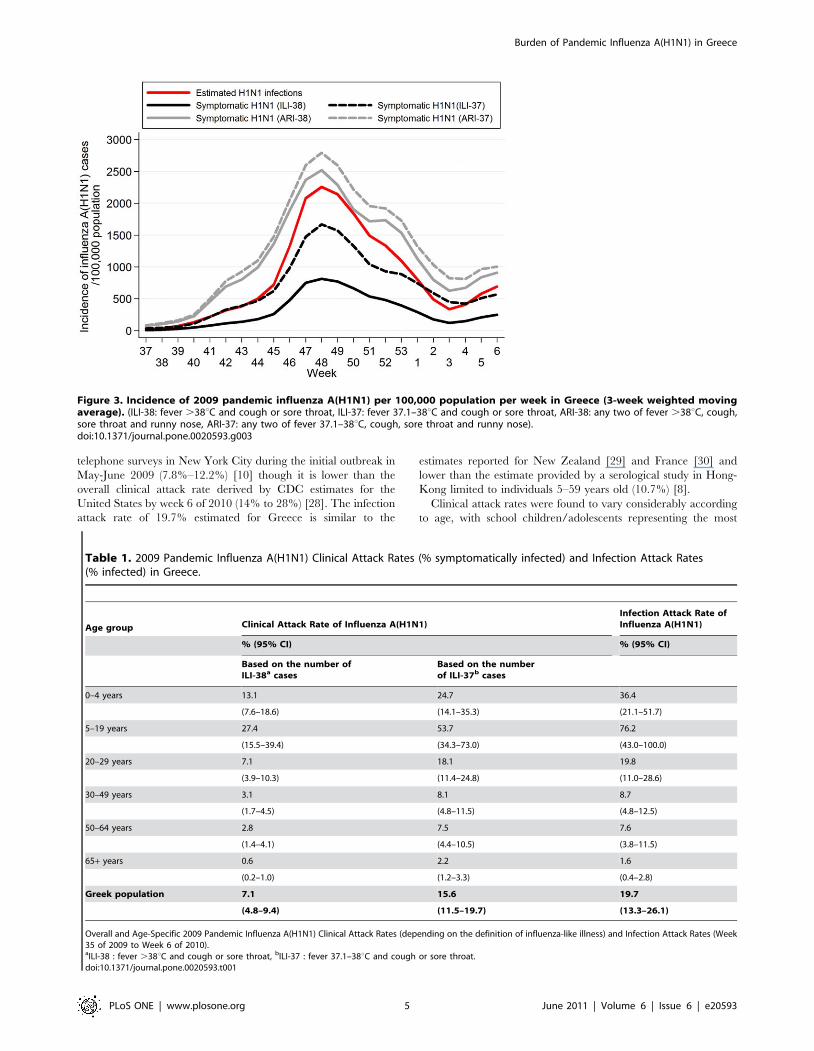
The overall incidence of ILI/ARI and of H1N1 in the Greek
population is depicted in Figure S2 and Figure 3, respectively.
The epidemic peaked on week 48 (end of November-beginning of
December 2009), with approximately 750–1,500 new H1N1
symptomatic cases per 100,000 population per week, based on
ILI-38 and ILI-37 definition, respectively, and was followed by a
sharp decline in the following weeks.
During the weeks 35/2009–6/2010, 7.1%–15.6% of the
population in Greece was estimated to be symptomatically infected
with H1N1, depending on ILI case definition (Table 1). When the
number of H1N1 cases was estimated based on the number of ARI
cases, the CAR was much higher (26.1%–29.5%) (Table S1). The
IAR (95% CI) was estimated to be 19.7% (13.3%, 26.1%)
(Table 1).
The age-specific estimates of the clinical attack rates are
depicted in Table 1. School children and adolescents were the
most affected group; 27.4%–53.7% were symptomatically infected
with influenza A(H1N1), depending on ILI case definition.
Children 0–4 years of age (13.1%–24.7%) and young adults 20–
29 years of age (7.1%–18.1%) were also largely affected. CARs
were markedly lower among individuals older than 30 years old
(30–49 and 50–64 years old had CARs of 3.1%–8.1% and 2.8%–
7.5%, respectively) and particularly, among individuals older than
64 years (0.6%–2.2%). Similar patterns were observed in the
proportion of infected individuals in the different age groups
(Table 1).
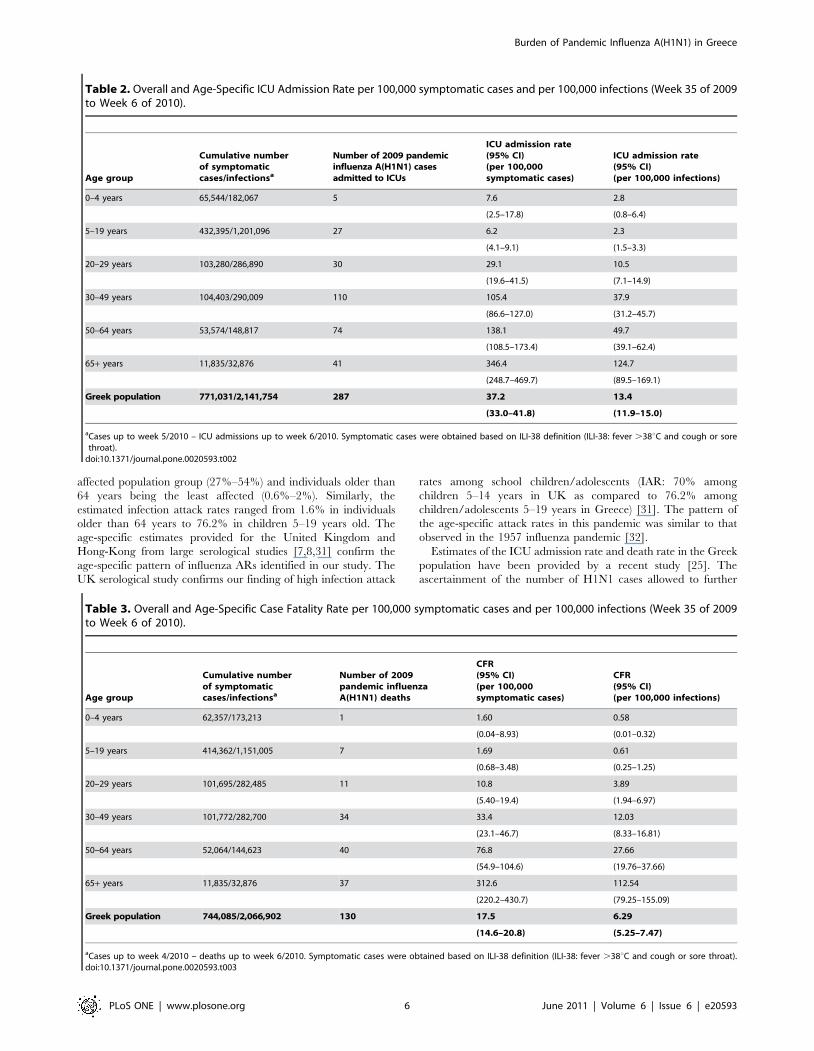
ICU admission rates and case fatality ratesAs of week 6 of 2010, there were 287 laboratory-confirmed
cases admitted to ICU. The estimated ICU admission rate was
Burden of Pandemic Influenza A(H1N1) in Greece
PLoS ONE | www.plosone.org 3 June 2011 | Volume 6 | Issue 6 | e20593
13.4/100,000 infected cases and 37.2/100,000 symptomatic cases.
It varied widely according to age, with an estimated rate for
individuals older than 65 years old that was 55-fold than that of
individuals 5–19 years old (346.4 and 6.2 per 100,000 symptom-
atic cases, respectively) (Table 2).
A total of 130 deaths were recorded during the same period.
The estimated CFR was 6.3 deaths/100,000 infected cases and
17.5 deaths/100,000 symptomatic cases (Table 3). CFR estimates
were markedly higher among individuals over 50 years of age (77
and 313 deaths per 100,000 symptomatic cases aged 50–64 and
$65 years old, respectively). Individuals older than 65 years old
had 185 times higher risk of death compared to individuals 5–19
years old, if infected.
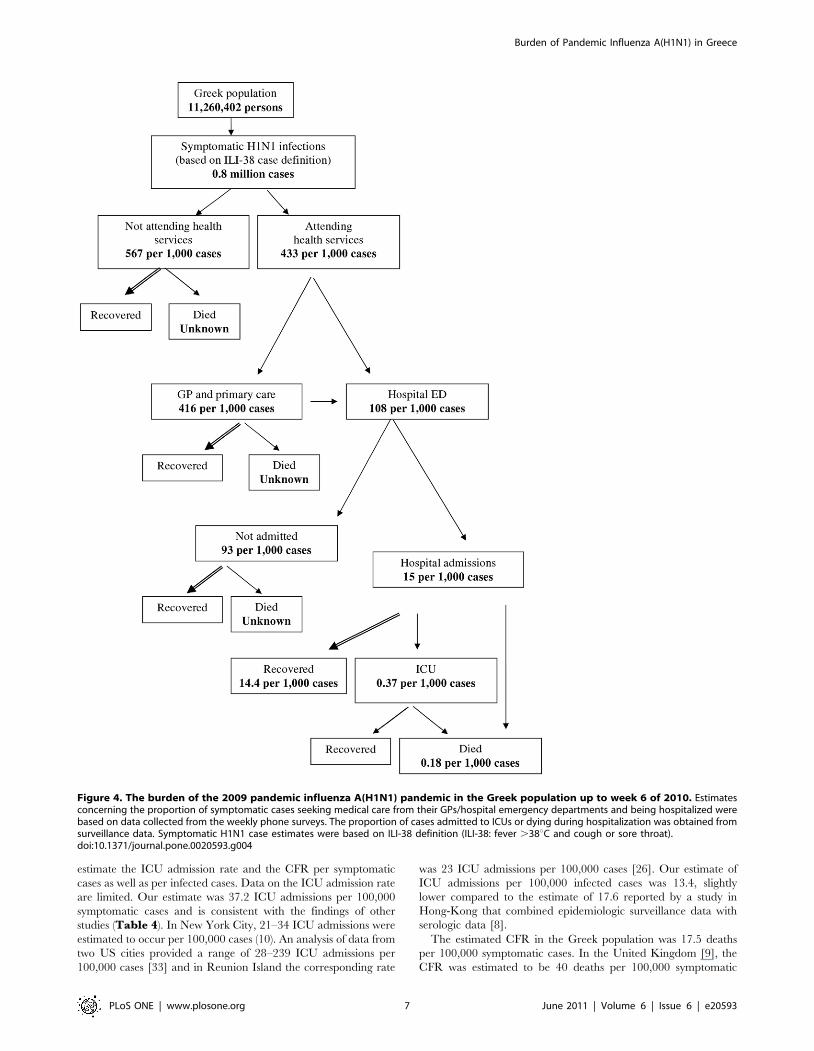
Disease pyramidA representation of the disease pyramid, i.e. of the proportion
of influenza A(H1N1) infected cases seeking medical care,
requiring hospitalization, ICU admission, or dying is shown in
Figure 4. It was estimated that 416 per 1,000 symptomatic cases
visited GPs/primary care physicians and 108 per 1,000 cases
visited hospital emergency departments (data obtained from
phone surveys; see Supporting Information S2). Only a
small proportion were admitted to hospitals (15 per 1,000 symp-
tomatic cases) or, subsequently, to an ICU (0.37 per 1,000
symptomatic cases). For every 100,000 symptomatic cases, 18
deaths occurred.
Discussion
Based on the data collected from repeated cross-sectional
households surveys for 25 consecutive weeks during the autumn-
early winter wave of influenza A(H1N1) in Greece in 2009–2010,
it was possible to reconstruct the incidence of ILI and influenza
A(H1N1) cases over time in the different age population groups. It
was estimated that 7%–16% of the Greek population experienced
symptomatic influenza A(H1N1), depending on ILI case defini-
tion, and that approximately one fifth of the population was
infected, either symptomatically or asymptomatically. The esti-
mated CAR is in accordance with the estimates provided for New
Zealand (7.5%) [13], Reunion Island (12.9%) [26] and Singapore
(5.4%–11%) [27] after the major H1N1 wave was complete
(Table 4). It compares with the estimates provided by two
Figure 2. Age-specific incidence of 2009 pandemic influenza A(H1N1) per 100,000 population per week (3-week weighted moving
average). For week i and age group j, the incidence of symptomatic H1N1 infection was estimated as:ILIij � PROPij
0:90per 100,000 population per
week where ILIij: the estimated number of new ILI cases per 100,000 population per week and PROPij: the proportion of samples testing positive forH1N1. The number of estimated H1N1 infections was obtained by dividing the estimated number of symptomatic H1N1 cases (based on ILI-38 casedefinition) by 0.36 [22,23]. (ILI-38: fever .38uC and cough or sore throat, ILI-37: fever 37.1-38uC and cough or sore throat, ARI-38: any two of fever.38uC, cough, sore throat and runny nose, ARI-37: any two of fever 37.1–38uC, cough, sore throat and runny nose).doi:10.1371/journal.pone.0020593.g002
Burden of Pandemic Influenza A(H1N1) in Greece
PLoS ONE | www.plosone.org 4 June 2011 | Volume 6 | Issue 6 | e20593
telephone surveys in New York City during the initial outbreak in
May-June 2009 (7.8%–12.2%) [10] though it is lower than the
overall clinical attack rate derived by CDC estimates for the
United States by week 6 of 2010 (14% to 28%) [28]. The infection
attack rate of 19.7% estimated for Greece is similar to the
estimates reported for New Zealand [29] and France [30] and
lower than the estimate provided by a serological study in Hong-
Kong limited to individuals 5–59 years old (10.7%) [8].
Clinical attack rates were found to vary considerably according
to age, with school children/adolescents representing the most
Table 1. 2009 Pandemic Influenza A(H1N1) Clinical Attack Rates (% symptomatically infected) and Infection Attack Rates(% infected) in Greece.
Age group Clinical Attack Rate of Influenza A(H1N1)Infection Attack Rate ofInfluenza A(H1N1)
% (95% CI) % (95% CI)
Based on the number ofILI-38a cases
Based on the numberof ILI-37b cases
0–4 years 13.1 24.7 36.4
(7.6–18.6) (14.1–35.3) (21.1–51.7)
5–19 years 27.4 53.7 76.2
(15.5–39.4) (34.3–73.0) (43.0–100.0)
20–29 years 7.1 18.1 19.8
(3.9–10.3) (11.4–24.8) (11.0–28.6)
30–49 years 3.1 8.1 8.7
(1.7–4.5) (4.8–11.5) (4.8–12.5)
50–64 years 2.8 7.5 7.6
(1.4–4.1) (4.4–10.5) (3.8–11.5)
65+ years 0.6 2.2 1.6
(0.2–1.0) (1.2–3.3) (0.4–2.8)
Greek population 7.1 15.6 19.7
(4.8–9.4) (11.5–19.7) (13.3–26.1)
Overall and Age-Specific 2009 Pandemic Influenza A(H1N1) Clinical Attack Rates (depending on the definition of influenza-like illness) and Infection Attack Rates (Week35 of 2009 to Week 6 of 2010).aILI-38 : fever .38uC and cough or sore throat, bILI-37 : fever 37.1–38uC and cough or sore throat.doi:10.1371/journal.pone.0020593.t001
Figure 3. Incidence of 2009 pandemic influenza A(H1N1) per 100,000 population per week in Greece (3-week weighted movingaverage). (ILI-38: fever .38uC and cough or sore throat, ILI-37: fever 37.1–38uC and cough or sore throat, ARI-38: any two of fever .38uC, cough,sore throat and runny nose, ARI-37: any two of fever 37.1–38uC, cough, sore throat and runny nose).doi:10.1371/journal.pone.0020593.g003
Burden of Pandemic Influenza A(H1N1) in Greece
PLoS ONE | www.plosone.org 5 June 2011 | Volume 6 | Issue 6 | e20593
affected population group (27%–54%) and individuals older than
64 years being the least affected (0.6%–2%). Similarly, the
estimated infection attack rates ranged from 1.6% in individuals
older than 64 years to 76.2% in children 5–19 years old. The
age-specific estimates provided for the United Kingdom and
Hong-Kong from large serological studies [7,8,31] confirm the
age-specific pattern of influenza ARs identified in our study. The
UK serological study confirms our finding of high infection attack
rates among school children/adolescents (IAR: 70% among
children 5–14 years in UK as compared to 76.2% among
children/adolescents 5–19 years in Greece) [31]. The pattern of
the age-specific attack rates in this pandemic was similar to that
observed in the 1957 influenza pandemic [32].
Estimates of the ICU admission rate and death rate in the Greek
population have been provided by a recent study [25]. The
ascertainment of the number of H1N1 cases allowed to further
Table 3. Overall and Age-Specific Case Fatality Rate per 100,000 symptomatic cases and per 100,000 infections (Week 35 of 2009to Week 6 of 2010).
Age group
Cumulative numberof symptomaticcases/infectionsa
Number of 2009pandemic influenzaA(H1N1) deaths
CFR(95% CI)(per 100,000symptomatic cases)
CFR(95% CI)(per 100,000 infections)
0–4 years 62,357/173,213 1 1.60 0.58
(0.04–8.93) (0.01–0.32)
5–19 years 414,362/1,151,005 7 1.69 0.61
(0.68–3.48) (0.25–1.25)
20–29 years 101,695/282,485 11 10.8 3.89
(5.40–19.4) (1.94–6.97)
30–49 years 101,772/282,700 34 33.4 12.03
(23.1–46.7) (8.33–16.81)
50–64 years 52,064/144,623 40 76.8 27.66
(54.9–104.6) (19.76–37.66)
65+ years 11,835/32,876 37 312.6 112.54
(220.2–430.7) (79.25–155.09)
Greek population 744,085/2,066,902 130 17.5 6.29
(14.6–20.8) (5.25–7.47)
aCases up to week 4/2010 – deaths up to week 6/2010. Symptomatic cases were obtained based on ILI-38 definition (ILI-38: fever .38uC and cough or sore throat).doi:10.1371/journal.pone.0020593.t003
Table 2. Overall and Age-Specific ICU Admission Rate per 100,000 symptomatic cases and per 100,000 infections (Week 35 of 2009to Week 6 of 2010).
Age group
Cumulative numberof symptomaticcases/infectionsa
Number of 2009 pandemicinfluenza A(H1N1) casesadmitted to ICUs
ICU admission rate(95% CI)(per 100,000symptomatic cases)
ICU admission rate(95% CI)(per 100,000 infections)
0–4 years 65,544/182,067 5 7.6 2.8
(2.5–17.8) (0.8–6.4)
5–19 years 432,395/1,201,096 27 6.2 2.3
(4.1–9.1) (1.5–3.3)
20–29 years 103,280/286,890 30 29.1 10.5
(19.6–41.5) (7.1–14.9)
30–49 years 104,403/290,009 110 105.4 37.9
(86.6–127.0) (31.2–45.7)
50–64 years 53,574/148,817 74 138.1 49.7
(108.5–173.4) (39.1–62.4)
65+ years 11,835/32,876 41 346.4 124.7
(248.7–469.7) (89.5–169.1)
Greek population 771,031/2,141,754 287 37.2 13.4
(33.0–41.8) (11.9–15.0)
aCases up to week 5/2010 – ICU admissions up to week 6/2010. Symptomatic cases were obtained based on ILI-38 definition (ILI-38: fever .38uC and cough or sorethroat).
doi:10.1371/journal.pone.0020593.t002
Burden of Pandemic Influenza A(H1N1) in Greece
PLoS ONE | www.plosone.org 6 June 2011 | Volume 6 | Issue 6 | e20593
estimate the ICU admission rate and the CFR per symptomatic
cases as well as per infected cases. Data on the ICU admission rate
are limited. Our estimate was 37.2 ICU admissions per 100,000
symptomatic cases and is consistent with the findings of other
studies (Table 4). In New York City, 21–34 ICU admissions were
estimated to occur per 100,000 cases (10). An analysis of data from
two US cities provided a range of 28–239 ICU admissions per
100,000 cases [33] and in Reunion Island the corresponding rate
was 23 ICU admissions per 100,000 cases [26]. Our estimate of
ICU admissions per 100,000 infected cases was 13.4, slightly
lower compared to the estimate of 17.6 reported by a study in
Hong-Kong that combined epidemiologic surveillance data with
serologic data [8].
The estimated CFR in the Greek population was 17.5 deaths
per 100,000 symptomatic cases. In the United Kingdom [9], the
CFR was estimated to be 40 deaths per 100,000 symptomatic
Figure 4. The burden of the 2009 pandemic influenza A(H1N1) pandemic in the Greek population up to week 6 of 2010. Estimatesconcerning the proportion of symptomatic cases seeking medical care from their GPs/hospital emergency departments and being hospitalized werebased on data collected from the weekly phone surveys. The proportion of cases admitted to ICUs or dying during hospitalization was obtained fromsurveillance data. Symptomatic H1N1 case estimates were based on ILI-38 definition (ILI-38: fever .38uC and cough or sore throat).doi:10.1371/journal.pone.0020593.g004
Burden of Pandemic Influenza A(H1N1) in Greece
PLoS ONE | www.plosone.org 7 June 2011 | Volume 6 | Issue 6 | e20593
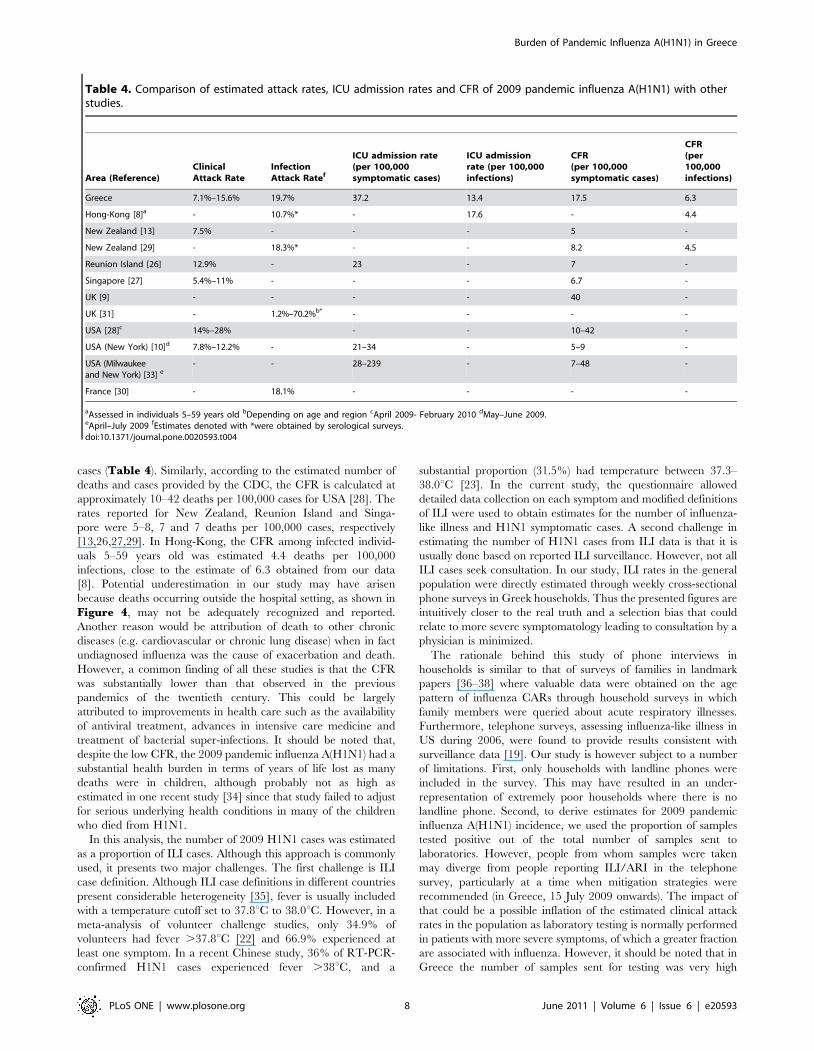
cases (Table 4). Similarly, according to the estimated number of
deaths and cases provided by the CDC, the CFR is calculated at
approximately 10–42 deaths per 100,000 cases for USA [28]. The
rates reported for New Zealand, Reunion Island and Singa-
pore were 5–8, 7 and 7 deaths per 100,000 cases, respectively
[13,26,27,29]. In Hong-Kong, the CFR among infected individ-
uals 5–59 years old was estimated 4.4 deaths per 100,000
infections, close to the estimate of 6.3 obtained from our data
[8]. Potential underestimation in our study may have arisen
because deaths occurring outside the hospital setting, as shown in
Figure 4, may not be adequately recognized and reported.
Another reason would be attribution of death to other chronic
diseases (e.g. cardiovascular or chronic lung disease) when in fact
undiagnosed influenza was the cause of exacerbation and death.
However, a common finding of all these studies is that the CFR
was substantially lower than that observed in the previous
pandemics of the twentieth century. This could be largely
attributed to improvements in health care such as the availability
of antiviral treatment, advances in intensive care medicine and
treatment of bacterial super-infections. It should be noted that,
despite the low CFR, the 2009 pandemic influenza A(H1N1) had a
substantial health burden in terms of years of life lost as many
deaths were in children, although probably not as high as
estimated in one recent study [34] since that study failed to adjust
for serious underlying health conditions in many of the children
who died from H1N1.
In this analysis, the number of 2009 H1N1 cases was estimated
as a proportion of ILI cases. Although this approach is commonly
used, it presents two major challenges. The first challenge is ILI
case definition. Although ILI case definitions in different countries
present considerable heterogeneity [35], fever is usually included
with a temperature cutoff set to 37.8uC to 38.0uC. However, in a
meta-analysis of volunteer challenge studies, only 34.9% of
volunteers had fever .37.8uC [22] and 66.9% experienced at
least one symptom. In a recent Chinese study, 36% of RT-PCR-
confirmed H1N1 cases experienced fever .38uC, and a
substantial proportion (31.5%) had temperature between 37.3–
38.0uC [23]. In the current study, the questionnaire allowed
detailed data collection on each symptom and modified definitions
of ILI were used to obtain estimates for the number of influenza-
like illness and H1N1 symptomatic cases. A second challenge in
estimating the number of H1N1 cases from ILI data is that it is
usually done based on reported ILI surveillance. However, not all
ILI cases seek consultation. In our study, ILI rates in the general
population were directly estimated through weekly cross-sectional
phone surveys in Greek households. Thus the presented figures are
intuitively closer to the real truth and a selection bias that could
relate to more severe symptomatology leading to consultation by a
physician is minimized.
The rationale behind this study of phone interviews in
households is similar to that of surveys of families in landmark
papers [36–38] where valuable data were obtained on the age
pattern of influenza CARs through household surveys in which
family members were queried about acute respiratory illnesses.
Furthermore, telephone surveys, assessing influenza-like illness in
US during 2006, were found to provide results consistent with
surveillance data [19]. Our study is however subject to a number
of limitations. First, only households with landline phones were
included in the survey. This may have resulted in an under-
representation of extremely poor households where there is no
landline phone. Second, to derive estimates for 2009 pandemic
influenza A(H1N1) incidence, we used the proportion of samples
tested positive out of the total number of samples sent to
laboratories. However, people from whom samples were taken
may diverge from people reporting ILI/ARI in the telephone
survey, particularly at a time when mitigation strategies were
recommended (in Greece, 15 July 2009 onwards). The impact of
that could be a possible inflation of the estimated clinical attack
rates in the population as laboratory testing is normally performed
in patients with more severe symptoms, of which a greater fraction
are associated with influenza. However, it should be noted that in
Greece the number of samples sent for testing was very high
Table 4. Comparison of estimated attack rates, ICU admission rates and CFR of 2009 pandemic influenza A(H1N1) with otherstudies.
Area (Reference)ClinicalAttack Rate
InfectionAttack Ratef
ICU admission rate(per 100,000symptomatic cases)
ICU admissionrate (per 100,000infections)
CFR(per 100,000symptomatic cases)
CFR(per100,000infections)
Greece 7.1%–15.6% 19.7% 37.2 13.4 17.5 6.3
Hong-Kong [8]a - 10.7%* - 17.6 - 4.4
New Zealand [13] 7.5% - - - 5 -
New Zealand [29] - 18.3%* - - 8.2 4.5
Reunion Island [26] 12.9% - 23 - 7 -
Singapore [27] 5.4%–11% - - - 6.7 -
UK [9] - - - - 40 -
UK [31] - 1.2%–70.2%b* - - - -
USA [28]c 14%–28% - - 10–42 -
USA (New York) [10]d 7.8%–12.2% - 21–34 - 5–9 -
USA (Milwaukeeand New York) [33] e
- - 28–239 - 7–48 -
France [30] - 18.1% - - - -
aAssessed in individuals 5–59 years old bDepending on age and region cApril 2009- February 2010 dMay–June 2009.eApril–July 2009 fEstimates denoted with *were obtained by serological surveys.doi:10.1371/journal.pone.0020593.t004
Burden of Pandemic Influenza A(H1N1) in Greece
PLoS ONE | www.plosone.org 8 June 2011 | Volume 6 | Issue 6 | e20593
relative to the population size (approximately 44.300 samples
tested by week 6/2010) which suggests that laboratory testing was
applied widely. Third, the total number of infections was obtained
by dividing the number of symptomatic cases by 0.36, i.e. the
estimated proportion of cases experiencing fever. The same
proportion was applied to all age groups. Although Cao et al. [23]
report no significant age difference among febrile and afebrile
cases, it might be argued that the proportion of febrile cases may
differ by age of infected individuals. In that case, the number of
infections by age cannot be estimated precisely. Fourth, it is possible
that some of the household representatives may have failed to
correctly report the occurrence of influenza-related symptoms for
each household member during the previous week (recall bias). It is
not clear, though, whether this might have introduced systematic
bias. The time proximity of the recall period and the survey is
anticipated to have reduced this bias. Similar biases may have been
present in household surveys aimed at assessing the burden of
disease in previous pandemics. Finally, despite the surveillance effort
to collect data on influenza A(H1N1) ICU admissions and deaths,
under ascertainment and underreporting may occur. In particular,
the number of deaths related to A(H1N1) might have been
underestimated because there may have been deaths occurring
outside the hospital setting that have not been identified.
In conclusion, our study attempted to describe the true extent of
2009 pandemic H1N1 infection in Greece and provides in-
sights into the age-specific spread and severity of the infection
during the major autumn-early winter wave in Greece. These
findings may contribute to an overall assessment of the impact of
2009 pandemic influenza A(H1N1) as well as to the preparedness for
future influenza pandemics or other emerging infectious diseases.
Supporting Information
Figure S1 Age-specific incidence of influenza-like illness(ILI) and acute respiratory illness (ARI) per 100,000population per week in Greece (3-week weighted movingaverage). (ILI-38: fever .38uC and cough or sore throat, ILI-37:
fever 37.1–38uC and cough or sore throat, ARI-38: any two of
fever .38uC, cough, sore throat and runny nose, ARI-37: any two
of fever 37.1–38uC, cough, sore throat and runny nose).
(TIF)
Figure S2 Incidence of influenza-like illness (ILI) andacute respiratory illness (ARI) per 100,000 populationper week in Greece (3-week weighted moving average).(ILI-38: fever .38uC and cough or sore throat, ILI-37: fever 37.1–
38uC and cough or sore throat, ARI-38: any two of fever .38uC,
cough, sore throat and runny nose, ARI-37: any two of fever 37.1–
38uC, cough, sore throat and runny nose).
(TIF)
Supporting Information S1 Telephone survey on influ-enza-like illness.
(DOC)
Supporting Information S2 Frequency of reported symp-toms and proportion of ILI cases seeking medicaladvice.
(DOC)
Supporting Information S3 Age and gender distributionof the population and average household size in Greece(data from 2001 census, Hellenic Statistical Authority).
(DOC)
Table S1 2009 Pandemic Influenza A(H1N1) ClinicalAttack Rates based on acute respiratory illness (ARI)case definition.
(DOC)
Acknowledgments
The authors thank T. Livanios and C. Michelaki (Opinion Marketing
Research, Athens, Greece) for their assistance in conducting the weekly
telephone surveys. They also thank Dr. M. Psichogiou, Dr. I. Pavlopoulou
(University of Athens), M. Tseroni, Z. Manolidou, and K. Karageorgou
(National Health Operations Centre, Ministry of Health and Social
Solidarity, Greece).
Author Contributions
Conceived and designed the experiments: AH. Analyzed the data: VS.
Contributed reagents/materials/analysis tools: IN SB TP MM ST AB PE.
Wrote the paper: VS AH. Contributed to drafting: IN SB TP MM ST AB
PE.
References
1. CDC (2010) The 2009 H1N1 Pandemic: Summary Highlights, April 2009-April
2010. Available at: http://www.cdc.gov/h1n1flu/cdcresponse.htm. Accessed
2010 Dec 10.
2. ECDC (2010) ECDC special report. The 2009 A(H1N1) pandemic in Europe A
review of the experience November 2010. Available at: http://www.ecdc.
europa.eu/en/publications/Publications/101108_SPR_pandemic_experience.
pdf. Accessed 2010 Dec 10.
3. Tuite AR, Greer AL, Whelan M, Winter AL, Lee B, et al. (2010) Estimated
epidemiologic parameters and morbidity associated with pandemic H1N1
influenza. CMAJ 182: 131–6.
4. New South Wales Public Health Network (2009) Progression and impact of the
first winter wave of the 2009 pandemic H1N1 influenza in New South Wales,
Australia. Euro Surveill 14(42): pii = 19365.
5. Klooster T, Wieders CC, Donker T, Isken L, Meijer A, et al. (2010) Surveillance
of hospitalizations from 2009 pandemic influenza A(H1N1) in the Netherlands, 5
June-31 December 2009. Euro Surveill 15(2): pii = 19461.
6. The ANZIC Influenza Investigators (2009) Critical care services and 2009
H1N1 influenza in Australia and New Zealand. NEJM 361: 1925–35.
7. Miller E, Hoschler K, Hardelid P, Stanford E, Andrews N, et al. (2010)
Incidence of 2009 pandemic influenza A H1N1 infection in England: a cross-
sectional serological study. Lancet 375: 1100–8.
8. Wu JT, Ma ES, Lee CK, Chu DK, Ho PL, et al. (2010) The infection attack rate
and severity of 2009 pandemic H1N1 influenza in Hong Kong. Clin Infect Dis
51: 1184–91.
9. Pebody RG, McLean E, Zhao H, Cleary P, Bracebridge S, et al. (2010)
Pandemic Influenza A (H1N1) 2009 and mortality in the United Kingdom: risk
factors for death, April 2009 to March 2010. Euro Surveill 15(20): pii:19571.
10. Hadler JL, Konty K, McVeigh KH, Fine A, Eisenhower D, et al. (2010) Case
fatality rates based on population estimates of influenza-like illness due to
novel H1N1 influenza: New York City, May-June 2009. PLoS One 5(7):
e11677.
11. Donaldson LJ, Rutter PD, Ellis BM, Greaves FE, Mytton OT, et al. (2009)
Mortality from pandemic A/H1N1 2009 influenza in England: public health
surveillance study. BMJ 339: b5213.
12. Reed C, Angulo FJ, Swerdlow DL, Lipsitch M, Meltzer MI, et al. (2009)
Estimates of the prevalence of pandemic (H1N1) 2009, United States, April-July
2009. Emerg Infect Dis 15: 2004–7.
13. Baker MG, Wilson N, Huang QS, Paine S, Lopez L, et al. (2009) Pandemic
influenza A(H1N1)v in New Zealand: the experience from April to August 2009.
Euro Surveill 14(34): pii:19319.
14. Lipsitch M, Hayden FG, Cowling BJ, Leung GM (2009) How to maintain
surveillance for novel influenza A H1N1 when there are too many cases to
count. Lancet 374: 1209–11.
15. President’s Council of Advisors on Science Technology (2009) Report to the
President on U. S. preparations for 2009-H1N1 influenza. Available at: http://
www.whitehouse.gov/assets/documents/PCAST_H1N1_Report.pdf. Accessed
2010 May 18.
16. Lau JT, Yeung NC, Choi KC, Cheng MY, Tsui HY, et al. (2009) Acceptability
of A/H1N1 vaccination during pandemic phase of influenza A/H1N1 in Hong
Kong: population based cross sectional survey. BMJ 339: b4164. doi: 10.1136/
bmj.b4164.
17. Rubin GJ, Amlot R, Page L, Wessely S (2009) Public perceptions, anxiety, and
behaviour change in relation to the swine flu outbreak: cross sectional telephone
survey. BMJ 339: b2651. doi: 10.1136/bmj.b2651.
Burden of Pandemic Influenza A(H1N1) in Greece
PLoS ONE | www.plosone.org 9 June 2011 | Volume 6 | Issue 6 | e20593
18. Payne L, Kuhlmann-Berenzon S, Ekdahl K, Giesecke J, Hogberg L, et al. (2005)
‘Did you have flu last week?’ A telephone survey to estimate a point prevalenceof influenza in the Swedish population. Euro Surveill 10(12): 241–4.
19. Malone JL, Madjid M, Casscells SW (2008) Telephone survey to assess
influenza-like illness, United States, 2006. Emerg Infect Dis 14(1): 129–35.20. Sypsa V, Livanios T, Psichogiou M, Malliori M, Tsiodras S, et al. (2009) Public
perceptions in relation to intention to receive pandemic influenza vaccination ina random population sample: evidence from a cross-sectional telephone survey.
Euro Surveill 14(49): pii:19437.
21. Tsiodras S, Sypsa V, Hatzakis A (2010) The vaccination campaign against 2009pandemic influenza A(H1N1) and its continued importance in view of the
uncertainty surrounding the risk associated with the pandemic. Euro Surveill15(3).
22. Carrat F, Vergu E, Ferguson NM, Lemaitre M, Cauchemez S, et al. (2008)Time lines of infection and disease in human influenza: a review of volunteer
challenge studies. Am J Epidemiol 167: 775–85.
23. Cao B, Li XW, Mao Y, Wang J, Lu HZ, et al. (2009) Clinical features of theinitial cases of 2009 pandemic influenza A (H1N1) virus infection in China.
N Engl J Med 361: 2507–17.24. EllisJ, Iturizza M, Allen R, Bermingham A, Brown K, et al. (2009) Evaluation of
four real-time PCR assays for detection of influenza A(H1N1)v viruses.
Eurosurveillance 14(22): pii:19230.25. Efstathiou P, Tseroni M, Baka A, Manolidou Z, Karageorgou K, et al. (2010)
Deaths and hospitalizations related to 2009 pandemic influenza A (H1N1) —Greece, May 2009–February 2010. MMWR 59: 682–686.
26. D’Ortenzio E, Renault P, Jaffar-Bandjee MC, Gauzere BA, Lagrange-Xelot M,et al. (2010) A review of the dynamics and severity of the pandemic A(H1N1)
influenza virus on Reunion island, 2009. Clin Microbiol Infect 16: 309–16.
27. Cutter JL, Ang WL, Lai FYL, Subramony H, Ma S, et al. (2010) Outbreak ofpandemic influenza A(H1N1-2009) in Singapore, May to September 2009. Ann
Acad Med Singapore 39: 273–82.28. CDC (2010) CDC Estimates of 2009 H1N1 Influenza Cases, Hospitalizations
and Deaths in the United States, April 2009 – February 13, 2010. Available at:
http://www.cdc.gov/h1n1flu/estimates_2009_h1n1.htm. Accessed 2010 May
18.
29. Bandaranayake D, Huang QS, Bissielo A, Wood T, Mackereth G, et al. (2010)
Risk factors and immunity in a nationally representative population following
the 2009 influenza A(H1N1) pandemic. PLoS One 5(10): e13211.
30. Carrat F, Pelat C, Levy-Bruhl D, Bonmarin I, Lapidus N (2010) Planning for the
next influenza H1N1 season: a modelling study. BMC Infect Dis 10: 301.
31. Hardelid P, Andrews NJ, Hoschler K, Stanford E, Baguelin M, et al. (2010)
Assessment of baseline age-specific antibody prevalence and incidence of
infection to novel influenza A/H1N1 2009. Health Technol Assess 14: 115–92.
32. Glezen WP (1996) Emerging infections: pandemic influenza. Epidemiol Rev 18:
64–76.
33. Presanis AM, De Angelis D, Hagy A, Reed C, Riley S, et al. (2009) The severity
of pandemic H1N1 influenza in the United States, from April to July 2009: a
Bayesian analysis. PLoS Med 2009; 6: e1000207.
34. Viboud C, Miller M, Olson D, Osterholm M, Simonsen L (2010) Preliminary
estimates of mortality and years of life lost with the 1009 A/H1N1 pandemic in
the US and comparison with past influenza seasons. PloS Curr Influenza
RRN1153.
35. Aguilera JF, Paget WJ, Mosnier A, Heijnen ML, Uphoff H, et al. (2003)
Heterogeneous case definitions used for the surveillance of influenza in Europe.
Eur J Epidemiol 18: 751–4.
36. Collins SD (1931) Age and sex incidence of influenza and pneumonia morbidity
and mortality in the epidemic of 1928-29 with comparative data for the
epidemic of 1918-19. Public Health Reports 46: 1909–80.
37. Jordan WS, Jr., Denny FW, Jr., Badger GF, Curtiss C, Dingle JH, et al. (1958) A
study of illness in a group of Cleveland families. XVII. The occurrence of Asian
influenza. Am J Hyg 68: 190–212.
38. Davis LE, Caldwell GG, Lynch RE, Bailey RE, Chin TD (1970) Hong Kong
influenza: the epidemiologic features of a high school family study analyzed and
compared with a similar study during the 1957 Asian influenza epidemic.
Am J Epidemiol 92: 240–7.
Burden of Pandemic Influenza A(H1N1) in Greece
PLoS ONE | www.plosone.org 10 June 2011 | Volume 6 | Issue 6 | e20593
Related Documents


