© 2009 European Association of Geoscientists & Engineers 401 Near Surface Geophysics, 2009, 401-412 ‡ Formerly at: Unit Subsurface and Groundwater Systems, Deltares, the Netherlands * [email protected] Estimating the depth of fresh and brackish groundwater in a predominantly saline region using geophysical and hydrological methods, Zeeland, the Netherlands B.J.M. Goes 1‡* , G.H.P. Oude Essink 2 , R.W. Vernes 2 and F. Sergi 3 1 Mott MacDonald (UK), Integrated Water Resources Management – Water Supply and Sanitation Sector Reform Programme, Damaturu and Calabar, Nigeria 2 Unit Subsurface and Groundwater Systems, Deltares, PO Box 85467, 3508 AL Utrecht, the Netherlands 3 Sapienza University of Roma, Piazzale Aldo Moro, 5, Rome, Italy Received October 2008, revision accepted August 2009 ABSTRACT The province of Zeeland is situated in the coastal zone of the Netherlands. The ground surface level is around or below mean sea level. Therefore seepage of brackish to saline groundwater is very common. Sea level rise as a result of climate change will very likely increase the pressure on the coastal groundwater system, leading to an increased salinization of the groundwater and surface water system. Still, freshwater agriculture is being practiced in large parts of the province. The vegetation extracts its fresh water from the unsaturated zone and thin rainwater lenses that ‘float’ on top of brackish and saline groundwater. Geophysical and hydrogeological data have been com- bined on two spatial scales to obtain a better insight into this fresh-brackish-saline groundwater distribution. This information is being used to: assess groundwater abstractions, plan landuse and improve the input of variable-density groundwater flow and coupled solute transport models. For over 6000 locations various types of data have been used to estimate the depth of the brackish-saline groundwater interface of 1000 mg [Cl - ]/L. These types of data are both of geophysi- cal (vertical electrical soundings, EM34, geoelectrical well logs and electrical cone penetration tests) and of hydrological origin (water samples and abstraction wells). These data have been inter- preted and combined with knowledge on the distribution of geological units to make an estimation of the depth of the brackish-saline water transition for the whole province (~66 km × 63 km). In addition to the regional brackish-saline interface map, continuous vertical electrical soundings (CVES) have been executed to map the fresh-brackish-saline distribution on a local scale. The CVES profiles were made at eight different plots where brackish-saline water is occurring at shal- low depths (<5 m below the surface) according to the regional map and where freshwater agriculture is still being practised. Six of the eight sites have thin (0–3 m) brackish to slightly saline water lenses. At two sites up to 15 m thick brackish water lenses have been observed with CVES. The thickness of the brackish water lenses varies laterally over short distances. Sandy sediment and a higher topography are favourable factors for the development of such lenses. aggradation. A Holocene sediment wedge with a maximum thickness of 50 m was formed, containing both clastic (sand and clay) and organic sediments. Most of Zeeland was sub- merged several times by the sea during the geological history. Around 1000 AD man became a dominant element in the evolu- tion of the coastal landscape. Salt marshes were successively being embanked, the resulting polders were drained and peat (with the salt water it contained) was beginning to become exploited as a source of salt. This resulted in the subsidence of the polder surface due to compaction and peat oxidation. Nowadays, only a very small part of the original salt-marsh INTRODUCTION Landscape evolution in Zeeland The coastal province of Zeeland is situated in the south-west of the Netherlands (Fig. 1). During the Holocene, the present landscape of Zeeland was formed in the context of continuous relative sea level rise. Coastal processes and the associated evolution of the Rhine-Meuse and Scheldt rivers resulted in net

Welcome message from author
This document is posted to help you gain knowledge. Please leave a comment to let me know what you think about it! Share it to your friends and learn new things together.
Transcript
© 2009 European Association of Geoscientists & Engineers 401
Near Surface Geophysics, 2009, 401-412
‡ Formerly at: Unit Subsurface and Groundwater Systems, Deltares,
the Netherlands
Estimating the depth of fresh and brackish groundwater in a predominantly saline region using geophysical and hydrological methods, Zeeland, the Netherlands
B.J.M. Goes1‡*, G.H.P. Oude Essink2, R.W. Vernes2 and F. Sergi3
1 Mott MacDonald (UK), Integrated Water Resources Management – Water Supply and Sanitation Sector Reform Programme, Damaturu and Calabar, Nigeria
2 Unit Subsurface and Groundwater Systems, Deltares, PO Box 85467, 3508 AL Utrecht, the Netherlands3 Sapienza University of Roma, Piazzale Aldo Moro, 5, Rome, Italy
Received October 2008, revision accepted August 2009
ABSTRACTThe province of Zeeland is situated in the coastal zone of the Netherlands. The ground surface level is around or below mean sea level. Therefore seepage of brackish to saline groundwater is very common. Sea level rise as a result of climate change will very likely increase the pressure on the coastal groundwater system, leading to an increased salinization of the groundwater and surface water system. Still, freshwater agriculture is being practiced in large parts of the province. The vegetation extracts its fresh water from the unsaturated zone and thin rainwater lenses that ‘float’ on top of brackish and saline groundwater. Geophysical and hydrogeological data have been com-bined on two spatial scales to obtain a better insight into this fresh-brackish-saline groundwater distribution. This information is being used to: assess groundwater abstractions, plan landuse and improve the input of variable-density groundwater flow and coupled solute transport models. For over 6000 locations various types of data have been used to estimate the depth of the brackish-saline groundwater interface of 1000 mg [Cl-]/L. These types of data are both of geophysi-cal (vertical electrical soundings, EM34, geoelectrical well logs and electrical cone penetration tests) and of hydrological origin (water samples and abstraction wells). These data have been inter-preted and combined with knowledge on the distribution of geological units to make an estimation of the depth of the brackish-saline water transition for the whole province (~66 km × 63 km). In addition to the regional brackish-saline interface map, continuous vertical electrical soundings (CVES) have been executed to map the fresh-brackish-saline distribution on a local scale. The CVES profiles were made at eight different plots where brackish-saline water is occurring at shal-low depths (<5 m below the surface) according to the regional map and where freshwater agriculture is still being practised. Six of the eight sites have thin (0–3 m) brackish to slightly saline water lenses. At two sites up to 15 m thick brackish water lenses have been observed with CVES. The thickness of the brackish water lenses varies laterally over short distances. Sandy sediment and a higher topography are favourable factors for the development of such lenses.
aggradation. A Holocene sediment wedge with a maximum thickness of 50 m was formed, containing both clastic (sand and clay) and organic sediments. Most of Zeeland was sub-merged several times by the sea during the geological history. Around 1000 AD man became a dominant element in the evolu-tion of the coastal landscape. Salt marshes were successively being embanked, the resulting polders were drained and peat (with the salt water it contained) was beginning to become exploited as a source of salt. This resulted in the subsidence of the polder surface due to compaction and peat oxidation. Nowadays, only a very small part of the original salt-marsh
INTRODUCTIONLandscape evolution in ZeelandThe coastal province of Zeeland is situated in the south-west of the Netherlands (Fig. 1). During the Holocene, the present landscape of Zeeland was formed in the context of continuous relative sea level rise. Coastal processes and the associated evolution of the Rhine-Meuse and Scheldt rivers resulted in net
B.J.M. Goes et al.402
© 2009 European Association of Geoscientists & Engineers, Near Surface Geophysics, 2009, 7, 401-412
Aims of the paperThe province of Zeeland has asked Deltares to map the scarce fresh groundwater occurrences in their province. This paper presents the use of geophysics for estimating the depth of fresh, brackish and saline groundwater occurrences at a regional and a local scale. The first part of the paper presents the use of geophysical data in combination with hydrological data to map the fresh-brackish ([Cl-] 150 mg/L) and brackish-saline ([Cl-] 1000 mg/L) ground-water interfaces for the entire province. Furthermore, the loca-tions of inversions (e.g., fresh or brackish groundwater below the brackish-saline groundwater) have been mapped. The second part of the paper presents the outcome of local continuous vertical electrical soundings (CVES) surveys at indi-vidual plots where the brackish-saline water interface is shallow (<5 m below the surface) according to the regional map and where freshwater agriculture is still being practised.
ESTIMATING CHLORIDE CONCENTRATION FROM GEOPHYSICAL AND HYDROLOGICAL DATAData sources and interpretationSix data types have been used to map the fresh-brackish-saline groundwater distribution in the province of Zeeland. These data types are, in declining order of accuracy and reliability: ground-water samples that have been analysed for chloride content, electrical borehole logs, electric cone penetration tests (CPT), vertical electrical soundings (VES), electromagnetic surface measurements and water salinity at groundwater abstraction sites. Analysed samples are the only data that provide direct information on chloride concentration of groundwater. The other data sources provide indirect information by estimating the chlo-
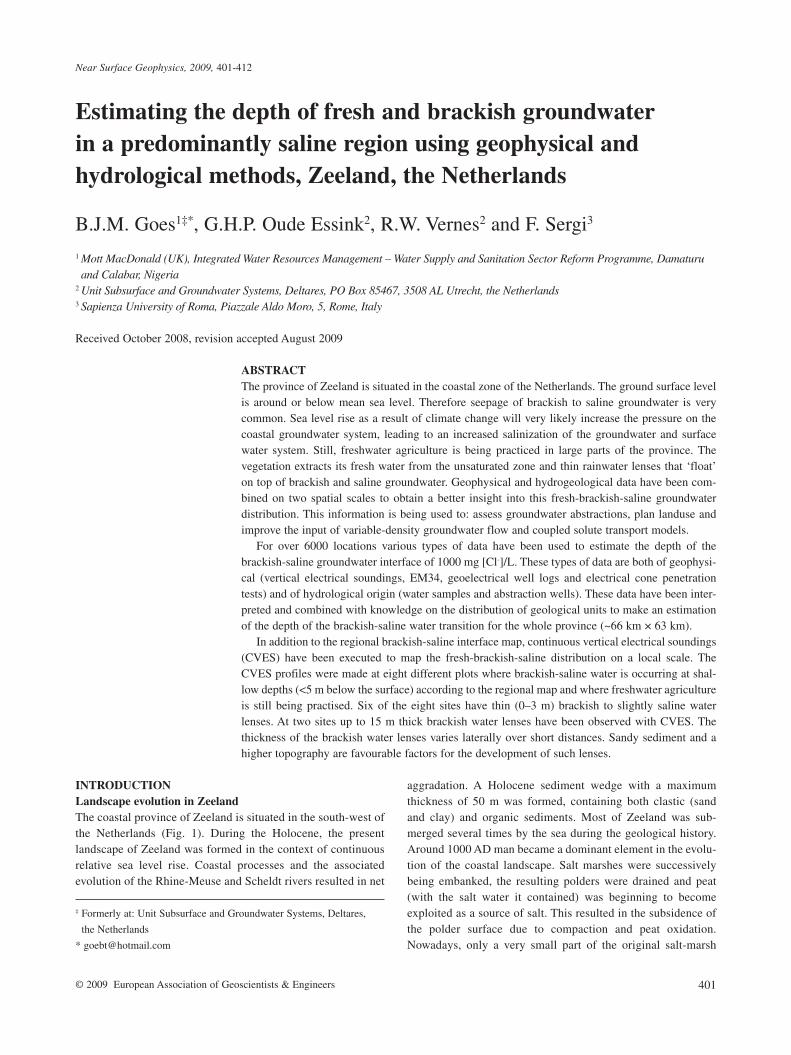
area remains. Moreover, the intertidal areas have been reduced by coastal engineering works in the 20th century (Vos en Van Heeringen 1997). Therefore, the present terrestrial landscape is dominated by three main units: reclaimed tidal marshes, filled tidal channels and a strip of dunes along the North Sea coast (Fig. 1). The reclaimed tidal marshes consist predominantly of clay and peat and are generally 0–2 m below mean sea level. The filled tidal channels consist of laminated sand and clay and are just above sea level. The sandy coastal dunes raise 5–30 m above mean sea level.
Fresh, brackish and saline groundwater in ZeelandAs chloride is the major conservative negative ion in Dutch coastal groundwater, the discussion about salinization is focused on that predominant solute. Saline and brackish groundwater is omnipresent in the province of Zeeland. This is, among other things, a result of the ample occurrence of marine sediments in the shallow subsoil, submergences by the sea and surface levels below mean sea level. However, fresh rainwater lenses have developed on top of the saline groundwater. The thickness of the lenses varies from over 100 m in the coastal dunes, to a maximum of 15–20 m in the sandy tidal channels and often less than 1 m in the reclaimed tidal marshes. The thick freshwater occurrences in the coastal dunes are important for groundwater exploitation for public water supply, whereas the thin rainwater lenses outside the coastal dunes are important for freshwater agriculture. Especially the thin rain-water lenses are jeopardized by an expected increase in seepage of the deeper saline water as a result of sea level rise due to climate change, combined with the ongoing land subsidence. Water man-agement, such as varying surface water levels in the polders, should anticipate these changes in time.
FIGURE 1
The study area: the province of
Zeeland with its reclaimed tidal
marshes (predominantly clay and
peat), filled tidal channels (pre-
dominantly sandy) and sand
dunes.
Estimating the depth of fresh and brackish groundwater 403
© 2009 European Association of Geoscientists & Engineers, Near Surface Geophysics, 2009, 7, 401-412
trical resistivity of the groundwater can be estimated with soil resistivity (ρs) and formation factor of the sediment (F) on the basis of the following formula (see e.g., Keary and Brooks 1991): ρw = ρs/F. The formation factor depends on the litho-logy (Table 2). The lithological data comes from sedimento-logical descriptions and interpreted borehole and CPT logs.
The above presented formula for estimating the resistivity of groundwater has not been applied for clayey soil because for conductive sediments the formation factor is an apparent for-mation factor that varies with the electrical resistivity of the groundwater. For thin (<2.5 m) layers the formula was also not applied because the measured LN resistivity does not approach the true resistivity of the layer in this situation.
2. Temperature correction of groundwater resistivity. The elec-trical resistivity of the groundwater is recalculated for a tem-perature of 20o C with the following formula (TNO-IGG 1992): ρw, 20 = ρw,t (1+0.0226(t-20)).
ρw, 20 : electrical resistivity of groundwater at 20o C (Ωm) t : temperature at depth of resistivity measurement t (o C) ρw,t : electrical resistivity of groundwater at temperature t (Ωm) The mean temperature gradient in the study area, which is
based on five temperature borehole logs, is 1.92o C per 100 m.3. Estimate chloride concentration. The electrical resistivity of
groundwater (ρw) depends on the concentration of ions. In a
ride content through physical and empirical relations. The meas-ured and derived chloride data result in a collection of 0D (point) and 1D (column) data. Table 1 provides an overview of the data used and their main attributes. The interpretation of the six data types is discussed in detail below.
Groundwater samplesThe source for the water samples is the DINO database from TNO. The chloride concentration may change with time, so if a series of samples is available for the same screen the mean con-centration of the most recent 10-years has been taken. The depth is set at the middle of the screen.
Geoelectrical borehole logs and electrical CPTThe main source for the borehole logs is the DINO database from TNO and for the CPT is Fugro (2002a,b). The long normal (LN) geoelectrical resistivity measured in borehole logs and electrical cone penetration tests is a good indication for the real soil resistivity (ρs in Ωm), if the diameter of the borehole is not too large. The following processing steps were undertaken to estimate the chloride concentration.1. Estimate groundwater resistivity. The electrical resistivity of
the saturated subsoil depends on the electrical resistivity of the groundwater (ρw in Ωm) and the sediment type. The elec-
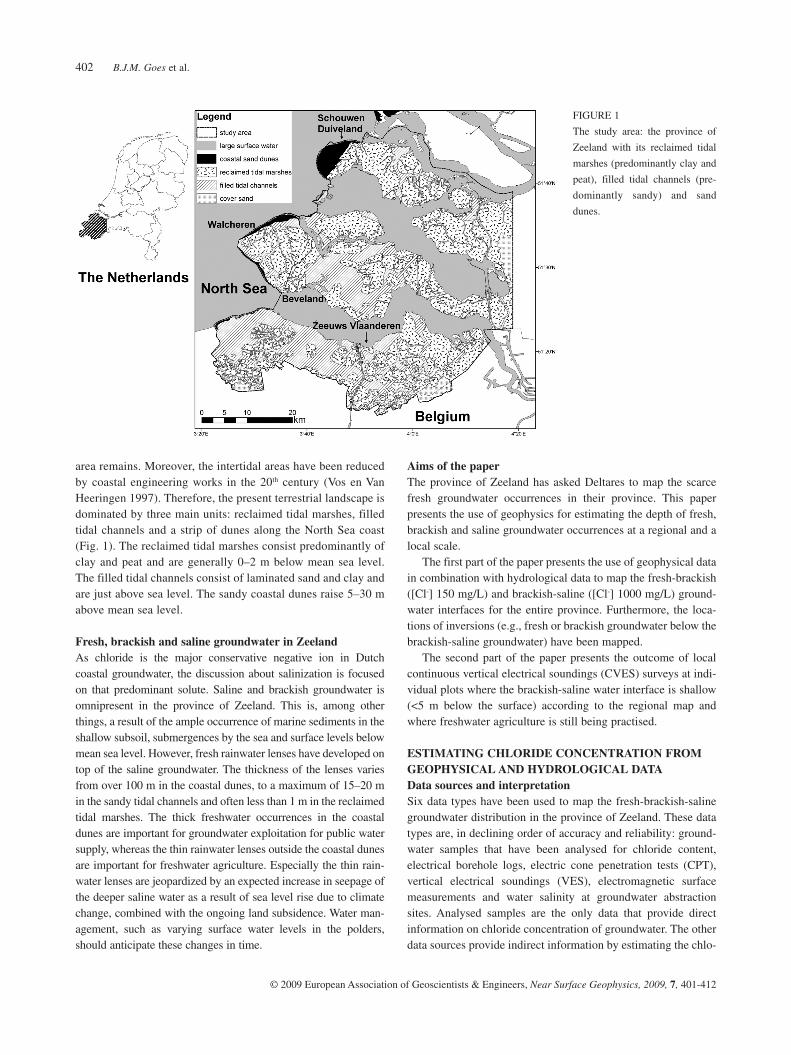
TABLE 1
Overview of data used for mapping the fresh-brackish-saline groundwater distribution in the province of Zeeland
Data typeCharacteristics of
measurementNumber of
locations (xy)
Number of inter preted
measurementsDetermined
Accuracy depth of interfaces
Groundwater samples
0D in situ 867* 721** Chloride concentrationDepends on positions
of screens
Geoelectrical borehole logs
1D in situ 151 1491D chloride profile, Depth fresh-
brackish interface, Depth brackish-saline interface, Inversions.
±1 m
Electrical CPT1D in situ
(max. depth 50 m)73 71 see borehole log ±1 m
VES 1D from surface 1196 1113Depth brackish-saline interface,
Major inversions,(1D chloride profile).
±20% of depth
EM34 1D from surface 4372 3251 Depth brackish-saline interfaceranges of 7.5, 15 or
30 m (accuracy decreases with depth)
Groundwater abstractions
0D in situ 1528 716 Depth brackish-saline interfacea range depending
on screen depth
Unique locations
8187 6021
* 2143 screens (xyz locations).
** Excluding 52 locations for which borehole logs are available.
B.J.M. Goes et al.404
© 2009 European Association of Geoscientists & Engineers, Near Surface Geophysics, 2009, 7, 401-412
sources for the VES data are the DINO database from TNO and the University of Gent, Belgium. All VES are measured with the Schlumberger or Wenner configuration. An interpreted VES measurement is a layered model of the subsurface with real soil resistivities (ρs). These models can pro-vide information on the lithology of the subsoil and the resistiv-ity of the groundwater (ρw). The resolution of VES models decreases with depth. Low resistivity contrasts, for example between fresh and brackish groundwater, can not be detected with VES. Another limitation of VES models is equivalence;
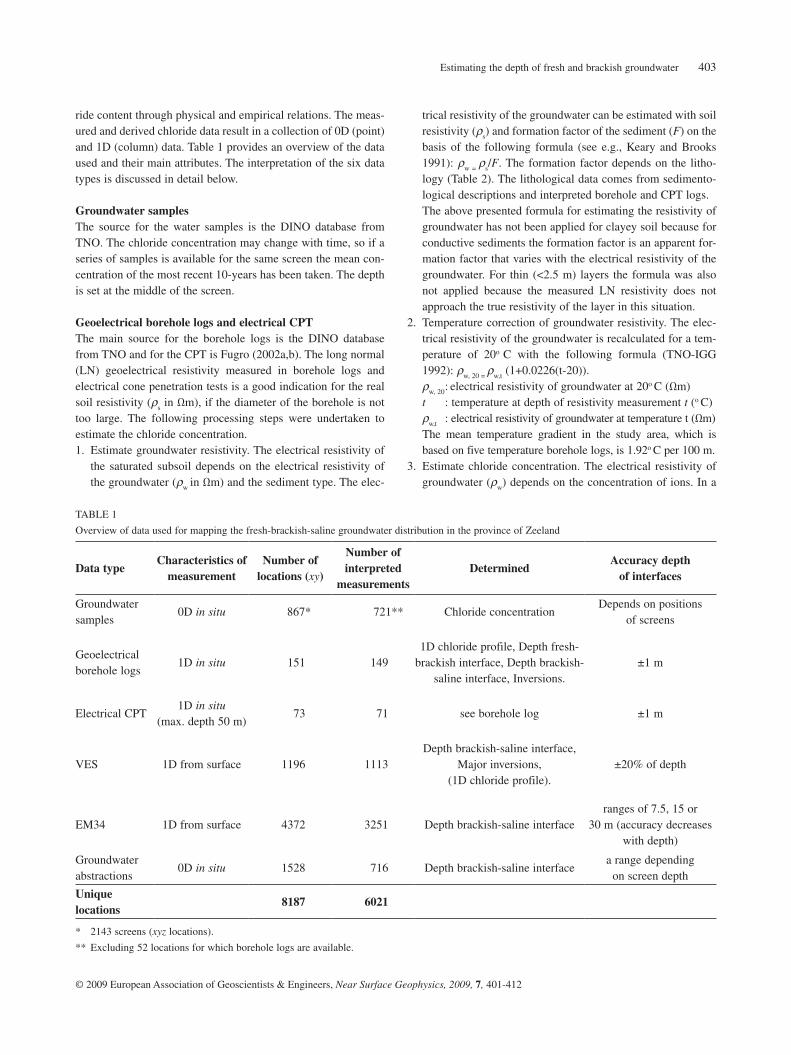
coastal province like Zeeland low resistivity groundwater (ρw < ~3 Ωm) is almost always, with the exception of polluted sites, dominated by chloride and sodium ions. At higher groundwater resistivities (ρw > ~3 Ωm) other ions also influ-ence the resistivity. The bicarbonate (HCO3) concentration is, due to the presence of Ca(HCO3)2 and Mg(HCO3)2, important for estimating the chloride concentration at higher resistivi-ties. So the chloride concentration can be estimated on the basis of an empirical relation with the electrical resistivity of the groundwater (ρw,20) and the bicarbonate concentration. This empirical relation was determined by TNO-IGG (1992) and is presented in a graph (Fig. 2). The relation can also be expressed in the following formula:
If ρw,20 ≤ 40 Ωm; [Cl-] = ((ECw,20 -0.122 * [HCO3
-]) / 0.44096)1/0.9446
[Cl-] : chloride concentration in groundwater [mg/L] [HCO3
-] : bicarbonate concentration in groundwater [mg/L] ECw,20 : electrical conductivity of the groundwater at a tem-
perature of 20o C [mS/m] (= 1000/ρw,20) The bicarbonate concentration at the depth of the resistivity measurement was estimated on the basis of the closest well screen(s) from which water sample(s) were taken and analysed for bicarbonate. Figure 3 presents an example of an interpreted geoelectrical well log.
Vertical electrical soundingsVES are geoelectrical measurements taken from the surface and they measure the apparent resistivity. VES are widely used for groundwater exploration (see e.g., Reynolds 1997). The main
FIGURE 2
Empirical relation between chlo-
ride concentration and electrical
resistivity of groundwater at 20o C
for various bicarbonate concen-
trations (TNO-IGG 1992).
TABLE 2
Formation factors for unconsolidated sediments in the Netherlands
Lithology Formation factor (F)
Gravel with sand 7
Coarse sand with gravel 6
Coarse sand 5
Medium coarse sand 4
Sand with some silt 3
Silty sand 2.5*
Strong silty sand 2*
Clay 1-2*
Peat ~1
* apparent formation factor.
Sources: Geirnaert and Vandenberghe (1988), Overmeeren et al. (1991),
TNO-IGG (1992).
Estimating the depth of fresh and brackish groundwater 405
© 2009 European Association of Geoscientists & Engineers, Near Surface Geophysics, 2009, 7, 401-412
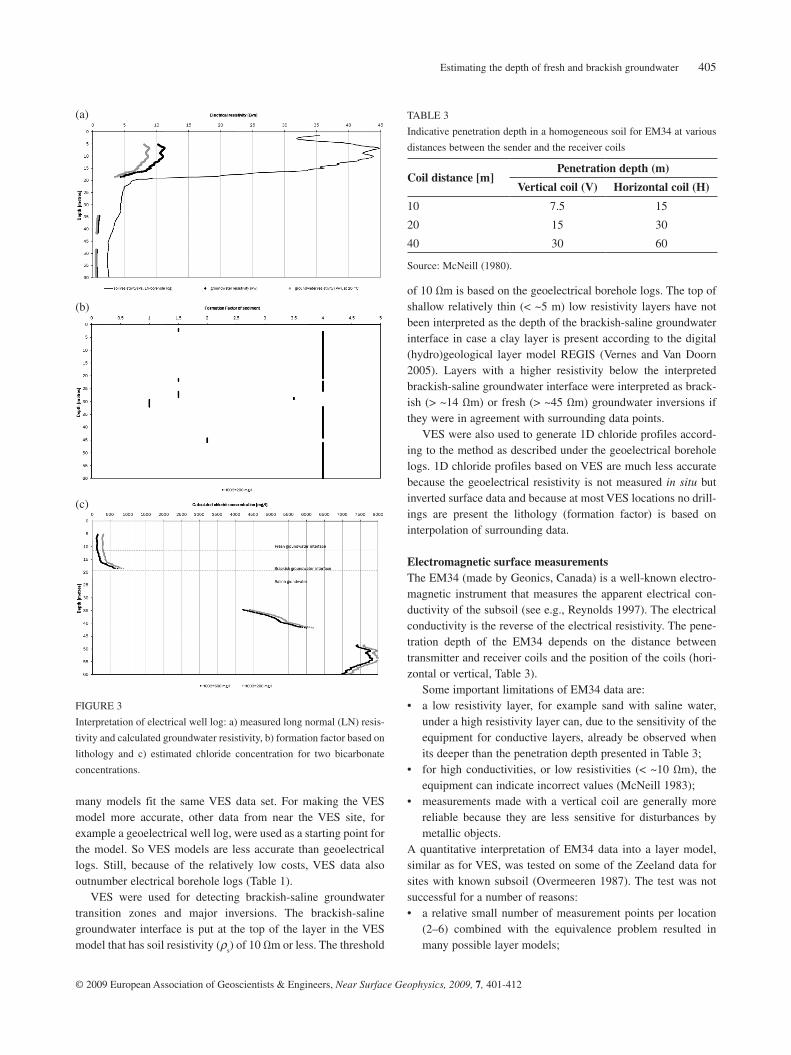
of 10 Ωm is based on the geoelectrical borehole logs. The top of shallow relatively thin (< ~5 m) low resistivity layers have not been interpreted as the depth of the brackish-saline groundwater interface in case a clay layer is present according to the digital (hydro)geological layer model REGIS (Vernes and Van Doorn 2005). Layers with a higher resistivity below the interpreted brackish-saline groundwater interface were interpreted as brack-ish (> ~14 Ωm) or fresh (> ~45 Ωm) groundwater inversions if they were in agreement with surrounding data points. VES were also used to generate 1D chloride profiles accord-ing to the method as described under the geoelectrical borehole logs. 1D chloride profiles based on VES are much less accurate because the geoelectrical resistivity is not measured in situ but inverted surface data and because at most VES locations no drill-ings are present the lithology (formation factor) is based on interpolation of surrounding data.
Electromagnetic surface measurementsThe EM34 (made by Geonics, Canada) is a well-known electro-magnetic instrument that measures the apparent electrical con-ductivity of the subsoil (see e.g., Reynolds 1997). The electrical conductivity is the reverse of the electrical resistivity. The pene-tration depth of the EM34 depends on the distance between transmitter and receiver coils and the position of the coils (hori-zontal or vertical, Table 3). Some important limitations of EM34 data are:• a low resistivity layer, for example sandwith salinewater,
under a high resistivity layer can, due to the sensitivity of the equipment for conductive layers, already be observed when its deeper than the penetration depth presented in Table 3;
• forhighconductivities,or low resistivities (<~10Ωm), theequipment can indicate incorrect values (McNeill 1983);
• measurementsmadewith avertical coil aregenerallymorereliable because they are less sensitive for disturbances by metallic objects.
A quantitative interpretation of EM34 data into a layer model, similar as for VES, was tested on some of the Zeeland data for sites with known subsoil (Overmeeren 1987). The test was not successful for a number of reasons:• a relativesmallnumberofmeasurementpointsper location
(2–6) combined with the equivalence problem resulted in many possible layer models;
many models fit the same VES data set. For making the VES model more accurate, other data from near the VES site, for example a geoelectrical well log, were used as a starting point for the model. So VES models are less accurate than geoelectrical logs. Still, because of the relatively low costs, VES data also outnumber electrical borehole logs (Table 1). VES were used for detecting brackish-saline groundwater transition zones and major inversions. The brackish-saline groundwater interface is put at the top of the layer in the VES model that has soil resistivity (ρs) of 10 Ωm or less. The threshold
FIGURE 3
Interpretation of electrical well log: a) measured long normal (LN) resis-
tivity and calculated groundwater resistivity, b) formation factor based on
lithology and c) estimated chloride concentration for two bicarbonate
concentrations.
TABLE 3
Indicative penetration depth in a homogeneous soil for EM34 at various
distances between the sender and the receiver coils
Coil distance [m]Penetration depth (m)
Vertical coil (V) Horizontal coil (H)
10 7.5 15
20 15 30
40 30 60
Source: McNeill (1980).
(a)
(b)
(c)
B.J.M. Goes et al.406
© 2009 European Association of Geoscientists & Engineers, Near Surface Geophysics, 2009, 7, 401-412
example, at the location of a recently placed agricultural well (a freshwater activity) is assumed that the brackish-saline groundwa-ter interface has a depth of at least 3 m below the bottom of the screen or 15 m below the surface if the screen depth is unknown. For about half the groundwater abstraction sites a similar estimate could be made. The outcome of these low reliability estimates were only used if it did not contradict nearby other data.
ESTIMATES OF THE FRESH-BRACKISH-SALINE GROUNDWATER INTERFACESMethodThe collection of 0D (point) and 1D (column) data from the above discussed sources have been used in extensive GIS proce-dures (Goes and Vernes 2006) to provide estimates (100 m grids) of the most shallow brackish-saline ([Cl-]=1000 mg/L) ground-water interface. The shallowest interface has been mapped because it determines the landuse possibilities. The grid with the estimated brackish-saline groundwater interface is presented in Fig. 4 and discussed below. The geoelectrical contrast between fresh (<150 mg/L) and brackish (150–1000 mg/L) groundwater is too low in order to be detected with VES or EM34 measurements. Sufficient chloride water samples at one location to map the interface are very rare and the groundwater abstraction data are not comprehensive. So the depth of the fresh-brackish interface could only be determined on the basis of the interpreted 1D (column) data from geoelectrical borehole logs and electrical CPTs. The estimated fresh-brackish map is strongly correlated to the brackish-saline groundwater map and therefore not further discussed in this paper. In the data the following inversions were distinguished: fresh water within the brackish zone, brackish water in the saline zone and freshwater in the saline zone. 1D electrical CPT and geoelec-trical borehole logs provided the most detailed information on inversions. The inversions are, with the exception of the eastern
• atsiteswithlargeresistivitycontrastsandlowresistivityval-ues the measurements did not correspond with the theoretical calculated values for a known subsoil;
• theinterpretationoftheover4000measurementstakestimeand is, especially given the poor outcome, not economical.
Sites where geoelectrical well log and EM34 data were available were studied. It was concluded that at sites with fresh groundwa-ter the EM34 resistivity was always above 23.5 Ωm and that at sites with saline groundwater the EM34 resistivity was always less than 11.6 Ωm (Overmeeren 1987). The fact that over half the available data consists of EM34 measurements (>4000 locations, Table 1) made it still, despite the mentioned limitations, useful to develop a set of pragmatic rules to estimate a depth range for the brackish-saline groundwa-ter transition zone. The rules were developed on the basis of: indicative depth ranges for various EM34 configurations (Table 4), measured EM34 resistivities at fresh and saline sites and experiences with interpreting VES and geoelectrical logs. The developed rules do not take into account sedimentological differences so the reliability of the data is less than for VES. In order to improve the reliability of the interpreted brackish-saline groundwater interfaces the data were, in a map, compared with surrounding data. 74% of the EM34 measurements could be interpreted according to the rules.
Groundwater abstractionsThe province of Zeeland provided a data base of over 1500, mostly small, groundwater abstractions. For only a few wells all crucial information (type of water use, screen depths and chloride concentration) was available for estimating the depth of the brackish-saline groundwater interface. Still, based on field experi-ences from staff from the province of Zeeland some pragmatic rules were made for estimating the brackish-saline interface depth at abstraction sites with little data (Goes and Vernes 2006). For
TABLE 4
A set of pragmatic rules to estimate a depth range for the brackish-saline groundwater interface in the province of Zeeland on the basis of apparent
EM34 resistivities
Depth brackish-saline interface (m)
Number of measurements
V10 (Ωm)
V20/H10* (Ωm)
V40/H20* (Ωm)
H40 (Ωm)
<7 1040 ≤12 (≤12)
7-15 307 >16 ≤14 (≤12)
<15 426 NM ≤14 (≤12)
15-30 365 (>18) >16 ≤14 (≤12)
>15 921 >20 or NM >18 NM
>30 171 (>22) (>20) >18 <18 or NM
>60 21 (>22) (>22) (>20) >18V10: measured EM34 resistivity with vertical coil positions with 10 m distance.
H20: measured EM34 resistivity with horizontal coil positions with 20 m distance.
NM: not measured.
* Vertical coil is taken if both measurements are available.
Conditions between brackets do not apply if measurement is not available.
Estimating the depth of fresh and brackish groundwater 407
© 2009 European Association of Geoscientists & Engineers, Near Surface Geophysics, 2009, 7, 401-412
border of the province, local phenomena and are not further dis-cussed in this paper.
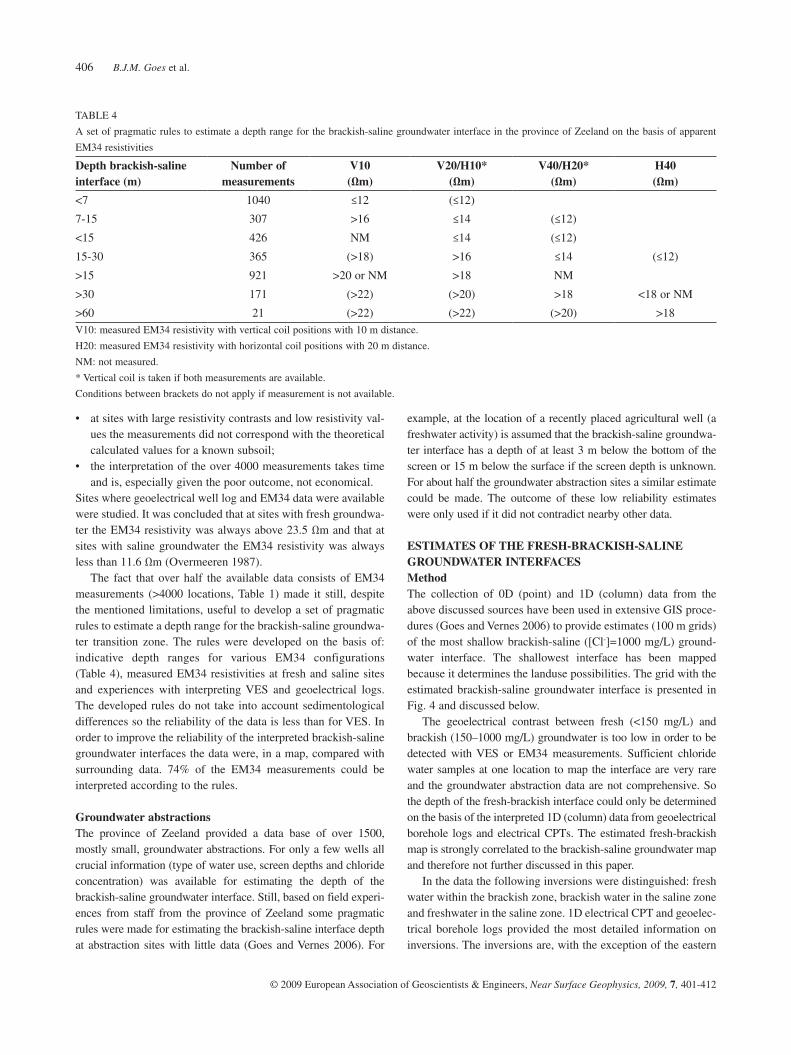
(Hydro)geological interpretation of brackish-saline ground-water interfacesFigure 4 gives a regional overview of the depth of the brackish-saline groundwater interface. Being a regional map, the actual depth of the interface may differ from the map; for example locally near infiltrating fresh or saline surface water bodies. The map is also less accurate in data sparse areas. The brackish-saline water interface map shows that the largest part of the peninsulas and islands are characterized by a shallow (<5 m) brackish–saline interface. The areas with a shallow brackish-saline interface are the clayey reclaimed tidal marshes where rain water lenses could not or hardly develop. In some areas the depth drops sharply to over 20 m. These areas coincide with dunes that face the North Sea (Fig. 1) and some of the former tidal channels that are filled with sand. Not all the tidal channels are filled with thick freshwater bodies. The development of a rainwater fed freshwater body in a tidal channel depends on sev-eral factors such as: elevation and sandiness of subsoil, date of reclamation from the sea and distance from the sea. Due to a lack of data, little information is available on the depth of the brackish-saline interface in small filled in tidal channels.
FIGURE 4
Estimated depth of brackish-
saline groundwater interface in
Zeeland province with location of
CVES sites and electrical CPT.
FIGURE 5
Estimated depth of brackish-saline groundwater interface and locations
of data points near a filled tidal channel at Schouwen-Duiveland (loca-
tion of map on Fig. 4).
B.J.M. Goes et al.408
© 2009 European Association of Geoscientists & Engineers, Near Surface Geophysics, 2009, 7, 401-412
water zone varies from approximately 5 m in the tidal channel to one metre or less outside the tidal channel. In Zeeuws-Vlaanderen (Fig. 1), which is nor an island or a peninsula, the depth of the brackish-saline interface changes more gradually and steep gradients hardly occur (Fig. 4). Also, with the exception of some areas in the north west, there is no clear relation between landscape type and the depth of the interface. The relative high elevation of the southern part of Zeeuws-Vlaanderen (gener-ally 0.5–2 m above mean sea level) and the presence of Pleistocene cover sand ridges along the Dutch-Belgian border (Fig. 1) are most likely the governing factors. The influence of the sea was less pronounced in the southern parts of Zeeuws-Vlaanderen during the Holocene due to the relative high elevation of the Pleistocene landscape. Except for filled tidal channels, clayey holocene depos-its are relatively thin; they wedge out against the Pleistocene sand ridges along the border with Belgium (Fig. 1). These Pleistocene sand ridges are infiltration areas, in which fresh groundwater bod-ies have developed and from which (fresh) groundwater flows to the adjacent lower situated areas of Zeeuws-Vlaanderen. Desalinization of the reclaimed tidal marshes in the southern part of Zeeuws-Vlaanderen is also facilitated by the fact that the clayey holocene deposits are relatively thin (generally 1–5 m) and the Pleistocene sands are closer to the surface.
Using the fresh-brackish-saline groundwater interfacesThe fresh-brackish and brackish-saline water interfaces are basic information for hydrogeological studies and groundwater man-agement. The maps clearly show that fresh groundwater is scarce in Zeeland. The province of Zeeland uses the maps to assess groundwater abstractions and to plan landuse. It is also a baseline situation for studies on the effects of climate change and related saltwater intrusions.
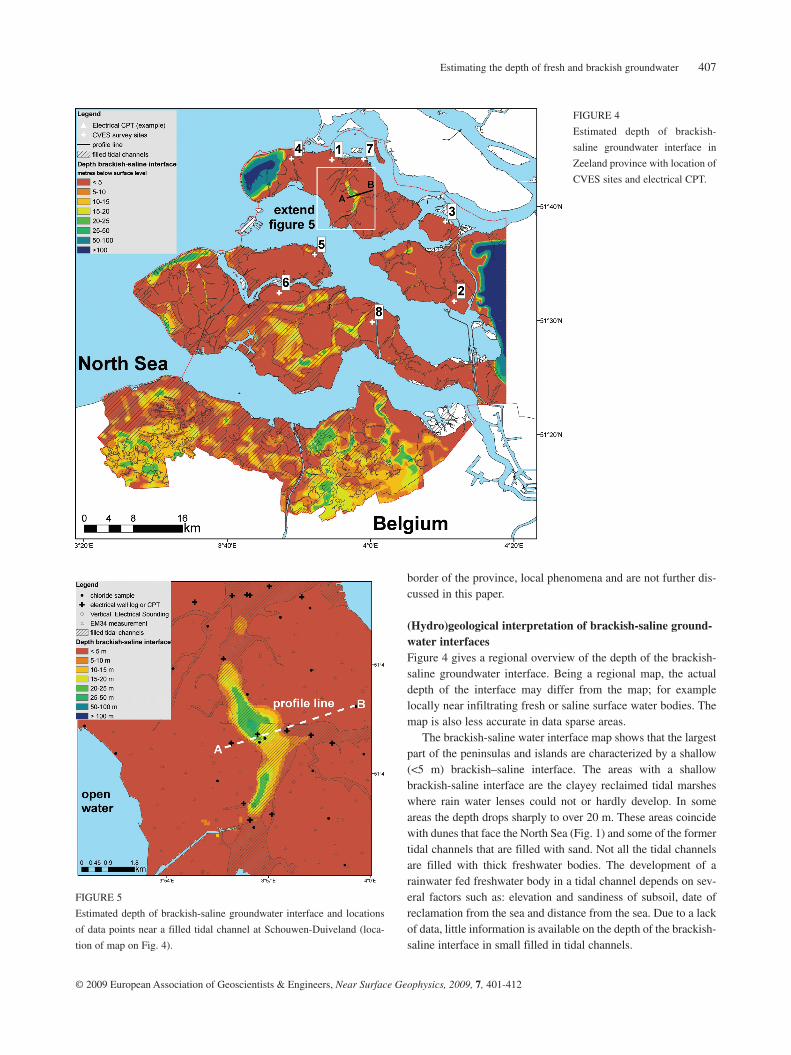
A detailed map and a cross-section over a filled tidal channel on the island of Schouwen-Duiveland are presented in Figs 5 and 6, respectively. This channel was gradually reclaimed from the sea and embanked. The oldest polder dates back from before 1300 and the youngest from 1873. The surface level of the profile illustrates how over time an inversion ridge developed by land subsidence on both sides of the filled tidal channel. Groundwater analyses and geophysical measurements show the presence of a thick zone with fresh and brackish groundwater. The brackish-saline interface has a maximum depth of 28 m below sea level. To the west and east of the filled channel, in the reclaimed tidal marshes, the interface rises to less than 5 m below sea level. The thickness of the brackish
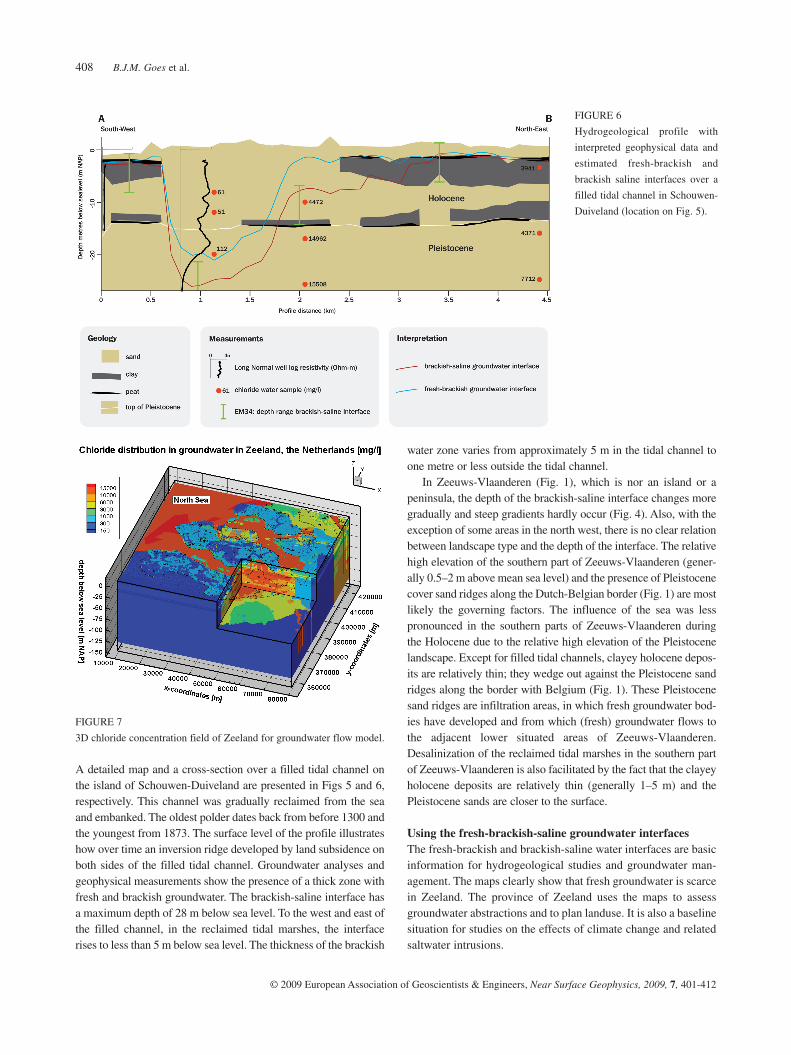
FIGURE 7
3D chloride concentration field of Zeeland for groundwater flow model.
FIGURE 6
Hydrogeological profile with
interpreted geophysical data and
estimated fresh-brackish and
brackish saline interfaces over a
filled tidal channel in Schouwen-
Duiveland (location on Fig. 5).
Estimating the depth of fresh and brackish groundwater 409
© 2009 European Association of Geoscientists & Engineers, Near Surface Geophysics, 2009, 7, 401-412
ments, are not taken into account. For this reason the automati-cally generated chloride grids for the model layers have been corrected by combining them with the mapped fresh-brackish, brackish-saline interfaces and the inversions. The outcome, a 3D field of the chloride concentration, is presented in Fig. 7.
DETECTING LOCAL BRACKISH TO SLIGHTLY SALINE WATER LENSES WITH CVESIntroductionMost data used for the regional map do not provide enough detailed information on thin and shallow fresh or brackish water
Another application of the maps is improving the estimated 3D chloride concentration field that serves as an input to a variable-density groundwater flow and coupled solute transport model, which is being made for Zeeland. The code used is MOC3D (Konikow et al. 1996). The input is needed in order to come up with plausible predictions of salinization of the groundwater sys-tem. Based on the above generated 0D and 1D data set of (esti-mated) chloride concentration, grids were generated (Kriging) for the depth of the middle of each groundwater model layer. This automatic interpolation procedure results in inaccuracies because other information, such as landscape types and EM34 measure-
TABLE 5
Overview of the with CVES detected brackish and brackish to slightly saline groundwater lenses at sites with shallow saline groundwater on the
regional map
Site**
Name Landuse Distance from large surface
water (m)
Landscape Thickness of brackish to slightly saline water lens
(Cl ≤ 3000 mg/L) (m)
Thickness of brackish water lens
(Cl ≤ 1000 mg/L) (m)
1 Brouwershaven agriculture 1100 reclaimed marsh 0 to 2 <2 *
2 Tholen agriculture 1300 reclaimed marsh 0 to 1.5 <1*
3 Anna Jacobapolder grassland 400 reclaimed marsh 0 to 3 <2*
4 Renesse agriculture 1450reclaimed marsh
and filled channel1 to 10 0 to 4
5 Noord Beveland agriculture 1100 filled channel 3 to 25 0 to 15
6 Wolphaartsdijk agriculture 1050 reclaimed marsh 0 to 2 <2*
7 Zonnemaire agriculture 400 filled channel 0.5 to 2 <2*
8 Kapelsche Moer nature 2600 reclaimed marsh 0 to 0.5 0
* thickness is difficult to estimate because CVES results are strongly influenced by unsaturated zone.
** see Fig. 4 for locations.
Based on: Marconi (2007) and Sergi (2007).
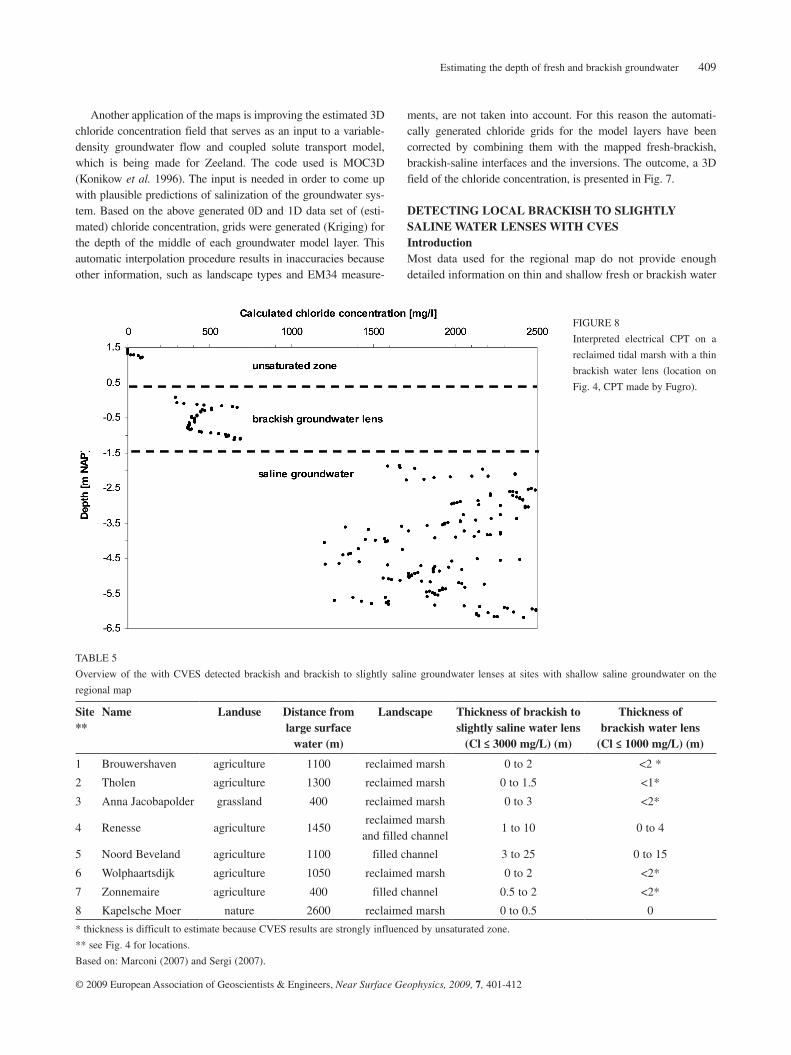
FIGURE 8
Interpreted electrical CPT on a
reclaimed tidal marsh with a thin
brackish water lens (location on
Fig. 4, CPT made by Fugro).
B.J.M. Goes et al.410
© 2009 European Association of Geoscientists & Engineers, Near Surface Geophysics, 2009, 7, 401-412
CPT with an interpreted thin (~2 m) fresh to brackish rainwater lens floating on saline water. Still, freshwater agriculture is being practised in some of the areas where the brackish-saline water interface is shallow (<5 m below the surface) according to the regional map. In order to find out more about the salinity of the shallow groundwater in these areas 2D geoelectrical measurements, or continuous vertical electrical soundings (CVES, see e.g., Reynolds 1997), have been carried along several profiles at eight different plots (Fig. 4). The CVES measurements have been done with an AbemSAS4000
occurrences. EM34 and sample data have a too low resolution while electrical well logs only provide information from a depth of approximately 5 m. Most VES measurements start with larger electrode distances because they were focused on the deeper (>4 m) subsoil. Electrical CPTs are the only data used for the regional map that are well suited for detecting shallow fresh to brackish water lenses. Still, there are not many measurements available (Table 1) and many of them have been put in the sandy channels where the brackish-saline water interface is often deeper than 5 m. Figure 8 presents an example of an electrical
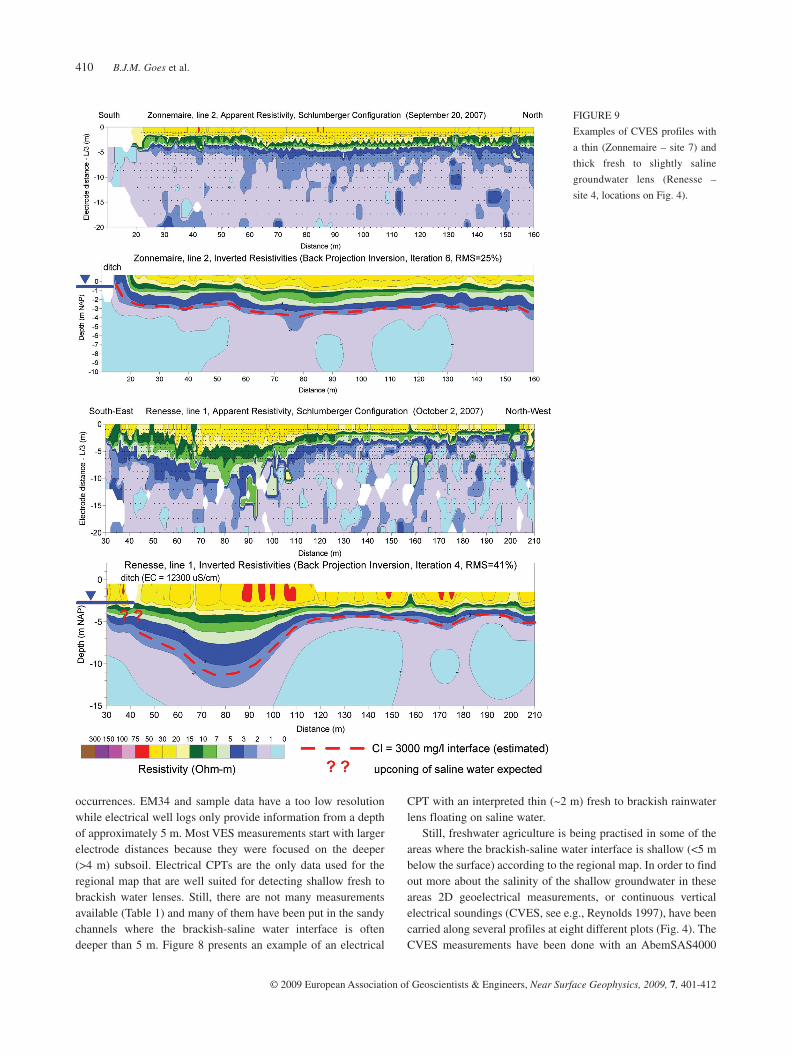
FIGURE 9
Examples of CVES profiles with
a thin (Zonnemaire – site 7) and
thick fresh to slightly saline
groundwater lens (Renesse –
site 4, locations on Fig. 4).
Estimating the depth of fresh and brackish groundwater 411
© 2009 European Association of Geoscientists & Engineers, Near Surface Geophysics, 2009, 7, 401-412
CONCLUSIONS AND RECOMMENDATIONSOn the basis of analysed geophysical (electrical CPT, electrical well logs, VES, EM34) and hydrological (chloride samples, groundwater abstractions) data the depth of the fresh-brackish ([Cl-]=150 mg/L) and brackish-saline ([Cl-]=1000 mg/L) ground-water interfaces have been estimated in the form of grid maps for the coastal province of Zeeland in the Netherlands. For a large part of Zeeland there is a clear relation between landscape type and the depth of the brackish-saline groundwater interface. The largest part of the peninsulas and islands are char-acterized by a shallow (<5 m) brackish-saline interface. The areas with a shallow brackish-saline interface are the clayey reclaimed tidal marshes with a low elevation (generally 0–2 m below mean sea level) where rain water lenses could not or hardly develop. Areas with a deeper brackish-saline groundwater interface coincide with dunes and some of the former tidal chan-nels (generally 0–1 m above mean sea level) that are partly filled with sand. Not all the tidal channels are filled with thick fresh-water bodies. The development of rainwater fed freshwater body in a tidal channel depends on several factors such as: elevation and sandiness of subsoil and date of reclamation from the sea and distance from the sea. In most of Zeeuws-Vlaanderen, which is nor an island or a peninsula, there is no clear relation between landscape type and the depth of the brackish-saline groundwater interface. The rela-tive high elevation of the southern part of Zeeuws-Vlaanderen and the presence of Pleistocene cover sand ridges along the Dutch-Belgium border are most likely the governing factors. The regional maps are being used to assess groundwater abstractions and to plan landuse. Furthermore, it is being used for a regional variable-density groundwater flow model, which will be used for various water management issues. Despite the fact that over 6000 unique locations have been used to prepare the regional maps, there always remain areas where the regional map is less reliable due to a low data density. Airborne EM (e.g., Ley-Cooper et al. 2008) can possibly help in the future to upgrade the regional maps. Most data used for the regional map, with the exception of electrical CPTs, do not provide enough detailed information on thin and shallow fresh or brackish water occurrences. Still, fresh-water agriculture is being practised in some of the areas where the brackish-saline water interface is shallow (<5 m below the surface) according to the regional map. Six of the eight sites surveyed with CVES have thin (0–3 m) brackish to slightly saline (Cl < 3000 mg/L) water lenses. At two sites up to 15 m thick brackish (Cl < 1000 mg/L) water lenses have been observed with CVES. The CVES also show that the thickness of the brackish water occurrences vary laterally over short distances. A sandier soil and a higher topography are appar-ently favourable circumstances along the CVES profiles for the development of these lenses. Freely inverted CVES data do not provide enough resolution to accurately map thin (<3 m) fresh to slightly saline groundwa-
that was connected to four multi-electrode cables with an elec-trode spacing of 1 m. The measured apparent resistivity data have been recalculated (inverted) into real soil resistivities with a computer program (SensInv2D, Geotomographie 2004). A free inversion, without prior subsoil information, was applied.
Interpretation of CVES profilesGiven a dominant soil type of clayey sand (F = 2.5) for most surveyed sites and the empirical relation presented in Fig. 2, a water saturated soil resistivity of ~7.2 Ωm represents the esti-mated brackish-saline interface (Cl = 1000 mg/L) while a soil resistivity of ~2.5 Ωm represents the estimated ‘slightly saline to saline’ interface (Cl = 3000 mg/L). The ‘slightly saline to saline’ interface is introduced because brackish water is hardly present in the saturated zone at most of these sites. The above presented resistivity values vary slightly from site to site depending on the dominant soil type. Table 5 provides a summary of the results for all the eight sites. Six of the eight sites have thin (0–3 m) brack-ish to slightly saline (Cl < 3000 mg/L) water lenses. At two sites (Noord-Beveland and Renesse) up to 15 m thick brackish (Cl < 1000 mg/L) water lenses have been observed with CVES. The CVES also shows that the thickness of the brackish water occur-rences vary laterally over short distances. Figure 9 presents two inverted CVES profiles, one with a very thin brackish to saline water lens (Zonnemaire) and one with a thick lens (Renesse). The thick brackish water lens at Renesse is at the south-east side of the profile where the sediment is sandier and where the topog-raphy is about 1 m higher (probably a filled channel). This cre-ates favourable circumstances for the infiltration of rain water. The water level in the adjacent ditch is saline (EC = 12300 μS/cm). The groundwater under the ditch is expected to be saline because of upconing of deeper saline groundwater. Still, the CVES indicates a thin zone (2–3 m) with higher resistivities, or brackish to slightly saline water, under the ditch. This may be related to the more difficult field circumstances in and near the ditch (not all electrodes could be connected) or our expectation is incorrect. More detailed measurements are required (e.g., CVES with shorter spacing in combination with electrical CPT) to examine the saline groundwater distribution under and adja-cent to the ditch. Freely inverted CVES data do not provide enough resolution to accurately map thin (<3 m) fresh to slightly saline groundwa-ter lenses because the unsaturated zone strongly influences the image. For example, the estimated depth of the brackish water interface is likely to be overestimated with a free inversion in the situation of a large resistivity contrast such as a relatively dry and sandy unsaturated zone above saline groundwater. So more detailed information from the saturated and unsaturated zone (chloride concentration, soil moisture, water levels, sediment type, electrical CPT, etc.) are required in order to put realistic constraints on the inversion of the CVES data. Still, the upconing of deeper saline groundwater under the ditch is clearly visible at the Zonnemaire profile (Fig. 9).
B.J.M. Goes et al.412
© 2009 European Association of Geoscientists & Engineers, Near Surface Geophysics, 2009, 7, 401-412
Konikow L.F., Goode D.J. and Hornberger G.Z. 1996. A three-dimen-sional method-of-characteristics solute-transport model (MOC3D). USGS Water-Resources Investigations Report 96-4267.
Ley-Cooper Y, Macnae J. and Tweed S. 2008. Estimating subsurface porosity and salt loads using airborne geophysical data. Near Surface Geophysics 6, 31–37.
Marconi V. 2007. Characterization of shallow fresh water lenses in the prov-ince of Zeeland with 2D geo-electrical survey. TNO Report (draft).
McNeill J.D. 1980. Electromagnetic terrain conductivity measurement at low induction numbers. Geonics Ltd Technical Note TN-6. Geonics Ltd, Mississauga, Canada.
McNeill J.D. 1983. EM34-3 survey interpretation techniques, Geonics Ltd Technical Note TN-8. Geonics Ltd, Mississauga, Canada.
van Overmeeren R.A. 1987. Electromagnetic and geo-electrical study Zeeuws-Vlaanderen. TNO Report GF-147. Dienst Grond water-verkenning TNO, Delft (in Dutch).
van Overmeeren R.A., Mulder M.H. and Meekes J.A.C. 1991. Computer aided analysis and interpretation of geophysical data. Dienst Grondwaterverkenning TNO, Delft.
Reynolds J.M. 1997. An Introduction to Applied and Environmental Geophysics. John Wiley & Sons.
Sergi F, 2007. Characterisation of shallow rainwater lenses in the prov-ince of Zeeland using 2D geo-electrical measurements. TNO Report (draft).
TNO-IGG 1992. Introduction to geophysical well logs, a practical course for groundwater studies. TNO Instituut voor Grondwater en Geo-Energie, Delft (in Dutch).
Vernes R.W. and van Doorn Th.H.M. 2005. Regional Geographical Information System for the Netherlands, REGIS II, TNO Report NITG 05-038-B. Nederlands Instituut voor Toegepaste Geowetenschappen TNO, Utrecht (in Dutch).
Vos P.C. and van Heeringen R.M. 1997. Holocene geology and occupa-tion history of the Province of Zeeland. In: Holocene Evolution of Zeeland (SW Netherlands) (ed. M.M. Fischer), pp. 5–109. Netherlands Institute of Applied Geoscience, TNO, Mededeling, Nr 59.
ter lenses because the unsaturated zone strongly influences the image. The estimated depth of the brackish water interface is likely to be overestimated with a free inversion in the situation of a large resistivity contrast such as a relatively dry and sandy unsaturated zone above saline groundwater. So more detailed information from the saturated and unsaturated zone (chloride concentration, soil moisture, water levels, sediment type, electri-cal CPT, etc.) is required in order to put realistic constraints on the inversion of the CVES data.
ACKNOWLEDGEMENTSThe province of Zeeland, notably Lein Kaland, is thanked for allowing us to use the outcome of various Deltares projects done in the province. A special thanks to Jeroen Schokker (Deltares) for providing useful comments on the geology of Zeeland.
REFERENCESFugro 2002a. Geotechnical Study for Hydrometric Network of Zeeland
Province, Opdrachtnummer: S-5269. Fugro Ingenieursbureau B.V., Breda (in Dutch).
Fugro 2002b. Geotechnical Study for Hydrometric Network of Zeeland Province, Opdrachtnummer: S-5289. Fugro Ingenieursbureau B.V., Hardinxveld-Giessendam (in Dutch).
Geirnaert W. and Vandenberghe J. 1988. Applied Geophysics for Groundwater Exploration and Geological Mapping. Instituut voor Aardwetenschappen, Vrije Universiteit, Amsterdam.
Geotomographie 2004. SensInv2D – Manual. www.geotomographt.de.Goes B.J.M. and Vernes R.W. 2006. REGIS Zeeland, Report C: Fresh,
brackish and saline groundwater. TNO Report, Province of Zeeland (in Dutch).
Keary P and Brooks M. 1991. An Introduction to Geophysical Exploration, 2nd edn. Blackwell Science.
Related Documents