Oxford University Press and American Society of Mammalogists are collaborating with JSTOR to digitize, preserve and extend access to Journal of Mammalogy. http://www.jstor.org American Society of Mammalogists Estimating the Adult Survival Rate of Central North Pacific Humpback Whales (Megaptera novaeangliae) Author(s): S. A. Mizroch, L. M. Herman, J. M. Straley, D. A. Glockner-Ferrari, C. Jurasz, J. Darling, S. Cerchio, C. M. Gabriele, D. R. Salden and O. von Ziegesar Source: Journal of Mammalogy, Vol. 85, No. 5 (Oct., 2004), pp. 963-972 Published by: American Society of Mammalogists Stable URL: http://www.jstor.org/stable/1383827 Accessed: 29-06-2015 18:57 UTC REFERENCES Linked references are available on JSTOR for this article: http://www.jstor.org/stable/1383827?seq=1&cid=pdf-reference#references_tab_contents You may need to log in to JSTOR to access the linked references. Your use of the JSTOR archive indicates your acceptance of the Terms & Conditions of Use, available at http://www.jstor.org/page/ info/about/policies/terms.jsp JSTOR is a not-for-profit service that helps scholars, researchers, and students discover, use, and build upon a wide range of content in a trusted digital archive. We use information technology and tools to increase productivity and facilitate new forms of scholarship. For more information about JSTOR, please contact [email protected]. This content downloaded from 161.55.176.36 on Mon, 29 Jun 2015 18:57:15 UTC All use subject to JSTOR Terms and Conditions

Welcome message from author
This document is posted to help you gain knowledge. Please leave a comment to let me know what you think about it! Share it to your friends and learn new things together.
Transcript

Oxford University Press and American Society of Mammalogists are collaborating with JSTOR to digitize, preserve and extend access to Journal of Mammalogy.
http://www.jstor.org
American Society of Mammalogists
Estimating the Adult Survival Rate of Central North Pacific Humpback Whales (Megaptera novaeangliae) Author(s): S. A. Mizroch, L. M. Herman, J. M. Straley, D. A. Glockner-Ferrari, C. Jurasz, J. Darling, S. Cerchio, C. M. Gabriele, D. R. Salden and O. von Ziegesar Source: Journal of Mammalogy, Vol. 85, No. 5 (Oct., 2004), pp. 963-972Published by: American Society of MammalogistsStable URL: http://www.jstor.org/stable/1383827Accessed: 29-06-2015 18:57 UTC
REFERENCESLinked references are available on JSTOR for this article:
http://www.jstor.org/stable/1383827?seq=1&cid=pdf-reference#references_tab_contents
You may need to log in to JSTOR to access the linked references.
Your use of the JSTOR archive indicates your acceptance of the Terms & Conditions of Use, available at http://www.jstor.org/page/ info/about/policies/terms.jsp
JSTOR is a not-for-profit service that helps scholars, researchers, and students discover, use, and build upon a wide range of content in a trusted digital archive. We use information technology and tools to increase productivity and facilitate new forms of scholarship. For more information about JSTOR, please contact [email protected].
This content downloaded from 161.55.176.36 on Mon, 29 Jun 2015 18:57:15 UTCAll use subject to JSTOR Terms and Conditions

Journal of Mammalogy, 85(5):963-972, 2004
ESTIMATING THE ADULT SURVIVAL RATE OF CENTRAL NORTH PACIFIC HUMPBACK WHALES (MEGAPTERA NOVAEANGLIAE) S. A. MIZROCH,* L. M. HERMAN, J. M. STRALEY, D. A. GLOCKNER-FERRARI, C. JURASZ, J. DARLING, S. CERCHIO, C. M. GABRIELE, D. R. SALDEN, AND O. VON ZIEGESAR
National Marine Mammal Laboratory, Alaska Fisheries Science Center, National Marine Fisheries Service, National Oceanic and Atmospheric Administration, 7600 Sand Point Way NE, Seattle, WA 98115, USA (SAM) Kewalo Basin Marine Mammal Laboratory, 1129 Ala Moana Boulevard, Honolulu, HI 96814, USA (LMH) University of Alaska Southeast Sitka Campus, 1332 Seward Avenue, Sitka, AK 99835, USA (JMS) Center for Whale Studies, 39 Woodvine Court, Covington, LA 70433-4724, USA (DAG-F) SeaSearch, P.O. Box 700, Faro, Yukon Territory, YOB 1KO, Canada (CJ) West Coast Whale Research Foundation, P.O. Box 384, Tofino, British Columbia, VOR 2ZO, Canada (JD) Moss Landing Marine Labs, 8272 Moss Landing Road, Moss Landing, CA 95039, USA (SC) Humpback Whale Monitoring Program, Glacier Bay National Park and Preserve, P.O. Box 140, Gustavus, AK 99826, USA (CMG) Hawaii Whale Research Foundation, 52 Cheshire Drive, Maryville, IL 62062, USA (DRS) Eye of the Whale, P.O. Box 15191, Fritz Creek, AK 99603, USA (OVZ) Present address of SC: Museum of Zoology, Bird Division, University of MI, 1109 Geddes Avenue, Ann Arbor, MI 48109-1079, USA
We used photo-identification records to estimate annual survival of adult humpback whales (Megaptera novaeangliae) for the central North Pacific stock using models within the software application Program MARK. The analysis is based on 10,567 photographs of 2,400 individual whales taken from 1979 to 1996. The central North Pacific stock winters in Hawai'i and migrates to discrete feeding areas in Alaska for the summer and autumn. The Cormack-Jolly-Seber (CJS) estimate of annual survival based on annual sightings in Hawai'i was 0.963 (95% confidence interval [CI]: 0.944-0.978) and the Pradel estimate was 0.963 (95% CI: 0.944-0.976), with a population rate of increase of 1.10 (95% CI: 1.03-1.16). The best survival estimate for southeastern Alaska whales, based on Barker's model, was 0.957 (95% CI: 0.943-0.967). The best survival estimate for Prince William Sound whales, also based on Barker's model, was 0.984 (95% CI: 0.954-0.995). Whales from the central North Pacific stock mix in Hawai'i; therefore, the best apparent survival estimate for the entire stock is from the pooled Hawai'i data. However, this analysis also demonstrated that we could reduce heterogeneity with Barker's model and obtain more plausible estimates of survival for the whales in discrete feeding areas using semiannual sightings in Hawai'i as opportunistic resightings.
Key words: adult survival, capture-recapture, demography, humpback whale, marine mammal, Megaptera novaeangliae, North Pacific, photo identification, Program MARK
Humpback whales (Megaptera novaeangliae) in the central North Pacific Ocean feed in Alaskan waters and migrate to Hawai'ian waters to mate and give birth (Baker et al. 1986; Darling and Jurasz 1983; Darling and McSweeney 1985). In Alaskan waters, humpback whales are distributed throughout
the Gulf of Alaska and the Bering Sea, but most long-term studies have occurred in southeastern Alaska and Prince William Sound because these waters are sheltered and can be surveyed from small boats. Whales separate into discrete feeding areas in Alaska and generally return to the same specific area year after year (Baker et al. 1986; Calambokidis et al. 1996, 2001; Waite et al. 1999), but it is thought that the central North Pacific whales mingle in Hawai'i (Calambokidis et al. 2001; Cerchio et al. 1998; Darling 1983). Most assume that whales fast during the migration to and from Hawai'i and eat only rarely while in low-latitude waters (Baraff et al. 1991;
* Correspondent. [email protected]
? 2004 American Society of Mammalogists www.mammalogy.org
963
This content downloaded from 161.55.176.36 on Mon, 29 Jun 2015 18:57:15 UTCAll use subject to JSTOR Terms and Conditions

964 JOURNAL OF MAMMALOGY Vol. 85, No. 5
Mackintosh 1965; Mathews 1937). Instead, these sites are used for social activities including calving, competition for mates, singing, and presumably mating. The availability of long-term sighting histories of individual humpback whales in winter and summer areas allows estimation of the adult survival rate, a population parameter essential for documenting the recovery of this endangered species.
In the late 1960s and early 1970s, researchers began to collect
photographs of humpback whale tail flukes and found they could distinguish unique individuals solely on the basis of natural markings on the flukes (Hammond et al. 1990). By the late 1970s and early 1980s, humpback whale photo-identifica- tion studies were conducted regularly in a number of locations in the North Pacific. Photographic collections from various research groups, when pooled over the entire North Pacific, now provide a comprehensive source of information to study migratory patterns, distribution, birth rates, and survival rates of
humpback whales (Gabriele et al. 2001). Beginning in 1985, the National Marine Mammal Laboratory developed a centralized database and computer-assisted photo-identification system based on natural markings on humpback whale tail flukes in order to facilitate and enhance such studies (Frady 1987; Mizroch et al. 1990).
Survival estimates have been provided for the North Atlantic
humpback whales, but there are no estimates for any of the other major humpback whale populations. Buckland (1990), using data from North Atlantic feeding areas, estimated an adult survival rate for North Atlantic humpback whales of 0.951 (95% confidence interval [CI]: 0.929-0.969), and Barlow and Clapham (1997) estimated a noncalf survival rate of 0.96
(SE = 0.008). We provide the 1st estimates of adult survival rates for the central North Pacific humpback whales, based on new estimation methods that are more powerful than those
previously used. Cormack (1964), Jolly (1965), and Seber (1965) developed
models (CJS models) used to estimate apparent survival rates
(?) and recapture probabilities (p) that vary over time. Unlike the Jolly-Seber model, which is generally used to estimate abundance, the Cormack-Jolly-Seber model is a restricted model and only allows for the estimation of parameterizations of 4) and p. It is conditioned on resightings after 1 st releases, and is therefore less susceptible to the effects of heterogeneity in the dataset than a Jolly-Seber model. Estimates of Q4 are considered
apparent survival, not true survival, because estimates of d can be affected by emigration, sampling that does not account for geographic segregation, or other factors. The software applica- tion Program MARK (White and Burnham 1999) allows the generalization and reparameterization of CJS models in order to explore additional models (see Lebreton et al. 1992 for additional information on modifications of CJS models). In addition to time-varying models, models of 4b and p can be explored that allow the parameters to vary by area (e.g., feeding areas in Alaska or Hawai'i subareas). Models that estimate capture probability as a function of photographic effort can be explored as well. Survival rate models that can be examined include constant survival, by convention called 4(.), 4(time; time varying), and $ (area varying). Capture probability models
that can be examined include p(.), p(time), p(area), and p(effort).
Pradel (1996) developed models based on Jolly-Seber that allow for the simultaneous estimation of survival, capture probability, and population growth rates, including population rate of increase (k). Burnham (1993) developed a model that uses data from both live captures (the initial marking event and
subsequent live recaptures) and dead recoveries (e.g., hunters returning tag numbers of banded birds). The Burnham model is a combination of CJS and band recovery models (Brownie et al. 1985). Barker (1997) extended Burnham's model to include resightings reported between capture occasions. Barker and White (2001) reparameterized the Barker model for incorpora- tion into MARK, and the parameters estimated include S
(probability of survival from 1 capture session to the next); p (probability of capture during a capture session); r (probability of reporting of tag recovery [animal found dead]); R (probability of being resighted between capture sessions when the animal remains alive throughout the interval between capture sessions); R' (probability of being resighted during the interval between
capture sessions when the animal dies after being resighted during the interval); F (probability of site fidelity, given that the animal remains in [or returns to] the capture-recapture site and is available for capture during the next capture session time
period); and F' (probability of immigration, given that the animal was absent in the previous capture session time period but returns for the subsequent time period).
Most survival rate analyses conducted before Program MARK was available used simple time-varying models and
analysts were not able to explore more complex (or simpler) models, nor were they able to measure and explore sources of
heterogeneity. Our study explores means to obtain the best survival rate estimates from a large and complex dataset through application of modern methods of capture-recapture analysis to long-term photographic records of individual humpback whales. This approach may provide the only means available for obtaining such estimates. We also examine how proper stratification of such data may help reduce heterogeneity, and how improper (but seemingly logical) pooling methods may actually introduce heterogeneity. Our work also provides the 1st
attempt to analyze data from migratory whales using sightings in both summer and winter areas and is the 1st to use Barker's model for estimating survival rates of migratory whales.
MATERIALS AND METHODS
Photo-identification data_-Photo-identification
data used in this paper are a subset of the large database of photographic submissions from researchers working throughout the North Pacific who are part of the North Pacific Humpback Whale Working Group (Mizroch et al. 1990; Fig. 1). The focus of the analysis presented here is the central North Pacific stock of humpback whales, which feed in Alaskan waters in summer and autumn and mate and give birth in Hawai'ian waters in winter (Fig. 1).
In addition to research groups whose photographs are analyzed in this paper, photographs were submitted from many areas in the North Pacific, including researchers working along the west coast of the United States (Cascadia Research Collective, J. Calambokidis),
This content downloaded from 161.55.176.36 on Mon, 29 Jun 2015 18:57:15 UTCAll use subject to JSTOR Terms and Conditions

October 2004 MIZROCH ET AL.-ADULT SURVIVAL RATE OF HUMPBACK WHALES 965
900E 120?E 150?E 180OW 150"W 120OW 90OW
90"E-
Prnc illiam Sound
600N- . ,_ . S iheastern Alka 60N
-90oW
0 750 1,500 3,0rn 30ON- -30ON
Japan Hawai'i
Mexico
Kaua'i
Maui IoN- I;D I "N
5 , 10Hawa i'
1200E 1500E 186OW 156oW 120OW 08? 751 2 00Km
FIG. 1.-Areas in the North Pacific where humpback whale research is conducted. Analyses in this paper focus on the central North Pacific stock, which spends the winter in Hawai'i and summer in feeding areas in Alaska.
Mexico (Universidad Aut6noma de Baja California Sur, J. Urban; Universidad Nacional Aut6noma de Mexico, L. Medrano), and Japan (Ogasawara Marine Center, M. Yamaguchi; Okinawa Expo Aquarium, S. Uchida).
None of the original photographic studies collected data specifically for calculating survival estimates. In some cases, photographic data were collected opportunistically, and in others, data were collected for behavioral rather than population studies. In most cases, especially in the earlier years, the age or sex of the whale was unknown. In many cases, more than 1 photograph of an individual was submitted each year, either due to multiple sightings by 1 research group or sightings of an individual by more than 1 research group. Photographs in the database were assigned a unique identification number when there were at least 2 photographs of an individual whale in the database. Only those assigned an identification number were used in this analysis. The large North Pacific database is not fully cross-matched because it quickly grew from about 5,000 to over 24,000 photographs. We selected whales that have at least 1 matching photograph. The unmatched whales in the larger database were not used in our analysis because they could bias the survival estimate downward.
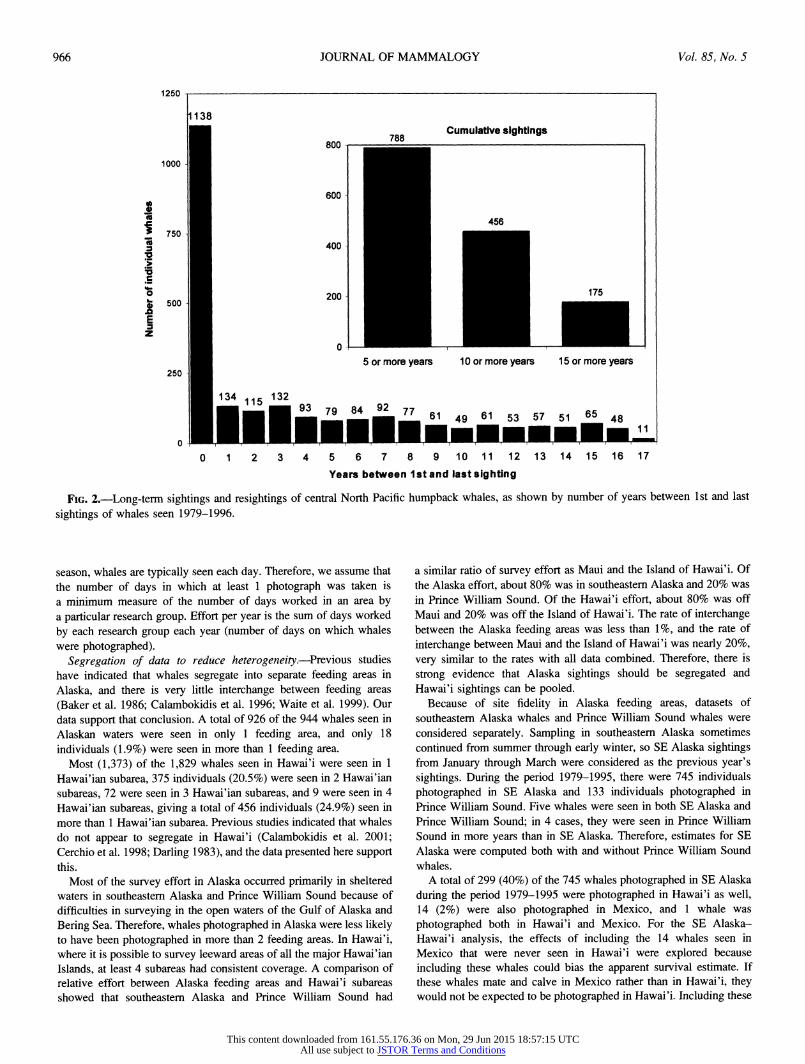
Photographic coverage began in 1968, but annual sample sizes from both Alaska and Hawai'i were small until the late 1970s. Consistent sampling from the central North Pacific stock began in Alaska in summer and late autumn 1979 and in Hawai'i during the winter of 1980. Therefore, the dataset analyzed in this paper begins with Alaska sightings in 1979 and ends with Hawai'i sightings in 1996. Sightings during winter (January-March) in Alaska were assumed to be of whales that had migrated to Alaska to feed during the previous calendar year and thus were included in the previous year's data. The Alaska 1979-Hawai'i 1996 dataset contains 10,567 photographs of 2,400 individuals. Of the 2,400 individual whales, 1,138 (47%) were seen in only 1 year, 788 (33%) were seen more than once over a period
of 5 years, and 175 (7%) individuals were seen over a period of 15 or more years (Fig. 2).
By including only whales that were photographed at least twice, there is a chance that this selection method could bias the estimate of survival rates high. That is, whales seen in only 1 year would have a lower chance of being included in the dataset, and therefore whales with a lower survival rate would be excluded because they were seen in 1 year only and subsequently died. However, 1,854 (77.3%) of the 2,400 whales had multiple photographs in a given year and nearly half of the whales in the dataset were seen in only 1 year (Fig. 2). We would very likely add a negative bias to survival estimates if we included unmatched whales.
For Barker models, sightings in Alaska are considered to have occurred during capture sessions. Because the capture probability of individual whales is much smaller in Hawai'i than in Alaska, sightings of Alaskan whales in Hawai'i are considered opportunistic resightings between capture occasions. In this case, because we had only 1 recovery of a dead whale (Pack et al. 1998) at the very end of the capture period (a known whale was witnessed to die in February 1996), that sighting was treated as a live resighting and the parameter r was fixed at 0 and was not estimated by MARK.
Estimation of photographic effort.-Photographic effort varied greatly over the years, with over 11 research groups or individuals working in Alaska and Hawai'i over a period of 31 years. In Alaskan waters, most sampling was conducted in southeastern Alaska and Prince William Sound, but some sampling occurred around Kodiak Island, Yakutat Bay, the Gulf of Alaska, and the Bering Sea. In Hawai'ian waters, most sampling occurred near Maui, the Island of Hawai'i, and off Kaua'i from 1989 to 1993. Some photographs from Molokai, Penguin Bank, and Oahu were also submitted.
A measure of effort (photo days) was developed based on the number of days that whales were photographed. During the research
This content downloaded from 161.55.176.36 on Mon, 29 Jun 2015 18:57:15 UTCAll use subject to JSTOR Terms and Conditions
966 JOURNAL OF MAMMALOGY Vol. 85, No. 5
1250
138 Cumulative sightings
788
1000
600
to ,456 S 7504
I 400
5 200 175 500
Ssoo-0 5 or more years 10 or more years 15 or more years 250
134 15 134 115 132 93 79 84 92
77 61 49 61 53 57 51 65 48
0 1 2 3 4 5 6 7 8 9 10 11 12 13 14 15 16 17
Years between 1 st and last sighting
FIG. 2.-Long-term sightings and resightings of central North Pacific humpback whales, as shown by number of years between 1st and last
sightings of whales seen 1979-1996.
season, whales are typically seen each day. Therefore, we assume that the number of days in which at least 1 photograph was taken is a minimum measure of the number of days worked in an area by a particular research group. Effort per year is the sum of days worked
by each research group each year (number of days on which whales were photographed).
Segregation of data to reduce heterogeneity.-Previous studies have indicated that whales segregate into separate feeding areas in
Alaska, and there is very little interchange between feeding areas
(Baker et al. 1986; Calambokidis et al. 1996; Waite et al. 1999). Our data support that conclusion. A total of 926 of the 944 whales seen in Alaskan waters were seen in only 1 feeding area, and only 18 individuals (1.9%) were seen in more than 1 feeding area.
Most (1,373) of the 1,829 whales seen in Hawai'i were seen in 1 Hawai'ian subarea, 375 individuals (20.5%) were seen in 2 Hawai'ian subareas, 72 were seen in 3 Hawai'ian subareas, and 9 were seen in 4 Hawai'ian subareas, giving a total of 456 individuals (24.9%) seen in more than 1 Hawai'ian subarea. Previous studies indicated that whales do not appear to segregate in Hawai'i (Calambokidis et al. 2001; Cerchio et al. 1998; Darling 1983), and the data presented here support this.
Most of the survey effort in Alaska occurred primarily in sheltered waters in southeastern Alaska and Prince William Sound because of difficulties in surveying in the open waters of the Gulf of Alaska and
Bering Sea. Therefore, whales photographed in Alaska were less likely to have been photographed in more than 2 feeding areas. In Hawai'i, where it is possible to survey leeward areas of all the major Hawai'ian Islands, at least 4 subareas had consistent coverage. A comparison of relative effort between Alaska feeding areas and Hawai'i subareas showed that southeastern Alaska and Prince William Sound had
a similar ratio of survey effort as Maui and the Island of Hawai'i. Of the Alaska effort, about 80% was in southeastern Alaska and 20% was in Prince William Sound. Of the Hawai'i effort, about 80% was off Maui and 20% was off the Island of Hawai'i. The rate of interchange between the Alaska feeding areas was less than 1%, and the rate of
interchange between Maui and the Island of Hawai'i was nearly 20%,
very similar to the rates with all data combined. Therefore, there is
strong evidence that Alaska sightings should be segregated and Hawai'i sightings can be pooled.
Because of site fidelity in Alaska feeding areas, datasets of southeastern Alaska whales and Prince William Sound whales were considered separately. Sampling in southeastern Alaska sometimes continued from summer through early winter, so SE Alaska sightings from January through March were considered as the previous year's sightings. During the period 1979-1995, there were 745 individuals
photographed in SE Alaska and 133 individuals photographed in Prince William Sound. Five whales were seen in both SE Alaska and Prince William Sound; in 4 cases, they were seen in Prince William Sound in more years than in SE Alaska. Therefore, estimates for SE Alaska were computed both with and without Prince William Sound whales.
A total of 299 (40%) of the 745 whales photographed in SE Alaska
during the period 1979-1995 were photographed in Hawai'i as well, 14 (2%) were also photographed in Mexico, and I whale was
photographed both in Hawai'i and Mexico. For the SE Alaska- Hawai'i analysis, the effects of including the 14 whales seen in Mexico that were never seen in Hawai'i were explored because
including these whales could bias the apparent survival estimate. If these whales mate and calve in Mexico rather than in Hawai'i, they would not be expected to be photographed in Hawai'i. Including these
This content downloaded from 161.55.176.36 on Mon, 29 Jun 2015 18:57:15 UTCAll use subject to JSTOR Terms and Conditions

October 2004 MIZROCH ET AL.-ADULT SURVIVAL RATE OF HUMPBACK WHALES 967
TABLE 1.-Summary of characteristics of datasets based on humpback whale photo-identification records, central North Pacific Ocean, with estimates of survival (4 or S as appropriate) using different models available in Program MARK. CJS = Cormack-Jolly-Seber; HI = Hawai'i.
Number of Survival Model Survival Range of individual estimate
Dataset used estimate years whales (95% CI) c X2/d.f. HI only CJS 1980-1996 1,825 0.963 (0.944-0.978) 2.296 HI only Pradel 1980-1996 1,825 0.963 (0.944-0.976) 2.296 SE Alaska only CJS 1979-1995 745 0.937 (0.921-0.950) 2.788 SE Alaska-HI CJS 1979-1996 745 0.952 (0.941-0.961) 1.903 SE Alaska-HI Barker S 1979-1996 745 0.957 (0.943-0.967) 2.006 SE Alaska-HI without CJS 1979-1996 740 0.953 (0.941-0.960) 1.895
Prince William Sound SE Alaska-HI without Prince CJS 1979-1996 728 0.951 (0.941-0.960) 1.857
William Sound and Mexico Prince William Sound-Hawai'i Barker S 1979-1996 133 0.984 (0.954-0.995) 1.569 All Alaska-HI CJS 1979-1996 2,397 0.931 (0.912-0.945) 6.074
data could bias the estimate low. Therefore, estimates for SE Alaska were computed both with and without whales photographed in Mexico. Of the 133 individuals seen in Prince William Sound during the period 1979-1996, 52 (39%) were seen in Hawai'i, 4 (3%) were seen in Mexico, and none were seen in both Hawai'i and Mexico.
Model selection and testing.--Our general conceptual approach to modeling survival estimates follows that of Lebreton et al. (1992), who also discuss the assumptions involved. In many cases, count data may not fully conform to a binomial distribution due to the lack of independence among individuals (extrabinomial variation) or dif- ferences in survival or capture probabilities among individuals (heterogeneity). Therefore, the variance of estimates using count data can be underestimated. Each dataset was tested and appropriately adjusted for extrabinomial variation (overdispersion). We ran software Program RELEASE (Burnham et al. 1987) within Program MARK (White and Bumham 1999) to compare estimates from the saturated model, 4(time) p(time), to the original dataset. We compared sighting histories based on the parameters of the saturated model with the original dataset. TEST2 of Program RELEASE (within Program MARK) compares observed to expected frequencies and pools across rows and treats the data as 2 x 2 X2 tables. TEST3 pools across columns and tests similarly. The variance inflation factor, c, is estimated as the pooled TEST2 + TEST3 Z2 value divided by the pooled degrees of freedom (Burnham et al. 1987; Lebreton et al. 1992). If the data are independent and homogeneous, the value of c is expected to be 1. The estimate of the variance inflation factor, c, is not expected to exceed 4, and values higher than 4 indicate that even the saturated model does not adequately represent the variation in the dataset (Anderson et al. 1994).
We selected models based on Akaike's Information Criterion (AIC-Akaike 1973, 1985; Bumham and Anderson 1998). In cases where overdispersion existed, models were adjusted by C, the variance inflation factor, and model selection was based on a quasi-likelihood modification of AIC defined as QAICc (Anderson and Burnham 1999; Anderson et al. 1994; Bumham and Anderson 1998).
RESULTS
We computed 16 annual survival estimates (4) for the 17- year period (Hawai'i 1980-1996 and Alaska 1979-1995). We analyzed 5 separately compiled datasets from the same overall photographic database (Table 1).
Hawai'i, 1980-1996.-If whales mix completely in Ha- wai'ian wintering areas, the pooled Hawai'i dataset should provide a good estimate of annual survival for the central North Pacific stock of humpback whales. This dataset included all whales seen in Hawai'i between 1980 and 1996. Using CJS models, the best fitting model, based on QAICc, assumed constant survival and time-varying capture probability (Fig. 3a; Appendix I). The estimate for 4 was 0.963 (95% CI: 0.944- 0.978). The C estimate (2.296) was higher than those of the geographically segregated Alaska datasets, but lower than the entire dataset (Hawai'i-Alaska; Table 1).
The Hawai'ian dataset was also analyzed using Pradel's model. The best model, based on QAICc, also assumed constant survival and time-varying capture probabilities (Appendix I). The estimate of 4 was 0.963 (95% CI: 0.944- 0.976; see Figs. 3b and 3c for a plot of capture probabilities and X values and Appendix I for the models and results). Pradel's model gave similar results to the CJS result, but had a narrower confidence interval (Table 1). Based on variance components analysis of the estimable X's (estimates 2 through 14), the population rate of increase is 1.10 (95% CI: 1.03-1.16), about 10% annually.
Southeastern Alaska, 1979-1995.-An annual survival estimate was computed for whales seen in SE Alaska from 1979 to 1995. The best model, based on a QAICc weight of 0.998, assumed constant survival and time-varying capture probability. Other models evaluated included {f)(.)p(effort)},
{ ?(time)p(time)}, f{ (time)p(effort)}, { f(.)p(.)}. The estimate for 4 was 0.937. The c estimate was higher
than the Hawai'i sightings dataset and the Alaska datasets that included semiannual sightings (Table 1), but lower than estimates based on the extremely overdispersed Alaska- Hawai'i dataset (Alaska-Hawai'i 1979-1996; see below).
Southeastern Alaska-Hawai'i, 1979-1996.-In an effort to reduce heterogeneity and remove records of whales that may not belong to the SE Alaska group of whales, datasets were produced that excluded whales seen in both Prince William Sound and SE Alaska and whales seen in Mexico and SE Alaska, and the same models were explored for the 3 different versions of this dataset (full dataset, Prince William Sound
This content downloaded from 161.55.176.36 on Mon, 29 Jun 2015 18:57:15 UTCAll use subject to JSTOR Terms and Conditions

968 JOURNAL OF MAMMALOGY Vol. 85, No. 5
0.4-
0 ,
a)
02-
P
o.0-?
- i
i 'I"
. ..
" -
010 I I 1 l... I 1 -- 0 1 2 3 4 5 6 7 8 9 10 11 12 13 14 15 16
0.4-
I
0.3- b)
a2-
0.1
0I-
0 1 2 3 4 5 6 7 8 9 20 11 12 13 14 15 16 17
2.
"0
iT .0 c E
0.1
0 .
0 1 2 3 4 5 6 7 8 9 10 11 12 13 14 15 16
Years of Stuy
FIG. 3.-Estimates of capture probabilities and population rates of increase for whales seen annually in Hawai'ian waters from 1980 to 1996, c - 2.296: a) Cormack-Jolly-Seber estimates of p, capture probability. b) Pradel estimates of p, capture probability. c) Pradel estimates of X, population rate of increase.
whales excluded, Prince William Sound and Mexico whales
excluded). The survival estimates for each dataset were nearly identical (Table 1).
Semiannual survival estimates were computed for all whales
photographed in SE Alaska, incorporating both Alaska encounters and Hawai'i encounters (if any). The results
presented here are from the complete central North Pacific dataset. The best model (based on QAICc) for this dataset was
4(.)p(time), which estimated a constant semiannual survival rate of 0.976 (95% CI: 0.970-0.980), resulting in an annual survival rate of 0.952 (95% CI: 0.941-0.960; see Fig. 4a for a plot of capture probabilities and Appendix I for models explored). Results from the 2nd best model, the 4(area)p(time) model, indicated a Hawai'i-Alaska rate of 0.952 (95% CI: 0.942- 0.961) and an Alaska-Hawai'i rate of 1.0 (95% CI: 1.0-1.0), resulting in an annual rate of 0.952 (95% CI: 0.942-0.961).
However, the 4(area) models were demonstrated to have problems estimating 4 and p when 4 was above 0.8 and p was very low (near or at 0) for every other sighting occasion. Based on simulations computed by G. White (pers. comm.), the CJS models estimated 4 values that alternated between high and low values for each time period, even when using simulated data with a constant 4 for each period. Therefore, the CJS
0.8
0.6-- a)
0.4
0.2 A
0.0 01 5 10 15 20 25 30
Half Years of Study
0.8
b)
0.2- o To T T i
0.0 0o 1 2 3 4 5 6 7 8 9 10 11 12 13 14 15 16
p o0. -
0.4- oiti
, 1 V 1•
0.2 1
0.0 0 1 2 3 4 5 6 7 8 9 10 11 12 13 14 15 16
Years of Study
FIG. 4.-Estimates of capture probabilities for humpback whales seen in Alaska and/or Hawai'i from 1979 to 1996: a) Cormack-Jolly- Seber estimates of p, capture probabilities, by semiannual periods (dark line) and by area x effort (light line) for SE Alaska whales seen in SE Alaska and Hawai'i (c = 1.905). b) Barker estimates of p, capture probability, for whales seen in SE Alaska (primary capture session) and Hawai'i (resighting between capture session) (d = 2.006). c) Barker estimates of p, capture probability, for whales seen in Prince William Sound (primary capture session) and Hawai'i (resighting between capture session) (c = 1.569).
models were not considered the best for the Alaska-Hawai'i datasets, but results are presented for purposes of comparison.
We used Barker's model to estimate survival rates as well as capture probabilities, resighting probabilities, site fidelity, and immigration. We used the same c that we used for the CJS model, which may underestimate the heterogeneity in resight- ing probability parameters (G. White, pers. comm.). The best Barker model, based on QAICc, estimated S(.) as 0.957 (95% CI: 0.943-0.967; see Fig. 4b for a plot of capture probabilities and Appendix I for the models explored and fitted parameters). Barker's model showed a very high site fidelity (F(.) = 0.961 (95% CI: 0.914-0.983) and a relatively low immigration rate (F'(.)= 0.069 (95% CI: 0.014-0.273).
Prince William Sound-Hawai' i, 1979-1996.-Assuming geographic segregation in feeding areas in Alaska, we produced a dataset that included whales seen in Prince William Sound,
This content downloaded from 161.55.176.36 on Mon, 29 Jun 2015 18:57:15 UTCAll use subject to JSTOR Terms and Conditions

October 2004 MIZROCH ET AL.-ADULT SURVIVAL RATE OF HUMPBACK WHALES 969
incorporating Alaska encounters and Hawai'i encounters (if any), to allow for the estimation of semiannual survival. Because of problems with the CJS model (noted above), only Barker's model results are presented for Prince William Sound data.
The best Barker model, based on QAICc, estimated an S(.) of 0.984 (95% CI: 0.954-0.995; see Fig. 4c for a plot of capture probabilities; see Appendix I for the models explored and parameters fitted from the best model). Barker's model showed a lower site fidelity and more variability (wider CI) in Prince William Sound than SE Alaska, (F(.) = 0.873 [95% CI: 0.779- 0.931]) and a higher immigration rate (F'(.) = 0.180 [95% CI: 0.092-0.323]).
Alaska-Hawai'i, 1979-1996.-The most comprehensive dataset included encounter histories of whales seen in Alaska beginning in the summer of 1979 and ending in Hawai'i during the winter of 1996, the period during which most consistent sampling occurred. This dataset included whales that may have been photographed in Hawai'i only, in Alaska only, or in both regions. This dataset had the most severe overdispersion, (c 6.074), which indicates a large amount of heterogeneity in capture probabilities. This overdispersion was introduced by pooling data inappropriately (see "Discussion").
Program MARK had difficulties in computing estimates for this dataset. Due to the problems of severe overdispersion, we used only 1 model for this dataset, 4(.)p(.). The resulting estimate of semiannual survival was 0.965 (95% CI: 0.955- 0.972), which provided an annual survival rate of 0.931 (95% CI: 0.912-0.945).
DIsCUSSION
If whales from the central North Pacific stock mix in Hawai'i, the best estimate for apparent survival rate for this stock is the annual rate for Hawai'i of 0.963, as estimated by both CJS and Pradel models. However, we demonstrated that it is possible to estimate survival rates for well-sampled Alaska feeding areas by using sightings both in feeding and wintering areas. The Hawai'i annual estimate and the SE Alaska and Prince William Sound estimates are generally comparable with the North Atlantic humpback whale survival estimates from feeding areas; for example, Buckland's (1990) estimate of 0.951 (95% CI 0.929, 0.969) and Barlow and Clapham's (1997) estimate of 0.96 (SE = 0.008).
In addition, by using Pradel's model, we calculated that the population rate of increase of the central North Pacific stock of humpback whales at about 10% per year. This fits with the range of rates reported by Best (1993) for humpback whale stocks (0.088-0.144) and is close to his preferred estimate of 0.097 (95% CI: 0.06-0.13), but with a smaller confidence interval. Bannister and Hedley (2001) reported a rate of population increase of about 10% a year for humpback whales off Western Australia. In contrast, Cooke et al. (2001) estimated a rate of increase for southern right whales off Argentina at 6.9% (SE 0.7%). Right whales have a lower birth rate than humpback whales and would presumably have a lower range of population rates of increase. Hines and Nichols (2002) present
caveats regarding the use of Pradel's model, noting that certain sampling situations can cause bias in the estimation of X. Bias can be a factor if there is some level of trap response or loss on capture or if the study area expands over time. For the dataset used in this study, there is no expectation of a trap response or loss (death) on capture. Although the Hawai'i study areas varied in time, they did not appear to expand over time (although there was a pulse of sampling off Kaua'i from 1989 to 1993). Therefore, if the estimate of X is biased at all, it is likely that it is biased high.
Careful consideration must be given to stratification of the data. The analysis that used the entire dataset of all sightings of whales in Alaska and Hawai'i introduced heterogeneity (c =
6.074), presumably because many of the whales seen in Hawai'i were feeding in areas not surveyed in Alaska. The inappropriate pooling of the dataset introduced an emigra- tion effect, and the resulting estimate of survival was biased low ( = 0.931).
When the analysis was restricted to annual sightings in a feeding area, e.g., SE Alaska only, an estimate with a fairly small confidence interval was produced, (0.937 [95% CI: 0.922- 0.950]). However, the heterogeneity (c = 2.788) was higher than for all but 1 of the other datasets, and the survival estimate was much lower than the other plausible estimates. The low estimate and high heterogeneity is most likely due to inconsistent sampling across SE Alaska. In some years, sampling was broadly spread throughout the region, and in other years, sampling was restricted to smaller areas within the region.
The addition of semiannual sightings of SE Alaska whales photographed in Hawai'i reduced the effects of missing whales in Alaska due to inconsistent sampling. If we had been simply comparing estimates from the feeding area based on annual sightings, we would have wrongly assumed that the SE Alaska whales have a lower survival rate than North Atlantic humpback whales. Instead, by using Barker's model, we produced estimates for SE Alaska (0.957) and Prince William Sound (0.984) that were similar to the Hawai'i annual estimate and had lower heterogeneity.
It was demonstrated that the CJS models used to estimate 4(area) did not produce a realistic fit for this dataset. The probability of sighting a specific Alaskan whale in Hawai'i is very small because the Hawai'i population is very large in comparison with the 2 Alaska feeding areas we studied. The apparent higher survival rate during the period after feeding (migration from Alaska to Hawai'i) and lower survival rate during the period after mating and calving (Hawai'i to Alaska) was produced even when data were simulated. A test dataset was generated that had an underlying constant survival rate and a capture probability set to 0 for every other capture occasion. The simulation produced an erroneous oscillation in 4 estimates, similar to the CJS 4(area) estimates, even though the underlying 4 for the dataset was constant.
Because Barker's models use opportunistic resightings that occur between capture occasions, they were better suited to the Alaska-Hawai'i datasets, which included high capture proba- bilities in Alaska and much lower capture probabilities in Hawai'i. In addition, Barker's models allowed us to begin to
This content downloaded from 161.55.176.36 on Mon, 29 Jun 2015 18:57:15 UTCAll use subject to JSTOR Terms and Conditions

970 JOURNAL OF MAMMALOGY Vol. 85, No. 5
estimate site fidelity in feeding areas. The high site fidelity in SE Alaska (0.96) is expected, based on previous observa- tional studies (Baker et al. 1986; Calambokidis et al. 1996, 2001; Waite et al. 1999). The lower site fidelity in Prince William Sound (0.873) may indicate differential year-to-year geographical sampling. Further study of the geographic ranges of past surveys should be conducted. Because it has been previously demonstrated (Baker et al. 1986; Calambokidis et al. 1996, 2001; Waite et al. 1999) and confirmed in this analysis that there is very little exchange between feeding areas, the immigration parameters for both feeding areas may also be inflated to some degree due to likely variation in geographic sampling over the 17 years of this study.
Compilation of long-term photographic records of individuals with unique markings is a growing endeavor in marine mammal research. Our study of humpback whales shows that such efforts can be coupled to new and powerful tools for population analyses if care is taken in the definition and selection of data- sets from among the available records. The results of such coupled efforts can provide reliable estimates for key pro- cesses in the population dynamics of whales and other species. These estimates can be of both life history and management relevance.
ACKNOWLEDGMENTS
We thank J. Laake and G. White for their careful review of this and earlier manuscripts and for their timely and helpful advice while
analyzing the data. We also thank D. DeMaster, G. Duker, N. Friday, S. Moore, T. Quinn, P. Wade, J. Waite, A. York, and J. Zeh and 2 anonymous reviewers for their helpful comments. G. White also conducted simulation studies that were instrumental in demonstrating the estimation problems in the CJS model. A. Zerbini encouraged the addition of Pradel's model in this analysis. This study would not have been possible without the efforts of field staff working with each research group and others who helped analyze the fluke identification
photographs. Support for the University of Hawai'i Kewalo Basin Marine Mammal Laboratory research came from the National Science Foundation, the National Park Service, the National Marine Fisheries Service, the National Wildlife Fund, Center for Field Studies (Earthwatch), and the Dolphin Institute, as well as the many students who participated in this laboratory's 25 years of research. For assistance with Alaska fieldwork, we thank K. Krieger and B. Wing of the Alaska Fisheries Science Center's Auke Bay Laboratory, as well as J. Straley, J. and C. Greenough, K. J. Metcalf, and Biological Journeys. The Center for Whale Studies thanks the Wallace Alexander Gerbode Foundation, the David and Lucile Packard Foundation, and Center for Whale Studies members. T. Norris was instrumental in
helping with the Moss Landing Marine Lab's Kaua'i fieldwork. Glacier Bay National Park and Preserve supported data collection and analysis for their long-term study in the Glacier Bay area. The Hawai'i Whale Research Foundation thanks Captain Zodiac (of Kaua'i and Hawai'i), Sea World, Tokyo Broadcasting System, and UFO Chuting of Hawai'i for their support and funding; they also appreciate the invaluable help of research associates and volunteers. M. Dolan, S. Harkness, S. Hoy, and A. Wolman of the National Marine Mammal Laboratory made many of the photo-identification matches. All field research was conducted under scientific research permits issued by the National Marine Fisheries Service. The studies presented here were observational only, with special care taken to minimize impact on
natural behaviors. No animals were handled during the course of these studies, so all work was in compliance with the Animal and Care Use Guidelines developed by the American Society of Mammalogists (Animal Care and Use Committee 1998; http://www.mammalogy.org/ committees/index.asp).
LITERATURE CITED
AKAIKE, H. 1973. Information theory and an extension of the maximum likelihood principle. Pp. 267-281 in Proceeding of the 2nd international symposium on information theory (B. Petrov and F. Czakil, eds.). 2nd ed. Akademiai Kiado, Budapest, Hungary.
AKAIKE, H. 1985. Prediction and entropy. Pp. 1-24 in A celebration of statistics: the ISI centenary volume (A. C. Atkinson and S. E. Fienberg, eds.). Springer-Verlag, New York.
ANDERSON, D. R., AND K. P. BURNHAM. 1999. Understanding information criteria for selection among capture-recapture or ring recovery models. Bird Study 46(Suppl.):261-270.
ANDERSON, D. R., K. P. BURNHAM, AND G. C. WHITE. 1994. AIC model selection in overdispersed capture-recapture data. Ecology 75:1780-1793.
ANIMAL CARE AND USE COMMITTEE. 1998. Guidelines for the capture, handling, and care of mammals as approved by the American
Society of Mammalogists. Journal of Mammalogy 79:1416-1431. BAKER, C. S., ET AL. 1986. The migratory movement and population
structure of humpback whales (Megaptera novaeangliae) in the central and eastern North Pacific. Marine Ecology Progress Series 31:105-119.
BANNISTER, J. L., AND S. L. HEDLEY. 2001. Southern Hemisphere group IV humpback whales: their status from recent aerial survey. Memoirs of the Queensland Museum 47:587-598.
BARAFF, L. S., P. J. CLAPHAM, D. K. MATTILA, AND R. S. BOWMAN. 1991. Feeding behavior of a humpback whale in low-latitude waters. Marine Mammal Science 7:197-202.
BARKER, R. J. 1997. Joint modeling of live-recapture, tag-resight, and tag-recovery data. Biometrics 53:666-677.
BARKER, R. J., AND G. C. WHITE. 2001. Joint analysis of live and dead encounters of marked animals. Pp. 361-367 in Wildlife, land, and people: priorities for the 21st century. Proceedings of the 2nd international wildlife management congress (R. Field, R. J. Warren, H. Okarma, and P. R. Sievert, eds.). The Wildlife Society, Bethesda, Maryland.
BARLOW, J., AND P. J. CLAPHAM. 1997. A new birth-interval approach to estimating demographic parameters of humpback whales. Ecology 78:535-546.
BEST, P. B. 1993. Increase rates in severely depleted stocks of baleen whales. International Council for the Exploration of the Sea (ICES) Journal of Marine Science 50:169-186.
BROWNIE, C., D. R. ANDERSON, K. P. BURNHAM, AND D. S. ROBSON. 1985. Statistical inference from band recovery data-a handbook. 2nd ed. United States Fish and Wildlife Service Research Publication 156, Washington, D.C. 305 pp.
BUCKLAND, S. T. 1990. Estimation of survival rates from sightings of individually identifiable whales. Reports of the International Whaling Commission (Sp. Issue 12):149-153.
BURNHAM, K. P. 1993. A theory for combined analysis of ring recovery and recapture data. Pp. 199-213 in Marked individuals in the study of bird populations (J.-D. Lebreton and P. M. North, eds.). Birkhiuser Verlag, Basel, Switzerland.
BURNHAM, K. P., AND D. R. ANDERSON. 1998. Model selection and inference: a practical information-theoretic approach. Springer- Verlag, New York.
This content downloaded from 161.55.176.36 on Mon, 29 Jun 2015 18:57:15 UTCAll use subject to JSTOR Terms and Conditions

October 2004 MIZROCH ET AL.-ADULT SURVIVAL RATE OF HUMPBACK WHALES 971
BURNHAM, K. P., D. R. ANDERSON, G. C. WHITE, C. BROWNIE, AND K. H. POLLOCK. 1987. Design and analysis methods for survival experiments based on release-recapture. American Fisheries Society Monograph 5. 437 pp.
CALAMBOKIDIS, J., ET AL. 1996. Interchange and isolation of humpback whales off California and other North Pacific feeding grounds. Marine Mammal Science 12:215-226.
CALAMBOKIDIS, J., ET AL. 2001. Movements and population structure of humpback whales in the North Pacific. Marine Mammal Science 17:769-794.
CERCHIO, S., C. M. GABRIELE, T. F. NORRIS, AND L. M. HERMAN. 1998. Movements of humpback whales between Kaua'i and Hawai'i: implications for population structure and abundance estimation in the Hawai'ian Islands. Marine Ecology Progress Series 175:13-22.
COOKE, J. G., V. J. ROWNTREE, AND R. PAYNE. 2001. Estimates of demographic parameters for southern right whales (Eubalaena australis) observed off Peninsula Vald6s, Argentina. Journal of Cetacean Research and Management (Sp. Issue 2):125-132.
CORMACK, R. M. 1964. Estimates of survival from sighting of marked animals. Biometrika 51:429-438.
DARLING, J. D. 1983. Migrations, abundance and behavior of "Hawai'ian" humpback whales (Megaptera novaeangliae). Ph.D. dissertation, University of California, Santa Cruz.
DARLING, J. D., AND C. M. JURASZ. 1983. Migratory destination of North Pacific Humpback whales (Megaptera novaeangliae). Pp. 359-368 in Communication and behavior of whales. American Association for the Advancement of Science Selected Symposium 76 (R. S. Payne, ed.). Westview Press, Boulder, Colorado.
DARLING, J. D., AND D. MCSWEENEY. 1985. Observations on the
migration of North Pacific humpback whales (Megaptera novaean- gliae). Canadian Journal of Zoology 63:308-314.
FRADY, T. 1987. Workshop on humpback whale photo-identification: a summary of proceedings. University of Alaska Sea Grant Report AK-SG-87-1.
GABRIELE, C. M., ET AL. 2001. Estimating the calf mortality rate of central North Pacific humpback whales. Canadian Journal of Zoology 79:589-600.
HAMMOND, P. S., S. A. MIZROCH, AND G. P. DONOVAN (EDS.). 1990. Introduction. P. i in Individual recognition of cetaceans: use of
photo-identification and other techniques to estimate population parameters. (P. S. Hammond, S. A. Mizroch, and G. P. Donovan, eds.). Special Issue 12, International Whaling Commission, Cam- bridge, United Kingdom.
HINES, J. E., AND J. D. NICHOLS. 2002. Investigations of potential bias in the estimation of X using Pradel's (1996) model for capture-recapture data. Journal of Applied Statistics 29:573- 587.
JOLLY, G. M. 1965. Explicit estimates from capture-recapture data with both death and immigration stochastic model. Biometrika 52:225-247.
LEBRETON, J. D., K. P. BURNHAM, J. CLOBERT, AND D. R. ANDERSON. 1992. Modeling survival and testing biological hypotheses using marked animals: a unified approach with case studies. Ecological Monograph 62:67-118.
MACKINTOSH, N. A. 1965. The stocks of whales. Fishing News (Books) Ltd. London, United Kingdom.
MATHEWS, L. H. 1937. The humpback whale, Megaptera nodosa. Discovery Reports 17:7-92.
MIZROCH, S. A., J. A. BEARD, AND M. LYNDE. 1990. Computer assisted photo-identification of humpback whales. Reports of the Interna- tional Whaling Commission (Sp. Issue 12):63-70.
PACK, A. A., ET AL. 1998. Male humpback whale dies in competitive group. Marine Mammal Science 14:861-873.
PRADEL, R. 1996. Utilization of capture-mark-recapture for the study of recruitment and population growth rate. Biometrics 52: 703-709.
SEBER, G. A. F. 1965. A note on the multiple recapture census. Biometrika 52:249-259.
WAITE, J. M., ET AL. 1999. Evidence of a feeding aggregation of humpback whales (Megaptera novaeangliae) around Kodiak Island, Alaska. Marine Mammal Science 15:210-220.
WHITE, G. C., AND K. P. BURNHAM. 1999. Program MARK: survival estimation from populations of marked animals. Bird Study 46(Suppl.): 120-138.
Submitted 14 January 2003. Accepted 8 November 2003.
Associate Editor was Thomas J. O'Shea.
This content downloaded from 161.55.176.36 on Mon, 29 Jun 2015 18:57:15 UTCAll use subject to JSTOR Terms and Conditions
972 JOURNAL OF MAMMALOGY Vol. 85, No. 5
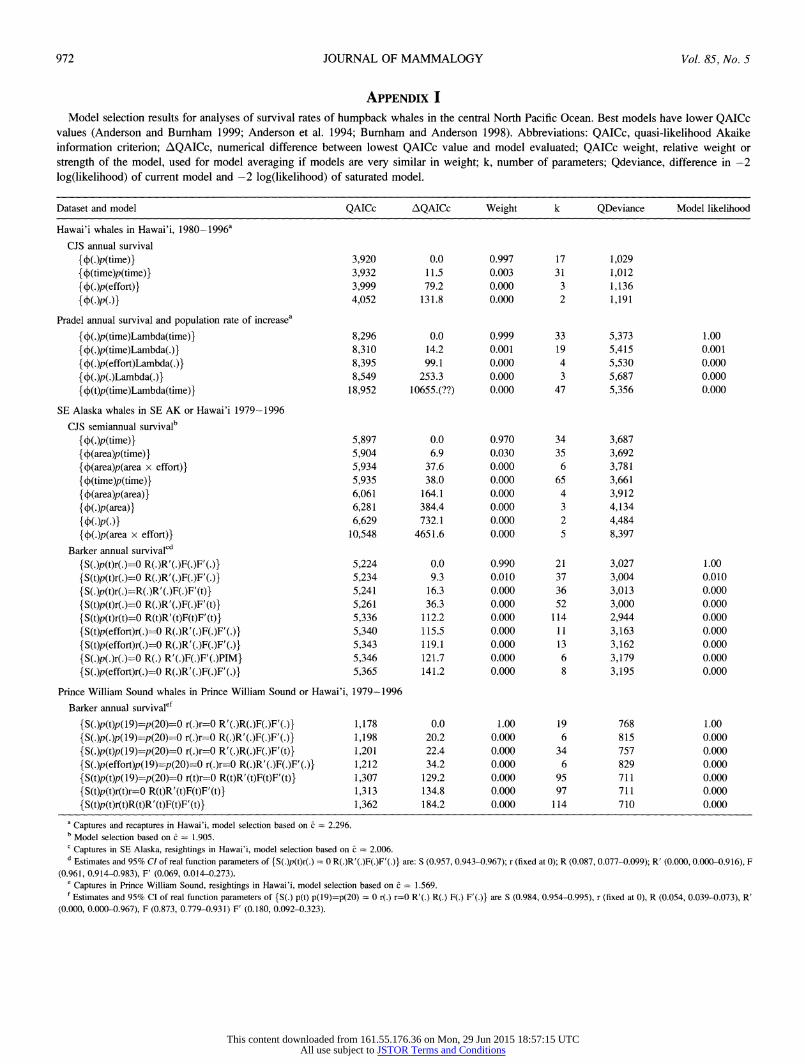
APPENDIX I Model selection results for analyses of survival rates of humpback whales in the central North Pacific Ocean. Best models have lower QAICc
values (Anderson and Burnham 1999; Anderson et al. 1994; Burnham and Anderson 1998). Abbreviations: QAICc, quasi-likelihood Akaike information criterion; AQAICc, numerical difference between lowest QAICc value and model evaluated; QAICc weight, relative weight or strength of the model, used for model averaging if models are very similar in weight; k, number of parameters; Qdeviance, difference in -2 log(likelihood) of current model and -2 log(likelihood) of saturated model.
Dataset and model QAICc AQAICc Weight k QDeviance Model likelihood
Hawai'i whales in Hawai'i, 1980-1996'
CJS annual survival
{ f(.)p(time)} 3,920 0.0 0.997 17 1,029 { f(time)p(time)} 3,932 11.5 0.003 31 1,012 { f(.)p(effort)} 3,999 79.2 0.000 3 1,136 { (.)p(.)} 4,052 131.8 0.000 2 1,191
Pradel annual survival and population rate of increasea
{f(.)p(time)Lambda(time)} 8,296 0.0 0.999 33 5,373 1.00
{f(.)p(time)Lambda(.)} 8,310 14.2 0.001 19 5,415 0.001
{f(.)p(effort)Lambda(.)} 8,395 99.1 0.000 4 5,530 0.000
{f(.)p(.)Lambda(.)} 8,549 253.3 0.000 3 5,687 0.000
{f (t)p(time)Lambda(time)} 18,952 10655.(??) 0.000 47 5,356 0.000
SE Alaska whales in SE AK or Hawai'i 1979-1996 CJS semiannual survivalb
{ (.)p(time)} 5,897 0.0 0.970 34 3,687 { f(area)p(time)} 5,904 6.9 0.030 35 3,692 { f(area)p(area x effort)} 5,934 37.6 0.000 6 3,781 { f(time)p(time)} 5,935 38.0 0.000 65 3,661 { (area)p(area)} 6,061 164.1 0.000 4 3,912 { (.)p(area)} 6,281 384.4 0.000 3 4,134
{ (.)p(.)} 6,629 732.1 0.000 2 4,484 { (.)p(area x effort)} 10,548 4651.6 0.000 5 8,397
Barker annual survivalcd
{ S(.)p(t)r(.)=0 R(.)R'(.)F(.)F'(.)} 5,224 0.0 0.990 21 3,027 1.00
{S(t)p(t)r(.)=O R(.)R'(.)F(.)F'(.)} 5,234 9.3 0.010 37 3,004 0.010
{ S(.)p(t)r(.)=R(.)R'(.)F(.)F'(t) } 5,241 16.3 0.000 36 3,013 0.000
{ S(t)p(t)r(.)=0 R(.)R'(.)F(.)F'(t)} 5,261 36.3 0.000 52 3,000 0.000
{S(t)p(t)r(t)=0 R(t)R'(t)F(t)F'(t)} 5,336 112.2 0.000 114 2,944 0.000
{S(t)p(effort)r(.)=0 R(.)R'(.)F(.)F'(.)} 5,340 115.5 0.000 11 3,163 0.000
{S(t)p(effort)r(.)=0 R(.)R'(.)F(.)F'(.)} 5,343 119.1 0.000 13 3,162 0.000
{S(.)p(.)r(.)=0 R(.) R'(.)F(.)F'(.)PIM} 5,346 121.7 0.000 6 3,179 0.000
{ S(.)p(effort)r(.)=0 R(.)R'(.)F(.)F'(.)} 5,365 141.2 0.000 8 3,195 0.000
Prince William Sound whales in Prince William Sound or Hawai'i, 1979-1996
Barker annual survivalef
{S(.)p(t)p(19)=p(20)=0 r(.)r=0 R'(.)R(.)F(.)F'(.)} 1,178 0.0 1.00 19 768 1.00
{S(.)p(.)p(19)=p(20)=0 r(.)r=0 R(.)R'(.)F(.)F'(.)} 1,198 20.2 0.000 6 815 0.000
{ S(.)p(t)p(19)=p(20)=0 r(.)r=0 R'(.)R(.)F(.)F'(t)} 1,201 22.4 0.000 34 757 0.000
{S(.)p(effort)p(19)=p(20)=0 r(.)r=0 R(.)R'(.)F(.)F'(.)} 1,212 34.2 0.000 6 829 0.000
{S(t)p(t)p(19)=p(20)=0 r(t)r=0 R(t)R'(t)F(t)F'(t)} 1,307 129.2 0.000 95 711 0.000
{S(t)p(t)r(t)r=0 R(t)R'(t)F(t)F'(t)} 1,313 134.8 0.000 97 711 0.000
{ S(t)p(t)r(t)R(t)R'(t)F(t)F'(t)} 1,362 184.2 0.000 114 710 0.000
a Captures and recaptures in Hawai'i, model selection based on c = 2.296. b Model selection based on c = 1.905. c Captures in SE Alaska, resightings in Hawai'i, model selection based on c = 2.006. d Estimates and 95% CI of real function parameters of {S(.)p(t)r(.) = 0 R(.)R'(.)F(.)F'(.)} are: S (0.957, 0.943-0.967); r (fixed at 0); R (0.087, 0.077-0.099); R' (0.000, 0.000-0.916), F
(0.961, 0.914-0.983), F' (0.069, 0.014-0.273). e
Captures in Prince William Sound, resightings in Hawai'i, model selection based on = 1.569.
f Estimates and 95% CI of real function parameters of {S(.) p(t) p(19)=p(20) = 0 r(.) r=0 R'(.) R(.) F(.) F'(.)} are S (0.984, 0.954-0.995), r (fixed at 0), R (0.054, 0.039-0.073), R' (0.000, 0.000-0.967), F (0.873, 0.779-0.931) F' (0.180, 0.092-0.323).
This content downloaded from 161.55.176.36 on Mon, 29 Jun 2015 18:57:15 UTCAll use subject to JSTOR Terms and Conditions
Related Documents