Journal of Informetrics 8 (2014) 181–196 Contents lists available at ScienceDirect Journal of Informetrics j ourna l h o mepa ge: www.elsevier.com/locate/joi Estimating the accuracies of journal impact factor through bootstrap Kuan-Ming Chen a , Tsung-Hau Jen a,∗ , Margaret Wu b a Science Education Center, National Taiwan Normal University, No. 88, 4th Section, Ting-Chou Road, Wen-Shan District, Taipei City 11677, Taiwan, ROC b Work-based Education Research Centre (WERC), Victoria Institute for Education, Diversity and Lifelong Learning, Victoria University, PO Box 14428, Melbourne, VIC 8001, Australia a r t i c l e i n f o Article history: Received 29 May 2013 Received in revised form 18 November 2013 Accepted 20 November 2013 Keywords: Bootstrap Journal impact factor Error estimation Education Citation index a b s t r a c t The journal impact factor (JIF) reported in journal citation reports has been used to represent the influence and prestige of a journal. Whereas the consideration of the stochastic nature of a statistic is a prerequisite for statistical inference, the estimation of JIF uncertainty is necessary yet unavailable for comparing the impact among journals. Using journals in the Database of Research in Science Education (DoRISE), the current study proposes bootstrap methods to estimate the JIF variability. The paper also provides a comprehensive exposition of the sources of JIF variability. The collections of articles in the year of interest and in the preceding years both contribute to JIF variability. In addition, the variability estimate differs depending on the way a database selects its journals for inclusion. In the bootstrap process, the nested structure of articles in a journal was accounted for to ensure that each bootstrap replication reflects the actual citation characteristics of articles in the journal. In conclusion, the proposed point and interval estimates of the JIF statistic are obtained and more informative inferences on the impact of journals can be drawn. © 2013 Elsevier Ltd. All rights reserved. 1. Introduction The idea that citation frequency measures the impact of a journal dates back nearly 60 years ago (Garfield, 1955). Since 1975, the journal impact factor (JIF) reported in the Science Citation Index (SCI) has been used to represent the influence and prestige of a journal (Garfield, 1999). The 2-year and 5-year JIFs indicate the mean citation rate across articles of a journal in the two and five preceding years, respectively. The JIF obtained in this way is an average citation rate per article and allows comparison among journals regardless of the total number of articles published by a journal. However, from a statistical perspective, any measurement comes with variability or uncertainty, and this variability must be considered to make comparison or draw inferences (Greenwood, 2007; Leydesdorff, 2013; Schneider, 2013). To date, advanced statistical techniques on high-speed computers are readily accessible; therefore, the current study utilized the bootstrap method (Efron & Tibshirani, 1993) to estimate the average JIF with confidence interval (CI) and standard error (SE) for a journal. Furthermore, taking both the JIF definition and the characteristics of database into consideration, the sources underlying JIF variability are separately examined. A number of concerns about JIF has been brought about by researchers, which mainly focused on the merits and disad- vantages of using JIF (e.g., Abramo, D’Angelo, & Di Costa, 2010; Buela-Casal, Perakakis, Taylor, & Checa, 2006; Fassoulaki, ∗ Corresponding author. Tel.: +886 2 77346773; fax: +886 2 29327187. E-mail addresses: [email protected] (K.-M. Chen), [email protected], [email protected] (T.-H. Jen), [email protected] (M. Wu). 1751-1577/$ – see front matter © 2013 Elsevier Ltd. All rights reserved. http://dx.doi.org/10.1016/j.joi.2013.11.007

Welcome message from author
This document is posted to help you gain knowledge. Please leave a comment to let me know what you think about it! Share it to your friends and learn new things together.
Transcript

Eb
Ka
1b
P
ARR1A
KBJEEC
1
1ajasmt(Fv
v
w
1h
Journal of Informetrics 8 (2014) 181– 196
Contents lists available at ScienceDirect
Journal of Informetrics
j ourna l h o mepa ge: www.elsev ier .com/ locate / jo i
stimating the accuracies of journal impact factor throughootstrap
uan-Ming Chena, Tsung-Hau Jena,∗, Margaret Wub
Science Education Center, National Taiwan Normal University, No. 88, 4th Section, Ting-Chou Road, Wen-Shan District, Taipei City1677, Taiwan, ROCWork-based Education Research Centre (WERC), Victoria Institute for Education, Diversity and Lifelong Learning, Victoria University,O Box 14428, Melbourne, VIC 8001, Australia
a r t i c l e i n f o
rticle history:eceived 29 May 2013eceived in revised form8 November 2013ccepted 20 November 2013
eywords:ootstrap
ournal impact factorrror estimationducationitation index
a b s t r a c t
The journal impact factor (JIF) reported in journal citation reports has been used to representthe influence and prestige of a journal. Whereas the consideration of the stochastic natureof a statistic is a prerequisite for statistical inference, the estimation of JIF uncertainty isnecessary yet unavailable for comparing the impact among journals. Using journals in theDatabase of Research in Science Education (DoRISE), the current study proposes bootstrapmethods to estimate the JIF variability. The paper also provides a comprehensive expositionof the sources of JIF variability. The collections of articles in the year of interest and inthe preceding years both contribute to JIF variability. In addition, the variability estimatediffers depending on the way a database selects its journals for inclusion. In the bootstrapprocess, the nested structure of articles in a journal was accounted for to ensure that eachbootstrap replication reflects the actual citation characteristics of articles in the journal. Inconclusion, the proposed point and interval estimates of the JIF statistic are obtained andmore informative inferences on the impact of journals can be drawn.
© 2013 Elsevier Ltd. All rights reserved.
. Introduction
The idea that citation frequency measures the impact of a journal dates back nearly 60 years ago (Garfield, 1955). Since975, the journal impact factor (JIF) reported in the Science Citation Index (SCI) has been used to represent the influencend prestige of a journal (Garfield, 1999). The 2-year and 5-year JIFs indicate the mean citation rate across articles of aournal in the two and five preceding years, respectively. The JIF obtained in this way is an average citation rate per articlend allows comparison among journals regardless of the total number of articles published by a journal. However, from atatistical perspective, any measurement comes with variability or uncertainty, and this variability must be considered toake comparison or draw inferences (Greenwood, 2007; Leydesdorff, 2013; Schneider, 2013). To date, advanced statistical
echniques on high-speed computers are readily accessible; therefore, the current study utilized the bootstrap methodEfron & Tibshirani, 1993) to estimate the average JIF with confidence interval (CI) and standard error (SE) for a journal.urthermore, taking both the JIF definition and the characteristics of database into consideration, the sources underlying JIF
ariability are separately examined.A number of concerns about JIF has been brought about by researchers, which mainly focused on the merits and disad-antages of using JIF (e.g., Abramo, D’Angelo, & Di Costa, 2010; Buela-Casal, Perakakis, Taylor, & Checa, 2006; Fassoulaki,
∗ Corresponding author. Tel.: +886 2 77346773; fax: +886 2 29327187.E-mail addresses: [email protected] (K.-M. Chen), [email protected], [email protected] (T.-H. Jen),
[email protected] (M. Wu).
751-1577/$ – see front matter © 2013 Elsevier Ltd. All rights reserved.ttp://dx.doi.org/10.1016/j.joi.2013.11.007
182 K.-M. Chen et al. / Journal of Informetrics 8 (2014) 181– 196
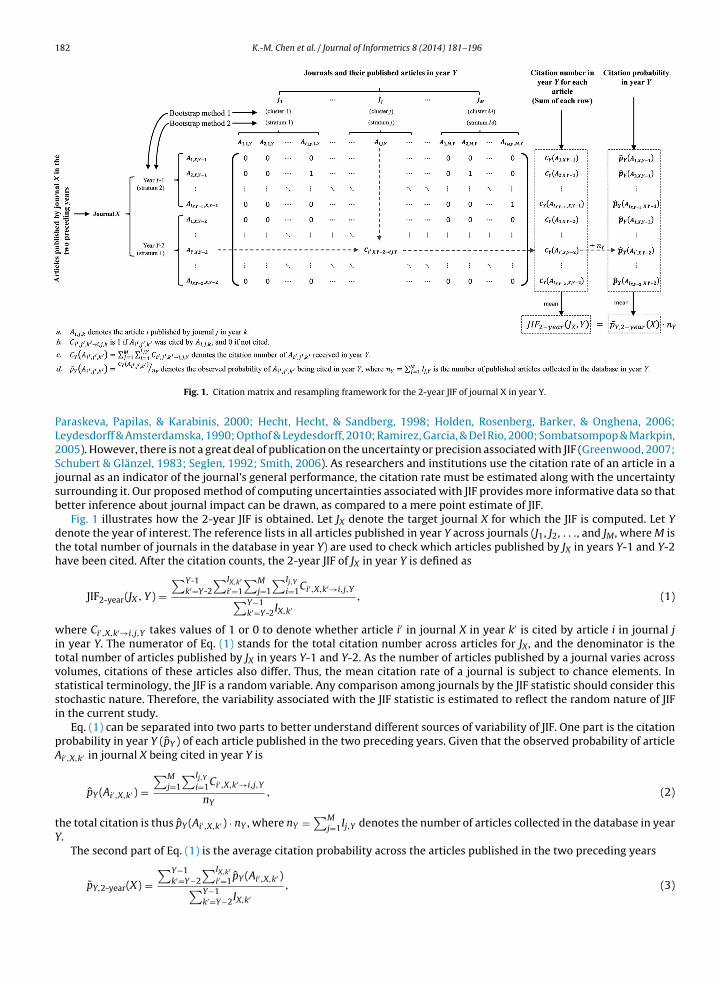
Fig. 1. Citation matrix and resampling framework for the 2-year JIF of journal X in year Y.
Paraskeva, Papilas, & Karabinis, 2000; Hecht, Hecht, & Sandberg, 1998; Holden, Rosenberg, Barker, & Onghena, 2006;Leydesdorff & Amsterdamska, 1990; Opthof & Leydesdorff, 2010; Ramirez, Garcia, & Del Rio, 2000; Sombatsompop & Markpin,2005). However, there is not a great deal of publication on the uncertainty or precision associated with JIF (Greenwood, 2007;Schubert & Glänzel, 1983; Seglen, 1992; Smith, 2006). As researchers and institutions use the citation rate of an article in ajournal as an indicator of the journal’s general performance, the citation rate must be estimated along with the uncertaintysurrounding it. Our proposed method of computing uncertainties associated with JIF provides more informative data so thatbetter inference about journal impact can be drawn, as compared to a mere point estimate of JIF.
Fig. 1 illustrates how the 2-year JIF is obtained. Let JX denote the target journal X for which the JIF is computed. Let Ydenote the year of interest. The reference lists in all articles published in year Y across journals (J1, J2, . . ., and JM, where M isthe total number of journals in the database in year Y) are used to check which articles published by JX in years Y-1 and Y-2have been cited. After the citation counts, the 2-year JIF of JX in year Y is defined as
JIF2-year(JX , Y) =∑Y-1
k′=Y-2
∑IX,k′i′=1
∑Mj=1
∑Ij,Yi=1Ci′,X,k′→i,j,Y∑Y−1
k′=Y-2IX,k′, (1)
where Ci′,X,k′→i,j,Y takes values of 1 or 0 to denote whether article i′ in journal X in year k′ is cited by article i in journal jin year Y. The numerator of Eq. (1) stands for the total citation number across articles for JX, and the denominator is thetotal number of articles published by JX in years Y-1 and Y-2. As the number of articles published by a journal varies acrossvolumes, citations of these articles also differ. Thus, the mean citation rate of a journal is subject to chance elements. Instatistical terminology, the JIF is a random variable. Any comparison among journals by the JIF statistic should consider thisstochastic nature. Therefore, the variability associated with the JIF statistic is estimated to reflect the random nature of JIFin the current study.
Eq. (1) can be separated into two parts to better understand different sources of variability of JIF. One part is the citationprobability in year Y (p̂Y ) of each article published in the two preceding years. Given that the observed probability of articleAi′,X,k′ in journal X being cited in year Y is
p̂Y (Ai′,X,k′ ) =∑M
j=1
∑Ij,Yi=1Ci′,X,k′→i,j,Y
nY, (2)
the total citation is thus p̂Y (Ai′,X,k′ ) · nY , where nY = ∑Mj=1Ij,Y denotes the number of articles collected in the database in year
Y.The second part of Eq. (1) is the average citation probability across the articles published in the two preceding years
p̄Y,2-year(X) =∑Y−1
k′=Y−2
∑IX,k′i′=1p̂Y (Ai′,X,k′ )∑Y−1
k′=Y−2IX,k′, (3)

a
Tp
HeiCultapmrmi
aspwpo‘rajt
esT
2
Tsa
tic
dta
2
A5t4y
K.-M. Chen et al. / Journal of Informetrics 8 (2014) 181– 196 183
nd
JIF2-year(JX , Y) = p̄Y,2-year(X) · nY . (4)
herefore, p̂Y (Ai′,X,k′ ) forms the kernel of p̄Y,2-year estimation, and p̄Y,2-year further considers the collection of articles in thereceding years. Accordingly, different sources of variability can have effects on the values of p̂Y and p̄Y .
Historical data could be used to estimate the probability distribution of JIF for a journal so that the variability is obtained.owever, it is impractical to collect such a large amount of data of a database for several decades, especially for a newlystablished database or for a new journal. Alternatives have been developed to estimate the uncertainty of bibliometricndices. Greenwood (2007) fitted a random effects Poisson model within a Bayesian framework using Markov chain Montearlo method to estimate the 95% credible intervals of JIFs and JIF ranks. Baccini, Barabesi, Marcheselli, and Pratelli (2012)sed a survival function to simulate individual authors’ expected h-index and their associated variability on the basis of
ikelihood function and the empirical distribution of citation rates of articles published by the authors. With both studies,he parametric distributions about the citation per article published by the target journal or by the author must be made
priori. In addition, the citation variability caused by using different databases and the nested structure of articles in theirublishing journals or in publishing years were overlooked. Nevertheless, these studies all have the common view that theeasure of uncertainty along with the point estimate should be considered. Therefore, in the current study an empirical
esampling method known as bootstrap (Efron & Tibshirani, 1993) is adopted to estimate the uncertainty of JIF. The bootstrapethod relies less on the parametric assumptions. In addition, our study takes into account the stochastic nature of the JIF
n relation to the nested structure of articles in journals and the mechanisms of collecting journals in a database.With the bootstrap method, the articles of a journal published in year Y and in the preceding years can be regarded as
sample of the candidate articles of the journal because “Any journal in effect takes a small, biased sample (biased in thatubjective selection criteria are involved) of articles from a finite but large pool of articles” (Amin & Mabe, 2000, p. 4). Therocess of publishing an article, based on different publication criteria among journals, has chance elements, depending onho submits which article to which journal to be reviewed by whom and when articles are published. The wait-time forublication for accepted articles varies and is generally unrelated to the impact of an article. Thus, the mean citation ratef a journal is subject to sampling error to a large extent (Greenwood, 2007). In addition, in the current study the nature of
biased sampling’ is taken care of by treating articles in a journal as a cluster or as stratified samples rather than as simpleandom samples. Accordingly, journals and their published articles in a database are repetitively sampled with replacement,nd each sample simulates the collection of journals and their published articles for a year. The JIF is then computed for eachournal within each sample. Through resampling multiple times, a distribution of JIFs for each journal is obtained; therebyhe variability of JIF of the journal can be estimated.
The Database of Research in Science Education (DoRISE, http://dorise.sec.ntnu.edu.tw/main/), including 79 journals ofducation and science education published in Taiwan, ROC, was used for demonstrating the bootstrap methods. DoRISE,imilar to the SCI and SSCI databases, was established with informatics techniques suitable for computerized analysis.herefore, the method demonstrated with DoRISE in the current study is applicable to other similar databases.
. Method
To compute confidence intervals for JIF estimates, sampling distributions of the JIF statistics need to be established.o build these sampling distributions, we use a resampling procedure called bootstrap. There are two separate parts inimulating the citation rates of journal articles. The first part involves the sampling of articles that cite previously publishedrticles. The second part involves the sampling of articles that are being cited.
The first part of the sampling process begins with the choice of a database to determine the sample set of journals andheir articles in year Y (i.e., nY articles) that cite previously published articles. The second part of the sampling procedurenvolves sampling articles of the target journal in the preceding years and determining whether these sampled articles areited by nY articles sampled in the first part of the sampling procedure.
Different samples of nY articles lead to differences in the citation rate of the articles of the target journal. Similarly,ifferent samples of articles sampled from the target journal have different rates of being cited by nY articles. Therefore,hrough the two sampling procedures, the sources of variability of the JIF statistic come from sampling the articles in year Ynd the articles of target journal in the preceding years. These two sampling parts are simulated using the bootstrap method.
.1. Data source
Articles of 79 journals in DoRISE from years 2006 to 2011 were analyzed (see Appendix A for a complete listing of journals).s some journals did not publish over the whole period under study, the number of journals varied between the 2-year and
-year JIFs. For the 2011 2-year JIFs, 41,905 references of 1201 articles across 73 journals in year 2011 were used to counthe citation among 2541 articles across 73 journals published in years 2009 and 2010. For the 2011 5-year JIFs, the identical1,905 references were used to count the citation among 5641 articles across 62 journals published in the five precedingears (2006–2010). In the subsequent analysis, a random ID was assigned to each journal for the anonymity of journals.
184 K.-M. Chen et al. / Journal of Informetrics 8 (2014) 181– 196
2.2. Method: bootstrap
In statistics, we are often interested in population parameter � = t(P), where P denotes the population data of interest andt a function of the population data. However, population data are typically inaccessible; therefore, representative samplesare drawn from the population. Through sampling, �̂ = s(x) is obtained, where �̂ is the sample statistic and x is the sampledata. The central limit theorem is generally used to obtain the sampling distribution of �̂ and the accuracy in estimatingthe population parameter �, assuming that observations are independently and identically distributed random variables.However, in the case of JIF, the assumptions are not satisfied because self-citations within research groups or mutual citationsamong articles in similar disciplines exist, suggesting a dependency among observations. The bootstrap method requiresno such parametric assumptions and, therefore, is suitable for estimating the uncertainty of JIF, especially with complexsampling procedures in that articles are published by a journal and there is a nested structure between articles and journals.
According to the plug-in principle (Efron & Tibshirani, 1993; Efron, 2003), the CI of �̂ is obtained by the sampling distri-bution of �̂∗ − �̂ instead of the distribution of �̂ − �, where �̂∗ is the statistic from each bootstrapped sample. In our study, �̂denotes a reported JIF of any journal in DoRISE. Essentially, the bootstrap samples of JIF should follow the sampling frame(Efron, 2003; Pons, 2007) to retain the link between articles and their publishing journals in a database. Because the citationrates of an article differ from year to year (Marx & Cardona, 2003), this year-to-year fluctuation at the article-level furtheradds to the JIF variability at the journal-level. Accordingly, the articles of a journal are sampled by treating years as strata.Assume that journal X remains in the database from year Y-n to year Y; the variability of n-year JIF for journal X in year Yis estimated by resampling both the articles published by journal X in the n preceding years year-by-year and the articleswithin each journal in year Y. Every time after an article of journal X in the n preceding years was sampled, the articlesin year Y were also sampled. It should be noted that different databases have different procedures for recruiting journals.Therefore, in the current study we propose two bootstrap methods for the two cases of journal inclusion in a database. Thefirst case assumes that the collection of journals in a database is a random sample of journals from a population of journals.The second case assumes that the collection of journals represents the population of journals and remains the same fromone year to another. As a matter of fact, the inclusion of journals in a database is likely to be in-between these two cases.
2.2.1. Bootstrap method 1If journals in a database are a random part of the population of journals and the articles of a journal can be treated as a
sample of candidate articles to be published in the journal, the JIF variability comes from both the samplings of the articlespublished by the target journal and the articles used to count the citation of articles published by the target journal. Therefore,not only the articles published by the target journal in the n preceding years need to be resampled by treating the publishingyears as strata, but also the articles and journals published in year Y need to be resampled based on a two-stage clustersampling procedure to retain the nested structure of articles in a journal. First, the journals were randomly sampled withreplacement, and the sample sizes were the total numbers of journals collected in the database in year Y. Second, articleswere randomly sampled with replacement from the articles of each previously sampled journal, and the sample size wasthe total number of articles of that journal.
The sampling procedure of articles in year Y was repeated for each sampled article of journal X in the n precedingyears. The citation number was computed based on whether an article sampled in the n preceding years was cited by thesampled articles of each sampled journal in year Y. The sampling procedure was then repeated until the number of articlessampled year-by-year in the n preceding years was equal to the total number of articles in journal X, rendering one bootstrapreplication. For each target journal, 1500 bootstrap replications were obtained.
2.2.2. Bootstrap method 2If journals in a database are treated as the population per se, the JIF variability will only arise from the articles within each
journal and not from the collection of journals since the collection does not change. Therefore, the procedure of bootstrapmethod 2 is the same as in method 1 except that all the journals in the database in year Y are used without sampling, whereasthe articles within each journal are resampled with replacement. For each target journal, 1500 bootstrap replications wereobtained.
2.3. Data analysis
Two sampling distributions of JIF resulted from 1500 replications from each of the two bootstrap methods for each journalin DoRISE. The 2-year and 5-year JIFs with their SEs and 95% CIs for 2011 were reported. The 95% CI was taken as the lowerand upper endpoints where 95% of the distribution lies in-between (Efron & Tibshirani, 1993).
The percentile CI ensures non-negative endpoints of CI, as JIF is between 0 and nY, being the citation rates of journalarticles. Consequently, the bootstrapped values of JIF are not normally distributed. However, the nonparametric percentile
method provides confidence intervals for a population mean (i.e., average citation number) with coverage error to the orderof n−1s , where ns is the sample size (Efron, 1981; Gross & Lai, 1996). Therefore, even though the bootstrapped JIFs are notnormally distributed the 95% percentile intervals could still be adequate estimates of the 95% confidence intervals due tolarge sample size.
K.-M. Chen et al. / Journal of Informetrics 8 (2014) 181– 196 185
(a)
(b)
0.00
0.20
0.40
0.60
0.80
1.00
1.20
1.40
1.60J0
45
J09
8J1
08
J10
9J1
13
J12
0J1
37
J14
1J1
48
J14
9J1
51
J12
7J0
95
J10
0J0
72
J08
4J0
87
J15
0J1
44
J09
7J1
06
J11
8J0
38
J09
2J1
32
J07
1J0
02
J13
1J1
38
J00
3J0
80
J01
3J1
03
J14
2J1
17
J12
5J0
86
J02
5J0
67
J10
4J0
81
J12
6J1
29
J04
4J1
43
J08
3J1
47
J02
4J1
19
J08
5J0
58
J10
7J0
43
J08
8J1
12
J04
2J0
22
J07
3J1
10
J11
4J0
39
J00
6J0
66
J06
5J0
60
J09
1J0
94
J04
1J0
77
J07
5J0
90
J06
1J0
79
0.00
0.20
0.40
0.60
0.80
1.00
1.20
1.40
1.60
J14
8
J15
1
J10
8
J14
1
J08
7
J10
9
J13
7
J14
4
J11
8
J14
9
J07
2
J11
3
J00
2
J00
3
J13
2
J08
5
J10
6
J07
1
J14
7
J08
4
J13
1
J12
7
J11
9
J02
5
J11
7
J09
7
J14
2
J14
3
J08
6
J12
6
J10
4
J06
7
J08
1
J03
8
J12
5
J04
4
J11
2
J15
0
J09
8
J11
0
J07
3
J10
3
J04
5
J02
4
J10
7
J03
9
J11
4
J00
6
J06
6
J08
8
J09
1
J06
0
J04
3
J01
3
J05
8
J04
1
J06
5
J04
2
J09
4
J07
5
J06
1
J09
0
Fb
o
3
rerpjbmtlD
d
3
np
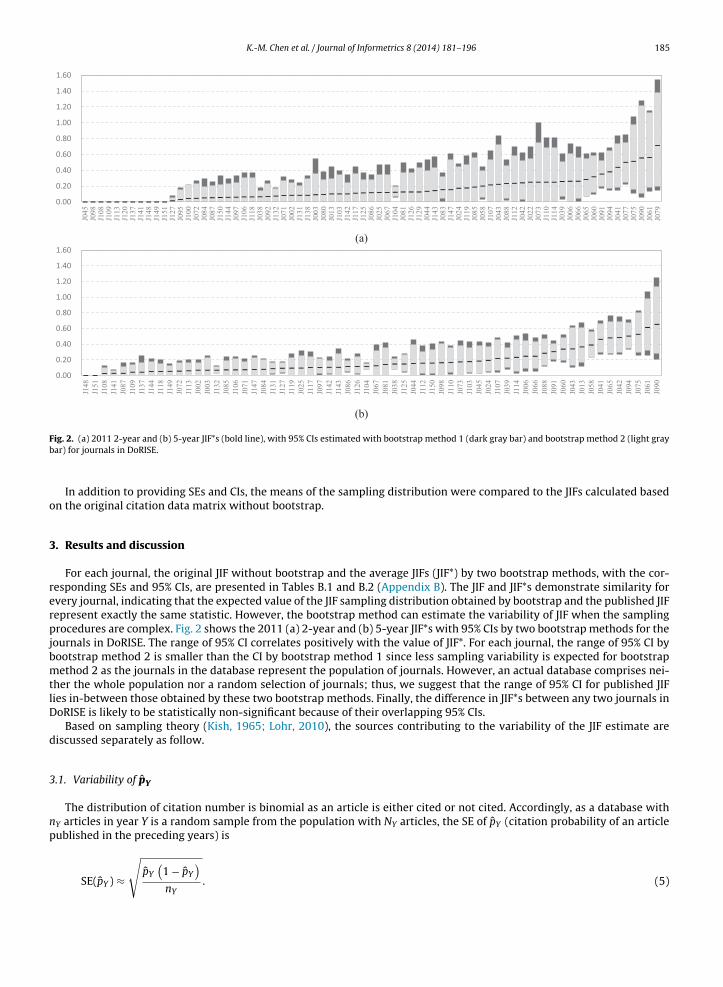
ig. 2. (a) 2011 2-year and (b) 5-year JIF*s (bold line), with 95% CIs estimated with bootstrap method 1 (dark gray bar) and bootstrap method 2 (light grayar) for journals in DoRISE.
In addition to providing SEs and CIs, the means of the sampling distribution were compared to the JIFs calculated basedn the original citation data matrix without bootstrap.
. Results and discussion
For each journal, the original JIF without bootstrap and the average JIFs (JIF*) by two bootstrap methods, with the cor-esponding SEs and 95% CIs, are presented in Tables B.1 and B.2 (Appendix B). The JIF and JIF*s demonstrate similarity forvery journal, indicating that the expected value of the JIF sampling distribution obtained by bootstrap and the published JIFepresent exactly the same statistic. However, the bootstrap method can estimate the variability of JIF when the samplingrocedures are complex. Fig. 2 shows the 2011 (a) 2-year and (b) 5-year JIF*s with 95% CIs by two bootstrap methods for the
ournals in DoRISE. The range of 95% CI correlates positively with the value of JIF*. For each journal, the range of 95% CI byootstrap method 2 is smaller than the CI by bootstrap method 1 since less sampling variability is expected for bootstrapethod 2 as the journals in the database represent the population of journals. However, an actual database comprises nei-
her the whole population nor a random selection of journals; thus, we suggest that the range of 95% CI for published JIFies in-between those obtained by these two bootstrap methods. Finally, the difference in JIF*s between any two journals inoRISE is likely to be statistically non-significant because of their overlapping 95% CIs.
Based on sampling theory (Kish, 1965; Lohr, 2010), the sources contributing to the variability of the JIF estimate areiscussed separately as follow.
.1. Variability of p̂Y
The distribution of citation number is binomial as an article is either cited or not cited. Accordingly, as a database withY articles in year Y is a random sample from the population with NY articles, the SE of p̂Y (citation probability of an articleublished in the preceding years) is√
p̂Y
(1 − p̂Y
)
SE(p̂Y ) ≈nY. (5)

186 K.-M. Chen et al. / Journal of Informetrics 8 (2014) 181– 196
However, in bootstrap method 1 when the journals in DoRISE are randomly sampled from a population of journals, theselected articles need to be treated as being nested within a selected journal rather than being randomly assigned to thejournal. This is a cluster sampling of articles so that the SE of p̂Y is approximately estimated as (Kish, 1965).
SEcluster(p̂Y ) ≈√
Deff ·[
p̂Y (1 − p̂Y )nY
]. (6)
Deff denotes the design effect for a cluster sampling, and with equal cluster sampling it is estimated as (Hansen, Hurwitz, &Madow, 1953)
Deff ≈ 1 + �(IY − 1), (7)
where IY is the cluster size (i.e., journal size). Mostly, the journal sizes in year Y are unequal, and IY is replaced by the weightedaveraged cluster size I′Y (Donner & Klar, 1994)
I′Y =∑M
j=1I2j,Y∑M
j=1Ij,Y. (8)
The intra-cluster correlation coefficient � is established through dividing the between-cluster variance by the sum ofthe within- and between-cluster variances. If different journals have different rates of citing an article, the � will be largeso that the variability of p̂Y will increase. For example, an article in medical education is more likely cited by articles ofjournals in medical education, but less likely by articles of journals in other disciplines, such as reading education or scienceeducation. Therefore, a larger � for this article would be expected than for another article related to all the disciplinary areasin education. Similarly, high self-citation within a journal also leads to a larger � as well as a larger SE of p̂.
Eq. (6) illustrates how the SE of p̂ for each article is influenced. First, the probability of an article to be cited (p̂Y ) is generallysmaller than .5; therefore, the p̂Y (1 − p̂Y ) is an increasing function of the citation rate (e.g., for articles in DoRISE the p̂Y rangedbetween 0.000 and 0.007). Consequently, the more probable an article of a journal is cited, the larger is its SE. Second, theSE of p̂Y is proportional to the inverse of the square root of the number of articles in a database (nY) and, when more articlesare included, SE becomes smaller. Third, articles with higher intra-journal correlation of citations (larger �) have larger SEof p̂Y and vice versa. Finally, according to Eq. (7), given the same number of articles in year Y in the database, more journals(i.e., fewer articles in each journal) included in the database will lead to a smaller SE of p̂Y than fewer journals (i.e., morearticles in each journal).
If the journals in the database are the population per se (bootstrap method 2), the journals would not contribute tosampling variability. However, since articles are published in journals, a journal forms a sampling stratum when articles aresampled. Assuming that the sample size of a stratum is proportional to the population size of that stratum, the SE of p̂Y isthus (Cochran, 1977; Jen, Tam, & Wu, 2011)
SEstratified(p̂Y ) ≈
√√√√D′eff ·
[p̂Y
(1 − p̂Y
)nY
], (9)
where the design effect D′eff for a stratified sampling procedure is
D′eff ≈ 1 − ϕ (10)
and ϕ is the ratio of between-stratum variance to the total variance. Therefore, in addition to the effects of p̂Y and nY on the SEas in bootstrap method 1, a larger ϕ indicates a larger between-stratum variance and a smaller within-stratum variance. Inthis case, for a journal in year Y, the citation status is more consistent across articles and a smaller variance of p̂Y is expected.Although journals of a database are treated as clusters in bootstrap method 1 and as strata in bootstrap method 2, the valueof � is equal to the value of ϕ. However, their effects on the variability of p̂Y differ depending on the mechanism of selectingjournals to include in a database.
3.2. Variability of p̄Y
Although the articles published in the preceding years can be treated as a sample to represent the citation of the targetjournal, the citation of articles fluctuates from one year to another. Therefore, the effect of stratification by year as opposedto random selection needs to be considered. The SE of average citation probability in year Y is (Cochran, 1977; Jen et al.,2011)
SEstratified(p̄Y ) ≈√
D′′eff · Var(p̂)
nI, (11)
wo
wsa
pwa
3
ya
dpb(i
2ft(is
CmSe
4
yswowwtdi
d
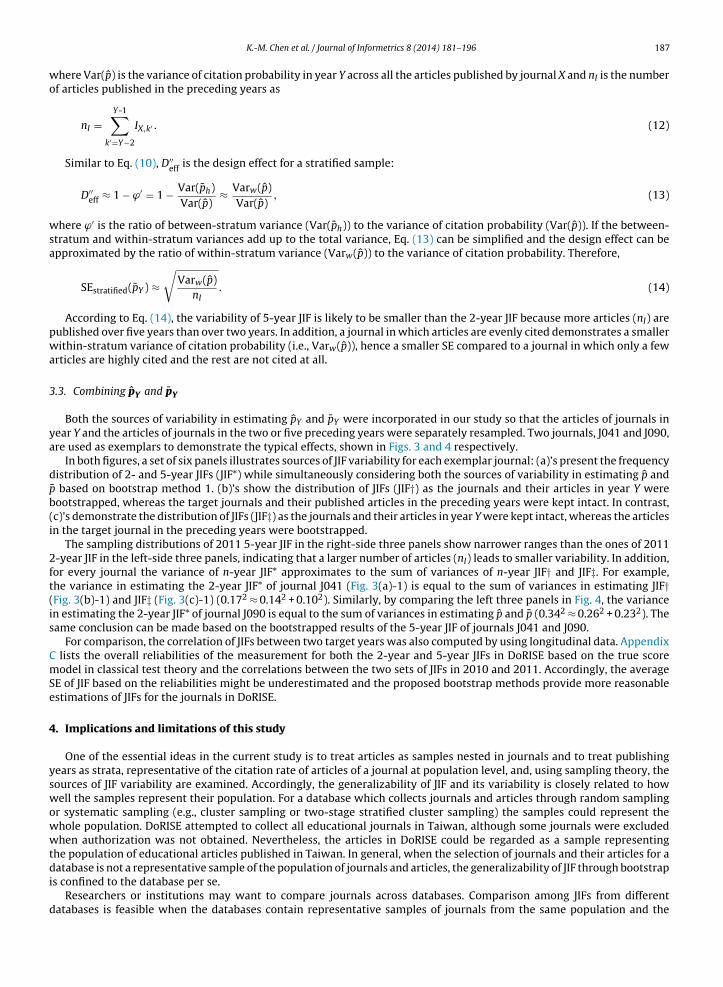
K.-M. Chen et al. / Journal of Informetrics 8 (2014) 181– 196 187
here Var(p̂) is the variance of citation probability in year Y across all the articles published by journal X and nI is the numberf articles published in the preceding years as
nI =Y-1∑
k′=Y−2
IX,k′ . (12)
Similar to Eq. (10), D′′eff is the design effect for a stratified sample:
D′′eff ≈ 1 − ϕ′ = 1 − Var(p̄h)
Var(p̂)≈ Varw(p̂)
Var(p̂), (13)
here ϕ′ is the ratio of between-stratum variance (Var(p̄h)) to the variance of citation probability (Var(p̂)). If the between-tratum and within-stratum variances add up to the total variance, Eq. (13) can be simplified and the design effect can bepproximated by the ratio of within-stratum variance (Varw(p̂)) to the variance of citation probability. Therefore,
SEstratified(p̄Y ) ≈√
Varw(p̂)nI
. (14)
According to Eq. (14), the variability of 5-year JIF is likely to be smaller than the 2-year JIF because more articles (nI) areublished over five years than over two years. In addition, a journal in which articles are evenly cited demonstrates a smallerithin-stratum variance of citation probability (i.e., Varw(p̂)), hence a smaller SE compared to a journal in which only a few
rticles are highly cited and the rest are not cited at all.
.3. Combining p̂Y and p̄Y
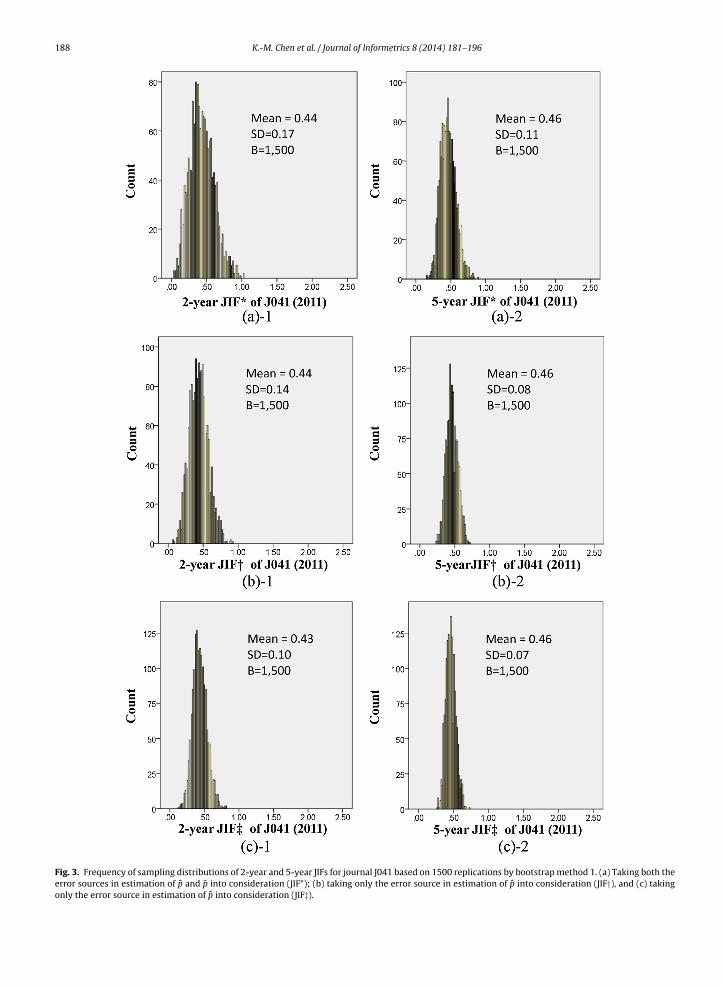
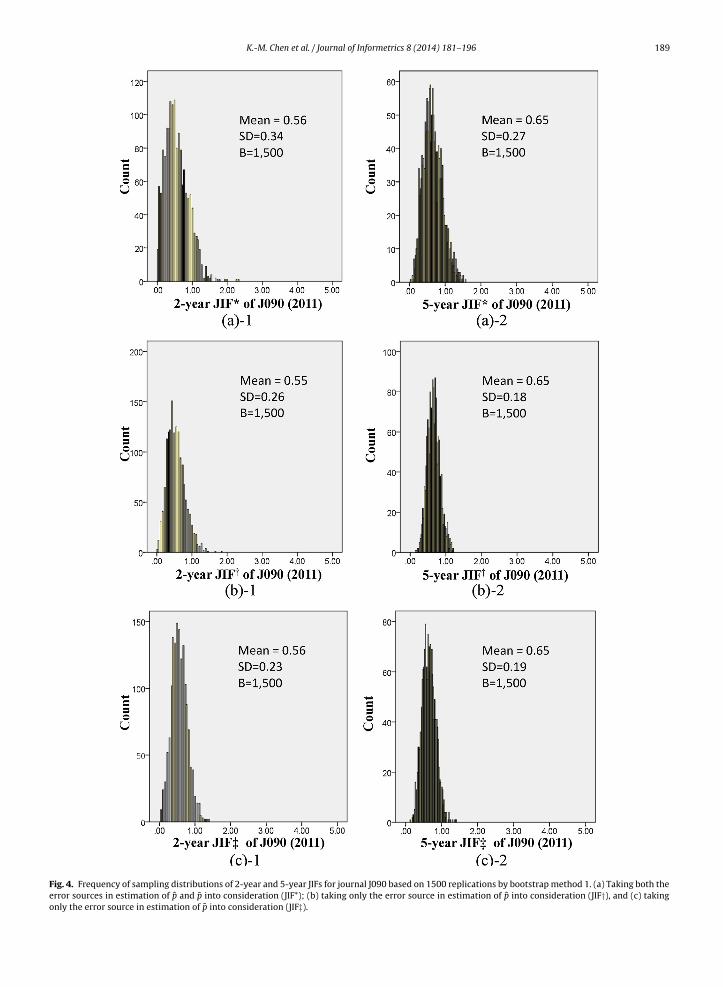
Both the sources of variability in estimating p̂Y and p̄Y were incorporated in our study so that the articles of journals inear Y and the articles of journals in the two or five preceding years were separately resampled. Two journals, J041 and J090,re used as exemplars to demonstrate the typical effects, shown in Figs. 3 and 4 respectively.
In both figures, a set of six panels illustrates sources of JIF variability for each exemplar journal: (a)’s present the frequencyistribution of 2- and 5-year JIFs (JIF*) while simultaneously considering both the sources of variability in estimating p̂ and
¯ based on bootstrap method 1. (b)’s show the distribution of JIFs (JIF†) as the journals and their articles in year Y wereootstrapped, whereas the target journals and their published articles in the preceding years were kept intact. In contrast,c)’s demonstrate the distribution of JIFs (JIF‡) as the journals and their articles in year Y were kept intact, whereas the articlesn the target journal in the preceding years were bootstrapped.
The sampling distributions of 2011 5-year JIF in the right-side three panels show narrower ranges than the ones of 2011-year JIF in the left-side three panels, indicating that a larger number of articles (nI) leads to smaller variability. In addition,or every journal the variance of n-year JIF* approximates to the sum of variances of n-year JIF† and JIF‡. For example,he variance in estimating the 2-year JIF* of journal J041 (Fig. 3(a)-1) is equal to the sum of variances in estimating JIF†Fig. 3(b)-1) and JIF‡ (Fig. 3(c)-1) (0.172 ≈ 0.142 + 0.102). Similarly, by comparing the left three panels in Fig. 4, the variancen estimating the 2-year JIF* of journal J090 is equal to the sum of variances in estimating p̂ and p̄ (0.342 ≈ 0.262 + 0.232). Theame conclusion can be made based on the bootstrapped results of the 5-year JIF of journals J041 and J090.
For comparison, the correlation of JIFs between two target years was also computed by using longitudinal data. Appendix lists the overall reliabilities of the measurement for both the 2-year and 5-year JIFs in DoRISE based on the true scoreodel in classical test theory and the correlations between the two sets of JIFs in 2010 and 2011. Accordingly, the average
E of JIF based on the reliabilities might be underestimated and the proposed bootstrap methods provide more reasonablestimations of JIFs for the journals in DoRISE.
. Implications and limitations of this study
One of the essential ideas in the current study is to treat articles as samples nested in journals and to treat publishingears as strata, representative of the citation rate of articles of a journal at population level, and, using sampling theory, theources of JIF variability are examined. Accordingly, the generalizability of JIF and its variability is closely related to howell the samples represent their population. For a database which collects journals and articles through random sampling
r systematic sampling (e.g., cluster sampling or two-stage stratified cluster sampling) the samples could represent thehole population. DoRISE attempted to collect all educational journals in Taiwan, although some journals were excludedhen authorization was not obtained. Nevertheless, the articles in DoRISE could be regarded as a sample representing
he population of educational articles published in Taiwan. In general, when the selection of journals and their articles for a
atabase is not a representative sample of the population of journals and articles, the generalizability of JIF through bootstraps confined to the database per se.Researchers or institutions may want to compare journals across databases. Comparison among JIFs from different
atabases is feasible when the databases contain representative samples of journals from the same population and the
188 K.-M. Chen et al. / Journal of Informetrics 8 (2014) 181– 196
Fig. 3. Frequency of sampling distributions of 2-year and 5-year JIFs for journal J041 based on 1500 replications by bootstrap method 1. (a) Taking both theerror sources in estimation of p̂ and p̄ into consideration (JIF*); (b) taking only the error source in estimation of p̂ into consideration (JIF†), and (c) takingonly the error source in estimation of p̄ into consideration (JIF‡).
K.-M. Chen et al. / Journal of Informetrics 8 (2014) 181– 196 189
Fig. 4. Frequency of sampling distributions of 2-year and 5-year JIFs for journal J090 based on 1500 replications by bootstrap method 1. (a) Taking both theerror sources in estimation of p̂ and p̄ into consideration (JIF*); (b) taking only the error source in estimation of p̂ into consideration (JIF†), and (c) takingonly the error source in estimation of p̄ into consideration (JIF‡).
190 K.-M. Chen et al. / Journal of Informetrics 8 (2014) 181– 196
JIFs are normalized to the same scale. Accordingly, the JIF of a journal from a database in Taiwan is not necessarily compara-ble with journals from outside of Taiwan. In addition, as a multiplier of p̄Y in Eq. (4), the number of articles published in thetarget year in the database (nY) could be a scaling factor that varies across databases. Therefore, p̄Y as the potential citationprobability could be a better index than JIF for the comparison of impact among journals across databases.
Various publishing practices render differences in citation patterns, and therefore journals with identical JIF differ inimpact regarding their subject fields (Dorta-González & Dorta-González, 2013; Garfield, 1979; Waltman, Van Eck, VanLeeuwen, & Visser, 2013). Some revised indices have been proposed to overcome such differences in citation patternsacross subject fields (Zitt & Small, 2008). One method uses the ratio of a journal’s JIF and the average citation rate for all thejournals in the same subject field (Marshakova-Shaikevich, 1996; Van Leeuwen & Moed, 2002). Another method calculatesthe average frequency of citations in an article in the target journal’s subject field (Moed, 2010), as an indicator to normalizethe impact of the target journal. However, citation practices across subject fields may differ qualitatively from each other,hence comparing JIFs across subject fields calls for caution, and more research should be carried out in the future.
Researchers have criticized that the JIF of a journal may not reflect the overall quality of articles published by the journal(Abramo et al., 2010; Hecht et al., 1998; Holden et al., 2006; Leydesdorff & Amsterdamska, 1990), or that the growingpercentages of self-citation within a journal or research group might change the implication of JIF (Fassoulaki et al., 2000).However, the issues addressed in the current study are more about the reliability rather than the validity of JIF, as the focusis on the stochastic nature of JIF.
How journals and their articles are selected in a database influences the variability estimation and the generalizability ofa journal’s JIF. The bootstrap method makes the assumption that articles in the database are samples representative of thepopulation of journal articles. It is important that resampling should be conducted according to the sampling frameworkbased on which the original sample was selected. With DoRISE the articles are selected by journals, and the journals areselected for inclusion in the database on a yearly basis. Therefore, the nested structure of journals in a year as strata and thenested structure of the articles in a journal as clusters or strata are necessary for estimating the JIF variability. If a databaseselected articles according to authors or institutions, the authors or institutions will need to form additional sampling clusterswhile bootstrapping. That is, the nested structure embedded in a database should not be overlooked in order to reflect actualvariability of the JIF statistic.
The method proposed in this study requires detailed information of all articles, such as the citations of each paper overa period of time. Such databases of information are not easily accessible for individual researchers. Therefore, enterprisessuch as Elsevier (Scopus) and Thomson Reuters (Web of Knowledge) or large institutions responsible of constructing journalcitation databases are encouraged to report more indices, rather than a mere report of a point estimate. Finally, the uncer-tainty of JIF could be estimated through different approaches such as using longitudinal data or assuming the parametricprobability distribution function. The differences among these approaches can be examined in future studies.
5. Conclusion
The use of JIFs has become increasingly high-stakes, such as in making appointment and promotion decisions of academicstaff. Therefore, it is critical that decision makers realize the limitations of JIFs. We sought to explore additional statisticsto make journal impact data more informative. While the estimated JIF is important in assessing journals, the variabilityassociated with the estimated impact is also crucial to making statistical inference. Therefore, in the current study twodifferent bootstrap methods are proposed to estimate the CIs and SEs of JIF by (a) appropriately resampling the journalsand the articles in the database and (b) examining the sources of variability associated with the estimation. In addition toreporting a single value for JIF, reporting the uncertainty surrounding JIF is helpful for researchers and policy makers to assessthe impact of journals. Based on point and interval estimates, informative inferences about the influence and prestige ofjournals can be drawn. According to the results presented in the current study, the JIF have large standard errors. It suggeststhat less confidence should be placed on the comparison among journals’ impact based on the JIF.
Acknowledgements
This study was made possible through generous grants from the Aim for the Top University project of National Taiwan
Normal University funded by the Ministry of Education and the project (NSC97-2511-S-003-045-MY5) funded by the NationalScience Council of Taiwan. The authors also appreciate the mentoring and editorial assistance from Dr. Larry Yore and Mrs.Shari Yore.Appendix A. Journals and years of publication in DoRISE.
Table A.1.
K.-M. Chen et al. / Journal of Informetrics 8 (2014) 181– 196 191
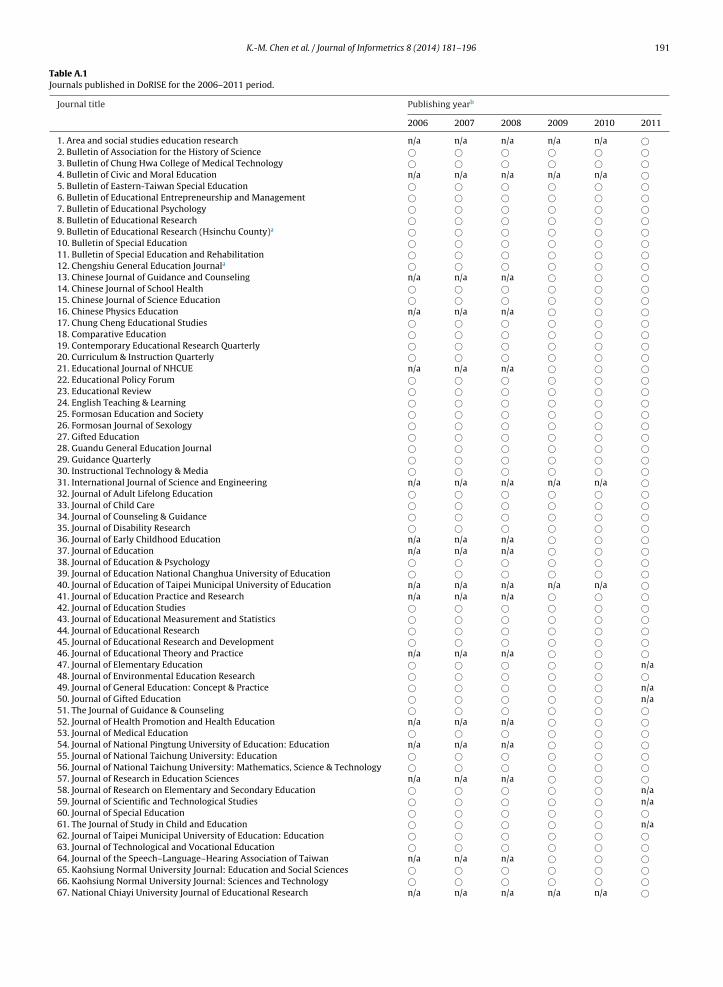
Table A.1Journals published in DoRISE for the 2006–2011 period.
Journal title Publishing yearb
2006 2007 2008 2009 2010 2011
1. Area and social studies education research n/a n/a n/a n/a n/a ©2. Bulletin of Association for the History of Science © © © © © ©3. Bulletin of Chung Hwa College of Medical Technology © © © © © ©4. Bulletin of Civic and Moral Education n/a n/a n/a n/a n/a ©5. Bulletin of Eastern-Taiwan Special Education © © © © © ©6. Bulletin of Educational Entrepreneurship and Management © © © © © ©7. Bulletin of Educational Psychology © © © © © ©8. Bulletin of Educational Research © © © © © ©9. Bulletin of Educational Research (Hsinchu County)a © © © © © ©10. Bulletin of Special Education © © © © © ©11. Bulletin of Special Education and Rehabilitation © © © © © ©12. Chengshiu General Education Journala © © © © © ©13. Chinese Journal of Guidance and Counseling n/a n/a n/a © © ©14. Chinese Journal of School Health © © © © © ©15. Chinese Journal of Science Education © © © © © ©16. Chinese Physics Education n/a n/a n/a © © ©17. Chung Cheng Educational Studies © © © © © ©18. Comparative Education © © © © © ©19. Contemporary Educational Research Quarterly © © © © © ©20. Curriculum & Instruction Quarterly © © © © © ©21. Educational Journal of NHCUE n/a n/a n/a © © ©22. Educational Policy Forum © © © © © ©23. Educational Review © © © © © ©24. English Teaching & Learning © © © © © ©25. Formosan Education and Society © © © © © ©26. Formosan Journal of Sexology © © © © © ©27. Gifted Education © © © © © ©28. Guandu General Education Journal © © © © © ©29. Guidance Quarterly © © © © © ©30. Instructional Technology & Media © © © © © ©31. International Journal of Science and Engineering n/a n/a n/a n/a n/a ©32. Journal of Adult Lifelong Education © © © © © ©33. Journal of Child Care © © © © © ©34. Journal of Counseling & Guidance © © © © © ©35. Journal of Disability Research © © © © © ©36. Journal of Early Childhood Education n/a n/a n/a © © ©37. Journal of Education n/a n/a n/a © © ©38. Journal of Education & Psychology © © © © © ©39. Journal of Education National Changhua University of Education © © © © © ©40. Journal of Education of Taipei Municipal University of Education n/a n/a n/a n/a n/a ©41. Journal of Education Practice and Research n/a n/a n/a © © ©42. Journal of Education Studies © © © © © ©43. Journal of Educational Measurement and Statistics © © © © © ©44. Journal of Educational Research © © © © © ©45. Journal of Educational Research and Development © © © © © ©46. Journal of Educational Theory and Practice n/a n/a n/a © © ©47. Journal of Elementary Education © © © © © n/a48. Journal of Environmental Education Research © © © © © ©49. Journal of General Education: Concept & Practice © © © © © n/a50. Journal of Gifted Education © © © © © n/a51. The Journal of Guidance & Counseling © © © © © ©52. Journal of Health Promotion and Health Education n/a n/a n/a © © ©53. Journal of Medical Education © © © © © ©54. Journal of National Pingtung University of Education: Education n/a n/a n/a © © ©55. Journal of National Taichung University: Education © © © © © ©56. Journal of National Taichung University: Mathematics, Science & Technology © © © © © ©57. Journal of Research in Education Sciences n/a n/a n/a © © ©58. Journal of Research on Elementary and Secondary Education © © © © © n/a59. Journal of Scientific and Technological Studies © © © © © n/a60. Journal of Special Education © © © © © ©61. The Journal of Study in Child and Education © © © © © n/a62. Journal of Taipei Municipal University of Education: Education © © © © © ©63. Journal of Technological and Vocational Education © © © © © ©64. Journal of the Speech–Language–Hearing Association of Taiwan n/a n/a n/a © © ©65. Kaohsiung Normal University Journal: Education and Social Sciences © © © © © ©66. Kaohsiung Normal University Journal: Sciences and Technology © © © © © ©67. National Chiayi University Journal of Educational Research n/a n/a n/a n/a n/a ©
192 K.-M. Chen et al. / Journal of Informetrics 8 (2014) 181– 196
Table A.1 (Continued)
Journal title Publishing yearb
2006 2007 2008 2009 2010 2011
68. NTTU Educational Research Journal © © © © © ©69. Psychological Testing © © © © © ©70. Research and Development in Science Education Quarterly © © © © © ©71. Research in Arts Education © © © © © ©72. School Health Nursinga n/a n/a n/a n/a n/a ©73. Science Education Monthly © © © © © ©74. Secondary Education © © © © © ©75. Special Education Quarterly © © © © © ©76. Taiwan Journal of Mathematics Teachers © © © © © ©77. Taiwan Journal of Sociology of Education © © © © © ©78. Technology Museum Review © © © © © ©79. Tzu-Chi University Journal of Educational Research © © © © © ©
a Journal title is in Chinese and translated into English by authors.b ‘n/a’ denotes ‘not available’ for the current analysis.Appendix B. Descriptive statistics for the journals in DoRISE.
Tables B.1 and B.2.
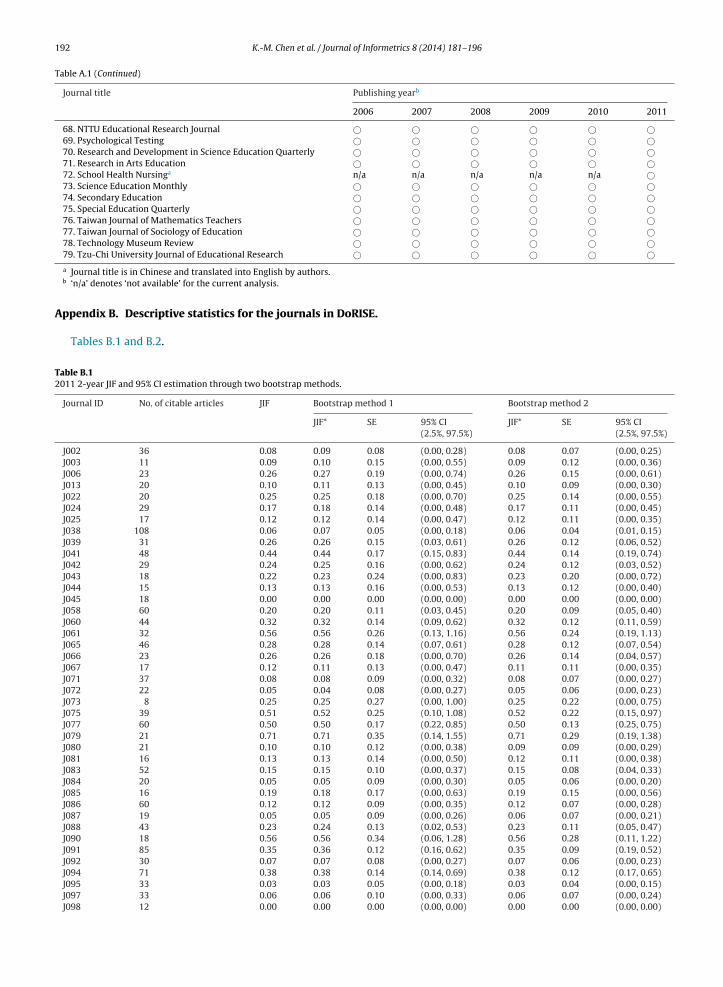
Table B.12011 2-year JIF and 95% CI estimation through two bootstrap methods.
Journal ID No. of citable articles JIF Bootstrap method 1 Bootstrap method 2
JIF* SE 95% CI JIF* SE 95% CI(2.5%, 97.5%) (2.5%, 97.5%)
J002 36 0.08 0.09 0.08 (0.00, 0.28) 0.08 0.07 (0.00, 0.25)J003 11 0.09 0.10 0.15 (0.00, 0.55) 0.09 0.12 (0.00, 0.36)J006 23 0.26 0.27 0.19 (0.00, 0.74) 0.26 0.15 (0.00, 0.61)J013 20 0.10 0.11 0.13 (0.00, 0.45) 0.10 0.09 (0.00, 0.30)J022 20 0.25 0.25 0.18 (0.00, 0.70) 0.25 0.14 (0.00, 0.55)J024 29 0.17 0.18 0.14 (0.00, 0.48) 0.17 0.11 (0.00, 0.45)J025 17 0.12 0.12 0.14 (0.00, 0.47) 0.12 0.11 (0.00, 0.35)J038 108 0.06 0.07 0.05 (0.00, 0.18) 0.06 0.04 (0.01, 0.15)J039 31 0.26 0.26 0.15 (0.03, 0.61) 0.26 0.12 (0.06, 0.52)J041 48 0.44 0.44 0.17 (0.15, 0.83) 0.44 0.14 (0.19, 0.74)J042 29 0.24 0.25 0.16 (0.00, 0.62) 0.24 0.12 (0.03, 0.52)J043 18 0.22 0.23 0.24 (0.00, 0.83) 0.23 0.20 (0.00, 0.72)J044 15 0.13 0.13 0.16 (0.00, 0.53) 0.13 0.12 (0.00, 0.40)J045 18 0.00 0.00 0.00 (0.00, 0.00) 0.00 0.00 (0.00, 0.00)J058 60 0.20 0.20 0.11 (0.03, 0.45) 0.20 0.09 (0.05, 0.40)J060 44 0.32 0.32 0.14 (0.09, 0.62) 0.32 0.12 (0.11, 0.59)J061 32 0.56 0.56 0.26 (0.13, 1.16) 0.56 0.24 (0.19, 1.13)J065 46 0.28 0.28 0.14 (0.07, 0.61) 0.28 0.12 (0.07, 0.54)J066 23 0.26 0.26 0.18 (0.00, 0.70) 0.26 0.14 (0.04, 0.57)J067 17 0.12 0.11 0.13 (0.00, 0.47) 0.11 0.11 (0.00, 0.35)J071 37 0.08 0.08 0.09 (0.00, 0.32) 0.08 0.07 (0.00, 0.27)J072 22 0.05 0.04 0.08 (0.00, 0.27) 0.05 0.06 (0.00, 0.23)J073 8 0.25 0.25 0.27 (0.00, 1.00) 0.25 0.22 (0.00, 0.75)J075 39 0.51 0.52 0.25 (0.10, 1.08) 0.52 0.22 (0.15, 0.97)J077 60 0.50 0.50 0.17 (0.22, 0.85) 0.50 0.13 (0.25, 0.75)J079 21 0.71 0.71 0.35 (0.14, 1.55) 0.71 0.29 (0.19, 1.38)J080 21 0.10 0.10 0.12 (0.00, 0.38) 0.09 0.09 (0.00, 0.29)J081 16 0.13 0.13 0.14 (0.00, 0.50) 0.12 0.11 (0.00, 0.38)J083 52 0.15 0.15 0.10 (0.00, 0.37) 0.15 0.08 (0.04, 0.33)J084 20 0.05 0.05 0.09 (0.00, 0.30) 0.05 0.06 (0.00, 0.20)J085 16 0.19 0.18 0.17 (0.00, 0.63) 0.19 0.15 (0.00, 0.56)J086 60 0.12 0.12 0.09 (0.00, 0.35) 0.12 0.07 (0.00, 0.28)J087 19 0.05 0.05 0.09 (0.00, 0.26) 0.06 0.07 (0.00, 0.21)J088 43 0.23 0.24 0.13 (0.02, 0.53) 0.23 0.11 (0.05, 0.47)J090 18 0.56 0.56 0.34 (0.06, 1.28) 0.56 0.28 (0.11, 1.22)J091 85 0.35 0.36 0.12 (0.16, 0.62) 0.35 0.09 (0.19, 0.52)J092 30 0.07 0.07 0.08 (0.00, 0.27) 0.07 0.06 (0.00, 0.23)J094 71 0.38 0.38 0.14 (0.14, 0.69) 0.38 0.12 (0.17, 0.65)J095 33 0.03 0.03 0.05 (0.00, 0.18) 0.03 0.04 (0.00, 0.15)J097 33 0.06 0.06 0.10 (0.00, 0.33) 0.06 0.07 (0.00, 0.24)J098 12 0.00 0.00 0.00 (0.00, 0.00) 0.00 0.00 (0.00, 0.00)

K.-M. Chen et al. / Journal of Informetrics 8 (2014) 181– 196 193
Table B.1 (Continued)
Journal ID No. of citable articles JIF Bootstrap method 1 Bootstrap method 2
JIF* SE 95% CI JIF* SE 95% CI(2.5%, 97.5%) (2.5%, 97.5%)
J100 23 0.04 0.04 0.07 (0.00, 0.22) 0.04 0.06 (0.00, 0.22)J103 20 0.10 0.09 0.12 (0.00, 0.40) 0.10 0.10 (0.00, 0.35)J104 318 0.12 0.12 0.04 (0.06, 0.21) 0.12 0.03 (0.07, 0.19)J106 16 0.06 0.06 0.11 (0.00, 0.38) 0.06 0.09 (0.00, 0.31)J107 28 0.21 0.22 0.17 (0.00, 0.64) 0.21 0.13 (0.00, 0.54)J108 21 0.00 0.00 0.00 (0.00, 0.00) 0.00 0.00 (0.00, 0.00)J109 19 0.00 0.00 0.00 (0.00, 0.00) 0.00 0.00 (0.00, 0.00)J110 16 0.25 0.25 0.23 (0.00,0.81) 0.25 0.18 (0.00, 0.69)J112 17 0.24 0.23 0.20 (0.00, 0.71) 0.23 0.15 (0.00, 0.59)J113 18 0.00 0.00 0.00 (0.00, 0.00) 0.00 0.00 (0.00, 0.00)J114 16 0.25 0.25 0.22 (0.00, 0.81) 0.25 0.19 (0.00, 0.69)J117 18 0.11 0.11 0.13 (0.00, 0.44) 0.11 0.10 (0.00, 0.36)J118 16 0.06 0.06 0.10 (0.00, 0.38) 0.06 0.09 (0.00, 0.31)J119 17 0.18 0.18 0.17 (0.00, 0.59) 0.18 0.13 (0.00, 0.47)J120 25 0.00 0.00 0.00 (0.00, 0.00) 0.00 0.00 (0.00, 0.00)J125 35 0.11 0.12 0.10 (0.00, 0.37) 0.11 0.07 (0.00, 0.29)J126 24 0.13 0.13 0.12 (0.00, 0.42) 0.12 0.10 (0.00, 0.38)J127 72 0.01 0.01 0.02 (0.00, 0.08) 0.01 0.02 (0.00, 0.06)J129 16 0.13 0.12 0.14 (0.00, 0.50) 0.13 0.12 (0.00, 0.44)J131 48 0.08 0.08 0.07 (0.00, 0.25) 0.08 0.06 (0.00, 0.21)J132 107 0.07 0.07 0.05 (0.00, 0.19) 0.08 0.04 (0.01, 0.17)J137 10 0.00 0.00 0.00 (0.00, 0.00) 0.00 0.00 (0.00, 0.00)J138 24 0.08 0.08 0.10 (0.00, 0.33) 0.08 0.08 (0.00, 0.29)J141 61 0.00 0.00 0.00 (0.00, 0.00) 0.00 0.00 (0.00, 0.00)J142 40 0.10 0.10 0.10 (0.00, 0.35) 0.10 0.07 (0.00, 0.25)J143 14 0.14 0.14 0.16 (0.00, 0.57) 0.14 0.13 (0.00, 0.43)J144 17 0.06 0.06 0.10 (0.00, 0.29) 0.06 0.08 (0.00, 0.24)J147 13 0.15 0.15 0.18 (0.00, 0.62) 0.15 0.15 (0.00, 0.54)J148 28 0.00 0.00 0.00 (0.00, 0.00) 0.00 0.00 (0.00, 0.00)J149 27 0.00 0.00 0.00 (0.00, 0.00) 0.00 0.00 (0.00, 0.00)J150 18 0.06 0.06 0.09 (0.00, 0.33) 0.05 0.07 (0.00, 0.22)J151 38 0.00 0.00 0.00 (0.00, 0.00) 0.00 0.00 (0.00, 0.00)
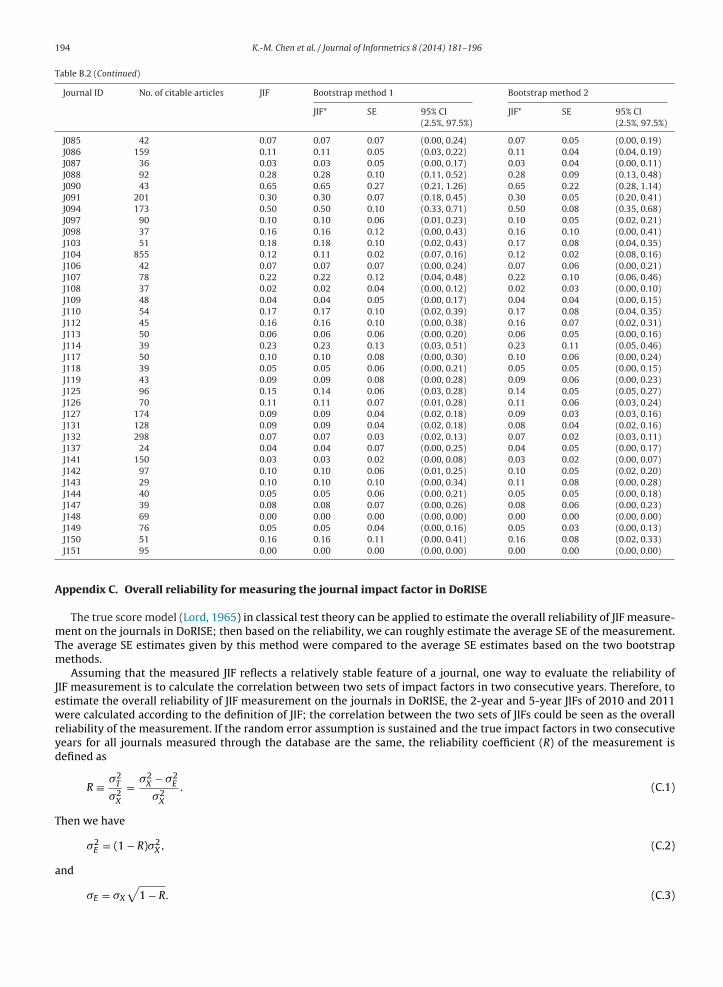
Table B.22011 5-year JIF and 95% CI estimation through two bootstrap methods.
Journal ID No. of citable articles JIF Bootstrap method 1 Bootstrap method 2
JIF* SE 95% CI JIF* SE 95% CI(2.5%, 97.5%) (2.5%, 97.5%)
J002 60 0.07 0.07 0.06 (0.00, 0.20) 0.07 0.04 (0.00, 0.17)J003 30 0.07 0.06 0.08 (0.00, 0.25) 0.07 0.07 (0.00, 0.23)J006 45 0.24 0.25 0.13 (0.04, 0.53) 0.25 0.09 (0.09, 0.44)J013 55 0.36 0.36 0.14 (0.11, 0.67) 0.36 0.12 (0.16, 0.62)J024 57 0.19 0.20 0.10 (0.04, 0.42) 0.19 0.08 (0.05, 0.37)J025 32 0.09 0.10 0.09 (0.00, 0.31) 0.09 0.07 (0.00, 0.25)J038 248 0.15 0.14 0.04 (0.07, 0.24) 0.15 0.04 (0.08, 0.22)J039 82 0.22 0.22 0.09 (0.07, 0.41) 0.22 0.07 (0.10, 0.35)J041 132 0.46 0.46 0.11 (0.27, 0.70) 0.46 0.09 (0.30, 0.66)J042 89 0.48 0.48 0.13 (0.26, 0.75) 0.48 0.10 (0.29, 0.69)J043 56 0.34 0.34 0.14 (0.11, 0.64) 0.34 0.12 (0.13, 0.61)J044 33 0.15 0.15 0.12 (0.00, 0.45) 0.15 0.10 (0.00, 0.39)J045 49 0.18 0.18 0.10 (0.02, 0.43) 0.18 0.09 (0.02, 0.39)J058 144 0.39 0.39 0.10 (0.23, 0.59) 0.39 0.08 (0.23, 0.56)J060 122 0.34 0.33 0.09 (0.16, 0.52) 0.34 0.07 (0.20, 0.48)J061 85 0.61 0.62 0.20 (0.25, 1.07) 0.62 0.18 (0.32, 0.99)J065 117 0.48 0.48 0.13 (0.27, 0.77) 0.48 0.11 (0.28, 0.69)J066 57 0.25 0.25 0.12 (0.05, 0.49) 0.24 0.09 (0.09, 0.44)J067 41 0.12 0.12 0.10 (0.00, 0.39) 0.12 0.08 (0.00, 0.32)J071 83 0.07 0.07 0.06 (0.00, 0.22) 0.07 0.05 (0.00, 0.18)J072 54 0.06 0.06 0.05 (0.00, 0.19) 0.06 0.04 (0.00, 0.17)J073 29 0.17 0.17 0.13 (0.00, 0.45) 0.17 0.10 (0.00, 0.38)J075 101 0.52 0.52 0.14 (0.26, 0.83) 0.53 0.13 (0.30, 0.80)J081 36 0.14 0.14 0.11 (0.00, 0.42) 0.14 0.09 (0.00, 0.36)J084 64 0.08 0.08 0.06 (0.00, 0.22) 0.08 0.05 (0.00, 0.20)
194 K.-M. Chen et al. / Journal of Informetrics 8 (2014) 181– 196
Table B.2 (Continued)
Journal ID No. of citable articles JIF Bootstrap method 1 Bootstrap method 2
JIF* SE 95% CI JIF* SE 95% CI(2.5%, 97.5%) (2.5%, 97.5%)
J085 42 0.07 0.07 0.07 (0.00, 0.24) 0.07 0.05 (0.00, 0.19)J086 159 0.11 0.11 0.05 (0.03, 0.22) 0.11 0.04 (0.04, 0.19)J087 36 0.03 0.03 0.05 (0.00, 0.17) 0.03 0.04 (0.00, 0.11)J088 92 0.28 0.28 0.10 (0.11, 0.52) 0.28 0.09 (0.13, 0.48)J090 43 0.65 0.65 0.27 (0.21, 1.26) 0.65 0.22 (0.28, 1.14)J091 201 0.30 0.30 0.07 (0.18, 0.45) 0.30 0.05 (0.20, 0.41)J094 173 0.50 0.50 0.10 (0.33, 0.71) 0.50 0.08 (0.35, 0.68)J097 90 0.10 0.10 0.06 (0.01, 0.23) 0.10 0.05 (0.02, 0.21)J098 37 0.16 0.16 0.12 (0.00, 0.43) 0.16 0.10 (0.00, 0.41)J103 51 0.18 0.18 0.10 (0.02, 0.43) 0.17 0.08 (0.04, 0.35)J104 855 0.12 0.11 0.02 (0.07, 0.16) 0.12 0.02 (0.08, 0.16)J106 42 0.07 0.07 0.07 (0.00, 0.24) 0.07 0.06 (0.00, 0.21)J107 78 0.22 0.22 0.12 (0.04, 0.48) 0.22 0.10 (0.06, 0.46)J108 37 0.02 0.02 0.04 (0.00, 0.12) 0.02 0.03 (0.00, 0.10)J109 48 0.04 0.04 0.05 (0.00, 0.17) 0.04 0.04 (0.00, 0.15)J110 54 0.17 0.17 0.10 (0.02, 0.39) 0.17 0.08 (0.04, 0.35)J112 45 0.16 0.16 0.10 (0.00, 0.38) 0.16 0.07 (0.02, 0.31)J113 50 0.06 0.06 0.06 (0.00, 0.20) 0.06 0.05 (0.00, 0.16)J114 39 0.23 0.23 0.13 (0.03, 0.51) 0.23 0.11 (0.05, 0.46)J117 50 0.10 0.10 0.08 (0.00, 0.30) 0.10 0.06 (0.00, 0.24)J118 39 0.05 0.05 0.06 (0.00, 0.21) 0.05 0.05 (0.00, 0.15)J119 43 0.09 0.09 0.08 (0.00, 0.28) 0.09 0.06 (0.00, 0.23)J125 96 0.15 0.14 0.06 (0.03, 0.28) 0.14 0.05 (0.05, 0.27)J126 70 0.11 0.11 0.07 (0.01, 0.28) 0.11 0.06 (0.03, 0.24)J127 174 0.09 0.09 0.04 (0.02, 0.18) 0.09 0.03 (0.03, 0.16)J131 128 0.09 0.09 0.04 (0.02, 0.18) 0.08 0.04 (0.02, 0.16)J132 298 0.07 0.07 0.03 (0.02, 0.13) 0.07 0.02 (0.03, 0.11)J137 24 0.04 0.04 0.07 (0.00, 0.25) 0.04 0.05 (0.00, 0.17)J141 150 0.03 0.03 0.02 (0.00, 0.08) 0.03 0.02 (0.00, 0.07)J142 97 0.10 0.10 0.06 (0.01, 0.25) 0.10 0.05 (0.02, 0.20)J143 29 0.10 0.10 0.10 (0.00, 0.34) 0.11 0.08 (0.00, 0.28)J144 40 0.05 0.05 0.06 (0.00, 0.21) 0.05 0.05 (0.00, 0.18)J147 39 0.08 0.08 0.07 (0.00, 0.26) 0.08 0.06 (0.00, 0.23)J148 69 0.00 0.00 0.00 (0.00, 0.00) 0.00 0.00 (0.00, 0.00)J149 76 0.05 0.05 0.04 (0.00, 0.16) 0.05 0.03 (0.00, 0.13)
J150 51 0.16 0.16 0.11 (0.00, 0.41) 0.16 0.08 (0.02, 0.33)J151 95 0.00 0.00 0.00 (0.00, 0.00) 0.00 0.00 (0.00, 0.00)Appendix C. Overall reliability for measuring the journal impact factor in DoRISE
The true score model (Lord, 1965) in classical test theory can be applied to estimate the overall reliability of JIF measure-ment on the journals in DoRISE; then based on the reliability, we can roughly estimate the average SE of the measurement.The average SE estimates given by this method were compared to the average SE estimates based on the two bootstrapmethods.
Assuming that the measured JIF reflects a relatively stable feature of a journal, one way to evaluate the reliability ofJIF measurement is to calculate the correlation between two sets of impact factors in two consecutive years. Therefore, toestimate the overall reliability of JIF measurement on the journals in DoRISE, the 2-year and 5-year JIFs of 2010 and 2011were calculated according to the definition of JIF; the correlation between the two sets of JIFs could be seen as the overallreliability of the measurement. If the random error assumption is sustained and the true impact factors in two consecutiveyears for all journals measured through the database are the same, the reliability coefficient (R) of the measurement isdefined as
R ≡ �2T
�2X
= �2X − �2
E
�2X
. (C.1)
Then we have
�2E = (1 − R)�2
X, (C.2)
and
�E = �X
√1 − R. (C.3)
K.-M. Chen et al. / Journal of Informetrics 8 (2014) 181– 196 195
0.0
0.2
0.4
0.6
0.8
1.0
0 0.2 0.4 0.6 0.8 1
2-y
ear
Imp
act
Fa
cto
r in
20
11
2-year Impact Factor in 2010
(a)
0.0
0.2
0.4
0.6
0.8
1.0
0 0.2 0.4 0.6 0.8 1
5-y
ear
Imp
act
Fa
ctor
in 2
011
5-year Impact Facto r in 2010
(b)
R = .65 R = .87
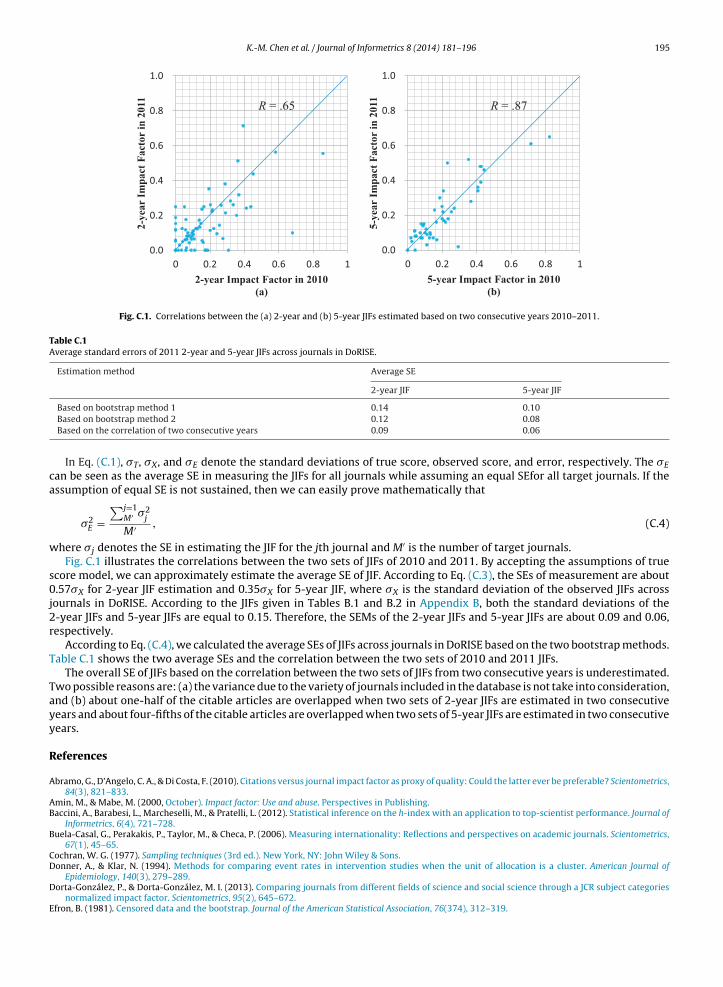
Fig. C.1. Correlations between the (a) 2-year and (b) 5-year JIFs estimated based on two consecutive years 2010–2011.
Table C.1Average standard errors of 2011 2-year and 5-year JIFs across journals in DoRISE.
Estimation method Average SE
2-year JIF 5-year JIF
ca
w
s0j2r
T
Tayy
R
A
AB
B
CD
D
E
Based on bootstrap method 1 0.14 0.10Based on bootstrap method 2 0.12 0.08Based on the correlation of two consecutive years 0.09 0.06
In Eq. (C.1), �T, �X, and �E denote the standard deviations of true score, observed score, and error, respectively. The �E
an be seen as the average SE in measuring the JIFs for all journals while assuming an equal SEfor all target journals. If thessumption of equal SE is not sustained, then we can easily prove mathematically that
�2E =
∑j=1M′ �2
j
M′ , (C.4)
here �j denotes the SE in estimating the JIF for the jth journal and M′ is the number of target journals.Fig. C.1 illustrates the correlations between the two sets of JIFs of 2010 and 2011. By accepting the assumptions of true
core model, we can approximately estimate the average SE of JIF. According to Eq. (C.3), the SEs of measurement are about.57�X for 2-year JIF estimation and 0.35�X for 5-year JIF, where �X is the standard deviation of the observed JIFs across
ournals in DoRISE. According to the JIFs given in Tables B.1 and B.2 in Appendix B, both the standard deviations of the-year JIFs and 5-year JIFs are equal to 0.15. Therefore, the SEMs of the 2-year JIFs and 5-year JIFs are about 0.09 and 0.06,espectively.
According to Eq. (C.4), we calculated the average SEs of JIFs across journals in DoRISE based on the two bootstrap methods.able C.1 shows the two average SEs and the correlation between the two sets of 2010 and 2011 JIFs.
The overall SE of JIFs based on the correlation between the two sets of JIFs from two consecutive years is underestimated.wo possible reasons are: (a) the variance due to the variety of journals included in the database is not take into consideration,nd (b) about one-half of the citable articles are overlapped when two sets of 2-year JIFs are estimated in two consecutiveears and about four-fifths of the citable articles are overlapped when two sets of 5-year JIFs are estimated in two consecutiveears.
eferences
bramo, G., D’Angelo, C. A., & Di Costa, F. (2010). Citations versus journal impact factor as proxy of quality: Could the latter ever be preferable? Scientometrics,84(3), 821–833.
min, M., & Mabe, M. (2000, October). Impact factor: Use and abuse. Perspectives in Publishing.accini, A., Barabesi, L., Marcheselli, M., & Pratelli, L. (2012). Statistical inference on the h-index with an application to top-scientist performance. Journal of
Informetrics, 6(4), 721–728.uela-Casal, G., Perakakis, P., Taylor, M., & Checa, P. (2006). Measuring internationality: Reflections and perspectives on academic journals. Scientometrics,
67(1), 45–65.ochran, W. G. (1977). Sampling techniques (3rd ed.). New York, NY: John Wiley & Sons.
onner, A., & Klar, N. (1994). Methods for comparing event rates in intervention studies when the unit of allocation is a cluster. American Journal ofEpidemiology, 140(3), 279–289.orta-González, P., & Dorta-González, M. I. (2013). Comparing journals from different fields of science and social science through a JCR subject categories
normalized impact factor. Scientometrics, 95(2), 645–672.fron, B. (1981). Censored data and the bootstrap. Journal of the American Statistical Association, 76(374), 312–319.

196 K.-M. Chen et al. / Journal of Informetrics 8 (2014) 181– 196
Efron, B. (2003). Second thoughts on the bootstrap. Statistical Science, 18(2), 135–140.Efron, B., & Tibshirani, R. J. (1993). An introduction to the bootstrap. New York, NY: Chapman & Hall.Fassoulaki, A., Paraskeva, A., Papilas, K., & Karabinis, G. (2000). Self-citations in six anaesthesia journals and their significance in determining the impact
factor. British Journal of Anaesthesia, 84(2), 266–269.Garfield, E. (1955). Citation indexes for science: A new dimension in documentation through association of ideas. Science, 122, 108–111.Garfield, E. (1979). Is citation analysis a legitimate evaluation tool? Scientometrics, 1(4), 359–375.Garfield, E. (1999). Journal impact factor: A brief review. Canadian Medical Association Journal, 161(8), 979–980.Greenwood, D. C. (2007). Reliability of journal impact factor rankings. BMC Medical Research Methodology, 7, 48. http://dx.doi.org/10.1186/1471-2288-7-48Gross, S. T., & Lai, T. L. (1996). Bootstrap methods for truncated and censored data. Statistica Sinica, 6, 509–530.Hansen, M. H., Hurwitz, W. N., & Madow, W. G. (1953). Sample survey methods and theory. New York, NY: John Wiley & Sons.Hecht, F., Hecht, B. K., & Sandberg, A. A. (1998). The journal “impact factor”: A misnamed, misleading, misused measure. Cancer Genetics and Cytogenetics,
104(2), 77–81.Holden, G., Rosenberg, G., Barker, K., & Onghena, P. (2006). An assessment of the predictive validity of impact factor scores: Implications for academic
employment decisions in social work. Research on Social Work Practice, 16(6), 613–624.Jen, T.-H., Tam, H.-P., & Wu, M. (2011). An estimation of the design effect for the two-stage stratified cluster sampling design. Journal of Research in Education
Sciences, 56(1), 33–65.Kish, L. (1965). Survey sampling. London, England: John Wiley & Sons.Leydesdorff, L. (2013). Does the specification of uncertainty hurt the progress of scientometrics? Journal of Informetrics, 7(2), 292–293.
http://dx.doi.org/10.1016/j.joi.2012.11.007Leydesdorff, L., & Amsterdamska, O. (1990). Dimensions of citation analysis. Science, Technology, & Human Values, 15(3), 305–335.
http://dx.doi.org/10.1177/016224399001500303Lohr, S. L. (2010). Sampling: Design and analysis (2nd ed.). Boston: Brooks/Cole.Lord, F. M. (1965). A strong true-score theory, with applications. Psychometrika, 30(3), 239–270.Marshakova-Shaikevich, I. (1996). The standard impact factor as an evaluation tool of science and scientific journals. Scientometrics, 35(2), 283–290.Marx, W., & Cardona, M. (2003). The impact of solid state communications in view of the ISI citation data. Solid State Communications, 127(5), 323–336.Moed, H. F. (2010). Measuring contextual citation impact of scientific journals. Journal of Informetrics, 4(3), 265–277.Opthof, T., & Leydesdorff, L. (2010). Caveats for the journal and field normalizations in the CWTS (“Leiden”) evaluations of research performance. Journal of
Informetrics, 4(3), 423–430.Pons, O. (2007). Bootstrap of means under stratified sampling. Electronic Journal of Statistics, 1, 381–391. http://dx.doi.org/10.1214/07-Ejs033Ramirez, A. M., Garcia, E. O., & Del Rio, J. A. (2000). Renormalized impact factor. Scientometrics, 47(1), 3–9.Schneider, J. W. (2013). Caveats for using statistical significance tests in research assessments. Journal of Informetrics, 7(1), 50–62.Schubert, A., & Glänzel, W. (1983). Statistical reliability of comparisons based on the citation impact of scientific publications. Scientometrics, 5(1), 59–74.Seglen, P. O. (1992). The skewness of science. Journal of the American Society for Information Science, 43(9), 628–638.Smith, R. (2006). Commentary: The power of the unrelenting impact factor – Is it a force for good or harm? International Journal of Epidemiology, 35,
1129–1130.Sombatsompop, N., & Markpin, T. (2005). Making an equality of ISI impact factors for different subject fields. Journal of the American Society for Information
Science and Technology, 56(7), 676–683.van Leeuwen, T. N., & Moed, H. F. (2002). Development and application of journal impact measures in the Dutch science system. Scientometrics, 53(2),
249–266.Waltman, L., van Eck, N. J., van Leeuwen, T. N., & Visser, M. S. (2013). Some modifications to the SNIP journal impact indicator. Journal of Informetrics, 7(2),
272–285.Zitt, M., & Small, H. (2008). Modifying the journal impact factor by fractional citation weighting: The audience factor. Journal of the American Society for
Information Science and Technology, 59(11), 1856–1860.
Related Documents


![[BOOK] [Bootstrap] [Awesome] Bootstrap-Programming-Cookbook](https://static.cupdf.com/doc/110x72/577ca6bf1a28abea748c023f/book-bootstrap-awesome-bootstrap-programming-cookbook.jpg)