Contributed Paper Estimating Sustainable Bycatch Rates for California Sea Lion Populations in the Gulf of California JARED G. UNDERWOOD, ∗ ‡ CLAUDIA J. HERNANDEZ CAMACHO, ∗ † DAVID AURIOLES-GAMBOA,† AND LEAH R. GERBER ∗ ∗ Ecology, Evolution and Environmental Science, School of Life Sciences, Arizona State University, College & University Drive, Tempe, AZ 85287-1501, U.S.A. †Centro Interdisciplinario de Ciencias Marinas-IPN, Av. IPN s/n Col. Playa Palo de Santa Rita, La Paz BCS 23096, M´ exico Abstract: Commercial and subsistence fisheries pressure is increasing in the Gulf of California, Mexico. One consequence often associated with high levels of fishing pressure is an increase in bycatch of marine mammals and birds. Fisheries bycatch has contributed to declines in several pinniped species and may be affecting the California sea lion (Zalophus californianus) population in the Gulf of California. We used data on fisheries and sea lion entanglement in gill nets to estimate current fishing pressure and fishing rates under which viable sea lion populations could be sustained at 11 breeding sites in the Gulf of California. We used 3 models to estimate sustainable bycatch rates: a simple population-growth model, a demographic model, and an estimate of the potential biological removal. All models were based on life history and census data collected for sea lions in the Gulf of California. We estimated the current level of fishing pressure and the acceptable level of fishing required to maintain viable sea lion populations as the number of fishing days (1 fisher/boat setting and retrieving 1 day’s worth of nets) per year. Estimates of current fishing pressure ranged from 101 (0–405) fishing days around the Los Machos breeding site to 1887 (842–3140) around the Los Islotes rookery. To maintain viable sea lion populations at each site, the current level of fishing permissible could be augmented at some sites and should be reduced at other sites. For example, the area around San Esteban could support up to 1428 (935–2337) additional fishing days, whereas fishing around Lobos should be reduced by at least 165 days (107–268). Our results provide conservation practitioners with site-specific guidelines for maintaining sustainable sea lion populations and provide a method to estimate fishing pressure and sustainable bycatch rates that could be used for other marine mammals and birds. Keywords: bycatch, California sea lion, fisheries, gill-net entanglement, Gulf of California, population viability, Zalophus californianus Estimaci´ on de Tasas de Captura Incidental Sustentables para Poblaciones de Lobos Marinos en el Golfo de California Resumen: La presi´ on de las pesquer´ ıas comerciales y de subsistencia est´ a aumentando en el Golfo de Califronia, M´ exico. El incremento de la captura incidental de mam´ ıferos y aves marinas a menudo es una consecuencia asociada con altos niveles de presi´ on de pesca. La captura incidental de pesquer´ ıas ha contribuido a las declinaciones de varias especies de pin´ ıpedos y puedee estar afectando a la poblaci´ on de lobo marino de California (Zalophus californianus) en el Golfo de California. Utilizamos datos sobre pesquer´ ıas y enmallamiento de lobos marinos en redes agalleras para estimar la presi´ on de pesca actual y las tasas de pesca bajo las que se pudieran sostener poblaciones de le´ on marino en 11 sitios de reproducci´ on en el Golfo de California. Utilizamos 3 modelos para estimar tasas de captura incidental sustentables: un modelo de crecimiento poblacional simple, un modelo demogr´ afico, y una estimaci´ on de la remoci´ on biol´ ogica potencial. Todos los modelos se basaron en datos de la historia de vida y de censos de lobos marinos en el Golfo de California. Estimamos el nivel de la presi´ on de pesca actual y el nivel de pesca aceptable requerido para mantener poblaciones viables de lobos marinos como el n´ umero de d´ ıas de pesca (1 pescador/barco ‡email [email protected] Paper submitted December 6, 2006; revised manuscript accepted November 5, 2007. 701 Conservation Biology, Volume 22, No. 3, 701–710 C 2008 Society for Conservation Biology DOI: 10.1111/j.1523-1739.2008.00919.x

Welcome message from author
This document is posted to help you gain knowledge. Please leave a comment to let me know what you think about it! Share it to your friends and learn new things together.
Transcript
Contributed Paper
Estimating Sustainable Bycatch Rates for CaliforniaSea Lion Populations in the Gulf of CaliforniaJARED G. UNDERWOOD,∗‡ CLAUDIA J. HERNANDEZ CAMACHO,∗†DAVID AURIOLES-GAMBOA,† AND LEAH R. GERBER∗∗Ecology, Evolution and Environmental Science, School of Life Sciences, Arizona State University, College & UniversityDrive, Tempe, AZ 85287-1501, U.S.A.†Centro Interdisciplinario de Ciencias Marinas-IPN, Av. IPN s/n Col. Playa Palo de Santa Rita, La Paz BCS 23096, Mexico
Abstract: Commercial and subsistence fisheries pressure is increasing in the Gulf of California, Mexico. One
consequence often associated with high levels of fishing pressure is an increase in bycatch of marine mammals
and birds. Fisheries bycatch has contributed to declines in several pinniped species and may be affecting the
California sea lion (Zalophus californianus) population in the Gulf of California. We used data on fisheries and
sea lion entanglement in gill nets to estimate current fishing pressure and fishing rates under which viable
sea lion populations could be sustained at 11 breeding sites in the Gulf of California. We used 3 models to
estimate sustainable bycatch rates: a simple population-growth model, a demographic model, and an estimate
of the potential biological removal. All models were based on life history and census data collected for sea
lions in the Gulf of California. We estimated the current level of fishing pressure and the acceptable level of
fishing required to maintain viable sea lion populations as the number of fishing days (1 fisher/boat setting
and retrieving 1 day’s worth of nets) per year. Estimates of current fishing pressure ranged from 101 (0–405)
fishing days around the Los Machos breeding site to 1887 (842–3140) around the Los Islotes rookery. To
maintain viable sea lion populations at each site, the current level of fishing permissible could be augmented
at some sites and should be reduced at other sites. For example, the area around San Esteban could support up
to 1428 (935–2337) additional fishing days, whereas fishing around Lobos should be reduced by at least 165
days (107–268). Our results provide conservation practitioners with site-specific guidelines for maintaining
sustainable sea lion populations and provide a method to estimate fishing pressure and sustainable bycatch
rates that could be used for other marine mammals and birds.
Keywords: bycatch, California sea lion, fisheries, gill-net entanglement, Gulf of California, population viability,Zalophus californianus
Estimacion de Tasas de Captura Incidental Sustentables para Poblaciones de Lobos Marinos en el Golfo de California
Resumen: La presion de las pesquerıas comerciales y de subsistencia esta aumentando en el Golfo de
Califronia, Mexico. El incremento de la captura incidental de mamıferos y aves marinas a menudo es
una consecuencia asociada con altos niveles de presion de pesca. La captura incidental de pesquerıas ha
contribuido a las declinaciones de varias especies de pinıpedos y puedee estar afectando a la poblacion
de lobo marino de California (Zalophus californianus) en el Golfo de California. Utilizamos datos sobre
pesquerıas y enmallamiento de lobos marinos en redes agalleras para estimar la presion de pesca actual y
las tasas de pesca bajo las que se pudieran sostener poblaciones de leon marino en 11 sitios de reproduccion
en el Golfo de California. Utilizamos 3 modelos para estimar tasas de captura incidental sustentables: un
modelo de crecimiento poblacional simple, un modelo demografico, y una estimacion de la remocion biologica
potencial. Todos los modelos se basaron en datos de la historia de vida y de censos de lobos marinos en el
Golfo de California. Estimamos el nivel de la presion de pesca actual y el nivel de pesca aceptable requerido
para mantener poblaciones viables de lobos marinos como el numero de dıas de pesca (1 pescador/barco
‡email [email protected] submitted December 6, 2006; revised manuscript accepted November 5, 2007.
701Conservation Biology, Volume 22, No. 3, 701–710C©2008 Society for Conservation BiologyDOI: 10.1111/j.1523-1739.2008.00919.x
702 Fisheries Bycatch and Sea Lions
colocando y recuperando el valor de 1 dıa de redes) por ano. Las estimaciones de la presion de pesca actual
variaron entre 101 (9-405) dıas de pesca alrededor del sitio de reproduccion Los Machos y 1887 (842–3140)
alrededor de Los Islotes. Para mantener poblaciones viables de lobos marinos en cada sitio, el nivel de pesca
permisible actual podrıa ser aumentado en algunos sitios y deberıa ser reducido en otros. Por ejemplo, el
area alrededor de San Esteban podrıa soportar hasta 1428 (935–2337) dıas de pesca adicionales, mientras
la pesca alrededor de Lobos deberıa ser reducida en por lo menos 165 (107–268) dıas. Nuestros resultados
proporcionar a los profesionales de la conservacion directrices especıficas para cada sitio para mantener
poblaciones sustentables de leones marinos y proporcionan un metodo para estimar la presion de pesca y las
tasas de captura incidental sustentables que podrıan se utilizadas en otros mamıferos y aves marinas.
Palabras Clave: captura incidental, lobo marino de California, enmallamiento en red agallera, Golfo de Califor-nia, viabilidad poblacional, Zalophus californianus
Introduction
Obtaining accurate information on fisheries-related by-catch for marine mammals and birds is a global chal-lenge in marine conservation biology (Read et al. 2006).Here we present a method for estimating current fish-ing pressure and sustainable bycatch rates based on en-tanglement data and life history parameters for marinespecies (pinnipeds, cetaceans, or birds). This method isillustrated with the California sea lion (Zalophus califor-
nianus) population in the Gulf of California (Gulf) as acase study. Using this method, an estimate of incidentalcatch and the relative intensity of fishing pressure can beapproximated indirectly from the number of entangledanimals recorded. Sea lion entanglement rates are rela-tively straightforward to document, and information canbe collected quickly. Assuming that the number of entan-gled individuals indicates relative fishing pressure, theuse of site-specific data on entanglement and life historyparameters permits one to estimate the level of allowablefishing pressure.
The California sea lion is a polygynous pinniped thatbreeds on islands of the eastern Pacific Ocean from BritishColumbia in Canada to Las Islas Marıas in Mexico and inthe Gulf (Odell 1981). After an apparent recovery fromexploitation in the 19th and 20th centuries, the currentstatus of California sea lions in the Gulf is uncertain.Szteren et al. (2006) compared the most recent survey(24,062–31,159) with a 1994 census (31,393 individuals)and found an approximate 20% decline between 1994 to2004. The most recent census data at the rookery levelindicate that increases in several large breeding coloniesare masking rapid declines in several smaller rookeries(Szteren et al. 2006). Although census numbers indicate adeclining population, estimates of the population-growthrate for the Gulf seem to indicate a stable to slightly in-creasing population (Gonzalez-Suarez et al. 2006; Szterenet al. 2006). Another way to assess the status of the pop-ulation is to estimate the probability of a reduction inpopulation size over time. Gonzalez-Suarez et al. (2006)found that the probability of a 30% reduction in popula-
tion size after only 3 generations (15 years) was >65%for 8 of the 11 rookeries used in the analysis. Because ofthe uncertainty associated with census data and subse-quent population-growth rate estimates, it is difficult toascertain the true status of this population.
Recent reports estimate that 30,000 fishers in 18,000boats currently fish in the Gulf and that unregulated gill-net fishing has doubled in the last decade and continuesto grow (CONANP 2006). The type of fishing that mostcommonly conflicts with California sea lions is the setgill-net fishery (Julian & Beeson 1998; Aurioles-Gamboaet al. 2003). In fact, the threat of mortality due to inci-dental catch in gill nets is one of the gravest problemsfacing sea lions in this area (Zavala-Gonzalez & Mellink1997; Programa de Manejo, Islas del Golfo de California2000; Aurioles-Gamboa et al. 2003). Although the directimpact of gill-net fishing on the sea lion population in theGulf is unknown, incidental catch in gill and other fishingnets has contributed to population declines in northernfur seals (Callorhinus ursinus), harbor seals (Phoca vi-
tulina stejnegeri), and harp seals (P. groenlandica) andis at least partially responsible for declines in Steller sealions (Eumetopias jubatus) (Fowler 1987; Woodley &Lavigne 1991). In the Gulf, recent observations indicatean increased rate of entanglement in the northern Gulf(Zavala-Gonzalez & Mellink 1997). Increases in entangle-ment almost certainly signal an elevated rate of mortalitydue to incidental catch, which may be one of the prin-ciple reasons why sea lion populations in the northernGulf are in decline.
We devised a method to estimate the current levelof fishing pressure and a sustainable bycatch ratefor 11 breeding colonies found throughout the Gulf.We assumed movement was limited between breedingcolonies. Although movement between rookeries is pos-sible and occasionally does occur, the level of movementbetween rookeries is thought to be minimal on the ba-sis of genetic and mark-recapture studies in the Gulf(Maldonado et al. 1995; Gonzalez-Suarez et al. 2006;Young et al. 2007; Hernandez-Camacho et al., 2008a).This method for estimating sustainable bycatch rates can
Conservation Biology
Volume 22, No. 3, 2008
Underwood et al. 703
help managers in the Gulf establish a fishing strategy thatwill allow sea lion populations in the region to persist.These methods could also be applied to other marine birdand mammal species.
Methods
We estimated the current level of fishing around sea lionrookeries of the Gulf of California and the maximum fish-ing pressure that could be sustained while ensuring viablesea lion populations. To estimate the current level of fish-ing pressure, we used fisheries and sea lion entanglementdata from southern California and sea lion entanglementdata from the Gulf. To estimate the level of fishing thatwould maintain viable sea lion populations in the Gulf,we used 3 methods. All 3 estimate the number of sea lionsthat can be removed and still maintain a viable popula-tion. For each method, after we determined the potentialnumber of sea lions that could be removed, we translatedthe estimate into allowable fishing pressure by calculat-ing the fishing effort required to remove that number ofindividuals.
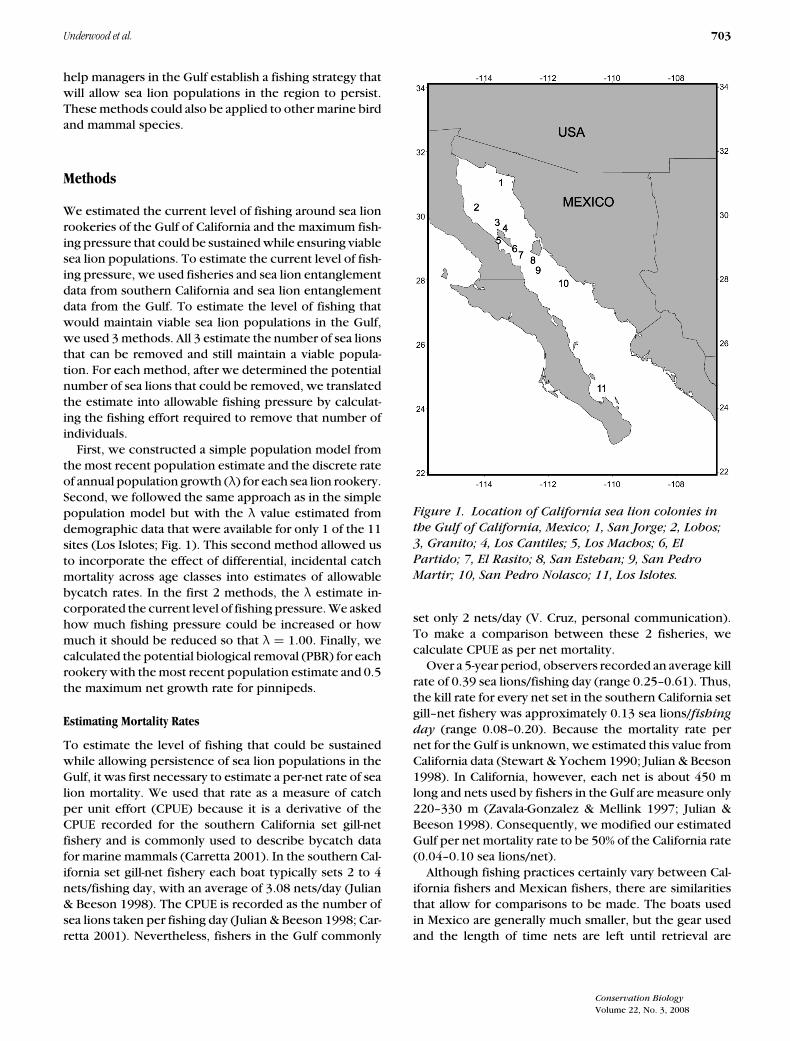
First, we constructed a simple population model fromthe most recent population estimate and the discrete rateof annual population growth (λ) for each sea lion rookery.Second, we followed the same approach as in the simplepopulation model but with the λ value estimated fromdemographic data that were available for only 1 of the 11sites (Los Islotes; Fig. 1). This second method allowed usto incorporate the effect of differential, incidental catchmortality across age classes into estimates of allowablebycatch rates. In the first 2 methods, the λ estimate in-corporated the current level of fishing pressure. We askedhow much fishing pressure could be increased or howmuch it should be reduced so that λ = 1.00. Finally, wecalculated the potential biological removal (PBR) for eachrookery with the most recent population estimate and 0.5the maximum net growth rate for pinnipeds.
Estimating Mortality Rates
To estimate the level of fishing that could be sustainedwhile allowing persistence of sea lion populations in theGulf, it was first necessary to estimate a per-net rate of sealion mortality. We used that rate as a measure of catchper unit effort (CPUE) because it is a derivative of theCPUE recorded for the southern California set gill-netfishery and is commonly used to describe bycatch datafor marine mammals (Carretta 2001). In the southern Cal-ifornia set gill-net fishery each boat typically sets 2 to 4nets/fishing day, with an average of 3.08 nets/day (Julian& Beeson 1998). The CPUE is recorded as the number ofsea lions taken per fishing day (Julian & Beeson 1998; Car-retta 2001). Nevertheless, fishers in the Gulf commonly
Figure 1. Location of California sea lion colonies in
the Gulf of California, Mexico; 1, San Jorge; 2, Lobos;
3, Granito; 4, Los Cantiles; 5, Los Machos; 6, El
Partido; 7, El Rasito; 8, San Esteban; 9, San Pedro
Martir; 10, San Pedro Nolasco; 11, Los Islotes.
set only 2 nets/day (V. Cruz, personal communication).To make a comparison between these 2 fisheries, wecalculate CPUE as per net mortality.
Over a 5-year period, observers recorded an average killrate of 0.39 sea lions/fishing day (range 0.25–0.61). Thus,the kill rate for every net set in the southern California setgill–net fishery was approximately 0.13 sea lions/fishing
day (range 0.08–0.20). Because the mortality rate pernet for the Gulf is unknown, we estimated this value fromCalifornia data (Stewart & Yochem 1990; Julian & Beeson1998). In California, however, each net is about 450 mlong and nets used by fishers in the Gulf are measure only220–330 m (Zavala-Gonzalez & Mellink 1997; Julian &Beeson 1998). Consequently, we modified our estimatedGulf per net mortality rate to be 50% of the California rate(0.04–0.10 sea lions/net).
Although fishing practices certainly vary between Cal-ifornia fishers and Mexican fishers, there are similaritiesthat allow for comparisons to be made. The boats usedin Mexico are generally much smaller, but the gear usedand the length of time nets are left until retrieval are
Conservation Biology
Volume 22, No. 3, 2008
704 Fisheries Bycatch and Sea Lions
similar (Zavala-Gonzalez & Mellink 1997; Julian & Beeson1998; Aurioles-Gamboa et al. 2003). In addition, in bothCalifornia and Mexico, fishers and sea lions do not pursuethe same species (Julian & Beeson 1998; Aurioles-Gamboaet al. 2003). Sea lions are caught incidentally as they en-ter an area with nets. Finally, the most important factorthat determines bycatch rate in pinnipeds is the size ofthe net mesh opening (Zavala-Gonzalez & Mellink 1997;Julian & Beeson 1998; Aurioles-Gamboa et al. 2003). Sealions cannot enter nets with a small mesh size and canswim through nets with a large mesh size. Sea lions aremost commonly caught in gill nets with a mesh size of20–22 cm, which is the mesh size for gill nets in boththe Californian and Mexican set gill-net fisheries (Julian& Beeson 1998; Aurioles-Gamboa et al. 2003).
Estimating Fishing Pressure
We estimated fishing pressure by incorporating data onentanglement and number of total nets fished from south-ern California with entanglement information from theGulf (Stewart & Yochem 1990; Zavala-Gonzalez & Mellink1997; Julian & Beeson 1998; Carretta 2001). We estimatedcurrent fishing pressure for each rookery in the Gulf (Fg)as
Fg = E g × Fc
Ec,
where Eg is the rookery-specific number of entangledindividuals for the Gulf (0–29), Fc is the estimated numberof nets set per year in the southern California set gill-netfishery (5,984–22,086), and Ec is the estimated numberof individuals entangled per year from California (97–193). This annual estimate of entanglement refers onlyto live individuals currently entangled in fishing debris;animals with old entanglement wounds or scars were notincluded in these estimates.
This approach was used to identify an estimated num-ber of nets set per year around each rookery in the Gulfand to identify the highest and lowest number of netsset to incorporate uncertainty associated with these data.Because the gill nets used by fishers in the Gulf are ap-proximately half as long as those used in California, wedoubled the estimate derived from the equation to nor-malize the size of the nets with those from southern Cal-ifornia. When calculating the upper and lower estimatesof fishing pressure, the highest (upper) or lowest (lower)estimates available for entanglement at a specific Gulfrookery and the highest or lowest estimates of entangle-ment and number of nets from California were used.
To obtain entanglement values for each rookery in theGulf, we used 5 years of entanglement records, in whicheach rookery was sampled once a year (Zavala-Gonzalez& Mellink 1997; Aurioles-Gamboa et al. 2003). We useda comparable 5-year data set from the Channel Islandsof California to obtain California entanglement estimates
(Stewart & Yochem 1990) and a 5-year data set fromsouthern California, where fisheries data were collectedby onboard observers as part of a National Marine Fish-eries Service and California Department of Fish and Gameproject to estimate total number of nets set per year inthe set gill-net fisheries (Julian & Beeson 1998). Popula-tion estimates for southern California were derived fromLowry and Maravilla-Chavez (2005). Although entangle-ment and fisheries data were collected asynchronouslyto the most recent population estimate, the most recentpopulation estimates were used to provide an approxi-mation of current fishing pressure.
Estimating Sustainable Levels of Bycatch: SimplePopulation-Growth Model
One metric of population viability is the mean andvariance in the discrete rate of λ. We used a simplepopulation-growth model to estimate the level of fishingpressure that would sustain sea lion populations giventhe constraint of λ = 1.00. We used recent estimates oftotal population size and λ for each rookery (Gonzalez-Suarez et al. 2006; Szteren et al. 2006) to determine thenumber of individuals produced (Np) annually at eachrookery:
Np = Nt+1 − Nt ,
where
Nt+1 = λt Nt
and Nt is defined as the population size (N) at a giventime (t). The population size (Nt) is derived from themost recent census data for all age classes at each rook-ery. We calculated the level of allowable fishing pressureby estimating the number of “surplus” individuals pro-duced annually by increasing populations (λ > 1.00) orthe number of individuals that would be needed so as toreverse the trend of a declining populations (λ < 1.00)such that λ = 1.00. We used this estimate to determinethe level of additional fishing pressure allowable, or thelevel by which current fishing pressure should be re-duced, to maintain sea lion populations.
This annual production estimate (Np) was calculatedfor the best predicted λ value, and for the upper andlower 95% confidence interval, λ value estimates foreach rookery. Gonzalez-Suarez et al. (2006) used thediffusion-approximation model to estimate λ for eachrookery (Dennis et al. 1991) and proposed that the best-predicted λ value is the most robust estimate of popula-tion growth (Gonzalez-Suarez et al. 2006). The diffusion-approximation model uses linear regression to estimatethe general trend and variability in λ. Data used to es-timate λ consisted of periodic census information col-lected since the late 1960s for each of the 11 rookeries(Gonzalez-Suarez et al. 2006). We considered the upper
Conservation Biology
Volume 22, No. 3, 2008
Underwood et al. 705
and lower production estimates for Np in our analyses soas to incorporate uncertainty in estimates of λ.
We then divided these production estimates by the es-timated per-net mortality rate (M) (lower, average, upperestimates) to generate the approximate number of netsets (Fe) required to maintain λ ≤ 1.00,
Fe = Np
M.
The Fe was then converted to number of fishing days bydividing Fe by 2. A fishing day is defined as 1 fisher/boatsetting and retrieving 1 day’s worth of nets. We dividedFe by 2 because that is the estimated number of nets setper day for a Mexican fisher. A fisher who fishes everyday of the year would accumulate 365 fishing days. Someislands have current levels of fishing that exceed 365fishing days; this implies that more than 1 fisher/boat isusing that area (5 fishers fishing every day equals 1825fishing days). We used number of fishing days because itis a standard metric of CPUE.
Estimating Sustainable Levels of Bycatch: Demographic Model
Although estimates from our population-growth modelprovide a basic understanding of how fishing might affecta rookery, these estimates do not consider demographicdifferences in mortality and the effect that these differ-ences have on λ. Demographic information sufficient toallow the construction of a Leslie matrix was available forone rookery in the Gulf (Los Islotes). To more accuratelyidentify sustainable bycatch levels for Los Islotes, we de-veloped an age-structured Leslie-matrix model to explorethe sensitivity of sea lion population growth to bycatchmortality. In this model λ was estimated as the dom-inant eigenvalue from the Leslie matrix. Because eachrookery has potentially different demographic parame-ters, we could only apply our model to the Los Islotesrookery. Nevertheless, we expect that the broader con-clusions drawn from this analysis may apply to the otherrookeries in the Gulf.
The model was populated with demographic data froma cohort life table for females at Los Islotes Island in thesouthern Gulf (Hernandez-Camacho et al. 2008b). Fer-tility estimates were only available for sea lions aged10–19 years (Hernandez-Camacho et al. 2008a). Thus,estimates for younger individuals were derived from val-ues reported for California sea lions at San Miguel Island,California (Melin 2002).
We performed an elasticity analysis to determine therelative impact of age-specific fertility and survival onλ (Caswell 2001). Although the model was age-based,the matrices were analyzed by age groups: juveniles (0–3 years old), young adults (4–7 years old), adults (8–11years old), and old adults (12–18 years old). To obtain asingle value for each age group, we summed the age-specific elasticities for age classes included in that agegroup (Caswell 2001).
We used our demographic model to consider 2 scenar-ios with distinct incidental catch probabilities for juvenileand adult animals. For the first scenario we assumed thatall individuals had an equal chance of mortality due toincidental catch, similar to our assumption in the simplepopulation-growth model. We based this assumption onthe fact that the proportion of individuals that were seenentangled at Los Islotes was the same as their overall pro-portion in the population (Aurioles-Gamboa et al. 2003).This first scenario estimated the level of mortality in allage classes that would generate the minimum sustainablepopulation-growth rate (λ = 1.00).
Because the actual proportion of individuals in eachage class that die as incidental catch is unknown, oursecond scenario addresses how the population-growthrate would be affected if those dying in the nets are alljuveniles. Juveniles are the most commonly observed en-tangled animals at the majority of rookeries in the Gulf(Zavala-Gonzalez & Mellink 1997). In addition, in Stellersea lions, juveniles are more likely than adults to becomeentangled in fishing nets (NRC 2003). In our second sce-nario we focused on identifying the increased juvenilemortality rate that would cause the entire population’sgrowth rate to reach the equilibrium rate of λ = 1.00.
We used the estimated mortality rates and the mostrecent population census data to estimate the number ofindividuals that could be removed from the populationwhile maintaining λ = 1.00. This estimate of individu-als was divided by the estimated per-net mortality rate(M) (lower, average, upper estimates) to generate the ap-proximate number of net sets (Fe) allowable. In this way,uncertainty in population growth could be considered inmanagement decisions.
Estimating Sustainable Levels of Bycatch: Potential BiologicalRemoval
To compare results from our simple population modeland demographic model to standard methods used bythe U.S. National Oceanic and Atmospheric Administra-tion, we also estimated the potential biological removal(PBR) for sea lions in the Gulf. The goal of this approach isto ensure that marine mammal stocks are maintained at alevel at which they are a functioning component of theirecosystem (Barlow et al. 1995). A PBR calculation pro-vides the allowable level of removal from the populationas a number of individuals. The PBR for the Californiasea lions is calculated as the minimum population sizetimes 0.5 the maximum growth rate for pinnipeds (0.5of 12%) times a recovery factor of 1.0 (NMFS 2003). Wecalculated PBR for each sea lion rookery in the Gulf toprovide a site-specific estimate of the number of sea lionsthat can be removed. These production estimates werethen divided by the estimated per-net mortality rate (M)(lower, average, upper estimates) to generate the approx-imate number of net sets (Fe) allowable.
Conservation Biology
Volume 22, No. 3, 2008
706 Fisheries Bycatch and Sea Lions
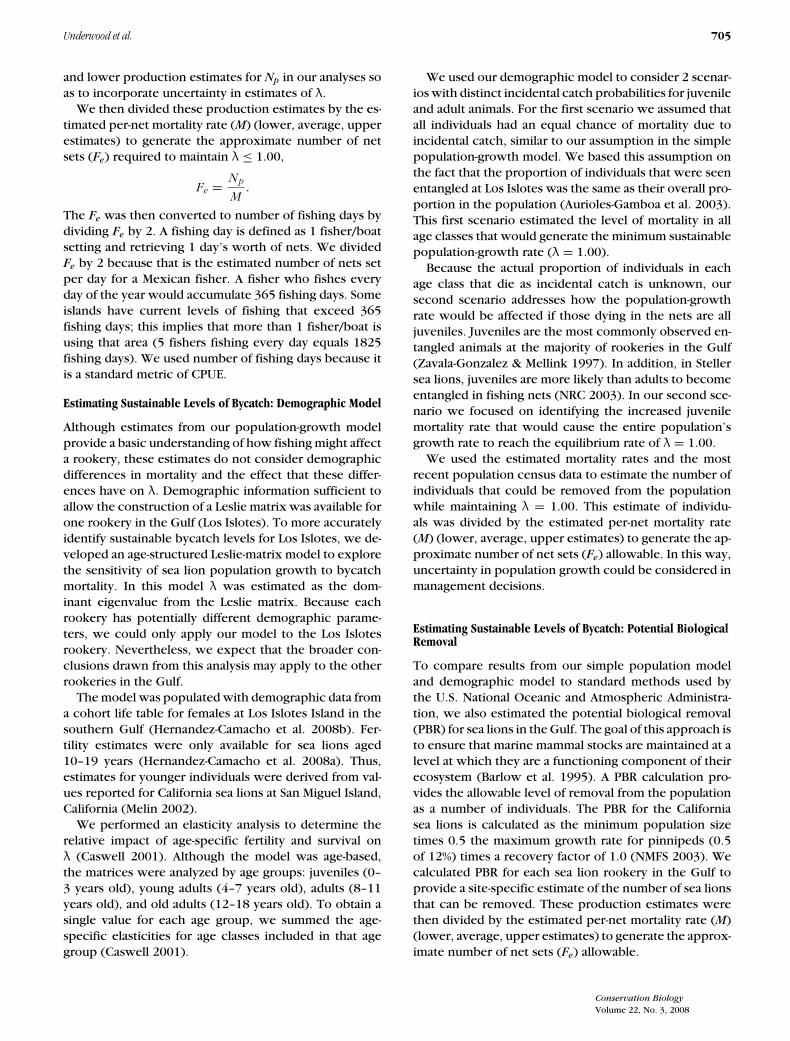
Table 1. Estimated level of current fishing pressure around Californiasea lion rookeries in the Gulf of California, Mexico.
Estimate of fishing Range of no. ofRookery days∗/year fishing days/year
San Jorge 1444 402–3,290Lobos 591 144–1,718Granito 444 89–1,485Los Cantiles 210 55–479Los Machos 101 0–405El Partido 223 69–493El Rasito 241 0–961San Esteban 1718 419–3,307San Pedro Martir 936 51–2,171San Pedro Nolasco 230 0–664Los Islotes 1887 842–3,140Total 8024 2,072–18,113
∗A fishing day is defined as 1 fisher/boat setting and retrieving 1
day’s worth of nets (2 nets). When the estimated number of fishing
days at a rookery exceeds 365 this implies that multiple fishers are
using a site. These estimates are not derived from empirical data
but from an extrapolation of entanglement data.
Results
Current Fishing Pressure
The areas around certain rookeries were more commonlyfished than others (Table 1; Fig. 2). The amount of cur-rent fishing pressure ranged from a minimal number offishing days around Los Machos (101) to over a thousandfishing days around rookeries such as San Jorge (1444),San Esteban (1718), and Los Islotes (1887).
Figure 2. Current estimated fishing pressure around
each sea lion rookery in the Gulf of California,
Mexico, measured as number of fishing days.
Simple Population-Growth Model
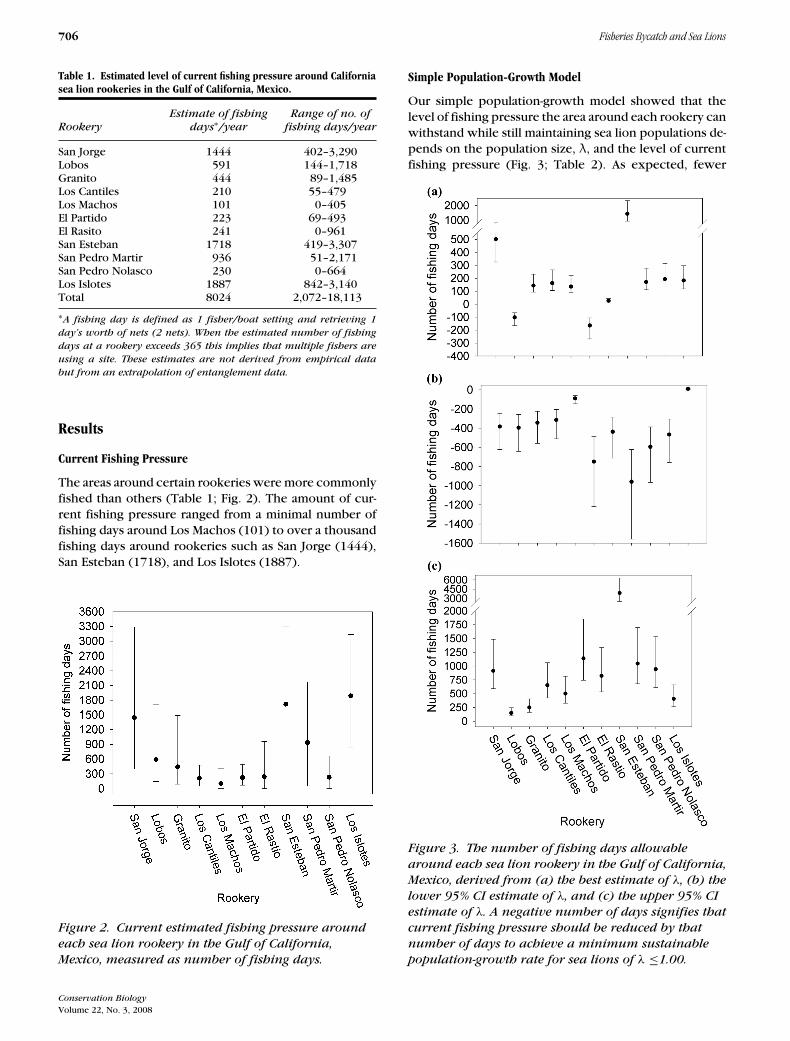
Our simple population-growth model showed that thelevel of fishing pressure the area around each rookery canwithstand while still maintaining sea lion populations de-pends on the population size, λ, and the level of currentfishing pressure (Fig. 3; Table 2). As expected, fewer
Figure 3. The number of fishing days allowable
around each sea lion rookery in the Gulf of California,
Mexico, derived from (a) the best estimate of λ, (b) the
lower 95% CI estimate of λ, and (c) the upper 95% CI
estimate of λ. A negative number of days signifies that
current fishing pressure should be reduced by that
number of days to achieve a minimum sustainable
population-growth rate for sea lions of λ ≤1.00.
Conservation Biology
Volume 22, No. 3, 2008
Underwood et al. 707
Table 2. The range of additional fishing days allowable estimated from the potential biological removal (PBR) calculation and a simplepopulation-growth model (with the associated values of λ) for 11 California sea lion rookeries in the Gulf of California, Mexico.a
Best estimate Lower CI estimateb Upper CI estimateb
Abundance estimate PBRRookery (year estimated) fishing days λ fishing days λ fishing days λ fishing days
San Jorge 3833 (2004) 1150 to 2875 1.02 326 to 815 0.99 −623 to −249 1.03 594 to 1485Los Cantiles 634 (2004) 190 to 476 0.98 −166 to −67b 0.92 −642 to −257 1.03 98 to 246Los Machos 580 (2004) 174 to 435 1.03 93 to 232 0.92 −558 to −253 1.06 162 to 406El Partido 449 (2004) 135 to 337 1.05 106 to 264 0.91 −511 to −204 1.19 424 to 1061El Rasito 375 (2004) 113 to 281 1.05 88 to 220 0.97 −145 to −58 1.17 326 to 816Lobos 1950 (2004) 585 to 1463 0.99 −268 to −107 0.95 −1219 to −488 1.08 741 to 1853Granito 848 (2004) 254 to 636 1.00 17 to 42 0.93 −710 to −284 1.13 534 to 1336San Esteban 5666 (2004) 1700 to 4250 1.03 935 to 2337 0.98 −1558 to −623 1.09 2521 to 6303San Pedro Martir 1171 (2004) 351 to 878 1.02 111 to 278 0.93 −966 to −386 1.12 679 to 1698San Pedro Nolasco 659 (1997) 198 to 494 1.04 125 to 313 0.91 −758 to −303 1.19 613 to 1532Los Islotes 439 (2004) 132 to 329 1.05 119 to 296 1.00 7 to 16 1.12 263 to 659
aA negative number of days signifies that current fishing pressure should be reduced by that number of days to achieve a minimum
sustainable population-growth rate of λ = 1.00 for sea lions.bTo incorporate uncertainty, we include the upper and lower 95% confidence estimates for λ so managers have a range to guide management
decisions.
allowable fishing days could be sustained around rook-eries with small population size, low λ, or high fishingpressure. When the best estimates of λ were used, onlythe areas around the Lobos and Los Cantiles rookeries re-quired a reduction in fishing pressure. For areas aroundother rookeries the number of additional fishing dayspermissible varied widely. The number of fishing days al-lowable was reasonably large around San Esteban (935–2337), which has a large sea lion population (5000–6000animals). Nevertheless, around the similar-sized rookeryof San Jorge (3000–4000 animals), a λ close to 1.00 signif-icantly reduced the number of fishing days (594–1485).Finally, the number of fishing days was even more lim-ited when the sea lion population was small such as at ElRasito (300–400 animals), which despite having one ofthe highest population-growth rates, could only sustain88–220 additional fishing days.
For the area around all but one rookery, when thelowest estimate for λ was used, our model suggested thatfishing pressure should be reduced to maintain sea lionpopulations. When the highest estimated λ value wasused, the area around all rookeries could sustain someadditional fishing pressure.
Demographic Model
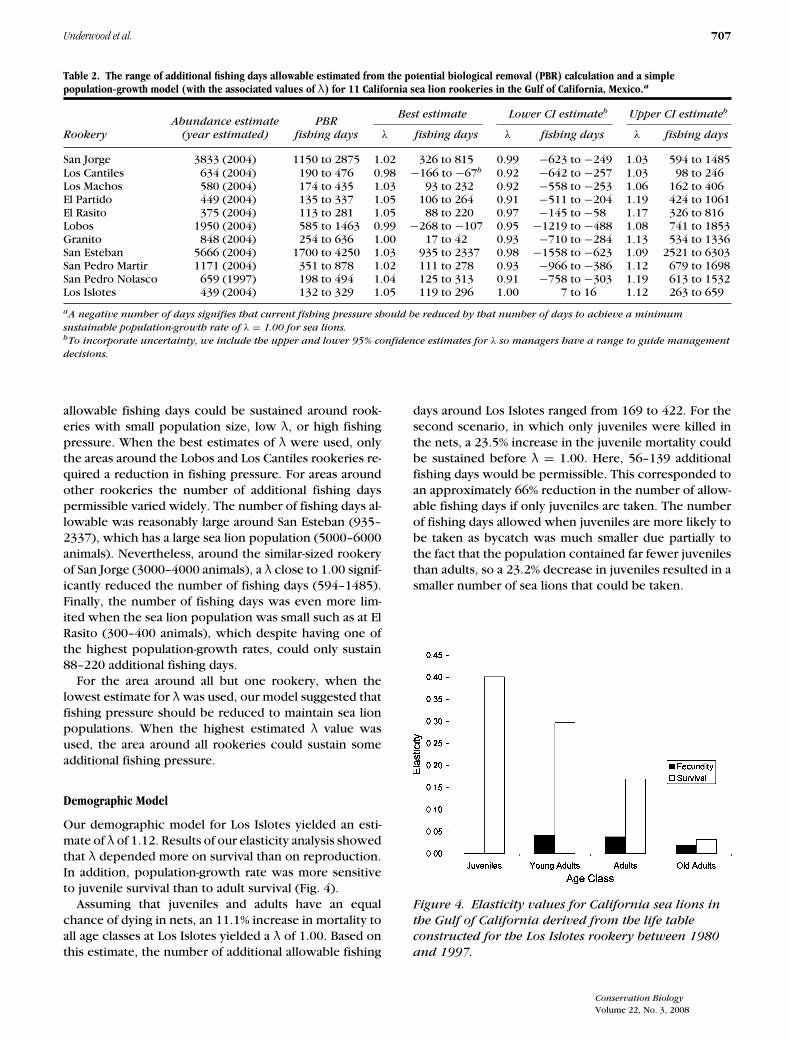
Our demographic model for Los Islotes yielded an esti-mate of λ of 1.12. Results of our elasticity analysis showedthat λ depended more on survival than on reproduction.In addition, population-growth rate was more sensitiveto juvenile survival than to adult survival (Fig. 4).
Assuming that juveniles and adults have an equalchance of dying in nets, an 11.1% increase in mortality toall age classes at Los Islotes yielded a λ of 1.00. Based onthis estimate, the number of additional allowable fishing
days around Los Islotes ranged from 169 to 422. For thesecond scenario, in which only juveniles were killed inthe nets, a 23.5% increase in the juvenile mortality couldbe sustained before λ = 1.00. Here, 56–139 additionalfishing days would be permissible. This corresponded toan approximately 66% reduction in the number of allow-able fishing days if only juveniles are taken. The numberof fishing days allowed when juveniles are more likely tobe taken as bycatch was much smaller due partially tothe fact that the population contained far fewer juvenilesthan adults, so a 23.2% decrease in juveniles resulted in asmaller number of sea lions that could be taken.
Figure 4. Elasticity values for California sea lions in
the Gulf of California derived from the life table
constructed for the Los Islotes rookery between 1980
and 1997.
Conservation Biology
Volume 22, No. 3, 2008
708 Fisheries Bycatch and Sea Lions
Potential Biological Removal
The PBR calculation yielded permissible fishing pressureestimates that were generally within the range calculatedwith the other methods (Table 2). The number of allow-able fishing days ranged from 113 to 281 around El Rasitoto several thousand fishing days around rookeries such asSan Jorge (1150–2875) and San Esteban (1700–4250). Be-cause this method assumed populations for all rookerieswere increasing, no reduction in fishing pressure wouldbe required.
Discussion
There are several hypotheses for why California sea lionsin certain areas of the Gulf are in decline. Szteren et al.(2006) hypothesize that the decline is associated witha reduction in sardine (Sardinops sagax) populations.Although a reduction in sardines may be a contributingfactor, we propose that recent declines might also be re-lated to an increase in fishing effort and associated sealion bycatch. For example, census data for all but 1 of the8 (Granito, Los Cantiles, Los Machos, El Rasito, Lobos, SanPedro Martir, San Esteban, and El Partido) sea lion rook-eries in the central Gulf show a population decrease of13–61% since the early 1990s (Szteren et al. 2006). Thisdecline occurred at the same time that Zavala-Gonzalezand Mellink (1997) found that fishing pressure and en-tanglement had increased in that area of the Gulf.
Our results shows that little additional fishing pres-sure would represent a significant threat to sea lion vi-ability, especially if fishing pressure disproportionatelyaffects the juvenile age class. Results from our demo-graphic model highlight the importance of consideringdemographic differences among life stages in estimatingfishing pressure that will sustain viable sea lion popu-lations. In particular, on the basis of reported elasticitypattern, when juveniles are disproportionately taken asbycatch, this will reduce the allowable fishing pressure.
Current Fishing Pressure
Current fishing pressure around most rookeries appearsto be relatively limited. Although 18,000 boats regularlyfish the Gulf, there are vast stretches of shoreline thatdo not harbor California sea lions; therefore, conflict be-tween fishing and sea lions in these areas is minimal. Inaddition, only some fishers use the techniques and gearthat commonly ensnare sea lions (Aurioles-Gamboa et al.2003). Finally, because rookeries are generally fairly iso-lated, these regions may be less geographically desirableto fisherman compared to areas in close proximity totowns. Nevertheless, all of the rookeries currently expe-riencing the greatest level of fishing pressure are closeto major population centers either in Baja California or
on mainland Mexico. The San Jorge rookery (1444 fishingdays) is close to the popular tourist destination and majorport town of the northern Gulf, Puerto Penasco/RockyPoint. The Los Islotes rookery (1887 fishing days) is inBahia La Paz and is very close to the capital city of BajaSur, La Paz. Finally, the San Esteban rookery (1718 fish-ing days) is close to the town of Bahia Kino, which is theonly major town along the Gulf in the state of Sonora,Mexico. As these and other towns continue to grow, theareas around rookeries will almost certainly experienceadditional fishing pressure.
Regardless of the level of current fishing pressure, itis important to understand the precarious balance thatnow exists between sea lions and local fishing communi-ties. As one can see from the El Partido example, even arookery that presently has relatively low levels of fishing(69–493 fishing days) can support relatively little addi-tional fishing pressure (106–338 fishing days) withoutinfluencing the viability of California sea lions.
Caveats
At rookeries where populations are currently declining,bycatch is probably not the only contributing factor. TheLos Cantiles and Lobos rookeries are both thought to bedeclining, yet the current estimated fishing pressure isnot drastically different from that experienced by otherrookeries in the Gulf. Other factors such as sardine pro-duction may be affecting these rookeries. Nevertheless,a reduction in fishing pressure surrounding these rook-eries might positively affect the population. Reductionin fishing pressure positively affects population growth(Woodley & Lavigne 1991), and this was the main reasonfor the nearshore fishing closures in California (Carretta2001). In addition, the prohibition of fishing camps inthe area around Los Islotes in the Gulf has resulted in a75–80% reduction in annual entanglement between 2002and 2005.
There is considerable uncertainty associated with ourresults. To obtain data sufficient to more accurately guidepolicy, one would need to know much more about theinteraction of the set gill-net fishery and the Californiasea lion. Data needs include the mortality rate for sealions entangled in nets, the number that become entan-gled each year, differential survival across sex and ageclasses, actual site-specific information on fishing effort,and variability of the interaction as it relates to temporaland spatial placement of nets. Better demographic andlife-history data for islands other than Los Islotes wouldalso be needed. In addition, because estimates of entan-glement and current population size were not collectedsimultaneously, if fishing pressure has changed dramati-cally, our estimates of sustainable bycatch may be over-or underestimates. Bayesian approaches could also be
Conservation Biology
Volume 22, No. 3, 2008
Underwood et al. 709
applied to incorporate this uncertainty as data becomeavailable (Hilborn & Mangel 1997).
Several additional factors could alter the estimatednumber of allowable fishing days. First, if fishers alteredspatial or temporal fishing practices, this could alter thenumber of allowable fishing days. Second, populationcensus data were collected during summer months whensea lion numbers at each rookery peak. Thus, the num-ber of allowable days would also fluctuate on the basis ofthe population size. Although the number of sea lions ateach rookery fluctuates throughout the year, a significantportion of the breeding population uses the rookery yearround. Finally, juvenile and possibly adult abundance arelikely to be density-dependent, which may violate the as-sumptions of the diffusion approximation model that weused to calculate λ. Nevertheless, Sabo et al. (2004) foundthat under certain types of density dependence, althoughthe assumption of density dependence is violated, thediffusion approximation methods can still accurately andconservatively estimate population viability parameters.
Despite these caveats, we believe our results can con-tribute to fisheries management plans so that viable sealion populations can persist in the Gulf (Fig. 3; Table 2).We used 3 estimates for λ (best, lower, and upper) andthe PBR calculation method to identify a range of poten-tial guidelines. We believe this will allow managers tochoose a set of results on the basis of their level of riskaversion. Nevertheless, until the actual fishing pressureat each site is known, managers can use allowable fishingestimates created with the lowest estimate of λ to ensureprecautionary approach to management.
Conclusion
One of the great difficulties in conservation biology is thedual goal of sustaining local economies without damag-ing the resources on which economies depend. In theGulf, 30,000 fishers and their families depend on the seafor a livelihood (CONANP 2006). Our models show thatwell-managed fishing around the islands of the Gulf is nec-essary for the California sea lion to persist. This does notmean fishing should be eliminated; rather, certain typesof fishing and fishing equipment around sea lion rook-eries and feeding areas should be regulated carefully. Weanticipate that analyses such as those we describe heremay be applied to other locations and for other marinemammal or bird species.
Acknowledgments
This research was partially supported by a grant toL.R.G. from the National Science Foundation (AnimalBehavior, Biological Oceanography, and InternationalPrograms; award 0347960) and by a grant to D.A.
from CONACYT-SEMARNAT (project 2002-C01-1230).We thank R. Fredrickson, M. Gonzalez-Suarez, and mem-bers of the L. Gerber lab for insightful comments on thismanuscript. SEMARNAT authorized data collection in theGulf (Oficio num/SGPA/DGVS/04160).
Literature Cited
Aurioles-Gamboa, D., F. Garcıa- Rodrıguez, M. Ramirez-Rodriguez, andC. J. Hernandez-Camacho. 2003. Interaction between the Californiasea lion and the artisanal fishery in La Paz Bay, Gulf of California,Mexico. Ciencias Marinas 29:357–370.
Barlow, J., S. L. Swartz, T. C. Eagle, and P. R. Wade. 1995. U.S. marinemammal stock assessments: guidelines for preparation, background,and a summary of the 1995 assessments. Technical memorandumNMFS-OPR-6. National Oceanic and Atmospheric Administration, LaJolla, California.
Carretta, J. V. 2001. Preliminary estimates of cetacean mortality in Cali-fornia gill net fisheries for 2000. Report SC/53/SM9. National MarineFisheries Service, La Jolla, California.
Caswell, H. 2001. Matrix population models: construction analysis andinterpretation. 2nd edition. Sinauer Associates, Sunderland, Mas-sachusetts.
Comision Nacional de Areas Naturales Protegidas (CONANP). 2006.Estudio previo justificativo para el establecimiento del Area NaturalProtegida “Parque Nacional Espıritu Santo.” Secretaria del MedioAmbiente y Recursos Naturales. Ciudad de Mexico, Mexico.
Dennis, B., P. L. Munholland, and J. M. Scott. 1991. Estimation of pop-ulation growth and extinction parameters for endangered species.Ecological Monographs 61:115–143.
Fowler, C. W. 1987. Marine debris and northern fur seals: a case study.Marine Pollution Bulletin 18:326–335.
Gonzalez-Suarez, M., K. E. McCluney, D. Aurioles, and L. R. Gerber.2006. Incorporating uncertainty in spatial structure for viability pre-dictions: a case study of California sea lions (Zalophus californianus
californianus). Animal Conservation 9:219–227.Hernandez-Camacho, C. J., D. Aurioles-Gamboa, and L. R. Gerber.
2008a. Age-specific birth rates of California sea lions (Zalophus cal-
ifornianus californianus) in the Gulf of California, Mexico. MarineMammal Science: In Press.
Hernandez-Camacho, C. J., D. Aurioles-Gamboa, J. Laake, and L. R. Ger-ber. 2008b. Survival rates of the California sea lion, Zalophus cali-
fornianus, in Mexico. Journal of Mammalogy: In Press.Hilborn, R., and M. Mangel. 1997. The ecological detective. Princeton
University Press, Princeton, New Jersey.Julian, F., and M. Beeson. 1998. Estimates of marine mammal, turtle, and
seabird mortality for two California gill net fisheries: 1990–1995.Fishery Bulletin 96:271–284.
Lowry, M. S., and O. Maravilla-Chavez. 2005. Recent abundance of Cal-ifornia sea lions in Western Baja California, Mexico and the UnitedStates. Pages 485–497 in D. K. Garcelon and C. A. Schwemm, edi-tors. Proceedings of the sixth California Islands symposium. NationalPark Service technical publication CHIS-05-01. Institute for WildlifeStudies, Arcata, California.
Maldonado, E. J., F. Orta-Davila, B. S. Stewart, E. Geffen, and R. K.Wayne. 1995. Intraspecific genetic differentiation in California sealion (Zalophus californianus) from southern California and Gulf ofCalifornia. Marine Mammal Science 11:46–58.
Melin, S. 2002. The foraging ecology and reproduction of the Californiasea lion (Zalophus californianus californianus). PhD dissertation.University of Minnesota, Minneapolis.
NMFS (National Marine Fisheries Service). 2003. Stock assessment of theCalifornia sea lion. NMFS, La Jolla, California. Available from http://www.nmfs.noaa.gov/pr/pdfs/sars/PO03casealion.pdf (accessedJuly 2007).
Conservation Biology
Volume 22, No. 3, 2008
710 Fisheries Bycatch and Sea Lions
NRC (National Research Council). 2003. Decline of the Steller sea lionin Alaskan waters. Untangling food webs and fishing nets. NationalAcademic Press, Washington, D.C.
Odell, D. K. 1981. California sea lion—Zalophus californianus. Pages67–97 in S. H. Ridgway and R. J. Harrison, editors. Handbook ofmarine mammals. Volume 1. Academic Press, London.
Programa de Manejo. Area de proteccion de flora y fauna. Islas del Golfode California., Mexico. 2000. Comision Nacional de Areas NaturalesProtegidas. Secretaria del Medio Ambiente y Recursos Naturales,Ciudad de Mexico, Mexico.
Read, A. J., P. Drinker, and S. Northridge. 2006. Bycatch of marine mam-mals in U.S. and global fisheries. Conservation Biology 20:163–169.
Sabo, J. L., E. E. Holmes, and P. Kareiva. 2004. Efficacy of simple viabil-ity models in ecological risk assessment: does density dependencematter? Ecology 85:328–341.
Stewart, B. S., and P. K. Yochem. 1990. Pinniped entanglement in syn-thetic material in the southern California bight. Pages 554–561 inR. S. Shomura and M. L. Godfrey, editors. Proceedings of the Sec-ond International Conference on Marine Debris. U.S. Department
of Commerce., NOAA Technical Memo. NMFS-SWFSC-154, La Jolla,California.
Szteren, D., D. Aurioles, and L. Gerber. (2006) Population status andtrend of the California sea lion (Zalophus californianus californi-
anus) in the Gulf of California, Mexico. Pages 369–384 in A. W.Trites, S. K. Atkinson, D. P. DeMaster, L. W. Fritz, T. S. Gelatt, L. D.Rea, and K. M. Wynne, editors. Sea lions of the world. 22nd Low-ell Wakefield fisheries symposium. Alaska Sea Grant, University ofAlaska, Fairbanks.
Woodley, T. H., and D. M. Lavigne. 1991. Incidental capture of pin-nipeds in commercial fishing gear. Technical report 91-01. Interna-tional Marine Mammal Association Guelph, Ontario.
Young, K. J., C. J. Hernandez-Camacho, and L. R. Gerber. 2007. Long-distance movement of a pinniped neonate. Marine Mammal Science23:926–930.
Zavala-Gonzalez, G. A., and E. Mellink. 1997. Entanglement of Californiasea lions, Zalophus californianus californianus, in fishing gear inthe central-northern part of the Gulf of California. Fishery Bulletin95:180–184.
Conservation Biology
Volume 22, No. 3, 2008
Related Documents


