July 8, 2008 9:34 WSPC/Trim Size: 11in x 8.5in for Proceedings 080Narasimhan 73 ESTIMATING SUPPORT FOR PROTEIN-PROTEIN INTERACTION DATA WITH APPLICATIONS TO FUNCTION PREDICTION Erliang Zeng Bioinformatics Research Group (BioRG), School of Computing and Information Sciences Florida International University Miami, FL 33199, USA Email: ezeng001@cs.fiu.edu Chris Ding Department of Computer Science and Engineering, University of Texas at Arlington Arlington, TX 76019, USA Email: [email protected] Giri Narasimhan * Bioinformatics Research Group (BioRG), School of Computing and Information Sciences Florida International University Miami, FL 33199, USA Email: giri@cs.fiu.edu Stephen R. Holbrook † Computational Research Division, Lawrence Berkeley National Laboratory Berkeley, CA 94720, USA Email: [email protected] Almost every cellular process requires the interactions of pairs or larger complexes of proteins. High throughput protein-protein interaction (PPI) data have been generated using techniques such as the yeast two-hybrid systems, mass spectrometry method, and many more. Such data provide us with a new perspective to predict protein functions and to generate protein-protein interaction networks, and many recent algorithms have been developed for this purpose. However, PPI data generated using high throughput techniques contain a large number of false positives. In this paper, we have proposed a novel method to evaluate the support for PPI data based on gene ontology information. If the semantic similarity between genes is computed using gene ontology information and using Resnik’s formula, then our results show that we can model the PPI data as a mixture model predicated on the assumption that true protein- protein interactions will have higher support than the false positives in the data. Thus semantic similarity between genes serves as a metric of support for PPI data. Taking it one step further, new function prediction approaches are also being proposed with the help of the proposed metric of the support for the PPI data. These new function prediction approaches outperform their conventional counterparts. New evaluation methods are also proposed. 1. INTRODUCTION Protein-protein interactions (PPI) are essential for cellular activities considering the fact that almost every biological function requires the cooperation of many proteins. Recently, many high-throughput methods have been developed to detect pairwise protein-protein interactions. These methods include the yeast two-hybrid approach, mass spectrometry techniques, genetic interactions, mRNA coexpres- sion, and in silico methods 1 . Among them, the yeast two-hybrid approach and mass spectrometry tech- niques aim to detect physical binding between pro- teins. The huge amount of protein-protein interac- tion data provide us with a means to begin elu- cidating protein function. Functional annotation of proteins is a fundamental problem in the post- genomic era. To date, a large fraction of the pro- * Corresponding author. † Corresponding author.

Welcome message from author
This document is posted to help you gain knowledge. Please leave a comment to let me know what you think about it! Share it to your friends and learn new things together.
Transcript
July 8, 2008 9:34 WSPC/Trim Size: 11in x 8.5in for Proceedings 080Narasimhan
73
ESTIMATING SUPPORT FOR PROTEIN-PROTEIN INTERACTION DATA WITH APPLICATIONS
TO FUNCTION PREDICTION
Erliang Zeng
Bioinformatics Research Group (BioRG), School of Computing and Information SciencesFlorida International University
Miami, FL 33199, USAEmail: [email protected]
Chris Ding
Department of Computer Science and Engineering, University of Texas at ArlingtonArlington, TX 76019, USAEmail: [email protected]
Giri Narasimhan∗
Bioinformatics Research Group (BioRG), School of Computing and Information SciencesFlorida International University
Miami, FL 33199, USAEmail: [email protected]
Stephen R. Holbrook†
Computational Research Division, Lawrence Berkeley National LaboratoryBerkeley, CA 94720, USAEmail: [email protected]
Almost every cellular process requires the interactions of pairs or larger complexes of proteins. High throughput
protein-protein interaction (PPI) data have been generated using techniques such as the yeast two-hybrid systems,
mass spectrometry method, and many more. Such data provide us with a new perspective to predict protein functionsand to generate protein-protein interaction networks, and many recent algorithms have been developed for this purpose.
However, PPI data generated using high throughput techniques contain a large number of false positives. In this paper,
we have proposed a novel method to evaluate the support for PPI data based on gene ontology information. If thesemantic similarity between genes is computed using gene ontology information and using Resnik’s formula, then our
results show that we can model the PPI data as a mixture model predicated on the assumption that true protein-
protein interactions will have higher support than the false positives in the data. Thus semantic similarity betweengenes serves as a metric of support for PPI data. Taking it one step further, new function prediction approaches
are also being proposed with the help of the proposed metric of the support for the PPI data. These new function
prediction approaches outperform their conventional counterparts. New evaluation methods are also proposed.
1. INTRODUCTION
Protein-protein interactions (PPI) are essential forcellular activities considering the fact that almostevery biological function requires the cooperationof many proteins. Recently, many high-throughputmethods have been developed to detect pairwiseprotein-protein interactions. These methods includethe yeast two-hybrid approach, mass spectrometrytechniques, genetic interactions, mRNA coexpres-
sion, and in silico methods1. Among them, the yeasttwo-hybrid approach and mass spectrometry tech-niques aim to detect physical binding between pro-teins.
The huge amount of protein-protein interac-tion data provide us with a means to begin elu-cidating protein function. Functional annotationof proteins is a fundamental problem in the post-genomic era. To date, a large fraction of the pro-
∗Corresponding author.†Corresponding author.
July 8, 2008 9:34 WSPC/Trim Size: 11in x 8.5in for Proceedings 080Narasimhan
74
teins have no assigned functions. Even for one of themost well-studied organisms such as Saccharomycescerevisiae, about a quarter of the proteins remainuncharacterized2.
There are several functional annotation sys-tems. These annotation systems include COGs(Clusters of Orthologous Groups)3, Funcat (Func-tional Catalogue)4 and GO (Gene Ontology)5. GOis the most comprehensive system and is widely used.In this paper, we will focus on functional annotationsbased on GO terms associated with individual genesand proteins.
A lot of previous work has been done on proteinfunction prediction by using the recently availableprotein-protein interaction data (see review by Sha-ran et al.2). The simplest and most direct method forfunction prediction determines the function of a pro-tein based on the known function of proteins lying inits neighborhood in the PPI network. Schwikowskiet al.6 used the so-called majority-voting techniqueto predict up to three functions that are frequentlyfound among the annotations of its network neigh-bors. Hishigaki et al.7 approached this problem byalso considering the background level of each func-tion across the whole genome. The χ2-like score wascomputed for every predicted function. Hua et al.8
proposed to improve the prediction accuracy by in-vestigating the relation between network topologyand functional similarity.
In contrast to the local neighborhood approach,several methods have been proposed to predict func-tions using global optimization. Vazquez et al.7 andNabieva et al.9 formulated the function predictionproblem as a minimum multiway cut problem andprovided an approximation algorithm to this NP-hard problem. Vazquez et al.7 used a simulated an-nealing approach and Nabieva et al.9 applied a in-teger programming method. Karaoz et al.10 used asimilar approach but handled one annotation label ata time. Several probabilistic models were also pro-posed for this task such as the Markov random fieldmodel used by Letovsky et al.11 and Deng et al.12,and a statistical model used by Wu et al.13.
Despite some successful applications of the afore-mentioned algorithms in functional annotation of un-characterized proteins, many challenges still remain.One of the big challenges is that PPI data has ahigh degree of noise1. Most methods that generate
interaction networks or perform functional predic-tion do not have a preprocessing step to clean thedata or filter out the noise. Although some meth-ods include the reliability of experimental sources assuggested by Nabieva et al.14, the reliability estima-tions are crude and do not consider the variationsin the reliability of instances within the same ex-perimental source. Some approaches were proposedto predict protein-protein interaction based on evi-dence from multi-source data. The evidence scorecalculated from multi-source data is a type of reliabil-ity measure of the protein-protein interaction data.Such approaches include those developed by Jansenet al.15, Bader et al.16, Zhang et al.17, Ben-Hur etal.18, Lee et al.19, Qi et al.20, and many more. Jansenet al.15 combined multiple sources of data using aBayes classifier. Bader et al.16 developed statisticalmethods that assign a confidence score to every inter-action. Zhang et al.17 predicted co-complexed pro-tein pairs by constructing a decision tree. Ben-Huret al.18 used kernel methods for predicting protein-protein interactions. Lee et al.19 developed a proba-bilistic framework to derive numerical likelihoods forinteracting protein pairs. Qi et al.20 used a Mixture-of-Experts method to predict the set of interactingproteins. The challenges of integrating multi-sourcedata are manily due to the heterogeneity of the dataand the effect of a functionally-biased reference set.Another problem is that most multi-source data areunstructured but often correlated.
Another important shortcoming of most functionprediction methods is that they do not take all an-notations and their relationships into account. In-stead, they have either used arbitrarily chosen func-tional categories from one level of annotation hierar-chy or some arbitrarily chosen so-called informativefunctional categories based on some ad hoc thresh-olds. Such arbitrarily chosen functional categoriesonly cover a small portions of the whole annotationhierarchy, making the predictions less comprehensiveand hard to compare. Predicting functions using theentire annotation system hierarchy is necessary andis a main focus of this paper.
In this paper, we propose a method to addressthe above two problems. We hypothesize that thedistribution of similarity values of pairs of proteinscan be modeled as a sum of two log-normal distribu-tions (i.e., a mixture model) representing two popu-
July 8, 2008 9:34 WSPC/Trim Size: 11in x 8.5in for Proceedings 080Narasimhan
75
lations – one representing pairs of proteins that in-teract with high support (high confidence), and theother representing pairs that interact with low sup-port (low confidence) (section 2.2). The parametersof the mixture model were then estimated from alarge database. This mixture model was then used todifferentiate interactions with high confidence fromthe ones that have low confidence, and was integratedinto the function prediction methods. A new evalu-ation method was also proposed to evaluate the pre-dictions (section 2.4). The new evaluation methodcaptures the similarity between GO terms and re-flects the relative hierarchical positions of predictedand true function assignments.
Note that while PPI data involves proteins, GOterms are associated with genes and their products.For the rest of this paper, we will use the terms genesand their associated proteins interchangeably.
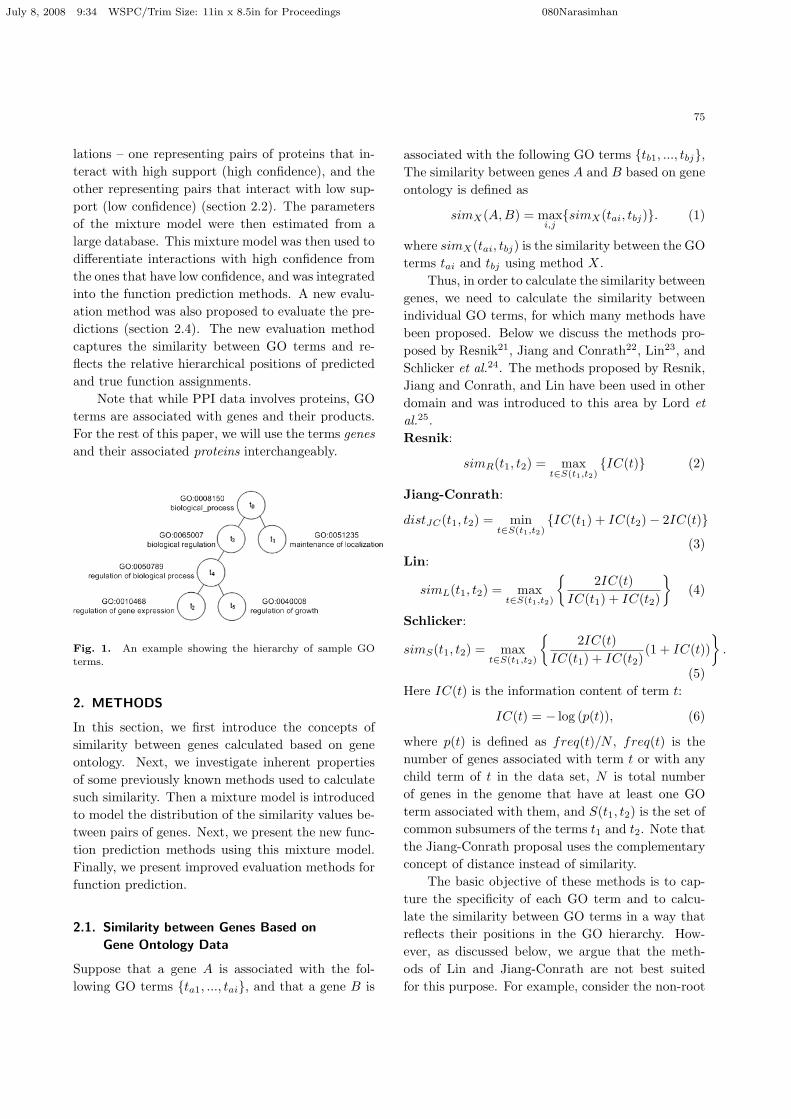
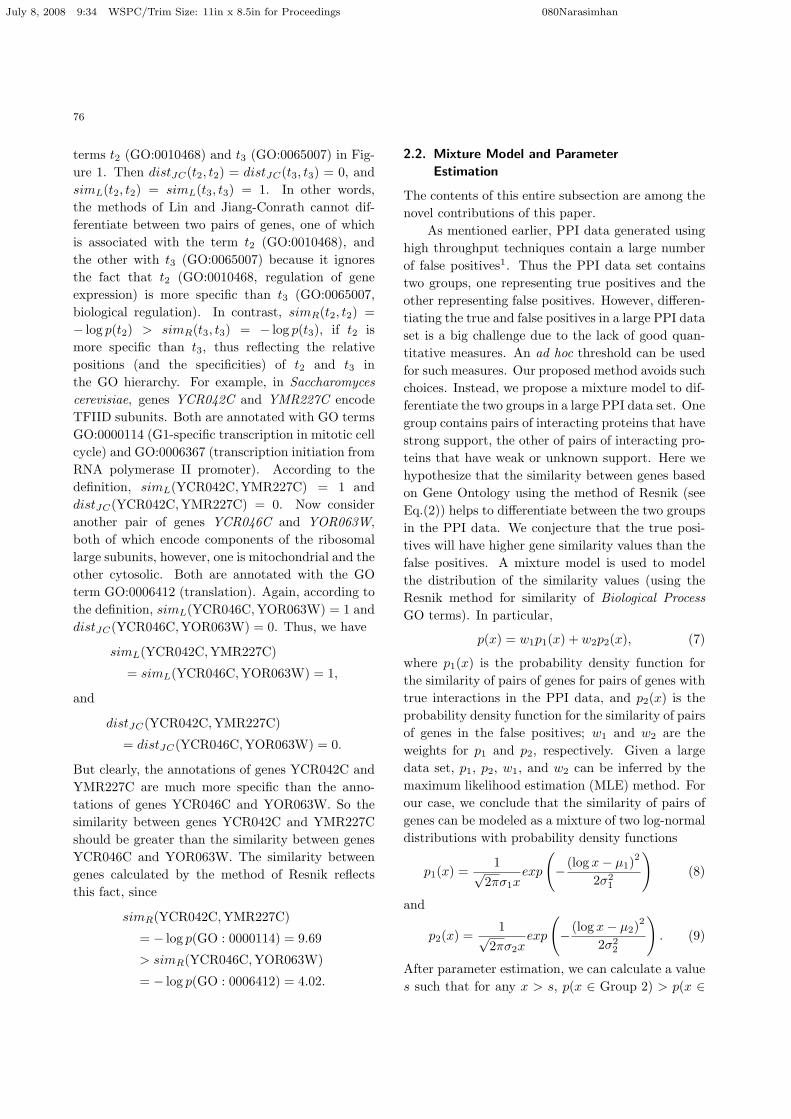
Fig. 1. An example showing the hierarchy of sample GO
terms.
2. METHODS
In this section, we first introduce the concepts ofsimilarity between genes calculated based on geneontology. Next, we investigate inherent propertiesof some previously known methods used to calculatesuch similarity. Then a mixture model is introducedto model the distribution of the similarity values be-tween pairs of genes. Next, we present the new func-tion prediction methods using this mixture model.Finally, we present improved evaluation methods forfunction prediction.
2.1. Similarity between Genes Based on
Gene Ontology Data
Suppose that a gene A is associated with the fol-lowing GO terms {ta1, ..., tai}, and that a gene B is
associated with the following GO terms {tb1, ..., tbj},The similarity between genes A and B based on geneontology is defined as
simX(A,B) = maxi,j
{simX(tai, tbj)}. (1)
where simX(tai, tbj) is the similarity between the GOterms tai and tbj using method X.
Thus, in order to calculate the similarity betweengenes, we need to calculate the similarity betweenindividual GO terms, for which many methods havebeen proposed. Below we discuss the methods pro-posed by Resnik21, Jiang and Conrath22, Lin23, andSchlicker et al.24. The methods proposed by Resnik,Jiang and Conrath, and Lin have been used in otherdomain and was introduced to this area by Lord etal.25.Resnik:
simR(t1, t2) = maxt∈S(t1,t2)
{IC(t)} (2)
Jiang-Conrath:
distJC(t1, t2) = mint∈S(t1,t2)
{IC(t1) + IC(t2)− 2IC(t)}
(3)Lin:
simL(t1, t2) = maxt∈S(t1,t2)
{2IC(t)
IC(t1) + IC(t2)
}(4)
Schlicker:
simS(t1, t2) = maxt∈S(t1,t2)
{2IC(t)
IC(t1) + IC(t2)(1 + IC(t))
}.
(5)Here IC(t) is the information content of term t:
IC(t) = − log (p(t)), (6)
where p(t) is defined as freq(t)/N , freq(t) is thenumber of genes associated with term t or with anychild term of t in the data set, N is total numberof genes in the genome that have at least one GOterm associated with them, and S(t1, t2) is the set ofcommon subsumers of the terms t1 and t2. Note thatthe Jiang-Conrath proposal uses the complementaryconcept of distance instead of similarity.
The basic objective of these methods is to cap-ture the specificity of each GO term and to calcu-late the similarity between GO terms in a way thatreflects their positions in the GO hierarchy. How-ever, as discussed below, we argue that the meth-ods of Lin and Jiang-Conrath are not best suitedfor this purpose. For example, consider the non-root
July 8, 2008 9:34 WSPC/Trim Size: 11in x 8.5in for Proceedings 080Narasimhan
76
terms t2 (GO:0010468) and t3 (GO:0065007) in Fig-ure 1. Then distJC(t2, t2) = distJC(t3, t3) = 0, andsimL(t2, t2) = simL(t3, t3) = 1. In other words,the methods of Lin and Jiang-Conrath cannot dif-ferentiate between two pairs of genes, one of whichis associated with the term t2 (GO:0010468), andthe other with t3 (GO:0065007) because it ignoresthe fact that t2 (GO:0010468, regulation of geneexpression) is more specific than t3 (GO:0065007,biological regulation). In contrast, simR(t2, t2) =− log p(t2) > simR(t3, t3) = − log p(t3), if t2 ismore specific than t3, thus reflecting the relativepositions (and the specificities) of t2 and t3 inthe GO hierarchy. For example, in Saccharomycescerevisiae, genes YCR042C and YMR227C encodeTFIID subunits. Both are annotated with GO termsGO:0000114 (G1-specific transcription in mitotic cellcycle) and GO:0006367 (transcription initiation fromRNA polymerase II promoter). According to thedefinition, simL(YCR042C,YMR227C) = 1 anddistJC(YCR042C,YMR227C) = 0. Now consideranother pair of genes YCR046C and YOR063W,both of which encode components of the ribosomallarge subunits, however, one is mitochondrial and theother cytosolic. Both are annotated with the GOterm GO:0006412 (translation). Again, according tothe definition, simL(YCR046C,YOR063W) = 1 anddistJC(YCR046C,YOR063W) = 0. Thus, we have
simL(YCR042C,YMR227C)
= simL(YCR046C,YOR063W) = 1,
and
distJC(YCR042C,YMR227C)
= distJC(YCR046C,YOR063W) = 0.
But clearly, the annotations of genes YCR042C andYMR227C are much more specific than the anno-tations of genes YCR046C and YOR063W. So thesimilarity between genes YCR042C and YMR227Cshould be greater than the similarity between genesYCR046C and YOR063W. The similarity betweengenes calculated by the method of Resnik reflectsthis fact, since
simR(YCR042C,YMR227C)
= − log p(GO : 0000114) = 9.69
> simR(YCR046C,YOR063W)
= − log p(GO : 0006412) = 4.02.
2.2. Mixture Model and Parameter
Estimation
The contents of this entire subsection are among thenovel contributions of this paper.
As mentioned earlier, PPI data generated usinghigh throughput techniques contain a large numberof false positives1. Thus the PPI data set containstwo groups, one representing true positives and theother representing false positives. However, differen-tiating the true and false positives in a large PPI dataset is a big challenge due to the lack of good quan-titative measures. An ad hoc threshold can be usedfor such measures. Our proposed method avoids suchchoices. Instead, we propose a mixture model to dif-ferentiate the two groups in a large PPI data set. Onegroup contains pairs of interacting proteins that havestrong support, the other of pairs of interacting pro-teins that have weak or unknown support. Here wehypothesize that the similarity between genes basedon Gene Ontology using the method of Resnik (seeEq.(2)) helps to differentiate between the two groupsin the PPI data. We conjecture that the true posi-tives will have higher gene similarity values than thefalse positives. A mixture model is used to modelthe distribution of the similarity values (using theResnik method for similarity of Biological ProcessGO terms). In particular,
p(x) = w1p1(x) + w2p2(x), (7)
where p1(x) is the probability density function forthe similarity of pairs of genes for pairs of genes withtrue interactions in the PPI data, and p2(x) is theprobability density function for the similarity of pairsof genes in the false positives; w1 and w2 are theweights for p1 and p2, respectively. Given a largedata set, p1, p2, w1, and w2 can be inferred by themaximum likelihood estimation (MLE) method. Forour case, we conclude that the similarity of pairs ofgenes can be modeled as a mixture of two log-normaldistributions with probability density functions
p1(x) =1√
2πσ1xexp
(− (log x− µ1)
2
2σ21
)(8)
and
p2(x) =1√
2πσ2xexp
(− (log x− µ2)
2
2σ22
). (9)
After parameter estimation, we can calculate a values such that for any x > s, p(x ∈ Group 2) > p(x ∈
July 8, 2008 9:34 WSPC/Trim Size: 11in x 8.5in for Proceedings 080Narasimhan
77
Group 1). This value s is the threshold meant to dif-ferentiate the PPI data with high support (Group 2)from those with low support (Group 1). The furtheraway the point is from s, the greater is the confi-dence. Furthermore, the confidence can be measuredby computing the p-value since the parameters of dis-tribution are known.
Thus our mixture model suggests a way of differ-entiating the true positives from the false positives byonly looking at the similarity value of pairs of genes(using the method of Resnik in Eq.(2) for similar-ity of Biological Process GO terms), and by using athreshold value specified by the model (Group 1 con-tains false positives and Group 2 contains the truepositives). Note that no ad hoc decision are involved.
2.3. Function Prediction
The major advantage of the method presented aboveis that the p-values obtained from the mixture modelprovide us with a metric of support of a reliabilitymeasure for the PPI data set. However, the limi-tation of our technique is that it can only be ap-plied to pairs of genes with annotations. In orderto overcome this limitation, it has been suggestedthat function prediction should be performed firstto predict the functional annotation of unannotatedgenes. As mentioned earlier, many computationalapproaches have been developed for this task2. How-ever, the prediction methods are prone to high falsepositives. Schwikowski et al.6 proposed the Majority-Voting (MV) algorithm for predicting the functionsof an unannotated gene u by the following objectivefunction,
αu = arg maxα
∑v∈N(u),αv∈A(v)
δ(αv, α), (10)
where N(u) is the set of neighbors of u, A(v) is theset of annotations associated with gene v, αi is theannotation for gene i, δ(x, y) is a function that equals1 if x = y, and 0 otherwise. In other words, gene u
is annotated with the term α associated with thelargest number of its neighbors. The main weaknessof this conventional majority voting algorithm is thatit weights all its neighbors equally, and is prone toerrors because of the high degree of false positivesin the PPI data set. Using the metric of supportproposed in section 2.2, we propose a modified “Re-liable” Majority-Voting (RMV) algorithm which as-
signs a functional annotation to an unannotated geneu based on the following objective function
αu = arg maxα
∑v∈N(u),αv∈A(v)
wv,uδ(αv, α), (11)
where wv,u is the reliability of the interaction be-tween genes v and u, that is, wv,u = sim(A(v), {α}).
Another weakness of the conventional MV algo-rithm is that it only allows exact matches of anno-tations and will reject even approximate matches ofannotations. Here we propose the Weighted ReliableMajority-Voting (WRMV) method, a modification ofRMV, with the following objective function
αu = arg maxα
∑v∈N(u)
wv,u
(max
αv∈A(v)sim(αv, α)
),
(12)where sim(x, y) is a function that calculates the sim-ilarity between the GO terms x and y.
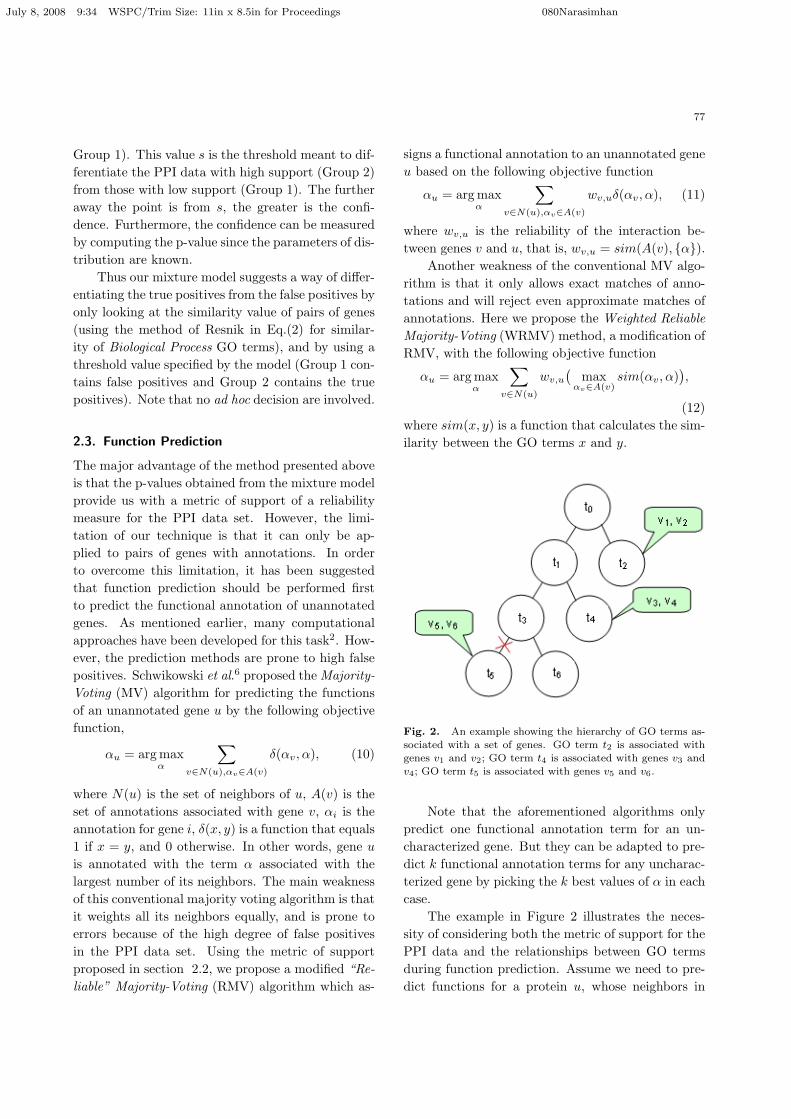
Fig. 2. An example showing the hierarchy of GO terms as-sociated with a set of genes. GO term t2 is associated with
genes v1 and v2; GO term t4 is associated with genes v3 and
v4; GO term t5 is associated with genes v5 and v6.
Note that the aforementioned algorithms onlypredict one functional annotation term for an un-characterized gene. But they can be adapted to pre-dict k functional annotation terms for any uncharac-terized gene by picking the k best values of α in eachcase.
The example in Figure 2 illustrates the neces-sity of considering both the metric of support for thePPI data and the relationships between GO termsduring function prediction. Assume we need to pre-dict functions for a protein u, whose neighbors in
July 8, 2008 9:34 WSPC/Trim Size: 11in x 8.5in for Proceedings 080Narasimhan
78
the interaction network include proteins v1, v2, v3,v4, v5, and v6. As shown in Figure 2, suppose pro-teins v1 and v2 are annotated with GO term t2, v3
and v4 with GO term t4, and v5 and v6 with GOterm t5. According to the MV algorithm, proteinu will be assigned all the GO terms t2, t4, and t5,since each of the three terms has equal votes (2 inthis case). However, as can be seen from Figure 2,GO term t5 is more specific than GO terms t2 andt4. So GO term t5 should be the most favored asan annotation for protein u, assuming that all thePPI data are equally reliable. On the other hand,if the interactions between proteins u and v5 and v6
are less reliable (or false positives), then there is lesssupport for associating protein u with term t5.
Note that the metric of support can also be usedto improve other approaches besides the MV algo-rithm. In this paper, we have employed only local ap-proaches, because as argued by Murali et al.26 meth-ods based on global optimization do not perform bet-ter than local approaches based on majority-votingalgorithm.
2.4. Evaluating the Function Prediction
Several measures are possible in order to evaluate thefunction prediction methods proposed in section 2.3.For the traditional cross-validation technique, thesimplest method to perform an evaluation is to useprecision and recall, defined as follows:
Precision =∑
i ki∑i mi
, Recall =∑
i ki∑i ni
, (13)
where ni is the number of known functions for theprotein i, mi is the number of predicted functionsfor the protein i when hiding its known annotations,and ki is the number of matches between knownand predicted functions for protein i. The conven-tional method to count the number of matches be-tween the annotated and predicted functions onlyconsiders the exact overlap between predicted andknown functions, ignoring the structure and rela-tionship between functional attributes. Using againthe simple example illustrated in Figure 2, assumethat the correct function annotation of a protein u isGO term t4, while term t1 is the only function pre-dicted for it. Then both recall and precision wouldbe reported to be 0 according to the conventionalmethod. However, it overlooks the fact that GO
term t4 is quite close to the term t1. Here we in-troduce a new definition for precision and recall. Fora known protein, suppose the known annotated func-tional terms are {to1, to2, ..., ton}, and the predictedterms are {tp1, tp2, ..., tpm}. We define the success ofthe prediction for function toi as
RecallSucess(toi) = maxj
sim(toi, tpj),
and the success of the predicted function tpj as
PrecisionSuccess(tpj) = maxi
sim(toi, tpj).
We define the new precision and recall measures asfollows:
Precision =
∑j PrecisionSuccess(tpj)∑
j sim(tpj , tpj), (14)
Recall =∑
i RecallSucess(toi)∑
i sim(toi , toi). (15)
3. EXPERIMENTAL RESULTS
3.1. Data Sets
Function prediction methods based on a protein-protein interaction network can make use of two datasources - the PPI data set and a database of avail-able functional annotations. In this section, we willintroduce the two data sources we used in our exper-iments.
3.1.1. Gene Ontology
We used the available functional annotations fromthe Gene Ontology (GO) database5. GO consists ofsets of structured vocabularies each organized as arooted directed acyclic graph (DAG), where everynode is associated with a GO term and edges repre-sent either a “IS-A” or a “PART-OF” relationship.Three independent sets of vocabularies are provided:cellular component, molecular function and biologi-cal process. Generally, a gene is annotated by oneor more GO terms. The terms at the lower levelscorrespond to more specific function descriptions. Ifa gene is annotated with a GO term, it is also an-notated with the ancestors of that GO term. Thus,the terms at the higher levels have more associatedgenes. The GO database is constantly being up-dated; we used version 5.403, and the gene-term as-sociations for Saccharomyces cerevisiae from version1.1344 from SGD.
July 8, 2008 9:34 WSPC/Trim Size: 11in x 8.5in for Proceedings 080Narasimhan
79
3.1.2. Protein-Protein Interaction Data
Several PPI data sets were used in this paper for ourexperiments. The first PPI data set was downloadedfrom the BioGRID database27. Henceforth, we willrefer to this data set as the BioGRID data set. Theconfirmation number for a given pair of proteins isdefined as the number of independent confirmationsthat support that interaction. A pseudo-negativedata set was also generated by picking pairs of pro-teins that were not present in the PPI data set. Thuseach pair of proteins in the pseudo-negative data sethas a confirmation number of 0. There were 87920unique interacting pairs in total with confirmationnumbers ranging from 0 to 40. This data set is usedto estimate the metric of support for pairs of pro-teins.
Two so-called gold-standard data sets (gold-standard positive and gold-standard negative) wereused to test the performance of our method. Thesetwo gold-standard data sets were hand-crafted byJansen et al.15. The gold-standard positives camefrom the MIPS (Munich Information Center for Pro-tein Sequence) complexes catalog28 since the proteinsin a complex are guaranteed to bind to each other.The number of gold-standard positive pairs used inour experiments was 7727. A gold-standard negativedata set is harder to define. Jansen et al. createdsuch a list by picking pairs of proteins known to belocalized in separate subcellular compartments15, re-sulting in a total of 1838501 pairs.
3.2. Results on Using the Mixture Model
The similarity between genes based on the Biologi-cal Process categorization of the GO hierarchy wascalculated using Eq.(1) and Eq.(2). The method wasseparately applied to the BioGRID data set, in whichPPI data have non-negative, integral confirmationnumbers k. Interacting pairs of proteins from Bi-oGRID data set were grouped based on their confir-mation number. It is clear that the PPI data set mayinclude a large number of false positives. Thus, thechallenge is to differentiate the true interactions fromthe false ones. We hypothesize that each of thesegroups generated above contains two subgroups, onerepresenting pairs of proteins that interact with highsupport, and the other representing pairs that inter-act with low support. Data sets with larger confir-
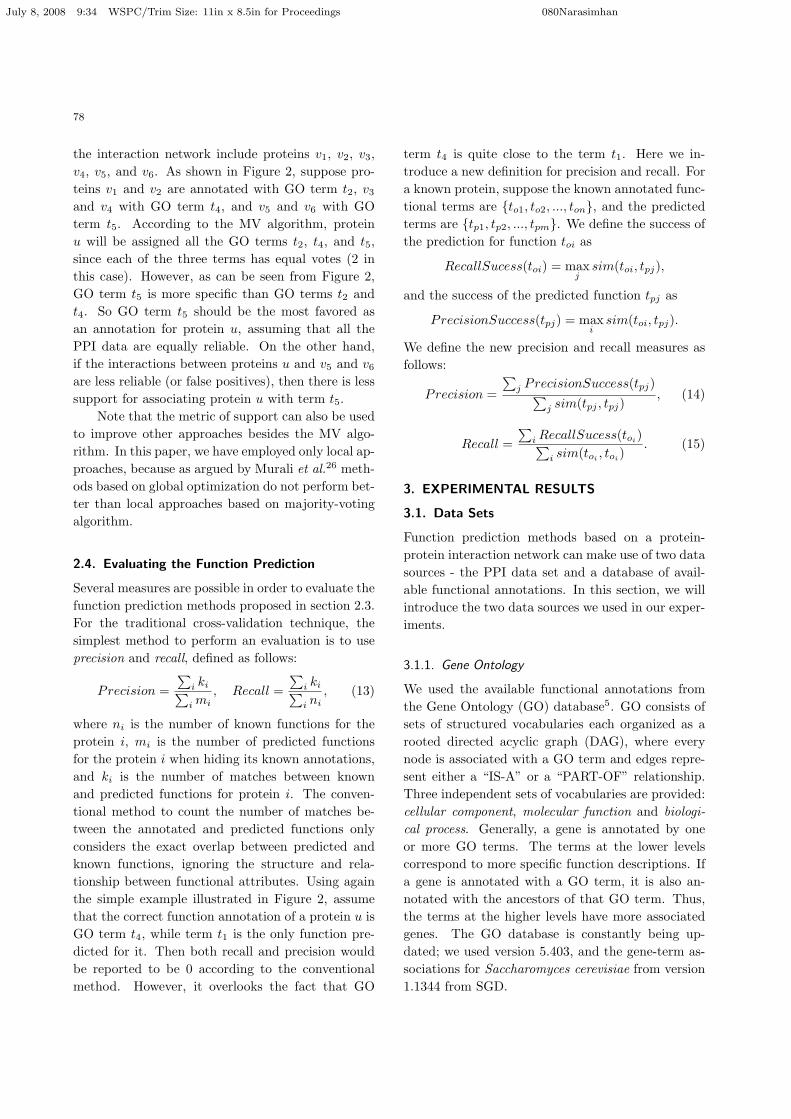
mation numbers are expected to have less noise.As shown in Figure 3, a histogram of the (log-
arithm of) similarity measure (using the Resnikmethod for similarity of GO terms) was plotted forpairs of genes within each group (i.e., same degreeof confirmation from the PPI data set). In orderto visualize the whole histogram, we have arbitrar-ily chosen log(0) = log(0.01) ≈ −4.61. Based onour earlier assumptions, we conjectured that each ofthese histograms can be modeled as a mixture of twonormal distributions (since the original is a mixturetwo log-normal distribution), one for the Group 1,and the other for the Group 2.
Fig. 3. Distribution of similarity of genes based on theResnik method using: (a) the entire PPI data set, (b) 1 or
more independent confirmations, (c) 2 or more independent
confirmations, (d) 3 or more independent confirmations, (e) 4or more independent confirmations, (f) 5 or more independent
confirmations.
All the plots in Figure 3 have three well-separated subgroups. Note that the leftmost sub-group corresponds to those pairs of genes for which atleast one has the GO terms associated with the rootof the GO hierarchy; the subgroup in the middle cor-
July 8, 2008 9:34 WSPC/Trim Size: 11in x 8.5in for Proceedings 080Narasimhan
80
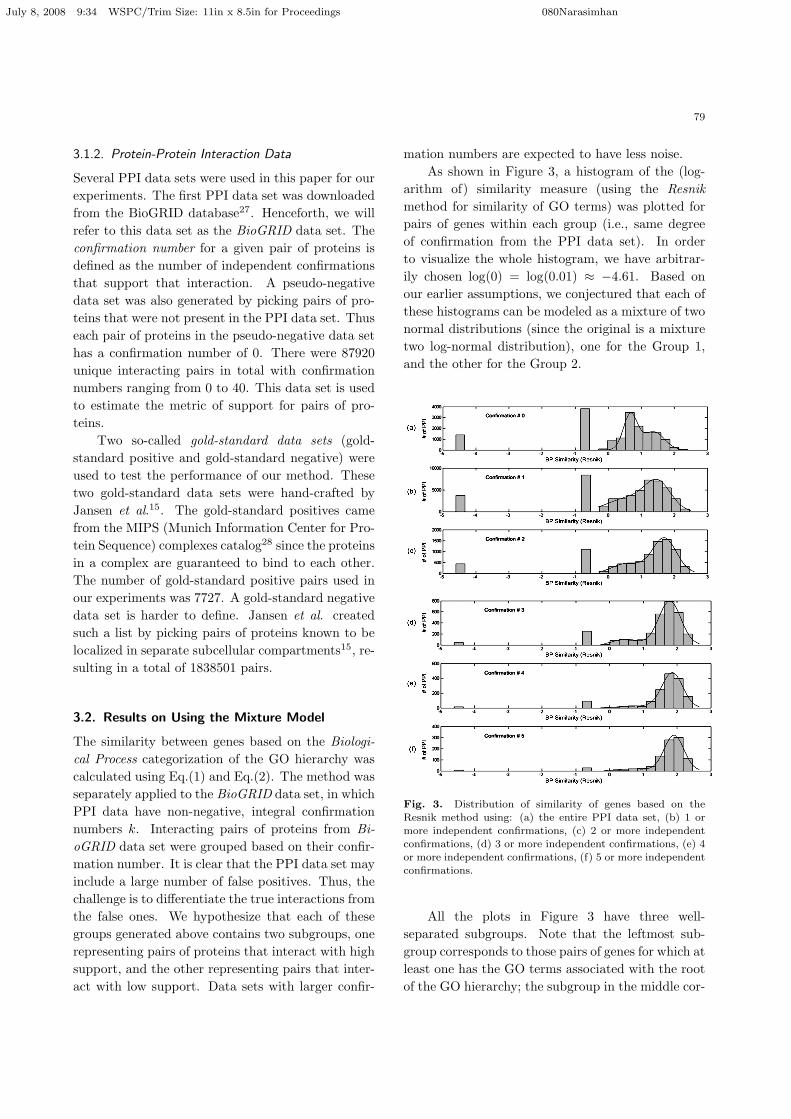
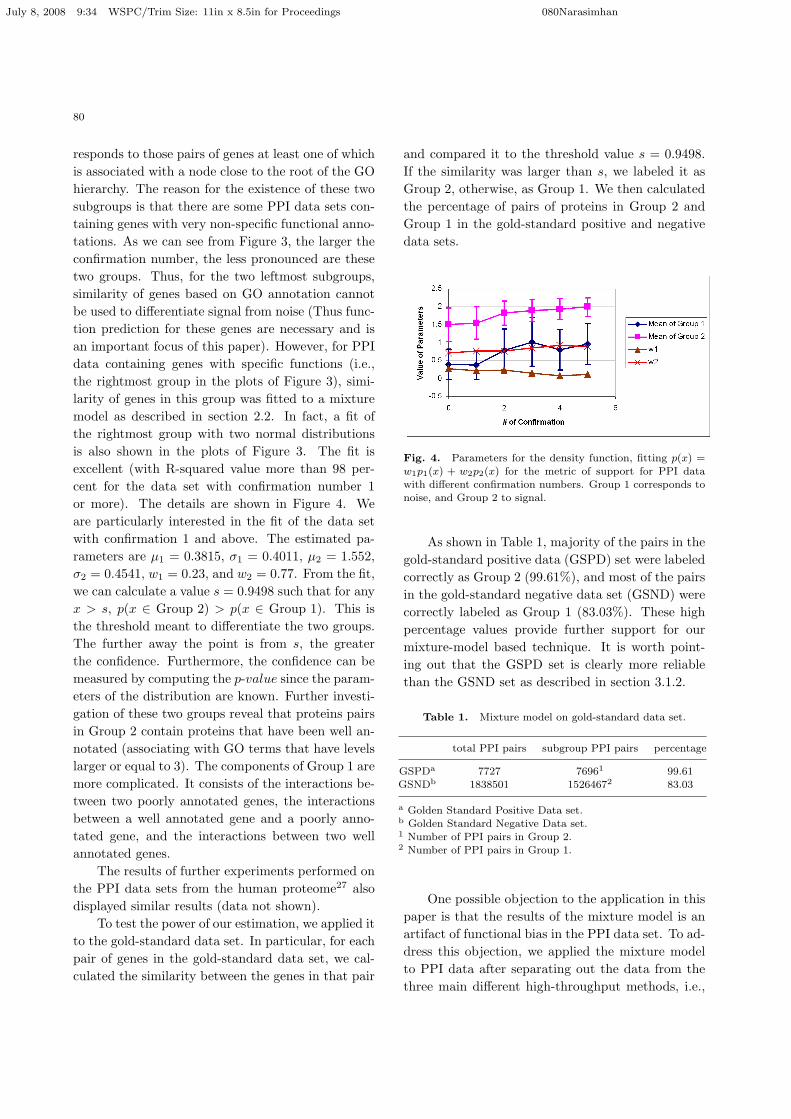
responds to those pairs of genes at least one of whichis associated with a node close to the root of the GOhierarchy. The reason for the existence of these twosubgroups is that there are some PPI data sets con-taining genes with very non-specific functional anno-tations. As we can see from Figure 3, the larger theconfirmation number, the less pronounced are thesetwo groups. Thus, for the two leftmost subgroups,similarity of genes based on GO annotation cannotbe used to differentiate signal from noise (Thus func-tion prediction for these genes are necessary and isan important focus of this paper). However, for PPIdata containing genes with specific functions (i.e.,the rightmost group in the plots of Figure 3), simi-larity of genes in this group was fitted to a mixturemodel as described in section 2.2. In fact, a fit ofthe rightmost group with two normal distributionsis also shown in the plots of Figure 3. The fit isexcellent (with R-squared value more than 98 per-cent for the data set with confirmation number 1or more). The details are shown in Figure 4. Weare particularly interested in the fit of the data setwith confirmation 1 and above. The estimated pa-rameters are µ1 = 0.3815, σ1 = 0.4011, µ2 = 1.552,σ2 = 0.4541, w1 = 0.23, and w2 = 0.77. From the fit,we can calculate a value s = 0.9498 such that for anyx > s, p(x ∈ Group 2) > p(x ∈ Group 1). This isthe threshold meant to differentiate the two groups.The further away the point is from s, the greaterthe confidence. Furthermore, the confidence can bemeasured by computing the p-value since the param-eters of the distribution are known. Further investi-gation of these two groups reveal that proteins pairsin Group 2 contain proteins that have been well an-notated (associating with GO terms that have levelslarger or equal to 3). The components of Group 1 aremore complicated. It consists of the interactions be-tween two poorly annotated genes, the interactionsbetween a well annotated gene and a poorly anno-tated gene, and the interactions between two wellannotated genes.
The results of further experiments performed onthe PPI data sets from the human proteome27 alsodisplayed similar results (data not shown).
To test the power of our estimation, we applied itto the gold-standard data set. In particular, for eachpair of genes in the gold-standard data set, we cal-culated the similarity between the genes in that pair
and compared it to the threshold value s = 0.9498.If the similarity was larger than s, we labeled it asGroup 2, otherwise, as Group 1. We then calculatedthe percentage of pairs of proteins in Group 2 andGroup 1 in the gold-standard positive and negativedata sets.
Fig. 4. Parameters for the density function, fitting p(x) =
w1p1(x) + w2p2(x) for the metric of support for PPI datawith different confirmation numbers. Group 1 corresponds to
noise, and Group 2 to signal.
As shown in Table 1, majority of the pairs in thegold-standard positive data (GSPD) set were labeledcorrectly as Group 2 (99.61%), and most of the pairsin the gold-standard negative data set (GSND) werecorrectly labeled as Group 1 (83.03%). These highpercentage values provide further support for ourmixture-model based technique. It is worth point-ing out that the GSPD set is clearly more reliablethan the GSND set as described in section 3.1.2.
Table 1. Mixture model on gold-standard data set.
total PPI pairs subgroup PPI pairs percentage
GSPDa 7727 76961 99.61
GSNDb 1838501 15264672 83.03
a Golden Standard Positive Data set.b Golden Standard Negative Data set.1 Number of PPI pairs in Group 2.2 Number of PPI pairs in Group 1.
One possible objection to the application in thispaper is that the results of the mixture model is anartifact of functional bias in the PPI data set. To ad-dress this objection, we applied the mixture modelto PPI data after separating out the data from thethree main different high-throughput methods, i.e.,
July 8, 2008 9:34 WSPC/Trim Size: 11in x 8.5in for Proceedings 080Narasimhan
81
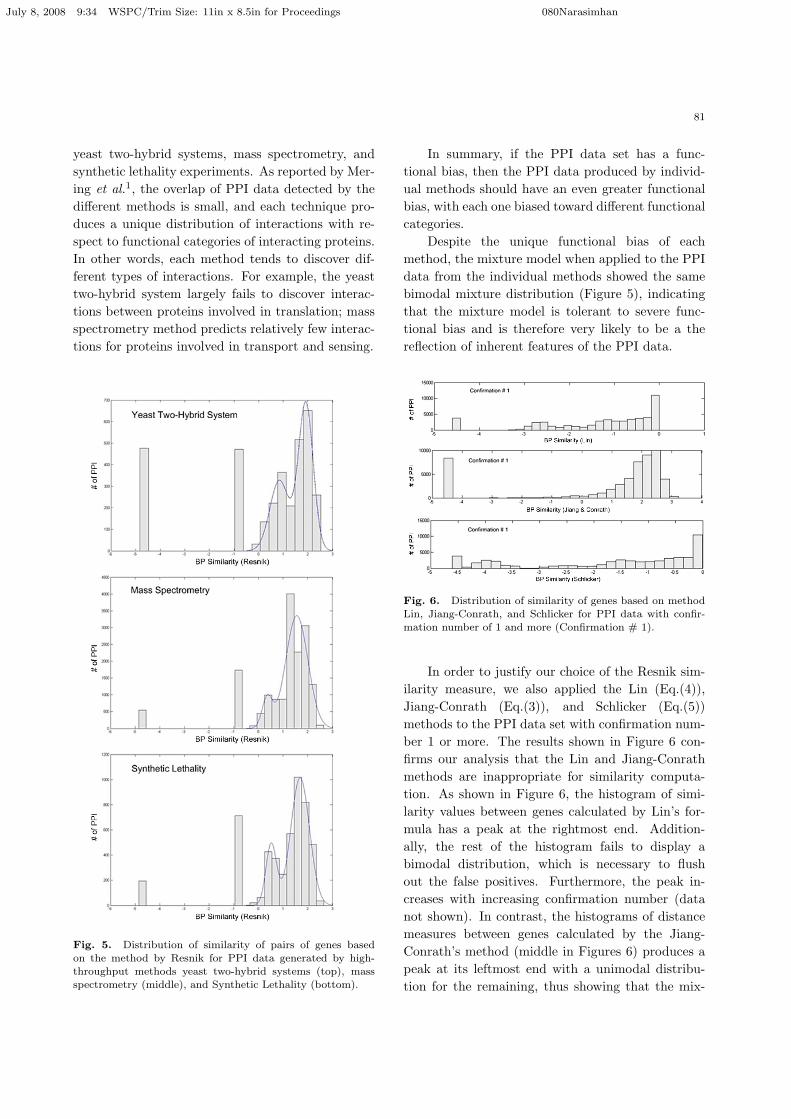
yeast two-hybrid systems, mass spectrometry, andsynthetic lethality experiments. As reported by Mer-ing et al.1, the overlap of PPI data detected by thedifferent methods is small, and each technique pro-duces a unique distribution of interactions with re-spect to functional categories of interacting proteins.In other words, each method tends to discover dif-ferent types of interactions. For example, the yeasttwo-hybrid system largely fails to discover interac-tions between proteins involved in translation; massspectrometry method predicts relatively few interac-tions for proteins involved in transport and sensing.
Fig. 5. Distribution of similarity of pairs of genes based
on the method by Resnik for PPI data generated by high-throughput methods yeast two-hybrid systems (top), massspectrometry (middle), and Synthetic Lethality (bottom).
In summary, if the PPI data set has a func-tional bias, then the PPI data produced by individ-ual methods should have an even greater functionalbias, with each one biased toward different functionalcategories.
Despite the unique functional bias of eachmethod, the mixture model when applied to the PPIdata from the individual methods showed the samebimodal mixture distribution (Figure 5), indicatingthat the mixture model is tolerant to severe func-tional bias and is therefore very likely to be a thereflection of inherent features of the PPI data.
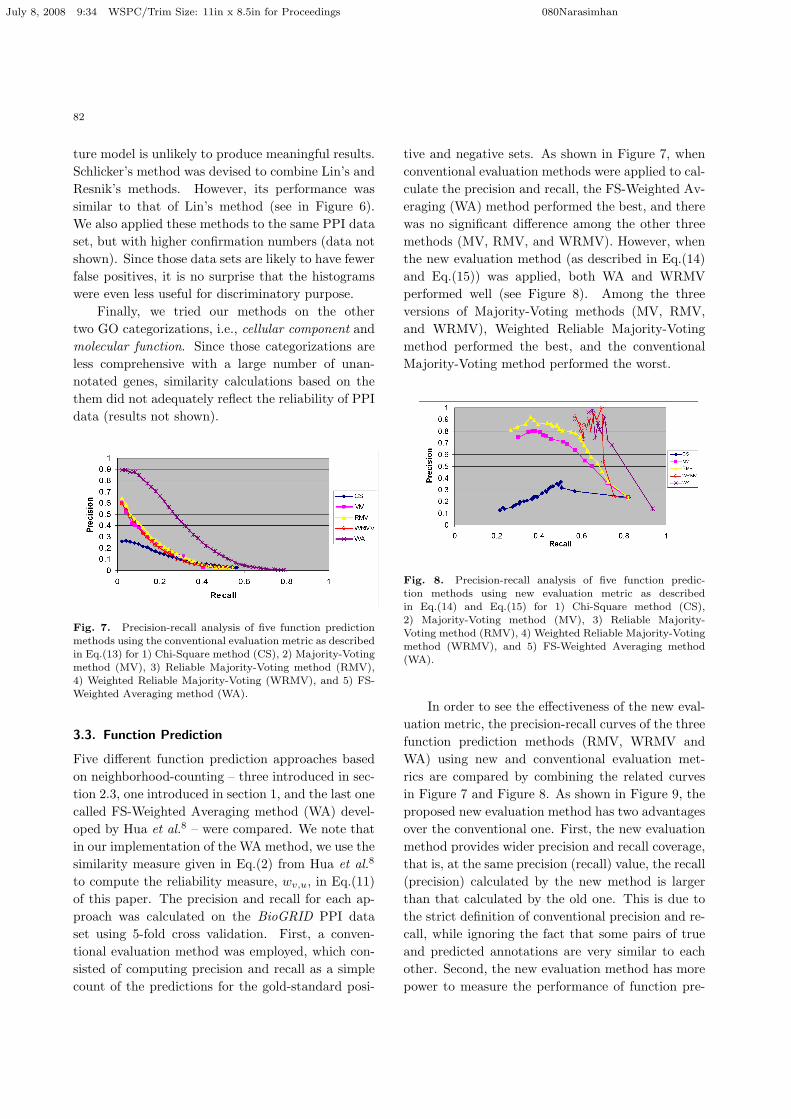
Fig. 6. Distribution of similarity of genes based on methodLin, Jiang-Conrath, and Schlicker for PPI data with confir-
mation number of 1 and more (Confirmation # 1).
In order to justify our choice of the Resnik sim-ilarity measure, we also applied the Lin (Eq.(4)),Jiang-Conrath (Eq.(3)), and Schlicker (Eq.(5))methods to the PPI data set with confirmation num-ber 1 or more. The results shown in Figure 6 con-firms our analysis that the Lin and Jiang-Conrathmethods are inappropriate for similarity computa-tion. As shown in Figure 6, the histogram of simi-larity values between genes calculated by Lin’s for-mula has a peak at the rightmost end. Addition-ally, the rest of the histogram fails to display abimodal distribution, which is necessary to flushout the false positives. Furthermore, the peak in-creases with increasing confirmation number (datanot shown). In contrast, the histograms of distancemeasures between genes calculated by the Jiang-Conrath’s method (middle in Figures 6) produces apeak at its leftmost end with a unimodal distribu-tion for the remaining, thus showing that the mix-
July 8, 2008 9:34 WSPC/Trim Size: 11in x 8.5in for Proceedings 080Narasimhan
82
ture model is unlikely to produce meaningful results.Schlicker’s method was devised to combine Lin’s andResnik’s methods. However, its performance wassimilar to that of Lin’s method (see in Figure 6).We also applied these methods to the same PPI dataset, but with higher confirmation numbers (data notshown). Since those data sets are likely to have fewerfalse positives, it is no surprise that the histogramswere even less useful for discriminatory purpose.
Finally, we tried our methods on the othertwo GO categorizations, i.e., cellular component andmolecular function. Since those categorizations areless comprehensive with a large number of unan-notated genes, similarity calculations based on thethem did not adequately reflect the reliability of PPIdata (results not shown).
Fig. 7. Precision-recall analysis of five function predictionmethods using the conventional evaluation metric as described
in Eq.(13) for 1) Chi-Square method (CS), 2) Majority-Voting
method (MV), 3) Reliable Majority-Voting method (RMV),4) Weighted Reliable Majority-Voting (WRMV), and 5) FS-
Weighted Averaging method (WA).
3.3. Function Prediction
Five different function prediction approaches basedon neighborhood-counting – three introduced in sec-tion 2.3, one introduced in section 1, and the last onecalled FS-Weighted Averaging method (WA) devel-oped by Hua et al.8 – were compared. We note thatin our implementation of the WA method, we use thesimilarity measure given in Eq.(2) from Hua et al.8
to compute the reliability measure, wv,u, in Eq.(11)of this paper. The precision and recall for each ap-proach was calculated on the BioGRID PPI dataset using 5-fold cross validation. First, a conven-tional evaluation method was employed, which con-sisted of computing precision and recall as a simplecount of the predictions for the gold-standard posi-
tive and negative sets. As shown in Figure 7, whenconventional evaluation methods were applied to cal-culate the precision and recall, the FS-Weighted Av-eraging (WA) method performed the best, and therewas no significant difference among the other threemethods (MV, RMV, and WRMV). However, whenthe new evaluation method (as described in Eq.(14)and Eq.(15)) was applied, both WA and WRMVperformed well (see Figure 8). Among the threeversions of Majority-Voting methods (MV, RMV,and WRMV), Weighted Reliable Majority-Votingmethod performed the best, and the conventionalMajority-Voting method performed the worst.
Fig. 8. Precision-recall analysis of five function predic-
tion methods using new evaluation metric as described
in Eq.(14) and Eq.(15) for 1) Chi-Square method (CS),2) Majority-Voting method (MV), 3) Reliable Majority-
Voting method (RMV), 4) Weighted Reliable Majority-Voting
method (WRMV), and 5) FS-Weighted Averaging method(WA).
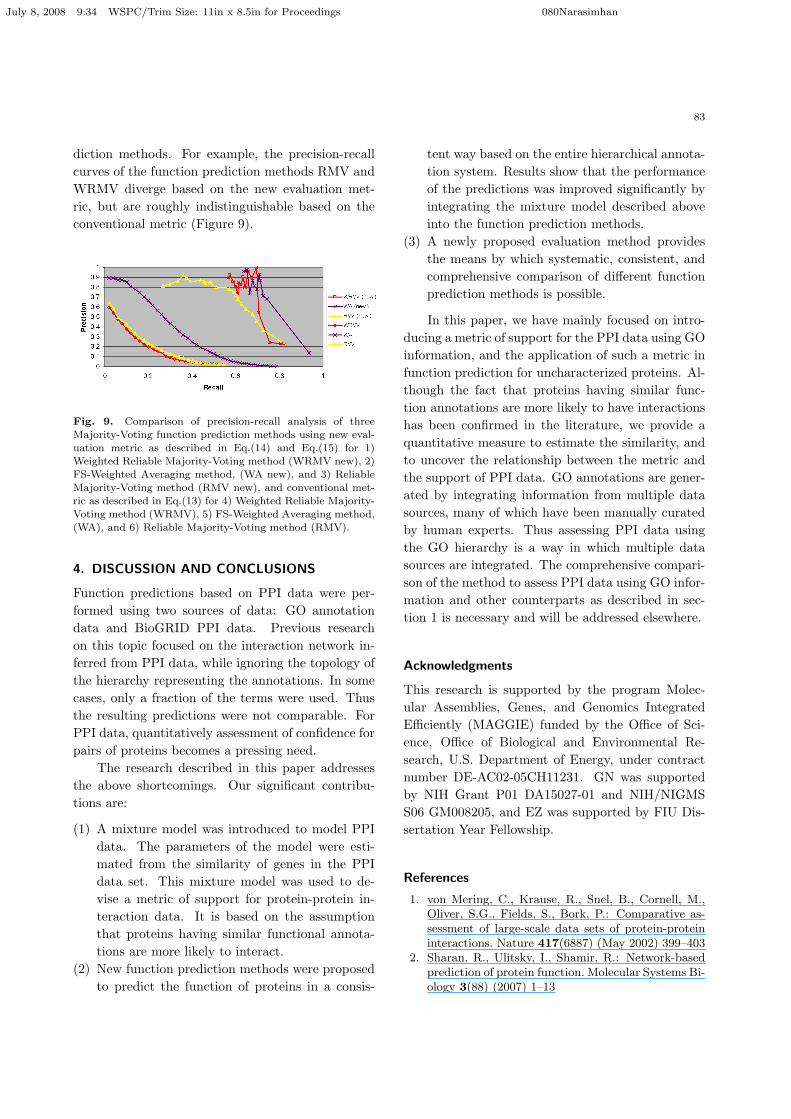
In order to see the effectiveness of the new eval-uation metric, the precision-recall curves of the threefunction prediction methods (RMV, WRMV andWA) using new and conventional evaluation met-rics are compared by combining the related curvesin Figure 7 and Figure 8. As shown in Figure 9, theproposed new evaluation method has two advantagesover the conventional one. First, the new evaluationmethod provides wider precision and recall coverage,that is, at the same precision (recall) value, the recall(precision) calculated by the new method is largerthan that calculated by the old one. This is due tothe strict definition of conventional precision and re-call, while ignoring the fact that some pairs of trueand predicted annotations are very similar to eachother. Second, the new evaluation method has morepower to measure the performance of function pre-
July 8, 2008 9:34 WSPC/Trim Size: 11in x 8.5in for Proceedings 080Narasimhan
83
diction methods. For example, the precision-recallcurves of the function prediction methods RMV andWRMV diverge based on the new evaluation met-ric, but are roughly indistinguishable based on theconventional metric (Figure 9).
Fig. 9. Comparison of precision-recall analysis of three
Majority-Voting function prediction methods using new eval-
uation metric as described in Eq.(14) and Eq.(15) for 1)Weighted Reliable Majority-Voting method (WRMV new), 2)
FS-Weighted Averaging method, (WA new), and 3) ReliableMajority-Voting method (RMV new), and conventional met-
ric as described in Eq.(13) for 4) Weighted Reliable Majority-
Voting method (WRMV), 5) FS-Weighted Averaging method,(WA), and 6) Reliable Majority-Voting method (RMV).
4. DISCUSSION AND CONCLUSIONS
Function predictions based on PPI data were per-formed using two sources of data: GO annotationdata and BioGRID PPI data. Previous researchon this topic focused on the interaction network in-ferred from PPI data, while ignoring the topology ofthe hierarchy representing the annotations. In somecases, only a fraction of the terms were used. Thusthe resulting predictions were not comparable. ForPPI data, quantitatively assessment of confidence forpairs of proteins becomes a pressing need.
The research described in this paper addressesthe above shortcomings. Our significant contribu-tions are:
(1) A mixture model was introduced to model PPIdata. The parameters of the model were esti-mated from the similarity of genes in the PPIdata set. This mixture model was used to de-vise a metric of support for protein-protein in-teraction data. It is based on the assumptionthat proteins having similar functional annota-tions are more likely to interact.
(2) New function prediction methods were proposedto predict the function of proteins in a consis-
tent way based on the entire hierarchical annota-tion system. Results show that the performanceof the predictions was improved significantly byintegrating the mixture model described aboveinto the function prediction methods.
(3) A newly proposed evaluation method providesthe means by which systematic, consistent, andcomprehensive comparison of different functionprediction methods is possible.
In this paper, we have mainly focused on intro-ducing a metric of support for the PPI data using GOinformation, and the application of such a metric infunction prediction for uncharacterized proteins. Al-though the fact that proteins having similar func-tion annotations are more likely to have interactionshas been confirmed in the literature, we provide aquantitative measure to estimate the similarity, andto uncover the relationship between the metric andthe support of PPI data. GO annotations are gener-ated by integrating information from multiple datasources, many of which have been manually curatedby human experts. Thus assessing PPI data usingthe GO hierarchy is a way in which multiple datasources are integrated. The comprehensive compari-son of the method to assess PPI data using GO infor-mation and other counterparts as described in sec-tion 1 is necessary and will be addressed elsewhere.
Acknowledgments
This research is supported by the program Molec-ular Assemblies, Genes, and Genomics IntegratedEfficiently (MAGGIE) funded by the Office of Sci-ence, Office of Biological and Environmental Re-search, U.S. Department of Energy, under contractnumber DE-AC02-05CH11231. GN was supportedby NIH Grant P01 DA15027-01 and NIH/NIGMSS06 GM008205, and EZ was supported by FIU Dis-sertation Year Fellowship.
References
1. von Mering, C., Krause, R., Snel, B., Cornell, M.,Oliver, S.G., Fields, S., Bork, P.: Comparative as-sessment of large-scale data sets of protein-proteininteractions. Nature 417(6887) (May 2002) 399–403
2. Sharan, R., Ulitsky, I., Shamir, R.: Network-basedprediction of protein function. Molecular Systems Bi-ology 3(88) (2007) 1–13
July 8, 2008 9:34 WSPC/Trim Size: 11in x 8.5in for Proceedings 080Narasimhan
84
3. Tatusov, R.L., Galperin, M.Y., Natale, D.A.,Koonin, E.V.: The COG database: a tool forgenome-scale analysis of protein functions and evolu-tion. Nucleic Acids Res 28(1) (January 2000) 33–36
4. Ruepp, A., Zollner, A., Maier, D., Albermann,K., Hani, J., Mokrejs, M., Tetko, I., Guldener,U., Mannhaupt, G., Munsterkotter, M., Mewes,H.W.: The FunCat, a functional annotation schemefor systematic classification of proteins from wholegenomes. Nucleic Acids Res 32(18) (2004) 5539–5545
5. Ashburner, M., Ball, C.A., Blake, J.A., Botstein, D.,Butler, H., Cherry, J.M., Davis, A.P., Dolinski, K.,Dwight, S.S., Eppig, J.T., Harris, M.A., Hill, D.P.,Issel-Tarver, L., Kasarskis, A., Lewis, S., Matese,J.C., Richardson, J.E., Ringwald, M., Rubin, G.M.,Sherlock, G.: Gene ontology: tool for the unificationof biology. the gene ontology consortium. Nat Genet25(1) (May 2000) 25–29
6. Schwikowski, B., Uetz, P., Fields, S.: A network ofprotein-protein interactions in yeast. Nat Biotechnol18(12) (December 2000) 1257–1261
7. Hishigaki, H., Nakai, K., Ono, T., Tanigami, A.,Takagi, T.: Assessment of prediction accuracy ofprotein function from protein–protein interactiondata. Yeast 18(6) (April 2001) 523–531
8. Chua, H.N., Sung, W.K., Wong, L.: Exploiting in-direct neighbours and topological weight to predictprotein function from proteinprotein interactions.Bioinformatics 22(13) (July 2006) 1623–1630
9. Vzquez, A., Flammini, A., Maritan, A., Vespignani,A.: Global protein function prediction from protein-protein interaction networks. Nat Biotechnol 21(6)(June 2003) 697–700
10. Karaoz, U., Murali, T.M., Letovsky, S., Zheng, Y.,Ding, C., R.Cantor, C., Kasif, S.: Whole-genome an-notation by using evidence integration in functional-linkage networks. Proc Natl Acad Sci U S A 101(9)(March 2004) 2888–2893
11. Letovsky, S., Kasif, S.: Predicting protein functionfrom protein/protein interaction data: a probabilis-tic approach. Bioinformatics 19 Suppl 1 (2003)i197–i204
12. Deng, M., Tu, Z., Sun, F., Chen, T.: Mapping geneontology to proteins based on protein–protein inter-action data. Bioinformatics 20(6) (2004) 895–902
13. Wu, Y., Lonardi, S.: A linear-time algorithmfor predicting functional annotations from protein-protein interaction networks. In: Proceedings ofthe Workshop on Data Mining in Bioinformatics(BIOKDD’07). (2007) 35–41
14. Nabieva, E., Jim, K., Agarwal, A., Chazelle, B.,Singh, M.: Whole-proteome prediction of proteinfunction via graph-theoretic analysis of interactionmaps. Bioinformatics 21 Suppl 1 (June 2005) i302–i310
15. Jansen, R., Yu, H., Greenbaum, D., Kluger, Y.,Krogan, N.J., Chung, S., Emili, A., Snyder, M.,Greenblatt, J.F., Gerstein, M.: A Bayesian net-works approach for predicting protein-protein inter-actions from genomic data. Science 302(5644) (Oc-tober 2003) 449–453
16. Bader, J.S., Chaudhuri, A., Rothberg, J.M., Chant,J.: Gaining confidence in high-throughput proteininteraction networks. Nat Biotechnol 22(1) (January2004) 78–85
17. Yu, J., Fotouhi, F.: Computational approaches forpredicting protein—protein interactions: A survey.J. Med. Syst. 30(1) (2006) 39–44
18. Ben-Hur, A., Noble, W.S.: Kernel methods for pre-dicting protein-protein interactions. Bioinformatics21 Suppl 1 (June 2005)
19. Lee, I., Date, S.V., Adai, A.T., Marcotte, E.M.: Aprobabilistic functional network of yeast genes. Sci-ence 306(5701) (November 2004) 1555–1558
20. Qi, Y., Bar-Joseph, Z., Klein-Seetharaman, J.: Eval-uation of different biological data and computationalclassification methods for use in protein interactionprediction. PROTEINS: Structure, Function, andBioinformatics 3(63) (May 2006) 490–500
21. Resnik, P.: Using information content to evaluate se-mantic similarity. In: Proceedings of the 14th Inter-national Joint Conference on Artificial Intelligence.(1995) 448–453
22. Jiang, J.J., Conrath, D.W.: Semantic similaritybased on corpus statistics and lexical taxonomy. In:Proceedings of International Conference on Researchin Computational Linguistics. (1997)
23. Lin, D.: An information-theoretic definition of simi-larity. In: Proceedings of the 15th International Con-ference on Machine Learning. (1998)
24. Schlicker, A., Domingues, F.S., Rahnenfuhrer, J.,Lengauer, T.: A new measure for functional similar-ity of gene products based on gene ontology. BMCBioinformatics 7 (June 2006) 302–317
25. Lord, P.W., Stevens, R.D., Brass, A., Goble, C.A.:Semantic similarity measures as tools for exploringthe gene ontology. Pac Symp Biocomput (2003) 601–612
26. Murali, T., Wu, C., Kasif, S.: The art of gene func-tion prediction. Nat Biotechnol 24(12) (2006) 1474–1475
27. Stark, C., Breitkreutz, B.J., Reguly, T., Boucher,L., Breitkreutz, A., Tyers, M.: BioGRID: a generalrepository for interaction datasets. Nucleic Acids Res34(Database issue) (January 2006)
28. Mewes, H., Gruber, F., Geier, C., Haase, B.,Kaps, D., Lemcke, A., Mannhaupt, K., Pfeiffer, G.,Schuller, F.: MIPS: a database for genomes and pro-tein sequences. Nucleic Acids Res 30(1) (2002) 31–34
Related Documents