..................................................................................................................................................................................... ..................................................................................................................................................................................... CLINICAL RESEARCH Prevention and epidemiology Estimating modifiable coronary heart disease risk in multiple regions of the world: the INTERHEART Modifiable Risk Score Catherine McGorrian 1,2 , Salim Yusuf 1 , Shofiqul Islam 1 , Hyejung Jung 1 , Sumathy Rangarajan 1 , Alvaro Avezum 3 , Dorairaj Prabhakaran 4 , Wael Almahmeed 5 , Zvonko Rumboldt 6 , Andrzej Budaj 7 , Antonio L. Dans 8 , Hertzel C. Gerstein 1 , Koon Teo 1 , and Sonia S. Anand 1 * on behalf of the INTERHEART Investigators 1 Population Health Research Institute, Hamilton Health Sciences, McMaster University, David Braley Cardiovascular Stroke Research Institute, 237 Barton Street East, Hamilton, ON, Canada L8L 2X2; 2 School of Public Health, Physiotherapy and Population Science, University College Dublin, Dublin, Ireland; 3 Dante Pazzanese Institute of Cardiology, Sa ˜o Paulo, SP, Brazil; 4 Centre for Chronic Disease Control, New Delhi, India; 5 Sheikh Khalifa Medical City, Abu Dhabi, United Arab Emirates; 6 Split University School of Medicine, Split, Croatia; 7 Postgraduate Medical School, Grochowski Hospital Warsaw, Poland; and 8 Philippine General Hospital, University of Philippines, Manila, Philippines Received 17 September 2010; accepted 26 October 2010; online publish-ahead-of-print 22 December 2010 Aims Summating risk factor burden is a useful approach in the assessment of cardiovascular risk among apparently healthy individuals. We aimed to derive and validate a new score for myocardial infarction (MI) risk using modifiable risk factors, derived from the INTERHEART case–control study (n ¼ 19 470). Methods and results Multiple logistic regression was used to create the INTERHEART Modifiable Risk Score (IHMRS). Internal validation was performed using split-sample methods. External validation was performed in an international prospective cohort study. A risk model including apolipoproteins, smoking, second-hand smoke exposure, hypertension, and dia- betes was developed. Addition of further modifiable risk factors did not improve score discrimination in an external cohort. Split-sample validation studies showed an area under the receiver-operating characteristic (ROC) curve c-stat- istic of 0.71 [95% confidence interval (CI): 0.70, 0.72]. The IHMRS was positively associated with incident MI in a large cohort of people at low risk for cardiovascular disease [12% increase in MI risk (95% CI: 8, 16%) with a 1-point increase in score] and showed appropriate discrimination in this cohort (ROC c-statistic 0.69, 95% CI: 0.64, 0.74). Results were consistent across ethnic groups and geographic regions. A non-laboratory-based score is also supplied. Conclusions Using multiple modifiable risk factors from the INTERHEART case–control study, we have developed and validated a simple score for MI risk which is applicable to an international population. ----------------------------------------------------------------------------------------------------------------------------------------------------------- Keywords Risk score † Myocardial infarction † Prediction † Ethnic † Global † Risk factors Introduction The World Health Organization estimates that in 2010, coronary heart disease (CHD) will be the leading cause of death globally, causing 30.8% of all deaths per annum and with about 80% of all cardiovascular disease deaths occurring in developing countries. 1 The INTERHEART case–control study has shown that nine mod- ifiable risk factors account for more than 90% of the population attributable risk for acute myocardial infarction (MI) globally, a finding which was consistent in all regions of the world. 2 Risk stratification is widely suggested as best practice in the man- agement of individual cardiovascular disease risk. 3,4 Coronary heart disease risk estimation tools estimate the effects of multiple risk factors to obtain an overall estimate of a person’s own risk of disease. Such tools have been shown to be more accurate at pre- dicting risk than physician assessment alone. 5 A number of risk esti- mation tools are currently in use, such as the functions based on the Framingham cohort 6 and the European SCORE. 7 However, both tools use a limited number of risk factors in their risk esti- mation, and neither includes lifestyle factors such as dietary * Corresponding author. Tel: +1 905 527 4322 ext. 40320, Fax: +1 905 528 2814, Email: [email protected] Published on behalf of the European Society of Cardiology. All rights reserved. & The Author 2010. For permissions please email: [email protected]. European Heart Journal (2011) 32, 581–590 doi:10.1093/eurheartj/ehq448 by guest on August 14, 2012 http://eurheartj.oxfordjournals.org/ Downloaded from

Welcome message from author
This document is posted to help you gain knowledge. Please leave a comment to let me know what you think about it! Share it to your friends and learn new things together.
Transcript
. . . . . . . . . . . . . . . . . . . . . . . . . . . . . . . . . . . . . . . . . . . . . . . . . . . . . . . . . . . . . . . . . . . . . . . . . . . . . . . . . . . . . . . . . . . . . . . . . . . . . . . . . . . . . . . . . . . . . . . . . . . . . . . . . . . . . . . . . . . . . . . . . . . . . . . . . . . . . . . . . . . . . . . . . . . . . . . . . . . . .
. . . . . . . . . . . . . . . . . . . . . . . . . . . . . . . . . . . . . . . . . . . . . . . . . . . . . . . . . . . . . . . . . . . . . . . . . . . . . . . . . . . . . . . . . . . . . . . . . . . . . . . . . . . . . . . . . . . . . . . . . . . . . . . . . . . . . . . . . . . . . . . . . . . . . . . . . . . . . . . . . . . . . . . . . . . . . . . . . . . . .
CLINICAL RESEARCHPrevention and epidemiology
Estimating modifiable coronary heart diseaserisk in multiple regions of the world:the INTERHEART Modifiable Risk ScoreCatherine McGorrian1,2, Salim Yusuf1, Shofiqul Islam1, Hyejung Jung1,Sumathy Rangarajan1, Alvaro Avezum3, Dorairaj Prabhakaran4, Wael Almahmeed5,Zvonko Rumboldt6, Andrzej Budaj7, Antonio L. Dans8, Hertzel C. Gerstein1,Koon Teo1, and Sonia S. Anand1* on behalf of the INTERHEART Investigators1Population Health Research Institute, Hamilton Health Sciences, McMaster University, David Braley Cardiovascular Stroke Research Institute, 237 Barton Street East, Hamilton,ON, Canada L8L 2X2; 2School of Public Health, Physiotherapy and Population Science, University College Dublin, Dublin, Ireland; 3Dante Pazzanese Institute of Cardiology, SaoPaulo, SP, Brazil; 4Centre for Chronic Disease Control, New Delhi, India; 5Sheikh Khalifa Medical City, Abu Dhabi, United Arab Emirates; 6Split University School of Medicine, Split,Croatia; 7Postgraduate Medical School, Grochowski Hospital Warsaw, Poland; and 8Philippine General Hospital, University of Philippines, Manila, Philippines
Received 17 September 2010; accepted 26 October 2010; online publish-ahead-of-print 22 December 2010
Aims Summating risk factor burden is a useful approach in the assessment of cardiovascular risk among apparently healthyindividuals. We aimed to derive and validate a new score for myocardial infarction (MI) risk using modifiable riskfactors, derived from the INTERHEART case–control study (n ¼ 19 470).
Methodsand results
Multiple logistic regression was used to create the INTERHEART Modifiable Risk Score (IHMRS). Internal validationwas performed using split-sample methods. External validation was performed in an international prospectivecohort study. A risk model including apolipoproteins, smoking, second-hand smoke exposure, hypertension, and dia-betes was developed. Addition of further modifiable risk factors did not improve score discrimination in an externalcohort. Split-sample validation studies showed an area under the receiver-operating characteristic (ROC) curve c-stat-istic of 0.71 [95% confidence interval (CI): 0.70, 0.72]. The IHMRS was positively associated with incident MI in a largecohort of people at low risk for cardiovascular disease [12% increase in MI risk (95% CI: 8, 16%) with a 1-point increasein score] and showed appropriate discrimination in this cohort (ROC c-statistic 0.69, 95% CI: 0.64, 0.74). Results wereconsistent across ethnic groups and geographic regions. A non-laboratory-based score is also supplied.
Conclusions Using multiple modifiable risk factors from the INTERHEART case–control study, we have developed and validated asimple score for MI risk which is applicable to an international population.
- - - - - - - - - - - - - - - - - - - - - - - - - - - - - - - - - - - - - - - - - - - - - - - - - - - - - - - - - - - - - - - - - - - - - - - - - - - - - - - - - - - - - - - - - - - - - - - - - - - - - - - - - - - - - - - - - - - - - - - - - - - - - - - - - - - - - - - - - - - - - - - - - - - - - - - - - - -Keywords Risk score † Myocardial infarction † Prediction † Ethnic † Global † Risk factors
IntroductionThe World Health Organization estimates that in 2010, coronaryheart disease (CHD) will be the leading cause of death globally,causing 30.8% of all deaths per annum and with about 80% of allcardiovascular disease deaths occurring in developing countries.1
The INTERHEART case–control study has shown that nine mod-ifiable risk factors account for more than 90% of the populationattributable risk for acute myocardial infarction (MI) globally, afinding which was consistent in all regions of the world.2
Risk stratification is widely suggested as best practice in the man-agement of individual cardiovascular disease risk.3,4 Coronary heartdisease risk estimation tools estimate the effects of multiple riskfactors to obtain an overall estimate of a person’s own risk ofdisease. Such tools have been shown to be more accurate at pre-dicting risk than physician assessment alone.5 A number of risk esti-mation tools are currently in use, such as the functions based onthe Framingham cohort6 and the European SCORE.7 However,both tools use a limited number of risk factors in their risk esti-mation, and neither includes lifestyle factors such as dietary
* Corresponding author. Tel: +1 905 527 4322 ext. 40320, Fax: +1 905 528 2814, Email: [email protected]
Published on behalf of the European Society of Cardiology. All rights reserved. & The Author 2010. For permissions please email: [email protected].
European Heart Journal (2011) 32, 581–590doi:10.1093/eurheartj/ehq448
by guest on August 14, 2012
http://eurheartj.oxfordjournals.org/D
ownloaded from

intake and physical activity. Modifiable lifestyle risk factors are ofimportance to clinicians and patients alike, and there is an inherentappeal to develop a score which integrates such factors.
The INTERHEART study was a large standardized case–controlstudy involving cases of first MI from 52 different countries, andtheir sex- and age-matched controls (+5 years).2 Nine modifiablerisk factors were found to have a globally consistent associationwith MI: apolipoprotein levels, smoking, hypertension, diabetes,abdominal obesity, psychosocial factors, dietary factors, physicalexercise, and alcohol consumption. This study aims to examinethe utility of the modifiable CHD risk factors in risk assessmentand to derive and validate an appropriate ‘modifiable risk’ equationusing the multifactor data collected in INTERHEART. The consist-ency of the association of this risk factor equation with MI is thenassessed within both the INTERHEART population, by ethnicityand geographical area, and an external validation cohort. ‘Non-laboratory’ and lipoprotein-based equations are also derived.
MethodsDetails of the participants and data collection procedures used aredescribed in detail elsewhere.2 Briefly, INTERHEART was a case–control study which recruited cases of first acute MI admitted to cor-onary care or equivalent units, and at least one sex- and age-matched(within 5 years) control, who had no history of heart disease. Partici-pants were recruited from 252 centers in 52 countries worldwide.
Data on lifestyle and other risk factors were collected by a struc-tured questionnaire, and a standardized physical examination was per-formed.2 Non-fasting blood samples were drawn from everyparticipant, centrifuged within 2 h of extraction, and frozen immedi-ately at 220 or 2708C. For cases, samples were to be drawnwithin 24 h of symptom onset, although due to delayed presentation,especially in lower income countries, this was only achieved intwo-thirds of cases. Samples were shipped in liquid nitrogen to thecore laboratories in Hamilton, Canada and Beijing, China. Apolipopro-tein concentrations were measured using immunoturbidmetric assays(Roche/Hitachi 917 analyser with Tina/quant Apo B version 2 andApoA1 version 2 kits; Roche Diagnostics, Mannheim, Germany).8
INTERHEART was approved by the appropriate Ethics Committeein all participating study countries and centres. Informed consent wasprovided by all participants before taking part in the study.
Statistical methodsStage 1: Assessment of each proposed risk factorAfter data cleaning and exclusion of subjects with missing risk factordata, the data set was split into a 2/3s derivation set and a 1/3 testset.9 Splitting of the data was performed in a paired manner, to main-tain the matched nature of the data, and was stratified by sex and geo-graphic area.
Using the 2/3s derivation set, each of the nine modifiable risk factorswas examined in a simple logistic regression model, adjusting for sex,age, and geographic region, and with acute MI as the dependent oroutcome variable. The variables relating to each risk factor werechosen from the questionnaire data based both on the variablesused in previous INTERHEART analyses and publications2,10 –12 andon the expected clinical utility of the variable. Categorical variableswere examined using design variables. Proposed variables wereretained if they achieved the set criterion of a ≤ 0.05 for statistical sig-nificance in the simple model.
Stage 2: Creation of risk factor definitions to be used inthe INTERHEART Modifiable Risk ScoreThe following risk factor definitions were selected. The apolipoproteinB:A1 ratio (included as a continuous variable in the final model and asquartiles for the final score) was selected as the measure of lipidstatus of choice. A secondary model (the ‘cholesterol’ score) replacedapolipoproteins with low-density lipoprotein and high-density lipopro-tein measurements, for use in regions where apolipoprotein testing isnot readily available. Current smokers were defined as individualswho had smoked any tobacco in the last 12 months, including thosepeople who had quit within that time. Current smoking was categorizedinto number of cigarettes or beedies smoked per day. Former smokerswere those persons who had quit 12 or more months prior to the inter-view. Second-hand smoke was defined as exposure for one or morehours per week, vs. less or no exposure. Hypertension and diabeteswere both defined by self-report. Waist–hip ratio was chosen as theoptimal index of abdominal obesity (included as a continuous variablein the final model and as quartiles for the final score).12
Psychosocial factors included details of work/home stress,depression, perceived locus of control, incidence of adverse lifeevents, and financial stress. Diet-related variables chosen were thosewhich had previously been identified as having the strongest associ-ation with case status.13 Consumption was measured in the frequencyof eating the foodstuff in question, and the diet variables were ulti-mately included as dichotomous variables. Physical exercise wasdefined as the level of regular physical activity during leisure time.Family history was defined as a history of MI in either parent, at anyage. This variable was only used in the ‘non-laboratory’-based score.A variable on alcohol was not included, because of the potential fora ‘mixed’ public health message.
Stage 3: Calculation of the risk equationMethods similar to those of Sullivan et al.14 from the FraminghamHeart study were used to develop the IHMRS. The risk factor variableswere examined in multivariable unconditional logistic regressionmodels, with MI case status as the dependent variable. Variableswere added to the multivariable model in a forward stepwisemethod, with variable entry chosen manually by the investigators asper the relative importance and effect size attributed to each riskfactor from the INTERHEART study. The criterion for statistical signifi-cance was set at a ≤ 0.05. The effect of interaction terms wasassessed, with terms relating to risk factor*age/sex included in themodel building. Model fit was checked at each step using the areaunder the receiver-operating characteristic (ROC) curve c-statistic,and the integrated discrimination index (IDI) was used to measurethe improvement in model discrimination as variables were added.15
INTERHEART used a matched design for age (+5 years) and sex,with the result that the true effects of age and sex cannot be accuratelyestimated in this analysis. Nevertheless, we wished to include an age-and sex-related variable, to maintain optimal face validity of the score.Furthermore, because matching was not achieved in all recruited sub-jects, an effect of both age and sex was evident on logistic regressionanalysis. Therefore, unconditional logistic regression was used to opti-mize the use of the data, and all models were adjusted by age and sex.A single age and sex variable was created which classified men andwomen into younger vs. older groups (men younger than 55 andwomen younger than 65, or else older) based on epidemiological evi-dence of this age gap of risk from both INTERHEART2 and the Fra-mingham study.16,17 After the risk factor variable panel for theequation was selected, a base or reference category was assignedfor each variable. The other categories were then valued on how farthey were from the base category and this value was weighted by
C. McGorrian et al.582
by guest on August 14, 2012
http://eurheartj.oxfordjournals.org/D
ownloaded from

multiplying it by the b coefficient from the multiple regressionequation. The points were derived by multiplying by an empirical con-stant and rounding to the nearest integer, for ease of use of the riskscore. Three models were developed: a ‘short’ score, a ‘full’ score,and a ‘non-laboratory’-based score. A secondary model, the ‘choles-terol’ score, was also created. Analyses were performed using Inter-cooled Stata 9 (StataCorp, TX, USA).
Stage 4: Internal validationValidation of the scores was assessed in the 1/3 test set using measuresof calibration and discrimination. Calibration is the agreement betweenthe expected probabilities of disease and the actual event rate seen inthe test set and refers to the extent that bias influences the model. Cali-bration is often assessed by the Hosmer–Lemeshow test.18 However,the results of the Hosmer–Lemeshow test can vary by the statisticalsoftware used19 and the test is over-sensitive to small deviations in fitas the sample size increases.20 To address these problems, the decilesof risk were compared separately and displayed as a calibration plotof the observed vs. expected events. Discrimination, or refinement, isa measure of a model’s ability to rank subjects correctly in terms ofrisk. Model discrimination (i.e. the model’s ability to rank persons appro-priately, from low to high risk) was assessed using the c-statistic fromROC testing,21 and further estimates of model discrimination weremade on subgroups of the population. Measures of global fit werealso examined, including the Akaike information criteria,22 the Bayesianinformation criteria,23 and the Brier score.24 The Brier score quantifiesthe overall accuracy of predictions and ranges from 0 (perfect accuracy)to 0.25 (worthless). Competing risk equation scores were examinedand compared using these measures, and the final model was deter-mined as that which provided the best fit in terms of the ROC c-statistic,with due regard to the aim of model parsimony.
Stage 5: External validationThe final score (termed the IHMRS) was assessed in an independentstudy population. EpiDREAM is an international prospective cohortstudy which includes follow-up data on 18 990 participants who werescreened for eligibility for the DREAM (Diabetes REduction Assess-ment with ramipril and rosiglitazone Medication) clinical trial.25 Subjectswere recruited from 21 countries and 191 centers, from NorthAmerica, South America, Europe, Australia, and Asia. All participantscompleted a questionnaire with information collected on medicalhistory, physical activity, and diet. Furthermore, all participants under-went a 75 g oral glucose tolerance test, and physical measurementsincluding weight, height, and waist and hip circumference were takenusing a standardized protocol. Six thousand and eight hundred subjects(35.8%) had impaired fasting glucose or impaired glucose tolerance(5269 of whom were randomized into DREAM), 2563 subjects(13.5%) had type-2 diabetes, and 9627 subjects (50.7%) were normo-glycaemic. The IHMRS was evaluated against incident MI (n ¼ 95) andincident CHD (including MI, new angina, and revascularization) (n ¼289). The models were adjusted for trial status and region.
ResultsData from 27 043 INTERHEART participants were available foranalysis, 14 605 controls and 12 438 cases. When those partici-pants with missing data were excluded, the final number availablefor analysis was 19 470. Of those excluded with missing data,5714 had missing apolipoprotein data (no blood sample hadbeen taken). After data splitting, there were 12 772 subjects inthe derivation set, 5349 cases (41.9%) and 7423 controls
(58.1%); and 6698 subjects in the test set, 2868 cases (42.8%)and 3830 controls (57.2%); 75.3% of the participants in the deri-vation set were males (n ¼ 9615), compared with 77.2% in thetest set (n ¼ 5,168). Mean age in the derivation set was 57.46years (standard deviation or SD 12.13) and in the test set, 57.16(SD 11.99).
Modifiable risk factors contributing to CHD risk which wereidentified in the INTERHEART study (Table 1) were examined inunivariable and multivariable logistic regression models. Variableswhich were not retained in the multivariable model included‘adverse life events’ (which did not maintain statistical significancein the multivariable model), and ‘locus of control’ and financialstress variables (excluded because there was a large missing databurden and little incremental predictive ability with these factors).Interaction terms for both age and sex with hypertension, diabetes,and apolipoprotein B:A1 ratio were statistically significant in themultivariable model, but were omitted from the final modelbecause of the lack of incremental value associated with theirinclusion, and the potential complexity of a risk score were theyto be retained. The risk factors were then assessed for their incre-mental predictive ability with their addition to the final model(Table 2). A risk model including age, sex, apolipoproteins,
. . . . . . . . . . . . . . . . . . . . . . . . . . . . . . . . . . . . . . . . . . . . . . . . . . . . . . . . . . . . . . . . . . . . . . . . . . . . . . . .
Table 1 Variables examined in the risk scorederivation process
Variable Definition
Apolipoprotein B: A1 level Included in the model as a continuousvariable, split into quartiles at thescore development stage
Smoking status Never smoked, former smoker (ceasedsmoking 12 or more months ago), orcurrent smoker (smoked regularly inthe last 12 months: by averagenumber of cigarettes smoked daily)
Second hand smokeexposure
More than 1 h of passive smokeexposure per week
Diabetes mellitus Self-report of diabetes mellitus
Hypertension Self-report of hypertension
Abdominal obesity:waist-to-hip ratio(WHR)
Included in the model as a continuousvariable, split into quartiles at thescore development stage
General stress How often have you felt stress in thelast year? Never/some periods ORseveral periods/permanently
Depression During the past 12 months, was thereever a time when you felt sad, blue,or depressed for 2 weeks or more ina row?
Dietary factors Salty foods or snacks ≥1 time a day (%)Deep fried foods/snacks/fast foods ≥3
times a week (%)Fruit: ≥1 time fruit dailyVegetables: ≥1 time vegetables dailyMeat and poultry: ≥2 times daily
Physical activity Activity during leisure time: none ormild, or moderate or strenuous
The INTERHEART Modifiable Risk Score 583
by guest on August 14, 2012
http://eurheartj.oxfordjournals.org/D
ownloaded from

smoking, hypertension, and diabetes had an ROC c-statistic of 0.72[95% confidence interval (CI): 0.72, 0.73]. Addition of further vari-ables significantly increased the ROC c-statistic to 0.73 (95% CI:0.72, 0.74) (Pearson’s x2 54.87, P , 0.0001); however, it did soat the expense of model parsimony. Four risk score versionswere therefore created. The two scores for consideration as theprimary INTERHEART risk scores were a ‘short’ score, whichwas the most parsimonious, and a ‘full’ score, including all therisk factors. Two supplemental scores were derived: a ‘cholesterol’score, for settings in which laboratory measurements of apolipo-proteins were not available, and a ‘non-laboratory-based’ score,which did not include any lab-based measures of lipid status.Table 3 shows the internal validation for the four scores. TheROC c-statistic in the 1/3 test set was greater for the ‘full’ scorethan for the ‘short’ score (Pearson’s x2 ¼ 6.28, P ¼ 0.012), butthe absolute difference in c-statistic was small, and was outweighedby the loss of model parsimony and increased complexity of the‘full’ model. Therefore, the ‘short’ score was accepted as theprimary IHMRS, and Table 4 shows the odds ratios for thisIHMRS model. Although for clarity in this table, the apolipopro-teins are presented as quartile 4 vs. quartile 1 comparisons,these were included as continuous variables in the final model.Similarly, smoking status is shown as current or former smoking,whereas current smokers were included in the final model as cat-egorical variables by the number of cigarettes smoked. Checks of
collinearity on the final model revealed a variance inflation factorof 1.2, indicating that collinearity was not present.26,27 The ‘full’,‘non-laboratory’, and ‘cholesterol’ versions of the score are avail-able in the Supplementary material online, Tables S1–S3.
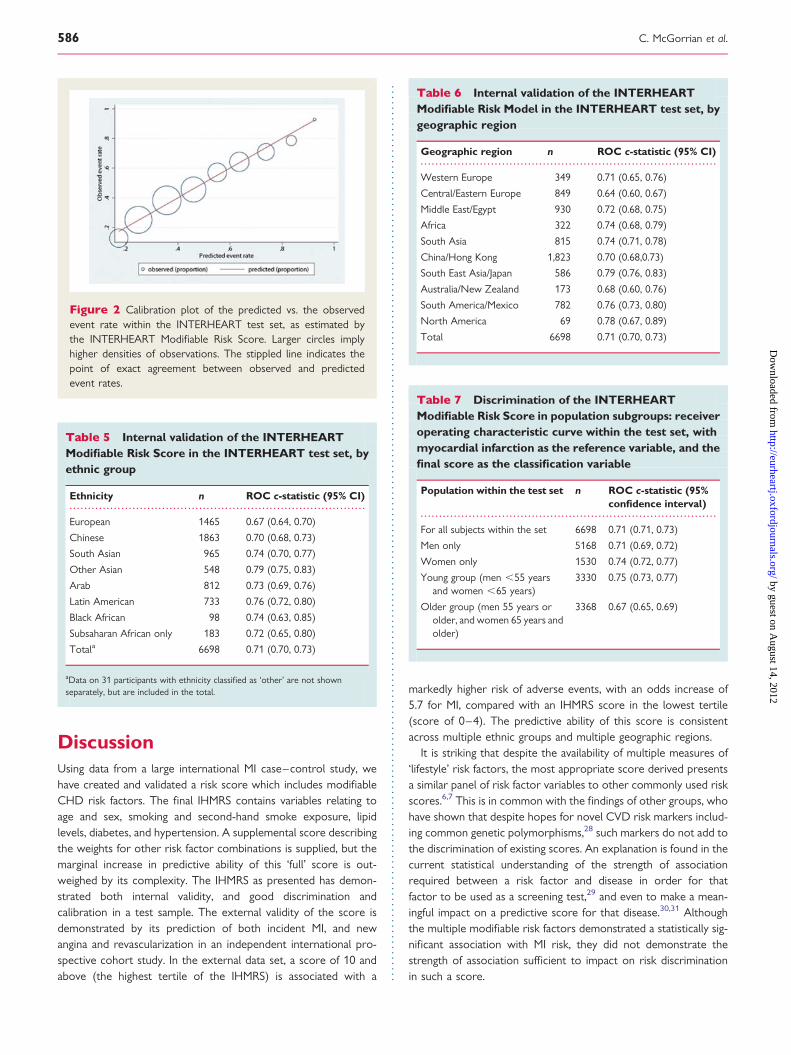
The probability of MI increased as the IHMRS increases, in the1/3 test set (Figure 1). The assessment of IHMRS calibration (theHosmer–Lemeshow test) in the 1/3 test set suggests a significantlack of fit (Hosmer–Lemeshow x2¼28.69, P ¼ 0.0004). However,ranking the observations by deciles of predicted risk and perform-ing the Hosmer–Lemeshow test on each group separately showthat the lack of fit occurs predominantly at the extremes of pre-dicted risk (Supplementary material online, Table S4). A calibrationplot (Figure 2) similarly shows good agreement between observedvs. predicted events in the groups where the majority of the sub-jects lie. The validation of the score by the ethnic group is shown inTable 5 and by the geographic region in Table 6. Discrimination asassessed by the ROC c-statistic is best among the South EastAsian and Japanese (ROC c-statistic 0.79, 95% CI: 0.76, 0.83),North American (0.76, 95% CI: 0.73, 0.80), South American andMexican (0.76, 95% CI: 0.73, 0.80), and South Asian (0.74, 95%CI: 0.71, 0.78) geographic regions and acceptable in the MiddleEast and Egypt, Western European, and China/Hong Kongregions. Discrimination was poorest in the Australia/New Zealand and Central and Eastern European geographicareas, and also in the European and other ethnic groups. Wealso examined the discriminative ability of the IHMRS in men andwomen and in the older and younger groups (Table 7). TheROC c-statistic was higher in women than in men (Pearson’sx2¼6.10, P ¼ 0.014) and higher in the younger group than in theolder group (Pearson’s x2¼41.05, P , 0.0001).
The IHMRS is presented in Table 8. The categories of the riskfactors are presented in the first column, and the specific questionsto be asked in the middle columns. Only one answer is chosen forevery question and inserted into the ‘points’ column. All questionsmust be answered for the most accurate risk score estimate. Themean score in the derivation set is 9.47 (SD 5.59; min 0, max 32),and in the test set, the mean score is 9.97 (SD 5.65), Student’st-test t¼25.90, P , 0.001. Examining the derived score in thetest set (n ¼ 6687), the mean score is higher in the cases than inthe controls (12.37, SD 5.55 vs. 8.17, SD 5.02, Student’st ¼ 232.37, P , 0.0001), higher in the older than in the youngergroups (10.63, SD 5.36, vs. 9.30, SD 5.86, Student’s t ¼ 29.65,P , 0.0001) and higher in men than in women (10.44, SD 5.64vs. 8.37, SD 5.37, Student’s t ¼ 212.71, P , 0.0001).
An external validation procedure was undertaken in an indepen-dent cohort study. The characteristics of the EpiDREAM and theINTERHEART derivation set populations are shown in Supplemen-tary material online, Table S5. Definitions of modifiable risk factorsin EpiDREAM were matched to the INTERHEART definitions (seeSupplementary material online, Table S6). In the EpiDREAM cohort,among 18 838 persons who had no prior history of MI, there were95 first MI events and a median follow-up of 3.5 years (inter-quartilerange 3.0–4.0). The mean IHMRS in EpiDREAM participants is 8.1(SD 5.4). For a 1-point increase in the IHMRS, the odds of MIincreased by 1.12 (95% CI: 1.08, 1.16). This association betweenMI risk and IHMRS in EpiDREAM is linear (see Supplementarymaterial online, Table S7) and is seen consistently across
. . . . . . . . . . . . . . . . . . . . . . . . . . . . . . . . . . . . . . . . . . . . . . . . . . . . . . . . . . . . . . . . . . . . . . . . . . . . . . . .
Table 2 Building the multivariable model: forwardstepped approach, using logistic regression in thederivation set, with case status as the dependentvariable
Modelexamined
ROC c-statistic(95% confidenceinterval)
Integrateddiscriminationindex (z, P-value)a
Brierscore
Model adjustedfor region andthe age/sexvariable
0.559 (0.549, 0.569) — 0.241
Above + apoB:A1 ratio
0.633 (0.623, 0.643) 0.034 (z ¼ 3.828,P , 0.001)
0.232
+smokingvariables
0.681 (0.672, 0.690) 0.048 (z ¼ 1.759,P , 0.001)
0.221
+diabetes 0.702 (0.693, 0.711) 0.024 (z ¼ 1.759,P ¼ 0.039)
0.215
+hypertension 0.719 (0.710, 0.728) 0.019 (z ¼ 1.290,P ¼ 0.099)
0.210
+abdominalobesity
0.721 (0.712, 0.730) 0.004 (z ¼ 0.257,P ¼ 0.399)
0.209
+dietary factors 0.726 (0.717, 0.735) 0.007 (z ¼ 0.359,P ¼ 0.359)
0.208
+physical activity 0.727 (0.718, 0.736) 0.001 (z ¼ 0.049,P ¼ 0.480)
0.207
+psychosocialfactors
0.733 (0.718, 0.736) 0.008 (z ¼ 0.364,P ¼ 0.358)
0.205
Each step shows the associated change in model discrimination. Note. Independentvariables are added in a forward stepwise manner.aIDI is for each successive model when compared with the preceding model.
C. McGorrian et al.584
by guest on August 14, 2012
http://eurheartj.oxfordjournals.org/D
ownloaded from

geographical regions (see Supplementary material online, Table S8).The ROC curve c-statistic for the IHMRS in EpiDREAM was 0.69(95% CI: 0.64, 0.74) (Figure 3). The score showed good calibrationusing the Hosmer–Lemeshow goodness-of-fit test (x2¼3.08, P ¼0.93). Comparing the top tertile of the IHMRS (score ≥10) to thelowest tertile (≤4), the odds ratio for MI is 5.67 (95% CI: 2.77,11.59), and comparing the middle tertile of score to the lowestthe odds ratio is 2.22 (95% CI: 1.02, 4.82) (Figure 4). The IHMRSshows a graded increase in the probability of an MI in EpiDREAM.The probability of suffering an MI at 3.25 years is 0.12% forpeople classified in the lowest score tertile (IHMRS ≤ 4), 0.27% inthe middle tertile (IHMRS: 5–9), and 0.68% in the highest scoretertile (IHMRS ≥ 10). Table 9 shows the 1- and 3.25-year probabil-ities of events by tertiles of the IHMRS. From the EpiDREAM vali-dation cohort ROC curve shown in Figure 3, a risk score of ≥5 isassociated with a sensitivity of 77.9% and a specificity of 49.5% forMI. In general, lower scores are associated with greater sensitivityand higher scores with higher specificity.
. . . . . . . . . . . . . . . . . . . . . . . . . . . . . . . . . . . . . . . . . . . . . . . . . . . . . . . . . . . . . . . . . . . . . . . . . . . . . . . . . . . . . . . . . . . . . . . . . . . . . . . . . . . . . . . . . . . . . . . . . . . . . . . . . . . . . . . . . . . . . . . . . . . . . . . . . . . . . . . . . . . . . . . . . . . . . . .
. . . . . . . . . . . . . . . . . . . . . . . . . . . . . . . . . . . . . . . . . . . . . . . . . . . . . . . . . . . . . . . . . . . . . . . . . . . . . . . . . . . . . . . . . . . . . . . . . . . . . . . . . . . . . . . . . . . . . . . . . . . . . . . . . . . . . . . . . . . . . . . . . . . . . . . . . . . . . . . . . . . . . . . . . . . . . . .
Table 3 Internal validation studies of the three tested modifiable risk scores: the ‘short’ score, the ‘full’ score, and the‘non-laboratory-based’ score
‘Short’ INTERHEARTModifiable Risk Score
‘Full’ INTERHEARTModifiable Risk Score
‘Cholesterol’ riskscore
‘Non-laboratory-based’INTERHEART ModifiableRisk Score
Validation studies within the 2/3 derivation set
Odds increase of MI for a 1-pointincrease in score (95% CI)
15.2% (14.4%, 16.1%) 14.3% (13.5%, 15.1%) 12.9% (12.2%, 13.7%) 14.4% (13.9%, 15.3%)
ROC c-statistic (95% CI) 0.71 (0.70, 0.72) 0.72 (0.71, 0.73) 0.69 (0.68, 0.70) 0.71 (0.70, 0.72)
Brier score 0.21 0.21 0.22 0.21
Validation studies within the 1/3 test set
Odds increase of MI for a 1-pointincrease in score (95% CI)
15.8% (14.7%, 17.0%) 14.0% (13.0%, 15.1%) 13.0% (12.0%, 14.3%) 14.2% (13.1%, 15.3%)
ROC c-statistic (95% CI) 0.71 (0.70, 0.73) 0.71 (0.71, 0.73) 0.69 (0.68, 0.71) 0.71 (0.70, 0.72)
Brier score 0.21 0.21 0.22 0.21
. . . . . . . . . . . . . . . . . . . . . . . . . . . . . . . . . . . . . . . . . . . . . . . . . . . . . . . . . . . . . . . . . . . . . . . . . . . . . . . . . . . . . . . . . . . . . . . . . . . . . . . . . . . . . . . . . . . . . . . . . . . . . . . . . . . . . . . . . . . . . . . . . . . . . . . . . . . . . . . . . . . . . . . . . . . . . . .
Table 4 The INTERHEART Modifiable Risk Score model
Risk factor Oddsratio
95% confidenceinterval
Standarderror
z P-value
Age and sex Male sex and age ≥ 55 years or female sex and age ≥ 65years vs. younger
1.25 1.15, 1.35 0.05 5.40 ,0.001
Apolipoprotein B:A1ratio
Quartile 4 vs. Quartile 1 2.98 2.66, 3.34 0.17 18.64 ,0.001
Smoking Current smoking vs. never smoking 2.33 2.13, 2.55 0.11 18.54 ,0.001
Former smoking vs. never smoking 1.31 1.18, 1.46 0.07 5.07 ,0.001
Second-hand smoke exposure (≥1 h/week) 1.50 1.38, 1.63 0.06 9.50 ,0.001
Self-report of diabetes 2.50 2.21, 2.82 0.15 14.90 ,0.001
Self-report ofhypertension
2.04 1.87, 2.22 0.09 16.30 ,0.001
Multivariable logistic regression in the derivation set with case status as the dependent variable and the risk factors as independent variables. Note. Model is adjusted for geographicregion and age and sex.
Figure 1 Two-way plot of the INTERHEART Modifiable RiskScore and the observed probability of myocardial infarction, inthe INTERHEART test set.
The INTERHEART Modifiable Risk Score 585
by guest on August 14, 2012
http://eurheartj.oxfordjournals.org/D
ownloaded from
DiscussionUsing data from a large international MI case–control study, wehave created and validated a risk score which includes modifiableCHD risk factors. The final IHMRS contains variables relating toage and sex, smoking and second-hand smoke exposure, lipidlevels, diabetes, and hypertension. A supplemental score describingthe weights for other risk factor combinations is supplied, but themarginal increase in predictive ability of this ‘full’ score is out-weighed by its complexity. The IHMRS as presented has demon-strated both internal validity, and good discrimination andcalibration in a test sample. The external validity of the score isdemonstrated by its prediction of both incident MI, and newangina and revascularization in an independent international pro-spective cohort study. In the external data set, a score of 10 andabove (the highest tertile of the IHMRS) is associated with a
markedly higher risk of adverse events, with an odds increase of5.7 for MI, compared with an IHMRS score in the lowest tertile(score of 0–4). The predictive ability of this score is consistentacross multiple ethnic groups and multiple geographic regions.
It is striking that despite the availability of multiple measures of‘lifestyle’ risk factors, the most appropriate score derived presentsa similar panel of risk factor variables to other commonly used riskscores.6,7 This is in common with the findings of other groups, whohave shown that despite hopes for novel CVD risk markers includ-ing common genetic polymorphisms,28 such markers do not add tothe discrimination of existing scores. An explanation is found in thecurrent statistical understanding of the strength of associationrequired between a risk factor and disease in order for thatfactor to be used as a screening test,29 and even to make a mean-ingful impact on a predictive score for that disease.30,31 Althoughthe multiple modifiable risk factors demonstrated a statistically sig-nificant association with MI risk, they did not demonstrate thestrength of association sufficient to impact on risk discriminationin such a score.
Figure 2 Calibration plot of the predicted vs. the observedevent rate within the INTERHEART test set, as estimated bythe INTERHEART Modifiable Risk Score. Larger circles implyhigher densities of observations. The stippled line indicates thepoint of exact agreement between observed and predictedevent rates.
. . . . . . . . . . . . . . . . . . . . . . . . . . . . . . . . . . . . . . . . . . . . . . . . . . . . . . . . . . . . . . . . . . . . . . . . . . . . . . . .
Table 5 Internal validation of the INTERHEARTModifiable Risk Score in the INTERHEART test set, byethnic group
Ethnicity n ROC c-statistic (95% CI)
European 1465 0.67 (0.64, 0.70)
Chinese 1863 0.70 (0.68, 0.73)
South Asian 965 0.74 (0.70, 0.77)
Other Asian 548 0.79 (0.75, 0.83)
Arab 812 0.73 (0.69, 0.76)
Latin American 733 0.76 (0.72, 0.80)
Black African 98 0.74 (0.63, 0.85)
Subsaharan African only 183 0.72 (0.65, 0.80)
Totala 6698 0.71 (0.70, 0.73)
aData on 31 participants with ethnicity classified as ‘other’ are not shownseparately, but are included in the total.
. . . . . . . . . . . . . . . . . . . . . . . . . . . . . . . . . . . . . . . . . . . . . . . . . . . . . . . . . . . . . . . . . . . . . . . . . . . . . . . .
Table 6 Internal validation of the INTERHEARTModifiable Risk Model in the INTERHEART test set, bygeographic region
Geographic region n ROC c-statistic (95% CI)
Western Europe 349 0.71 (0.65, 0.76)
Central/Eastern Europe 849 0.64 (0.60, 0.67)
Middle East/Egypt 930 0.72 (0.68, 0.75)
Africa 322 0.74 (0.68, 0.79)
South Asia 815 0.74 (0.71, 0.78)
China/Hong Kong 1,823 0.70 (0.68,0.73)
South East Asia/Japan 586 0.79 (0.76, 0.83)
Australia/New Zealand 173 0.68 (0.60, 0.76)
South America/Mexico 782 0.76 (0.73, 0.80)
North America 69 0.78 (0.67, 0.89)
Total 6698 0.71 (0.70, 0.73)
. . . . . . . . . . . . . . . . . . . . . . . . . . . . . . . . . . . . . . . . . . . . . . . . . . . . . . . . . . . . . . . . . . . . . . . . . . . . . . . .
Table 7 Discrimination of the INTERHEARTModifiable Risk Score in population subgroups: receiveroperating characteristic curve within the test set, withmyocardial infarction as the reference variable, and thefinal score as the classification variable
Population within the test set n ROC c-statistic (95%confidence interval)
For all subjects within the set 6698 0.71 (0.71, 0.73)
Men only 5168 0.71 (0.69, 0.72)
Women only 1530 0.74 (0.72, 0.77)
Young group (men ,55 yearsand women ,65 years)
3330 0.75 (0.73, 0.77)
Older group (men 55 years orolder, and women 65 years andolder)
3368 0.67 (0.65, 0.69)
C. McGorrian et al.586
by guest on August 14, 2012
http://eurheartj.oxfordjournals.org/D
ownloaded from

A measure of apolipoproteins, in place of lipoproteins, is uniqueto the IHMRS. The apolipoprotein B:A1 ratio has been demon-strated to be a marker of coronary artery disease risk in large
. . . . . . . . . . . . . . . . . . . . . . . . . . . . . . . . . . . . . . . . . . . . . . . . . . . . . . . . . . . . . . . . . . . . . . . . . . . . . . . . . . . . . . . . . . . . . . . . . . . . . . . . . . . . . . . . . . . . . . . . . . . . . . . . . . . . . . . . . . . . . . . . . . . . . . . . . . . . . . . . . . . . . . . . . . . . . . .
. . . . . . . . . . . . . . . . . . . . . . . . . . . . . . . . . . . . . . . . . . . . . . . . . . . . . . . . . . . . . . . . . . . . . . . . . . . . . . . . . . . . . . . . . . . . . . . . . . . . . . . . . . . . . . . . . . . . . . . . . . . . . . . . . . . . . . . . . . . . . . . . . . . . . . . . . . . . . . . . . . . . . . . . . . . . . . .
. . . . . . . . . . . . . . . . . . . . . . . . . . . . . . . . . . . . . . . . . . . . . . . . . . . . . . . . . . . . . . . . . . . . . . . . . . . . . . . . . . . . . . . . . . . . . . . . . . . . . . . . . . . . . . . . . . . . . . . . . . . . . . . . . . . . . . . . . . . . . . . . . . . . . . . . . . . . . . . . . . . . . . . . . . . . . . .
. . . . . . . . . . . . . . . . . . . . . . . . . . . . . . . . . . . . . . . . . . . . . . . . . . . . . . . . . . . . . . . . . . . . . . . . . . . . . . . . . . . . . . . . . . . . . . . . . . . . . . . . . . . . . . . . . . . . . . . . . . . . . . . . . . . . . . . . . . . . . . . . . . . . . . . . . . . . . . . . . . . . . . . . . . . . . . .
. . . . . . . . . . . . . . . . . . . . . . . . . . . . . . . . . . . . . . . . . . . . . . . . . . . . . . . . . . . . . . . . . . . . . . . . . . . . . . . . . . . . . . . . . . . . . . . . . . . . . . . . . . . . . . . . . . . . . . . . . . . . . . . . . . . . . . . . . . . . . . . . . . . . . . . . . . . . . . . . . . . . . . . . . . . . . . .
. . . . . . . . . . . . . . . . . . . . . . . . . . . . . . . . . . . . . . . . . . . . . . . . . . . . . . . . . . . . . . . . . . . . . . . . . . . . . . . . . . . . . . . . . . . . . . . . . . . . . . . . . . . . . . . . . . . . . . . . . . . . . . . . . . . . . . . . . . . . . . . . . . . . . . . . . . . . . . . . . . . . . . . . . . . . . . .
Table 8 The INTERHEART Modifiable Risk Score
Risk factors Question Point forthe answer
Points foreach section
Age Are you a man 55 years or older OR woman 65 years or older? 2 Points:OR Are you a man younger than 55 years or woman younger than 65 years 0
Apolipoprotein B:A1 ratio Pick one only: Q1: Less than 0.633 0 Points:Q2: 0.633–0.792 2Q3: 0.792–0.983 3Q4: Greater than or ¼0.984 7
Smoking. Pick the descriptionwhich matches you best:
I never smoked 0 Points:OR I am a former smoker (last smoked more than 12 months ago) 2OR I am a current smoker or I smoked
regularly in the last 12 months, and Ismoke. . .
1–5 cigarettes/day 26–10 cigarettes/day 411–15 cigarettes/day 616–20 cigarettes/day 7More than 20 cigarettes/day 10
Second hand smoke Over the past 12 months, what has been yourtypical exposure to other people’stobacco smoke?
Less than 1 h or exposure perweek or no exposure
0 Points:
OR one or more hours ofsecond-hand smoke exposureper week
2
Diabetes Do you have diabetes mellitus? Yes 6 Points:No or unsure 0
High blood pressure Do you have high blood pressure Yes 5 Points:No or unsure 0
Total:
The categories of the risk factors are presented in the first column, and the specific questions to be asked in the middle columns. Only one answer is chosen for every question,and inserted into the ‘points’ column. All questions must be answered for the most accurate risk score estimate. Minimum score is 0 and maximum is 32.
Figure 3 Receiver-operating characteristic curves for myocar-dial infarction, for the INTERHEART Modifiable Risk Score in theEpiDREAM Cohort Study. From the EpiDREAM validation cohortreceiver-operating characteristic curve shown in Figure 3, a riskscore of ≥5 is associated with a sensitivity of 77.9% and a speci-ficity of 49.5% for myocardial infarction. In general, lower scoresare associated with greater sensitivity and higher scores withhigher specificity.
Figure 4 Odds ratio (adjusted for trial status and region) ofmyocardial infarction in EpiDREAM, by tertiles of the INTER-HEART Modifiable Risk Score.
The INTERHEART Modifiable Risk Score 587
by guest on August 14, 2012
http://eurheartj.oxfordjournals.org/D
ownloaded from

prospective epidemiological studies32,33 and has the advantage thatit can be assayed from samples taken in the non-fasting state. Theapolipoprotein B:A1 ratio was preferentially used in the IHMRS, aspatients were not obliged to be in the fasting state at time of bloodsampling, and previous work has suggested its superiority to lipo-protein measurements.8 However, for settings where apolipopro-tein assays may not be available, the ‘non-laboratory-based’ scoremay be used. Non-laboratory-based scores have an added advan-tage that they do not require lab testing facilities in order to esti-mate risk, making them ideal for the patient’s first visit in primarycare settings, for community worker use, and for use in resource-poor settings. Two other groups have created non-laboratory riskscores in recent years,34,35 but neither score includes the wealth ofmodifiable risk factors available in INTERHEART. It is envisagedthat the IHMRS might be used in clinical situations where riskfactors are self-reported and the results are reviewed with ahealth-care worker.
Our score has a number of strengths. It is derived from a multi-ethnic study sample, from 52 countries of the world and everyinhabited continent, with an even representation of men andwomen. It is generalizable across diverse ethnic populations andgeographic regions, which is an advance over other risk scoreswhich were developed and validated in white Caucasians primarily,and which have had variable predictability in non-white popu-lations.36 Our variables were chosen with both clinical and statisti-cal utility in mind, and the data used were derived fromstandardized questionnaires and physical assessments. A centrallaboratory performed all the blood assays including those in theexternal validation studies. Patients have been shown to basetheir understanding of cardiovascular disease risk on personalexperiences, rather than on population estimates.37 The IHMRSprovides a synthesis of patient-level modifiable risk factors, andrisk level is described as tertiles of risk. This may well be aneasier concept for patients to understand, rather than the moreremote concept of a percentage risk of MI.
We have performed internal validity testing on the IHMRS, usinga split-sample methodology. The final IHMRS model showedappropriate calibration in the test set within the separate decilesof predicted risk. The IHMRS had good calibration and discrimi-nation, both in the entire test set and by the ethnic group, withROC c-statistic values of .0.70 in all ethnic groups except theEuropean and other ethnicity groups. Similarly good discriminationwas seen in the women and in the younger participants in the testset. The cause of the deterioration in discrimination in the older
participants is not clear, but may be due to unmeasured factorsaffecting this age group which may affect CHD risk, such as conco-mitant illnesses. Risk factor levels may also be underestimated inthis older age group, as more of these persons were on risk-modifying medications than in the younger group. The finalIHMRS showed good discrimination (ROC c-statistic in the testset 0.72, 95% CI: 0.71, 0.73; and in the external validation set0.67, 95% CI: 0.62, 0.73).
Prognostic models should be validated in an external sample, inorder to demonstrate their generality and accuracy.38 We havevalidated the IHMRS in the EpiDREAM cohort and shown that itis positively associated with an increase in the probability of MIin this cohort.25 Further validity studies of the score in other exter-nal cohorts, in particular by ethnicity or geographic area, would bedesirable. It can be argued that arbitrary ‘cut-off levels’ for continu-ous variables should be avoided39: dichotomizing a continuousvariable can lead to loss of information and loss of power.40
Nevertheless, since clinicians seek guidance and reference pointswith such scores, we have provided information on the scoreproperties in the external cohort, by tertiles of IHMRS. Ingeneral, the lower IHMRS scores are associated with greater sen-sitivity and higher scores are associated with higher specificity.
There are some limitations of the IHMRS. First, it can be arguedthat case–control data is not the ideal data source to make such ascore, and ideally, a prospective cohort should be used. Scoresderived from case–control data cannot be considered ‘predictive’of events in the same manner as those derived from cohort studies,and external validation to ascertain predictive ability in a cohortsetting was an important step. However, case–control methodologypermitted us to collect a large number of cases from different regionsof the world to test the many variables which we felt were clinicallyimportant, without incurring penalties of overfitting.41 To achieve asimilar number of endpoints in a prospective cohort, especially indiverse settings, would require extremely large studies involvingover a million individuals followed for at least 10 years. Furthermore,the case–control design enables large numbers of MI cases beobtained from diverse ethnic groups around the world, especiallyfrom resource-poor settings, and allowed inclusion of a largenumber of cases in younger subjects and in women, among whomthe event rates are relatively low, and who are typically under-represented in cohort-based models. Variables ascertained in acase–control manner can be subject to recall bias. However, thestudy design also meant that our estimate of each participant’s riskfactor status was contemporaneous with the event. With regards inparticular to lifestyle factors, these may well undergo changes overtime, and thus, the estimated effects of such factors in a cohortsetting may be biased due to regression to the mean. There was amissing data burden in the INTERHEART data, due primarily to anumber of subjects who did not have apolipoprotein data. A sensi-tivity analysis with a missing data imputation procedure was under-taken, and it was shown that the missing data did not compromisethe validity of the IHMRS estimates (see Supplementary materialonline, Table S9).
INTERHEART was matched by age (+5 years) and sex. Despitethis, we felt it was important to include an adjustment for age andsex, while accepting that their effects may be an underestimate,since they are important risk factors for CHD. Furthermore,
. . . . . . . . . . . . . . . . . . . . . . . . . . . . . . . . . . . . . . . . . . . . . . . . . . . . . . . . . . . . .
. . . . . . . . . . . . . . . . . . . . . . . . . . . . . . . . . . . . . . . . . . . . . . . . . . . . . . . . . . . . . . . . . . . . . . . . . . . . . . . .
Table 9 Risk of MI in EpiDREAM, by INTERHEARTModifiable Risk Score tertile
Tertiles ofrisk score
For the outcome of MI
1-yearrisk
3.25-yearrisk
Sensitivity Specificity
0–4 0.04% 0.12% 93.7% 18.1%
5–9 0.09% 0.27% 77.9% 49.5%
≥10 0.23% 0.68% 42.1% 82.9%
C. McGorrian et al.588
by guest on August 14, 2012
http://eurheartj.oxfordjournals.org/D
ownloaded from

INTERHEART has been analysed using unconditional logisticregression2 to minimize loss of data. However, creating an IHMRSusing conditional logistic regression does not improve the discrimi-nation of the score (see Supplementary material online, Table S10).This study only included those cases of acute MI who survived tohospital admission, although data were collected from familymembers for patients who were recruited to the study but whodied before all study measures were collected. A subanalysis of allMI cases who died after recruitment but before discharge in INTER-HEART (3.2% of all cases, n ¼ 255) showed that their mean IHMRSwas marginally less than those who were alive at discharge (see Sup-plementary material online, Table S11). Therefore, the IHMRS wasderived on both fatal and non-fatal hospitalized MI cases. Neverthe-less, although it seems likely that the same risk factors describedabove may also predispose individuals to rapidly fatal MI in the pre-hospital setting, we cannot assume that this is so. Finally, a number ofrisk factors were determined by self-report (such as hypertensionand diabetes). This historical recall may be considered inferior todirect measurement which was not possible in the acute MIsetting. However, the prevalence of self-reported hypertensionand diabetes has been found to approximate the known prevalenceof disease in a number of studies.42 –44
The study population in EpiDREAM consists of both individualswith normoglycaemia and with dysglycaemia, as subjects were pre-ferentially screened if they were deemed to be at increased risk ofdysglycaemia based on their family history, ethnicity, and anthropo-metric characteristics. Although this independent validation of theability of the INTERHEART score to predict clinical events is reas-suring, additional validation from prospective cohort studies,including those with population-based sampling and longer-termfollow-up, would add to our understanding of the generalizabilityof the IHMRS.
Risk scores can be a useful educational and motivational tool forpatients: educational in that they can understand their personal risklevel, and motivational in that they can see their risk scoredecrease as their risk factors improve. Insofar as possible, suchscores should aim for model parsimony. Inclusion of all statisticallysignificant multiple modifiable risk factors made the score cumber-some and did not add to its predictive ability in the test set. TheAmerican Heart Association recommends using simple, consistentmessages when educating patients about their risk factors,45 andthe European Society of Cardiology guidelines echo this conceptin their simple ‘telephone number’ of targets for cardiovasculardisease prevention.4 However, the take-up of risk-scoringsystems has not been uniform. Reasons for this include their com-plexity, the time required to input the data, the availability of thedata required to complete some scores, and the perceptionsome health-care providers may have that they are able to estimaterisk without any such score.46 Furthermore, there have been fewstudies documenting the efficacy of these tools in clinical practice.One systematic review identified four randomized controlled trialsof such cardiovascular disease risk tools,47 with only two trialsshowing an effect in terms of change in clinician prescribing inthe risk estimation tool groups.48,49 The IHMRS demonstrates clini-cal credibility, evidence of accuracy, and evidence of generality.38
Impact studies testing the usefulness of the score in clinical practiceare required.50
ConclusionUsing data from the INTERHEART case–control study, we havedeveloped and validated a simple score for MI risk which is appli-cable to an international population.
Supplementary materialSupplementary material is available at European Heart Journalonline.
AcknowledgementsS.Y. holds an endowed chair from Heart and Stroke Foundation ofOntario, McMaster University, H.C.G. holds the Aventis Chair inDiabetes Research, McMaster University, S.S.A. holds the MichaelG. DeGroote/Heart and Stroke Foundation of Ontario Chair inPopulation Health, and the May Cohen Eli Lilly Endowed Chairin Women’s Health Research, McMaster University. We wouldalso like to acknowledge the statistical advice given by Dr LehanaThabane.
FundingThe INTERHEART study was funded by the Canadian Institutes ofHealth Research, the Heart and Stroke Foundation of Ontario, theInternational Clinical Epidemiology Network (INCLEN), and throughunrestricted grants from several pharmaceutical companies (withmajor contributions from AstraZeneca, Novartis, Sanofi Aventis,Knoll Pharmaceuticals [now Abbott], Bristol Myers Squibb, and KingPharma), and by various national bodies in different countries Chile:Universidad de la Frontera, Sociedad Chilena de Cardiologia FilialSur; Colombia: Colciencias, Ministerio de Salud; Croatia: CroatianMinistry of Science & Technology; Guatemala: Liga Guatemaltecadel Corazon; Hungary: Astra Hassle, National Health ScienceCouncil, George Gabor Foundation; Iran: Iran Ministry of Health;Italy: Boehringer-Ingelheim, Japan: Sankyo Pharmaceutical Co.,Banyu Pharmaceutical Co., Astra Japan; Kuwait: Endowment Fundfor Health Development in Kuwait; Pakistan: ATCO Laboratories;Philippines: Philippine Council for Health Research & Dev., PfizerPhilippines Foundation, Inc., Astra Pharmacetuicals, Inc. & the AstraFund for Clinical Research & Continuing Medical Education, Pharmacia& Upjohn Inc.; Poland: Foundation PROCLINICA; Singapore: Singa-pore National Heart Association; South Africa: MRC South Africa,Warner-Parke-Davis Pharmaceuticals, Aventis; Sweden: Grant fromthe Swedish State under LUA Agreement, Swedish Heart and LungFoundation; Thailand: The Heart Association of Thailand, ThailandResearch Fund.
Conflict of interest: the sponsors of the study had no role in studydesign, data collection, data analysis, data interpretation, or writing ofthe report. The corresponding author had full access to all data andhad final responsibility for the decision to submit for publication.
References1. World Health Organization. The atlas of heart disease and stroke. http://www.
who.int/cardiovascular_diseases/resources/atlas/en/ (4 December 2009).2. Yusuf S, Hawken S, Ounpuu S, Dans T, Avezum A, Lanas F, McQueen M, Budaj A,
Pais P, Varigos J, Lisheng L. Effect of potentially modifiable risk factors associatedwith myocardial infarction in 52 countries (the INTERHEART study): case–control study. Lancet 2004;364:937–952.
3. Grundy SM, Paternak R, Greenland P, Smith S, Fuster V. AHA/ACC scientificstatement: assessment of cardiovascular risk by use of multiple-risk-factor
The INTERHEART Modifiable Risk Score 589
by guest on August 14, 2012
http://eurheartj.oxfordjournals.org/D
ownloaded from

assessment equations: a statement for healthcare professionals from the Ameri-can Heart Association and the American College of Cardiology. J Am CollCardiol 1999;34:1348–1359.
4. Authors/Task Force Members, Graham I, Atar D, Borch-Johnsen K, Boysen G,Burell G, Cifkova R, Dallongeville J, De Backer G, Ebrahim S, Gjelsvik B,Herrmann-Lingen C, Hoes A, Humphries S, Knapton M, Perk J, Priori SG,Pyorala K, Reiner Z, Ruilope L, Sans-Menendez S, Scholte op Reimer W,Weissberg P, Wood D, Yarnell J, Zamorano JL. European guidelines on cardiovas-cular disease prevention in clinical practice: executive summary: Fourth Joint TaskForce of the European Society of Cardiology and other societies on cardiovascu-lar disease prevention in clinical practice (constituted by representatives of ninesocieties and by invited experts). Eur Heart J 2007;28:2375–2414.
5. Mosca L, Linfante AH, Benjamin EJ, Berra K, Hayes SN, Walsh BW, Fabunmi RP,Kwan J, Mills T, Simpson SL. National study of physician awareness and adherenceto cardiovascular disease prevention guidelines. Circulation 2005;111:499–510.
6. Wilson PF, D’Agostino R, Levy D, Belanger A, Silbershatz H, Kannel W. Predictionof coronary heart disease using risk factor categories. Circulation 1998;97:1837–1847.
7. Conroy RM, Pyorala K, Fitzgerald AP, Sans S, Menotti A, De Backer G, DeBacquer D, Ducimetiere P, Jousilahti P, Keil U, Njølstad I, Oganovj RG,Thomsen T, Tunstall-Pedoe H, Tverdal A, Wedel H, Whincup P, Wilhelmsen L,Graham IM, on behalf of the SCORE project group1. Estimation of ten-yearrisk of fatal cardiovascular disease in Europe: the SCORE project. Eur Heart J2003;24:987–1003.
8. McQueen M, Hawken S, Wang X, Ounpuu S, Sniderman A, Probstfield J, Steyn K,Sanderson J, Hasani M, Volkova E, Kazmi K, Yusuf S. Lipids, lipoproteins, and apo-lipoproteins as risk markers of myocardial infarction in 52 countries (the INTER-HEART study): a case–control study. Lancet 2008;372:224–233.
9. Altman DG, Royston P. What do we mean by validating a prognostic model? StatMed 2000;19:453–473.
10. Rosengren A, Hawken S, Ounpuu S, Sliwa K, Zubaid M, Almahmeed WA, NguBlackett K, Sitthi-amorn C, Sato H, Yusuf S. Association of psychosocial riskfactors with risk of acute myocardial infarction in 11,119 cases and 13,648 con-trols from 52 countries (the INTERHEART study): case–control study. Lancet2004;364:953–962.
11. Teo KK, Ounpuu S, Hawken S, Pandey MR, Valentin V, Hunt D, Diaz R,Rashed W, Freeman R, Jiang L, Zhang X, Yusuf S, on behalf of the INTERHEARTStudy Investigators. Tobacco use and risk of myocardial infarction in 52 countriesin the INTERHEART study: a case–control study. Lancet 2006;368:647–658.
12. Yusuf S, Hawken S, Ounpuu S, Bautista L, Franzosi M, Commerford P, Lang C,Rumboldt Z, Onen C, Lisheng L, Tanomsup S, Wangai P Jr, Razak F,Sharma AM, Anand SS, for the INTERHEART Study Investigators. Obesity andthe risk of myocardial infarction in 27 000 participants from 52 countries: acase–control study. Lancet 2005;366:1640–1649.
13. Iqbal R, Anand S, Ounpuu S, Islam S, Zhang X, Rangarajan S, Chifamba J,Al-Hinai A, Keltai M, Yusuf S, on behalf of the INTERHEART Study Investigators.Dietary patterns and the risk of acute myocardial infarction in 52 countries.Results of the INTERHEART Study. Circulation 2008;118:1929–1937.
14. Sullivan L, Massaro JM, D’Agostino RB Sr. Presentation of multivariate data forclinical use: the Framingham study risk score functions. Stat Med 2004;23:1631.
15. Pencina MJ, D’Agostino RB Sr, D’Agostino RB Jr, Vasan RS. Evaluating the addedpredictive ability of a new marker: from area under the ROC curve to reclassifica-tion and beyond. Stat Med 2008;27:157–172.
16. Kannel WB, Wilson PW. Risk factors that attenuate the female coronary diseaseadvantage. Arch Intern Med 1995;155:57–61.
17. Thom TJ, Kannel WB, Silbershatz H, D’Agostino RB. Cardiovascular disease in theUnited States and preventive approaches. In: Fuster V, Alexander RW,O’Rourke RA, eds. Hurst’s the Heart, Arteries and Veins. 10th ed. New York, NY:McGraw-Hill; 2001.
18. Hosmer DW, Lemeshow S. Applied Logistic Regression. New York, NY: John Wiley& Sons, 1989.
19. Hosmer DW, Hosmer T, Lecessie S, Lemeshow S. A comparison ofgoodness-of-fit tests for the logistic regression model. Stat Med 1997;16:965–980.
20. Kramer AA, Zimmerman JE. Assessing the calibration of mortality benchmarks in criti-cal care: the Hosmer–Lemeshow test revisited. Crit care med 2007;35:2212–2213.
21. Hanley JA, McNeil BJ. The meaning and use of the area under a receiver operatingcharacteristic (ROC) curve. Radiology 1982;143:29–36.
22. Akaike H. Information theory and an extension of the maximum likelihood prin-ciple. In: Petrox BN, Caski F, eds. Proceedings of the Second International Symposiumon Information Theory, Budapest; 1973. p267–281.
23. Kass RE, Raftery AE. Bayes factors. J Am Stat Assoc 1995;90:773–795.
24. Steyerberg EW, Harrell FE, Borsboom GJ, Eijkemans MJ, Vergouwe Y,Habbema JD. Internal validation of predictive models: efficiency of some pro-cedures for logistic regression analysis. J Clin Epidemiol 2001;54:774–781.
25. Gerstein H.C. Rationale, design and recruitment characteristics of a large, simpleinternational trial of diabetes prevention: the DREAM trial. Diabetologia 2004;47:1519–1527.
26. Fox J, Monette G. Generalized collinearity diagnostics. J Am Stat Assoc 1992;87:178–183.
27. Marquardt D. Generalised inverses, ridge regression, biased liner estimation andnonlinear estimation. Technometrics 1970;12:591–612.
28. Paynter NP, Chasman DI, Buring JE, Shiffman D, Cook NR, Ridker PM. Cardiovas-cular disease risk prediction with and without knowledge of genetic variation atchromosome 9p21.3. Ann Intern Med 2009;150:65–72.
29. Wald NJ, Hackshaw AK, Frost CD. When can a risk factor be used as a worth-while screening test? BMJ 1999;319:1562–1565.
30. Cook NR. Statistical evaluation of prognostic versus diagnostic models: beyondthe ROC curve. Clin Chem 2008;54:17–23.
31. Pepe MS, Janes H, Longton G, Leisenring W, Newcomb P. Limitations of the oddsratio in gauging the performance of a diagnostic, prognostic, or screening marker.Am J Epidemiol 2004;159:882–890.
32. Walldius G, Jungner I, Holme I, Aastveit AH, Kolar W, Steiner E. High apolipopro-tein B, low apolipoprotein A-I, and improvement in the prediction of fatal myo-cardial infarction (AMORIS study): a prospective study. Lancet 2001;358:2026.
33. Thompson A, Danesh J. Associations between apolipoprotein B, apolipoproteinA1, the apolipoprotein B:A1 ratio and coronary heart disease: a literature-basedmeta analysis of prospective studies. J Int Med 2006;259:481–492.
34. Gaziano T, Young C, Fitzmaurice G, Atwood S, Gaziano J. Laboratory basedversus non laboratory based method for assessment of cardiovascular diseaserisk: the NHANES I Follow-up Study cohort. Lancet 2008;371:923–931.
35. D’Agostino RB, Vasan RS, Pencina MJ, Wolf PA, Cobain M, Massaro JM,Kannel WB. General cardiovascular risk profile for use in primary care. The Fra-mingham Heart study. Circulation 2008;117:743–753.
36. Cooney MT, Dudina AL, Graham IM. Value and limitations of existing scores forthe assessment of cardiovascular risk: a review for clinicians. J Am Coll Cardiol2009;54:1209–1227.
37. Van Steenkiste B, van der Weijden T, Timmermans DRM, Stoffers J, Grol R.Patients’ ideas, fears and expectations of their coronary risk: barriers forprimary prevention. Patient Educ Couns 2004;55:301–307.
38. Altman DG, Vergouwe Y, Royston P, Moons KG. Prognosis and prognosticresearch: validating a prognostic model. BMJ 2009;338:b605.
39. Wyatt JC, Altman DG. Commentary: prognostic models: clinically useful orquickly forgotten? BMJ 1995;311:1539–1541.
40. Streiner DL. Breaking up is hard to do: the heartbreak of dichotomizing continu-ous data. Can J Psychiatry 2002;47:262–266.
41. Harrell FE, Lee KL, Matchar DB, Reichert TA. Regression models for prognosticprediction: advantages, problems, and suggested solutions. Cancer Treat Rep 1985;69:1071–1077.
42. Bays HE, Bazata DD, Clark NG, James G, Green A, Lewis S, Reed M, Stewart W,Chapman R, Fox K, Grandy S. Prevalence of self-reported diagnosis of diabetesmellitus and associated risk factors in a national survey in the US population:SHIELD (study to help improve early evaluation and management of riskfactors leading to diabetes). BMC Public Health 2007;7:277.
43. Kehoe R, Wu SY, Leske MC, Chylack LT. Comparing self reported and physician-reported history. Am J Epidemiol 1994;139:813–818.
44. Haapanen N, Miilunpalo S, Pasanen M, Oja P, Vuori I. Agreement between ques-tionnaire data and medical records of chronic diseases in middle-aged and elderlyFinnish men and women. Am J Epidemiol 1997;145:762–769.
45. Smith SC Jr, Greenland P, Grundy SM. Prevention conference V: beyond second-ary prevention: identifying the high-risk patient for primary prevention: executivesummary. Circulation 2000;101:111–116.
46. Topol EJ, Lauer MS. The rudimentary phase of personalised medicine: coronaryrisk scores. Lancet 2003;362:1776–1777.
47. Brindle P, Beswick A, Fahey T, Ebrahim S. Accuracy and impact of risk assessmentin the primary prevention of cardiovascular disease: a systematic review. Heart2006;92:1752–1759.
48. Montgomery AA, Fahey T, Peters TJ, MacIntosh C, Sharp DJ. Evaluation of computerbased clinical decision support system and risk chart for management of hyperten-sion in primary care: randomized controlled trial. BMJ 2000;320:686–690.
49. Hall LML, Jung RT, Leese GP. Controlled trial of effect of documented cardiovas-cular risk scores on prescribing. BMJ 2003;326:251–252.
50. Moons KM, Altman DG, Vergouwe Y, Royston P. Prognosis and prognosticresearch: application and impact of prognostic models in clinical practice. BMJ2009;338:b606.
C. McGorrian et al.589a
by guest on August 14, 2012
http://eurheartj.oxfordjournals.org/D
ownloaded from
Related Documents


