ORIGINAL PAPER Estimating mean air temperature using MODIS day and night land surface temperatures Hao Sun & Yunhao Chen & Adu Gong & Xiang Zhao & Wenfeng Zhan & Mengjie Wang Received: 11 January 2013 /Accepted: 13 October 2013 /Published online: 28 November 2013 # Springer-Verlag Wien 2013 Abstract Near surface air temperature (Ta) values measured by weather stations provide limited information about spatial patterns over a wide area. Remote sensing is a promising technology for providing a more accurate description of spatial variations in the Ta on both a regional and global scale. This paper presents a new approach for estimating mean Ta using a combination of MODIS day–night land surface temperatures (Ts) and enhanced vegetation index (EVI) data (called DTVX method). The advantages of the DTVX method include complete independence of ancillary data and non- contextual characteristics that circumvent the limitations inherent to the contextual temperature–vegetation index (TVX) method. Three land areas covered by the MODIS sinusoidal tile h26v04, h26v05, and h27v05 were selected as test areas because their terrain elevations vary in the range of several decameters to several kilometers. Based on the DTVX method, Terra MODIS 8-day day–night Ts and 16-day EVI products were used to obtain an 8-day average Ta from May 2010 to June 2011 (a total of 51 8- day periods). The daily average Ta values measured at 314 weather stations in the three tiles were utilized as the in-situ reference data. An RMSE value of 1.84 K with R 2 of 0.97 was observed for the Ta estimation in the h27v05 tile (plain area). In the case of the h26v05 tile (high mountain area), an RMSE of 2.45 K with R 2 of 0.96 was observed, whereas the h26v04 tile (mountain area) exhibited an RMSE of 2.34 K with an R 2 of 0.989. The RMSE of the three tiles was 2.23 K with an R 2 of 0.977. Sensitivity analysis indicates that the method developed herein is elastic with respect to the accuracy of day–night Ts and EVI data in areas with a greater EVI and day–night Ts difference, such as dense forests and high mountain areas. 1 Introduction Accurate estimation of spatially distributed near surface air temperature (Ta) is important for studying the land surface energy balance (House-Peters and Chang 2011; Savage et al. 2009), terrestrial evapotranspiration (Li et al. 2009; Wang and Dickinson 2012), climate change (IPCC 2007), disease spread (DeVisser et al. 2010), and living environments (Liu and Weng 2012). Generally, Ta data are recorded by weather stations located approximately 2 m above ground. The weather station measurements exhibit high temporal resolution and accuracy and are thus among the most significant resource data for studying climate change. However, due to the heterogeneity inherent to various environmental factors that regulate the H. Sun : Y. Chen (*) : A. Gong : M. Wang State Key Laboratory of Earth Surface Processes and Resource Ecology (Beijing Normal University), College of Resources Science & Technology, Beijing Normal University, No.19, Xinjiekouwai Street, Beijing 100875, China e-mail: [email protected] A. Gong Academy of Disaster Reduction and Emergency Management, Beijing Normal University, Beijing 100875, China X. Zhao College of Global Change and Earth System Science, Beijing Normal University, Beijing 100875, China W. Zhan Jiangsu Provincial Key Laboratory of Geographic Information Science and Technology, International Institute of Earth System Science, Nanjing University, Nanjing 210093, China W. Zhan State Key Laboratory for Remote Sensing Science, Institute of Remote Sensing and Digital Earth, Chinese Academy of Sciences and Beijing Normal University, Beijing 100101, China Theor Appl Climatol (2014) 118:81–92 DOI 10.1007/s00704-013-1033-7

Welcome message from author
This document is posted to help you gain knowledge. Please leave a comment to let me know what you think about it! Share it to your friends and learn new things together.
Transcript
ORIGINAL PAPER
Estimating mean air temperature using MODIS day and nightland surface temperatures
Hao Sun & Yunhao Chen & Adu Gong & Xiang Zhao &
Wenfeng Zhan & Mengjie Wang
Received: 11 January 2013 /Accepted: 13 October 2013 /Published online: 28 November 2013# Springer-Verlag Wien 2013
Abstract Near surface air temperature (Ta) values measuredby weather stations provide limited information about spatialpatterns over a wide area. Remote sensing is a promisingtechnology for providing a more accurate description ofspatial variations in the Ta on both a regional and global scale.This paper presents a new approach for estimating mean Tausing a combination of MODIS day–night land surfacetemperatures (Ts) and enhanced vegetation index (EVI) data(called DTVXmethod). The advantages of the DTVXmethodinclude complete independence of ancillary data and non-contextual characteristics that circumvent the limitationsinherent to the contextual temperature–vegetation index(TVX) method. Three land areas covered by the MODIS
sinusoidal tile h26v04, h26v05, and h27v05 were selectedas test areas because their terrain elevations vary in therange of several decameters to several kilometers. Basedon the DTVX method, Terra MODIS 8-day day–night Tsand 16-day EVI products were used to obtain an 8-dayaverage Ta from May 2010 to June 2011 (a total of 51 8-day periods). The daily average Ta values measured at314 weather stations in the three tiles were utilized as thein-situ reference data. An RMSE value of 1.84 K with R2
of 0.97 was observed for the Ta estimation in the h27v05tile (plain area). In the case of the h26v05 tile (highmountain area), an RMSE of 2.45 K with R2 of 0.96was observed, whereas the h26v04 tile (mountain area)exhibited an RMSE of 2.34 K with an R2 of 0.989. TheRMSE of the three tiles was 2.23 K with an R 2 of0.977. Sensitivity analysis indicates that the methoddeveloped herein is elastic with respect to the accuracyof day–night Ts and EVI data in areas with a greater EVI andday–night Ts difference, such as dense forests and highmountain areas.
1 Introduction
Accurate estimation of spatially distributed near surface airtemperature (Ta) is important for studying the land surfaceenergy balance (House-Peters and Chang 2011; Savage et al.2009), terrestrial evapotranspiration (Li et al. 2009; Wang andDickinson 2012), climate change (IPCC 2007), disease spread(DeVisser et al. 2010), and living environments (Liu andWeng 2012). Generally, Ta data are recorded by weatherstations located approximately 2 m above ground. The weatherstation measurements exhibit high temporal resolution andaccuracy and are thus among the most significant resource datafor studying climate change.However, due to the heterogeneityinherent to various environmental factors that regulate the
H. Sun :Y. Chen (*) :A. Gong :M. WangState Key Laboratory of Earth Surface Processes and ResourceEcology (Beijing Normal University), College of Resources Science& Technology, Beijing Normal University,No.19, Xinjiekouwai Street, Beijing 100875, Chinae-mail: [email protected]
A. GongAcademy of Disaster Reduction and Emergency Management,Beijing Normal University, Beijing 100875, China
X. ZhaoCollege of Global Change and Earth System Science, BeijingNormal University, Beijing 100875, China
W. ZhanJiangsu Provincial Key Laboratory of Geographic InformationScience and Technology, International Institute of Earth SystemScience, Nanjing University, Nanjing 210093, China
W. ZhanState Key Laboratory for Remote Sensing Science, Institute ofRemote Sensing and Digital Earth, Chinese Academy of Sciencesand Beijing Normal University, Beijing 100101, China
Theor Appl Climatol (2014) 118:81–92DOI 10.1007/s00704-013-1033-7
energy balance of a land–atmosphere system, e.g., surfacemoisture and vegetation coverage, the spatial patterns of Tacan be highly variable and complex (Benali et al. 2012).Furthermore, various station-based interpolation techniquessuffer from the arbitrary locations of weather stations andfrequently lack access to real-time data (Vancutsem et al.2010). Consequently, the measured Ta values obtained fromweather station data may not meet the requirements of spatiallydependent models (Lin et al. 2012).
Satellite remote sensing data have been utilized to moreaccurately describe the spatial variations in the Ta data. Somestudies attempted to estimate the Ta by establishing regressionrelationships between Ta and its main impact factors, such assolar zenith angle (Cresswell et al. 1999), NormalizedDifference Vegetation Index (NDVI), and land surfacetemperature (Ts; Benali et al. 2012; Kawashima et al. 2000;Lin et al. 2012; Mao et al. 2008). Although these statisticalmethods generally perform well (with an RMSE value of lessthan 2 K) within the region and time frame, they requiresufficient training data, and the statistical relationships aredifficult to transfer across space and time (Stisen et al. 2007). Amethod based on thermodynamicswas proposed for determiningTa from Ts by Sun in 2005 (Sun et al. 2005). Although methodsbased on thermodynamics do not always require trainingsamples in statistical methods, they introduce some parametersthat are not typically recorded by remote sensing systems such asthe aerodynamic resistance and air density.
The temperature–vegetation index method (TVX) cancircumvent the limitations inherent to the aforementionedstatistical and thermodynamics-based method, as it merelyutilizes Ts and spectral vegetation index (SVI). The TVXapproach has been widely used to estimate the Ta due to itssimplicity, effectiveness, and fewer requirements for theamount of training data or ancillary data (Prihodko andGoward 1997; Stisen et al. 2007). The principle of the TVXmethod is to construct a negative correlation between Ts andSVI in a relatively small window assuming a homogeneousarea (uniform atmospheric forces and moisture conditions). Ifthe TVX relation exhibits a linear slope, then the airtemperature is obtained by allowing the linear relation tointersect with the NDVI over optically infinite thick canopy(NDVIc). However, when the window size used to construct anegative correlation between Ts and NDVI is increased andvariability in the surface moisture conditions is introduced, theTs/NDVI triangle or trapezoid emerges (Sandholt et al. 2002).In this case, it is hard to determine the exact linear slope of theTVX relation. Moreover, the TVX method might lower theamount of variation in the estimated Ta data over the slidingwindow, resulting in a spatial autocorrelation of the Ta data(Nieto et al. 2011; Stisen et al. 2007).
In this paper, we present a new method to estimate Ta viamodifying the TVX-method from a day–night Ts difference(DTs) and SVI feature space utilizing Moderate Resolution
Imaging Spectroradiometer (MODIS) day–night Ts and EVI.This new method is called Differential TVX (DTVX) method.The principles of this method and the materials used areintroduced in Sections 2 and 3, respectively. The method isapplied and assessed in Section 4. Finally, some discussionand conclusions are presented in Sections 5 and 6.
2 Method
2.1 Estimating Ta using DTVX method
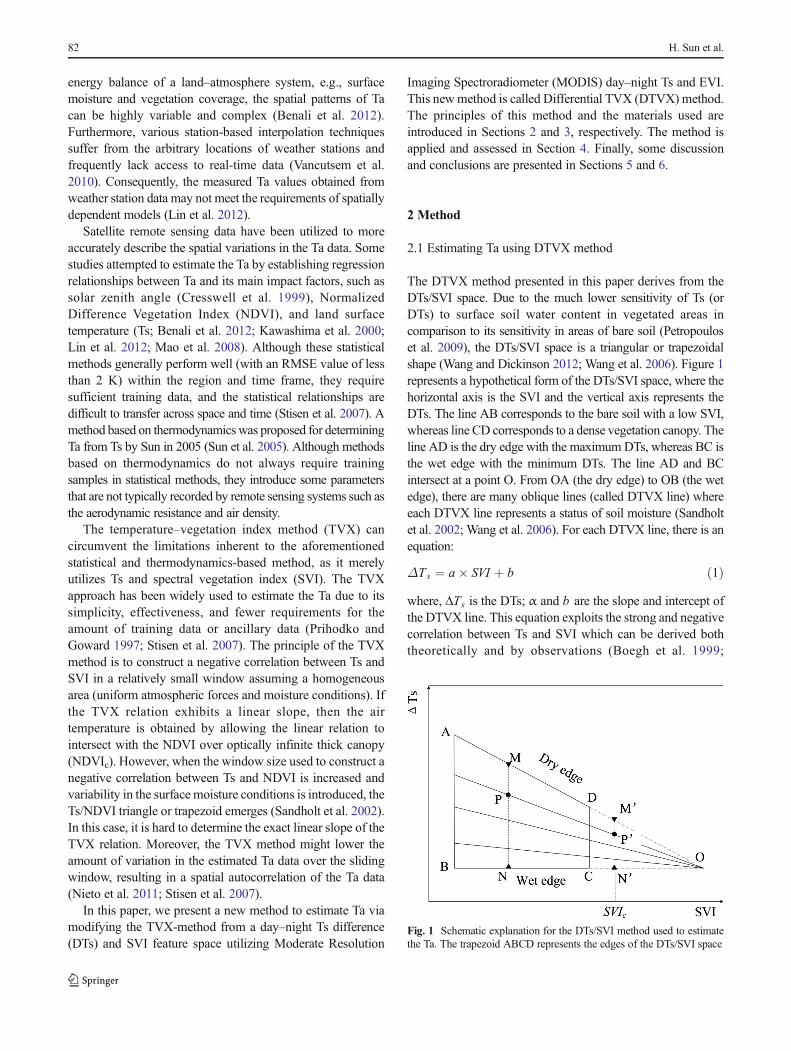
The DTVX method presented in this paper derives from theDTs/SVI space. Due to the much lower sensitivity of Ts (orDTs) to surface soil water content in vegetated areas incomparison to its sensitivity in areas of bare soil (Petropouloset al. 2009), the DTs/SVI space is a triangular or trapezoidalshape (Wang and Dickinson 2012; Wang et al. 2006). Figure 1represents a hypothetical form of the DTs/SVI space, where thehorizontal axis is the SVI and the vertical axis represents theDTs. The line AB corresponds to the bare soil with a low SVI,whereas line CD corresponds to a dense vegetation canopy. Theline AD is the dry edge with the maximum DTs, whereas BC isthe wet edge with the minimum DTs. The line AD and BCintersect at a point O. From OA (the dry edge) to OB (the wetedge), there are many oblique lines (called DTVX line) whereeach DTVX line represents a status of soil moisture (Sandholtet al. 2002; Wang et al. 2006). For each DTVX line, there is anequation:
ΔTs ¼ a� SVI þ b ð1Þwhere, ΔTs is the DTs; α and b are the slope and intercept ofthe DTVX line. This equation exploits the strong and negativecorrelation between Ts and SVI which can be derived boththeoretically and by observations (Boegh et al. 1999;
Fig. 1 Schematic explanation for the DTs/SVI method used to estimatethe Ta. The trapezoid ABCD represents the edges of the DTs/SVI space
82 H. Sun et al.
Prihodko and Goward 1997; Sandholt et al. 2002). Thiscorrelation originates mainly from the combined impact ofvegetation cover on the Ts (Stisen et al. 2007). Wheninterpreting SVI as an indicator of the fractional vegetationcover (f v), the Ts represents the composite temperature of soil(Tsoil) and vegetation (Tv), which is often regarded as simpleadditive measure: Ts=f vTv+(1−f v)Tsoil (Boegh et al. 1999).This equation has a similar form to the Eq. (1) byTs=(Tv−Tsoil)× f v+Tsoil which demonstrates the validityof the equation of the DTVX line.
P represents a point in the DTs-EVI space.M andN are thecorresponding points of P on the dry edge and wet edge,respectively. P’ belongs to the same DTVX line with the pointP. M’ and N’ are the corresponding points of P’ on the dryedge and wet edge, respectively. SVIc represents the SVI overoptically infinite thick canopy (i.e., dense canopy). Accordingto the geometric characteristics of similar triangles, thefollowing formula is applied:
PN
MN¼ P
0N
0
M0N
0 ð2Þ
Because dense canopy (SVIc) consists primarily of airfilled with relatively small, thin leaves, and branches that aremutually shading as well as heterogeneity and shade effects atthe satellite pixel scale (Prihodko and Goward 1997; Stisenet al. 2007), the Ts of a very dense canopy should be close toits ambient Ta. Based on this assumption, the followingequation can be proposed:
ΔTs−ΔTs min
ΔTs max−ΔTs min¼ ΔTa−ΔTa min
ΔTa max−ΔTa minð3Þ
where ΔTs is the DTs for point P;ΔTs_max andΔTs_min are theΔTs of point M and N on the dry and wet edges, respectively;ΔTa, the day–night Ta difference, equals the DTs of point P’ ;and ΔTa_min and ΔTa_max are the ΔTa of points M’ and N’ ,respectively. The DTs on the wet edge and of extreme densecanopy (SVI=1) should be close to 0 because of higher thermalinertia. Therefore, in the DTs/SVI space,
ΔTs min ¼ ΔTa min ¼ 0a ¼ −b
�ð4Þ
where, α and b are the slope and intercept of the DTVX line.Combining the DTVX line expression, the formula (3), and
formula (4), we can acquire:
ΔTa ¼ Taday−Ta
night ¼ 1−SVIc1−SVI
� Tsday−Ts
night� � ð5Þ
where Tsday and Ts
night are daytime and nighttime Ts at theMODIS overpass times; Ta
day and Tanight are the daytime and
nighttime Ta at the times corresponding to Tsday and Ts
night.MODIS provides two types of SVIs: NDVI and enhanced
vegetation index (EVI). The EVI provides improvedsensitivity in high biomass regions while minimizing soiland atmosphere influences (Jiang et al. 2008). To satisfy theassumption that DTs is close to 0 when SVI=1, EVI isemployed in the formula (5).
Kawashima et al. (2000) investigated the relationshipbetween surface and air temperatures on a local scale duringwinter nights. The results showed that night surfacetemperatures alone explained 80 % of the observed variationin night air temperature (Kawashima et al. 2000). Qi et al.(2006) compared the MODIS Terra night Ts and Ta at satellitetransit times in China. The results showed that in night airtemperature can be represented by the Ts obtained from asatellite as confirmed by variance analysis (Qi et al. 2006).Considering these results and that the heat from solarirradiation is absent and more heat is transferred between thesurface and air in the night, let us substitute Ta
night with Tsnight
in formula (5). Finally, a connection between instantaneous Tsand Ta was established for MODIS Ts data:
Taday ¼ 1−EVIc
1−EVI� Ts
day−Tsnight
� �þ Tsnight ð6Þ
The connection in formula (6) is very valuable because itprovides a way to estimate Ta using Ts. Actually, thetraditional TVX method also established a connectionbetween instantaneous Ts and Ta via allowing the TVX lineto intersect with the SVIc. Recently, Zhu et al. (2013) usingobserved daily maximum Ta instead of instantaneous Ta in theTVXmethod to parameterize SVIc via least-square fit method.The parameterized SVI c was then used to estimate dailymaximum Ta (Zhu et al. 2013). Encouraged by this work,we attempt to estimate mean Ta via parameterizing EVIc informula (6) using observed daily mean Ta. Finally, ouralgorithm to estimate mean Ta is:
Tamean ¼ 1−EVIc
0
1−EVI� Ts
day−Tsnight
� �þ Tsnight ð7Þ
where, Tamean is mean Ta; EVIc′ is the parameterized EVIc
using observed mean Ta.
2.2 Parameter determination
In the present algorithm, EVIc′ is the only underdeterminedparameter for calculating the Ta. It can be determined byadjusting its value to afford the best possible agreementbetween the estimated and observed mean air temperatures.In this study, the EVIc′ is adjusted in incremental steps of 0.05from 0.5 to 0.95. The root mean square error (RMSE)value is used to evaluate the agreement between theestimated and observed mean Ta data for all of the weatherstations in the study area over the entire test period. The EVI
Estimating mean air temperature using MODIS day-night LST 83
corresponding to the minimum RMSE value is considered theoptimal selection.
3 Test areas and data
3.1 Case study areas
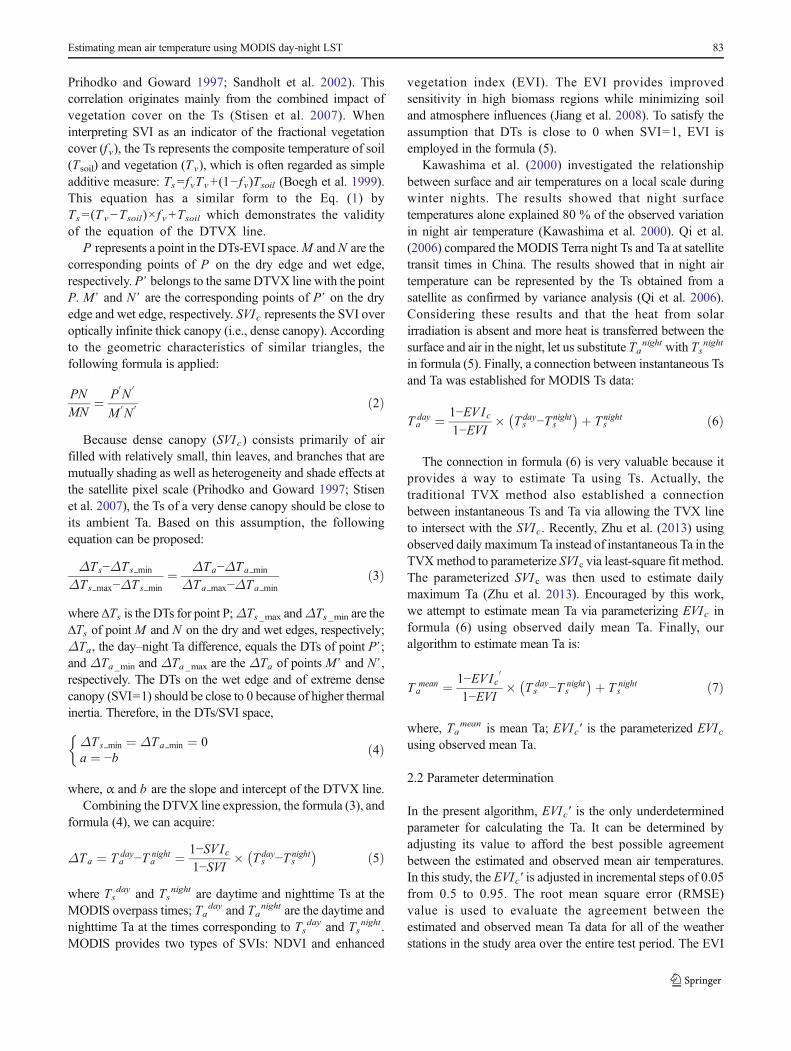
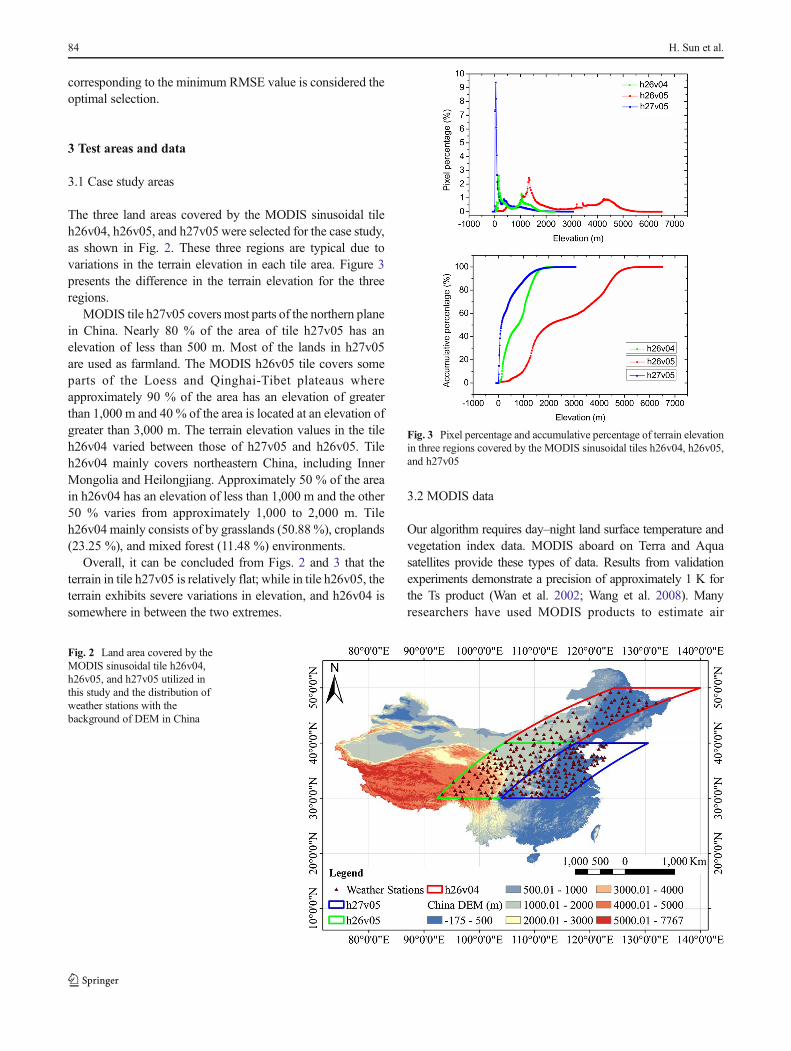
The three land areas covered by the MODIS sinusoidal tileh26v04, h26v05, and h27v05 were selected for the case study,as shown in Fig. 2. These three regions are typical due tovariations in the terrain elevation in each tile area. Figure 3presents the difference in the terrain elevation for the threeregions.
MODIS tile h27v05 covers most parts of the northern planein China. Nearly 80 % of the area of tile h27v05 has anelevation of less than 500 m. Most of the lands in h27v05are used as farmland. The MODIS h26v05 tile covers someparts of the Loess and Qinghai-Tibet plateaus whereapproximately 90 % of the area has an elevation of greaterthan 1,000 m and 40 % of the area is located at an elevation ofgreater than 3,000 m. The terrain elevation values in the tileh26v04 varied between those of h27v05 and h26v05. Tileh26v04 mainly covers northeastern China, including InnerMongolia and Heilongjiang. Approximately 50 % of the areain h26v04 has an elevation of less than 1,000 m and the other50 % varies from approximately 1,000 to 2,000 m. Tileh26v04 mainly consists of by grasslands (50.88 %), croplands(23.25 %), and mixed forest (11.48 %) environments.
Overall, it can be concluded from Figs. 2 and 3 that theterrain in tile h27v05 is relatively flat; while in tile h26v05, theterrain exhibits severe variations in elevation, and h26v04 issomewhere in between the two extremes.
3.2 MODIS data
Our algorithm requires day–night land surface temperature andvegetation index data. MODIS aboard on Terra and Aquasatellites provide these types of data. Results from validationexperiments demonstrate a precision of approximately 1 K forthe Ts product (Wan et al. 2002; Wang et al. 2008). Manyresearchers have used MODIS products to estimate air
Fig. 2 Land area covered by theMODIS sinusoidal tile h26v04,h26v05, and h27v05 utilized inthis study and the distribution ofweather stations with thebackground of DEM in China
Fig. 3 Pixel percentage and accumulative percentage of terrain elevationin three regions covered by the MODIS sinusoidal tiles h26v04, h26v05,and h27v05
84 H. Sun et al.
temperatures. Their results serve as a verification of the precisionofMODIS products that meet the requirements for estimating airtemperatures (Fu et al. 2011; Vancutsem et al. 2010).
MODIS products used in this study include the following:(a) Terra 8-day Land Surface Temperature & Emissivity(MOD11A2 V5), (b) Aqua 16-day Vegetation Indexes(MYD13A2 V5), and (c) Terra 16-day Vegetation Indexes(MOD13A2 V5). The land surface temperature product, i.e.,MOD11A2 covers the time from period 145 in 2010 to period177 in 2011 (a total of 51 8-day periods that are longer than1 year), as well as theMOD13A2 product (a total of 26 16-dayperiods). Another vegetation index product MYD 13A2 coverthe time from period 137 in 2010 to period 169 in 2011 (a totalof 26 16-day periods). All products in the three MODIS titlesh26v04, h26v05, and h27v05 were obtained from NASA’sEarth Observing System Data and Information System(EOSDIS; http://reverb.echo.nasa.gov/reverb/).
3.3 In situ reference data
For validating the algorithm, we also collected the “DailyChinese Ground Climatic Data” from the Chinameteorological Data Sharing Service System. (http://cdc.cma .gov.cn /home .do ; j s es s ion id=751525458081E3B6159A90098F9E0664). The daily average, maximumand minimum air temperatures observed by weather stationslocated approximately 2 m above ground are recorded in thisdata set in the time period spanning from approximately 1960to now. These weather stations measured data that werederived from the “monthly surface meteorological records”submitted by the climate data processing department inprovinces, municipalities, and autonomous regions. Thesedata have been examined for the purpose of strict qualitycontrol and inspection and have been utilized for validatingthermodynamics-based methods for estimating the Ta (Sunet al. 2005). The spatial distribution of these weather stationsis illustrated in Fig. 2. There are 117, 127, and 70 weatherstations in the h26v05, h27v05, and h26v04 tiles, respectively.
3.4 Data preprocessing
The day–night Ts products in the 8-day period derived fromMOD11A2 with an HDF format were processed with a validtemperature range in units of K. Any value beyond the validrange was set as a single-precision floating point value NaN(Not a Number). In parallel with the same 8-day periods of theTs product, the EVI product (MOD13A2 or MYD13A2) was a16-day composite. We acquire the new 8-day period EVI databy averaging the MYD13A2 and MOD13A2 products. Forexample, the average EVI in the 16-day period of 105 (inMYD13A2 product) and 113 (in MOD12A2 product) was setas the 8-day EVI of period 113 because the 105 and 113 16-daycomposite EVIs covered the period from 113 to 121 twice.
The meteorological data recorded the daily mean airtemperature from Jan. 2010 to Dec. 2011. These daily averageair temperatures during the 8-day composite period ofMODISTs product were thus averaged into an observed 8-day averageTa. These observed 8-day average Ta values over 314 weatherstations were utilized as in-situ reference data to validate theproposed algorithm.
4 Results
4.1 Determination of the EVIc′ using observed mean Ta
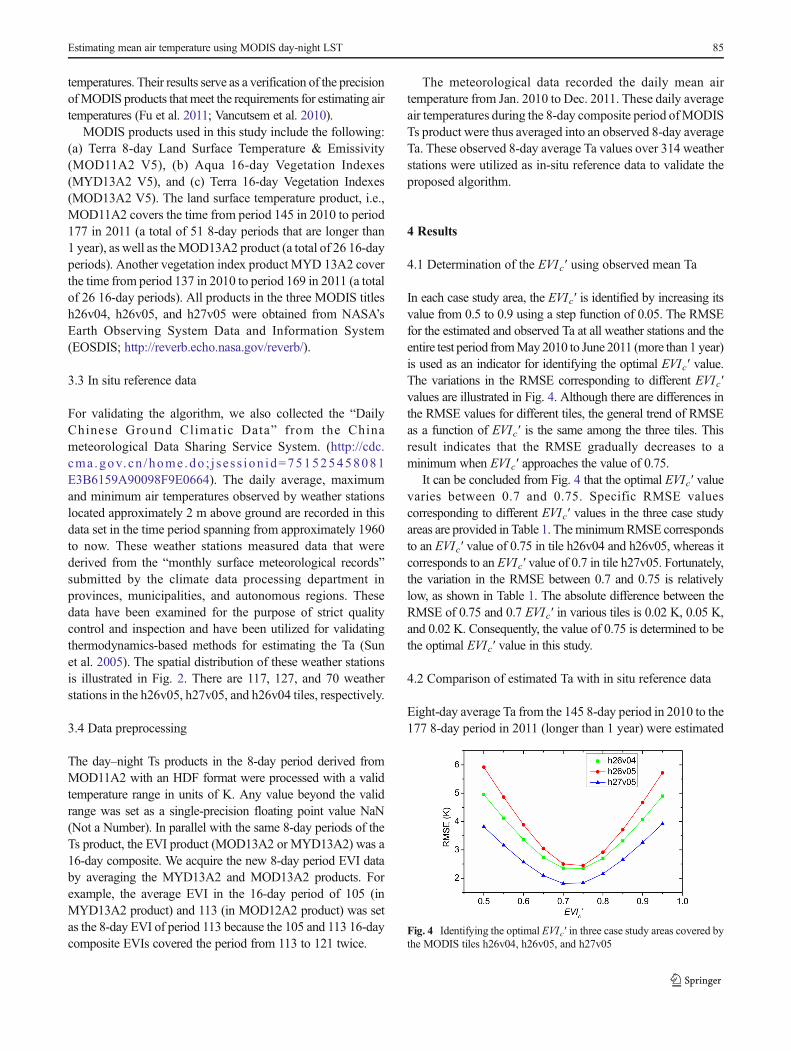
In each case study area, the EVIc′ is identified by increasing itsvalue from 0.5 to 0.9 using a step function of 0.05. The RMSEfor the estimated and observed Ta at all weather stations and theentire test period fromMay2010 to June 2011 (more than 1 year)is used as an indicator for identifying the optimal EVIc′ value.The variations in the RMSE corresponding to different EVIc′values are illustrated in Fig. 4. Although there are differences inthe RMSE values for different tiles, the general trend of RMSEas a function of EVIc′ is the same among the three tiles. Thisresult indicates that the RMSE gradually decreases to aminimum when EVIc′ approaches the value of 0.75.
It can be concluded from Fig. 4 that the optimal EVIc′ valuevaries between 0.7 and 0.75. Specific RMSE valuescorresponding to different EVIc′ values in the three case studyareas are provided in Table 1. TheminimumRMSE correspondsto an EVIc′ value of 0.75 in tile h26v04 and h26v05, whereas itcorresponds to an EVIc′ value of 0.7 in tile h27v05. Fortunately,the variation in the RMSE between 0.7 and 0.75 is relativelylow, as shown in Table 1. The absolute difference between theRMSE of 0.75 and 0.7 EVIc′ in various tiles is 0.02 K, 0.05 K,and 0.02 K. Consequently, the value of 0.75 is determined to bethe optimal EVIc′ value in this study.
4.2 Comparison of estimated Ta with in situ reference data
Eight-day average Ta from the 145 8-day period in 2010 to the177 8-day period in 2011 (longer than 1 year) were estimated
Fig. 4 Identifying the optimal EVIc′ in three case study areas covered bythe MODIS tiles h26v04, h26v05, and h27v05
Estimating mean air temperature using MODIS day-night LST 85
utilizing the DTVX method based on the MODIS 8-day day–night Ts and interpolated 8-day EVI. The daily average Tameasured by the weather stations was consolidated into the8-day average Ta, which was used as the in-situ reference. Toevaluate the effect of the underlying surface characteristic onthe estimated Ta, three land areas covered by the MODIS tilesh27v05, h26v05, and h26v04 were selected to separately testthe proposed DTVX method. The estimated Ta at pointlocations of the weather stations were directly extractedfrom image, as the geolocation accuracy of MODIS isapproximately 50 m at the nadir (Wolfe et al. 2002). Invalidvalues in the reference data or remote sensing data wereexcluded from the comparison.
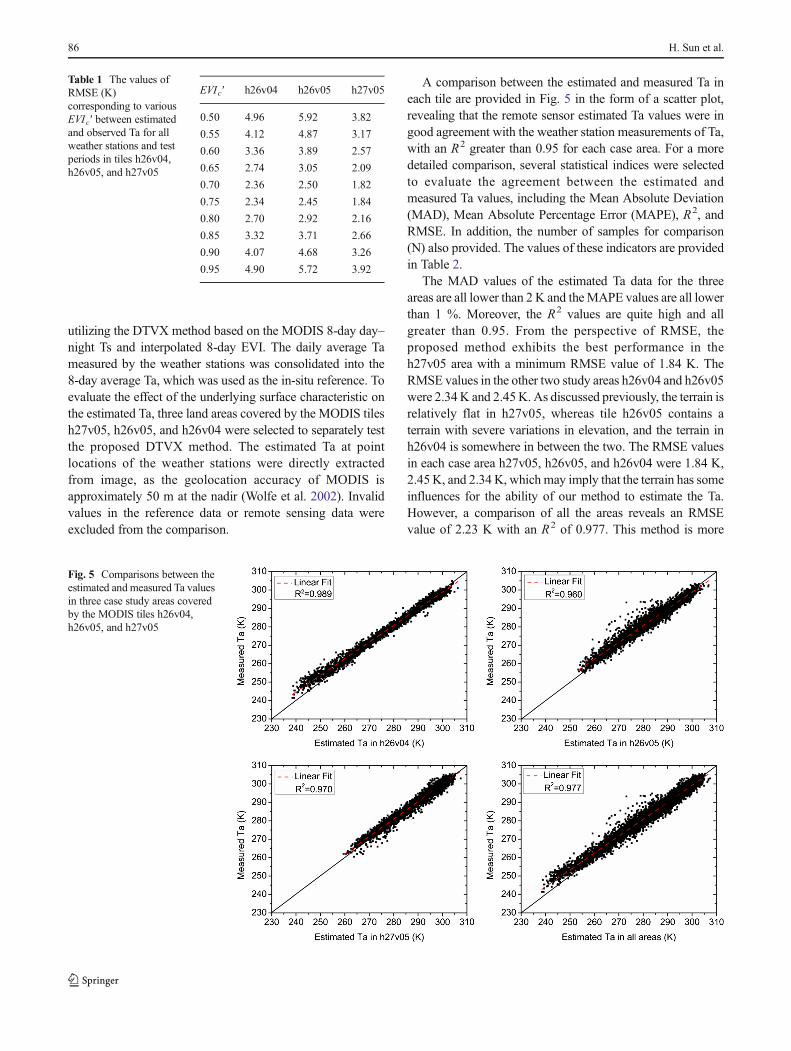
A comparison between the estimated and measured Ta ineach tile are provided in Fig. 5 in the form of a scatter plot,revealing that the remote sensor estimated Ta values were ingood agreement with the weather station measurements of Ta,with an R2 greater than 0.95 for each case area. For a moredetailed comparison, several statistical indices were selectedto evaluate the agreement between the estimated andmeasured Ta values, including the Mean Absolute Deviation(MAD), Mean Absolute Percentage Error (MAPE), R2, andRMSE. In addition, the number of samples for comparison(N) also provided. The values of these indicators are providedin Table 2.
The MAD values of the estimated Ta data for the threeareas are all lower than 2 K and theMAPE values are all lowerthan 1 %. Moreover, the R2 values are quite high and allgreater than 0.95. From the perspective of RMSE, theproposed method exhibits the best performance in theh27v05 area with a minimum RMSE value of 1.84 K. TheRMSE values in the other two study areas h26v04 and h26v05were 2.34K and 2.45K. As discussed previously, the terrain isrelatively flat in h27v05, whereas tile h26v05 contains aterrain with severe variations in elevation, and the terrain inh26v04 is somewhere in between the two. The RMSE valuesin each case area h27v05, h26v05, and h26v04 were 1.84 K,2.45K, and 2.34 K, which may imply that the terrain has someinfluences for the ability of our method to estimate the Ta.However, a comparison of all the areas reveals an RMSEvalue of 2.23 K with an R2 of 0.977. This method is more
Table 1 The values ofRMSE (K)corresponding to variousEVIc′ between estimatedand observed Ta for allweather stations and testperiods in tiles h26v04,h26v05, and h27v05
EVIc′ h26v04 h26v05 h27v05
0.50 4.96 5.92 3.82
0.55 4.12 4.87 3.17
0.60 3.36 3.89 2.57
0.65 2.74 3.05 2.09
0.70 2.36 2.50 1.82
0.75 2.34 2.45 1.84
0.80 2.70 2.92 2.16
0.85 3.32 3.71 2.66
0.90 4.07 4.68 3.26
0.95 4.90 5.72 3.92
Fig. 5 Comparisons between theestimated and measured Ta valuesin three case study areas coveredby the MODIS tiles h26v04,h26v05, and h27v05
86 H. Sun et al.
accurate in flat land areas covered by h27v05, which has anRMSE of 1.84 K and R2 of 0.97.
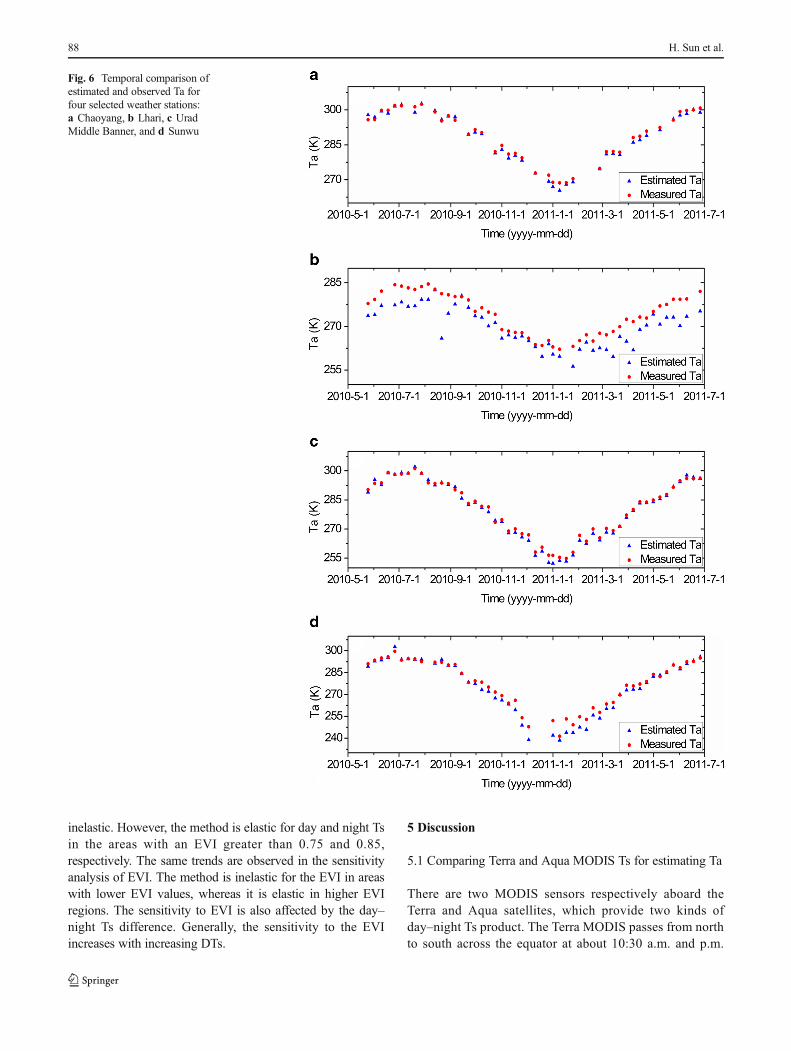
Four weather stations were selected to conduct a temporalcomparison between the estimated and observed Ta,considering the variation in the elevation and geo-location.The detailed information about these weather stations isprovided in Table 3. In these four weather stations, Lharistation in Tibet has the highest elevation of 4,488.8 m.Chaoyang station located in the north plane of China has anelevation of only 37.8 m. The Urad Middle Banner station islocated in the great grasslands of Inner Mongolia. Sunwustation has the highest latitude with a value of 49°26’ N. Thetemporal variation in the estimated and measured Ta valuesover these four weather stations is illustrated in Fig. 6, whichreveals that the Ta estimated using the method presentedherein is in good agreement with the observations in temporalvariation, especially in Chaoyang and Urad Middle Bannerstations. A more significant error may exist in areas withhigher elevations or latitudes.
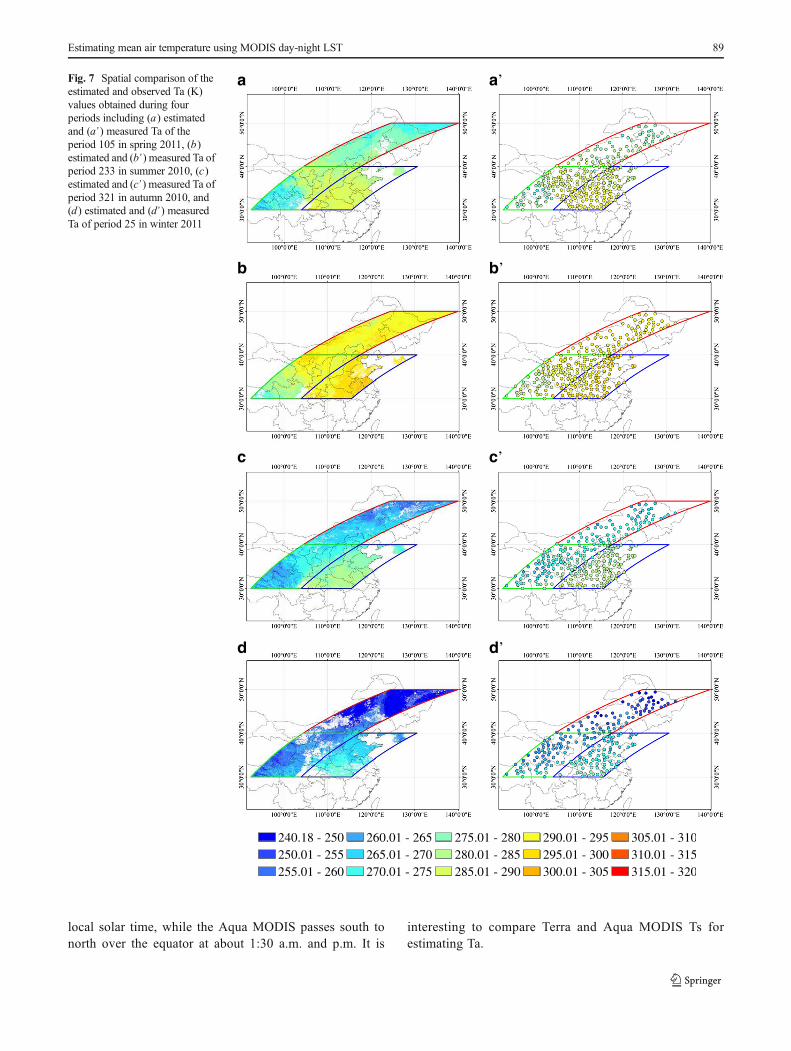
The spatial distribution of the estimated Ta data created bythe proposed algorithm was also compared with the Ta datameasured by the weather stations. Four periods of 8-dayaverage Ta values were selected i.e., period 105 in spring2011, period 233 in summer 2010, period 321 in autumn2010, and period 25 in winter 2011. The spatial distributionof estimated and measured Ta values is presented in Fig. 7.The estimated and measured values are in agreement indescribing the spatial variation of the Ta. Due to the latitude,the Ta values in the northern areas are lower than those of thesouthern area. Because of the elevation, the Ta in the west islower than in it is in the east in the area where the latitude
varies from 30° N to 40° N. Moreover, the spatial distributionof Ta can be described in detail by the remote sensing datausing the algorithm discussed in this study.
4.3 Sensitivity of the presented DTVX method
A sensitivity analysis of the presented DTVX method isconducted using four variables: Ts
day, Tsnight, and EVI . The
coefficient of sensitivity for the proposed method for Tsday
(CSday _Ts) and Tsnight (CSnight _Ts) can be described using:
CSday Ts ¼ ∂Ta
∂Tsday
¼ 1−EVIc0
1−EVIð8Þ
CSnight Ts ¼ ∂Ta
∂Tsnight
¼ EVIc0−EVI
1−EVIð9Þ
where CSday _Ts and CSnight _Ts represent the quantity variableTa when Ts
day and Tsnight change by one unit, such as one K.
If CSday _Ts and CSnight _Ts are less than 1, the presentedmethod is considered inelastic with respect to that variable,but if they are greater than 1, the method is elastic.
Because the accuracy of MODIS EVI product is within±0.015, the sensitivity of the present method with respect toEVI (CSevi) can be evaluated by the following formula:
CSEVI ¼ ∂Ta
∂EVI*0:015 ¼ 1−EVIc
0� �1−EVIð Þ2 * Ts
day−Tsnight
� �*0:015 ð10Þ
where CSevi is the quantity variable Ta when EVI changes by0.015. IfCSevi is greater than 1, the proposedmethod is elasticwith respect to EVI , but if the CSevi is less than 1, then themethod is considered to be inelastic.
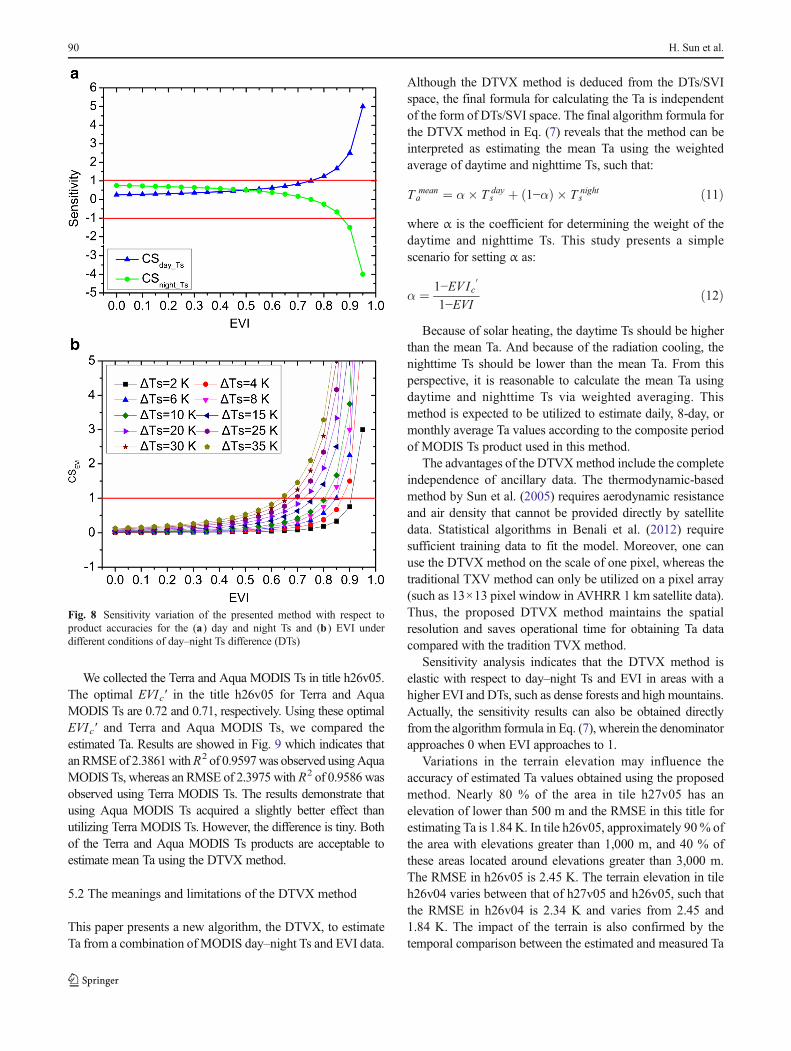
Formulas (8) to (10) reveal that the sensitivity of theproposed method for each variable is dependent on thevegetation coverage and the day-night Ts conditions of thestudy area. Assuming the variation of EVI from 0 to 0.95 atthe step of 0.05, and DTs vary from 2 K to 35 K, the change insensitivity of the proposed method to Ts
day, Tsnight, and EVI is
depicted in Fig. 8.Figure 8a, b illustrates that upon changing the accuracy of
MODIS day and night Ts product by 1 K, the estimated Tavalues determined using the proposed method do not varymore than ±1K in the areas with an EVI lower than EVIc′, i.e.,0.75. In these areas, the proposed method is considered to be
Table 2 Comparison between the estimated Ta obtained using theproposed method and the data measured by the meteorological stationsfor the test periods in tiles of h26v04, h26v05, and h27v05
h26v04 h26v05 h27v05 All areas
N 3,324 4,663 4,132 12,119
MAD (K) 1.71 1.78 1.46 1.65
RMSE (K) 2.34 2.45 1.84 2.23
R2 0.989 0.960 0.970 0.977
MAPE 0.57 % 0.64 % 0.51 % 0.59 %
N numbers of samples, MAD Mean Absolute Deviation, RMSE Root-Mean-Square Error, MAPE Mean Absolute Percentage Error
Table 3 Information from fourweather stations utilized toconduct temporal comparisonbetween the estimated andmeasured Ta values
Station code Station name Province Latitude Longitude Elevation (m)
50564 Sunwu Heilongjiang 49°26’ N 127°21’ E 234.5
53336 Urad Middle Banner Inner Mongolia 41°34’ N 108°31’ E 1288.0
54808 Chaoyang Shandong 36°14’ N 115°40’ E 37.8
56202 Lhari Tibet 30°40’ N 93°17’ E 4488.8
Estimating mean air temperature using MODIS day-night LST 87
inelastic. However, the method is elastic for day and night Tsin the areas with an EVI greater than 0.75 and 0.85,respectively. The same trends are observed in the sensitivityanalysis of EVI. The method is inelastic for the EVI in areaswith lower EVI values, whereas it is elastic in higher EVIregions. The sensitivity to EVI is also affected by the day–night Ts difference. Generally, the sensitivity to the EVIincreases with increasing DTs.
5 Discussion
5.1 Comparing Terra and Aqua MODIS Ts for estimating Ta
There are two MODIS sensors respectively aboard theTerra and Aqua satellites, which provide two kinds ofday–night Ts product. The Terra MODIS passes from northto south across the equator at about 10:30 a.m. and p.m.
Fig. 6 Temporal comparison ofestimated and observed Ta forfour selected weather stations:a Chaoyang, b Lhari, c UradMiddle Banner, and d Sunwu
88 H. Sun et al.
local solar time, while the Aqua MODIS passes south tonorth over the equator at about 1:30 a.m. and p.m. It is
interesting to compare Terra and Aqua MODIS Ts forestimating Ta.
240.18 - 250250.01 - 255255.01 - 260
260.01 - 265265.01 - 270270.01 - 275
275.01 - 280280.01 - 285285.01 - 290
290.01 - 295295.01 - 300300.01 - 305
305.01 - 310310.01 - 315315.01 - 320
a a’
b b’
c c’
d d’
Fig. 7 Spatial comparison of theestimated and observed Ta (K)values obtained during fourperiods including (a) estimatedand (a’) measured Ta of theperiod 105 in spring 2011, (b)estimated and (b’) measured Ta ofperiod 233 in summer 2010, (c)estimated and (c’) measured Ta ofperiod 321 in autumn 2010, and(d) estimated and (d’) measuredTa of period 25 in winter 2011
Estimating mean air temperature using MODIS day-night LST 89
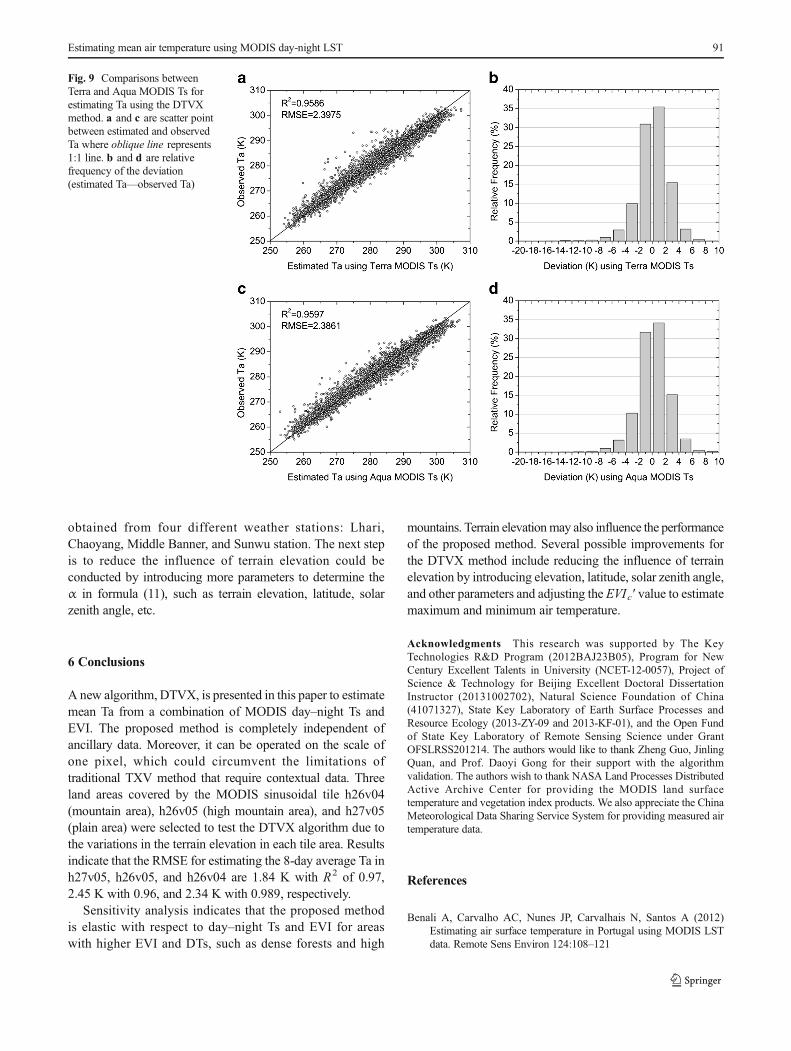
We collected the Terra and Aqua MODIS Ts in title h26v05.The optimal EVIc′ in the title h26v05 for Terra and AquaMODIS Ts are 0.72 and 0.71, respectively. Using these optimalEVIc′ and Terra and Aqua MODIS Ts, we compared theestimated Ta. Results are showed in Fig. 9 which indicates thatanRMSE of 2.3861withR2 of 0.9597was observed usingAquaMODIS Ts, whereas an RMSE of 2.3975 with R2 of 0.9586 wasobserved using Terra MODIS Ts. The results demonstrate thatusing Aqua MODIS Ts acquired a slightly better effect thanutilizing Terra MODIS Ts. However, the difference is tiny. Bothof the Terra and Aqua MODIS Ts products are acceptable toestimate mean Ta using the DTVX method.
5.2 The meanings and limitations of the DTVX method
This paper presents a new algorithm, the DTVX, to estimateTa from a combination of MODIS day–night Ts and EVI data.
Although the DTVX method is deduced from the DTs/SVIspace, the final formula for calculating the Ta is independentof the form of DTs/SVI space. The final algorithm formula forthe DTVX method in Eq. (7) reveals that the method can beinterpreted as estimating the mean Ta using the weightedaverage of daytime and nighttime Ts, such that:
Tamean ¼ α� Ts
day þ 1−αð Þ � Tsnight ð11Þ
where α is the coefficient for determining the weight of thedaytime and nighttime Ts. This study presents a simplescenario for setting α as:
α ¼ 1−EVIc0
1−EVIð12Þ
Because of solar heating, the daytime Ts should be higherthan the mean Ta. And because of the radiation cooling, thenighttime Ts should be lower than the mean Ta. From thisperspective, it is reasonable to calculate the mean Ta usingdaytime and nighttime Ts via weighted averaging. Thismethod is expected to be utilized to estimate daily, 8-day, ormonthly average Ta values according to the composite periodof MODIS Ts product used in this method.
The advantages of the DTVXmethod include the completeindependence of ancillary data. The thermodynamic-basedmethod by Sun et al. (2005) requires aerodynamic resistanceand air density that cannot be provided directly by satellitedata. Statistical algorithms in Benali et al. (2012) requiresufficient training data to fit the model. Moreover, one canuse the DTVX method on the scale of one pixel, whereas thetraditional TXV method can only be utilized on a pixel array(such as 13×13 pixel window in AVHRR 1 km satellite data).Thus, the proposed DTVX method maintains the spatialresolution and saves operational time for obtaining Ta datacompared with the tradition TVX method.
Sensitivity analysis indicates that the DTVX method iselastic with respect to day–night Ts and EVI in areas with ahigher EVI and DTs, such as dense forests and high mountains.Actually, the sensitivity results can also be obtained directlyfrom the algorithm formula in Eq. (7), wherein the denominatorapproaches 0 when EVI approaches to 1.
Variations in the terrain elevation may influence theaccuracy of estimated Ta values obtained using the proposedmethod. Nearly 80 % of the area in tile h27v05 has anelevation of lower than 500 m and the RMSE in this title forestimating Ta is 1.84 K. In tile h26v05, approximately 90% ofthe area with elevations greater than 1,000 m, and 40 % ofthese areas located around elevations greater than 3,000 m.The RMSE in h26v05 is 2.45 K. The terrain elevation in tileh26v04 varies between that of h27v05 and h26v05, such thatthe RMSE in h26v04 is 2.34 K and varies from 2.45 and1.84 K. The impact of the terrain is also confirmed by thetemporal comparison between the estimated and measured Ta
Fig. 8 Sensitivity variation of the presented method with respect toproduct accuracies for the (a) day and night Ts and (b ) EVI underdifferent conditions of day–night Ts difference (DTs)
90 H. Sun et al.
obtained from four different weather stations: Lhari,Chaoyang, Middle Banner, and Sunwu station. The next stepis to reduce the influence of terrain elevation could beconducted by introducing more parameters to determine theα in formula (11), such as terrain elevation, latitude, solarzenith angle, etc.
6 Conclusions
A new algorithm, DTVX, is presented in this paper to estimatemean Ta from a combination of MODIS day–night Ts andEVI. The proposed method is completely independent ofancillary data. Moreover, it can be operated on the scale ofone pixel, which could circumvent the limitations oftraditional TXV method that require contextual data. Threeland areas covered by the MODIS sinusoidal tile h26v04(mountain area), h26v05 (high mountain area), and h27v05(plain area) were selected to test the DTVX algorithm due tothe variations in the terrain elevation in each tile area. Resultsindicate that the RMSE for estimating the 8-day average Ta inh27v05, h26v05, and h26v04 are 1.84 K with R2 of 0.97,2.45 K with 0.96, and 2.34 K with 0.989, respectively.
Sensitivity analysis indicates that the proposed methodis elastic with respect to day–night Ts and EVI for areaswith higher EVI and DTs, such as dense forests and high
mountains. Terrain elevationmay also influence the performanceof the proposed method. Several possible improvements forthe DTVX method include reducing the influence of terrainelevation by introducing elevation, latitude, solar zenith angle,and other parameters and adjusting the EVIc′ value to estimatemaximum and minimum air temperature.
Acknowledgments This research was supported by The KeyTechnologies R&D Program (2012BAJ23B05), Program for NewCentury Excellent Talents in University (NCET-12-0057), Project ofScience & Technology for Beijing Excellent Doctoral DissertationInstructor (20131002702), Natural Science Foundation of China(41071327), State Key Laboratory of Earth Surface Processes andResource Ecology (2013-ZY-09 and 2013-KF-01), and the Open Fundof State Key Laboratory of Remote Sensing Science under GrantOFSLRSS201214. The authors would like to thank Zheng Guo, JinlingQuan, and Prof. Daoyi Gong for their support with the algorithmvalidation. The authors wish to thank NASA Land Processes DistributedActive Archive Center for providing the MODIS land surfacetemperature and vegetation index products. We also appreciate the ChinaMeteorological Data Sharing Service System for providing measured airtemperature data.
References
Benali A, Carvalho AC, Nunes JP, Carvalhais N, Santos A (2012)Estimating air surface temperature in Portugal using MODIS LSTdata. Remote Sens Environ 124:108–121
Fig. 9 Comparisons betweenTerra and Aqua MODIS Ts forestimating Ta using the DTVXmethod. a and c are scatter pointbetween estimated and observedTa where oblique line represents1:1 line. b and d are relativefrequency of the deviation(estimated Ta—observed Ta)
Estimating mean air temperature using MODIS day-night LST 91
Boegh E, Soegaard H, Hanan N, Kabat P, Lesch L (1999) A RemoteSensing Study of the NDVI–Ts Relationship and the Transpirationfrom Sparse Vegetation in the Sahel Based on High-ResolutionSatellite Data. Remote Sens Environ 69:224–240
Cresswell MP, Morse AP, Thomson MC, Connor SJ (1999) Estimatingsurface air temperatures, from Meteosat land surface temperatures,using an empirical solar zenith angle model. Int J Remote Sens 20:1125–1132
DeVisser MH, Messina JP, Moore NJ, Lusch DP, Maitima J (2010) Adynamic species distribution model of Glossina subgenusMorsitans: The identification of tsetse reservoirs and refugia.Ecosphere 1:21
Wolfe RE, Nishihama M, Fleig A, Kuyper J, Roy DP, Storey J, Patt F(2002) Achieving sub-pixel geolocation accuracy in support ofMODIS land science. Remote Sens Environ 83:31–49
Fu G, Shen Z, Zhang X, Shi P, Zhang Y, Wu J (2011) Estimatingair temperature of an alpine meadow on the Northern TibetanPlateau using MODIS land surface temperature. Acta EcolSin 31:8–13
House-Peters LA, Chang H (2011) Modeling the impact of land use andclimate change on neighborhood-scale evaporation and nighttimecooling: A surface energy balance approach. Landsc Urban Plan103:139–155
IPCC (2007) Climate Change 2007: The Physical Science Basis. In:Solomon S, Qin D, Manning M, Chen Z, Marquis M, Averyt KB,Tignor M, Miller HL (eds) Contribution of Working Group I to theFourth Assessment Report of the Intergovernmental Panel onClimate Change. United Kindom, Cambridge
Jiang Z, Huete AR, Didan K,Miura T (2008) Development of a two-bandenhanced vegetation index without a blue band. Remote SensEnviron 112:3833–3845
Kawashima S, Ishida T, Minomura M, Miwa T (2000) Relations betweenSurface Temperature and Air Temperature on a Local Scale duringWinter Nights. J Appl Meteorog Climatol 39:1570–1580
Li Z-L, Tang R,Wan Z, Bi Y, Zhou C, Tang B, Yan G, Zhang X (2009) Areview of current methodologies for regional evapotranspirationestimation from remotely sensed data. Sensors 9:3801–3853
Lin S, Moore NJ, Messina JP, DeVisser MH, Wua J (2012) Evaluation ofestimating daily maximum and minimum air temperature withMODIS data in east Africa. Int J Appl Earth Obs Geoinformation18:128–140
Liu H,WengQ (2012) Enhancing temporal resolution of satellite imageryfor public health studies: A case study ofWest Nile Virus outbreak inLos Angeles in 2007. Remote Sens Environ 117:57–71
Mao KB, Tang HJ, Wang XF, Zhou QB, Wang DL (2008) Near-surfaceair temperature estimation from ASTER data based on neuralnetwork algorithm. Int J Remote Sens 29:6021–6028
Nieto H, Sandholt I, Aguado I, Chuvieco E, Stisen S (2011) Airtemperature estimation with MSG-SEVIRI data: Calibration andvalidation of the TVX algorithm for the Iberian Peninsula. RemoteSens Environ 115:107–116
Petropoulos G, Carlson TN, Wooster MJ, Islam S (2009) A review of Ts/VI remote sensing based methods for the retrieval of land surfaceenergy fl uxes and soil surface moisture. Prog Phys Geogr 33:224–250
Prihodko L, Goward SN (1997) Estimation of air temperature fromremotely sensed surface observations. Remote Sens Environ 60:335–346
Qi S, Luo C, Wang C, Niu Z (2006) Pre-study on reverse air temperaturefrom remote sensing - Relationship between vegetation index, landsurface temperature and air temperature. Remote Sens Technol Appl21:130–137 (in chinese)
Sandholt I, Rasmussen K, Andersen J (2002) A simple interpretation ofthe surface temperature/vegetation index space for assessment ofsurface moisture status. Remote Sens Environ 79:213–224
Savage MJ, Everson CS, Metelerkamp BR (2009) Bowen ratioevaporation measurement in a remote montane grassland: Dataintegrity and fluxes. J Hydrol 376:249–260
Stisen S, Sandholt I, Nørgaard A, Fensholt R, Eklundh L (2007)Estimation of diurnal air temperature using MSG SEVIRI data inWest Africa. Remote Sens Environ 110:262–274
Sun Y-J, Wang J-F, Zhang R-H, Gillies RR, Xue Y, Bo Y-C (2005) Airtemperature retrieval from remote sensing data based onthermodynamics. Theor Appl Climatol 80:37–48
Vancutsem C, Ceccato P, Dinku T, Connor SJ (2010) Evaluation ofMODIS land surface temperature data to estimate air temperaturein different ecosystems over Africa. Remote Sens Environ 114:449–465
Wan Z, Zhang Y, Zhang Q, Li ZL (2002) Validation of the land-surfacetemperature products retrieved from Terra Moderate ResolutionImaging Spectroradiometer data. Remote Sens Environ 83:163–180
Wang K, Dickinson RE (2012) A review of global terrestrialevapotranspiration: Observation, modeling, climatology, andclimatic variability. Rev Geophys 50:1–54
Wang K, Li Z, Cribb M (2006) Estimation of evaporative fraction from acombination of day and night land surface temperatures and NDVI:A new method to determine the Priestley–Taylor parameter. RemoteSens Environ 102:293–305
Wang W, Liang S, Meyers T (2008) Validating MODIS land surfacetemperature products using long-term nighttime groundmeasurements. Remote Sens Environ 112:623–635
Zhu W, Lü A, Jia S (2013) Estimation of daily maximum and minimumair temperature using MODIS land surface temperature products.Remote Sens Environ 130:62–73
92 H. Sun et al.
Related Documents


