CSIRO PUBLISHING www.publish.csiro.au/journals/mfr Marine and Freshwater Research, 2006, 57, 635–653 Estimating local stream fish assemblage attributes: sampling effort and efficiency at two spatial scales Mark J. Kennard A,C , Bradley J. Pusey A , Bronwyn D. Harch B , Elli Dore A and Angela H. Arthington A A Cooperative Research Centres for Freshwater Ecology and Tropical Rainforest Ecology and Management, Centre for Riverine Landscapes, Faculty of Environmental Sciences, Griffith University, 170 Kessels Road, Nathan, Qld 4111, Australia. B Commonwealth Scientific and Industrial Research Organisation, Mathematical & Information Sciences, Queensland Bioscience Precinct, 306 Carmody Road, St Lucia, Qld 4067, Australia. C Corresponding author. Email: [email protected] Abstract. As part of a wider study to develop an ecosystem-health monitoring program for wadeable streams of south-eastern Queensland,Australia, comparisons were made regarding the accuracy, precision and relative effi- ciency of single-pass backpack electrofishing and multiple-pass electrofishing plus supplementary seine netting to quantify fish assemblage attributes at two spatial scales (within discrete mesohabitat units and within stream reaches consisting of multiple mesohabitat units). The results demonstrate that multiple-pass electrofishing plus seine netting provide more accurate and precise estimates of fish species richness, assemblage composition and species relative abundances in comparison to single-pass electrofishing alone, and that intensive sampling of three mesohabitat units (equivalent to a riffle–run–pool sequence) is a more efficient sampling strategy to estimate reach-scale assemblage attributes than less intensive sampling over larger spatial scales.This intensive sampling protocol was sufficiently sensitive that relatively small differences in assemblage attributes (<20%) could be detected with a high statistical power (1-β > 0.95) and that relatively few stream reaches (<4) need be sampled to accurately estimate assemblage attributes close to the true population means. The merits and potential drawbacks of the intensive sampling strategy are discussed, and it is deemed to be suitable for a range of monitoring and bioassessment objectives. Extra keywords: biodiversity, bootstrapping, fish behaviour, habitat use, physico-chemical conditions, power anal- ysis, sample size. Introduction Accurately estimating biotic assemblage attributes such as species richness, species composition and species relative abundances is a fundamental requirement of environmen- tal monitoring and assessment programs. The precision of these estimates influences our ability to detect meaningful differences in assemblage attributes through time and space. Maximising accuracy and precision is frequently constrained by sampling effort, which in turn is often limited by available funds and resources. The minimum sampling effort required is that which provides the necessary information to achieve the goal of a sampling program, and depends on such fac- tors as the species and attributes of interest, the required accuracy (proximity of an estimate to the true value) and pre- cision (degree of variation in the estimate), and the efficiency (sampling effort required to achieve a given level of accu- racy and precision) (Sheldon 1984; Andrew and Mapstone 1987; Bohlin et al. 1989; Norris et al. 1992; Maher et al. 1994; Angermeier and Smogor 1995). Ultimately, the best sampling program is one that simultaneously maximises accuracy, precision and sensitivity, and minimises resource use. The increasing focus on the management of Australian inland waters to sustain human needs, as well as simultaneous maintenance of natural biodiversity and ecosystem processes, requires that programs designed to monitor or assess ecosys- tem health are appropriate to the task. Freshwater fish are frequently advocated as appropriate target organisms in such programs, yet little information exists on the effort required to quantify relevant attributes of fish assemblages in the context of such programs. Pusey et al. (1998) evaluated the accuracy of single- v. multiple-pass electrofishing plus seine netting in two eastern Queensland river basins. They concluded that multiple-pass electrofishing and supplementary seine netting yielded sig- nificantly more accurate estimates of fish species richness, abundance, species composition and assemblage structure within single hydraulic units (i.e. riffles, runs or pools – hereafter collectively termed mesohabitats) than a single © CSIRO 2006 10.1071/MF06062 1323-1650/06/060635

Welcome message from author
This document is posted to help you gain knowledge. Please leave a comment to let me know what you think about it! Share it to your friends and learn new things together.
Transcript

CSIRO PUBLISHING
www.publish.csiro.au/journals/mfr Marine and Freshwater Research, 2006, 57, 635–653
Estimating local stream fish assemblage attributes: samplingeffort and efficiency at two spatial scales
Mark J. KennardA,C, Bradley J. PuseyA, Bronwyn D. HarchB, Elli DoreA
and Angela H. ArthingtonA
ACooperative Research Centres for Freshwater Ecology and Tropical Rainforest Ecology and Management,Centre for Riverine Landscapes, Faculty of Environmental Sciences, Griffith University,
170 Kessels Road, Nathan, Qld 4111, Australia.BCommonwealth Scientific and Industrial Research Organisation, Mathematical & Information Sciences,
Queensland Bioscience Precinct, 306 Carmody Road, St Lucia, Qld 4067, Australia.CCorresponding author. Email: [email protected]
Abstract. As part of a wider study to develop an ecosystem-health monitoring program for wadeable streams ofsouth-eastern Queensland, Australia, comparisons were made regarding the accuracy, precision and relative effi-ciency of single-pass backpack electrofishing and multiple-pass electrofishing plus supplementary seine netting toquantify fish assemblage attributes at two spatial scales (within discrete mesohabitat units and within stream reachesconsisting of multiple mesohabitat units).The results demonstrate that multiple-pass electrofishing plus seine nettingprovide more accurate and precise estimates of fish species richness, assemblage composition and species relativeabundances in comparison to single-pass electrofishing alone, and that intensive sampling of three mesohabitat units(equivalent to a riffle–run–pool sequence) is a more efficient sampling strategy to estimate reach-scale assemblageattributes than less intensive sampling over larger spatial scales. This intensive sampling protocol was sufficientlysensitive that relatively small differences in assemblage attributes (<20%) could be detected with a high statisticalpower (1-β > 0.95) and that relatively few stream reaches (<4) need be sampled to accurately estimate assemblageattributes close to the true population means. The merits and potential drawbacks of the intensive sampling strategyare discussed, and it is deemed to be suitable for a range of monitoring and bioassessment objectives.
Extra keywords: biodiversity, bootstrapping, fish behaviour, habitat use, physico-chemical conditions, power anal-ysis, sample size.
Introduction
Accurately estimating biotic assemblage attributes such asspecies richness, species composition and species relativeabundances is a fundamental requirement of environmen-tal monitoring and assessment programs. The precision ofthese estimates influences our ability to detect meaningfuldifferences in assemblage attributes through time and space.Maximising accuracy and precision is frequently constrainedby sampling effort, which in turn is often limited by availablefunds and resources. The minimum sampling effort requiredis that which provides the necessary information to achievethe goal of a sampling program, and depends on such fac-tors as the species and attributes of interest, the requiredaccuracy (proximity of an estimate to the true value) and pre-cision (degree of variation in the estimate), and the efficiency(sampling effort required to achieve a given level of accu-racy and precision) (Sheldon 1984; Andrew and Mapstone1987; Bohlin et al. 1989; Norris et al. 1992; Maher et al.1994; Angermeier and Smogor 1995). Ultimately, the best
sampling program is one that simultaneously maximisesaccuracy, precision and sensitivity, and minimises resourceuse. The increasing focus on the management of Australianinland waters to sustain human needs, as well as simultaneousmaintenance of natural biodiversity and ecosystem processes,requires that programs designed to monitor or assess ecosys-tem health are appropriate to the task. Freshwater fish arefrequently advocated as appropriate target organisms in suchprograms, yet little information exists on the effort required toquantify relevant attributes of fish assemblages in the contextof such programs.
Pusey et al. (1998) evaluated the accuracy of single- v.multiple-pass electrofishing plus seine netting in two easternQueensland river basins. They concluded that multiple-passelectrofishing and supplementary seine netting yielded sig-nificantly more accurate estimates of fish species richness,abundance, species composition and assemblage structurewithin single hydraulic units (i.e. riffles, runs or pools –hereafter collectively termed mesohabitats) than a single
© CSIRO 2006 10.1071/MF06062 1323-1650/06/060635
636 Marine and Freshwater Research M. J. Kennard et al.
electrofishing pass. The study was concerned with samplingeffort at small spatial scales and did not directly examine therelative accuracy and precision of single-pass electrofishingand multiple-pass electrofishing over larger spatial scales (i.e.multiple mesohabitat units within a stream reach). Further-more, Pusey et al. (1998) did not fully examine the biologicaland environmental factors potentially influencing samplingefficiency at these spatial scales.
Failure to detect species or accurately estimate theirtrue abundances during sampling has the potential to biasbioassessments, and could result in considerable deviationsbetween expected and observed assemblages and a low sen-sitivity to detect meaningful changes in space or time (Maheret al. 1994; Growns et al. 1996; Paller et al. 1996; Kennardet al. 2005, 2006a). This may be particularly importantfor Australian streams, where local fish species diversityis often low in comparison with North America, Asia andelsewhere (Harris 1995; Matthews 1998; Harris and Silveira1999). Sampling relatively short sections of a stream usingintensive sampling may be insufficient to estimate reach-scale assemblage attributes, because insufficient micro- andmesohabitat configurations that support different speciesand varying numbers of individuals may be encountered.Bioassessment programs or biodiversity surveys have fre-quently used low intensity sampling (e.g. using single-passelectrofishing) over comparatively longer stream reaches toensure that larger numbers of habitat configurations (and pre-sumably the species they support) are sampled (e.g. Lyons1992; Pusey and Kennard 1996; Harris and Gehrke 1997;Gehrke et al. 1999; Mitro and Zale 2000; Gehrke and Harris2001; Murray–Darling Basin Commission 2004). Increasingsampling intensity within a stream reach (e.g. by increasingthe number of electrofishing passes or using multiple sam-pling methods) should increase the accuracy and precisionof estimates of assemblage attributes without increasing thenumber of replicates (number of mesohabitat units), but itis not clear that the increased statistical power to detect ahypothesised effect is worth the additional time (and cost)required to undertake more intensive sampling (Andrew andMapstone 1987; Paller 1995a, 1995b).
A range of biological, environmental and technical fac-tors can influence the accurate and precise estimation offish assemblage attributes. Species (and individuals of dif-ferent sizes) vary in their susceptibility to being capturedby electrofishing. Variation in galvanotaxic and galvanonar-cotic responses of fish is widely documented and has beenattributed to such factors as variation in physiology, size,behaviour and microhabitat use. Electrofishing effective-ness can also vary with factors such as water conductivity,temperature, stream width, stream depth, habitat structureand disturbance, and fright bias (see Bohlin et al. (1989),Zalewski and Cowx (1989) and Kolz et al. (1998) forreviews). These issues may have major implications for theoptimum design of sampling programs that aim to provide
accurate, precise yet efficient estimates of fish assemblageattributes.
The present paper forms part of a wider study to developan ecosystem health (sensu Rapport et al. 1998) moni-toring program for waterways in south-eastern Queensland(Moreton Bay Waterways and Catchment Partnership 2002).The freshwater fish component of the study uses fish assem-blage attributes such as species richness (Kennard et al.2006b), species composition (Kennard et al. 2006a) andspecies relative abundances (Kennard et al. 2005) as indica-tors of ecosystem health. In the present paper we comparethe accuracy, precision and efficiency of two fish sam-pling methods (single-pass electrofishing and multiple-passelectrofishing plus seine netting) to estimate stream fishassemblage attributes at two spatial scales (within discretemesohabitat units and within stream reaches consisting ofmultiple mesohabitat units). We examine the extent to whichthe efficiency of each sampling method was influenced byinterspecific variation in fish behaviour and habitat use, andspatial variation in environmental conditions. Our ultimategoal is to evaluate how changes in sampling effort (within andamong mesohabitat units) influence the accuracy, precisionand hence efficiency of fish assemblage estimates, dependingon the fish sampling method employed.
Materials and methods
Study area
The study area was confined to the Mary River and Albert River incoastal south-eastern Queensland, Australia. Detailed descriptions ofthe region and the characteristics of the study rivers are given in Puseyet al. (1993, 1998, 2004) and Kennard et al. (2005). Streams in the Maryand Albert River catchments generally have well defined riffle–run–pool sequences. Forty-six stream reaches selected for sampling wererandomly stratified by relative position within the catchments (locatedon third to seventh order streams and rivers as estimated from 1 : 100 000topographic maps) to encompass as much of the natural biological andenvironmental variation as possible (Fig. 1). Reach selection was con-strained by available access points to the river and a desire to avoid areasaffected by human activity, but reaches chosen for study were widelyarrayed throughout both catchments and represented the best condi-tion available (sensu Hughes 1995) (i.e. minimally disturbed riparianvegetation, bank and channel structure in natural condition and naturalhydrograph).
We evaluated fish sampling effort and efficiency within individ-ual mesohabitat units (i.e. riffles, runs and pools) using data collectedfrom one mesohabitat unit sampled at each of the 46 reaches in theMary (n = 28) andAlbert (n = 18) River catchments. We visually distin-guished individual mesohabitat units as areas of relatively homogeneouswater depth and velocity that were bounded by sharp gradients in bothdepth and velocity (similar to Hawkins et al. 1993).Three distinct classesof mesohabitat were identified (Jowett 1993) and included riffles (char-acterised by shallow, fast-flowing water, n = 15), pools (deep, with nodiscernable flow, n = 15) and runs (slow flowing and of intermediatedepth, n = 16) (Table 1). On average, mesohabitats were 40.9 m long and8.0 m wide (equivalent to 5.1 mean stream widths (MSW) – calculatedas site length/width) and 326 m2 in area. Water clarity and water conduc-tivity were usually high in both rivers (mean turbidity 3.5 NTU, meanconductivity 393 µs cm−1). Mesohabitats were sampled once betweenJune and August 1995. We chose the winter sampling period when

Estimating local stream fish assemblage attributes Marine and Freshwater Research 637
0 35
Kilometres
70
N
Mary River
�28°14��153°58�
(a) Location
Albert River
(b) Stream reach
Str
eam
dis
tanc
e (m
)
40
30
20
10
0
In-stream habitatsampling point
Bank habitatsampling point
(c) Mesohabitat unitPool
Riffle
Run
Pool
Riffle
Run
Stream distance (~265 m)
1
3
4
25
6
Brisbane
Fig. 1. Spatial scale of sampling in the Mary River and Albert River in south-eastern Queensland, Australia. (a) Location of stream reaches wheresampling of mesohabitat units was undertaken. (b) The subset of stream reaches where extended sampling of multiple (six) mesohabitat units wasundertaken in the Mary River is depicted in (a) by numbered squares. (c) Sampling points within each mesohabitat unit where measurements ofin-stream and bank habitat were taken.
Table 1. F values and their associated significance levels (P) for nested analysis of variance of log(x + 1) transformed physical and waterquality characteristics between rivers and mesohabitat types (nested within river)
Means and standard deviations (s.d.) of physical and water quality parameters for each mesohabitat type are also shown
ANOVA term Mesohabitat type
River Mesohabitat (River) Riffles (n = 15) Runs (n = 16) Pools (n = 15)F1,40 P F4,40 P Mean (± s.d.) Mean (± s.d.) Mean (± s.d.)
Physical characteristicsSite length (m) 0.24 0.628 0.25 0.911 40.0 ± 10.2 42.3 ± 27.2 40.3 ± 13.6Site area (m2) 0.01 0.913 1.33 0.277 263.8 ± 277.5 310.0 ± 348.9 404.1 ± 231.7Wetted width (m) 0.21 0.65 3.39 0.018 6.0 ± 4.6 6.7 ± 2.5 11.3 ± 5.0Mean depth (m) 1.73 0.196 25.61 0.000 0.18 ± 0.06 0.32 ± 0.16 0.63 ± 0.16Mean velocity (m s−1) 2.11 0.155 69.27 0.000 0.31 ± 0.08 0.10 ± 0.06 0.00 ± 0.00
Water qualityTurbidity (NTU) 3.06 0.088 0.62 0.648 2.4 ± 1.3 3.2 ± 2.1 2.4 ± 1.5Conductivity (µS cm−1) 3.21 0.055 0.72 0.582 356.3 ± 346.4 449.6 ± 357.5 332.1 ± 249.5Temperature (◦C) 2.12 0.14 1.94 0.122 17.3 ± 3.2 17.0 ± 2.7 18.1 ± 2.9
hydrological conditions were characterised by low and relatively sta-ble flows (Pusey et al. 1993, 2000, 2004), but there was sufficient flowto allow fish unrestricted longitudinal movement among mesohabitatsand river reaches.
We evaluated fish sampling effort and efficiency within streamreaches (i.e. over multiple mesohabitat units) at a subset of six streamreaches located in the mid- and upper portions of the Mary River catch-ment (situated on third to sixth order streams, Fig. 1). These sites were
638 Marine and Freshwater Research M. J. Kennard et al.
sampled in January and February of 2003 when stream flows werelow and stable. Within each of the six stream reaches, we sampled aseries of six contiguous mesohabitat units, 44.5 m long, 8.7 m wide and5.1 mean stream widths on average. This equated to total stream reachlengths of ∼265 m or 30 MSW on average. Hereafter, we refer to reachlength in terms of number of mesohabitat units and number of MSW asthis allows comparison both between different stream reaches and withstudies undertaken elsewhere.
Fish sampling procedures
Fish assemblages at each site were intensively sampled using the proce-dures detailed in Pusey et al. (1998) and are similar to those used by otherresearchers (e.g. Martin-Smith 1998; Eros and Grossman 2005). Sam-pling was conducted using a backpack DC electrofishing unit (Mk 12POW, Smith-Root, www.smith-root.com/, verified August 2006) witha standard Smith-Root anode (25 cm diameter ring attached to a 2 mpole) and cathode (3.2 m wire cable). The electrofisher was typicallyoperated at 300–400V, 70 Hz frequency and 4 ms pulse width as ourexperience indicated that this output was the most effective for col-lecting a wide range of fish species within different habitat types insouth-eastern Queensland rivers and streams (M. J. Kennard, personalobservation). A small net (9-mm stretched mesh) was attached to theanode ring as this markedly improved fish capture efficiency (partic-ularly within undercut banks), while also minimising the duration ofelectroshocking required to capture fish (M. J. Kennard, personal obser-vation). We were particularly judicious in our use of the electrofisher aswe were concerned with the potential for electrofishing-induced injuriesto fish resulting from extended or repeated exposure to the electric cur-rent, and so attempted to collect fish immediately at, or below, theirimmobilization threshold (Holliman and Reynolds 2003).
Each mesohabitat unit was blocked upstream and downstream withweighted seine nets (11 mm stretched-mesh) to prevent fish movementinto or out of the study area. The operator and one or two dip-nettersthen commenced electrofishing from the downstream end of the site and,using short, intermittent pulses, moved upstream in a zig-zag fashion,attempting to ensure that all of the enclosed area was electrofished once.Upon capture, fish were identified to species level, counted, recorded onpre-prepared datasheets, removed from the stream and placed in 70 Lcontainers. This procedure was considered to represent a single elec-trofishing pass. All subsequent electrofishing passes continued in thesame manner until few or no more fish were caught (i.e. usually less than25% of the total collected on the previous pass, Peterson et al. 2004).Following electrofishing, a seine net was pulled through each site wherepossible to catch any fish missed by the electrofisher.A maximum of fiveelectrofishing passes and two seine hauls were required to collect themajority of fish present. Visual observation and occasional snorkellingsurveys aided in this determination. Native fish were released back intothe stream and alien fish (i.e. species introduced from other countries)were euthanased (using benzocaine), and not returned to the water (inaccordance with the Queensland Fisheries Act, 1994). The elapsed timeand the actual electrofisher ‘power on’ time were recorded upon com-pletion of each electrofishing pass to measure sampling effort.Althoughthese two measures of electrofishing sampling effort were stronglycorrelated (Spearman’s correlation coefficient = 0.80) (Kennard 2005),electrofisher ‘power on’ time is a more direct measure of sampling dura-tion and so is used here. The duration of each seine net haul (and fishprocessing) was usually ∼10 min.
Habitat sampling procedures
Physical variables considered important determinants of fish speciescomposition and abundance, and that potentially influenced samplingefficiency, were estimated for each mesohabitat according to a stan-dard protocol described in Pusey et al. (2004). Wetted stream width,mean water velocity and water depth were measured at a series of points
located randomly throughout the site. In general, this scheme resulted in20 measures for each parameter at each site, which equated to an aver-age of seven samples per mean stream width. Proportional substratecomposition was estimated for one square metre around each surveypoint and allocated to each of seven substrate classes: mud (<0.06 mm),sand (0.06–2 mm), fine gravel (2–16 mm), coarse gravel (16–64 mm),cobbles (64–128 mm), rocks (>128 mm) and bedrock. At each surveypoint we also estimated the abundance of submerged physical structuresoften used as refuge by fish (hereafter termed microhabitat variables)including aquatic macrophytes, filamentous algae, submerged vege-tation (mainly grasses), emergent vegetation, submerged overhangingvegetation (tree branches), leaf litter, and large (>15 cm minimum stemdiameter) and small (1–15 cm diameter) woody debris.As many of thesemicrohabitat structures were concentrated along the stream margins, weestimated the lineal extent (proportion of wetted perimeter) of thesestructures, in addition to the proportion of undercut banks and rootmasses, using multiple transect segments along each bank. For every10 m of stream traversed, bank microhabitat was assessed out to a dis-tance of 1 m from the bank, at an average sampling intensity of twosamples per mean stream width. Average values (wetted width, depthand velocity), or average proportion of mean wetted site area (substratecomposition and microhabitat structures) or stream bank (microhab-itat structures including undercut banks and root masses) were thencalculated for each site. Ambient water quality conditions (turbidity,conductivity and temperature) were characterised by the mean of threemeasurements for each parameter taken at each site.
Data analysis
Spatial variation in physical and water quality characteristics
Nested analysis of variance was used to examine variation in physicalcharacteristics (site dimensions, depth and velocity) and water qual-ity characteristics between rivers and mesohabitat types (nested withinriver). All variables were log(x + 1) transformed before analyses.
Sampling effort and efficiency within mesohabitat units
We evaluated sampling cumulative changes in fish assemblageattributes with increasing sampling effort within mesohabitats usingfish data summarised in four ways: total fish species richness (totalnumber of species sampled), total fish abundance, species composition(presence/absence) and species relative abundances. The total numberof species and individuals collected after all electrofishing passes plusadditional seine netting, were taken to represent the total fish assemblagepresent within each site (NT ). The cumulative total species richness andtotal abundance collected up to pass i was represented by N i. The con-tribution of each cumulative pass was standardised by the total (N i/N T )and expressed as a percentage. The contribution of seine netting toN T was similarly standardised. Multivariate comparisons of cumula-tive changes in fish species composition and species relative abundancedata sampled on each electrofishing pass was performed by calculat-ing the Bray–Curtis similarity between the fish assemblage sampled oneach successive cumulative pass N i and the total fish assemblage N T (i.e.N i v. N T ). The Bray–Curtis measure is widely used in ecological studiesand is regarded as an effective measure of ecological association (Faithet al. 1987; Legendre and Legendre 1998). Initial analysis of the rela-tionship between variances and means indicated heterogenous variancesso all standardised cumulative catch data were log(x + 1) transformedbefore further analysis.
To accommodate the nested sampling of mesohabitat type withinrivers and the nesting of repeated electrofishing passes within meso-habitat type, a linear mixed effects model was used. This enabledinvestigation of whether successive electrofishing passes contributedsignificant new information to the estimation of total species richness,total abundance, species composition and species relative abundances,

Estimating local stream fish assemblage attributes Marine and Freshwater Research 639
and whether sampling efficiency varied between mesohabitat types(riffles, runs and pools) within rivers. In this analysis we used sites(mesohabitats) as subjects, mesohabitat type nested within river as afixed effect and we tested the within-subject effect of electrofishing pass(with errors modelled allowing for correlation). Initial analyses revealedthat the main effect of river was not significant and so was removedfrom all subsequent analyses. For all significant within-site effects ofelectrofishing pass, we used a Bonferroni multiple-comparison test todistinguish significant differences between the 1 to nth level cumulativepass and the total collected by electrofishing. The relative proportion ofthe total fish assemblage (NT ) collected by the first electrofishing pass(P1) is a measure of electrofishing efficiency and variation in electrofish-ing efficiency between mesohabitat types was evaluated using a one-wayANOVA. Where appropriate, we used Bonferroni multiple-comparisontests to distinguish significant differences between mesohabitat types.
Relationships between electrofishing sampling effort (as sum-marised by the total electrofishing ‘power on’ time) and electrofishingefficiency (see above) with the site dimensions (site length, area andvolume), and site physical (width, depth and velocity), chemical (waterturbidity, conductivity and temperature) and biological (total fish speciesrichness and total fish abundance) characteristics were evaluated usingSpearman’s rank correlation. Variation in sampling effort and biologicalcharacteristics between mesohabitat types was assessed using one-wayANOVA (data were log(x + 1) transformed before analysis).
The probability of detecting a species at a site and the probabilityof estimating its true relative abundances (as defined by multiple-passelectrofishing plus seine netting) were used as measures of sam-pling efficiency of each species by single-pass electrofishing. Weexamined whether variation in sampling efficiency was related to indi-vidual species’ behaviour and microhabitat use by grouping speciesaccording to whether they were benthic, pelagic or usually inhabitedbeds of submerged vegetation (species behavioural designations werebased on information provided in Pusey et al. (2004) and unpublishedobservations, Table 2). One-way ANOVA was used to test whether sam-pling efficiency by single-pass electrofishing differed among speciesbehavioural groups, and post-hoc comparisons were tested using LeastSignificant Difference (l.s.d.) tests.
Sampling effort and efficiency at the stream reach scale
We examined changes in reach-scale estimates of total species rich-ness, species composition and species relative abundances with increas-ing numbers of mesohabitats (and hence length of stream sampled)and compared these estimates using data collected from single-passelectrofishing and multiple-pass electrofishing (three passes only) plusseine netting (one seine haul per mesohabitat) at six stream reachesin the Mary River (Fig. 1). We incrementally constructed hypotheticalseries of mesohabitat units using a bootstrapped resampling approachsimilar to that employed by Angermeier and Smogor (1995). One, thentwo, then three (etc.) individual mesohabitats were randomly selected(with replacement) up to the maximum of six mesohabitats actuallysampled in each stream reach. For each increment of sampling effort(one mesohabitat unit) data were pooled and fish species richness,species composition and species relative abundances calculated. Thetotal number of species and individuals collected after multiple-passelectrofishing plus seine netting of all six mesohabitat units in a streamreach was taken to represent the total fish assemblage present withineach stream reach (NT reach). The cumulative total species richnesscollected up to mesohabitat i was represented by Ni reach. The contri-bution of each cumulative set of mesohabitat samples was standardisedby the total (Ni reach/N T reach) and expressed as a percentage. Calcula-tions of Ni reach/N T reach were undertaken separately for data collectedby single-pass electrofishing and by multiple-pass electrofishing plusseine netting. Multivariate comparisons of fish species composition andspecies relative abundance data sampled from each cumulative set of
mesohabitats was performed by calculating the Bray–Curtis similaritybetween the fish assemblage from each successive set of mesohabitatssampled Ni reach and the total fish assemblage NT reach (i.e. Ni reach v.NT reach). These calculations were also undertaken separately for eachfish sampling method. For each fish assemblage attribute (species rich-ness, species composition and species relative abundance) and fishsampling method, we ran the randomised resampling procedure 1000times, calculated Ni reach/N T reach or Ni reach v. NT reach for each resam-ple and calculated the mean and standard deviation (s.d.) for each levelof sampling effort (number of mesohabitats).
Changes in the accuracy (proximity of an estimate to the best esti-mate or true value) of estimates of species richness, species compositionand species relative abundance with each cumulative number of meso-habitats sampled was calculated as the mean (± s.d.) percentage oftotal fish species richness (from all six mesohabitats) or mean (± s.d.)Bray–Curtis similarity with total species composition and species rela-tive abundance respectively. Changes in precision (degree of variationin the estimate) for each cumulative number of mesohabitats sampledwas represented by the coefficient of variation (mean/s.d.) for each fishassemblage attribute (following Kritzer et al. 2001). We examined rela-tionships between sampling effort within stream reaches (i.e. number ofmesohabitat units sampled) and statistical power (1-β) to detect a 20%decrease in the mean (effect size, δ) for fish assemblage data collectedby both single-pass electrofishing and multiple-pass electrofishing plusseine netting. For each level of sampling effort (number of mesohabitats)within stream reaches, we used the pooled mean and standard deviationfrom all stream reaches for power calculations and set the Type I errorrate (α) to 0.05. We substituted a range of values of δ (10–100% in incre-ments of 10) in these analyses but report only for δ = 20% as the trendsfor each fish sampling method with increasing numbers of mesohabitatsamples were similar for each level of 1-β and δ. We also calculated thesample sizes (i.e. number of stream reaches) required to achieve a halfwidth of the confidence interval (Zar 1996) within specified percentages(10–100% in increments of 10) of the estimated true population mean foreach fish assemblage dataset sampled using single-pass electrofishingand multiple-pass electrofishing plus seine netting. For these analy-ses we used a one-sample test based on the pooled mean and standarddeviation from all stream reaches and report only for fish assemblageestimates based on sampling of three mesohabitat units per stream reachas trends for each fish sampling method were similar with each level ofwithin-reach sampling effort (i.e. number of mesohabitat samples).
Longitudinal accumulation of microhabitat
To establish whether rates of changes in fish assemblage attributesalong stream reaches were associated with longitudinal variation inmicrohabitats used by fish, we examined rates of longitudinal accu-mulation of microhabitat configurations (i.e. particular combinationsof depth, velocity, substrate, in-stream microhabitat structures and bankmicrohabitat structures) along stream reaches. Raw habitat data from therandom point measurements were condensed into five categories eachof depth (0.01–0.25, 0.26–0.50, 0.51–0.75, 0.76–1.0 and >1.0 m) andvelocity (0.01–0.25, 0.26–0.50, 0.51–0.75, 0.76–1.0 and >1.0 m s−1).Seven substrate categories, 10 in-stream microhabitat categories andeight bank microhabitat categories were also recognised. The occur-rence of these unique microhabitat categories was treated similarly tothe longitudinal accumulation of fish species. The cumulative numberof microhabitat categories was estimated for each of 1000 resamples ofincrementally increasing numbers of individual random point measure-ments within each stream reach and expressed as a percentage of thetotal number of microhabitat categories within each stream reach. Foreach level of sampling effort (number of random point measurements)the mean and standard deviation of the 1000 resamples were calculated.We performed three separate analyses: one based on the longitudinalaccumulation of physical microhabitat (depth, velocity and substrate

640 Marine and Freshwater Research M. J. Kennard et al.
Tab
le2.
Cha
ract
eris
tics
offi
shsp
ecie
sco
llect
edfr
omm
esoh
abit
ats
inth
eM
ary
Riv
eran
dA
lber
tR
iver
Max
imum
size
s(c
m,s
tand
ard
leng
th)
are
thos
eco
mm
only
atta
ined
byea
chsp
ecie
sin
sout
h-ea
ster
nQ
ueen
slan
dan
dbe
havi
oura
ldes
igna
tion
sre
fer
toth
ose
spec
ies
that
are
bent
hic
(B),
pela
gic
(P)
orfr
eque
ntly
inha
bits
ubm
erge
dve
geta
tion
(SV
)(P
usey
etal
.200
4,M
.J.K
enna
rd,u
npub
lish
edda
ta).
The
rela
tive
abun
danc
ean
dfr
eque
ncy
ofoc
curr
ence
ofea
chsp
ecie
sar
eex
pres
sed
aspe
rcen
tage
sof
the
tota
lnum
ber
offi
shes
coll
ecte
dan
dm
esoh
abit
ats
sam
pled
(n=
1319
9in
divi
dual
san
d46
mes
ohab
itat
sam
ples
resp
ectiv
ely)
.Nat
ive
fish
fam
ilie
sar
ear
rang
edin
appr
oxim
ate
phyl
ogen
etic
orde
r(a
fter
Pus
eyet
al.2
004)
and
alie
nsp
ecie
sar
ede
note
dby
A.A
llfi
shil
lust
rati
ons
byB
.J.P
usey
exce
ptC
.car
pio
(Ped
roT.
Esc
uder
o,M
inda
nao
Sta
teU
nive
rsit
y,P
hili
ppin
es),
and
G.h
olbr
ooki
and
X.h
elle
ri(s
ourc
edfr
omht
tp:/
/ww
w2.
dpi.q
ld.g
ov.a
u/ex
tra/
aqua
tici
nvad
ers/
add_
noxi
ous_
noni
ndig
enou
s.ht
ml,
veri
fied
Aug
ust2
006)
Spe
cies
Siz
eB
ehav
iour
Rel
ativ
eFr
eque
ncy
ofS
peci
esS
ize
Beh
avio
urR
elat
ive
Freq
uenc
yof
(cm
)ab
unda
nce
occu
rren
ce(c
m)
abun
danc
eoc
curr
ence
(%)
(%)
(%)
(%)
Ang
uill
idae
Tera
pont
idae
Ang
uill
are
inha
rdti
i10
0B
4.65
91.3
Lei
opot
hera
pon
unic
olor
15P
0.10
8.7
A.a
ustr
alis
50B
0.04
4.3
Apo
goni
dae
Glo
ssam
iaap
rion
9S
V0.
098.
7
Plo
tosi
dae
Tand
anus
tand
anus
50B
1.76
78.3
Ele
otri
dae
Neo
silu
rus
hyrt
lii
30B
0.08
4.3
Gob
iom
orph
usau
stra
lis
12B
1.29
13.0
G.c
oxii
12B
0.04
2.2
Ret
ropi
nnid
aeR
etro
pinn
ase
mon
i6
P21
.90
78.3
Hyp
sele
otri
sco
mpr
essa
7B
5.00
13.0
Ath
erin
idae
Cra
tero
ceph
alus
mar
jori
ae5
P11
.08
71.7
C.s
terc
usm
usca
rum
5P
2.06
28.3
H.g
alii
4B
5.65
60.9
H.k
lunz
inge
ri4
B6.
3350
.0
Mel
anot
aeni
idae
Mel
anot
aeni
adu
boul
ayi
6P
14.8
080
.4M
ogur
nda
adsp
ersa
8B
1.05
28.3
Phi
lypn
odon
sp.
4B
0.67
28.3
Pse
udom
ugil
idae
Psu
edom
ugil
sign
ifer
3S
V13
.27
69.6
Sco
rpae
nida
eP.
gran
dice
ps7
B1.
2634
.8
Not
esth
esro
bust
a20
B0.
086.
5
Cha
ndid
ae
Cyp
rini
dae
Cyp
rinu
sca
rpio
A40
P0.
108.
7
Am
bass
isag
assi
zii
5S
V3.
5734
.8
A.m
aria
nus
6S
V0.
362.
2
Poec
ilii
dae
Gam
busi
aho
lbro
okiA
4S
V2.
7939
.1
Xip
hoph
orus
hell
eriA
6S
V1.
9815
.2

Estimating local stream fish assemblage attributes Marine and Freshwater Research 641
Table 3. Spearman’s rank correlation coefficients between measures of sampling effort (total sampling duration and percentageof total sampling time spent on the first electrofishing pass), electrofishing efficiency (percentage of total fish catch collected on
the first electrofishing pass) and the physical, chemical and biological attributes of the study sitesAll mesohabitat samples were included in analyses (n = 46 samples). Correlation coefficients shown in bold type are significant
at P < 0.05 after correction for multiple comparisons using the Dunn–Sidak procedure (Quinn and Keough 2002)
Sampling effort Electrofishing efficiency
Total sampling 1st electrofishing Total species Total Species Species relativeduration pass richness abundance composition abundance
Sampling effort1st electrofishing pass 0.62
Site dimensionsSite length 0.22 0.22 −0.20 −0.05 −0.19 0.02Site area 0.56 0.55 −0.14 −0.09 −0.13 −0.27Site volume 0.53 0.52 −0.19 −0.06 −0.19 −0.36
Site physical characteristicsMean wetted width 0.22 0.42 −0.15 −0.09 −0.16 −0.39Mean depth 0.27 0.36 −0.12 −0.02 −0.12 −0.28Mean velocity −0.23 −0.24 0.17 −0.05 0.16 0.22
Site water qualityTurbidity 0.11 0.26 0.24 0.22 0.23 0.10Conductivity −0.21 0.03 −0.20 0.10 −0.20 −0.20Temperature −0.31 0.06 −0.38 −0.14 −0.38 −0.32
Site biological characteristicsTotal species richness 0.23 0.21 −0.34 0.00 −0.33 −0.37Total abundance 0.46 0.41 0.09 −0.01 0.10 −0.13
categories), one based on the accumulation of in-stream microhabitatcategories, and one based on the accumulation of bank microhabitatcategories. Mixed linear model analysis was performed using the SPSSstatistical software package (SPSS 1999) and all other analyses werepreformed using S-PLUS 2000 (Statistical Sciences 1999).
Results
Spatial variation in physical and water qualitycharacteristics
Sites sampled in each river were generally similar in size andencompassed the same range of physical and water qualityconditions, and no significant difference between rivers wasobserved for any physical and water quality characteristics(P > 0.05, Table 1). Significant differences between meso-habitat types (nested within river) was observed with riffles,runs and pools varying significantly in terms of wetted width,mean depth and mean velocity (P < 0.05, Table 1).
Sampling effort and efficiency within mesohabitats
The total time taken to sample discrete mesohabitat unitsusing an electrofisher averaged 50 min; this equated to∼900 selectrofisher ‘power on’ time. On average, 50% of the totalsampling time was spent on the first electrofishing passand 95% of the total sampling time was spent on the firstthree passes. Both total time spent electrofishing, and timespent on the first electrofishing pass, were positively corre-lated (though often only weakly) with the size of the studysites (area and volume) and the total number of individuals
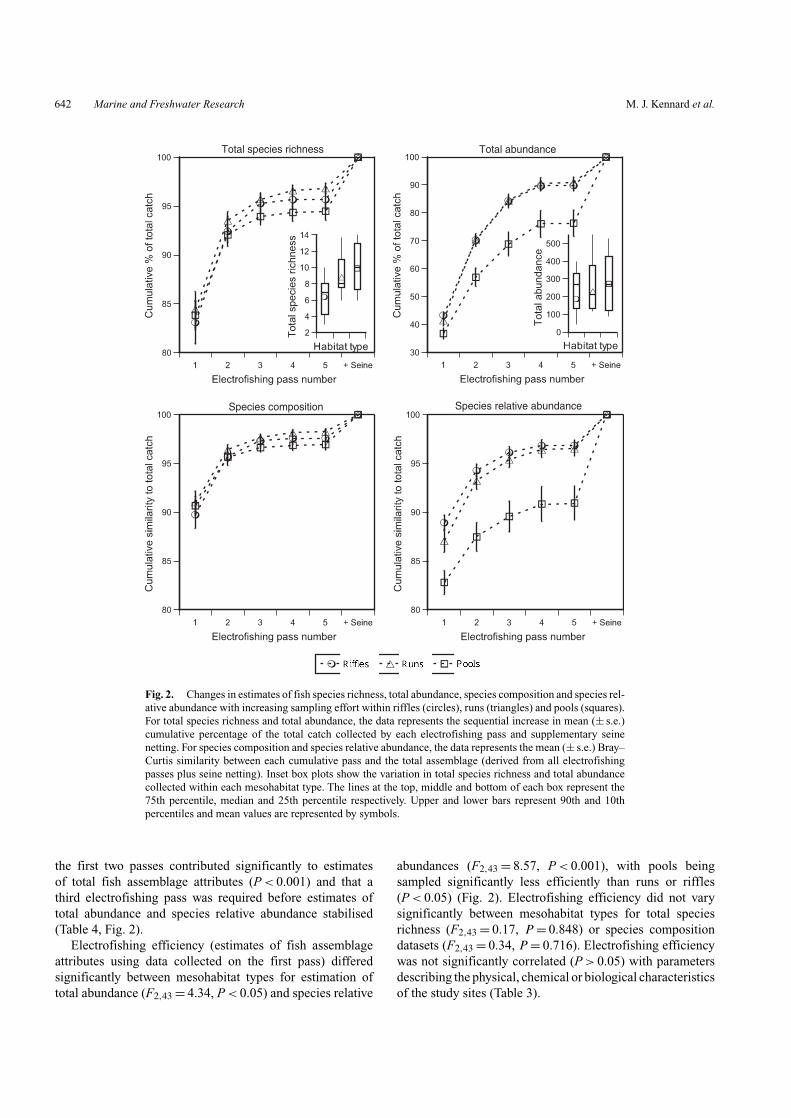
present, but not with variables describing the physical char-acteristics (except mean wetted width) or water quality ofthe study sites (Table 3). Riffles, runs and pools differedsignificantly in the mean total number of species (P < 0.01)and total number of individuals (P < 0.05), with pools con-taining the highest number of species and individuals onaverage (F2,43 = 6.56 and F2,43 = 4.92 for one-way ANOVAsof between-mesohabitat type comparisons of mean speciesrichness and mean total abundance respectively) (Fig. 2).
Up to 85% of the total number of species present wereusually collected from a single electrofishing pass and onaverage, seine netting following electrofishing accounted forless than ∼5% of the total number of species (Fig. 2). Lessthan 45% of the total number of individuals was collectedon the first electrofishing pass and seine netting accountedfor between 10 and 30% of individuals. Comparatively moresampling effort (electrofishing passes and seine netting) wasrequired to accurately estimate species relative abundancethan species composition, and this was consistent acrossmesohabitat types (Fig. 2).
Mixed linear model analysis revealed a significant maineffect of electrofishing pass for analyses of total speciesrichness, total abundance, species composition and speciesrelative abundance datasets (P < 0.001), and significanteffects of mesohabitat type nested within river for anal-yses of total abundance and species relative abundancedatasets (Table 4, Fig. 2). Multiple comparisons between thenth cumulative pass and the total assemblage estimated byelectrofishing indicated that for each fish assemblage dataset,
642 Marine and Freshwater Research M. J. Kennard et al.
Total species richness Total abundance
Species composition Species relative abundance
Fig. 2. Changes in estimates of fish species richness, total abundance, species composition and species rel-ative abundance with increasing sampling effort within riffles (circles), runs (triangles) and pools (squares).For total species richness and total abundance, the data represents the sequential increase in mean (± s.e.)cumulative percentage of the total catch collected by each electrofishing pass and supplementary seinenetting. For species composition and species relative abundance, the data represents the mean (± s.e.) Bray–Curtis similarity between each cumulative pass and the total assemblage (derived from all electrofishingpasses plus seine netting). Inset box plots show the variation in total species richness and total abundancecollected within each mesohabitat type. The lines at the top, middle and bottom of each box represent the75th percentile, median and 25th percentile respectively. Upper and lower bars represent 90th and 10thpercentiles and mean values are represented by symbols.
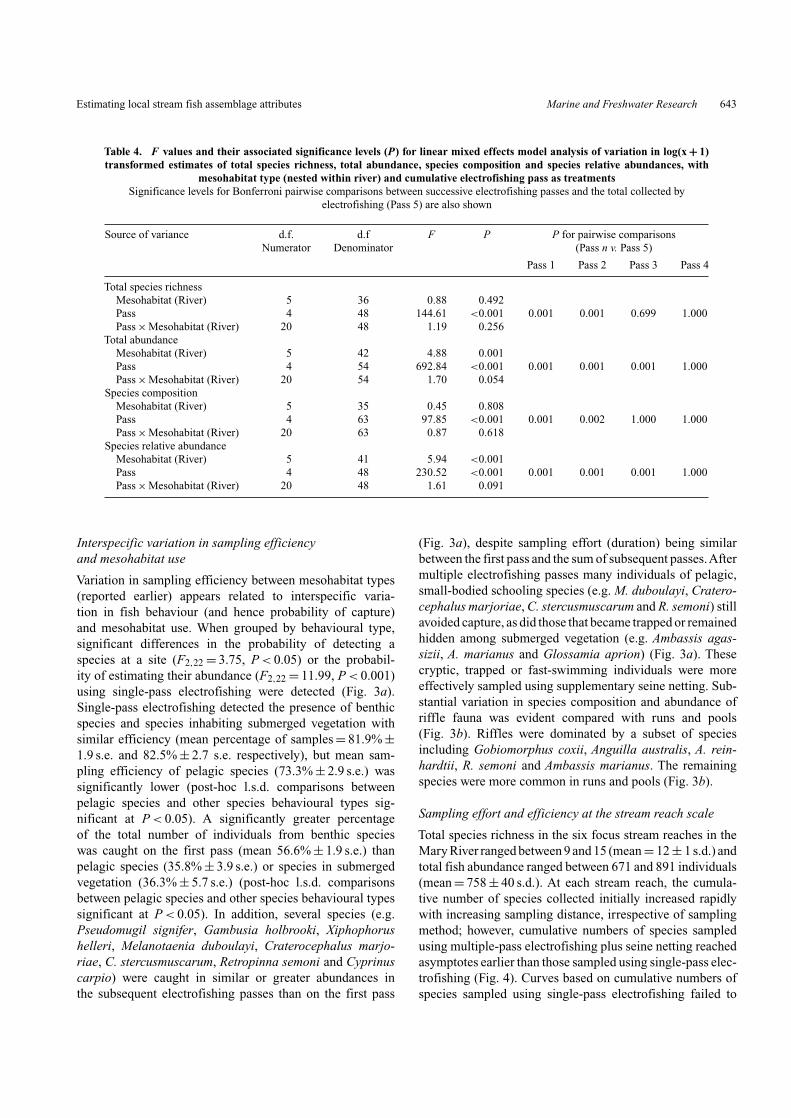
the first two passes contributed significantly to estimatesof total fish assemblage attributes (P < 0.001) and that athird electrofishing pass was required before estimates oftotal abundance and species relative abundance stabilised(Table 4, Fig. 2).
Electrofishing efficiency (estimates of fish assemblageattributes using data collected on the first pass) differedsignificantly between mesohabitat types for estimation oftotal abundance (F2,43 = 4.34, P < 0.05) and species relative
abundances (F2,43 = 8.57, P < 0.001), with pools beingsampled significantly less efficiently than runs or riffles(P < 0.05) (Fig. 2). Electrofishing efficiency did not varysignificantly between mesohabitat types for total speciesrichness (F2,43 = 0.17, P = 0.848) or species compositiondatasets (F2,43 = 0.34, P = 0.716). Electrofishing efficiencywas not significantly correlated (P > 0.05) with parametersdescribing the physical, chemical or biological characteristicsof the study sites (Table 3).
sto223
Text Box
Pools
sto223
Text Box
Runs
sto223
Text Box
Riffles
sto223
Rectangle
sto223
Rectangle
sto223
Rectangle
Estimating local stream fish assemblage attributes Marine and Freshwater Research 643
Table 4. F values and their associated significance levels (P) for linear mixed effects model analysis of variation in log(x + 1)transformed estimates of total species richness, total abundance, species composition and species relative abundances, with
mesohabitat type (nested within river) and cumulative electrofishing pass as treatmentsSignificance levels for Bonferroni pairwise comparisons between successive electrofishing passes and the total collected by
electrofishing (Pass 5) are also shown
Source of variance d.f. d.f F P P for pairwise comparisonsNumerator Denominator (Pass n v. Pass 5)
Pass 1 Pass 2 Pass 3 Pass 4
Total species richnessMesohabitat (River) 5 36 0.88 0.492Pass 4 48 144.61 <0.001 0.001 0.001 0.699 1.000Pass × Mesohabitat (River) 20 48 1.19 0.256
Total abundanceMesohabitat (River) 5 42 4.88 0.001Pass 4 54 692.84 <0.001 0.001 0.001 0.001 1.000Pass × Mesohabitat (River) 20 54 1.70 0.054
Species compositionMesohabitat (River) 5 35 0.45 0.808Pass 4 63 97.85 <0.001 0.001 0.002 1.000 1.000Pass × Mesohabitat (River) 20 63 0.87 0.618
Species relative abundanceMesohabitat (River) 5 41 5.94 <0.001Pass 4 48 230.52 <0.001 0.001 0.001 0.001 1.000Pass × Mesohabitat (River) 20 48 1.61 0.091
Interspecific variation in sampling efficiencyand mesohabitat use
Variation in sampling efficiency between mesohabitat types(reported earlier) appears related to interspecific varia-tion in fish behaviour (and hence probability of capture)and mesohabitat use. When grouped by behavioural type,significant differences in the probability of detecting aspecies at a site (F2,22 = 3.75, P < 0.05) or the probabil-ity of estimating their abundance (F2,22 = 11.99, P < 0.001)using single-pass electrofishing were detected (Fig. 3a).Single-pass electrofishing detected the presence of benthicspecies and species inhabiting submerged vegetation withsimilar efficiency (mean percentage of samples = 81.9% ±1.9 s.e. and 82.5% ± 2.7 s.e. respectively), but mean sam-pling efficiency of pelagic species (73.3% ± 2.9 s.e.) wassignificantly lower (post-hoc l.s.d. comparisons betweenpelagic species and other species behavioural types sig-nificant at P < 0.05). A significantly greater percentageof the total number of individuals from benthic specieswas caught on the first pass (mean 56.6% ± 1.9 s.e.) thanpelagic species (35.8% ± 3.9 s.e.) or species in submergedvegetation (36.3% ± 5.7 s.e.) (post-hoc l.s.d. comparisonsbetween pelagic species and other species behavioural typessignificant at P < 0.05). In addition, several species (e.g.Pseudomugil signifer, Gambusia holbrooki, Xiphophorushelleri, Melanotaenia duboulayi, Craterocephalus marjo-riae, C. stercusmuscarum, Retropinna semoni and Cyprinuscarpio) were caught in similar or greater abundances inthe subsequent electrofishing passes than on the first pass
(Fig. 3a), despite sampling effort (duration) being similarbetween the first pass and the sum of subsequent passes.Aftermultiple electrofishing passes many individuals of pelagic,small-bodied schooling species (e.g. M. duboulayi, Cratero-cephalus marjoriae, C. stercusmuscarum and R. semoni) stillavoided capture, as did those that became trapped or remainedhidden among submerged vegetation (e.g. Ambassis agas-sizii, A. marianus and Glossamia aprion) (Fig. 3a). Thesecryptic, trapped or fast-swimming individuals were moreeffectively sampled using supplementary seine netting. Sub-stantial variation in species composition and abundance ofriffle fauna was evident compared with runs and pools(Fig. 3b). Riffles were dominated by a subset of speciesincluding Gobiomorphus coxii, Anguilla australis, A. rein-hardtii, R. semoni and Ambassis marianus. The remainingspecies were more common in runs and pools (Fig. 3b).
Sampling effort and efficiency at the stream reach scale
Total species richness in the six focus stream reaches in theMary River ranged between 9 and 15 (mean = 12 ± 1 s.d.) andtotal fish abundance ranged between 671 and 891 individuals(mean = 758 ± 40 s.d.). At each stream reach, the cumula-tive number of species collected initially increased rapidlywith increasing sampling distance, irrespective of samplingmethod; however, cumulative numbers of species sampledusing multiple-pass electrofishing plus seine netting reachedasymptotes earlier than those sampled using single-pass elec-trofishing (Fig. 4). Curves based on cumulative numbers ofspecies sampled using single-pass electrofishing failed to

644 Marine and Freshwater Research M. J. Kennard et al.
(a) Sampling efficiency (b) Mesohabitat use
A. r
einh
ardt
iiH
. klu
nzin
geri
M. a
dspe
rsa
H. g
alii
G. a
ustra
lisH
. com
pres
saP
. gra
ndic
eps
T. ta
ndan
usG
. cox
iiP
hily
pnod
on s
p.A
. aus
tralis
N. r
obus
ta
P. s
igni
fer
G. h
olbr
ooki
G. a
prio
nX
. hel
leri
A. a
gass
izii
A. m
aria
nus
M. d
ubou
layi
C. s
terc
usR
. sem
oni
L. u
nico
lor
C. c
arpi
o
G. c
oxii
A. a
ustra
lisR
. sem
oni
A. m
aria
nus
A. r
einh
ardt
iiH
. com
pres
saL.
uni
colo
rC
. mar
joria
eN
. rob
usta
P. s
igni
fer
C. s
terc
usM
. dub
oula
yiT.
tand
anus
G. a
ustra
lisH
. klu
nzin
geri
G. h
olbr
ooki
X. h
elle
riG
. apr
ion
Phi
lypn
odon
sp.
H. g
alii
A. a
gass
izii
P. g
rand
icep
sN
. hyr
tlii
M. a
dspe
rsa
C. c
arpi
o
N. h
yrtli
i
C. m
arjo
riae
Species Species
Fig. 3. Interspecific variation in (a) sampling efficiency and (b) mesohabitat use. Sampling efficiency for each species (grouped by behaviouraltype) is defined as the probability of capture (as assessed by the frequency of occurrence in mesohabitats) and percentage of total catch (relativeabundance) sampled by single-pass electrofishing, multiple-pass electrofishing and supplementary seine netting. Mesohabitat use (based on thetotal catch) is indicated by the frequency of occurrence and relative abundance of each species occurring in riffles, runs or pools. Sample sizes(number of mesohabitats or number of individuals) for each species can be calculated using the data presented in Table 2.

Estimating local stream fish assemblage attributes Marine and Freshwater Research 645
4
6
8
10
12
14
1 2 3 4 5 6
Length of stream sampled (number of mesohabitats)1 2 3 4 5 6
5 10 15 20 25 305 10 15 20 25 30
Length of stream sampled (number of stream widths)
(a) Single electrofishing pass (b) Multiple electrofishing passesplus seine netting
Mea
n cu
mul
ativ
e sp
ecie
s ric
hnes
s
Fig. 4. Mean cumulative species richness v. length of stream sampled using (a) single-pass electrofishingand (b) multiple-pass electrofishing plus seine netting in each of the six stream reaches. Reach numbersmatch those given in Fig. 1. Estimates of mean species richness for each sampling interval (cumulativenumber of mesohabitats) were based on 1000 bootstrapped randomisations that incrementally constructedhypothetical series of mesohabitat units. For clarity, standard deviations are not shown.
reach an asymptote in most stream reaches and total num-bers of species sampled (after six mesohabitats) were oftenmuch lower than the true number of species present (asdetermined from multiple-pass electrofishing plus seine net-ting). Sampling in stream reaches with relative high totalspecies richness tended to accumulate species more slowlythan sampling in stream reaches with fewer species (Fig. 4).
The accuracy and precision of reach-scale estimates oftotal species richness, species composition and species rela-tive abundances increased with increasing stream length andhence number of mesohabitat units sampled (using both sam-pling methods) (Fig. 5). For a given level of sampling effort(number of mesohabitats), the accuracy and precision of esti-mates of fish assemblage attributes were lower for single-passelectrofishing in comparison to multiple-pass electrofish-ing plus seine netting (Fig. 5). For example, single-passelectrofishing of three mesohabitats equivalent to 15 MSWresulted in estimates of mean accuracy for the three fishassemblage attributes between 75 and 85% and estimates ofprecision between 0.10 and 0.16 (Fig. 5a). Multiple-pass elec-trofishing plus seine netting of three mesohabitats resultedin comparably higher levels of accuracy and precision ofthese attributes (accuracy = 86–97% and precision = 0.04–0.09) (Fig. 5b). To gain equivalent levels of accuracy andprecision, at least double the length of stream needed to besampled by single-pass electrofishing than by more inten-sive sampling using multiple-pass electrofishing plus seine
netting.To estimate total species richness and species compo-sition with an accuracy of 90% and precision of 0.1, samplingof three to six mesohabitats was required using single-passelectrofishing v. between one and three mesohabitats usingmore intensive fish sampling (Fig. 5). Even after samplingof six mesohabitats, species relative abundances could notbe estimated to this level of accuracy and precision usingsingle-pass electrofishing.
Estimates of species composition were comparativelymore accurate and precise, for a given number of mesohabitatsamples, than estimates of total species richness and speciesrelative abundance for both sampling protocols (Fig. 5). Themajority of species were numerically rare (i.e. 16 of 19species individually formed less than 10% of the total abun-dance on average as estimated by multiple-pass electrofishingplus seine netting) but ubiquitous (i.e. usually present in twoor more mesohabitats per stream reach on average). Con-sequently, it took comparably less sampling effort to detectthe presence of a species in a stream reach and therefore toaccurately and precisely estimate species composition thanit did to estimate their relative abundances (which variedmarkedly between mesohabitat types, see Fig. 3b). Becauseestimates of total species richness give equal weighting to dis-continuous and ubiquitous species, accumulations of speciesare strongly influenced by discontinuously distributed (i.e.patchy) species. This led to less precise estimates of totalspecies richness in comparison to multivariate estimates of

646 Marine and Freshwater Research M. J. Kennard et al.
L
(a) Single electrofishing pass (b) Multiple electrofishing passesplus seine netting
Fig. 5. Change in average sampling accuracy (± s.d.) and average precision v. length of stream sampledusing (a) single-pass electrofishing and (b) multiple-pass electrofishing plus seine netting to estimate totalfish species richness (circles), species composition (triangles) and species relative abundance (squares).Accuracy for each cumulative number of mesohabitats sampled is represented by the mean (± s.d.) per-centage of total fish species richness or mean (± s.d.) Bray–Curtis similarity with total species compositionand species relative abundance respectively. Precision for each cumulative number of mesohabitats sampledis represented by the coefficient of variation (mean/s.d.). Estimates of accuracy and precision were basedon 1000 bootstrapped randomisations that incrementally constructed hypothetical series of mesohabitatunits. Results are averaged across six sampled stream reaches in the Mary River. Dashed lines facilitatecomparison between sampling methods for two levels of accuracy and precision.
fish assemblage composition, which were less sensitive topatchily distributed species (Fig. 5b).
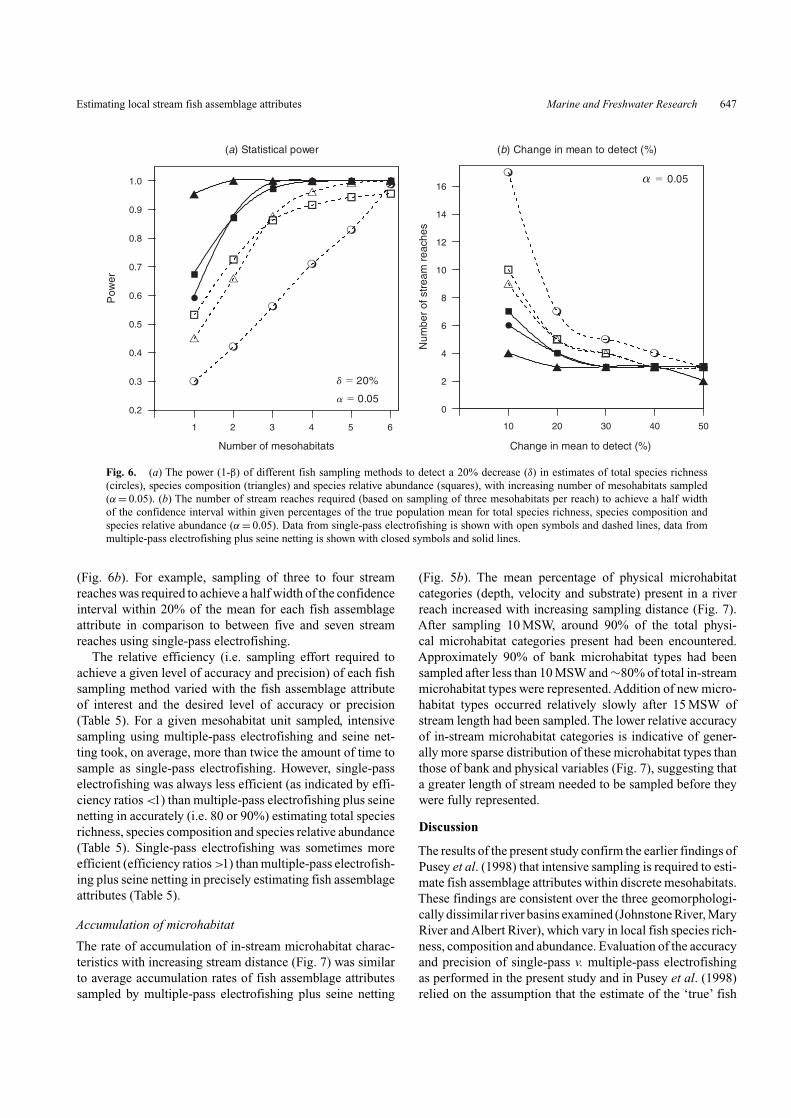
For an equivalent level of sampling effort (number ofmesohabitats), the power to detect a 20% decrease in themean of estimates of fish assemblage attributes was higherfor multiple-pass electrofishing plus seine netting in com-parison to single-pass electrofishing (Fig. 6a). Sampling ofthree mesohabitats yielded a power (1-β) greater than 0.95
using multiple-pass electrofishing plus seine netting whereassampling of six mesohabitat units was required to achievecomparable levels of power using single-pass electrofish-ing. Multiple-pass electrofishing plus seine netting of threemesohabitat units also yielded more precise estimates of fishassemblage attributes and so fewer stream reaches needed tobe sampled to achieve a half width of the confidence inter-val within given percentages of the true population mean
Estimating local stream fish assemblage attributes Marine and Freshwater Research 647
0.2
0.3
0.4
0.5
0.6
0.7
0.8
0.9
1.0
1 2 3 4 5 6
Number of mesohabitats
0
2
4
6
8
10
12
14
16
10 20 30 40 50
Change in mean to detect (%)
(a) Statistical power (b) Change in mean to detect (%)
d � 20%
a � 0.05
a � 0.05
Pow
er
Num
ber
of s
trea
m r
each
es
Fig. 6. (a) The power (1-β) of different fish sampling methods to detect a 20% decrease (δ) in estimates of total species richness(circles), species composition (triangles) and species relative abundance (squares), with increasing number of mesohabitats sampled(α = 0.05). (b) The number of stream reaches required (based on sampling of three mesohabitats per reach) to achieve a half widthof the confidence interval within given percentages of the true population mean for total species richness, species composition andspecies relative abundance (α = 0.05). Data from single-pass electrofishing is shown with open symbols and dashed lines, data frommultiple-pass electrofishing plus seine netting is shown with closed symbols and solid lines.
(Fig. 6b). For example, sampling of three to four streamreaches was required to achieve a half width of the confidenceinterval within 20% of the mean for each fish assemblageattribute in comparison to between five and seven streamreaches using single-pass electrofishing.
The relative efficiency (i.e. sampling effort required toachieve a given level of accuracy and precision) of each fishsampling method varied with the fish assemblage attributeof interest and the desired level of accuracy or precision(Table 5). For a given mesohabitat unit sampled, intensivesampling using multiple-pass electrofishing and seine net-ting took, on average, more than twice the amount of time tosample as single-pass electrofishing. However, single-passelectrofishing was always less efficient (as indicated by effi-ciency ratios <1) than multiple-pass electrofishing plus seinenetting in accurately (i.e. 80 or 90%) estimating total speciesrichness, species composition and species relative abundance(Table 5). Single-pass electrofishing was sometimes moreefficient (efficiency ratios >1) than multiple-pass electrofish-ing plus seine netting in precisely estimating fish assemblageattributes (Table 5).
Accumulation of microhabitat
The rate of accumulation of in-stream microhabitat charac-teristics with increasing stream distance (Fig. 7) was similarto average accumulation rates of fish assemblage attributessampled by multiple-pass electrofishing plus seine netting
(Fig. 5b). The mean percentage of physical microhabitatcategories (depth, velocity and substrate) present in a riverreach increased with increasing sampling distance (Fig. 7).After sampling 10 MSW, around 90% of the total physi-cal microhabitat categories present had been encountered.Approximately 90% of bank microhabitat types had beensampled after less than 10 MSW and ∼80% of total in-streammicrohabitat types were represented. Addition of new micro-habitat types occurred relatively slowly after 15 MSW ofstream length had been sampled. The lower relative accuracyof in-stream microhabitat categories is indicative of gener-ally more sparse distribution of these microhabitat types thanthose of bank and physical variables (Fig. 7), suggesting thata greater length of stream needed to be sampled before theywere fully represented.
Discussion
The results of the present study confirm the earlier findings ofPusey et al. (1998) that intensive sampling is required to esti-mate fish assemblage attributes within discrete mesohabitats.These findings are consistent over the three geomorphologi-cally dissimilar river basins examined (Johnstone River, MaryRiver and Albert River), which vary in local fish species rich-ness, composition and abundance. Evaluation of the accuracyand precision of single-pass v. multiple-pass electrofishingas performed in the present study and in Pusey et al. (1998)relied on the assumption that the estimate of the ‘true’ fish

648 Marine and Freshwater Research M. J. Kennard et al.
Table 5. Relative sampling efficiency (efficiency ratio) of single-pass electrofishing v. multiple-pass electrofishing plusseine netting to achieve a desired accuracy (80 and 90%) and precision (0.2 and 0.1) in estimating total species richness,
species composition and species relative abundance in a river reachThe number of mesohabitat units required to achieve the prescribed accuracy and precision levels were obtained from Fig. 5.
Total mean sampling duration was estimated by multiplying the number of mesohabitat units by the sampling time required by atwo or three person crew to collect, identify and enumerate fish using single-pass electrofishing (mean 23 min per mesohabitat)
or multiple (three) pass electrofishing (mean 45 min) plus seine netting (estimated as 10 min per site). Efficiency ratios werecalculated by dividing the total mean sampling duration of single-pass electrofishing by the duration of multiple-pass
electrofishing plus seine netting. Note that single-pass electrofishing did not estimate species richness or relative abundance toan accuracy of 90% after the maximum of six sampled mesohabitats (Fig. 5a) so efficiency ratios could not calculated
Number of mesohabitats Total mean sampling Efficiency ratiorequired duration
Accuracy = >80% >90% >80% >90% >80% >90%Species richness
Single pass 5 >6 115 – 0.96 –Multiple passes + seine netting 2 2 110 110
Species compositionSingle pass 3 5 69 115 0.80 0.48Multiple passes + seine netting 1 1 55 55
Species relative abundanceSingle pass 5 >6 115 – 0.96 –Multiple passes + seine netting 2 5 110 275
Precision = <0.2 <0.1 <0.2 <0.1 <0.2 <0.1Species richness
Single pass 3 5 69 115 0.80 1.43Multiple passes + seine netting 1 3 55 165
Species compositionSingle pass 1 3 23 69 2.39 0.80Multiple passes + seine netting 1 1 55 55
Species relative abundanceSingle pass 1 4 23 92 2.39 1.79Multiple passes + seine netting 1 3 55 165
assemblage based on multiple-pass electrofishing plus seinenetting was accurate, particularly in terms of species abun-dances. Although maximum likelihood estimation methodsare available to estimate species’ total population sizes basedon removal sampling (e.g. Zippin 1956; Otis et al. 1978),these methods have several restrictive assumptions that areoften violated (Riley and Fausch 1992; Riley et al. 1993;Peterson et al. 2004) and can result in overestimates of speciescapture efficiencies and underestimates of fish populationsizes (Peterson et al. 2004). The main goal of our studywas to develop a sampling program able to monitor andcompare variation in fish assemblage attributes (species rich-ness, species composition and relative abundances), and notnecessarily to estimate absolute population sizes.
Changes in catchability of some fish species exposed toan electrical current during previous electrofishing passes(Cross and Stott 1975; Bohlin et al. 1989; Mesa and Schreck1989; Riley et al. 1993; Peterson et al. 2004) has the poten-tial to bias estimates of fish species relative abundancesbased on multiple-pass electrofishing. Reductions in gal-vanotaxic responses of fish with increases in the number oftimes an individual has been shocked reportedly contributes
to reductions in catchability of some cyprinids, salmonids andanguillids (Chmielewski et al. 1973; Cross and Stott 1975),with the refractory period in cyprinids thought to last between3 and 24 h (Cross and Stott 1975).The extent to which speciescollected in our study experienced a refractory effect fromrepeated electroshocking is unknown. If some species wereless catchable on subsequent electrofishing passes, it is pos-sible that our estimates of species relative abundances froma single pass were more accurate than estimates from mul-tiple electrofishing passes plus seine netting. However, ourdata do not support this for several reasons. Galvanotaxicresponses to electroshocking for all species collected in thepresent study (with the usual exception ofAnguilla spp.) wererarely observed (i.e. fish usually did not swim, or could notbe drawn, towards the anode ring). The usual response bymost fish was immobilisation on the stream bottom or erraticswimming behaviour (but rarely towards the anode) requir-ing vigorous and rapid sweepings of the anode pole net andthe assistance of dip-netters to capture these fish. Moreover,several species were caught in similar or greater abundancesin the subsequent electrofishing passes than on the first pass,despite sampling effort being similar between the first pass

Estimating local stream fish assemblage attributes Marine and Freshwater Research 649
0
20
40
0
20
40
60
0
10
20
0
10
20
30
0
10
20
30
Depth (m) Velocity(m s�1)
Substrate
Bankhabitat
In-streamhabitat
20
40
60
80
100
0 5 10 15 20 25 30
Length of stream sampled (number of stream widths)
Depth, velocity, substrate
Bank microhabitat
In-stream microhabitat
Num
ber
of m
icro
habi
tat c
ateg
orie
s (%
of t
otal
)
Mud
San
dF
ine
grav
elC
oars
e gr
avel
Cob
bles
Roc
ksB
edro
ck
Fre
quen
cy(%
of s
ampl
es)
Fre
quen
cy(%
of s
ampl
es)
Mac
roph
ytes
Mac
roph
ytes
Leaf
litte
r
Leaf
litte
rO
verh
angi
ng v
eg
Ove
rhan
ging
veg
Sub
mer
ged
veg
Sub
mer
ged
veg
Em
erge
nt v
eg
Em
erge
nt v
egLa
rge
woo
dS
mal
l woo
d
Larg
e w
ood
Sm
all w
ood
Und
ercu
t ban
ksR
oot m
asse
s
Alg
ae
Alg
ae
Fig. 7. Cumulative increases in the mean percentage (± s.d.) of the total number of microhabitat types encountered in streamreaches v. length of stream sampled (expressed as number of mean stream widths). Separate curves are shown for depth, velocity andsubstrate categories, and for bank microhabitat and in-stream microhabitat categories. Means were generated using 1000 bootstrappedrandomisations that incrementally constructed hypothetical combinations of microhabitat categories from observed samples andaveraged over the six stream reaches. Frequency histograms of the number of habitat sampling points within each microhabitatcategory used in the analyses are also shown.
and the sum of subsequent passes, suggesting that fish werenot necessarily less catchable after being electroshocked.
Reductions in capture efficiency with each electrofishingpass may also arise because fish avoid capture by concealmentin areas that are difficult to sample (e.g. coarse substrates,aquatic macrophyte beds and undercut banks), or by activelyswimming to avoid the anode (Peterson et al. 2004). Fishesthat are already concealed within such microhabitat refugesmay, however, require repeated electroshocking episodesbefore they emerge from cover and can be captured. Wehave regularly observed this phenomenon with large speciessuch as plotosids (Tandanus tandanus and Neosilurus hyrtlii),anguillids (A. reinhardtii and A. australis) and some eleotrids(e.g. Philypnodon grandiceps), which commonly take refugein deep undercut banks (Pusey et al. 2004) and often onlyemerge from these areas after repeated shocking over sev-eral electrofishing passes. The present study did clearly show,however, that species differed in their susceptibility to cap-ture by electrofishing (Fig. 3a; see also Kennard 2005). Thiseffect should yield estimates of species relative abundancesbiased towards those most easily caught by electrofishing(primarily benthic species and some small-bodied nativeand alien species commonly found in submerged marginalvegetation). Our results also indicated that multiple-pass elec-trofishing underestimated abundances of some species that
were more efficiently sampled using seine netting. The onlymeans of evaluating the adequacy of an abundance estimationtechnique is to compare the estimates with known or unbiasedestimates of fish abundance (e.g. by tagging and releasing aknown number of fish in an enclosed area and counting therecapture of tagged fish on each pass) (Peterson et al. 2004).These issues require further research; however, we suggestthat intensive sampling using dual gear (multiple-pass elec-trofishing plus seine netting) should minimise the negativebias of our estimates of species abundances in comparison tosingle-pass electrofishing alone.
Repeated electroshocking episodes undoubtedly increasethe potential to injure fish (see Nielsen (1998) and Sny-der (2003) for recent reviews). Sampling-induced mortality(potentially also caused by seine netting) has obvious neg-ative implications for bioassessment programs that aim toevaluate temporal variation in fish assemblages by repeatedsampling at a study site, or studies in rivers where rare orendangered fish species that are of high conservation signifi-cance are frequently encountered. There is little quantitativedata on immediate or longer-term injury or mortality rates ofAustralian fish species due to electroshocking. Barker et al.(2002) reported that only a very small percentage of fishsuffered injuries and that the incidence of injury was muchless than that caused by more conventional survey capture

650 Marine and Freshwater Research M. J. Kennard et al.
methods. Our own experience supports this and suggests thatshort-term mortality rates for a range of fish species, in arange of eastern Queensland rivers, are generally less than5% (Pusey et al. 1998; M. J. Kennard, unpublished observa-tions). Moreover, on numerous occasions we have retainedfish collected by electrofishing and seine netting, and main-tained them in laboratory aquaria for many months with noobvious mortality due to the sampling procedure.
The site dimensions (area and volume) and number of indi-viduals influenced the amount of time that had to be spentsampling each site, with larger sites containing more fishtaking longer to sample. However, variation in the physi-cal and chemical characteristics of sites did not appear toaffect electrofishing efficiency. The range of variation in thephysico-chemical conditions across the sites sampled in thepresent study (e.g. relatively high conductivity, low turbidityand depth usually less than 1 m) was not such that they wouldbe expected to influence efficiency. Sampling efficiency didvary significantly with mesohabitat type, presumably dueto variation in species composition and relative abundancesbetween riffles, runs and pools, and variation in the catchabil-ity of these species using electrofishing and seine netting.
Our study showed that accurate estimates of assemblageattributes at the reach scale could be obtained from inten-sive sampling using multiple-pass electrofishing plus seinenetting of three mesohabitat units equivalent to 15 MSW(accuracy of species richness, species composition and rel-ative abundances 94, 97 and 86% respectively). Perhaps notsurprisingly, this spatial scale corresponded to the point atwhich longitudinal accumulations of most microhabitat con-figurations present within stream reaches had also stabilised(Fig. 7). This length of stream is generally within the lowerend of the range of stream lengths recommended for sam-pling of fish assemblages in similar studies conducted inNorth American streams and elsewhere (e.g. Kennedy andStrange 1981; Lyons 1992; Hill and Willis 1994; Anger-meier and Smogor 1995; Paller 1995a; Simonson and Lyons1995; Mitro and Zale 2000; Patton et al. 2000; Cao et al.2001; Dauwalter and Pert 2003). For example, Angermeierand Smogor (1995) reported that between five and 14mesohabitats (equivalent to 15–67 MSW) yielded accurate(90%) estimates of species richness and species relativeabundances using two-pass electric seining. Lyons (1992)recommended a minimum of 35 stream widths be sam-pled using single-pass electrofishing to estimate asymptoticspecies richness (although shorter distances were requiredat some sites). Patton et al. (2000) reported that an averageof 22 MSW was required to sample 90% of species usingsingle-pass electrofishing and 38 MSW using single-haulseine netting.
Our study also showed that multiple-pass electrofishingplus seine netting was generally a more efficient samplingstrategy (in terms of time and effort expended) than single-pass electrofishing to accurately estimate fish assemblage
attributes but that single-pass electrofishing was some-times more efficient in precisely estimating fish assem-blage attributes (Table 5). In contrast, Paller (1995a, 1995b)concluded that both accurate and precise estimates oftotal species richness and abundance were more efficientlyobtained by sampling larger areas of stream with a singleelectrofishing pass than by more intensive multiple-pass elec-trofishing of smaller sampling areas. It is difficult to compareestimates of sampling effort and efficiency among studies andbetween geographic regions, and many factors can lead to dif-ferent conclusions regarding optimum sampling protocols.These factors include the objectives of the study, the assem-blage attributes of interest, and the desired level of accuracyand precision in their estimation. Furthermore, variation inlocal species diversity, habitat specificity and patchiness inspecies distributions, physico-chemical characteristics andlocation of the study sites in the stream network, size of thesampling units, intensity of sampling, effectiveness of sam-pling gear, and experience and proficiency of the samplingcrews can influence sampling efficiency (Bohlin et al. 1989;Angermeier and Smogor 1995; Paller 1995a, 1995b; Palleret al. 1996; Pusey et al. 1998; Mitro and Zale 2000; Meadorand McIntyre 2003; Meador et al. 2003; the present study).In streams with very high species diversity and substantialdifferences between species in microhabitat use and habi-tat specificity, as may be the case for some North Americanstreams, greater lengths of stream may need to be sampledin order to collect the majority of species present within thereach. However, streams of south-eastern Queensland, andsouthern Australia in general, are not especially species-rich,nor is microhabitat specialisation so pronounced (Pusey et al.2004) as to result in profound compositional changes withvarying micro- or mesohabitat structure. In contrast, riversand streams in other parts of Australia (e.g. the Wet Trop-ics region of northern Queensland) are characterised by ahigh number of species, many of which are comparativelyrare (Pusey and Kennard 1996; Pusey et al. 2004), and socomparatively greater sampling effort (length of stream) maybe required to describe reach-scale assemblage attributes inthis region.
A major objective of the present study was to evalu-ate the accuracy, precision and efficiency of fish samplingprotocols to estimate reach-scale fish assemblage attributesin wadeable streams and rivers for an ecosystem healthambient monitoring program in south-eastern Queensland.This monitoring program uses ecosystem health indicatorsbased on fish species richness (Kennard et al. 2006b), fishassemblage composition (Kennard et al. 2006a) and therelative abundance of alien species (Kennard et al. 2005),and the use of block seine nets, multiple-pass electrofish-ing plus supplementary seine netting of three mesohabitatunits is the sampling protocol currently used. The presentstudy demonstrates that sampling at this intensity and spa-tial scale provides accurate and precise estimates of these
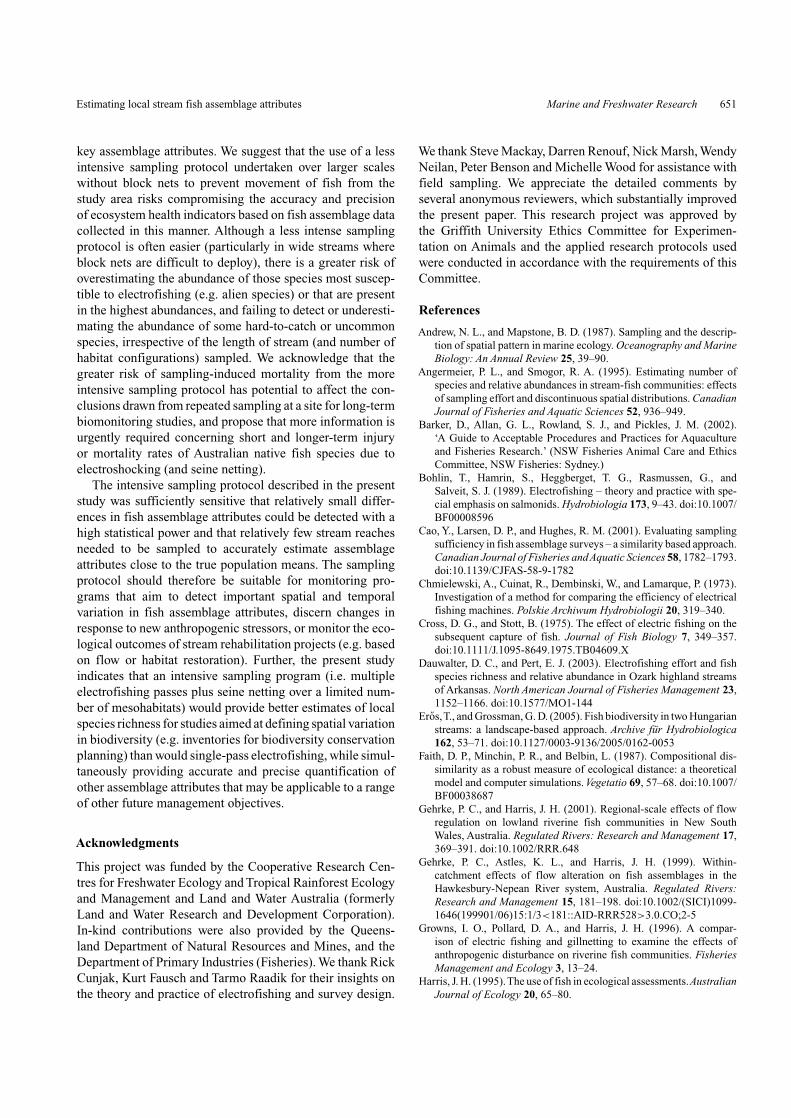
Estimating local stream fish assemblage attributes Marine and Freshwater Research 651
key assemblage attributes. We suggest that the use of a lessintensive sampling protocol undertaken over larger scaleswithout block nets to prevent movement of fish from thestudy area risks compromising the accuracy and precisionof ecosystem health indicators based on fish assemblage datacollected in this manner. Although a less intense samplingprotocol is often easier (particularly in wide streams whereblock nets are difficult to deploy), there is a greater risk ofoverestimating the abundance of those species most suscep-tible to electrofishing (e.g. alien species) or that are presentin the highest abundances, and failing to detect or underesti-mating the abundance of some hard-to-catch or uncommonspecies, irrespective of the length of stream (and number ofhabitat configurations) sampled. We acknowledge that thegreater risk of sampling-induced mortality from the moreintensive sampling protocol has potential to affect the con-clusions drawn from repeated sampling at a site for long-termbiomonitoring studies, and propose that more information isurgently required concerning short and longer-term injuryor mortality rates of Australian native fish species due toelectroshocking (and seine netting).
The intensive sampling protocol described in the presentstudy was sufficiently sensitive that relatively small differ-ences in fish assemblage attributes could be detected with ahigh statistical power and that relatively few stream reachesneeded to be sampled to accurately estimate assemblageattributes close to the true population means. The samplingprotocol should therefore be suitable for monitoring pro-grams that aim to detect important spatial and temporalvariation in fish assemblage attributes, discern changes inresponse to new anthropogenic stressors, or monitor the eco-logical outcomes of stream rehabilitation projects (e.g. basedon flow or habitat restoration). Further, the present studyindicates that an intensive sampling program (i.e. multipleelectrofishing passes plus seine netting over a limited num-ber of mesohabitats) would provide better estimates of localspecies richness for studies aimed at defining spatial variationin biodiversity (e.g. inventories for biodiversity conservationplanning) than would single-pass electrofishing, while simul-taneously providing accurate and precise quantification ofother assemblage attributes that may be applicable to a rangeof other future management objectives.
Acknowledgments
This project was funded by the Cooperative Research Cen-tres for Freshwater Ecology and Tropical Rainforest Ecologyand Management and Land and Water Australia (formerlyLand and Water Research and Development Corporation).In-kind contributions were also provided by the Queens-land Department of Natural Resources and Mines, and theDepartment of Primary Industries (Fisheries). We thank RickCunjak, Kurt Fausch and Tarmo Raadik for their insights onthe theory and practice of electrofishing and survey design.
We thank Steve Mackay, Darren Renouf, Nick Marsh, WendyNeilan, Peter Benson and Michelle Wood for assistance withfield sampling. We appreciate the detailed comments byseveral anonymous reviewers, which substantially improvedthe present paper. This research project was approved bythe Griffith University Ethics Committee for Experimen-tation on Animals and the applied research protocols usedwere conducted in accordance with the requirements of thisCommittee.
References
Andrew, N. L., and Mapstone, B. D. (1987). Sampling and the descrip-tion of spatial pattern in marine ecology. Oceanography and MarineBiology: An Annual Review 25, 39–90.
Angermeier, P. L., and Smogor, R. A. (1995). Estimating number ofspecies and relative abundances in stream-fish communities: effectsof sampling effort and discontinuous spatial distributions. CanadianJournal of Fisheries and Aquatic Sciences 52, 936–949.
Barker, D., Allan, G. L., Rowland, S. J., and Pickles, J. M. (2002).‘A Guide to Acceptable Procedures and Practices for Aquacultureand Fisheries Research.’ (NSW Fisheries Animal Care and EthicsCommittee, NSW Fisheries: Sydney.)
Bohlin, T., Hamrin, S., Heggberget, T. G., Rasmussen, G., andSalveit, S. J. (1989). Electrofishing – theory and practice with spe-cial emphasis on salmonids. Hydrobiologia 173, 9–43. doi:10.1007/BF00008596
Cao, Y., Larsen, D. P., and Hughes, R. M. (2001). Evaluating samplingsufficiency in fish assemblage surveys – a similarity based approach.Canadian Journal of Fisheries andAquatic Sciences 58, 1782–1793.doi:10.1139/CJFAS-58-9-1782
Chmielewski, A., Cuinat, R., Dembinski, W., and Lamarque, P. (1973).Investigation of a method for comparing the efficiency of electricalfishing machines. Polskie Archiwum Hydrobiologii 20, 319–340.
Cross, D. G., and Stott, B. (1975). The effect of electric fishing on thesubsequent capture of fish. Journal of Fish Biology 7, 349–357.doi:10.1111/J.1095-8649.1975.TB04609.X
Dauwalter, D. C., and Pert, E. J. (2003). Electrofishing effort and fishspecies richness and relative abundance in Ozark highland streamsof Arkansas. North American Journal of Fisheries Management 23,1152–1166. doi:10.1577/MO1-144
Eros,T., and Grossman, G. D. (2005). Fish biodiversity in two Hungarianstreams: a landscape-based approach. Archive für Hydrobiologica162, 53–71. doi:10.1127/0003-9136/2005/0162-0053
Faith, D. P., Minchin, P. R., and Belbin, L. (1987). Compositional dis-similarity as a robust measure of ecological distance: a theoreticalmodel and computer simulations. Vegetatio 69, 57–68. doi:10.1007/BF00038687
Gehrke, P. C., and Harris, J. H. (2001). Regional-scale effects of flowregulation on lowland riverine fish communities in New SouthWales, Australia. Regulated Rivers: Research and Management 17,369–391. doi:10.1002/RRR.648
Gehrke, P. C., Astles, K. L., and Harris, J. H. (1999). Within-catchment effects of flow alteration on fish assemblages in theHawkesbury-Nepean River system, Australia. Regulated Rivers:Research and Management 15, 181–198. doi:10.1002/(SICI)1099-1646(199901/06)15:1/3<181::AID-RRR528>3.0.CO;2-5
Growns, I. O., Pollard, D. A., and Harris, J. H. (1996). A compar-ison of electric fishing and gillnetting to examine the effects ofanthropogenic disturbance on riverine fish communities. FisheriesManagement and Ecology 3, 13–24.
Harris, J. H. (1995).The use of fish in ecological assessments.AustralianJournal of Ecology 20, 65–80.

652 Marine and Freshwater Research M. J. Kennard et al.
Harris, J. H., and Gehrke, P. C. (Eds) (1997). ‘Fish and Rivers in Stress:The NSW Rivers Survey.’ (NSW Fisheries Office of Conserva-tion and the Cooperative Research Centre for Freshwater Ecology:Sydney.)
Harris, J. H., and Silveira, R. (1999). Large-scale assessments of riverhealth using an Index of Biotic Integrity with low-diversity fishcommunities. Freshwater Biology 41, 235–252. doi:10.1046/J.1365-2427.1999.00428.X
Hawkins, C. P., Kershner, J. L., Bisson, P. A., Bryant, M. D.,Decker, L. M., et al. (1993). A hierarchical approach to classify-ing stream habitat features. Fisheries 18, 3–12. doi:10.1577/1548-8446(1993)018<0003:AHATCS>2.0.CO;2
Hill, T. D., and Willis, D. W. (1994). Influence of water conductivity onpulsed AC and pulsed DC electrofishing catches for largemouthedbass. North American Journal of Fisheries Management 14, 202–207. doi:10.1577/1548-8675(1994)014<0202:IOWCOP>2.3.CO;2
Holliman, F. M., and Reynolds, J. B. (2003). A predictive risk model forelectroshock-induced mortality of the endangered Cape Fear shiner.North American Journal of Fisheries Management 23, 905–912.doi:10.1577/M02-009
Hughes, R. M. (1995). Defining acceptable biological status by compar-ing with reference conditions. In ‘Biological Assessment and Crite-ria: Tools for Water Resource Planning and Decision Making’. (EdsW. S. Davis and T. P. Simon.) pp. 31–48. (Lewis: Boca Raton, FL.)
Jowett, I. G. (1993). A method for objectively identifying pool, run, andriffle habitats from physical measurements. New Zealand Journal ofMarine and Freshwater Research 27, 241–248.
Kennard, M. J. (2005). A quantitative basis for the use of fish as indi-cators of river health in eastern Australia. Ph.D. Thesis, GriffithUniversity.
Kennard, M. J., Arthington, A. H., Pusey, B. J., and Harch, B. D. (2005).Are alien fish a reliable indicator of river health? Freshwater Biology50, 174–193. doi:10.1111/J.1365-2427.2004.01293.X
Kennard, M. J., Pusey, B. J., Arthington, A. H., Harch, B. D., andMackay, S. J. (2006a). Utility of a multivariate modelling methodfor prediction of freshwater fish assemblages and evaluation of riverhealth. Hydrobiologia. doi:10.1007/S10750-005-0993-8
Kennard, M. J., Harch, B. D., Pusey, B. J., and Arthington, A. H.(2006b). Accurately defining the reference condition for summarybiotic metrics: a comparison of four approaches. Hydrobiologia.doi:10.1007/S10750-005-0998-3
Kennedy, G. J., and Strange, C. D. (1981). Efficiency of electric fishingfor salmonids in relation to river width. Fish Management 12, 55–60.
Kolz, A. L., Reynolds, J. B., Boardman, J., Temple, A., and Lam, D.(Eds) (1998). ‘Principles and Techniques of Electrofishing.’ (U.S.Fish and Wildlife Service National Conservation Training Center:Shepherdstown, WV.)
Kritzer, J. P., Davies, C. R., and Mapstone, B. D. (2001). Charac-terizing fish populations: effects of sample size and populationstructure on the precision of demographic parameter estimates.Canadian Journal of Fisheries andAquatic Sciences 58, 1557–1568.doi:10.1139/CJFAS-58-8-1557
Legendre, P., and Legendre, L. (1998). ‘Numerical Ecology.’ (ElsevierScientific: Amsterdam.)
Lyons, J. (1992).The length of stream to sample with a towed electrofish-ing unit when fish species richness is estimated. North AmericanJournal of Fisheries Management 12, 198–203. doi:10.1577/1548-8675(1992)012<0198:TLOSTS>2.3.CO;2
Maher, W. A., Cullen, P. W., and Norris, R. H. (1994). Frameworkfor designing sampling programs. Environmental Monitoring andAssessment 30, 139–162. doi:10.1007/BF00545619
Martin-Smith, K. M. (1998). Relationships between fishes and habitatin rainforest streams in Sabah, Malaysia. Journal of Fish Biology52, 458–482.
Matthews, W. J. (1998). ‘Patterns in Freshwater Ecology.’ (Chapman &Hall: New York.)
Meador, M. R., and McIntyre, J. P. (2003). Effects of electrofishinggear type on spatial and temporal variability in fish communitysampling. Transactions of the American Fisheries Society 132,709–716. doi:10.1577/T01-135
Meador, M. R., McIntyre, J. P., and Pollock, K. H. (2003). Assessingthe efficacy of single-pass backpack electrofishing to character-ize fish community structure. Transactions of the American Fish-eries Society 132, 39–46. doi:10.1577/1548-8659(2003)132<0039:ATEOSP>2.0.CO;2
Mesa, M. G., and Schreck, C. B. (1989). Electrofishing mark-recaptureand depletion methodologies evoke behavioral and physiologicalchanges in cutthroat trout. Transactions of the American Fish-eries Society 118, 644–658. doi:10.1577/1548-8659(1989)118<
0644:EMADME>2.3.CO;2Mitro, M. G., and Zale, A. V. (2000). Predicting fish abundance using
single-pass removal sampling. Canadian Journal of Fisheries andAquatic Sciences 57, 951–961. doi:10.1139/CJFAS-57-5-951
Moreton Bay Waterways and Catchment Partnership (2002). SouthEast Queensland’s Health Waterways. Available online at:www.healthywaterways.org/ [verified August 2006].
Murray–Darling Basin Commission (2004). Fish theme pilot audit tech-nical report – sustainable rivers audit. MDBC Publication 06/04.Canberra.
Nielsen, J. L. (1998). Scientific sampling effects: electrofishing Califor-nia’s endangered fish populations. Fisheries 23, 6–12. doi:10.1577/1548-8446(1998)023<0006:SSEECE>2.0.CO;2
Norris, R. H., McElravy, E. P., and Resh, V. H. (1992). The samplingproblem. In ‘The Rivers Handbook: Hydrological and EcologicalPrinciples’. (Eds P. Callow and G. E. Petts.) Vol. 1, pp. 282–306.(Blackwell Scientific Publications: Oxford, UK.)
Otis, D. L., Burnham, K. P., Anderson, D. R., and White, G. C. (1978).Statistical inference from capture data on closed populations.Wildlife Monographs 62, 1–135.
Paller, M. H. (1995a). Relationships among number of fish species sam-pled, reach length surveyed, and sampling effort in South Carolinacoastal plain streams. North American Journal of Fisheries Man-agement 15, 110–120. doi:10.1577/1548-8675(1995)015<0110:RANOFS>2.3.CO;2
Paller, M. H. (1995b). Interreplicate variance and statistical powerof electrofishing data from low-gradient streams in the south-eastern United States. North American Journal of Fisheries Man-agement 15, 542–550. doi:10.1577/1548-8675(1995)015<0542:IVASPO>2.3.CO;2
Paller, M. H., Reichert, M. J. M., and Dean, J. M. (1996). Use offish communities to assess environmental impacts in South Car-olina coastal plain streams. Transactions of the American FisheriesSociety 125, 633–644. doi:10.1577/1548-8659(1996)125<0633:UOFCTA>2.3.CO;2
Patton, T. M., Hubert, W. A., Rahel, F. J., and Gerow, K. G. (2000).Effort needed to estimate species richness in small streams on theGreat Plains inWyoming. NorthAmerican Journal of Fisheries Man-agement 20, 394–398. doi:10.1577/1548-8675(2000)020<0394:ENTESR>2.3.CO;2
Peterson, J. T., Thurow, R. F., and Guzevich, J. W. (2004). An evaluationof multipass electrofishing for estimating the abundance of stream-dwelling salmonids. Transactions of the American Fisheries Society133, 462–475. doi:10.1577/03-044
Pusey, B. J., and Kennard, M. J. (1996). Species richness andgeographical variation in assemblage structure of the freshwa-ter fish fauna of the Wet Tropics region of northern Queens-land. Marine and Freshwater Research 47, 563–573. doi:10.1071/MF9960563

Estimating local stream fish assemblage attributes Marine and Freshwater Research 653
Pusey, B. J., Arthington, A. H., and Read, M. G. (1993). Spatial and tem-poral variation in fish assemblage structure in the Mary River, South-east Queensland: the influence of habitat structure. EnvironmentalBiology of Fishes 37, 355–380. doi:10.1007/BF00005204
Pusey, B. J., Kennard, M. J., Arthur, J. M., and Arthington, A. H.(1998). Quantitative sampling of stream fish assemblages: Single-vs multiple-pass electrofishing. Australian Journal of Ecology 23,365–374.
Pusey, B. J., Kennard, M. J., and Arthington, A. H. (2000). Dis-charge variability and the development of predictive models relat-ing stream fish assemblage structure to habitat in north-easternAustralia. Ecology Freshwater Fish 9, 30–50. doi:10.1034/J.1600-0633.2000.90105.X
Pusey, B. J., Kennard, M. J., and Arthington, A. H. (2004). ‘FreshwaterFishes of North-EasternAustralia.’(CSIRO Publishing: Melbourne.)
Quinn, G. P., and Keough, M. J. (2002). ‘Experimental Design and DataAnalysis for Biologists.’ (Cambridge University Press: Cambridge.)
Rapport, D. J., Costanza, R., and McMichael, A. J. (1998). Assess-ing ecosystem health. Trends in Ecology & Evolution 13, 397–402.doi:10.1016/S0169-5347(98)01449-9
Riley, S. C., and Fausch, K. D. (1992). Underestimation of trout popula-tion size by maximum-likelihood removal estimates in small streams.North American Journal of Fisheries Management 12, 768–776.doi:10.1577/1548-8675(1992)012<0768:UOTPSB>2.3.CO;2
Riley, S. C., Haedrich, S. R., and Gibson, R. (1993). Negative bias inremoval estimates of Atlantic salmon parr relative to stream size.Journal of Freshwater Ecology 8, 97–101.
http://www.publish.csiro.au/journals/mfr
Sheldon,A. L. (1984). Cost and precision in a stream sampling program.Hydrobiologia 111, 147–152. doi:10.1007/BF00008627
Simonson, T. D., and Lyons, J. (1995). Comparison of catch per effortand removal procedures for sampling stream fish assemblages.North American Journal of Fisheries Management 15, 419–427.doi:10.1577/1548-8675(1995)015<0419:COCPEA>2.3.CO;2
Snyder, D. E. (2003). Invited overview: conclusions from a review ofelectrofishing and its harmful effects on fish. Journal Reviews inFish Biology and Fisheries 13, 445–453. doi:10.1007/S11160-004-1095-9
SPSS (1999). ‘SPSS Base 11.5 for Windows User’s Guide.’ (SPSS Inc.:Chicago, IL.)
Statistical Sciences (1999). ‘S-PLUS, version 2000 for Windows.’(Mathsoft Inc.: Seattle, WA.)
Zalewski, M., and Cowx, I. G. (1989). Factors affecting the efficiencyof electrofishing. In ‘Fishing with Electricity – Application in Fresh-water Fisheries Management’. (Eds I. G. Cowx and P. Lamarque.)pp. 89–110. (Fishing New Books: Oxford.)
Zar, J. H. (1996). ‘Biostatistical Analysis.’ (Prentice-Hall: EnglewoodCliffs, NJ.)
Zippin, C. (1956). An evaluation of the removal method of estimatinganimal populations. Biometrics 12, 163–169. doi:10.2307/3001759
Manuscript received 18 April 2006; revised 25 June 2006; and accepted17 July 2006.
Related Documents