SRB Working Paper Series #1 – March 2022 Federico INFELISE; Francesco LIPPI; Michael VINCENT Abstract This staff working paper provides a methodology for the ex-ante estimation of the potential liquidity needs that banks could foresee in resolution. Several estimates are provided depending on the timing of the intervention. The sample covers the significant institutions of the banking union under the remit of the SRB. The methodology proposed here is meant to foster the debate on liquidity needs in resolution, and suggests, given the magnitude of such liquidity gaps, that more liquidity tools could be beneficial to strengthen financial stability in the Banking Union. Technical SRB Staff Working Paper Estimating liquidity needs in resolution in the Banking Union

Welcome message from author
This document is posted to help you gain knowledge. Please leave a comment to let me know what you think about it! Share it to your friends and learn new things together.
Transcript
SRB Working Paper Series #1 – March 2022
Federico INFELISE; Francesco LIPPI; Michael VINCENT
Abstract
This staff working paper provides a methodology for the ex-ante estimation of the potential liquidity needs that
banks could foresee in resolution. Several estimates are provided depending on the timing of the intervention.
The sample covers the significant institutions of the banking union under the remit of the SRB. The
methodology proposed here is meant to foster the debate on liquidity needs in resolution, and suggests, given
the magnitude of such liquidity gaps, that more liquidity tools could be beneficial to strengthen financial stability
in the Banking Union.
Technical SRB Staff Working Paper
Estimating liquidity needs in resolution in the Banking Union

Single Resolution Board
Treurenberg 22 B-1049 Brussels, Belgium
T +32 2 490 30 00 E [email protected]
@EU_SRB srb.europa.eu
1
Disclaimer
This staff working paper is for information purposes only and is published to foster debate. This paper describes
research in progress by the author(s) on certain technical aspects. It should not be reported as representing
the views of the SRB. The views and opinions expressed in this paper are those of the authors and do not
necessarily reflect the position of the SRB. The SRB cannot be held liable for the content of this paper and this
paper does not represent a statement of official SRB policy, methodology or position on matters addressed
therein. Nor can this paper be understood as anticipating or pre-empting these.
Single Resolution Board
Treurenberg 22 B-1049 Brussels, Belgium
T +32 2 490 30 00 E [email protected]
@EU_SRB srb.europa.eu
2
Table of contents
1. Background 3
2. Methodological framework: definitions, concepts 4
2.1. Pre-FOLTF stylised dynamic 5
2.2. Post-FOLTF stylised dynamic 5
3. Methodology and scenario 6
3.1. Pre-FOLTF assumptions 6
3.2. Post-FOLTF assumptions 6
3.3. Methodological disclaimers 7
4. Simulation and estimates 9
5. Conclusion 12
6. Annexes 13
6.1. Annex A - Technical description of the method and data 13
6.2. Annex B – Summary of results and charts 15
1. Background
How to ensure liquidity in resolution is a key question when considering how financial continuity can be ensured
during the resolution process. Despite evidence suggesting that most banks will face liquidity challenges during
resolution, the toolbox available to Banking Union resolution authorities is seen as more powerful for restoring
the solvency of a failing bank, rather than its liquidity. For this reason, liquidity needs in resolution have been
a topic of keen interest for policymakers, regulators and academics for some time. The Financial Stability
Board (FSB) already included it among the outstanding policy issues to be addressed in 20141, following up
in 2016 with the principles on the temporary funding needed to support the orderly resolution of a G-SIB2 and
in 2018 with the funding strategy elements of an implementable resolution plan3.
Based on the international standards, resolution authorities have started strengthening their frameworks
building on two main dimensions:
developing banks’ specific capabilities for minimising the likelihood that a funding gap might actually occur in resolution; and
improving the resilience of the resolution institutional frameworks through backstop funding facilities.
The implementation of these policies relies on the interactions between different stakeholders (i.e. banks,
resolution authorities, supervisors and central banks) and spans across a varied set of areas (e.g. stress-
testing, management information systems (MIS), collateral management, reporting, and so on). However, no
matter from which angle we address this topic from, a key piece of information that is needed to support the
calibration of any action is the amount of liquidity that could be needed by a bank in resolution.
The ex-ante estimation of liquidity needs in resolution is a scenario-driven and assumptions-dependent
exercise that can easily become very complex and far-fetched. In this light, the development of a simple yet
robust methodology providing estimations of banks’ liquidity needs in resolution would inform the debate and
support the work of resolution authorities by:
providing benchmarks to assess banks’ capabilities to meet liquidity needs in resolution and, in general, supporting any resolvability assessment related to the financial continuity dimension; and
supporting an assessment of the robustness of the overall resolution framework by testing the adequacy of the size of resolution liquidity facilities.
The methodological framework and results presented in this note intend to contribute to both these dimensions
by providing a top-down resolution-specific methodology to estimate liquidity needs in resolution. In line with
Article 88 of the Single Resolution Mechanism Regulation (SRMR), the results shown in this paper have been
anonymised and aggregated to remove any confidential, bank- or country-specific information.
1 FSB (2014) https://www.fsb.org/wp-content/uploads/Resolution-Progress-Report-to-G20.pdf
2 FSB (2016) https://www.fsb.org/2016/08/guiding-principles-on-the-temporary-funding-needed-to-support-the-orderly-resolution-of-a-global-systemically-important-bank-g-sib/
3 FSB (2018) https://www.fsb.org/2018/06/funding-strategy-elements-of-an-implementable-resolution-plan-2/
4
2. Methodological framework: definitions, concepts
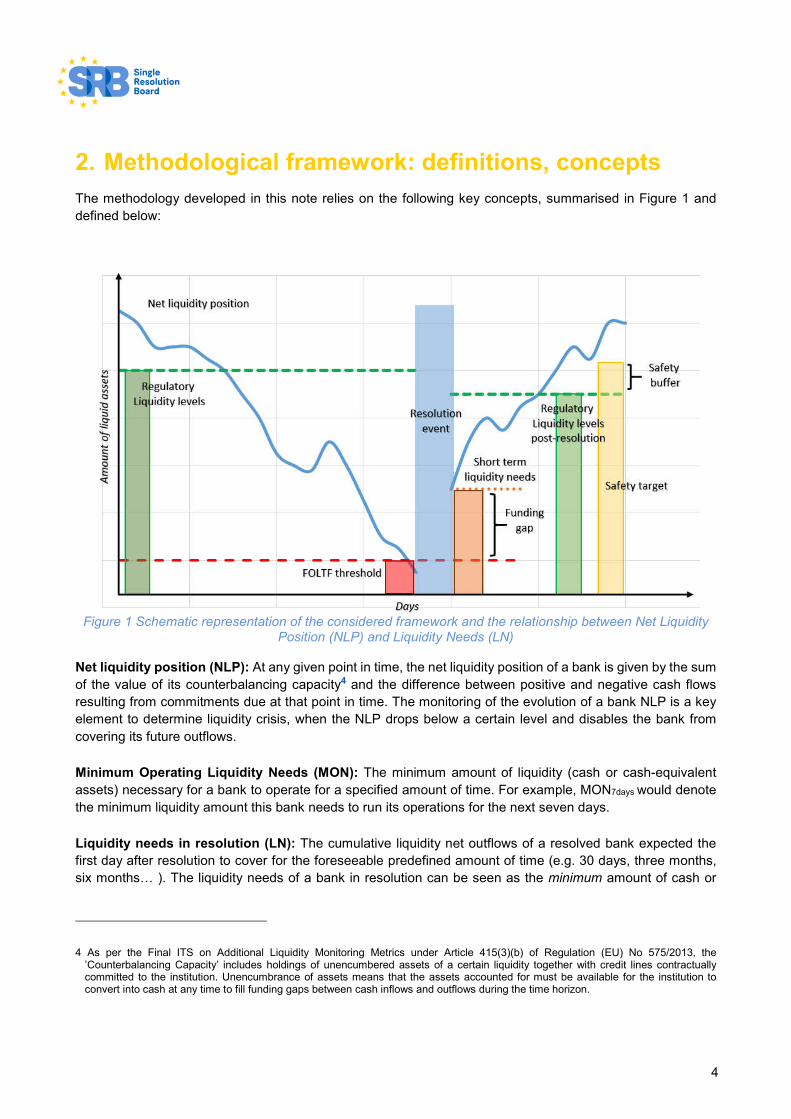
The methodology developed in this note relies on the following key concepts, summarised in Figure 1 and
defined below:
Figure 1 Schematic representation of the considered framework and the relationship between Net Liquidity Position (NLP) and Liquidity Needs (LN)
Net liquidity position (NLP): At any given point in time, the net liquidity position of a bank is given by the sum
of the value of its counterbalancing capacity4 and the difference between positive and negative cash flows
resulting from commitments due at that point in time. The monitoring of the evolution of a bank NLP is a key
element to determine liquidity crisis, when the NLP drops below a certain level and disables the bank from
covering its future outflows.
Minimum Operating Liquidity Needs (MON): The minimum amount of liquidity (cash or cash-equivalent
assets) necessary for a bank to operate for a specified amount of time. For example, MON7days would denote
the minimum liquidity amount this bank needs to run its operations for the next seven days.
Liquidity needs in resolution (LN): The cumulative liquidity net outflows of a resolved bank expected the
first day after resolution to cover for the foreseeable predefined amount of time (e.g. 30 days, three months,
six months… ). The liquidity needs of a bank in resolution can be seen as the minimum amount of cash or
4 As per the Final ITS on Additional Liquidity Monitoring Metrics under Article 415(3)(b) of Regulation (EU) No 575/2013, the ’Counterbalancing Capacity’ includes holdings of unencumbered assets of a certain liquidity together with credit lines contractually committed to the institution. Unencumbrance of assets means that the assets accounted for must be available for the institution to convert into cash at any time to fill funding gaps between cash inflows and outflows during the time horizon.
5
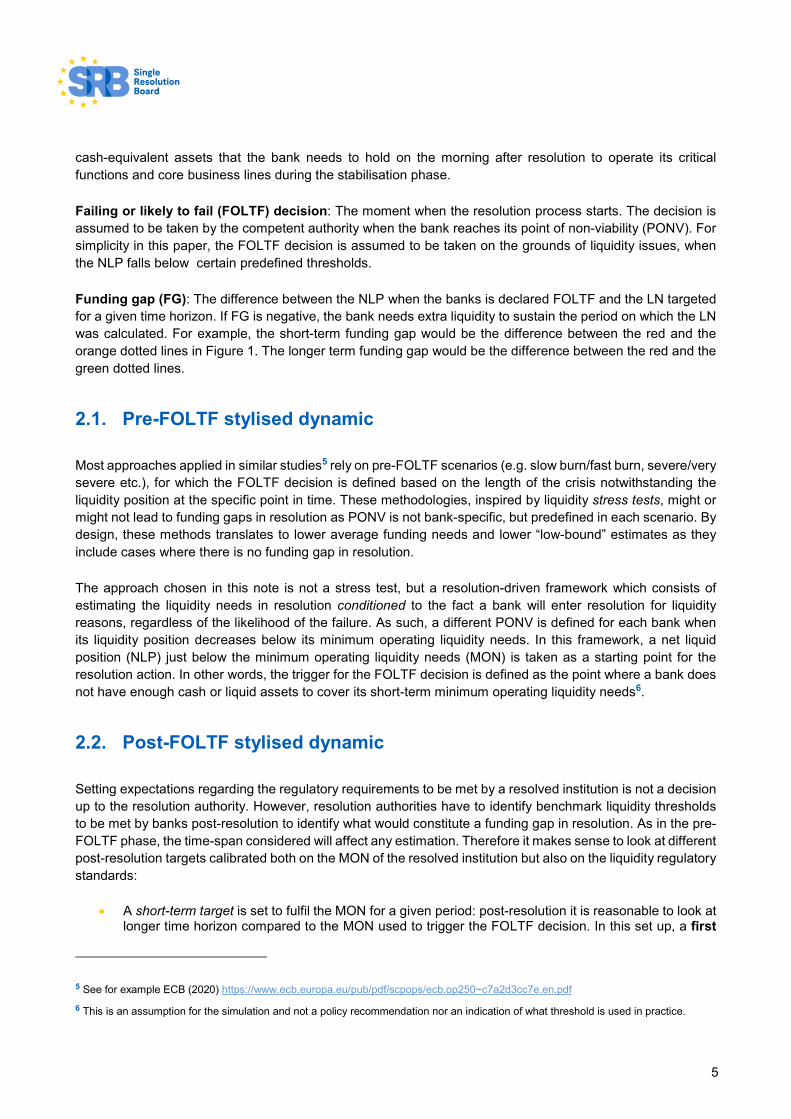
cash-equivalent assets that the bank needs to hold on the morning after resolution to operate its critical
functions and core business lines during the stabilisation phase.
Failing or likely to fail (FOLTF) decision: The moment when the resolution process starts. The decision is
assumed to be taken by the competent authority when the bank reaches its point of non-viability (PONV). For
simplicity in this paper, the FOLTF decision is assumed to be taken on the grounds of liquidity issues, when
the NLP falls below certain predefined thresholds.
Funding gap (FG): The difference between the NLP when the banks is declared FOLTF and the LN targeted
for a given time horizon. If FG is negative, the bank needs extra liquidity to sustain the period on which the LN
was calculated. For example, the short-term funding gap would be the difference between the red and the
orange dotted lines in Figure 1. The longer term funding gap would be the difference between the red and the
green dotted lines.
2.1. Pre-FOLTF stylised dynamic
Most approaches applied in similar studies5 rely on pre-FOLTF scenarios (e.g. slow burn/fast burn, severe/very
severe etc.), for which the FOLTF decision is defined based on the length of the crisis notwithstanding the
liquidity position at the specific point in time. These methodologies, inspired by liquidity stress tests, might or
might not lead to funding gaps in resolution as PONV is not bank-specific, but predefined in each scenario. By
design, these methods translates to lower average funding needs and lower “low-bound” estimates as they
include cases where there is no funding gap in resolution.
The approach chosen in this note is not a stress test, but a resolution-driven framework which consists of
estimating the liquidity needs in resolution conditioned to the fact a bank will enter resolution for liquidity
reasons, regardless of the likelihood of the failure. As such, a different PONV is defined for each bank when
its liquidity position decreases below its minimum operating liquidity needs. In this framework, a net liquid
position (NLP) just below the minimum operating liquidity needs (MON) is taken as a starting point for the
resolution action. In other words, the trigger for the FOLTF decision is defined as the point where a bank does
not have enough cash or liquid assets to cover its short-term minimum operating liquidity needs6.
2.2. Post-FOLTF stylised dynamic
Setting expectations regarding the regulatory requirements to be met by a resolved institution is not a decision
up to the resolution authority. However, resolution authorities have to identify benchmark liquidity thresholds
to be met by banks post-resolution to identify what would constitute a funding gap in resolution. As in the pre-
FOLTF phase, the time-span considered will affect any estimation. Therefore it makes sense to look at different
post-resolution targets calibrated both on the MON of the resolved institution but also on the liquidity regulatory
standards:
A short-term target is set to fulfil the MON for a given period: post-resolution it is reasonable to look at longer time horizon compared to the MON used to trigger the FOLTF decision. In this set up, a first
5 See for example ECB (2020) https://www.ecb.europa.eu/pub/pdf/scpops/ecb.op250~c7a2d3cc7e.en.pdf
6 This is an assumption for the simulation and not a policy recommendation nor an indication of what threshold is used in practice.

6
funding gap (FG) would be represented by the difference between the MONFOLTF and the MONshort-
term target (i.e. the distance between the red and the orange dotted lines).
A middle-term target set as the liquidity necessary to restore the liquidity coverage ratio (LCR) to 100%. The LCR is both seen as a regulatory constraint and as a benchmark buffer to restore market confidence: the second FG would be represented as the distance between the orange and the green dotted lines in Figure 1.
A safety buffer above the minimum LCR to give the bank more room to manoeuver and prevent the non-compliance with the LCR at first hurdle: the third component of the FG would be the part of the yellow bar above the green dotted line in Figure 1.
3. Methodology and scenario
3.1. Pre-FOLTF assumptions
The methodology proposed in this note links the FOLTF threshold to a specific level of the MON: the competent
authority would trigger the FOLTF decision when the NLP falls below a pre-identified level of MON. The choice
of the period on which the MON is calculated affects the NLP at the point of resolution and therefore the size
of the funding gap. The baseline scenario for the estimations uses the MON7-days as the benchmark threshold
assuming the bank will be declared FOLTF when its NLP<MON7-days (see Figure 2). This would mean a given
bank would be considered to be FOLTF from the point at which it would hold less liquid assets than it would
need to cover the net outflows of the coming week. To get an order of magnitude, in this sample, this would
translate on average into calling PONV when the bank’s LCR is in a range of 20-33% (more on this in Section
4. Results);
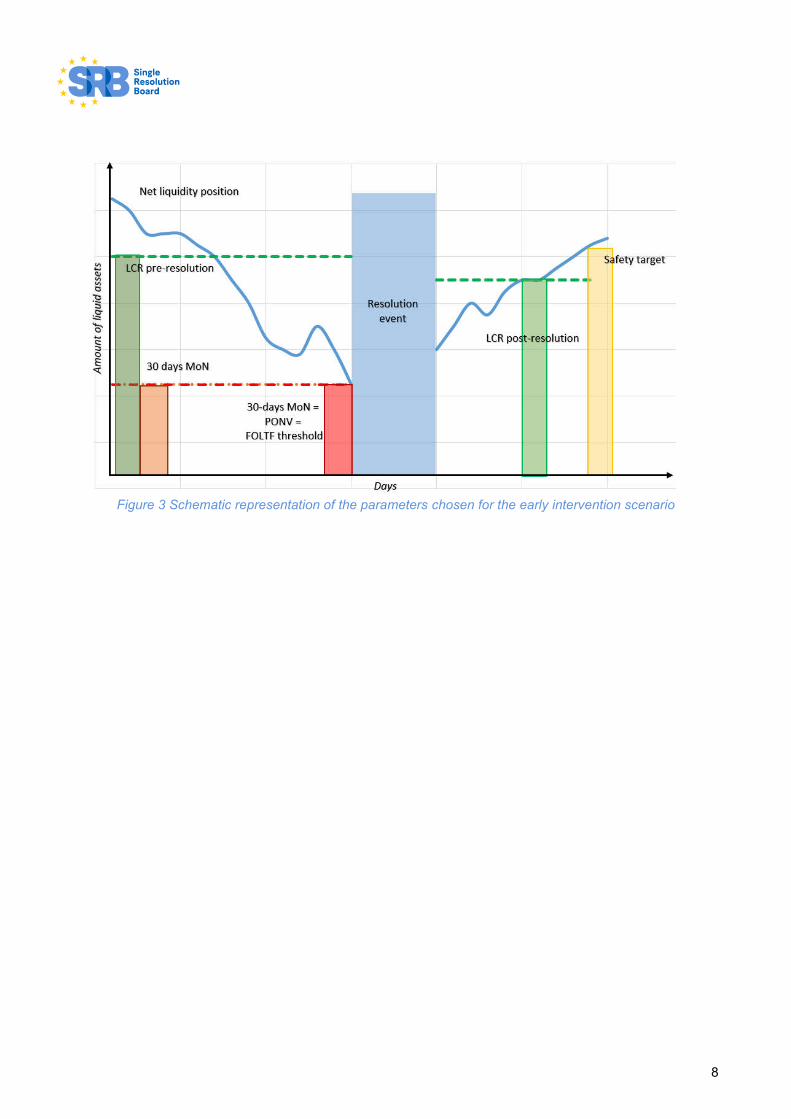
For consistency and comparability, as well as ensuring realistic assumptions, estimates from the baseline
scenario are supplemented with estimates generated under a second set of circumstances: an earlier
intervention, assuming PONV is reached when a bank NLP drops below the one-month MON level. This would
translate, on average, in calling PONV when the bank’s LCR is in a range of 40-60% of LCR for the majority
of banks in the sample (see Figure 3).
3.2. Post-FOLTF assumptions
The assumptions applied to the post-resolution liquidity targets are the following:
A short-term target to fulfil the required MON30-days.
A middle-term target set as the liquidity necessary to restore the LCR to 100%. A non-static balance sheet assumption is applied to reflect the impact of the crisis and of resolution, by assuming a slightly lower level of outflows post-resolution led in particular by a decrease of deposits7, which would lead to a different LCR target post-resolution.
A safety buffer of 10% above a 100% LCR.
7 Based on past crises.

7
3.3. Methodological disclaimers
While the results of applying this methodology discussed in Section 4 are in line with examples from past cases
and other similar studies, the methodology presented in this section should be taken with caution. While
informative on the expected order of magnitude of potential liquidity needs in resolution, it should be recalled
that liquidity-driving factors, in real crisis cases, are highly behavioural, and liquidity outflows can demonstrate
non-linear or exponential trends, making prediction uncertain. One should also (therefore) strike a delicate
balance between triggering a FOLTF decision too early, and the risks of triggering it rather late, at a point
where the stock of liquid counterbalancing capacity could be almost empty.
Figure 2 and 3 below illustrate these thresholds and targets on a chart using the proposed parameters.
Figure 2 Schematic representation of the criteria used in the considered framework
8
Figure 3 Schematic representation of the parameters chosen for the early intervention scenario
9
4. Simulation and estimates
This section reports the results of liquidity needs estimation obtained using the methodology described above.
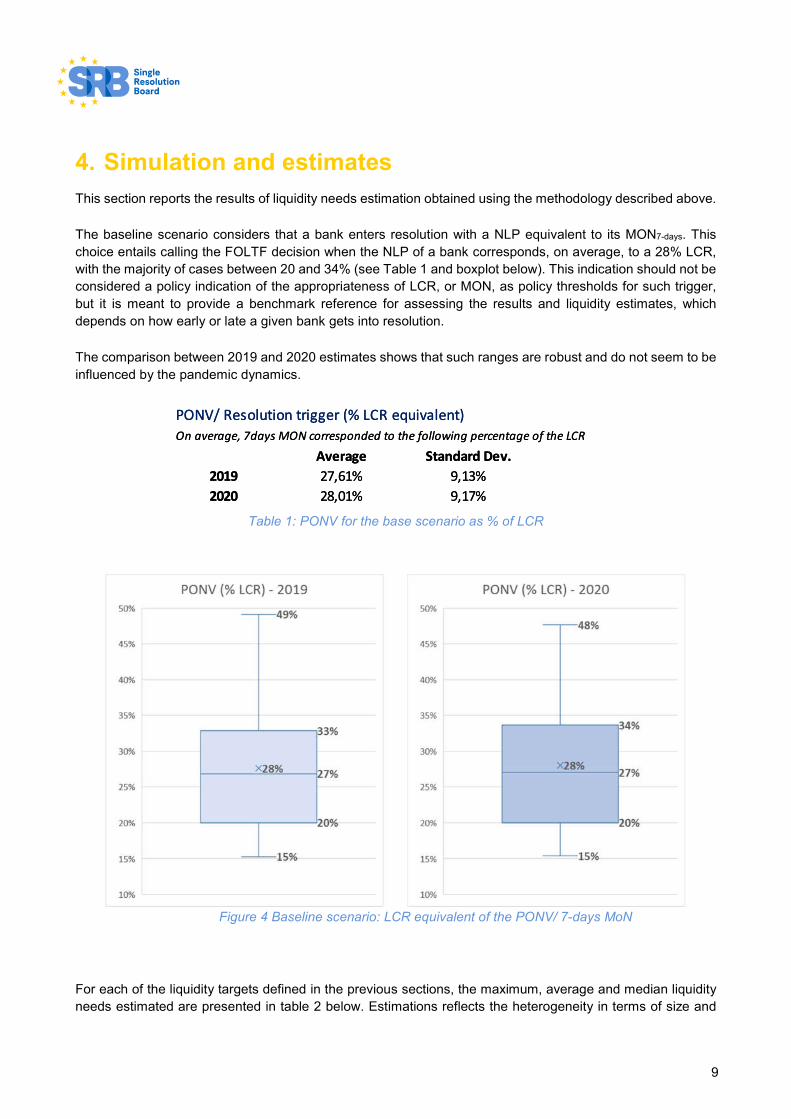
The baseline scenario considers that a bank enters resolution with a NLP equivalent to its MON7-days. This
choice entails calling the FOLTF decision when the NLP of a bank corresponds, on average, to a 28% LCR,
with the majority of cases between 20 and 34% (see Table 1 and boxplot below). This indication should not be
considered a policy indication of the appropriateness of LCR, or MON, as policy thresholds for such trigger,
but it is meant to provide a benchmark reference for assessing the results and liquidity estimates, which
depends on how early or late a given bank gets into resolution.
The comparison between 2019 and 2020 estimates shows that such ranges are robust and do not seem to be
influenced by the pandemic dynamics.
Table 1: PONV for the base scenario as % of LCR
Figure 4 Baseline scenario: LCR equivalent of the PONV/ 7-days MoN
For each of the liquidity targets defined in the previous sections, the maximum, average and median liquidity
needs estimated are presented in table 2 below. Estimations reflects the heterogeneity in terms of size and
PONV/ Resolution trigger (% LCR equivalent)
On average, 7days MON corresponded to the following percentage of the LCR
Average Standard Dev.
2019 27,61% 9,13%
2020 28,01% 9,17%
PONV/ Resolution trigger (% LCR equivalent)
On average, 7days MON corresponded to the following percentage of the LCR
Average Standard Dev.
2019 27,61% 9,13%
2020 28,01% 9,17%
10
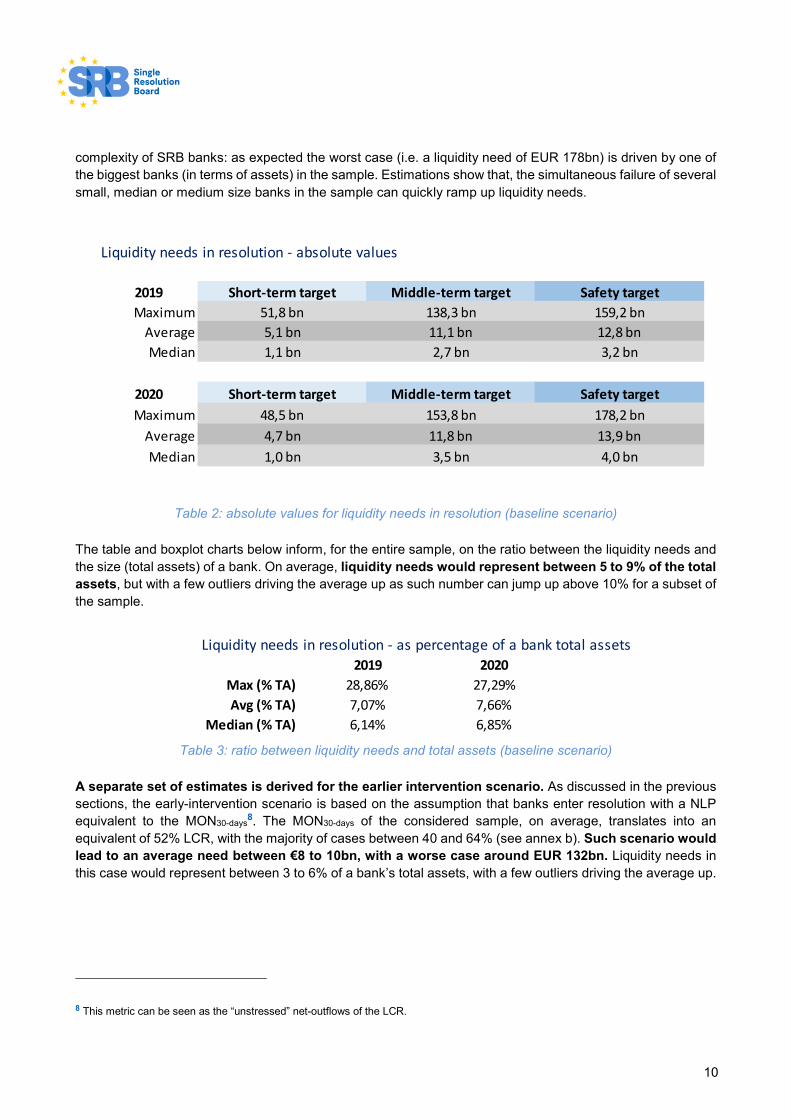
complexity of SRB banks: as expected the worst case (i.e. a liquidity need of EUR 178bn) is driven by one of
the biggest banks (in terms of assets) in the sample. Estimations show that, the simultaneous failure of several
small, median or medium size banks in the sample can quickly ramp up liquidity needs.
Table 2: absolute values for liquidity needs in resolution (baseline scenario)
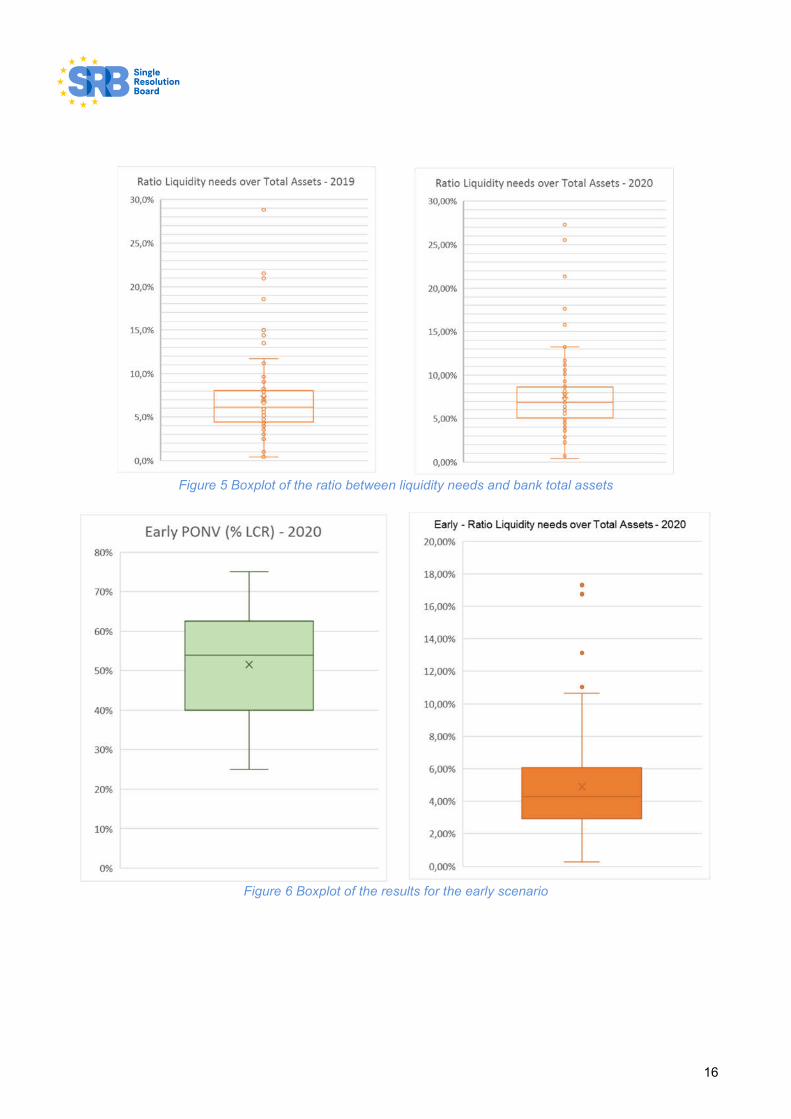
The table and boxplot charts below inform, for the entire sample, on the ratio between the liquidity needs and
the size (total assets) of a bank. On average, liquidity needs would represent between 5 to 9% of the total
assets, but with a few outliers driving the average up as such number can jump up above 10% for a subset of
the sample.
Table 3: ratio between liquidity needs and total assets (baseline scenario)
A separate set of estimates is derived for the earlier intervention scenario. As discussed in the previous
sections, the early-intervention scenario is based on the assumption that banks enter resolution with a NLP
equivalent to the MON30-days8. The MON30-days of the considered sample, on average, translates into an
equivalent of 52% LCR, with the majority of cases between 40 and 64% (see annex b). Such scenario would
lead to an average need between €8 to 10bn, with a worse case around EUR 132bn. Liquidity needs in
this case would represent between 3 to 6% of a bank’s total assets, with a few outliers driving the average up.
8 This metric can be seen as the “unstressed” net-outflows of the LCR.
Liquidity needs in resolution - as percentage of a bank total assets
2019 2020
Max (% TA) 28,86% 27,29%
Avg (% TA) 7,07% 7,66%
Median (% TA) 6,14% 6,85%
Liquidity needs in resolution - absolute values
2019 Short-term target Middle-term target Safety target
Maximum 51,8 bn 138,3 bn 159,2 bn
Average 5,1 bn 11,1 bn 12,8 bn
Median 1,1 bn 2,7 bn 3,2 bn
2020 Short-term target Middle-term target Safety target
Maximum 48,5 bn 153,8 bn 178,2 bn
Average 4,7 bn 11,8 bn 13,9 bn
Median 1,0 bn 3,5 bn 4,0 bn
11
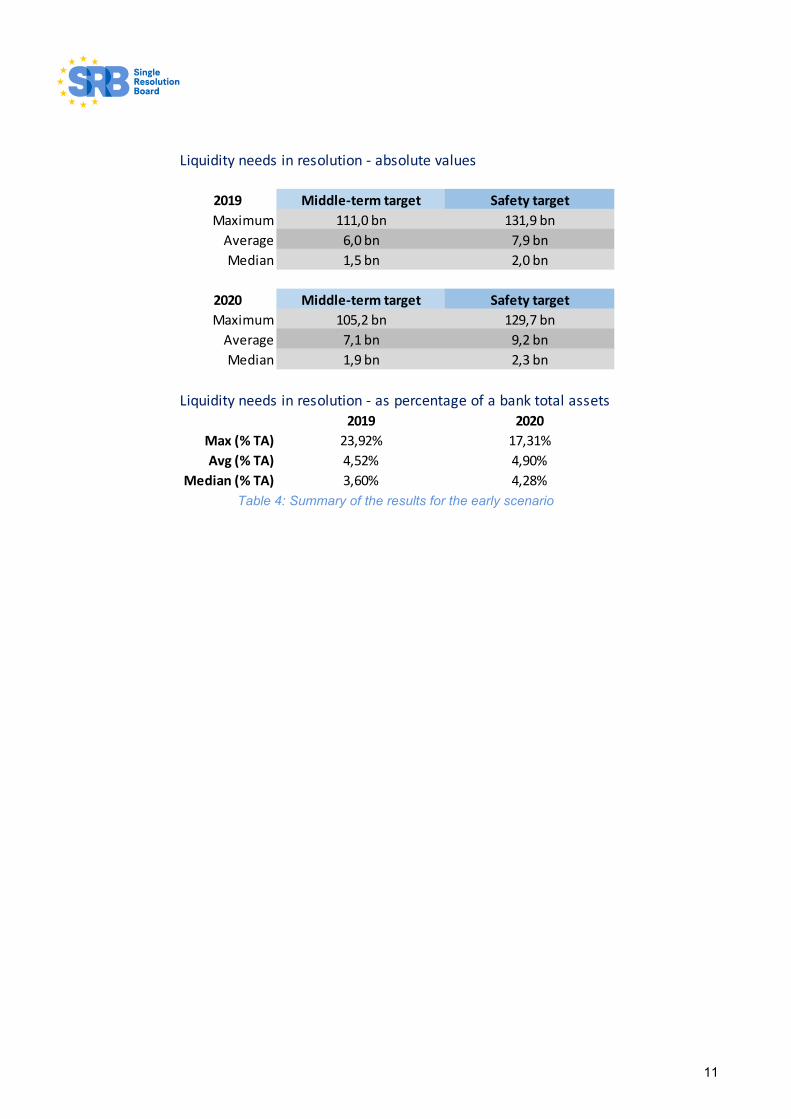
Table 4: Summary of the results for the early scenario
Liquidity needs in resolution - absolute values
2019 Middle-term target Safety target
Maximum 111,0 bn 131,9 bn
Average 6,0 bn 7,9 bn
Median 1,5 bn 2,0 bn
2020 Middle-term target Safety target
Maximum 105,2 bn 129,7 bn
Average 7,1 bn 9,2 bn
Median 1,9 bn 2,3 bn
Liquidity needs in resolution - as percentage of a bank total assets
2019 2020
Max (% TA) 23,92% 17,31%
Avg (% TA) 4,52% 4,90%
Median (% TA) 3,60% 4,28%
12
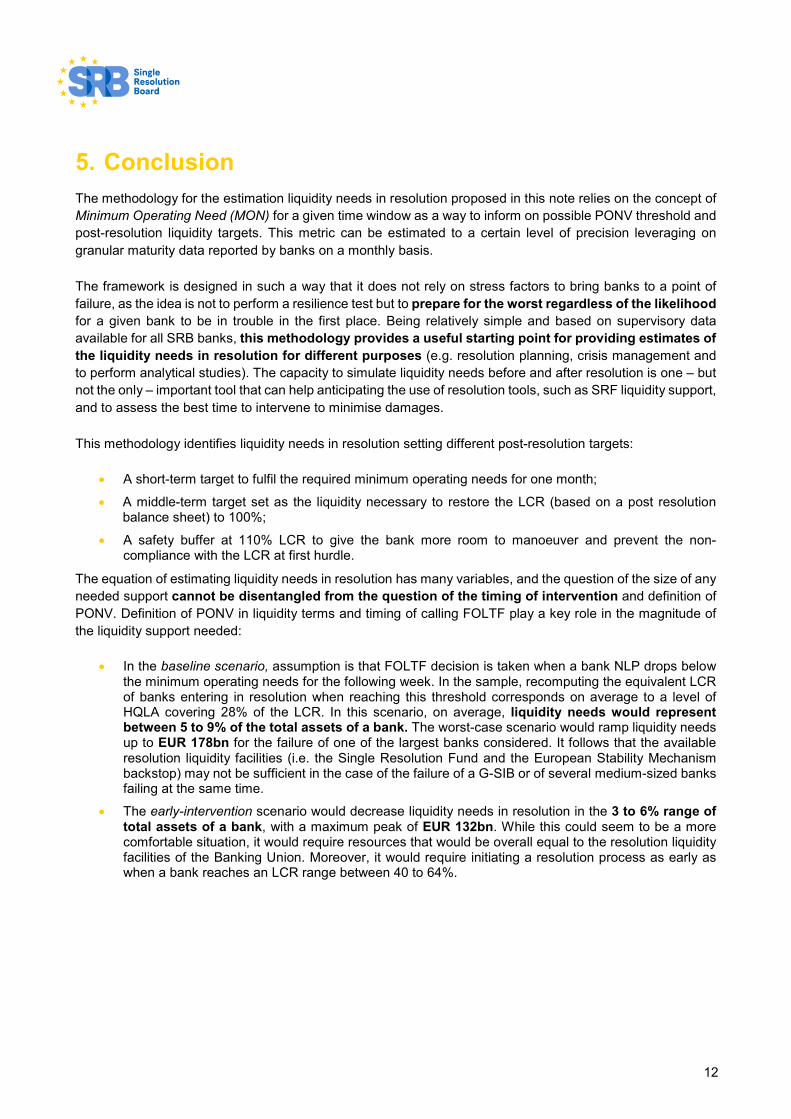
5. Conclusion
The methodology for the estimation liquidity needs in resolution proposed in this note relies on the concept of
Minimum Operating Need (MON) for a given time window as a way to inform on possible PONV threshold and
post-resolution liquidity targets. This metric can be estimated to a certain level of precision leveraging on
granular maturity data reported by banks on a monthly basis.
The framework is designed in such a way that it does not rely on stress factors to bring banks to a point of
failure, as the idea is not to perform a resilience test but to prepare for the worst regardless of the likelihood
for a given bank to be in trouble in the first place. Being relatively simple and based on supervisory data
available for all SRB banks, this methodology provides a useful starting point for providing estimates of
the liquidity needs in resolution for different purposes (e.g. resolution planning, crisis management and
to perform analytical studies). The capacity to simulate liquidity needs before and after resolution is one – but
not the only – important tool that can help anticipating the use of resolution tools, such as SRF liquidity support,
and to assess the best time to intervene to minimise damages.
This methodology identifies liquidity needs in resolution setting different post-resolution targets:
A short-term target to fulfil the required minimum operating needs for one month;
A middle-term target set as the liquidity necessary to restore the LCR (based on a post resolution balance sheet) to 100%;
A safety buffer at 110% LCR to give the bank more room to manoeuver and prevent the non-compliance with the LCR at first hurdle.
The equation of estimating liquidity needs in resolution has many variables, and the question of the size of any
needed support cannot be disentangled from the question of the timing of intervention and definition of
PONV. Definition of PONV in liquidity terms and timing of calling FOLTF play a key role in the magnitude of
the liquidity support needed:
In the baseline scenario, assumption is that FOLTF decision is taken when a bank NLP drops below the minimum operating needs for the following week. In the sample, recomputing the equivalent LCR of banks entering in resolution when reaching this threshold corresponds on average to a level of HQLA covering 28% of the LCR. In this scenario, on average, liquidity needs would represent between 5 to 9% of the total assets of a bank. The worst-case scenario would ramp liquidity needs up to EUR 178bn for the failure of one of the largest banks considered. It follows that the available resolution liquidity facilities (i.e. the Single Resolution Fund and the European Stability Mechanism backstop) may not be sufficient in the case of the failure of a G-SIB or of several medium-sized banks failing at the same time.
The early-intervention scenario would decrease liquidity needs in resolution in the 3 to 6% range of total assets of a bank, with a maximum peak of EUR 132bn. While this could seem to be a more comfortable situation, it would require resources that would be overall equal to the resolution liquidity facilities of the Banking Union. Moreover, it would require initiating a resolution process as early as when a bank reaches an LCR range between 40 to 64%.
13
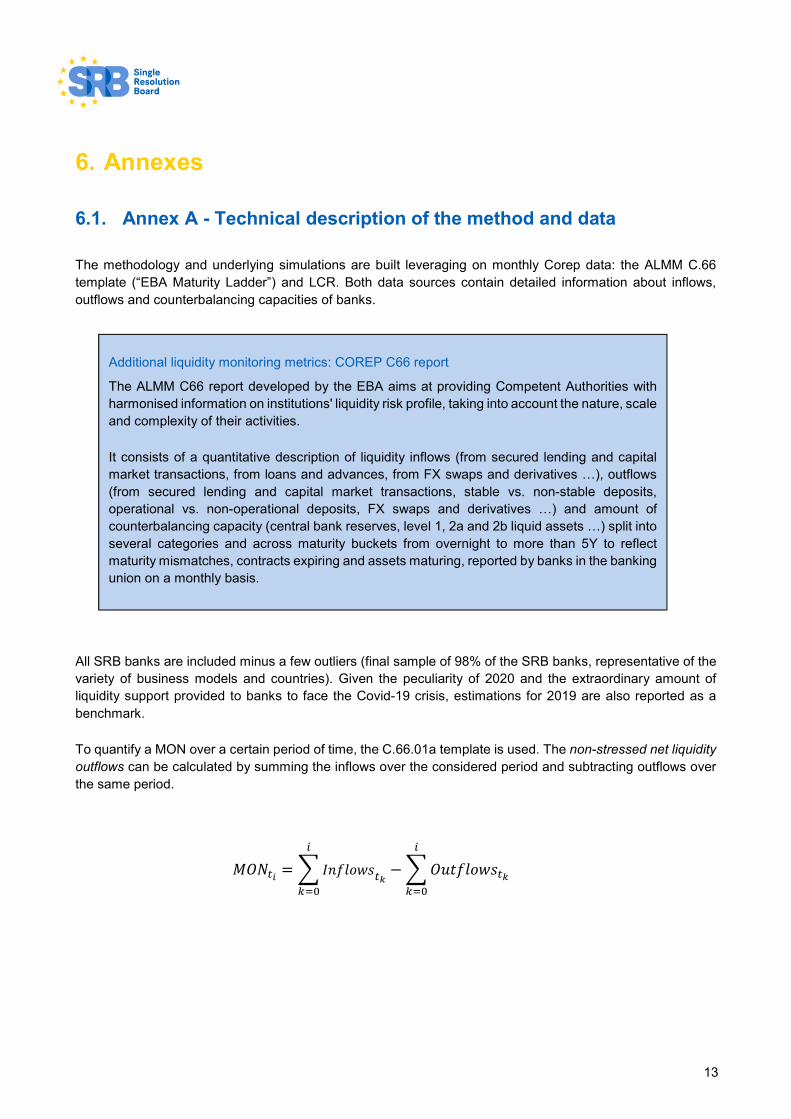
6. Annexes
6.1. Annex A - Technical description of the method and data
The methodology and underlying simulations are built leveraging on monthly Corep data: the ALMM C.66
template (“EBA Maturity Ladder”) and LCR. Both data sources contain detailed information about inflows,
outflows and counterbalancing capacities of banks.
All SRB banks are included minus a few outliers (final sample of 98% of the SRB banks, representative of the
variety of business models and countries). Given the peculiarity of 2020 and the extraordinary amount of
liquidity support provided to banks to face the Covid-19 crisis, estimations for 2019 are also reported as a
benchmark.
To quantify a MON over a certain period of time, the C.66.01a template is used. The non-stressed net liquidity
outflows can be calculated by summing the inflows over the considered period and subtracting outflows over
the same period.
�����= � ���������
− � ����������
�
���
�
���
Additional liquidity monitoring metrics: COREP C66 report
The ALMM C66 report developed by the EBA aims at providing Competent Authorities with
harmonised information on institutions' liquidity risk profile, taking into account the nature, scale
and complexity of their activities.
It consists of a quantitative description of liquidity inflows (from secured lending and capital
market transactions, from loans and advances, from FX swaps and derivatives …), outflows
(from secured lending and capital market transactions, stable vs. non-stable deposits,
operational vs. non-operational deposits, FX swaps and derivatives …) and amount of
counterbalancing capacity (central bank reserves, level 1, 2a and 2b liquid assets …) split into
several categories and across maturity buckets from overnight to more than 5Y to reflect
maturity mismatches, contracts expiring and assets maturing, reported by banks in the banking
union on a monthly basis.

14
In particular, the MON30-days are expected to be positive and below the LCR net-liquidity outflow9 by design,
since they both cover the same period of time (30 days) while LCR stresses the outflows and reduces the
expected inflows.
0 ≤ ����� ���� ≤ ���
Because of data quality issues, related to the various ways banks fill the C.66 report or the way banks manage
their liquidity maturity mismatch, this method can, however, sometimes lead to estimates outside these
expectations. When this is the case, the estimate is adjusted so it reflects better the definition of MON and the
core of the sample. The following methodology is applied to the minority of outliers:
Applying a 75% cap to the sum of inflows over the first 30 days if the uncapped leads to negative MON, similarly to the way LCR is calculated;
If �����≤ 0 then �����
= ∑ 0.75 × ���������− ∑ ����������
����
����
Comparing with a different, less granular but more consistent way to compute MON30-days using LCR data by “unstressing” net outflows to create a non-stressed LCR which will be, by construction, below the LCR net-liquidity outflow.
After the sample is redressed, all banks in the sample shows a MON30-days comprise between 0 and the LCR
net-liquidity outflow. To remove seasonality effects or to smooth ad-hoc circumstances, we average the MON30-
days over all reports available for a given year (2019 and 2020 in this sample).
9 The denominator of the LCR, representing the outflows expected over 30 days under stress conditions.
15
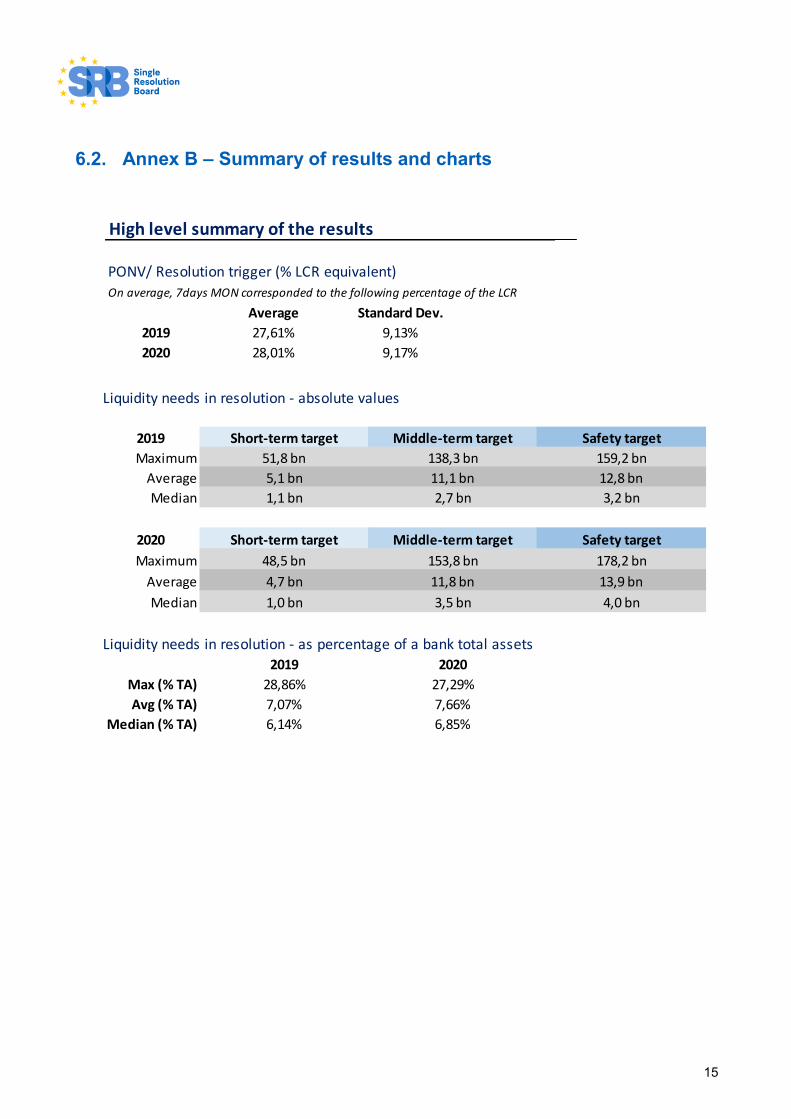
6.2. Annex B – Summary of results and charts
High level summary of the results
PONV/ Resolution trigger (% LCR equivalent)
On average, 7days MON corresponded to the following percentage of the LCR
Average Standard Dev.
2019 27,61% 9,13%
2020 28,01% 9,17%
Liquidity needs in resolution - absolute values
2019 Short-term target Middle-term target Safety target
Maximum 51,8 bn 138,3 bn 159,2 bn
Average 5,1 bn 11,1 bn 12,8 bn
Median 1,1 bn 2,7 bn 3,2 bn
2020 Short-term target Middle-term target Safety target
Maximum 48,5 bn 153,8 bn 178,2 bn
Average 4,7 bn 11,8 bn 13,9 bn
Median 1,0 bn 3,5 bn 4,0 bn
Liquidity needs in resolution - as percentage of a bank total assets
2019 2020
Max (% TA) 28,86% 27,29%
Avg (% TA) 7,07% 7,66%
Median (% TA) 6,14% 6,85%
16
Figure 5 Boxplot of the ratio between liquidity needs and bank total assets
Figure 6 Boxplot of the results for the early scenario
Related Documents