Page 1 of 29 Estimating Interzonal Leakage in a Net-Zero Energy House Lisa Ng 1 , Lindsey Kinser 2 , Steven Emmerich 1 , Andrew Persily 1 1 Indoor Air Quality and Ventilation Group, Engineering Laboratory, National Institute of Standards and Technology, Gaithersburg MD 2 College of Engineering, Mechanical Engineering and Mechanics, Drexel University ABSTRACT The Net-Zero Energy Residential Test Facility (NZERTF) was constructed at the National Institute of Standards and Technology (NIST) to support the development and adoption of cost-effective net-zero energy designs and technologies. The 250 m 2 two-story, unoccupied NZERTF, built in 2012, had among its design goals an airtight and highly insulated building enclosure designed for heat, air and moisture control. The airtightness goal was achieved through detailed envelope design, and careful construction, as well as during and after construction commissioning. When it was built, the NZERTF was one of the tightest residential buildings in North America with a whole building pressurization test result of roughly 0.6 h -1 at 50 Pa measured per ASTM E779-19, Standard Test Method for Determining Air Leakage Rate by Fan Pressurization. No special attention was given to the airtightness of the interior floors and other interior partitions. To support airflow modeling efforts, this interior leakage was quantified through a series of interzonal pressurization tests. Both the basement and attic were considered to be conditioned spaces because the thermal and air-moisture barriers encompass the basement walls and attic roof. Transfer grilles and other openings linked the living space to these two zones. A series of fan and partition configurations were used to quantify the leakage values of the various interzone airflow paths. Test results showed that the interior floors were more than 10 times leakier than the exterior building envelope and that the leakage associated with the transfer grilles between levels was less than the floor leakage. This paper describes the design of the interzonal tests and the challenges in

Welcome message from author
This document is posted to help you gain knowledge. Please leave a comment to let me know what you think about it! Share it to your friends and learn new things together.
Transcript
Page 1 of 29
Estimating Interzonal Leakage in a Net-Zero Energy House
Lisa Ng1, Lindsey Kinser2, Steven Emmerich1, Andrew Persily1
1 Indoor Air Quality and Ventilation Group, Engineering Laboratory, National Institute of
Standards and Technology, Gaithersburg MD 2 College of Engineering, Mechanical Engineering and Mechanics, Drexel University
ABSTRACT
The Net-Zero Energy Residential Test Facility (NZERTF) was constructed at the National Institute
of Standards and Technology (NIST) to support the development and adoption of cost-effective
net-zero energy designs and technologies. The 250 m2 two-story, unoccupied NZERTF, built in
2012, had among its design goals an airtight and highly insulated building enclosure designed for
heat, air and moisture control. The airtightness goal was achieved through detailed envelope
design, and careful construction, as well as during and after construction commissioning. When it
was built, the NZERTF was one of the tightest residential buildings in North America with a whole
building pressurization test result of roughly 0.6 h-1 at 50 Pa measured per ASTM E779-19,
Standard Test Method for Determining Air Leakage Rate by Fan Pressurization. No special
attention was given to the airtightness of the interior floors and other interior partitions. To support
airflow modeling efforts, this interior leakage was quantified through a series of interzonal
pressurization tests. Both the basement and attic were considered to be conditioned spaces because
the thermal and air-moisture barriers encompass the basement walls and attic roof. Transfer grilles
and other openings linked the living space to these two zones. A series of fan and partition
configurations were used to quantify the leakage values of the various interzone airflow paths. Test
results showed that the interior floors were more than 10 times leakier than the exterior building
envelope and that the leakage associated with the transfer grilles between levels was less than the
floor leakage. This paper describes the design of the interzonal tests and the challenges in
Page 2 of 29
performing them, which included isolating zones, controlling multiple blower doors, and access
for installing pressurization fans. The results of these tests were inputs to a multizone airflow
(CONTAM) model of the building for use in evaluating the effects of different ventilation
strategies and other airflow-related technologies on energy consumption and indoor air quality.
Keywords
airtightness, interzonal leakage, net-zero house, ASTM E779-10, pressurization tests
INTRODUCTION
In 2017, buildings were associated with 39 % of all energy used in the United States, with
residential buildings and commercial buildings accounting for 20 % and 19 %, respectively [1].
Based on estimates by the U. S. Department of Energy (DOE), infiltration alone accounts for 14 %
and 6 % of the energy used by residential and commercial buildings, respectively [2]. To reduce
these energy impacts, tighter building envelopes are being required by codes and standards [2-5].
There are no standards related to the leakiness of interior floors and walls based on energy and
indoor air quality considerations (though some fire codes address the issue), even though
interzonal airflow through these surfaces can be important for contaminant transport and thus
occupant exposure [6].
The literature on interzonal airflow experiments includes analyses of two-zone test cases [7-9].
Determining interzonal airflow is more difficult than whole building testing, either requiring a
series of pressurization tests or multiple tracer gas tests. Emmerich et al. [7] conducted interzonal
pressurization tests in five homes with attached garages to determine the leakiness of the house-
Page 3 of 29
garage interface. The tests involved placing one or two fans in different exterior doorways and
altering the positions of the door connecting the two zones, as well as of the garage door to the
outside. They found that the house-garage interface (normalized by the house-garage surface area)
was two and half times to nearly eleven times leakier than the house exterior envelope (normalized
by the house exterior surface area), which has implications for the transfer of contaminants from
garages into houses. Hult et al. [9] compared the results of various single-fan and two-fan tests of
the leakiness of house-garage interfaces. They also compared single-pressure difference to
multiple-pressure difference tests. They found that a method using one fan in two configurations
provided results with the smallest uncertainty among the single-fan tests. In general, the single-
pressure tests led to less reliable results than the multiple-pressure tests. Though requiring an extra
configuration, the “one-fan, three configurations” test performed by Emmerich et al. [7] also
resulted in low uncertainty.
Tracer gas tests have also been used to determine interzonal airflow rates, as opposed to the
interzone partition leakiness determined by the previously-described fan pressurization tests [10-
15]. Du et al. [16] conducted constant-concentration tracer tests in several homes using two tracer
gases. The steady-state concentrations of the tracer gases were used to estimate the airflow rates
between a bedroom and the rest of the home. They found that most of the air entering the bedrooms
came from somewhere else in the house and not from outside. Conversely, most of the air entering
the rest of the house came from outside and not from the bedroom. They also found that homes
that relied more on central heating and cooling systems had relatively higher interzonal airflows
than homes in which occupants opened windows for ventilation.

Page 4 of 29
This paper examines the use of blower door tests to determine the effective leakage area (ELA) of
various house components (exterior envelope, interior floor leakage, leakage of transfer grilles)
for input into a multizone airflow model. The results of such simulations can be used to evaluate
different ventilation strategies and other airflow-related technologies to study the effects of
weather, indoor conditions, and system operation on interzonal airflow and contaminant transport.
This paper describes the test house, the design of the interzonal tests and the challenges in
performing these tests, as well as the performance of a multizone airflow model (i.e., CONTAM)
using measured values of interior leakages to predict contaminant concentrations. Interzonal tracer
decay tests also were performed, and their analyses are saved for future work.
TEST HOUSE
The Net-Zero Energy Residential Test Facility (NZERTF) was built on the campus of the National
Institute of Standards and Technology (NIST) in 2012 to demonstrate low-energy residential
technologies with the goal of net-zero energy use on an annual basis (FIG. 1). The NZERTF is a
250 m2 two-story, unoccupied house located in Gaithersburg, MD with an unfinished basement
and an attic, both within the conditioned space. As reflected in TABLE 1, which summarizes the
physical characteristics of the house, the basement is mostly below-grade, with a window well
providing egress. A two-story foyer with a staircase connects the first and second floor, which has
a horizontal area of approximately 17 m2 (12 % of the first floor area). Given the open connection
between these two floors, they were considered a single zone in these tests.
The detached garage contains the controls and data acquisition systems of the instruments and
sensors in the NZERTF, so that their heat load is not introduced into the home. Lighting,

Page 5 of 29
appliances, plug loads, and sensible and latent heat loads of the simulated occupants are controlled
by the data acquisition system [17]. A virtual family consisting of two adults and two children are
simulated in the house, with their electrical and water usage varying over a seven-day schedule
[18].
TABLE 1. Physical characteristics of NZERTF
Building characteristic Value
Roof area 184 m2
Basement wall area (above-grade) 2 m2
First floor/second floor exterior wall area 314 m2
Attic floor 130 m2
Basement ceiling 151 m2
Total exterior surface area 500 m2
Total volume (basement, first floor, second
floor, attic) 1300 m3
The main design goal of the NZERTF was to achieve net-zero energy use over the course of a
year, which was achieved from July 2013 to June 2014. One of the ways to reduce energy use in
homes is to reduce heating and cooling loads because Since infiltration can account for 14 % of
the total energy use of a home, the NZERTF was designed and constructed to be airtight. The
building envelope airtightness of the NZERTF was tested to be 0.63 h-1 at 50 Pa [19], which is
tighter than the requirements in LEED v4 [20] and ENERGY STAR v3.1 [21], and only slightly
leakier than the Passive House U. S. requirement [22]. The normalized leakage (NL) value for the
house equals 0.06, which is tighter than 99 % of U.S. homes based on statistical analysis of the
Lawrence Berkeley National Laboratory Residential Diagnostics Database [23]. The NL value is
defined in the ASHRAE Fundamentals Handbook [24] as follows:
𝑁𝐿 = 1000 (𝐸𝐿𝐴4
𝐴𝑟𝑒𝑎) (
𝐻
2.5 𝑚)
0.3 (1)

Page 6 of 29
where ELA4 (m2) is the ELA at 4 Pa, Area (m2) is the floor area, and H (m) is the house height.
FIG. 1. NZERTF at NIST facing south.
The basement, first floor, and second floor were actively conditioned by a central, air-source heat
pump. The central heat pump had supplies in the basement, first floor, and second floor. Two
returns were on the first floor and two returns were on the second floor. The heat pump has no
outdoor air intake. Three transfer grilles were located on the floor of the first level to allow airflow
between the basement and the house (referred to as the first floor transfer grilles). Two transfer
grilles were located on the ceiling of the second floor to allow airflow between the attic and the
house (FIG. 2a) referred to as the attic transfer grilles. Because the attic is within the thermal
envelope, the attic transfer grilles were installed to provide the attic with conditioned air without
requiring air distribution ductwork in the attic [25]. All the transfer grilles contain a damper that
would close in case of a fire. The basement door and the attic hatch were closed during normal
operation of the house. The basement door had an undercut that was approximately 0.9 m wide by

Page 7 of 29
2.5 cm high, and the attic hatch door had a gap around it that was approximately 0.3 cm wide and
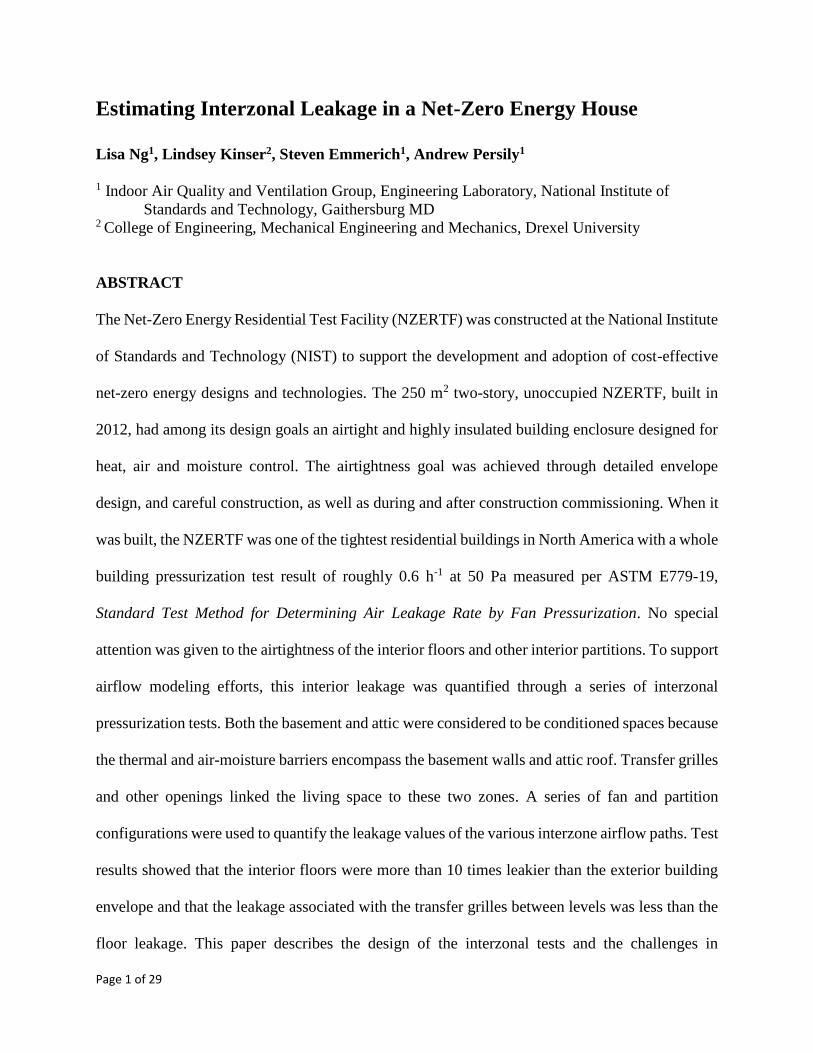
5.5 m long around its perimeter. Under depressurization, smoke tests were performed around
interior airflow paths, such as the transfer grilles and around the basement door (FIG. 2) to better
understand the airflow through these building elements. Smoke tests were also used to identify
airflow paths that should be sealed during pressurization testing, such as the access panels in a
bathroom used for signal and control wire (FIG. 2c) to isolate and determine leakage associated
with the construction of the floors, basement door, and attic door. Other interior airflow paths that
were sealed during testing included the supplies and returns of the central heat pump and the
independently ducted mechanical ventilation system, the heat recovery ventilator (HRV). The
HRV was balanced, with supplies on the first and second floors and exhausts in the bathrooms on
the first and second floors. Both systems were turned off during all of the pressurization tests. The
kitchen exhaust fan and dryer also were turned off, and their exterior vents were sealed.
(a) Floor transfer grille (b) Basement door (c) Access panel

Page 8 of 29
FIG. 2 Photographs of smoke tests performed at NZERTF at the (a) floor transfer grilles, (b)
basement door, and (c) access panel while depressurizing. Arrows indicate direction of airflow.
Because the NZERTF is airtight, the designers wanted to prevent the house from depressurizing
when either the kitchen exhaust fan or dryer were turned on. Thus, a 15-cm round duct was
installed in the attic, penetrating the exterior attic wall on the west side, with motorized and
barometric dampers installed in the duct. The motorized damper was activated when either the
kitchen exhaust fan or dryer was turned on. The barometric damper would open if the motorized
damper was open and if the inside pressure was 10 Pa less than the outside pressure.
METHODOLOGY
The testing and data analysis methodologies as follows:
(1) Five house configurations were tested under various blower door arrangements.
(2) Each test configuration was expressed in mathematical form following the analogy of an
electrical circuit with pressure corresponding to voltage and airflow corresponding to current.
The airflow Q and pressure difference ΔP across a surface were represented by the equation
Q = CΔPn, where C is the flow coefficient (m3/s•Pa) and n is the pressure exponent. Both C
and n were determined from the test data. These expressions formed the system of the equations
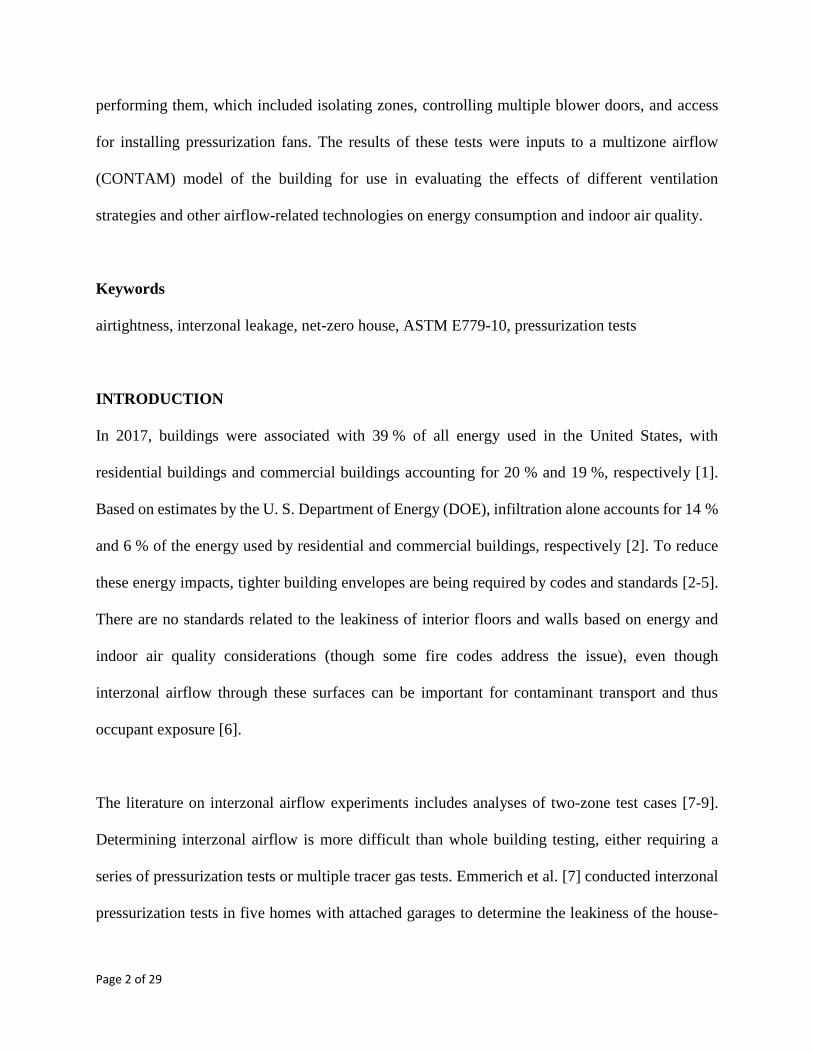
needed to solve for the ELAs of the following building surfaces: roof (LR), basement wall
(LBW), living area (first floor/second floor) walls (LW), attic floor (LAF), and basement ceiling
leakage (LBC) (illustrated in FIG. 3).
(3) The simultaneous solution of this system of equations resulted in values of C for each of the
list building surfaces. C was converted to effective leakage, L, using the following equation
Page 9 of 29
[24]:
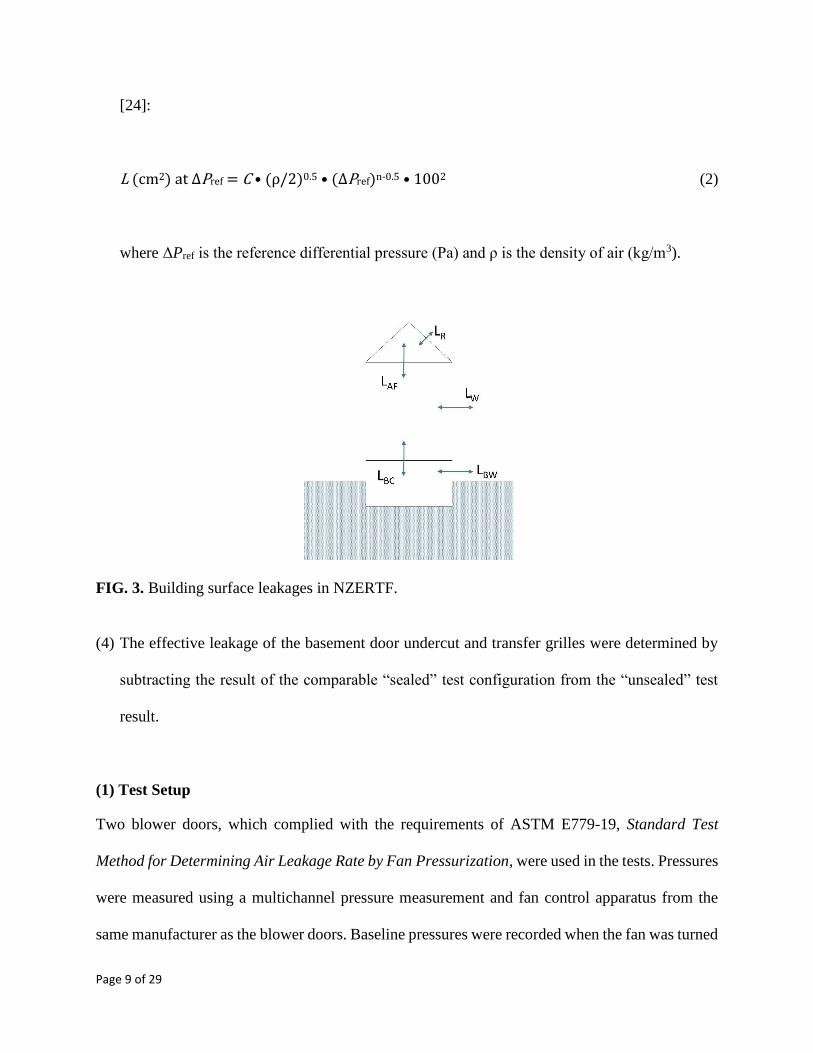
L (cm2) at ΔPref = C • (ρ/2)0.5 • (ΔPref)n-0.5 • 1002 (2)
where ΔPref is the reference differential pressure (Pa) and ρ is the density of air (kg/m3).
FIG. 3. Building surface leakages in NZERTF.
(4) The effective leakage of the basement door undercut and transfer grilles were determined by
subtracting the result of the comparable “sealed” test configuration from the “unsealed” test
result.
(1) Test Setup
Two blower doors, which complied with the requirements of ASTM E779-19, Standard Test
Method for Determining Air Leakage Rate by Fan Pressurization, were used in the tests. Pressures
were measured using a multichannel pressure measurement and fan control apparatus from the
same manufacturer as the blower doors. Baseline pressures were recorded when the fan was turned

Page 10 of 29
off before and after each blower door test. These values were then averaged and subtracted from
each measured pressure recorded during the test, as outlined in ASTM E779. The data logging and
control software allowed for the simultaneous measurement of differential pressures across the fan
and at three locations throughout the house. The software was setup to record differential pressures
and fan flow rates between 10 Pa and 60 Pa in increments of 5 Pa, in both pressurization and
depressurization modes. The software also provided the ability to take 100 pressure differential
readings at each incremental differential pressure value and report the average. All tests were
conducted over two weeks in November 2016, during which time the average indoor temperature
was 21 °C, outdoor temperature was 7 °C and wind speed was 4 m/s.
(2) Test Configurations
Five house configurations were tested, varying the placement of the fan and open/closed status of
exterior and interior doors (FIG. 4). All tests were successfully executed except for Test #3, which
required the attic pressure to be at the same as the outside pressure. The existing opening in the
attic (makeup-air duct) was not large enough to neutralize the attic-outdoor pressure. Details of
each test and the mathematical expressions used to represent each test are described in the
following sections.

Page 11 of 29
(a) Test #1 (b) Test #2 (c) Test #3 (d) Test #4 (e) Test #5
FIG. 4. Five house configurations for determining external and interzonal leakage.
Test #1
For this test configuration, the blower door was placed in the front doorway of the house, and both
the basement door and attic hatch remained open. Pressure differentials with respect to the
outdoors were measured in the basement, attic, and living room to ensure that the induced pressure
across the building envelope was uniform across the entire house. Two subconfigurations (“A”
and “B”) were also tested: in Test #1A the exterior dryer and kitchen exhaust vents were unsealed
and in Test #1B, these vents were sealed.
Test #1 was represented as an electrical circuit with three “resistances” (analogous to the flow
coefficient C) in parallel (FIG. 5). The sum of the flow through each branch of the “circuit” is
equal to Q1, which was the measured airflow delivered by the blower door fan test to yield values
of C1 and 𝑛1:
𝑄1 = 𝐶1Δ𝑃1𝑛1 = 𝐶𝑅Δ𝑃𝑅1
𝑛1 + 𝐶𝑊Δ𝑃𝑊1
𝑛1 + 𝐶𝐵𝑊Δ𝑃𝐵𝑊1
𝑛1 (3)

Page 12 of 29
Note that the value of 𝑛1 is assumed to be the same for all surfaces in Eq. (3). No tests were
performed to determine these values of n individually as part of Test #1. The subscript 1 denotes
Test #1, and subscripts R, BW, and W denote the building surfaces (roof, basement wall and walls,
respectively). On the basis of consideration of the similarity in airtightness of the exterior surfaces
throughout the house, and the inability to measure them separately, we assumed that the following
relationship:
CR/Aroof = CBW/Abasement wall = CW/Awalls (4)
FIG. 5. Electrical circuit equivalent of Test #1
Test #2
For this test configuration, the blower door was placed in the front doorway. The basement door
was closed and the attic hatch was opened. Four subconfigurations (A, B, C, and D) were tested,
varying the sealing and unsealing of the first floor transfer grilles (between the first floor and the
basement) and the sealing and unsealing of the basement door undercut as summarized in Table 2.
Page 13 of 29
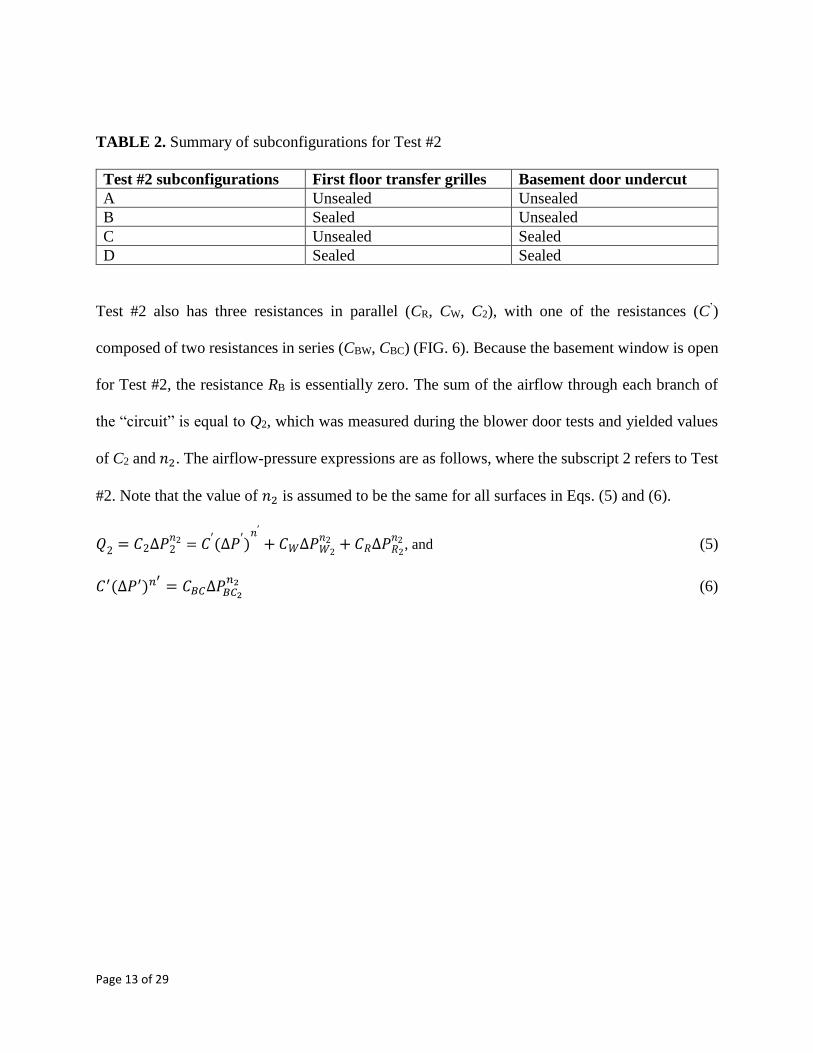
TABLE 2. Summary of subconfigurations for Test #2
Test #2 subconfigurations First floor transfer grilles Basement door undercut
A Unsealed Unsealed
B Sealed Unsealed
C Unsealed Sealed
D Sealed Sealed
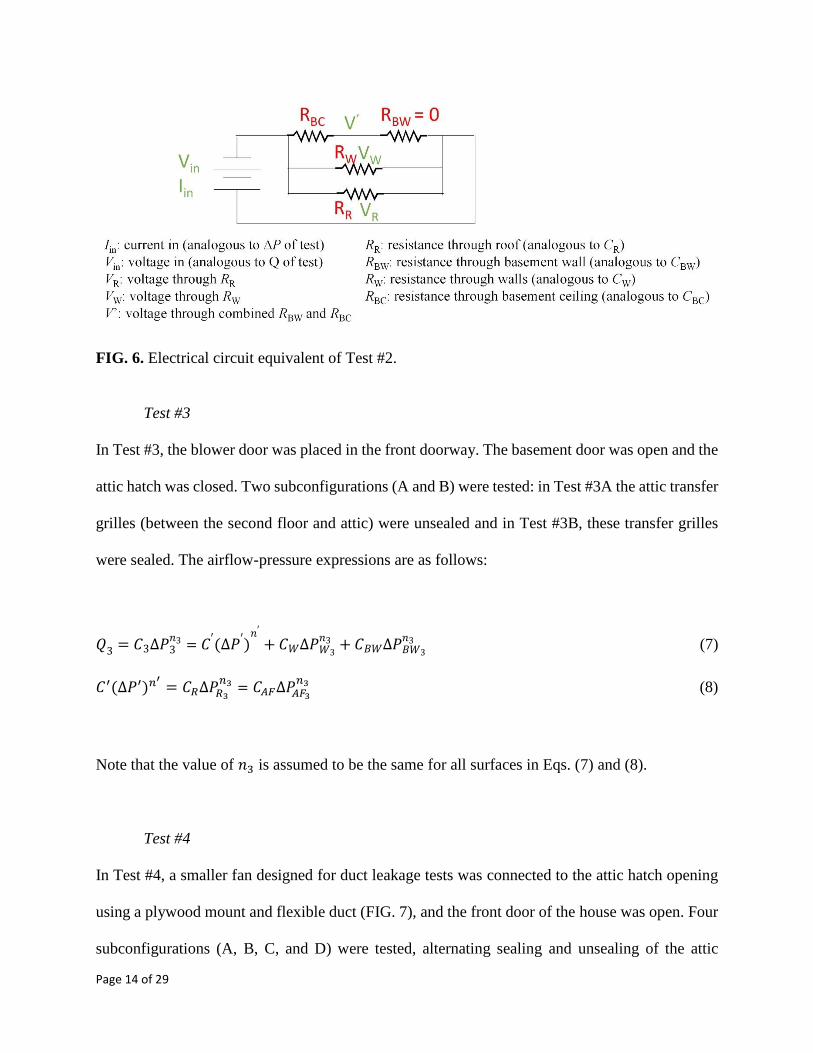
Test #2 also has three resistances in parallel (CR, CW, C2), with one of the resistances (C’)
composed of two resistances in series (CBW, CBC) (FIG. 6). Because the basement window is open
for Test #2, the resistance RB is essentially zero. The sum of the airflow through each branch of
the “circuit” is equal to Q2, which was measured during the blower door tests and yielded values
of C2 and 𝑛2. The airflow-pressure expressions are as follows, where the subscript 2 refers to Test
#2. Note that the value of 𝑛2 is assumed to be the same for all surfaces in Eqs. (5) and (6).
𝑄2 = 𝐶2Δ𝑃2𝑛2 = 𝐶′(Δ𝑃′)
𝑛′
+ 𝐶𝑊Δ𝑃𝑊2
𝑛2 + 𝐶𝑅Δ𝑃𝑅2
𝑛2 , and (5)
𝐶′(Δ𝑃′)𝑛′= 𝐶𝐵𝐶Δ𝑃𝐵𝐶2
𝑛2 (6)
Page 14 of 29
FIG. 6. Electrical circuit equivalent of Test #2.
Test #3
In Test #3, the blower door was placed in the front doorway. The basement door was open and the
attic hatch was closed. Two subconfigurations (A and B) were tested: in Test #3A the attic transfer
grilles (between the second floor and attic) were unsealed and in Test #3B, these transfer grilles
were sealed. The airflow-pressure expressions are as follows:
𝑄3 = 𝐶3Δ𝑃3𝑛3 = 𝐶′(Δ𝑃′)
𝑛′
+ 𝐶𝑊Δ𝑃𝑊3
𝑛3 + 𝐶𝐵𝑊Δ𝑃𝐵𝑊3
𝑛3 (7)
𝐶′(Δ𝑃′)𝑛′= 𝐶𝑅Δ𝑃𝑅3
𝑛3 = 𝐶𝐴𝐹Δ𝑃𝐴𝐹3
𝑛3 (8)
Note that the value of 𝑛3 is assumed to be the same for all surfaces in Eqs. (7) and (8).
Test #4
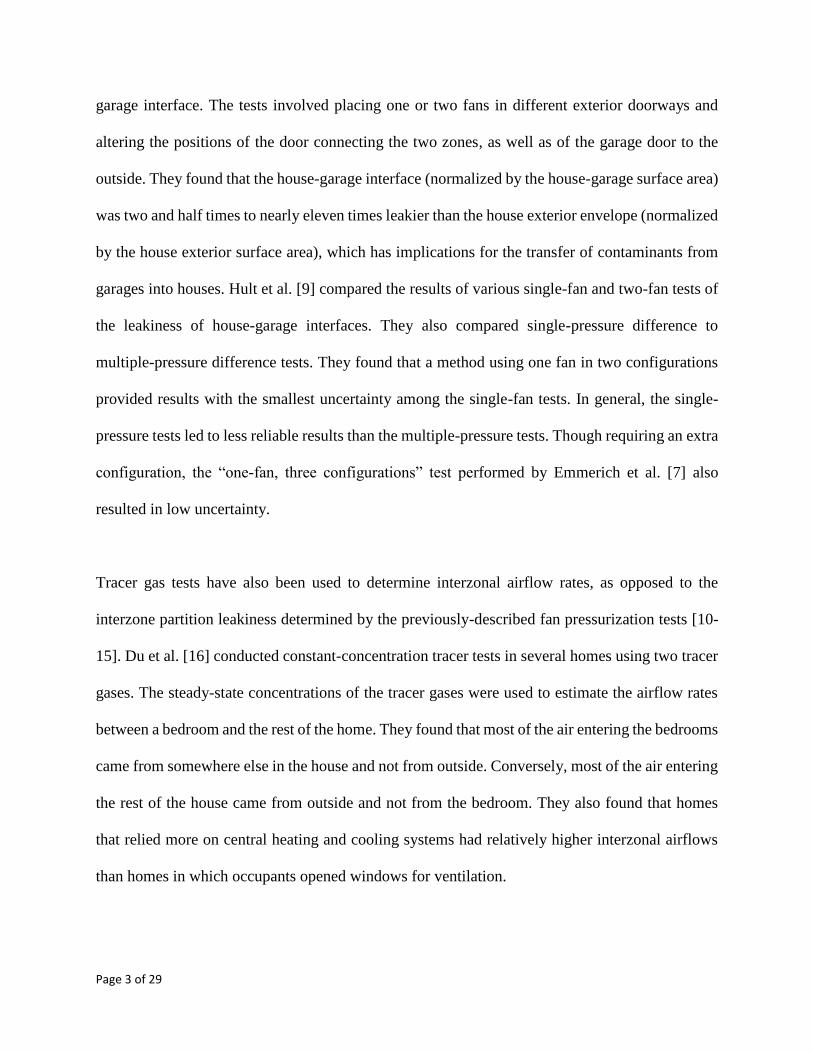
In Test #4, a smaller fan designed for duct leakage tests was connected to the attic hatch opening
using a plywood mount and flexible duct (FIG. 7), and the front door of the house was open. Four
subconfigurations (A, B, C, and D) were tested, alternating sealing and unsealing of the attic

Page 15 of 29
transfer grilles (between the second floor and the attic) and makeup-air duct in the attic (Table 3).
The airflow-pressure expression is as follows:
𝑄4 = 𝐶4Δ𝑃4𝑛4 = 𝐶𝑅Δ𝑃𝑅4
𝑛4 + 𝐶𝐴𝐹Δ𝑃𝐴𝐹4
𝑛4 (9)
Note that the value of 𝑛4 is assumed to be the same for all surfaces in Eq. (9).
FIG. 7. Plywood mount for smaller fan in attic hatch opening.
TABLE 3. Summary of subconfigurations for Test #4.
Test #4 subconfigurations Attic transfer grilles Makeup-air duct
A Sealed Unsealed
B Unsealed Unsealed
C Sealed Sealed
D Unsealed Sealed
Page 16 of 29
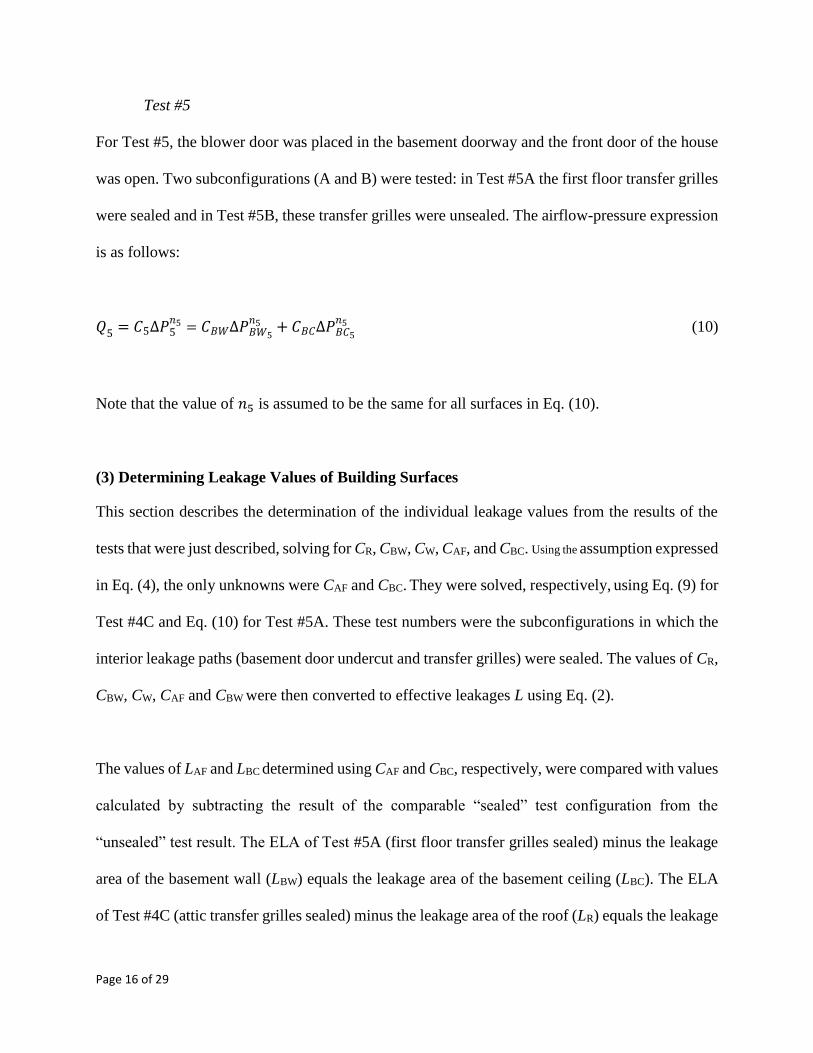
Test #5
For Test #5, the blower door was placed in the basement doorway and the front door of the house
was open. Two subconfigurations (A and B) were tested: in Test #5A the first floor transfer grilles
were sealed and in Test #5B, these transfer grilles were unsealed. The airflow-pressure expression
is as follows:
𝑄5 = 𝐶5Δ𝑃5𝑛5 = 𝐶𝐵𝑊Δ𝑃𝐵𝑊5
𝑛5 + 𝐶𝐵𝐶Δ𝑃𝐵𝐶5
𝑛5 (10)
Note that the value of 𝑛5 is assumed to be the same for all surfaces in Eq. (10).
(3) Determining Leakage Values of Building Surfaces
This section describes the determination of the individual leakage values from the results of the
tests that were just described, solving for CR, CBW, CW, CAF, and CBC. Using the assumption expressed
in Eq. (4), the only unknowns were CAF and CBC. They were solved, respectively, using Eq. (9) for
Test #4C and Eq. (10) for Test #5A. These test numbers were the subconfigurations in which the
interior leakage paths (basement door undercut and transfer grilles) were sealed. The values of CR,
CBW, CW, CAF and CBW were then converted to effective leakages L using Eq. (2).
The values of LAF and LBC determined using CAF and CBC, respectively, were compared with values
calculated by subtracting the result of the comparable “sealed” test configuration from the
“unsealed” test result. The ELA of Test #5A (first floor transfer grilles sealed) minus the leakage
area of the basement wall (LBW) equals the leakage area of the basement ceiling (LBC). The ELA
of Test #4C (attic transfer grilles sealed) minus the leakage area of the roof (LR) equals the leakage

Page 17 of 29
area of the attic floor (LAF).
(4) Determining Leakage Values of Basement Door Undercut and Transfer Grilles
The leakages of the basement door undercut and transfer grilles were determined by subtracting
the result of the comparable “sealed” test configuration from the “unsealed” test result. The
solution process for each building component is described below:
The effective leakage of the basement door undercut was calculated two ways:
(1) ELA Test #2 with first floor transfer grilles unsealed: ELA2A (door undercut unsealed)
minus ELA2C (door undercut sealed)
(2) ELA Test #2 with first floor transfer grilles sealed: ELA2B (door undercut unsealed)
minus ELA2D (door undercut sealed).
The effective leakage of the first floor transfer grilles was calculated three ways:
(1) ELA Test #2 basement door undercut unsealed: ELA2A (transfer grilles unsealed) minus
ELA2B (transfer grilled sealed)
(2) ELA Test #2 basement door undercut sealed: ELA2C (transfer grilles unsealed) minus
ELA2D (transfer grilled sealed)
(3) ELA5A (transfer grilles unsealed) minus ELA5B (transfer grilles sealed)
The effective leakage of the attic transfer grilles was calculated two ways:
(1) ELA Test #4 makeup-air duct sealed: ELA4A (transfer grilles unsealed) minus ELA4B
(transfer grilled sealed)
(2) ELA Test #4 makeup-air duct unsealed: ELA4C (transfer grilles unsealed) minus ELA4D

Page 18 of 29
(transfer grilled sealed).
RESULTS
This section summarizes the ELAs obtained from the 14 blower door tests. These ELAs are used
to calculate the leakiness of the roof, first and second floor walls, basement walls, basement
ceiling, and attic floor using derived flow coefficients. The test ELAs also are used to calculate the
effective leakages of the basement door undercut and transfer grilles. Lastly, results from
multizone airflow simulations of the NZERTF, using the calculated leakages as inputs, are
presented.
Effective leakages
The ELA at 50 Pa for all 14 tests were calculated using the procedures outlined in ASTM E779
(TABLE 4). The results are listed by test configuration (Test #1 to Test #5) and subconfiguration
denoting whether vents and other openings were sealed or unsealed. Because of the attic-outdoor
pressure not being able to be neutralized, the results of Tests #3A and #3B actually captured the
leakage of the basement wall, first and second floor walls, and the combined leakage of the attic
floor and roof. With the attic floor being so leaky relative to the attic roof (see TABLE 5 and
subsequent explanation), Test #3 results closely matched the results of Test #1B, which captured
the combined leakage of basement wall, first and second floor walls, and attic roof. (The exterior
dryer and kitchen exhaust vents were sealed during these three tests.) For Tests #1 and #3, n = 0.65
on average, ranging from n = 0.64 to n = 0.67.
As expected, the ELAs of Tests #2, #4, and #5 (which include the combined leakage of exterior
and interior leakages) are greater than the ELAs of Test #1 (exterior envelope only) because
attention was paid to minimizing the leakiness of the exterior envelope. No attention was paid to

Page 19 of 29
the leakiness of the basement ceiling or attic floor, which is reasonable because both the basement
and attic are within the conditioned volume. The ELAs of Test #4 were the highest of the tests,
which indicated that the attic floor was leakier than the basement ceiling. This was also verified
by further analysis presented below. For Tests #2, #4, and #5, n = 0.61 on average (ranging from
n = 0.58 to n = 0.68), which was smaller than the average of the n values for Tests #1 and #3 (tests
of the exterior envelope leakage).
TABLE 4. Summary of ELA at 50 Pa for five test configurations and their subconfigurations.
Test
number Leakage determined
ELA at 50
Pa (cm2)
95 % confidence
interval (+/- cm2)
1A LR+LBW+LW (vents unsealed) 237 7
1B LR+LBW+LW (vents sealed) 200 3
2A LR+LW + (LBW + LBC)1 898 12
2B LR+LW + (LBW + LBC)1 676 9
2C LR+LW + (LBW + LBC)1 765 8
2D LR+LW + (LBW + LBC)1 539 9
3A LBW+LW + (LR + LAF)1 202 4
3B LBW+LW + (LR + LAF)1 204 3
4A LR + LAF1 696 16
4B LR + LAF1 914 51
4C LR + LAF1 694 17
4D LR + LAF1 941 30
5A LBW + LBC (first floor grilles
sealed) 611 4
5B LBW + LBC (first floor grilles
unsealed) 836 6
1. See the section, “Test Configurations”, for descriptions of the various subconfigurations.
As discussed in the section, “Methodology”, the ELAs of the tests are used to calculate C and L of
the various building components (i.e., roof, walls, floor). The values of CR, CBW, and CW were
converted to effective leakages, L, using Eq. (1) and then normalized by their respective surface
areas in TABLE 1. The assumption in Eq. (4), L’R = L’
W = L’BW, where the prime notation indicating

Page 20 of 29
L is normalized by surface area, is given in TABLE 5. TABLE 5 also shows the results of
calculating LAF and LBC two ways, (1) by determining CAF and CBW and then converting to L and
(2) by subtracting the result of the comparable “sealed” test configuration from the “unsealed” test
result. TABLE 5 shows the average calculated LAF = 618 cm2 at 50 Pa (95 % confidence interval
(CI) 567 cm2 to 655 cm2) when calculated using CAF and shows that the average calculated LAF =
606 cm2 at 50 Pa (95 % CI 596 cm2 to 620 cm2) when calculated using ELA4C – LR. There was
only a 2 % difference in LAF calculated by these two methods.
TABLE 5 shows the average calculated LBC = 614 cm2 at 50 Pa (95 % CI 594 cm2 to 634 cm2)
when calculated using CBC and shows the average calculated LBC = 611 cm2 at 50 Pa (95 % CI 596
cm2 to 620 cm2) when calculated using ELA5A – LBW (< 1 % difference). The last column of
TABLE 5 shows the effective leakages normalized by their respective surface area or per item.
The attic floor (4.66 cm2/m2 at 50 Pa) is about 15 % leakier than the basement ceiling (4.01 cm2/m2
at 50 Pa) The attic floor and basement ceiling are also about 10 times leakier than the exterior
envelope (0.48 cm2/m2 at 50 Pa). The leakage area of the attic floor (606 cm2 at 50 Pa) is greater
than the leakage of the attic transfer grilles (233 cm2 at 50 Pa). The leakage of the basement ceiling
(611 cm2 at 50 Pa) is greater than the leakage of the first floor transfer grilles (224 cm2 at 50 Pa).
TABLE 5. Flow coefficient and calculated leakages of building components.
C (m3/s•Pa) L from Eq. (2)
(cm2)
L using ELATest# (cm2) L' (cm2/m2 or
per item)
Roof CR=0.006 LR=88
N/A
0.48 cm2/m2
Basement wall CBW=0.00005 LBW=1 0.48 cm2/m2
First and second
floor walls CW=0.010 LW=150
0.48 cm2/m2
Attic floor CAF=0.041 LAF=618 LAF=ELA4C – LR = 606 4.66 cm2/m2
Basement ceiling CBC=0.049 LBC=614 LBC=ELA5A – LBW = 611 4.05 cm2/m2

Page 21 of 29
Basement door
undercut N/A N/A
ELA2A – ELA2C = 132
ELA2B – ELA2D = 137
135 cm2
First floor
transfer grilles
(qty = 3)
N/A N/A
ELA2A – ELA2B = 221
ELA2C – ELA2D = 226
ELA5A – ELA5B = 225
75 cm2 per
transfer grille
Attic transfer
grilles (qty = 2) N/A N/A
ELA4A – ELA4B = 218
ELA4C – ELA4D = 248
116 cm2 per
transfer grille
SIMULATIONS
To evaluate the effects of different ventilation strategies on airflows and contaminant
concentrations in the NZERTF, the L' at 50 Pa (cm2/m2 or per item) in TABLE 5 were input into
a multizone airflow model of the house developed using CONTAM [26]. This CONTAM model
was also coupled with EnergyPlus, a whole-building energy analysis tool, to study the energy
implications of these airflows [27]. In a previous modeling study, preliminary estimates of the
interzone leakage values were used to predict formaldehyde and acetaldehyde concentrations
[28].
The CONTAM model considers the interaction between external forces driving airflow (inside-
outside temperature difference and wind) and building heating, ventilating, and air conditioning
(HVAC) system airflow rates to determine pressures and airflows across internal partitions and the
building envelope. CONTAM also accounts for external and internal contaminant sources and
removal mechanisms to calculate contaminant transport associated with the airflows. EnergyPlus
implements a multizone heat transfer model that accounts for conductive, convective and radiant
heat transfer associated with building materials; interzone and envelope airflows; and HVAC
systems. During cosimulation using the coupled model, indoor air temperatures and HVAC system
airflow rates are passed from EnergyPlus to CONTAM, and airflow rates across the building
envelope and between internal zones are passed from CONTAM to EnergyPlus [29, 30]. Details
Page 22 of 29
on the model and simulated concentrations of formaldehyde and acetaldehyde in the NZERTF are
given in .
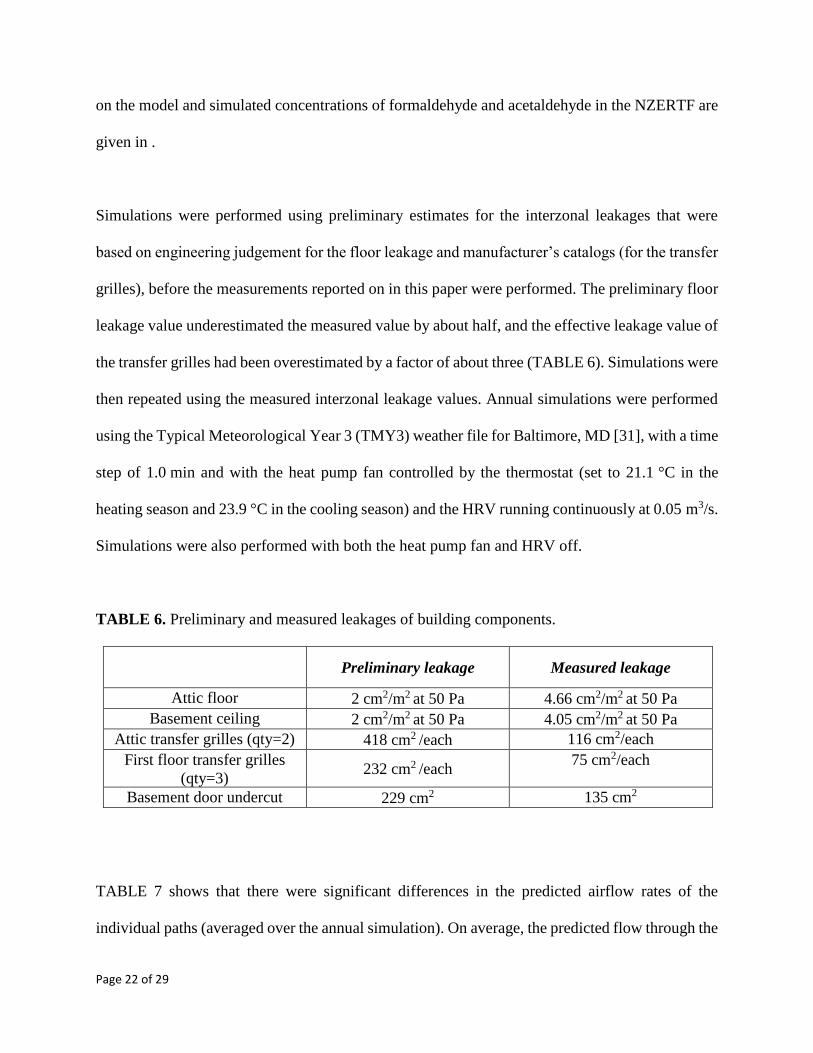
Simulations were performed using preliminary estimates for the interzonal leakages that were
based on engineering judgement for the floor leakage and manufacturer’s catalogs (for the transfer
grilles), before the measurements reported on in this paper were performed. The preliminary floor
leakage value underestimated the measured value by about half, and the effective leakage value of
the transfer grilles had been overestimated by a factor of about three (TABLE 6). Simulations were
then repeated using the measured interzonal leakage values. Annual simulations were performed
using the Typical Meteorological Year 3 (TMY3) weather file for Baltimore, MD [31], with a time
step of 1.0 min and with the heat pump fan controlled by the thermostat (set to 21.1 °C in the
heating season and 23.9 °C in the cooling season) and the HRV running continuously at 0.05 m3/s.
Simulations were also performed with both the heat pump fan and HRV off.
TABLE 6. Preliminary and measured leakages of building components.
Preliminary leakage Measured leakage
Attic floor 2 cm2/m2 at 50 Pa 4.66 cm2/m2 at 50 Pa
Basement ceiling 2 cm2/m2 at 50 Pa 4.05 cm2/m2 at 50 Pa
Attic transfer grilles (qty=2) 418 cm2 /each 116 cm2/each
First floor transfer grilles
(qty=3) 232 cm2 /each
75 cm2/each
Basement door undercut 229 cm2 135 cm2
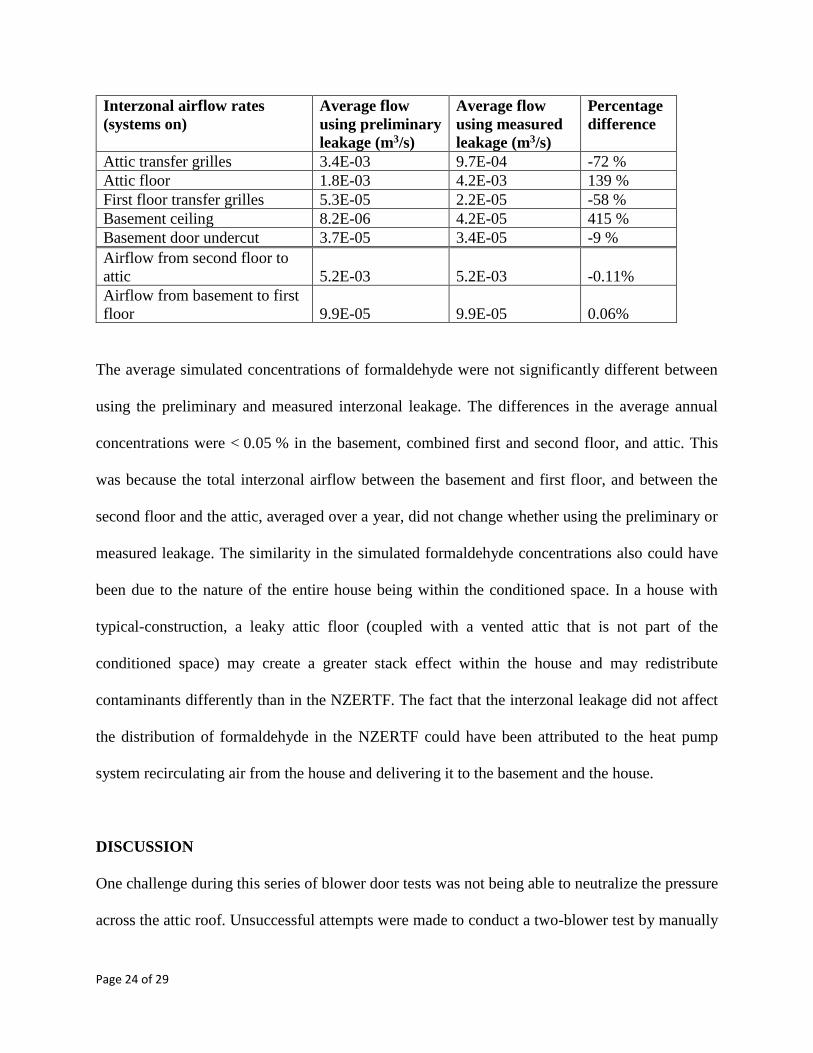
TABLE 7 shows that there were significant differences in the predicted airflow rates of the
individual paths (averaged over the annual simulation). On average, the predicted flow through the

Page 23 of 29
basement ceiling and attic floor using the measured leakage was higher than the value using the
preliminary leakage. In contrast, the predicted flow through attic, first floor transfer grilles, and
basement door undercut using the measured leakage were lower using the preliminary leakage.
Note that the total airflow from the basement to the first floor, and from the second floor to the
attic, were the same for the preliminary and measured leakage when averaged over a year
(differences < 0.5 %). It may be that no change was observed in the average interzonal airflow
because the exterior building leakage was comparatively airtight (ten times more airtight) and
changes to the interzonal leakage were not great enough to affect the overall airflow pattern within
the house.
The heat pump system was 100 % recirculating and the HRV was balanced. Although there were
only heat pump supplies in the basement (no returns), whether the systems were on or off, the
total infiltration was the same. With the systems off (details not shown for brevity), the airflow
from the basement to the first floor decreased by 4 % because the heat pump was no longer
supplying air to the basement. The only outside air supplied to the basement, when the heat
pump and HRV was off, would have been through the basement wall, which had an ELA of
1 cm2 at 50 Pa (0.48 cm2/m2 multiplied by the wall area of 2 m2). With the systems off, the
airflow from the second floor to the attic increased by 25 % to balance the decrease of air from
the basement to the first floor.
TABLE 7. Predicted interzonal airflow rates using preliminary and measured leakage averaged
over a year
Page 24 of 29
Interzonal airflow rates
(systems on)
Average flow
using preliminary
leakage (m3/s)
Average flow
using measured
leakage (m3/s)
Percentage
difference
Attic transfer grilles 3.4E-03 9.7E-04 -72 %
Attic floor 1.8E-03 4.2E-03 139 %
First floor transfer grilles 5.3E-05 2.2E-05 -58 %
Basement ceiling 8.2E-06 4.2E-05 415 %
Basement door undercut 3.7E-05 3.4E-05 -9 %
Airflow from second floor to
attic 5.2E-03 5.2E-03 -0.11%
Airflow from basement to first
floor 9.9E-05 9.9E-05 0.06%
The average simulated concentrations of formaldehyde were not significantly different between
using the preliminary and measured interzonal leakage. The differences in the average annual
concentrations were < 0.05 % in the basement, combined first and second floor, and attic. This
was because the total interzonal airflow between the basement and first floor, and between the
second floor and the attic, averaged over a year, did not change whether using the preliminary or
measured leakage. The similarity in the simulated formaldehyde concentrations also could have
been due to the nature of the entire house being within the conditioned space. In a house with
typical-construction, a leaky attic floor (coupled with a vented attic that is not part of the
conditioned space) may create a greater stack effect within the house and may redistribute
contaminants differently than in the NZERTF. The fact that the interzonal leakage did not affect
the distribution of formaldehyde in the NZERTF could have been attributed to the heat pump
system recirculating air from the house and delivering it to the basement and the house.
DISCUSSION
One challenge during this series of blower door tests was not being able to neutralize the pressure
across the attic roof. Unsuccessful attempts were made to conduct a two-blower test by manually

Page 25 of 29
adjusting the speed of the blower door in the front doorway and smaller fan in the attic hatch
opening. The authors will attempt a two-blower test using additional fan control devices in the
future.
Blower door test results showed that the interior floors were approximately 10 times leakier than
the exterior building envelope and that the leakage associated with the transfer grilles between
levels was less than the total floor leakage. Considering that all the levels of the NZERTF were all
within the conditioned space, the leaky interior floors do not pose an energy penalty (i.e., cold air
from the basement flowing up to house, and conditioned air from house flowing out through the
roof) when paired with a tight exterior envelope. In a home of more typical construction, however,
in which the attic is not within the conditioned space and the exterior walls are not as tight, there
could be a significant energy penalty as conditioned air escapes to the attic and out the roof vents.
There were no significant differences in the total interzonal airflows between the levels of the
NZERTF, and no significant differences in the simulated formaldehyde concentrations, using
preliminary and measured interzonal leakage in the NZERTF (both averaged over a year). Reasons
for this lack of difference in the annual averages may include the fact that the zones within the
NZERTF were all within the conditioned envelope. Thus cold basements and hot attics did not
create as great a stack effect as created in homes with only living areas within the conditioned
space. Also, the heat pump in the NZERTF recirculated air between the basement, first floor, and
second floor, which may not be the case in all homes. Last, as noted, no change was observed in
the average interzonal airflow because the exterior building leakage was comparatively airtight
(10 times more airtight) and changes to the interzonal leakage were not great enough to affect the
Page 26 of 29
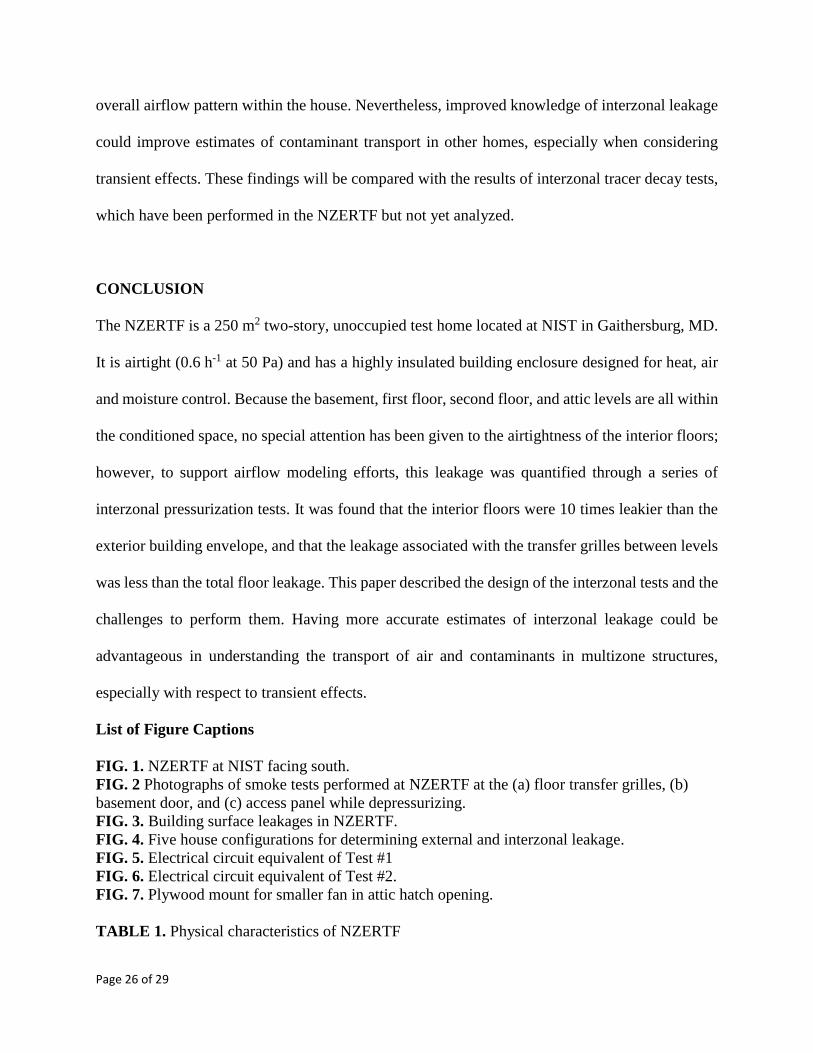
overall airflow pattern within the house. Nevertheless, improved knowledge of interzonal leakage
could improve estimates of contaminant transport in other homes, especially when considering
transient effects. These findings will be compared with the results of interzonal tracer decay tests,
which have been performed in the NZERTF but not yet analyzed.
CONCLUSION
The NZERTF is a 250 m2 two-story, unoccupied test home located at NIST in Gaithersburg, MD.
It is airtight (0.6 h-1 at 50 Pa) and has a highly insulated building enclosure designed for heat, air
and moisture control. Because the basement, first floor, second floor, and attic levels are all within
the conditioned space, no special attention has been given to the airtightness of the interior floors;
however, to support airflow modeling efforts, this leakage was quantified through a series of
interzonal pressurization tests. It was found that the interior floors were 10 times leakier than the
exterior building envelope, and that the leakage associated with the transfer grilles between levels
was less than the total floor leakage. This paper described the design of the interzonal tests and the
challenges to perform them. Having more accurate estimates of interzonal leakage could be
advantageous in understanding the transport of air and contaminants in multizone structures,
especially with respect to transient effects.
List of Figure Captions
FIG. 1. NZERTF at NIST facing south.
FIG. 2 Photographs of smoke tests performed at NZERTF at the (a) floor transfer grilles, (b)
basement door, and (c) access panel while depressurizing.
FIG. 3. Building surface leakages in NZERTF.
FIG. 4. Five house configurations for determining external and interzonal leakage.
FIG. 5. Electrical circuit equivalent of Test #1
FIG. 6. Electrical circuit equivalent of Test #2.
FIG. 7. Plywood mount for smaller fan in attic hatch opening.
TABLE 1. Physical characteristics of NZERTF

Page 27 of 29
TABLE 2. Summary of subconfigurations for Test #2
TABLE 3. Summary of subconfigurations for Test #4.
TABLE 4. Summary of ELA at 50 Pa for five test configurations and their subconfigurations.
TABLE 5. Flow coefficient and calculated leakages of building components.
REFERENCES
REFERENCES
1. U.S. Energy Information Administration, ed., Annual Energy Outlook 2018 with
Projections to 2050 (Washington, DC: U.S. Energy Information Administration, 2018),
127.
2. Windows and Building Envelope Research and Development: Roadmap for Emerging
Technologies" (Washington, DC: U.S. Department of Energy, 2014).
3. Energy Standard for Buildings Except Low-Rise Residential Buildings,
ANSI/ASHRAE/IES Standard 90.1-2016 (Atlanta, GA: American Society of Heating,
Refrigerating and Air-Conditioning Engineers, 2016).
4. U.S. Army Corps of Engineers Air Leakage Test Protocol for Building Envelopes
(Chapaign, IL: U.S. Army Corps of Engineers Research and Development Center, 2012).
5. International Energy Conservation Code (Washington, DC: International Code Council,
2015).
6. M. Jayjock and A. A. Havics, "Residential Inter-Zonal Ventilation Rates for Exposure
Modeling," Journal of Occupational and Environmental Hygiene 15, no. 5 (2018): 376–
388, http://doi.org/10.1080/15459624.2018.1438615
7. S. J. Emmerich, J. E. Gorfain, and C. Howard-Reed, "Air and Pollutant Transport from
Attached Garages to Residential Living Spaces–Literature Review and Field Tests,"
International Journal of Ventilation 2, no. 3 (2003): 265–276, http://
doi.org/10.1080/14733315.2003.11683670
8. L. Du, S. Batterman, C. Godwin, J.-Y. Chin, E. Parker, M. Breen, W. Brakefield, T.
Robins, and T. Lewis, "Air Change Rates and Interzonal Flows in Residences, and the
Need for Multi-Zone Models for Exposure and Health Analyses," International Journal of
Environmental Research and Public Health 9, no. 12 (2012): 4639–4662, http://
doi.org/10.3390/ijerph9124639
9. E. L. Hult, M. H. Sherman, I. S. and Walker, "Blower-Door Techniques for Measuring
Interzonal Leakage" (paper presentation, Buildings XII, Lawrence Berkeley National
Laboratory, Berkeley, CA, December 4-6, 2013).
10. C. F. A. Afonso, E. A. B. Maldonado, and E. Skåret, "A Single Tracer-Gas Method to
Characterize Multi-Room Air Exchanges," Energ Buildings 9, no. 4 (1986): 273–280.
11. F. D. Heidt, R. Rabenstein, and G. Schepers, "Comparison of Tracer Gas Methods for
Measuring Airflows in Two-zone Buildings," Indoor Air 1, no. 3 (1991): 297–309.
12. S. L. Miller, K. Leiserson, and W. W. Nazaroff, "Nonlinear Least-Squares Minimization
Applied to Tracer Gas Decay for Determining Airflow Rates in a Two-Zone Building,"
Indoor Air 7, no. 1 (1997): 64–75, http://doi.org/doi:10.1111/j.1600-0668.1997.t01-1-
00008.x

Page 28 of 29
13. P. J. O'Neill and R. R. Crawford, "Identification of Flow and Volume Parameters in Multi-
Zone Systems Using a Single-Gas Tracer Technique," ASHRAE Transactions 1991, no. 1
(1997): 49–54.
14. M. Enai, N. Aratani, C. Y. Shaw, and J. T. Reardon (1993). Differential and integral
method for computing interzonal airflows using multiple tracer gases. Proceedings of
International Symposium on Room Air Convection and Ventilation Effectiveness
(ISRACVE), 22-24 July, 1992 Tokyo, Japan, Atlanta: ASHRAE, 357-362.
15. R. P. Sieber, R. W. Besant, and G. J. Schoenau, "Variations in Interzonal Airflow Rates in
a Detached House Using Tracer Gas Techniques" r presentation, ASHRAE Transactions
99, (1993): 699–708.
16. L. Du, S. Batterman, C. Godwin, Z. Rowe, and J. Y. Chin, "Air Exchange Rates and
Migration of VOCs in Basements and Residences," Indoor Air 25, no. 6 (2015): 598–609,
http://doi.org/10.1111/ina.12178
17. A. H. Fanney, V. Payne, T. Ullah, L. Ng, M. Boyd, F. Omar, M. Davis, H. Skye, B.
Dougherty, B. Polidoro, W. Healy, J. Kneifel, and B. Pettit, "Net-Zero and Beyond! Design
and Performance of NIST's Net-Zero Energy Residential Test Facility," Energy and
Buildings 101, no. 15 (2015): 95–109, http://doi.org/10.1016/j.enbuild.2015.05.002
18. F. Omar and S. T. Bushby, "Simulating Occupancy in the NIST Net-Zero Energy
Residential Test Facility" (Gaithersburg, MD: National Institute of Standards and
Technology, 2013).
19. L. Ng, A. Persily, and S. Emmerich (2015), “Infiltration and Ventilation in a Very Tight,
High Performance Home” Proceedings of 36th AIVC Conference Effective Ventilation
High Performance Buildings, Madrid, Spain, September 23–24, 2015, Brussels: AIVC,
719–726.
20. LEED BD+C: Homes, v4, LEED v4 (Washington, DC: U.S. Green Building Council,
2014).
21. ENERGY STAR Certified Homes, Version 3.1 (Rev. 06) (Washington, DC: U.S.
Environmental Protection Agency, 2015).
22. PHIUS + 2015: Passive Building Standard–North America" (Chicago, IL: Passive House
Institute US, 2015).
23. W. R. Chan, J. Joh, and M. H. Sherman, "Analysis of Air Leakage Measurements of US
Houses," Energy and Buildings 66 (November 2013): 616–625,
http://doi.org/10.1016/j.enbuild.2013.07.047
24. ASHRAE Handbook Fundamentals (Atlanta, GA: American Society of Heating,
Refrigerating and Air-Conditioning Engineers, 2017).
25. Standard Test Method for Determining Air Leakage Rate by Fan Pressurization ASTM
E779-19 (West Conshohocken, PA: ASTM International, 2019), www.astm.org
25. B. Pettit, C. Gates, A. H. Fanney, and W. Healy, "Design Challenges of the NIST Net-Zero
Energy Residential Test Facility" (Gaithersburg, MD: National Institute of Standards and
Technology, 2014)..
26. W. S. Dols and B. Polidoro, "CONTAM User Guide and Program Documentation"
(Gaithersburg, MD: National Institute of Standards and Technology, 2016).
27. EnergyPlus 8.4 (Washington, DC: U.S. Department of Energy, 2015).
28. L. Ng, D. Poppendieck, W. S. Dols, and S. J. Emmerich, "Evaluating Indoor Air Quality
and Energy Impacts of Ventilation in a Net-Zero Energy House Using a Coupled Model,"

Page 29 of 29
Science and Technology for the Built Environment 24, no. 2 (2017): 124–134,
https://doi.org/10.1080/23744731.2017.1401403
29. W. S. Dols, S. J. Emmerich, and B. J. Polidoro, "Coupling the Multizone Airflow and
Contaminant Transport Software CONTAM with EnergyPlus Using Co-simulation,"
Building Simulation 9 (2016): 469–479, http://doi.org/10.1007/s12273-016-0279-2
30. M. Wetter, "Co-simulation of Building Energy and Control Systems with the Building
Controls Virtual Test Bed," Journal of Building Performance Simulation 4, no. 3 (2011):
185–203, http://doi.org/10.1080/19401493.2010.518631
31. "National Solar Radiation Data Base: 1991–2005 Update: Typical Meteorological Year 3,"
(Lakewood, CO: National Renewable Energy Laboratory, 2015).
Related Documents