Ecological Engineering 37 (2011) 1112–1122 Contents lists available at ScienceDirect Ecological Engineering journal homepage: www.elsevier.com/locate/ecoleng Estimating heat flux transmission of vertical greenery ecosystem C.Y. Jim ∗ , Hongming He Department of Geography, The University of Hong Kong, Pokfulam Road, Hong Kong article info Article history: Received 26 July 2010 Received in revised form 25 January 2011 Accepted 15 February 2011 Available online 17 March 2011 Keywords: Vertical greening Green wall Global solar radiation Direct solar radiation Diffuse solar radiation Thermodynamics transmission model (TTM) Heat flux Thermal shielding coefficient abstract Nurturing vegetation on building envelopes provides an innovative and eco-friendly alternative to urban greening especially in compact cities. Whereas the thermal and other benefits of green roofs have been studied intensively, green walls have received scanty attention. This study evaluates the thermodynamic transmission process of the vertical greenery ecosystem. We designed a field experiment to monitor solar radiation and weather conditions, and developed a thermodynamics transmission model to sim- ulate heat flux and temperature variations. The model was calibrated, tested, and proved to be highly efficient. The results show that seasonal global and direct solar radiation drops to minimum in winter in January and February, and reaches maximum in summer in July and August (1168 W m −2 for global solar radiation and 889 W m −2 for direct solar radiation). Diffuse solar radiation attains maximum in summer (586 W m −2 ) with moderate rainfall in July and August, and minimum in winter with no rainfall in Jan- uary and February. Radiation transmission of the green wall strongly correlates with canopy transmittance and reflectance (R 2 = 0.83). Thermal shielding effectiveness varies with orientation, with the south wall achieving a higher coefficient (0.31) than the north wall. The south wall has lower heat flux absorbance and heat flux loss than the north wall. The south wall can transfer much more heat flux through the vertical greenery ecosystem due to more intensive canopy evapotranspiration effect. The model matches the transmission properties of green wall radiation, and the model simulation fits empirical transmission results. © 2011 Elsevier B.V. All rights reserved. 1. Introduction A comfortable and healthy environment is increasingly demanded to support urban sustainability. Vegetation plays an important role in this endeavour. In compact city areas with inad- equate street-level spaces for greening, building envelopes offer feasible alternatives. Whereas green roofs have been actively pro- moted in many cities, green walls (referring to walls covered by vegetation in the sense of building engineering and building physics) have received less attention. To understand the green city benefits, researchers have focused on the ameliorative effect of regulating the energy balance of urban areas, the quality of air flowing through the urban canopy and its acoustic property (Akbari et al., 1997; Bartzanas et al., 2005; Harmanto and Salokhe, 2006; Emilsson, 2008; Grigoletti et al., 2008; Halwatura and Jayasinghe, 2009; Teemusk and Mander, 2010). Vegetation covering a building could induce cooling of indoor space by reflecting and absorbing solar radiation, cool- ing by evapotranspiration, enhancing insulation, and acting as ∗ Corresponding author. Tel.: +852 2859 7020; fax: +852 2559 8994. E-mail address: [email protected] (C.Y. Jim). a thermal barrier. The vegetative shield provides an additional barrier between the building interior and the hot (or cold) exter- nal environment. The green plant protection mechanism helps to maintain the temperature differential between the interior and exterior of the building (Gomez et al., 1998; Miyawaki, 1998; Rosenfeld et al., 2001; Picot, 2004; Bartzanas et al., 2005; Kurpaska et al., 2005; Pearlmutter and Rosenfelda, 2005; Harmanto and Salokhe, 2006). The amount of cooling provided by a vegetated building depends greatly on weather conditions and on green- ery design and management (Wilmers, 1990; Panferov et al., 2001). It is important to explore quantitatively vegetation–atmosphere interactions in addressing solar energy transmission through the atmosphere to the vegetation canopy (Panferov et al., 2001; Chen et al., 2007). Various factors influence energy exchange and trans- mission of a vertical greenery (referring to walls covered by vegetation in the sense of ecological functions in an ecological sys- tem) ecosystem, such as weather condition, plant physiological function, and building structure. The amount of energy absorbed by an ecosystem is governed by the biophysical properties of the vegetation canopy (referring to the upper surface of vegetation), and the driving potentials established by temperature and humid- ity gradients between the surface and the atmosphere (Raupach, 0925-8574/$ – see front matter © 2011 Elsevier B.V. All rights reserved. doi:10.1016/j.ecoleng.2011.02.005

Welcome message from author
This document is posted to help you gain knowledge. Please leave a comment to let me know what you think about it! Share it to your friends and learn new things together.
Transcript

E
CD
a
ARRAA
KVGGDDT(HT
1
diefmbp
oaiH22ii
0d
Ecological Engineering 37 (2011) 1112–1122
Contents lists available at ScienceDirect
Ecological Engineering
journa l homepage: www.e lsev ier .com/ locate /eco leng
stimating heat flux transmission of vertical greenery ecosystem
.Y. Jim ∗, Hongming Heepartment of Geography, The University of Hong Kong, Pokfulam Road, Hong Kong
r t i c l e i n f o
rticle history:eceived 26 July 2010eceived in revised form 25 January 2011ccepted 15 February 2011vailable online 17 March 2011
eywords:ertical greeningreen walllobal solar radiationirect solar radiation
a b s t r a c t
Nurturing vegetation on building envelopes provides an innovative and eco-friendly alternative to urbangreening especially in compact cities. Whereas the thermal and other benefits of green roofs have beenstudied intensively, green walls have received scanty attention. This study evaluates the thermodynamictransmission process of the vertical greenery ecosystem. We designed a field experiment to monitorsolar radiation and weather conditions, and developed a thermodynamics transmission model to sim-ulate heat flux and temperature variations. The model was calibrated, tested, and proved to be highlyefficient. The results show that seasonal global and direct solar radiation drops to minimum in winter inJanuary and February, and reaches maximum in summer in July and August (1168 W m−2 for global solarradiation and 889 W m−2 for direct solar radiation). Diffuse solar radiation attains maximum in summer(586 W m−2) with moderate rainfall in July and August, and minimum in winter with no rainfall in Jan-
iffuse solar radiationhermodynamics transmission modelTTM)eat fluxhermal shielding coefficient
uary and February. Radiation transmission of the green wall strongly correlates with canopy transmittanceand reflectance (R2 = 0.83). Thermal shielding effectiveness varies with orientation, with the south wallachieving a higher coefficient (0.31) than the north wall. The south wall has lower heat flux absorbanceand heat flux loss than the north wall. The south wall can transfer much more heat flux through thevertical greenery ecosystem due to more intensive canopy evapotranspiration effect. The model matchesthe transmission properties of green wall radiation, and the model simulation fits empirical transmission
abnmeReSbe2
iae
results.
. Introduction
A comfortable and healthy environment is increasinglyemanded to support urban sustainability. Vegetation plays an
mportant role in this endeavour. In compact city areas with inad-quate street-level spaces for greening, building envelopes offereasible alternatives. Whereas green roofs have been actively pro-
oted in many cities, green walls (referring to walls coveredy vegetation in the sense of building engineering and buildinghysics) have received less attention.
To understand the green city benefits, researchers have focusedn the ameliorative effect of regulating the energy balance of urbanreas, the quality of air flowing through the urban canopy andts acoustic property (Akbari et al., 1997; Bartzanas et al., 2005;armanto and Salokhe, 2006; Emilsson, 2008; Grigoletti et al.,
008; Halwatura and Jayasinghe, 2009; Teemusk and Mander,010). Vegetation covering a building could induce cooling ofndoor space by reflecting and absorbing solar radiation, cool-ng by evapotranspiration, enhancing insulation, and acting as
∗ Corresponding author. Tel.: +852 2859 7020; fax: +852 2559 8994.E-mail address: [email protected] (C.Y. Jim).
mvtfbvai
925-8574/$ – see front matter © 2011 Elsevier B.V. All rights reserved.oi:10.1016/j.ecoleng.2011.02.005
© 2011 Elsevier B.V. All rights reserved.
thermal barrier. The vegetative shield provides an additionalarrier between the building interior and the hot (or cold) exter-al environment. The green plant protection mechanism helps toaintain the temperature differential between the interior and
xterior of the building (Gomez et al., 1998; Miyawaki, 1998;osenfeld et al., 2001; Picot, 2004; Bartzanas et al., 2005; Kurpaskat al., 2005; Pearlmutter and Rosenfelda, 2005; Harmanto andalokhe, 2006). The amount of cooling provided by a vegetateduilding depends greatly on weather conditions and on green-ry design and management (Wilmers, 1990; Panferov et al.,001).
It is important to explore quantitatively vegetation–atmospherenteractions in addressing solar energy transmission through thetmosphere to the vegetation canopy (Panferov et al., 2001; Chent al., 2007). Various factors influence energy exchange and trans-ission of a vertical greenery (referring to walls covered by
egetation in the sense of ecological functions in an ecological sys-em) ecosystem, such as weather condition, plant physiological
unction, and building structure. The amount of energy absorbedy an ecosystem is governed by the biophysical properties of theegetation canopy (referring to the upper surface of vegetation),nd the driving potentials established by temperature and humid-ty gradients between the surface and the atmosphere (Raupach,
nginee
1omtMmtwsb(2
df1Apbtdg(efiemctimrafpc
la1cscrosfeomeraenae
iSccyaH
isede
daerntveoe
2
2
picimtwcgrpatxip
ctpow(1dNSorfntsnart
C.Y. Jim, H. He / Ecological E
995; Baldocchi and Vogel, 1997; Wang et al., 2004). Partitioningf the incoming radiation into vegetation canopy absorption, trans-ission, reflection and transformation of absorbed energy help
o understand the interactions between solar energy and plants.any studies investigated such interactions using canopy radiationodels (Emilsson, 2008; Grigoletti et al., 2008). However, they tend
o emphasize the scattering behaviour of different vegetation types,hich is correlated with vegetation–atmosphere processes. Few
tudies evaluated the radiation regime within vegetation canopyy characterizing its state based on the law of energy conservationEmilsson, 2008; Grigoletti et al., 2008; Halwatura and Jayasinghe,009).
Various methods have been developed to study the thermo-ynamics of vertical greenery ecosystem. Some papers addressundamental research and important emerging applications (Holm,989; Bastianoni and Marchettini, 1997; Dufrene et al., 2005;lexandria and Jones, 2008; Sailor, 2008; Ip et al., 2010). For exam-le, the enhanced DOE-2.2-derived user-interface of eQUEST foruilding energy use simulation provides a perspective of simula-ion in the energy-efficient design process. The eQUEST software isesigned to perform detailed analysis of building design technolo-ies using sophisticated building energy use simulation techniquesJames J. Hirsch & Associates, 2009). A complete solution of thenergy transmission problem requires knowledge of the volumeeld of temperature and physical properties of the medium atach point of a system (Goldstein et al., 2003). Quantitative assess-ent of the interactions between solar radiation and vegetation
anopy demands specification of variables that determine radiationransport through the vegetation canopy. These variables includentrinsic canopy properties such as absorption, reflection and trans-
ission from the atmosphere into the canopy. The canopy radiationegime is a function of the optical properties of individual leavesnd ground surface under the canopy and canopy structure. Thiseature of the shortwave energy conservation in vegetation canopyrovides powerful means for accurate specification of changes inanopy structure.
Solar radiation is the primary energy source for physical, bio-ogical and chemical processes of plant photosynthesis, respirationnd associated transpiration (Nieto-Vesperinas, 1986; Palomo,998). Through combined consideration of landform and weatheronditions, analysis of heat flux variations at different time scalesuch as diurnal, seasonal and annual cycles have been widelyonducted (Theodosiou, 2003). The availability of accurate solaradiation data at the study location is essential. The separationf solar irradiance into diffuse and beam components is neces-ary for a wide range of solar engineering tasks and is now a keyeature of several canopy scale models of photosynthesis. It is nec-ssary to calculate accurately solar radiation especially when in situbservation is difficult. Time series analysis of solar radiation trans-ission between the atmosphere and vegetation canopy has been
mphasized in some studies (Roderick, 1999). However, the solaradiation transmission model for vertical greening has not beenttempted. Greenery on buildings is a combination of natural veg-tation and artificial structures, incurring marked differences fromatural conditions. A dedicated modelling study of the structurend parameters of solar radiation transmission should be consid-red.
The evaluation of shading performance of vertical plant canopys crucial to improve greenery system design and management.hading performance is affected by the biological–horticultural
haracteristics of the plant species and environmental growthonditions. Some investigations involve thermal performance anal-sis by establishing efficient solutions to determine the heatnd mass transfer processes (Pearlmutter and Rosenfelda, 2005;alwatura and Jayasinghe, 2009; Ip et al., 2010). They focus onrtotp
ring 37 (2011) 1112–1122 1113
dentifying the heat transfer parameters with influence on thehading performance of vertical climbing plant canopies (Wongt al., 2003, 2009, 2010). However, few studies address theelayed response of radiation transmission due to attenuationffect.
The primary objective of our study is to understand the thermo-ynamic transmission process of the vertical greenery ecosystem,nd to optimize its design to contribute to an eco-friendly urbannvironment. We developed a field experiment to monitor the solaradiation and weather conditions. We then proposed a thermody-amics transmission model (TTM) for vertical greenery ecosystemo simulate the dynamic heat flux transmission and temperatureariations. The model is calibrated and tested by observations of anmpirical experimental setup. It addresses specifically the processf thermodynamic transmission through the vertical green wallcosystem, and its solar radiation shielding effects.
. Materials and methods
.1. Experimental design and data acquisition
The primary procedure for data acquisition is to validate theroposed thermodynamics transmission model with high-quality
n situ observations. Observation of heat flux and temperature isarried out on the roof of the four-storied Runme Shaw Buildingn the University of Hong Kong to establish a thermal reduction
ap of different scenarios. The experiment (Fig. 1) consisted of fourreatments, including a south green wall, a north green wall (bothith length 150 cm × height 85 cm × width 35 cm), an unshielded
oncrete south wall, and an unshielded concrete north wall. Eachreen wall is composed of a plastic framework with interlockedeceptacles to receive 70 herbaceous plants, in seven rows with 10lants per row. A gap of 15 cm is kept between the concrete wallnd the green wall. A drip irrigation system provides supplemen-ary water supply. An evergreen perennial tropical plant, Euphorbia
lomi ‘Salmon’ (Supergrandiflora Salmon; Euphorbiaceae; orig-nated from Madagascar), which is a drought-tolerant succulentara-shrub, has been used for the experiment.
Data sources including solar radiation, microclimatic and soilonditions were automatically recorded at 15 min intervals withhe help of data loggers (8160, Lufft, Fellbach, Germany). Four com-onents of solar radiation were recorded, including incoming andutgoing shortwave, and incoming and outgoing longwave. Theyere detected by a four-in-one combination type of radiometer
CNR1, Kipp & Zonen, the Netherlands) mounted horizontally at50 cm above the soil surface. Soil heat flux was monitored by aedicated thermal transmission sensor (HFP01SC, Hukseflux, theetherlands). Soil moisture and temperature sensors (respectively-SMC and S-TMB, Onset Hobo, USA) were buried in different layersf the substrate. Surface temperature was assessed by an infraredadiometer made for outdoor use (SI-111, Apogee, USA). Six sur-aces were monitored continually: the vegetated surface of theorth and south green walls serving as experimental treatments,he concrete wall shielded by the north and south green wallserving as experimental treatments, and the unshielded concreteorth and south walls serving as controls. The infrared sensorsre all pointing at the centre of the target to obtain the mostepresentative data and to minimize the edge effect (Fig. 1). Thehermister air temperature probes (8160.TFF, Lufft, Germany) with
adiation shields were installed at 20 cm, 60 cm, and 200 cm abovehe ground surface at a nearby site. Meteorological factors werebserved using a weather station setup (Onset Hobo) located nearhe green wall site, including air relative humidity (RH), air tem-erature, and dew point.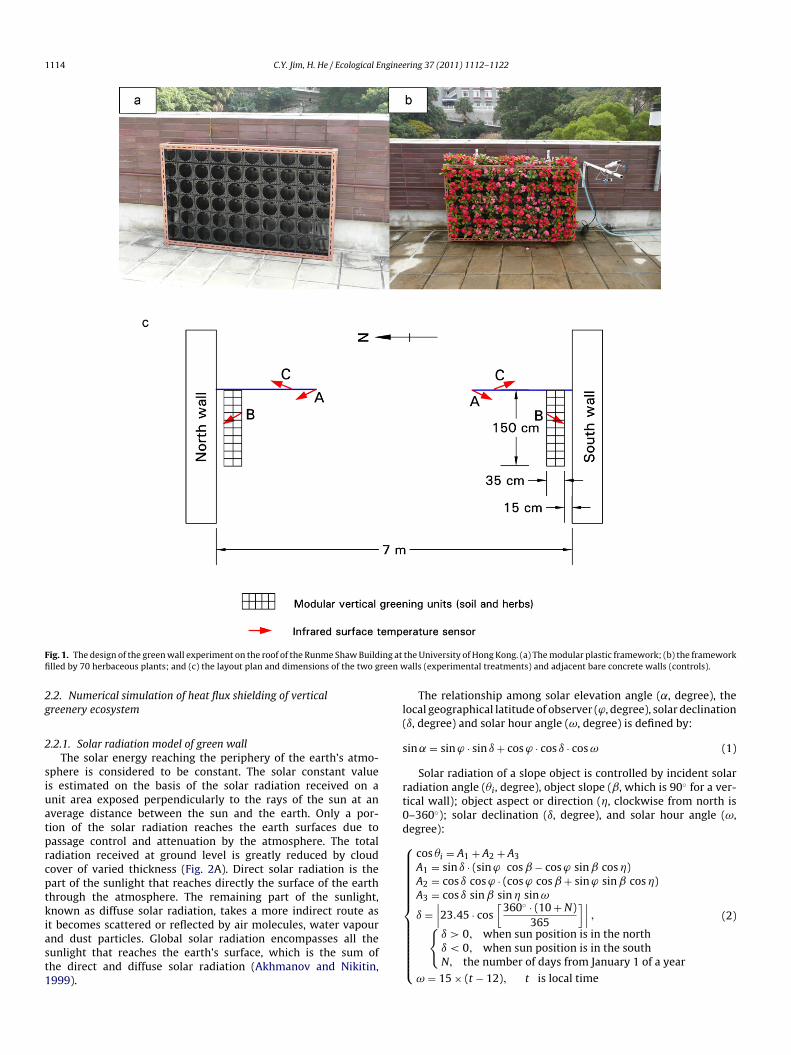
1114 C.Y. Jim, H. He / Ecological Engineering 37 (2011) 1112–1122
F ing atfi reen w
2g
2
siuatprcptkiast1
l(
s
rt0d⎧⎪⎪⎪⎪⎪⎪⎪⎪⎪⎪⎪⎨
ig. 1. The design of the green wall experiment on the roof of the Runme Shaw Buildlled by 70 herbaceous plants; and (c) the layout plan and dimensions of the two g
.2. Numerical simulation of heat flux shielding of verticalreenery ecosystem
.2.1. Solar radiation model of green wallThe solar energy reaching the periphery of the earth’s atmo-
phere is considered to be constant. The solar constant values estimated on the basis of the solar radiation received on anit area exposed perpendicularly to the rays of the sun at anverage distance between the sun and the earth. Only a por-ion of the solar radiation reaches the earth surfaces due toassage control and attenuation by the atmosphere. The totaladiation received at ground level is greatly reduced by cloudover of varied thickness (Fig. 2A). Direct solar radiation is theart of the sunlight that reaches directly the surface of the earthhrough the atmosphere. The remaining part of the sunlight,nown as diffuse solar radiation, takes a more indirect route as
t becomes scattered or reflected by air molecules, water vapournd dust particles. Global solar radiation encompasses all theunlight that reaches the earth’s surface, which is the sum ofhe direct and diffuse solar radiation (Akhmanov and Nikitin,999).⎪⎪⎪⎪⎪⎪⎪⎪⎪⎪⎪⎩
the University of Hong Kong. (a) The modular plastic framework; (b) the frameworkalls (experimental treatments) and adjacent bare concrete walls (controls).
The relationship among solar elevation angle (˛, degree), theocal geographical latitude of observer (ϕ, degree), solar declinationı, degree) and solar hour angle (ω, degree) is defined by:
in ˛ = sin ϕ · sin ı + cos ϕ · cos ı · cos ω (1)
Solar radiation of a slope object is controlled by incident solaradiation angle (�i, degree), object slope (ˇ, which is 90◦ for a ver-ical wall); object aspect or direction (�, clockwise from north is–360◦); solar declination (ı, degree), and solar hour angle (ω,egree):
cos �i = A1 + A2 + A3A1 = sin ı · (sin ϕ cos ˇ − cos ϕ sin ˇ cos �)A2 = cos ı cos ϕ · (cos ϕ cos ˇ + sin ϕ sin ˇ cos �)A3 = cos ı sin ˇ sin � sin ω
ı =∣∣∣23.45 · cos
[360◦ · (10 + N)
]∣∣∣ , (2)
365{ı > 0, when sun position is in the northı < 0, when sun position is in the southN, the number of days from January 1 of a year
ω = 15 × (t − 12), t is local time

C.Y. Jim, H. He / Ecological Engineering 37 (2011) 1112–1122 1115
Fig. 2. Parameters for the systematic characterization of solar radiation transmission through a green wall ecosystem. �i , �r and �t are angles that the incident, reflected andrefracted rays make respectively to the normal of the interface. A0B0C0D0, solar constant value (S0, 1367 W m−2); A1B1C1D1, solar radiation over the earth’s atmosphere (I0,W movint all; Q( anopyi
s{
mim1⎧⎪⎪⎪⎪⎨⎪⎪⎪⎪⎩
e{
w(1
awm{
dr{
dr
I
2(
tagbcsg(⎧⎪⎪⎪⎪⎨⎪⎪⎪⎪⎩maficob
r
m−2); A2B2C1D1, global solar radiation (IG0, W m−2); I� , radiation intensity afterhrough the green wall; QT , solar radiation received after moving through the green wQG) equals to the sum of transmission (Q� ), absorption (Q˛) and reflection (Q�) of cs a function of green wall thickness (mm).
As green wall is vertical (ˇ = 90), solar radiation of the north andouth aspect of green wall can be calculated by:
North wall : cos �i = cos ı · sin ωSouth wall : cos �i = sin ı · cos ϕ + cos ı · cos ω · sin ϕ
(3)
The sky clearness coefficient (�Dir) is function of atmosphereass (Mh of elevation h, a.s.l., and M0 of the average sea level
s 5.3 × 10¹⁸ kg), which is closely related to atmospheric pressureass (Ph of elevation h, a.s.l., and P0 of the average sea level is
01.325 kPa):
�dir = 0.56 · [exp(−0.56 · Mh) + exp(−0.095 · Mh)]
Mh = M0 · Ph
P0
M0 = [1229 + (614 · sin ˛)2]1/2 − 614 · sin ˛
ph
P0=
[(288 − 0.0065 · h)
288
]5.256
(4)
Direct solar radiation (Idir, W m−2) of slope object under consid-ration of sky clearness coefficient (�dir) is calculated by:
Idir = I0 · �dir · cos �i
I0 = S0 · (1 + 0.0344 · cos(
N · 360◦
365
)(5)
here I0 is the solar radiation over the earth’s atmosphereA1B1C1D1, W m−2); S0 is the solar constant value (A0B0C0D0,367 W m−2).
Diffuse solar radiation includes atmospheric diffusive solar radi-tion (Idif, W m−2) and ground reflected solar radiation (Iref, W m−2),here, atmospheric diffuse solar radiation (Idif, W m−2) is deter-ined by diffusion coefficients (�dif):
Idif = I0 · �dif · (cos ˇ)2
2 sin ˛�dif = 0.271 − 0.294 · �dir
(6)
Ground reflected solar radiation (Iref, W m−2) is determined byiffusion coefficients (�b) and surface ground reflectance (r0, the
eference value is 0.31):Iref = r0 · I0 · �ref · (sin ˇ)2
2 sin ˛�ref = 0.271 + 0.706 · �dir
(7)
wwmri
g out of the greenery layer (W m−2); QG0, solar radiation received before moving� solar radiation received after reflecting through the green wall; the total radiationthrough the green wall ecosystem. L, the distance of radiation transmission which
Global solar radiation (IG0, A2B2C1D1, W m−2) is the sum ofirect solar radiation (Idir) diffusive solar radiation (Idif) and groundeflected solar radiation (Iref):
G0 = Idir + Idif + Iref (8)
.2.2. Canopy transmittance (�), absorbance (˛) and reflectance�) of green wall
Patterns of thermodynamic transfer of vertical greenery ecosys-em are determined by heat flux transmission, reflectance andbsorption. Meteorological conditions and vegetation structure ofreenery ecosystem determine the behaviors of internal distur-ance of the thermodynamic transfer process. According to energyonservation, the total radiation (QG) equals to the sum of transmis-ion (Q�), absorption (Q˛) and reflection (Q�) of canopy through thereen wall ecosystem (Fig. 2B). Therefore, canopy transmittance�), absorbance (˛) and reflectance (�) can be expressed as:
QG = Q� + Q˛ + Q�Q�
QG+ Q˛
QG+ Q�
QG= 1
Q�
QG= �;
Q˛
QG= ˛;
Q�
QG= �
� + ˛ + � = 1
(9)
Suppose that green wall is a partly transparent object that per-its some sunlight to move through the greenery layer. Reflection
nd refraction of the light may occur when light moves from therst medium into the second. Refractive index (n) is mathemati-ally described as velocity of light in a vacuum divided by velocityf light in a medium (Fig. 2B). The reflection coefficient (r) is giveny the Fresnel equations (Akhmanov and Nikitin, 1999):
= I�IG0
=(
n1 cos �i − n2 cos �t
n1 cos �i + n2 cos �t
)2
=[
n1 cos �i − n2
√1 − ((n1/n2) sin �i)
2
n1 cos �i + n2
√1 − ((n1/n2) sin �i)
2
]2
(10)
here I�� (W m−2) is solar radiation intensity as reflection by greenall; n1 and n2, are refractive indices of radiation from the firstedium into the second; �i, �r and �t are angles that the incident,
eflected and refracted rays respectively make to the normal of thenterface.
1 ngineering 37 (2011) 1112–1122
pG⎧⎪⎪⎨⎪⎪⎩wgwawtamlcb⎧⎪⎪⎪⎪⎪⎪⎨⎪⎪⎪⎪⎪⎪⎩2
cc(SoiK
S
td
wwasa
2
(Nr
N
Fsr
wuN1ttdtwtbiNtc
3
3
ietattmudma
3
ganofi
116 C.Y. Jim, H. He / Ecological E
Solar radiation, attenuated after absorption by the partly trans-arent green wall, can be expressed by (Trenberth and Kevin, 1992;ao, 1996):
I� = IG0 · exp(−K · L cos i)
K = ln(
TPAR
PAR
)· LAI
a = 1 − I�IG0
= 1 − exp(−K · L)
(11)
here I� (W m−2) is radiation intensity after moving out of thereenery layer; L (mm) is the distance of radiation transmissionhich is a function of green wall thickness (mm) and refraction
ngle; K, is attenuation coefficient which describes the extent tohich the intensity of an energy beam is reduced as it passes
hrough a specific material; PAR (W m−2) is photosyntheticallyctive radiation over the greenery surface; TPAR (W m−2) is trans-itted photosynthetically active radiation behind the greenery
ayer; LAI is canopy leaf area index. From the above relationship,anopy absorbance (˛) reflectance (�) and transmittance (�) cane further expressed as (Lu et al., 1990; Gao, 1996):
˛ = a · (1 − r) · [1 + r · (1 − a) + r2 · (1 − a)2 + . . .] = a · (1 − r)1 − r · (1 − a)
� = r · {1 + (1 − a)2 · (1 − r)2 · [1 + r · (1 − a)2 + . . .]} =
r ·[
1 + (1 − a)2 · (1 − r)2
1 − r2 · (1 − a)2
]� = (1 − a) · (1 − r)2 · [1 + r2 · (1 − a)2 + . . .] = (1 − a) · (1 − r)2
1 − r2 · (1 − a)2
(12)
.2.3. Shading performance of green wall on solar radiationTo evaluate shading effect of green wall, we introduce a shading
oefficient to represent the shading performance. Shading coeffi-ient is defined as the proportion of solar radiation received beforeQG0) and after (QT) moving through the green wall (Ip et al., 2010).hading effectiveness changes at different times, and it is capablef representing the shading performance time period cycle. Shad-ng coefficient (SC) is represented as (Lu et al., 1990; Trenberth andevin, 1992; Gao, 1996):
C = QG0
QT(13)
Delay response of radiation transmission is further employedo investigate the attenuation effect of radiation transmission. Weefine transmission delay coefficient () as:
= 115
×[
40.5 × (Rgw · Sgw + Rair · Sair) − arc tgAi
Ai + Yi
√2
+arc tgAe
Ae + Ye√
2
](14)
here Rgw and Rair are respectively thermal resistance of greenall and air; Sgw are Sair are storage coefficients of green wall and
ir; Ai and Ae are thermal exchange coefficients of outer and innerurfaces of green wall; Yi and Ye are storage coefficients of innernd outer surfaces of green wall.
.3. Evaluation of model performance
Model performance is evaluated by the Root Mean Square ErrorRMSE) and Nash–Sutcliffe Efficiency Coefficient (NSEC, see Eq. (15),
ash and Sutcliffe, 1970). Table 1 summarizes the statistical testesults RMSE and NSEC for both models:
SEC = 1 −∑n
t=1(Ttobserved
− Ttsimulated
)2∑nt=1(Tt
observed− Tobserved)
2(15)
sa1as
ig. 3. Hourly solar radiation of horizontal roof: comparison between observed andimulated scenarios (November 08, 2008 to August 21, 2009); Difference (O − S)efers to the difference between observed and simulated results.
here Ttobserved
is the observed value at time t; Ttsimulated
is the sim-lated value at time t; Tobserved is the average value of the observed.ash–Sutcliffe efficiencies can range from ∞ to 1. An efficiency of(NSEC = 1) corresponds to a perfect match of modelled discharge
o the observed data. An efficiency of 0 (NSEC = 0) indicates thathe model predictions are as accurate as the mean of the observedata, whereas an efficiency less than zero (NSEC < 0) occurs whenhe observed mean is a better predictor than the model or, in otherords, when the residual variance (described by the nominator in
he expression above), is larger than the data variance (describedy the denominator). Essentially, the closer the model efficiency
s to 1, the more accurate the model is. It should be noted thatash–Sutcliffe efficiencies can be used to describe the predica-
ive accuracy of other models as long as there is observed data toompare the model results.
. Results and discussion
.1. Validation of model performance
Performance of the proposed solar radiation model of green walls evaluated by the RMSE and NSEC. The models are calibrated andvaluated, and proved to be highly efficient for our study objec-ives (Fig. 3, and Table 1). The estimated values of the two modelsre in favorable agreement with the observed values. The simula-ion results of temperature have lower RMSE values (2.79–9.71)han heat flux (19.17–90.78). For NSEC values of the heat flux
odel, temperature and heat flux get relatively high NSEC val-es (0.54–0.87) and only 9% falls within 0.56–0.69. These resultsenote excellent indicators that the radiation damping oscillationodel can give precise estimation of radiation transmission with
cceptable errors.
.2. Period characteristics of canopy solar radiation
The observations for solar radiation near the ground provideeneral insight on the surface energy balance and seasonal vari-tion near the ground. Period characteristics of solar radiationear the ground can be achieved by comparison between thebserved and simulated values. To illustrate the solar radiationeld in the neighborhood of the ground, the hourly and daily
equence (November 8, 2008–August 22, 2009) of solar radi-tion is shown in Figs. 3–5. For the diurnal cycle, a total of2 days representing three typical weather days (sunny, cloudynd rainy) in four seasons (winter – February, spring – May,ummer – August and autumn – November), were selected
C.Y. Jim, H. He / Ecological Engineering 37 (2011) 1112–1122 1117
Table 1Evaluation of model performance (RMSE and Nash–Sutcliffe Efficiency Coefficient).
Thermodynamics Experiment treatment February May August November
NSEC RMSE NSEC RMSE NSEC RMSE NSEC RMSE
Temperature
South green wall 0.87 3.01 0.80 5.64 0.83 5.80 0.75 9.71North green wall 0.81 7.92 0.78 6.91 0.77 7.89 0.81 7.60South control wall 0.84 5.92 0.83 3.88 0.87 2.79 0.84 5.88North control wall 0.78 9.60 0.79 6.54 0.81 7.11 0.78 8.47South green wall 0.71 53.56 0.70 44.10 0.85 20.40 *0.67 68.46North green wall 0.74 61.34 0.74 33.98 0.69* 66.09 0.73 57.19
00
fop
ttcmmtdnw
ottbtem8dso
wtwssihttmddrlsIbtcr
igaT
tflsscn
3g
vitpadc
mGtaulbebn
ssa0atwtreT(
aAq
Solar radiation South control wall 0.82 44.17North control wall 0.77 59.92
* Value <7.0.
or detailed analysis (Figs. 4–6). They depict the commonalityf energy fluxes in the temporal–seasonal and major weatheratterns.
The global solar radiation increases from 0 at 0600–0800 h inhe morning to peak values at 1200–1300 h, and then decreaseo 0 at around 1800–2000 h. The beginning of diurnal heating islearly seen at 0600 h by the flow of heat into the ground, theaximum temperature at 1200 h is associated with the maxi-um solar radiation, and the green wall is later cooled in response
o reduced solar radiation. This can be proved by the nocturnalistribution of temperature. The influence of radiation predomi-ates and the minimum is found at north- and south-facing greenall.
The seasonal heat flux on green wall varies with the fluctuationsf the underlying meteorological driving forces. It follows clearlyhe seasonal solar radiation regime, with deviations brought byhe monsoonal rainfall rhythm. The seasonal trends are affectedy rainfall and cloud cover (Figs. 4–6). Seasonal global solar radia-ion and direct solar radiation drop to a minimum value in winter,specially in January and February, and reach a maximum in sum-er in July and August (1168 W m−2 of global solar radiation and
89 W m−2 of direct solar radiation). In terms of daily weather con-ition, the maximum values of global solar radiation and directolar radiation occur on the summer sunny day, and the minimumn the winter rainy day.
Diffuse solar radiation attains a maximum value in summerith moderate rainfall in July and August, and a minimum in win-
er with no rainfall in January and February (Figs. 4–7). The dailyeather pattern shows quite notable differences between direct
olar radiation and diffuse solar radiation. The maximum directolar radiation occurs on the summer sunny day and the min-mum on the winter rainy day. The highest flux occurs duringigh temperature, coinciding with an adequate supply of watero enhance evaporation. The diurnal range of direct solar radia-ion reaches the widest in winter and narrowest in summer, with
edium values for spring and autumn. For all seasons, the sunnyay gets the widest diurnal range, with suppression on cloudyay, and diminishing to almost 0 on rainy day. As to diffuse solaradiation, it reaches the maximum on cloudy summer day fol-owed by rainy and sunny days. The extreme values of diffuseolar radiation correlate well with cloud cover (Figs. 6 and 7).n summer, moderate cloud amount in July and August reduceoth global and direct solar radiation, but not diffuse solar radia-ion. In contrast, the limited rainfall associated with the prolongedloudy-humid weather in spring in April admits less diffuse solaradiation.
The dynamics of heat flux magnitude differ notably by exper-mental treatment (control and vegetation types) and temporalroups (diurnal and seasonal changes) (Figs. 4–7). The hourly aver-ge has a value around 455–610 W m−2 through the four seasons.he fluctuations of direct solar radiation for both groups are greater
fhb(s
.82 19.17 0.79 39.40 *0.54 90.78
.77 30.43 0.74 48.89 0.76 63.71
han diffuse and global solar radiation. The difference of hourly heatux between north and south wall ranges from 13 to 39 W m−2. Theouth wall control treatment gets the highest value of hourly globalolar radiation (1168.23 W m−2) in summer, followed by north wallontrol (1026.48 W m−2), south green wall (889.38 W m−2) andorth green wall (731.12 W m−2).
.3. Impacts of shielding structures on thermodynamic transfer ofreen wall
The simulation of reflectance and transmittance of heat flux byegetation shielding structure (referring to the radiation shield-ng effect afforded by green plants that cover a wall) is based onhe radiation shielding effectiveness model. From the heat flowerspective, the performance of green roofs as insulators is associ-ted with shading, heat absorption, and latent heat transfer. Theyepend greatly on a number of variables, including the moistureontent and temperature regime.
The results show that the shading effect of vegetation is dra-atic, especially during high temperature periods in daytime.reen walls evidently reduce heat flux and temperature more effec-
ively than control walls. For example, when global solar radiationnd temperature of the south control wall reaches maximum val-es (1168 W m−2, 48.48 ◦C), the south green walls register much
ower values (586.89 W m−2, 39.65 ◦C). The differences betweenack and front sides of the green wall demonstrate obvious shadingffects. For example, the hourly global average solar radiation haseen reduced by 31.54 W m−2 in the south and 11.36 W m−2 in theorth.
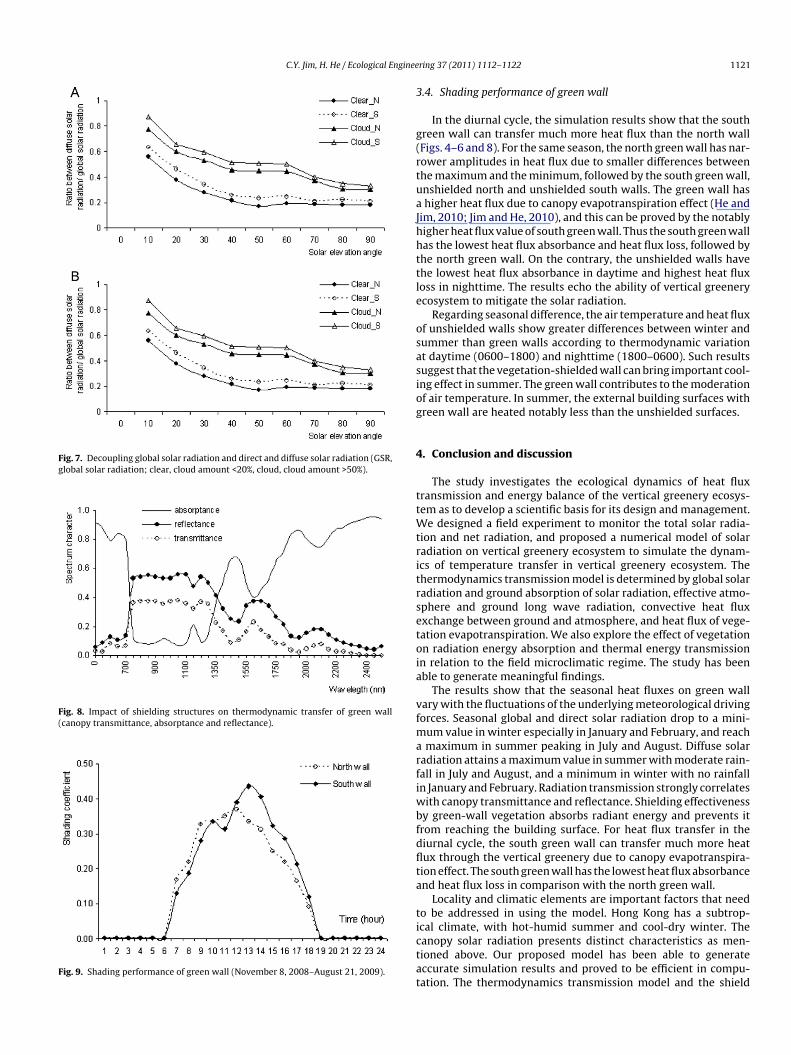
Radiation transmission strongly correlates with vegetationtructure and canopy transmittance and reflectance. The modelimulation results of reflectance and transmittance of the canopyre presented in Figs. 8 and 9. The canopy reflectance ranges from.1 to 0.58, and canopy transmittance values lie between 0.06nd 0.38 within the major heat flux wavelength spectrum. Statis-ical analysis indicates that the canopy reflectance is correlatedell with the canopy transmittance (R2 = 0.83). Shielding effec-
iveness varies, and the south green walls have higher values ofeflectance and transmittance. The south green wall has the high-st shielding effectiveness (0.31), followed by the north green wall.hus the green wall absorbs more heat flux than the control wallFigs. 7–9).
Shielding effectiveness by green-wall vegetation absorbs radi-nt energy and prevents it from reaching the building surface.
very important function of the vegetation layer is to create auiescent layer of air immediately in front of the green wall sur-
ace. Green wall vegetation absorbs and store large amounts ofeat to form a thermal subsidence effect. The effect is to create auffer against the daily macro-climatic fluctuation in temperatureFigs. 4–7). It shows that a vegetation-shielded wall can drasticallyuppress the air temperature at 1200 h by more than 10.3 ◦C in
1118 C.Y. Jim, H. He / Ecological Engineering 37 (2011) 1112–1122
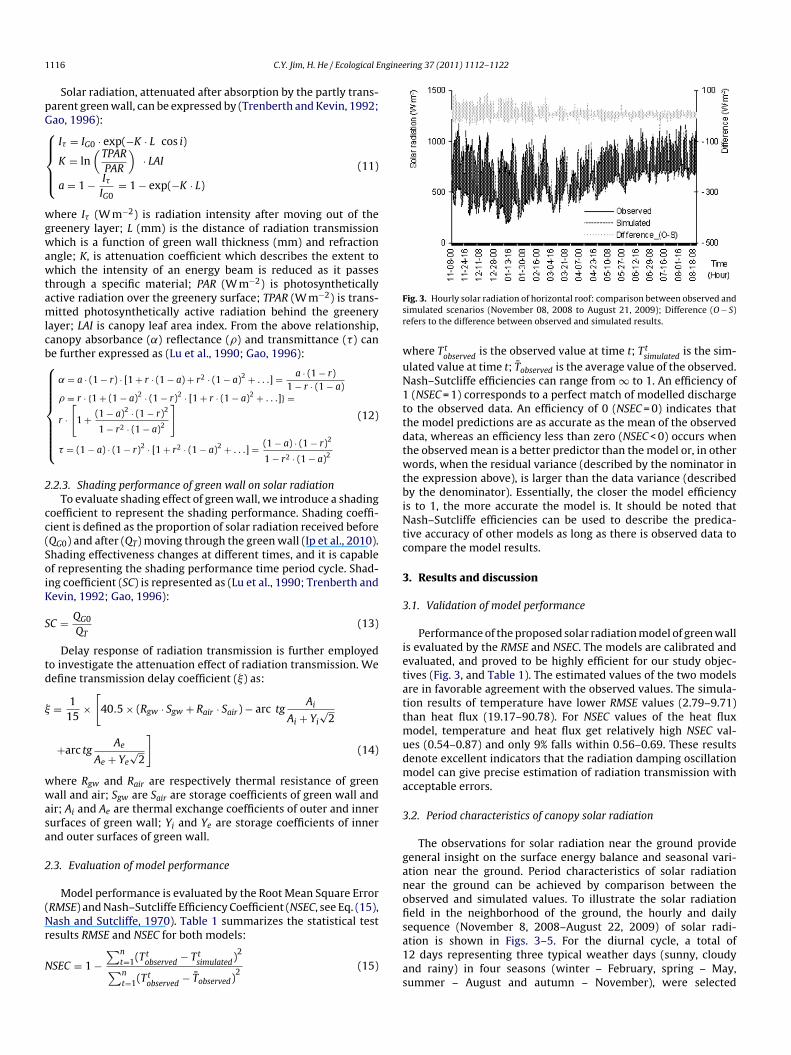
Fig. 4. Simulated hourly solar radiation of green wall ecosystem (November 8, 2008–August 21, 2009); T N Ctrl, T N Front, T N Back: north wall temperature of control plot,n k: soub orth gs nd ba
cgTipttep
eait
orth green wall temperature of front side and back side; T S Ctrl, T S Front, T S Bacack side; H N Ctrl, H N Front, H N Back: north wall temperature of control plot, nouth wall temperature of control plot, south green wall temperature of front side a
omparison with the unshielded wall (control treatment). With areen wall in place, the extremes of temperature are eliminated.he minimum temperature of a green wall (7.6 ◦C of the south)s lower than the control treatment (7.9 ◦C). The maximum tem-
erature of the vegetated wall (44.5 ◦C of the south) is lower thanhe control (48.5 ◦C of the south). It suggests that the overall heatransfer through the green wall has been reduced. Another ben-fit of foliage is that it absorbs radiant energy, utilizing it to fuelhotosynthetic processes. This effect contributes to increasing theTtsr
th wall temperature of control plot, south green wall temperature of front side andreen wall temperature of front side, and back side; H S Ctrl, H S Front, H S Back:ck side.
ffective albedo of the vegetated wall. The benefit of green walls an insulator depends upon vegetation structure, with both thensulation and thermal mass effects contributing to dampening ofemperature changes.
The above simulation results are deemed to be notably accurate.he thermodynamics transmission model is proved to match wellhe transmission properties of green wall radiation, and the modelimulation results are commensurate with empirical transmissionecords.

C.Y. Jim, H. He / Ecological Engineering 37 (2011) 1112–1122 1119
Fig. 5. Simulated hourly solar radiation under different weather conditions (sunny, cloudy and rainy) of green wall ecosystem (November 8, 2008–August 21, 2009); T N Ctrl,T N Front, T N Back: north wall temperature of control plot, north green wall temperature of front side and back side; T S Ctrl, T S Front, T S Back: south wall temperatureof control plot, south green wall temperature of front side and back side.

1120 C.Y. Jim, H. He / Ecological Engineering 37 (2011) 1112–1122
Fig. 6. Simulated hourly wall temperature of different weather conditions (sunny, cloudy and rainy) of vertical green wall ecosystem (November 8, 2008–August 21, 2009);T N Ctrl, T N Front, T N Back: north wall temperature of control plot, north green wall temperature of front side and back side; T S Ctrl, T S Front, T S Back: south walltemperature of control plot, south green wall temperature of front side and back side.
C.Y. Jim, H. He / Ecological Enginee
Fig. 7. Decoupling global solar radiation and direct and diffuse solar radiation (GSR,global solar radiation; clear, cloud amount <20%, cloud, cloud amount >50%).
Fig. 8. Impact of shielding structures on thermodynamic transfer of green wall(canopy transmittance, absorptance and reflectance).
Fig. 9. Shading performance of green wall (November 8, 2008–August 21, 2009).
3
g(rtuaJhhttle
osasiog
4
ttWtritrsetoia
vfmarfiwbfdflta
tictat
ring 37 (2011) 1112–1122 1121
.4. Shading performance of green wall
In the diurnal cycle, the simulation results show that the southreen wall can transfer much more heat flux than the north wallFigs. 4–6 and 8). For the same season, the north green wall has nar-ower amplitudes in heat flux due to smaller differences betweenhe maximum and the minimum, followed by the south green wall,nshielded north and unshielded south walls. The green wall hashigher heat flux due to canopy evapotranspiration effect (He and
im, 2010; Jim and He, 2010), and this can be proved by the notablyigher heat flux value of south green wall. Thus the south green wallas the lowest heat flux absorbance and heat flux loss, followed byhe north green wall. On the contrary, the unshielded walls havehe lowest heat flux absorbance in daytime and highest heat fluxoss in nighttime. The results echo the ability of vertical greenerycosystem to mitigate the solar radiation.
Regarding seasonal difference, the air temperature and heat fluxf unshielded walls show greater differences between winter andummer than green walls according to thermodynamic variationt daytime (0600–1800) and nighttime (1800–0600). Such resultsuggest that the vegetation-shielded wall can bring important cool-ng effect in summer. The green wall contributes to the moderationf air temperature. In summer, the external building surfaces withreen wall are heated notably less than the unshielded surfaces.
. Conclusion and discussion
The study investigates the ecological dynamics of heat fluxransmission and energy balance of the vertical greenery ecosys-em as to develop a scientific basis for its design and management.
e designed a field experiment to monitor the total solar radia-ion and net radiation, and proposed a numerical model of solaradiation on vertical greenery ecosystem to simulate the dynam-cs of temperature transfer in vertical greenery ecosystem. Thehermodynamics transmission model is determined by global solaradiation and ground absorption of solar radiation, effective atmo-phere and ground long wave radiation, convective heat fluxxchange between ground and atmosphere, and heat flux of vege-ation evapotranspiration. We also explore the effect of vegetationn radiation energy absorption and thermal energy transmissionn relation to the field microclimatic regime. The study has beenble to generate meaningful findings.
The results show that the seasonal heat fluxes on green wallary with the fluctuations of the underlying meteorological drivingorces. Seasonal global and direct solar radiation drop to a mini-
um value in winter especially in January and February, and reachmaximum in summer peaking in July and August. Diffuse solar
adiation attains a maximum value in summer with moderate rain-all in July and August, and a minimum in winter with no rainfalln January and February. Radiation transmission strongly correlates
ith canopy transmittance and reflectance. Shielding effectivenessy green-wall vegetation absorbs radiant energy and prevents itrom reaching the building surface. For heat flux transfer in theiurnal cycle, the south green wall can transfer much more heatux through the vertical greenery due to canopy evapotranspira-ion effect. The south green wall has the lowest heat flux absorbancend heat flux loss in comparison with the north green wall.
Locality and climatic elements are important factors that needo be addressed in using the model. Hong Kong has a subtrop-
cal climate, with hot-humid summer and cool-dry winter. Theanopy solar radiation presents distinct characteristics as men-ioned above. Our proposed model has been able to generateccurate simulation results and proved to be efficient in compu-ation. The thermodynamics transmission model and the shield
1 nginee
cethltrwolnpiwt
A
pAps
R
A
A
A
B
B
B
C
D
E
G
G
G
G
H
H
H
H
I
J
J
K
L
M
N
N
P
P
P
P
R
R
R
S
T
T
T
W
W
W
122 C.Y. Jim, H. He / Ecological E
oefficient model are commensurate with the transmission prop-rties of green wall radiation, and they fit well with empiricalransmission. As an abstraction of reality, modelling will alwaysave some shortcomings. Nevertheless, we have employed simu-
ations to anticipate future implications of current decisions. Fromhe present results, it is clear that our model could be furtherefined. For example, to facilitate the development of our model,e have simplified the calculation of diffuse solar radiation which
therwise would involve complex calculations. In addition, to ana-yze the shading effectiveness changes at different time scales, weeed to develop more elaborate algorithms for more accurate com-utations. We intend to improve the model by acquiring more
n-depth data in future studies. Despite the model’s deficiencies,e have confidence in the basic results of our simulation because
he predictions are generally valid and reasonable.
cknowledgements
We acknowledge with gratitude the research Grants kindlyrovided by the Midland Charitable Foundation, and Stanley Holumni Challenge Fund. We gratefully appreciate Pegasus Com-any for donating the vertical greening setup of our experimentalite.
eferences
kbari, H., Kurn, D.M., Bretz, S.E., Hanford, J.W., 1997. Peak power and cooling energysavings of shade trees. Energy Buildings 25, 139–148.
khmanov, S.A., Nikitin, Y.S., 1999. Physical Optics, vol. 405. Clarendon Press, Oxford,p. 420.
lexandria, E., Jones, P., 2008. Temperature decreases in an urban canyon due togreen walls and green roofs in diverse climates. Building Environ. 43, 480–493.
aldocchi, D.D., Vogel, C.A., 1997. Seasonal variation of energy and water vaporexchange rates above and below a boreal jack pine forest canopy. J. Geophys.Res. 102, 28939–28951.
artzanas, T., Tchamitchian, M., Kittas, C., 2005. Influence of the heatingmethod on greenhouse microclimate and energy consumption. Biosyst. Eng.,487–499.
astianoni, S., Marchettini, N., 1997. Emergy/exergy ratio as a measure of the levelof organization of systems. Ecol. Model. 99, 33–40.
hen, R., Kang, E., Ji, X., Yang, J., Wang, J., 2007. An hourly solar radiation modelunder actual weather and terrain conditions: a case study in Heihe river basin.Energy 32, 1148–1157.
ufrene, E., Davi, H., Francis, C., Le Maire, G., Le Dantec, V., Granier, A., 2005. Mod-elling carbon and water cycles in a beech forest. Part I. Model description anduncertainty analysis on modelled NEE. Ecol. Model. 185, 407–436.
milsson, T., 2008. Vegetation development on extensive vegetated green roofs:influence of substrate composition, establishment method and species mix. Ecol.Eng. 33 (3–4), 265–277.
ao, G.D., 1996. Climatology Tutorial. Meteorology Press, Beijing, pp. 395–397.
oldstein, R.J., Eckert, E.R.G., Ibele, W.E., Patankar, S.V., Simon, T.W., Kuehn, T.H.,Strykowski, P.J., Tamma, K.K., Heberlein, J.V.R., Davidson, J.H., Bischof, J., Kulacki,F.A., Kortshagen, U., Garrick, S., 2003. Heat transfer: a review of 2001 literature.
Int. J. Heat Mass Transfer 46, 1887–1992.omez, F., Gaja, E., Reig, A., 1998. Vegetation and climatic changes in a city. Ecol.Eng. 10 (4), 355–360.
rigoletti, G., Sattler, M.A., Morello, A., 2008. Analysis of the thermal behaviour of alow cost, single-family, more sustainable house in Porto Alegre, Brazil. EnergyBuildings 40, 1961–1971.
W
W
ring 37 (2011) 1112–1122
alwatura, R.U., Jayasinghe, M.T.R., 2009. Influence of insulated roof slabs on airconditioned spaces in tropical climatic conditions: a life cycle cost approach.Energy Buildings 41, 678–686.
armanto, H.J.T., Salokhe, V.M., 2006. Microclimate and air exchange rates in green-houses covered with different nets in the humid tropics. Biosyst. Eng. 94 (2),239–253.
e, H.M., Jim, C.Y., 2010. Simulation of thermodynamic transmission in green roofecosystem. Ecol. Model. 221, 2949–2958.
olm, D., 1989. Thermal improvement by means of leaf-cover on external walls: asimulation model. Energy Buildings 14, 19–30.
p, K., Lam, M., Miller, A., 2010. Shading performance of a vertical deciduous climbingplant canopy. Building Environ. 45, 81–88.
ames J. Hirsch & Associates, 2009. DOE-2.2, Building Energy Use and Cost AnalysisProgram, vol. 6, New Features, Version 41–47, December 2009. Camarillo, CA.
im, C.Y., He, H.M., 2010. Coupling heat flux dynamics with meteorological condi-tions in the green roof ecosystem. Ecol. Eng. 36, 1052–1063.
urpaska, S., Slipek, Z., Bozek, B., Fraczek, J., 2005. Simulation of heat and moisturetransfer in the greenhouse substrate due to a heating system by buried pipes.Biosyst. Eng. 90 (1), 63–74.
u, Q.Y., Fu, B.P., Yu, J.M., 1990. The methods of calculating the spatial distribu-tion of agroclimatic resources in mountainous areas and the climate effects ofmicrotopography. Chin. J. Agric. Meteorol. 9 (2), 27–32.
iyawaki, A., 1998. Restoration of urban green environments based on the theoriesof vegetation ecology. Ecol. Eng. 11 (1–4), 157–165.
ash, J.E., Sutcliffe, J.V., 1970. River flow forecasting through conceptual models.Part I. A discussion of principles. J. Hydrol. 10 (3), 282–290.
ieto-Vesperinas, M., 1986. Classical radiometry and radiative transfer theory:a short-wavelength limit of a general mapping of cross-spectral densities insecond-order coherence theory. J. Opt. Soc. Am. 3 (9), 1354–1359.
alomo, E., 1998. Analysis of the green roofs cooling potential in buildings. EnergyBuildings 27, 179–193.
anferov, O., Knyazikhin, Y., Myneni, R.B., Szarzynski, J., Engwald, S., Schnitzler, K.G.,Gravenhorst, G., 2001. The role of canopy structure in the spectral variationof transmission and absorption of solar radiation in vegetation canopies. IEEETrans. Geosci. Rem. Sens. 39 (2), 241–253.
earlmutter, D., Rosenfelda, S., 2005. Performance analysis of a simple roof coolingsystem with irrigated soil and two shading alternatives. Energy Buildings 40 (5),855–864.
icot, X., 2004. Thermal comfort in urban spaces: impact of vegetation growth. Casestudy: Piazza della Scienza, Milan, Italy. Energy Buildings 36, 329–334.
aupach, M.R., 1995. Vegetation–atmosphere interaction and surface conductanceat leaf, canopy and regional scales. Agric. Forest Meteorol. 73, 151–179.
oderick, M.L., 1999. Estimating the diffuse component from daily and monthlymeasurements of global radiation. Agric. Meteorol. 95, 169–185.
osenfeld, A.H., Akbari, H., Romm, J.J., Pomerantz, M., 2001. Cool communities:strategies for heat island mitigation and smog reduction. Energy Buildings 28,51–62.
ailor, D.J., 2008. A green roof model for building energy simulation programs.Energy Buildings 40 (8), 1466–1478.
eemusk, A., Mander, Ü., 2010. Temperature regime of planted roofs compared withconventional roofing systems. Ecol. Eng. 36 (1), 91–95.
heodosiou, T.G., 2003. Summer period analysis of the performance of a plantedroof as a passive cooling technique. Energy Buildings 35, 909–917.
renberth, I., Kevin, E., 1992. Climate System Modeling. Cambridge University Press,Cambridge, pp. 5–19.
ang, K., Kellomäki, S., Zha, T., Peltola, H., 2004. Seasonal variation in energy andwater fluxes in a pine forest: an analysis based on eddy covariance and anintegrated model. Ecol. Model. 179, 259–279.
ilmers, F., 1990. Effect of vegetation on urban climate and buildings. Energy Build-ings 22, 15–16.
ong, N.H., Cheong, D.K.W., Yan, H., Soh, J., Ong, C.L., Sia, A., 2003. The effects ofrooftop garden on energy consumption of a commercial building in Singapore.
Energy Buildings 35, 353–364.ong, N.H., Kwan Tan, A.Y., Chen, Y., Sekar, K., Tan, P.Y., Chan, D., Chiang, K., Wong,N.C., 2010. Thermal evaluation of vertical greenery systems for building walls.Building Environ. 45 (3), 663–672.
ong, N.H., Kwan Tan, A.Y., Tan, P.Y., Wong, N.C., 2009. Energy simulation of verticalgreenery systems. Energy Buildings 41, 1401–1408.
Related Documents