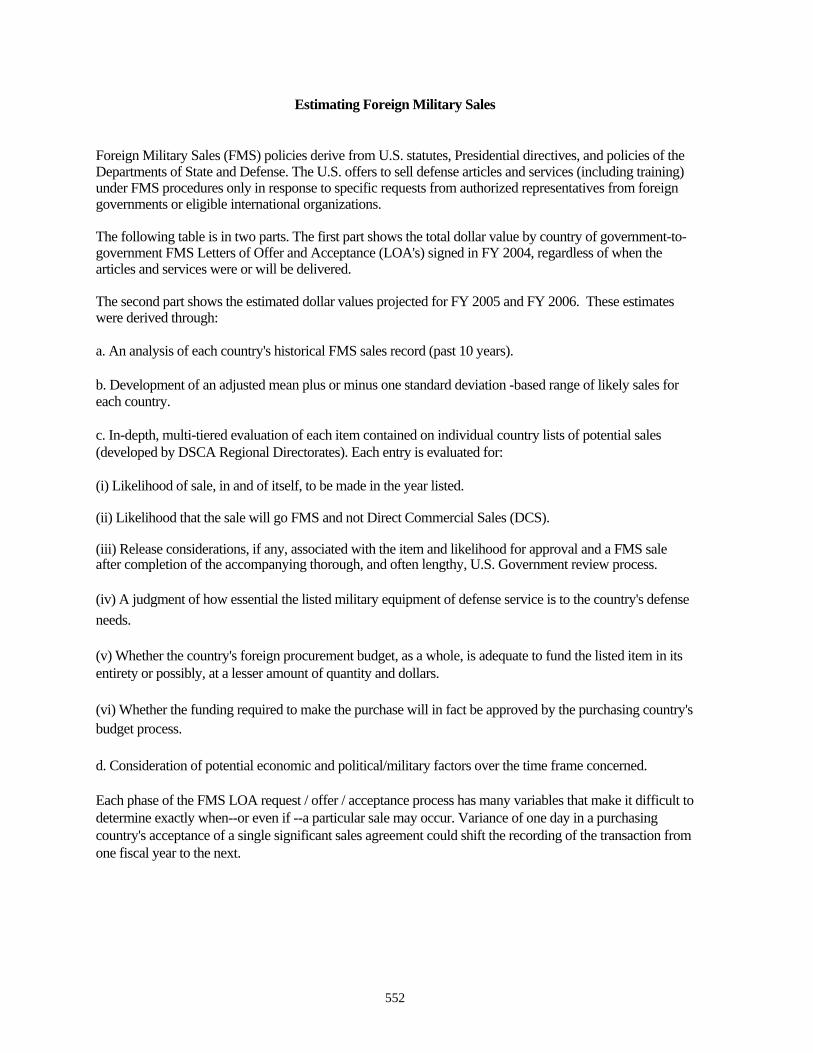
Estimating Foreign Military Sales Foreign Military Sales (FMS) policies derive from U.S. statutes, Presidential directives, and policies of the Departments of State and Defense. The U.S. offers to sell defense articles and services (including training) under FMS procedures only in response to specific requests from authorized representatives from foreign governments or eligible international organizations. The following table is in two parts. The first part shows the total dollar value by country of government-to- government FMS Letters of Offer and Acceptance (LOA's) signed in FY 2004, regardless of when the articles and services were or will be delivered. The second part shows the estimated dollar values projected for FY 2005 and FY 2006. These estimates were derived through: a. An analysis of each country's historical FMS sales record (past 10 years). b. Development of an adjusted mean plus or minus one standard deviation -based range of likely sales for each country. c. In-depth, multi-tiered evaluation of each item contained on individual country lists of potential sales (developed by DSCA Regional Directorates). Each entry is evaluated for: (i) Likelihood of sale, in and of itself, to be made in the year listed. (ii) Likelihood that the sale will go FMS and not Direct Commercial Sales (DCS). (iii) Release considerations, if any, associated with the item and likelihood for approval and a FMS sale after completion of the accompanying thorough, and often lengthy, U.S. Government review process. (iv) A judgment of how essential the listed military equipment of defense service is to the country's defense needs. (v) Whether the country's foreign procurement budget, as a whole, is adequate to fund the listed item in its entirety or possibly, at a lesser amount of quantity and dollars. (vi) Whether the funding required to make the purchase will in fact be approved by the purchasing country's budget process. d. Consideration of potential economic and political/military factors over the time frame concerned. Each phase of the FMS LOA request / offer / acceptance process has many variables that make it difficult to determine exactly when--or even if --a particular sale may occur. Variance of one day in a purchasing country's acceptance of a single significant sales agreement could shift the recording of the transaction from one fiscal year to the next. 552

Welcome message from author
This document is posted to help you gain knowledge. Please leave a comment to let me know what you think about it! Share it to your friends and learn new things together.
Transcript
Estimating Foreign Military Sales
Foreign Military Sales (FMS) policies derive from U.S. statutes, Presidential directives, and policies of the Departments of State and Defense. The U.S. offers to sell defense articles and services (including training) under FMS procedures only in response to specific requests from authorized representatives from foreign governments or eligible international organizations.
The following table is in two parts. The first part shows the total dollar value by country of government-to-government FMS Letters of Offer and Acceptance (LOA's) signed in FY 2004, regardless of when the articles and services were or will be delivered.
The second part shows the estimated dollar values projected for FY 2005 and FY 2006. These estimates were derived through:
a. An analysis of each country's historical FMS sales record (past 10 years).
b. Development of an adjusted mean plus or minus one standard deviation -based range of likely sales for each country.
c. In-depth, multi-tiered evaluation of each item contained on individual country lists of potential sales (developed by DSCA Regional Directorates). Each entry is evaluated for:
(i) Likelihood of sale, in and of itself, to be made in the year listed.
(ii) Likelihood that the sale will go FMS and not Direct Commercial Sales (DCS).
(iii) Release considerations, if any, associated with the item and likelihood for approval and a FMS sale after completion of the accompanying thorough, and often lengthy, U.S. Government review process.
(iv) A judgment of how essential the listed military equipment of defense service is to the country's defense needs.
(v) Whether the country's foreign procurement budget, as a whole, is adequate to fund the listed item in its entirety or possibly, at a lesser amount of quantity and dollars.
(vi) Whether the funding required to make the purchase will in fact be approved by the purchasing country's budget process.
d. Consideration of potential economic and political/military factors over the time frame concerned.
Each phase of the FMS LOA request / offer / acceptance process has many variables that make it difficult to determine exactly when--or even if --a particular sale may occur. Variance of one day in a purchasing country's acceptance of a single significant sales agreement could shift the recording of the transaction from one fiscal year to the next.
552
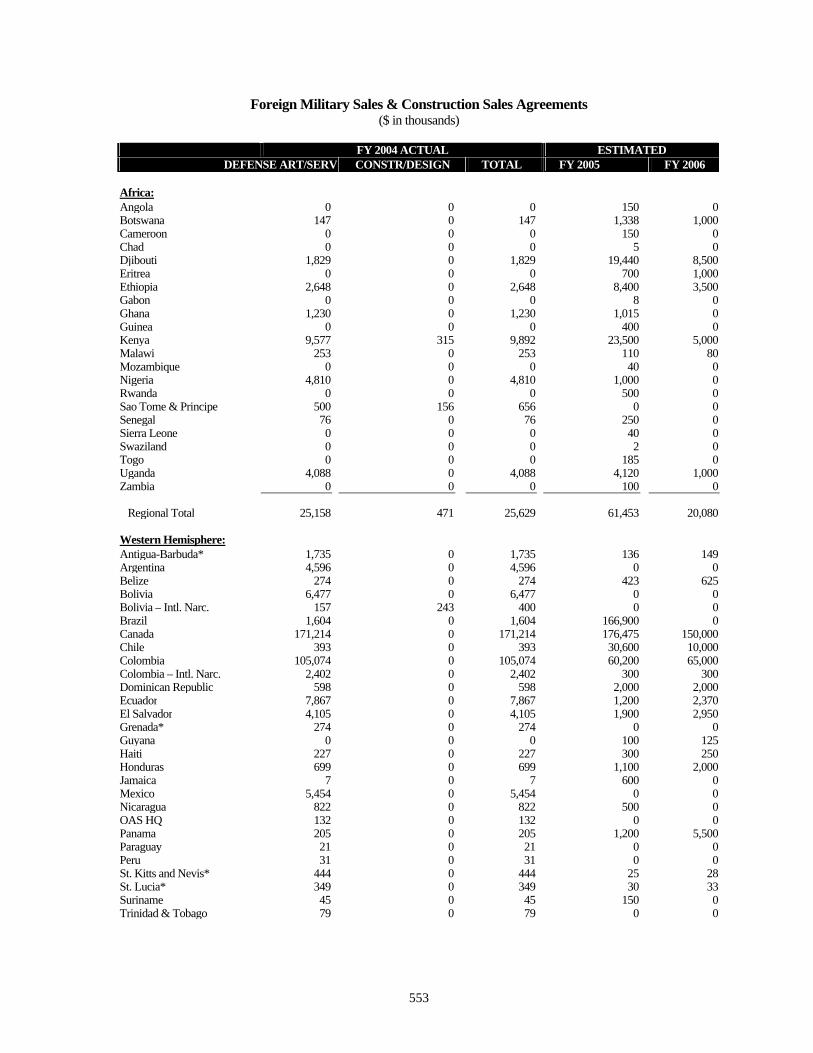
Foreign Military Sales & Construction Sales Agreements ($ in thousands)
ESTIMATED DEFENSE ART/SERV CONSTR/DESIGN FY 2005
FY 2004 ACTUAL TOTAL FY 2006
Africa: Angola 0 0 0 150 0 Botswana 147 0 147 1,338 1,000 Cameroon 0 0 0 150 0 Chad 0 0 0 5 0 Djibouti 1,829 0 1,829 19,440 8,500 Eritrea 0 0 0 700 1,000 Ethiopia 2,648 0 2,648 8,400 3,500 Gabon 0 0 0 8 0 Ghana 1,230 0 1,230 1,015 0 Guinea 0 0 0 400 0 Kenya 9,577 315 9,892 23,500 5,000 Malawi 253 0 253 110 80 Mozambique 0 0 0 40 0 Nigeria 4,810 0 4,810 1,000 0 Rwanda 0 0 0 500 0 Sao Tome & Principe 500 156 656 0 0 Senegal 76 0 76 250 0 Sierra Leone 0 0 0 40 0 Swaziland 0 0 0 2 0 Togo 0 0 0 185 0 Uganda 4,088 0 4,088 4,120 1,000 Zambia 0 0 0 100 0
Regional Total 25,158 471 25,629 61,453 20,080
Western Hemisphere: Antigua-Barbuda* 1,735 0 1,735 136 149 Argentina 4,596 0 4,596 0 0 Belize 274 0 274 423 625 Bolivia 6,477 0 6,477 0 0 Bolivia – Intl. Narc. 157 243 400 0 0 Brazil 1,604 0 1,604 166,900 0 Canada 171,214 0 171,214 176,475 150,000 Chile 393 0 393 30,600 10,000 Colombia 105,074 0 105,074 60,200 65,000 Colombia – Intl. Narc. 2,402 0 2,402 300 300 Dominican Republic 598 0 598 2,000 2,000 Ecuador 7,867 0 7,867 1,200 2,370 El Salvador 4,105 0 4,105 1,900 2,950 Grenada* 274 0 274 0 0 Guyana 0 0 0 100 125 Haiti 227 0 227 300 250 Honduras 699 0 699 1,100 2,000 Jamaica 7 0 7 600 0 Mexico 5,454 0 5,454 0 0 Nicaragua 822 0 822 500 0 OAS HQ 132 0 132 0 0 Panama 205 0 205 1,200 5,500 Paraguay 21 0 21 0 0 Peru 31 0 31 0 0 St. Kitts and Nevis* 444 0 444 25 28 St. Lucia* 349 0 349 30 33 Suriname 45 0 45 150 0 Trinidad & Tobago 79 0 79 0 0
553

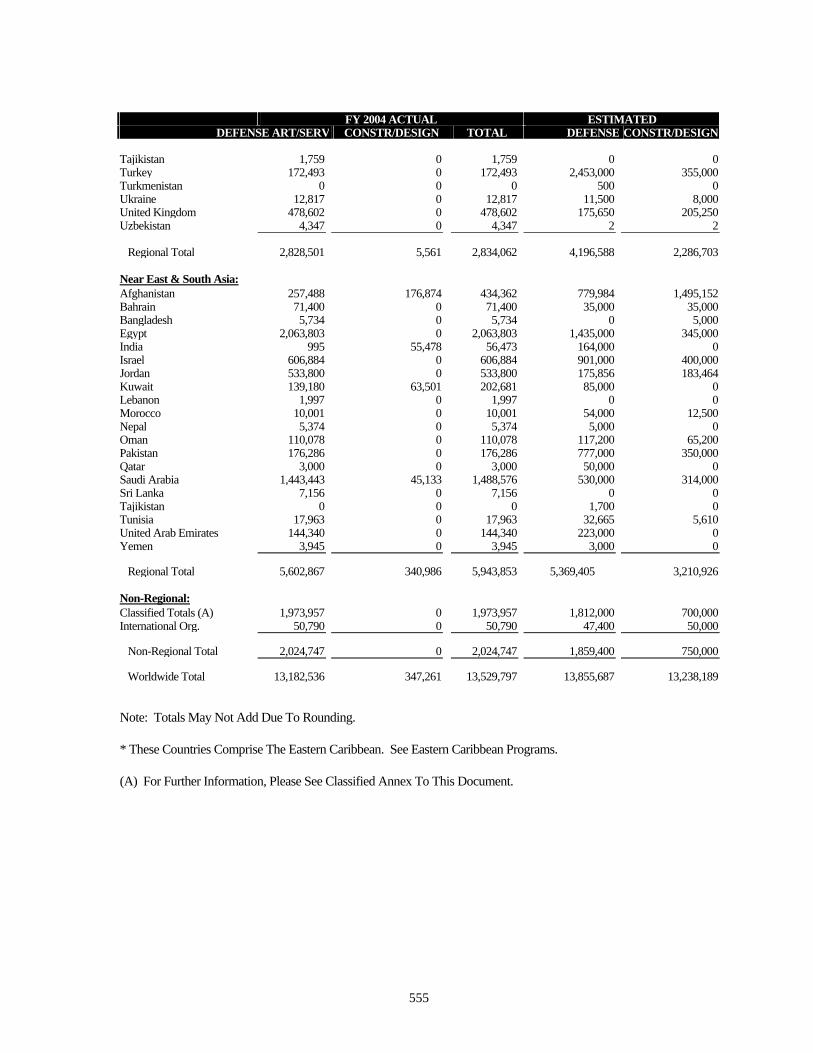
ESTIMATED DEFENSE ART/SERV CONSTR/DESIGN DEFENSE CONSTR/DESIGN
FY 2004 ACTUAL TOTAL
Uruguay 67 0 67 0 0 Venezuela 14,330 0 14,330 0 0
Regional Total 329,682 243 329,925 444,139 241,330
East Asia & Pacific: Australia 487,315 0 487,315 415,000 517,500 Fiji 1,990 0 1,990 0 1,000 Japan 600 0 600 655,000 443,000 Korea (Seoul) 680,975 0 680,975 0 5,056,000 Malaysia 350,557 0 350,557 0 0 Mongolia 19,714 0 19,714 1,500 0 New Zealand 1,281 0 1,281 0 0 Rep of Philippines 14,693 0 14,693 54,400 0 Singapore 51,626 0 51,626 205,000 0 Taiwan 141,510 0 141,510 568,000 500,000 Thailand 591,070 0 591,070 23,902 211,050 Tonga 0 0 0 0 600 UNTAET (East Timor) 30,250 0 30,250 1,900 0
Regional Total 2,371,581 0 2,371,581 1,924,702 6,729,150
Europe & NIS: Albania 4,962 0 4,962 3,000 3,750 Armenia 2,053 0 2,053 2,485 2,000 Austria 4,144 0 4,144 6,500 0 Azerbaijan 2,823 0 2,823 5,400 6,500 Belgium 27,788 0 27,788 12,000 126,000 Bosnia-Herzegovina 6,784 0 6,784 14,900 12,000 Bulgaria 7,253 0 7,253 7,000 3,000 Croatia 6 0 6 0 0 Czech Republic 9,862 0 9,862 37,000 0 Denmark 53,735 0 53,735 98,000 101,000 Estonia 6,822 0 6,822 5,000 6,000 Finland 134,219 0 134,219 5,375 96,675 France 66,897 0 66,897 30,910 33,420 Georgia 13,561 0 13,561 12,000 15,000 Germany 170,047 0 170,047 112,650 136,750 Greece 259,371 0 259,371 162,000 59,500 Hungary 13,445 0 13,445 11,822 29,204 Ireland 12 0 12 133 12 Italy 92,309 0 92,309 200,000 440,000 Kazakhstan 3,050 0 3,050 6,036 2,300 Kyrgyzstan 1,856 5,561 7,417 5,500 5,500 Latvia 4,376 0 4,376 3,300 5,100 Lithuania 2,323 0 2,323 12,500 5,000 Luxembourg 960 0 960 580 680 Macedonia (FYROM) 16,078 0 16,078 6,500 3,750 Malta 0 0 0 400 500 Moldova 1,447 0 1,447 1,485 2,250 Netherlands 453,158 0 453,158 352,000 182,000 Norway 167,359 0 167,359 129,000 81,000 Poland 189,887 0 189,887 36,000 161,000 Portugal 46,780 0 46,780 113,500 79,500 Romania 64,064 0 64,064 11,000 10,750 Slovakia 606 0 606 11,650 6,000 Slovenia 650 0 650 2,000 2,900 Spain 84,188 0 84,188 126,960 92,810 Sweden 7,391 0 7,391 4,100 1,100 Switzerland 238,217 0 238,217 7,250 5,500
554
ESTIMATED DEFENSE ART/SERV CONSTR/DESIGN DEFENSE CONSTR/DESIGN
FY 2004 ACTUAL TOTAL
Tajikistan 1,759 0 1,759 0 0 Turkey 172,493 0 172,493 2,453,000 355,000 Turkmenistan 0 0 0 500 0 Ukraine 12,817 0 12,817 11,500 8,000 United Kingdom 478,602 0 478,602 175,650 205,250 Uzbekistan 4,347 0 4,347 2 2
Regional Total 2,828,501 5,561 2,834,062 4,196,588 2,286,703
Near East & South Asia: Afghanistan 257,488 176,874 434,362 779,984 1,495,152 Bahrain 71,400 0 71,400 35,000 35,000 Bangladesh 5,734 0 5,734 0 5,000 Egypt 2,063,803 0 2,063,803 1,435,000 345,000 India 995 55,478 56,473 164,000 0 Israel 606,884 0 606,884 901,000 400,000 Jordan 533,800 0 533,800 175,856 183,464 Kuwait 139,180 63,501 202,681 85,000 0 Lebanon 1,997 0 1,997 0 0 Morocco 10,001 0 10,001 54,000 12,500 Nepal 5,374 0 5,374 5,000 0 Oman 110,078 0 110,078 117,200 65,200 Pakistan 176,286 0 176,286 777,000 350,000 Qatar 3,000 0 3,000 50,000 0 Saudi Arabia 1,443,443 45,133 1,488,576 530,000 314,000 Sri Lanka 7,156 0 7,156 0 0 Tajikistan 0 0 0 1,700 0 Tunisia 17,963 0 17,963 32,665 5,610 United Arab Emirates 144,340 0 144,340 223,000 0 Yemen 3,945 0 3,945 3,000 0
Regional Total 5,602,867 340,986 5,943,853 5,369,405 3,210,926
Non-Regional: Classified Totals (A) 1,973,957 0 1,973,957 1,812,000 700,000 International Org. 50,790 0 50,790 47,400 50,000
Non-Regional Total 2,024,747 0 2,024,747 1,859,400 750,000
Worldwide Total 13,182,536 347,261 13,529,797 13,855,687 13,238,189
Note: Totals May Not Add Due To Rounding.
* These Countries Comprise The Eastern Caribbean. See Eastern Caribbean Programs.
(A) For Further Information, Please See Classified Annex To This Document.
555
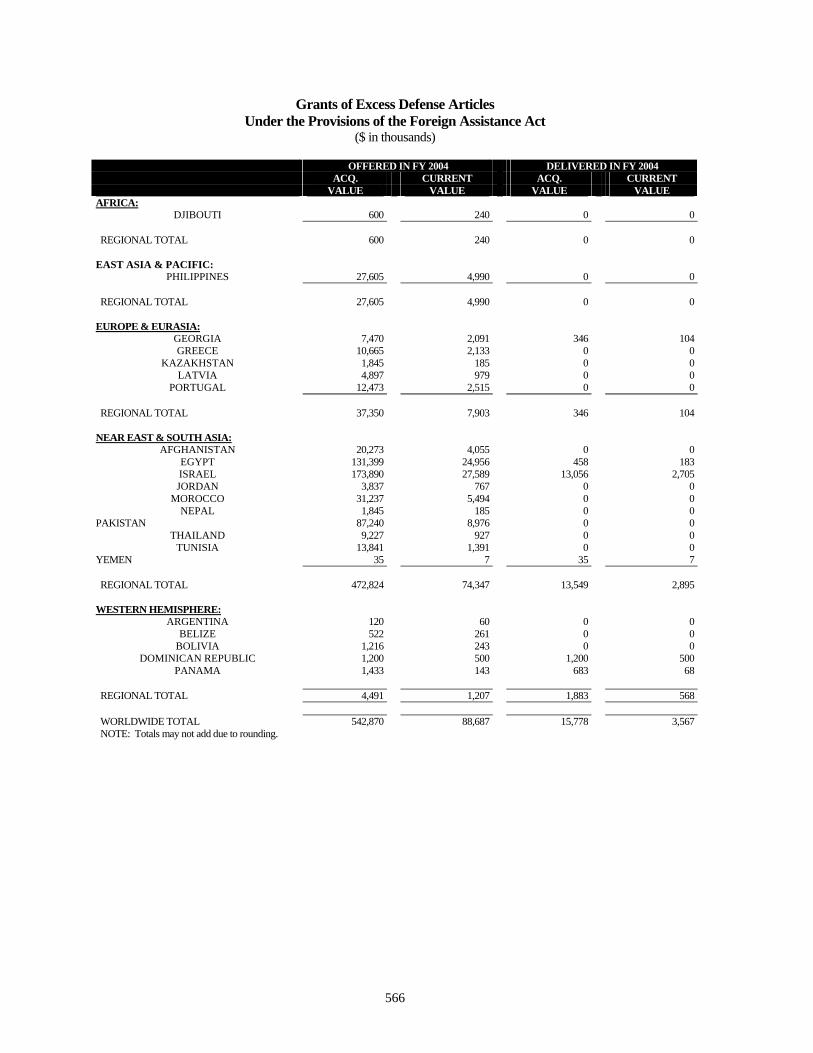
Grants of Excess Defense Articles Under the Provisions of the Foreign Assistance Act
($ in thousands)
ACQ. CURRENT ACQ. CURRENT VALUE VALUE VALUE VALUE
OFFERED IN FY 2004 DELIVERED IN FY 2004
AFRICA: DJIBOUTI 600 240 0 0
REGIONAL TOTAL 600 240 0 0
EAST ASIA & PACIFIC: PHILIPPINES 27,605 4,990 0 0
REGIONAL TOTAL 27,605 4,990 0 0
EUROPE & EURASIA: GEORGIA 7,470 2,091 346 104 GREECE 10,665 2,133 0 0
KAZAKHSTAN 1,845 185 0 0 LATVIA 4,897 979 0 0
PORTUGAL 12,473 2,515 0 0
REGIONAL TOTAL 37,350 7,903 346 104
NEAR EAST & SOUTH ASIA: AFGHANISTAN 20,273 4,055 0 0
EGYPT 131,399 24,956 458 183 ISRAEL 173,890 27,589 13,056 2,705 JORDAN 3,837 767 0 0
MOROCCO 31,237 5,494 0 0 NEPAL 1,845 185 0 0
PAKISTAN 87,240 8,976 0 0 THAILAND 9,227 927 0 0
TUNISIA 13,841 1,391 0 0 YEMEN 35 7 35 7
REGIONAL TOTAL 472,824 74,347 13,549 2,895
WESTERN HEMISPHERE: ARGENTINA 120 60 0 0
BELIZE 522 261 0 0 BOLIVIA 1,216 243 0 0
DOMINICAN REPUBLIC 1,200 500 1,200 500 PANAMA 1,433 143 683 68
REGIONAL TOTAL 4,491 1,207 1,883 568
WORLDWIDE TOTAL 542,870 88,687 15,778 3,567 NOTE: Totals may not add due to rounding.
566
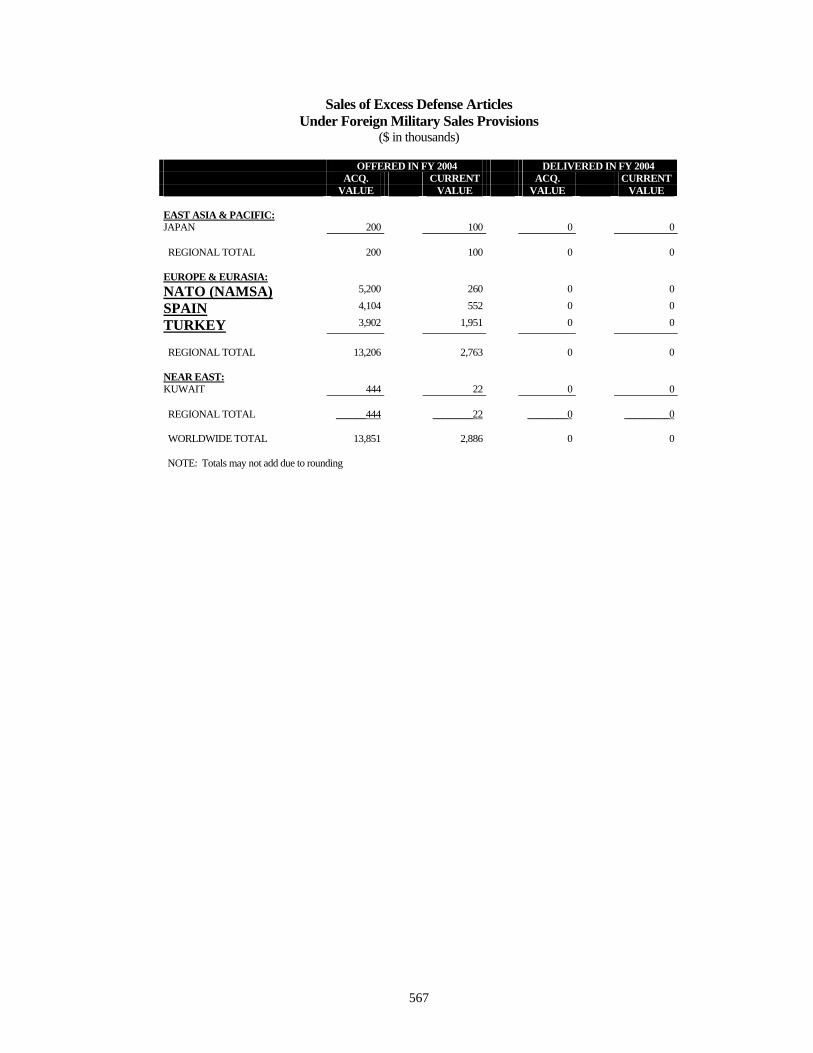
Sales of Excess Defense Articles Under Foreign Military Sales Provisions
($ in thousands)
ACQ. CURRENT ACQ. CURRENT VALUE VALUE VALUE VALUE
OFFERED IN FY 2004 DELIVERED IN FY 2004
EAST ASIA & PACIFIC: JAPAN 200 100 0 0
REGIONAL TOTAL 200 100 0 0
EUROPE & EURASIA: NATO (NAMSA) SPAIN
5,2004,104
260 552
0 0
0 0
TURKEY 3,902 1,951 0 0
REGIONAL TOTAL 13,206 2,763 0 0
NEAR EAST: KUWAIT 444 22 0 0
REGIONAL TOTAL ______444 ________22 ________0 _________0
WORLDWIDE TOTAL 13,851 2,886 0 0
NOTE: Totals may not add due to rounding
567

Leased Defense Articles
The lease of defense articles can be authorized under the Arms Export Control Act (AECA), Chapter 6, if there are compelling U.S. foreign policy and national security reasons for providing defense articles on a lease rather than a sales basis. Defense articles cannot be leased if they are needed for public use during the period of the lease.
Except for leases entered into for the purposes of cooperative research or development, military exercises or communications or electronics interface projects, the country leasing the defense article(s) must agree to pay, in U.S. dollars, all costs incurred by the United States Government in leasing the article(s). These costs include reimbursement for depreciation of the article(s) while leased. In addition, the country must also pay the cost of restoration or replacement if the article(s) are damaged while leased. If the article(s) is lost or destroyed while leased, the U.S. requires funds to cover the replacement cost (less depreciation, if any) or an amount equal to the actual value (less depreciation) when the article(s) will not be replaced in the U.S. inventory.
The President may waive reimbursement of depreciation for any defense article which has passed three-quarters of its normal service life if the President determines that to do so is important to the national security interests of the United States. In some cases, the President may waive the reimbursement of all lease charges with respect to a lease that is made in exchange with the lessee for a lease on substantially reciprocal terms of defense articles for the Department of Defense. Waivers for depreciation or reciprocity are made before the implementation of the lease agreement.
Leases are conducted for a fixed duration of time not to exceed five years and provide that, at any time during the lease, the U.S. may terminate the lease and require the immediate return of the defense article(s).
568

Leases Under the Arms Export Control Act Implemented FY 2004 ($ in thousands)
TOTAL VALUE
REPLACEMENT RENTAL VALUE
East Asia & Pacific: Australia 2,753 93 Malaysia 19 0 Philippines 34 0 Singapore 55 0
Regional Total 2,861 93
Europe and Eurasia: Germany 192 10 Tajikistan 73 0 Turkey 149 15 United Kingdom 191 0
Regional Total 605 25
Western Hemisphere: Canada 547 5
Regional Total 547 5
Near East & South Asia: Jordan 49 0
Regional Total 49 0
WORLDWIDE TOTAL 4,062 123
569
Commercial Exports Licensed or Approved Under the Arms Export Control Act
The data in the following chart on commercial arms sales are compiled on the basis of information available to the Department as of January 2005. The first column, entitled “Actual Deliveries (preliminary)” shows the preliminary dollar value totals by destination of exports during fiscal year 2004. These export totals which, in some cases, do not reflect defense training and technical assistance, are compiled from expired or completed licenses returned to the Department by exporters or the Department of Homeland Security/Customs Border Patrol (CBP) and export shipment data recently made available to the State Department via the Automated Export System (AES). The totals are very preliminary because (a) the vast majority of State Department munitions export licenses are approved for four calendar years, thereby allowing shipments to span five fiscal years, and are not returned to the State Department until usage of the licenses usage is completed or the licenses expire; and (b) the fiscal year 2004 AES information is still being compiled and under review for accuracy. Thus, information on “Actual Deliveries (preliminary)” in this chart is incomplete. In the future, information collected through AES and reporting of technical data exports directly to the State Department will allow a more accurate portrayal of “up-to-date” export transactions. For further information, see also the classified annex to this document.
The second and third columns in the chart show the estimated dollar value totals by destination of possible deliveries in fiscal years 2005 and 2006. These estimates are based primarily on the dollar values of licenses approved for each destination during the prior two fiscal years (the dollar values of the authorized licenses are not shown here but captured in reports to the Congress made pursuant to section 655 of the Foreign Assistance Act of 1961, as amended. The value of defense export authorizations in FY 2004 amounted to $22,426,833,938 billion in defense articles and $44,729,024,937 billion in defense services. Not all export approvals result in signed contracts and actual exports. Key factors that affect the final export value include the availability of the licensed item for shipping, and how quickly the license is returned to the Department. (See also the classified annex.) Other factors that cannot be quantified are economic and security considerations at the final destinations, as well as changing U.S. foreign policy and national security considerations. In exercising defense trade controls, the Department administers embargoes on commercial arms transfers to more than two dozen countries in any given year as a result of U.S. law and foreign policy/national security considerations and UN Security Council decisions. Several other countries are subject to special scrutiny due to non-proliferation, regional security (e.g., disputed territories or borders), or human rights concerns. Countries for whom there were no actual deliveries in fiscal year 2004 and which had no authorized license for fiscal years 2003 and 2004 do not appear in this report.
The procedures for estimating defense commercial sales for out years (fiscal years 2005 and 2006) were revised for the 1995 CPD. Previous procedures for such estimates called for extrapolating exports for the first year at forty percent of the actual dollar value of licenses approved in the previous two fiscal years. The second out year’s exports would have been estimated at sixty percent of that two-year total.
However, based on historical data, the Department now estimates exports for the first out year (fiscal year 2005) to be ten percent of the total dollar value of approved licenses for the previous two fiscal years (fiscal years 2003 and 2004). The exports for the second out year (fiscal year 2006) are estimated to be fifty percent of those for fiscal year 2004.
586

Commercial Exports Licensed or Approved Under the AECA (Dollars in Thousands)
Region Name FY 2000
AFRICA
Country / Designation
ANGOLA
BENIN
BOTSWANA
CAMEROON
CAPE VERDE
CENTRAL AFRICAN REPUBLIC CHAD
DJIBOUTI
ERITREA
ETHIOPIA
GABON
GAMBIA
GHANA
GUINEA
IVORY COAST
KENYA
MADAGASCAR
MALAWI
MALI
MAURITANIA
MAURITIUS
NAMIBIA
NIGER
NIGERIA
SENEGAL
SEYCHELLES
SOUTH AFRICA
TANZANIA
UGANDA
ZAMBIA
Actual Deliveries* Estimated Deliveries FY 2004 FY 2005 FY 2006
(Preliminary)
535 5
4 20
16,979 5,497 12,338
3,000 313 0
8 0
39 0 0
63 316
15 20
18 0
42 48 51
5 25
190 950
131 555
514 21
91 0 0
1,887 608 811
148 0
23 138 656
10 523 0
2 0
22 40 202
103 169 205
137 3 15
6 739 72
159 1,004 7
33 120
7,622 6,501 20,745
20 4
794 1,909 7,517
573 8
587
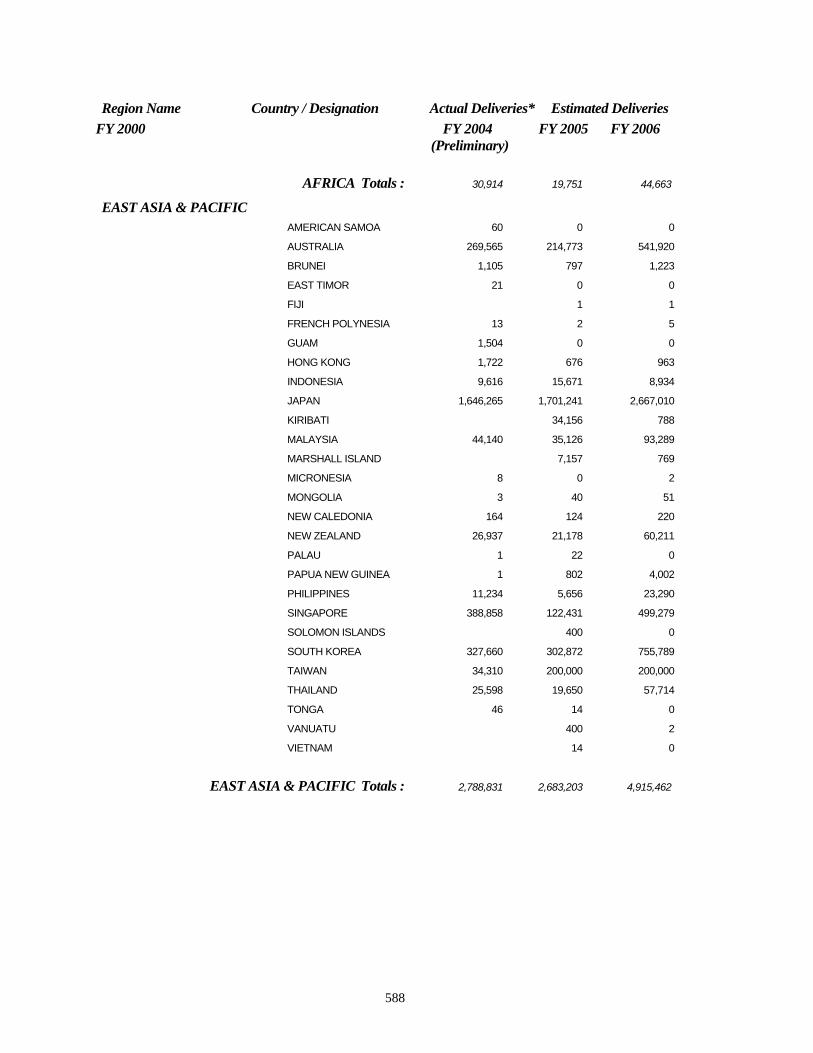
Region Name Country / Designation Actual Deliveries* Estimated Deliveries FY 2000 FY 2004 FY 2005 FY 2006
(Preliminary)
AFRICA Totals : 30,914 19,751 44,663
EAST ASIA & PACIFIC AMERICAN SAMOA 60 0 0
AUSTRALIA 269,565 214,773 541,920
BRUNEI 1,105 797 1,223
EAST TIMOR 21 0 0
FIJI 1 1
FRENCH POLYNESIA 13 2 5
GUAM 1,504 0 0
HONG KONG 1,722 676 963
INDONESIA 9,616 15,671 8,934
JAPAN 1,646,265 1,701,241 2,667,010
KIRIBATI 34,156 788
MALAYSIA 44,140 35,126 93,289
MARSHALL ISLAND 7,157 769
MICRONESIA 8 0 2
MONGOLIA 3 40 51
NEW CALEDONIA 164 124 220
NEW ZEALAND 26,937 21,178 60,211
PALAU 1 22 0
PAPUA NEW GUINEA 1 802 4,002
PHILIPPINES 11,234 5,656 23,290
SINGAPORE 388,858 122,431 499,279
SOLOMON ISLANDS 400 0
SOUTH KOREA 327,660 302,872 755,789
TAIWAN 34,310 200,000 200,000
THAILAND 25,598 19,650 57,714
TONGA 46 14 0
VANUATU 400 2
VIETNAM 14 0
EAST ASIA & PACIFIC Totals : 2,788,831 2,683,203 4,915,462
588
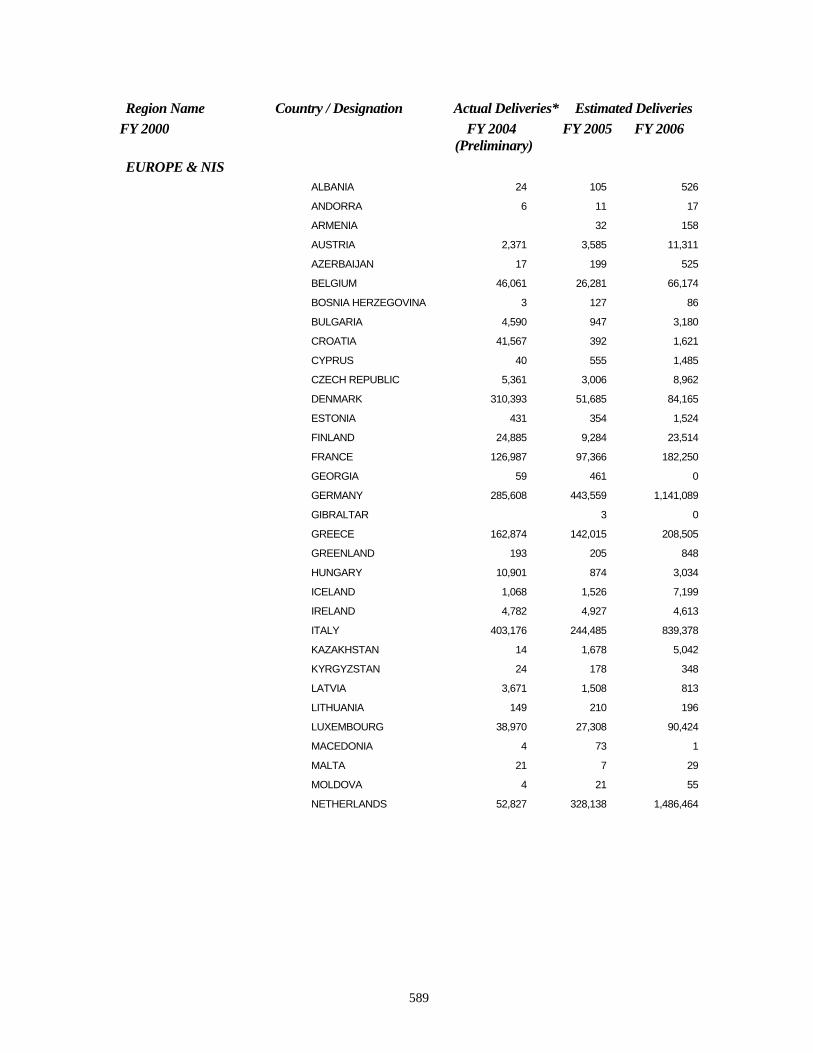
Region Name Country / Designation Actual Deliveries* Estimated Deliveries FY 2000 FY 2004 FY 2005 FY 2006
(Preliminary) EUROPE & NIS
ALBANIA 24 105 526
ANDORRA 6 11 17
ARMENIA 32 158
AUSTRIA 2,371 3,585 11,311
AZERBAIJAN 17 199 525
BELGIUM 46,061 26,281 66,174
BOSNIA HERZEGOVINA 3 127 86
BULGARIA 4,590 947 3,180
CROATIA 41,567 392 1,621
CYPRUS 40 555 1,485
CZECH REPUBLIC 5,361 3,006 8,962
DENMARK 310,393 51,685 84,165
ESTONIA 431 354 1,524
FINLAND 24,885 9,284 23,514
FRANCE 126,987 97,366 182,250
GEORGIA 59 461 0
GERMANY 285,608 443,559 1,141,089
GIBRALTAR 3 0
GREECE 162,874 142,015 208,505
GREENLAND 193 205 848
HUNGARY 10,901 874 3,034
ICELAND 1,068 1,526 7,199
IRELAND 4,782 4,927 4,613
ITALY 403,176 244,485 839,378
KAZAKHSTAN 14 1,678 5,042
KYRGYZSTAN 24 178 348
LATVIA 3,671 1,508 813
LITHUANIA 149 210 196
LUXEMBOURG 38,970 27,308 90,424
MACEDONIA 4 73 1
MALTA 21 7 29
MOLDOVA 4 21 55
NETHERLANDS 52,827 328,138 1,486,464
589

Region Name Country / Designation Actual Deliveries* Estimated Deliveries FY 2000 FY 2004 FY 2005 FY 2006
(Preliminary) NORWAY 87,754 113,403 427,079
POLAND 21,729 13,020 37,510
PORTUGAL 10,660 11,066 19,899
ROMANIA 21,143 3,263 13,301
RUSSIA 240 11,589 17,103
SAN MARINO 37 19
SERBIA 67 231 19
SLOVAKIA 1,447 2,092 6,975
SLOVENIA 6,022 1,234 5,796
SPAIN 123,328 52,460 103,974
SWEDEN 124,139 41,221 95,863
SWITZERLAND 87,570 17,584 65,081
TAJIKSTAN 18 89
TURKEY 153,798 144,549 497,659
TURKMENISTAN 118 36 129
UKRAINE 23 19,927 2,603
UNITED KINGDOM 588,676 1,119,736 2,916,132
UZBEKISTAN 358 232 298
EUROPE & NIS Totals : 2,754,153 2,942,803 8,383,065
NEAR EAST ALGERIA 77,881 59,877 19,900
BAHRAIN 2,139 4,236 11,968
EGYPT 166,813 52,788 173,189
IRAQ 32,123 52,558 211,242
ISRAEL 418,883 255,898 827,226
JORDAN 19,794 15,973 24,014
KUWAIT 63,773 144,546 580,877
LEBANON 90 387 14
MOROCCO 30,350 3,171 8,703
OMAN 48,618 8,332 12,979
QATAR 1,612 3,206 2,209
SAUDI ARABIA 45,709 96,779 327,675
TUNISIA 2,775 2,106 4,172
590

Region Name Country / Designation Actual Deliveries* Estimated Deliveries FY 2000 FY 2004 FY 2005 FY 2006
(Preliminary) UNITED ARAB EMIRATES 360,820 434,841 1,919,407
YEMEN 1,842 1,279 4,225
NEAR EAST Totals : 1,273,222 1,135,977 4,127,800
NON-REGIONAL CLASSIFIED TOTALS 183,751 1,000,000 1,000,000
INTERNATIONAL ORG. 270 433,827 919,069
NON-REGIONAL Totals : 184,021 1,433,827 1,919,069
SOUTH ASIA AFGHANISTAN 3,472 19,039 78,846
BANGLADESH 519 440 1,616
BHUTAN 6 29
INDIA 15,516 17,788 24,629
NEPAL 71 175 396
PAKISTAN 7,492 33,536 82,261
SRI LANKA 1,650 1,771 5,813
SOUTH ASIA Totals : 28,720 72,755 193,590
WESTERN HEMISPHERE ANTIGUA-BARBUDA 1 10 14
ARGENTINA 1,758 4,379 18,059
ARUBA 33 23 25
BAHAMAS 1,284 831 3,696
BARBADOS 358 88 137
BELIZE 66 45 87
BERMUDA 40 21 44
BOLIVIA 2,535 1,306 1,644
BRAZIL 56,951 23,132 51,569
CANADA 111,614 170,123 424,433
CAYMAN ISLANDS 12 109,106 272,767
CHILE 9,778 13,319 29,381
COLOMBIA 30,404 13,602 35,399
591

Region Name Country / Designation Actual Deliveries* Estimated Deliveries FY 2000 FY 2004 FY 2005 FY 2006
(Preliminary) COSTA RICA 1,008 598 1,697
DOMINICA 5 10 8
DOMINICAN REPUBLIC 2,474 684 1,988
ECUADOR 2,255 60,852 300,988
EL SALVADOR 1,635 742 1,670
FRENCH GUIANA 213,506 46,868 48,111
GRENADA 7 22 69
GUATEMALA 672 517 958
GUYANA 47 16,107 59
HAITI 11 54
HONDURAS 131 421 336
JAMAICA 1,118 363 954
MEXICO 90,961 41,186 139,555
MONTSERRAT 1 0
NETHERLANDS ANTILLES 185 26 76
NICARAGUA 404 148 390
PANAMA 1,726 828 3,052
PARAGUAY 42 7 5
PERU 603 1,782 1,668
SAINT LUCIA 12 0 0
SAINT VINCENT & 15 0 0 GRENADINES ST KITTS AND NEVIS 342 1 2
ST LUCIA 1 20 43
ST VINCENT & 1 4 10 GRENADINES SURINAME 73 13 51
TRINIDAD & TOBAGO 722 160 560
TURKS & CAICOS 10 52 260 ISLANDS URUGUAY 138 393 1,653
VENEZUELA 24,934 14,771 49,282
WESTERN HEMISPHERE Totals : 557,861 522,572 1,390,754
Grand Totals : 7,617,722 8,810,888 20,974,403
592
Related Documents

![FOREIGN AN]) MILITARY INTELLIGENCE](https://static.cupdf.com/doc/110x72/586988331a28ab6b518b4926/foreign-an-military-intelligence.jpg)